


Abstract
The global shift toward cleaner energy has positioned hydrogen-enriched methane (CH4/H2) as a practical bridge fuel. While it burns more efficiently and produces fewer carbon emissions than traditional hydrocarbons, it introduces operational and safety challenges. Hydrogen’s high reactivity and rapid burning velocity increase risks such as flashback and premature ignition. This study employs Computational Fluid Dynamics to examine the combustion behavior of methane−hydrogen blends in a 2D axisymmetric chamber based on RANS equations. Using ANSYS Fluent 19.1, the research utilizes a validated equilibrium mixture-fraction/PDF framework to ensure accuracy against physical experiments. The simulation framework successfully captures the complexity of non-premixed turbulent combustion by combining a probability density function approach with a realizable k-ε turbulence model. Moreover, this research explores how varying hydrogen concentrations and air mass flow rates, covering the full spectrum from lean to fuel-rich conditions, affect fluid dynamics, turbulence, and the development of recirculation zones. The data show that adding hydrogen fundamentally reshapes velocity fields and thermal profiles, which in turn dictate combustion efficiency and pollutant formation. It has been demonstrated that the optimal blend for combustion performance is the case containing 30% hydrogen. Furthermore, evaluations involving higher-fraction blends (approaching the 70% enrichment range) suggest that configurations exceeding this level necessitate a redesign of the injector near field to mitigate localized heat release and accelerated NOx emissions. By identifying the operational limits for CH4/H2 blends in industrial settings such as steam boilers, this study offers a technical roadmap for engineering more stable, high-performance, and low-carbon energy infrastructure.
1. Introduction
Major research aspects are emerging in the combustion community and engine development society. The transition away from fossil fuels is not just a matter of energy security; it is the fundamental incentive for reclaiming air quality in urban regions. By shifting the focus from traditional liquid/solid fuels to cleaner alternatives, we move toward an urban environment with lower CO and CO2 emissions [1,2]. Natural gas is regarded as one of the most promising alternatives and probably one of the cleanest fuels in combustion [3]. The combustion of natural gas produces fewer emissions than gasoline and/or diesel due to its simple chemical structure and no fuel evaporation problem [4,5]. Some unique combustion characteristics of methane, such as high ignition temperature and low flame propagation speed, lead to the slow burning velocity [6]. This may lead to incomplete combustion in non-stoichiometric mixture combustion applications.
Driven by escalating global energy needs and the high level of demand to mitigate climate change, researchers are prioritizing the discovery of alternative fuels and the engineering of sophisticated combustion systems [3,7,8,9,10,11,12]. One suitable alternative fuel is hydrogen (H2). Hydrogen stands out as an exceptional fuel due to its high energy density and clean combustion profile. Unlike traditional fuels, it generates no carbon monoxide, carbon dioxide, soot, or sulfur compounds, which are the chief reasons behind global warming and poor urban air quality [1,8,13]. In contrast to conventional fossil fuels, hydrogen burns to produce mostly water vapor, establishing it as the fundamental element of a future hydrogen economy [14,15,16]. Despite its potential, shifting directly from carbon-heavy fuels to pure hydrogen involves technical barriers. Hydrogen’s high reactivity, characterized by a broad flammability range, minimal ignition energy, and rapid flame speed, poses significant risks. While its traits enhance combustion, they also trigger dangerous instabilities like hot spot formation, pre-ignition, and flashback [17,18]. The latter, where the flame travels upstream into the fuel nozzle, poses a severe risk of structural failure or even destruction of the combustion chamber [19].
To capitalize on hydrogen’s advantages while minimizing its risks, blending it with traditional fuels like methane (CH4) has become a practical strategy for industrial boilers, gas turbines, and burners [20,21]. This hydrogen enrichment acts as a vital transition technology, enabling rapid decarbonization across the energy sector. Hydrogen is an excellent additive to improve the combustion of natural gas due to its low ignition energy, high reactivity, high diffusivity, and high burning velocity [17]. The laminar burning velocity of hydrogen is seven times that of natural gas [3]. By integrating hydrogen into the existing natural gas infrastructure, industries can boost combustion efficiency and stability beside reducing their carbon footprint without requiring extensive or costly structural overhauls [21,22,23,24,25]. The reduction in CO and CO2 mole fractions with the addition of hydrogen is due to the decrease in the CH4 mole fraction in the reactant. It is interesting to note that H2 changes from an intermediate species to a reactant when the hydrogen fraction in the blends exceeds 20% [3]. Moreover, the mole fraction of O2 required for combustion decreases with hydrogen addition, since H2 is more reactive than CH4. Since the reaction rate coefficient in Arrhenius form has strong temperature dependence, the high temperature of hydrogen combustion must have a great effect on the chemical reaction process [3]. In this study, the potential for reduction in emissions during the combustion of methane enriched by hydrogen under various equivalence ratios is investigated.
Various experimental and numerical studies of methane–hydrogen fuel blends have been conducted on laminar burning velocity, intermediate species analysis, and thermo-chemical simulation [24,25,26]. As the experimental research into high-pressure, high-temperature reactive flows is both expensive and technically demanding, numerical simulation has emerged as a robust and cost-effective alternative [24]. Computational Fluid Dynamics (CFD) allows researchers to dissect the complex relationship between fluid mechanics, thermal transfer, and thermochemical behavior. This approach provides a level of granular detail regarding combustion behavior and flame structure that is often hard to capture using physical sensors or traditional measurement tools [20,27,28,29,30,31].
To simulate non-premixed methane and hydrogen flames, researchers frequently employ numerical frameworks such as the Probability Density Function (PDF) model [4]. The non-premixed equilibrium PDF approach has been recently validated against many experimental and numerical works related to CH4/H2 combustion blends [20,23,26,29,32,33]. These methods are highly effective because they account for complex turbulence−chemistry interactions while remaining computationally efficient, avoiding the extreme processing power required by Direct Numerical Simulation (DNS) [20,29,34,35]. By leveraging the computational cost of modern hardware, these computational tools allow for the rapid optimization of combustion systems. They provide a detailed analysis of critical variables, including velocity distributions, thermal gradients, and emission characteristics across a wide range of operational scenarios [36,37]. Although existing studies have broadly addressed the impact of hydrogen addition, there is still a significant gap in understanding how hydrogen enrichment and air flow rates interact to influence performance and emissions within non-premixed turbulent chambers [25]. The current literature presents a conflict: some research warns that higher hydrogen fractions elevate NOx emissions by increasing adiabatic flame temperatures, while other findings suggest that specific blending and mixing strategies can successfully reduce both NOx and COx simultaneously [24,32,33,38].
No systematic work has been conducted that examines the effects of various operational parameters (i.e., the hydrogen addition, temperature, and equivalence ratio) on the combustion of a CH4/H2 mixture in a wide range of hydrogen (0 to 99%) and fuel-to-air equivalence ratios (0.5 to 1.5). Moreover, no research has been conducted to establish the criterion for the hydrogen level in CH4/H2 mixtures for combustion chambers originally designed for methane combustion applications. The present study is an effort to help address these issues. Two specific objectives are designated: investigating the effect of hydrogen addition on combustion parameters under various equivalence ratios. Consequently, a rigorous assessment is required to determine how these variables precisely influence burning efficiency and the generation of pollutants under various fuel−air ratios. Mapping these interactions is essential for defining the operational boundaries of clean and high-performance combustion systems. This research conducts a computationally efficient numerical simulation of non-premixed turbulent combustion within a 2D axisymmetric chamber fueled by a methane−hydrogen−air blend. Utilizing ANSYS Fluent 19.1, the study investigates how varying hydrogen levels from lean to rich mixtures and fluctuating air mass flow rates impact overall combustion performance. For modeling the non-premixed combustion of CH4/H2, the standard k − ε realizable turbulence model and a PDF-based approach have been shown to present the best performances [26]. Therefore, these models are employed to extract quantitative data on flame morphology, thermal gradients, velocity distributions, and emission signatures in the studied cases. Additionally, the study explores the role of hydrogen in shaping fluid dynamics, with a specific focus on turbulence intensity and recirculation zones, both of which are critical for maintaining flame stability. Ultimately, this research defines the operating criteria of hydrogen level in CH4/H2 blends for combustion chamber applications in industrial steam boilers, providing a technical bridge toward a sustainable, low-emission energy future.
2. Problem Definition
The schematic of the considered combustion chamber and its geometrical parameters are shown in Figure 1. A two-dimensional axisymmetric computational domain was considered for this problem. The combustion chamber geometry is a generalized configuration based on the experimental setup of Pierce and Moin [39,40], adapted to represent the fundamental characteristics of industrial burners. The length-to-diameter (L/D) ratio was selected based on the requirement for a high-aspect-ratio domain to capture the full evolution of the chemical species and temperature fields while maintaining a representative flow velocity and sufficient residence time for the CH4/H2 fuel blends. The geometry consists of a long combustion chamber with two jets, including a CH4 fuel jet at the center surrounded by one annular air jet for improved mixing and diffusion. The fuel and air jets are separated by a thin 1 mm bluff body at the entrance, which applies the non-premixed characteristic to the problem. The dimensions related to the chamber radius and lengths are presented in the schematic.
Figure 1.
The schematic of the combustion chamber and its geometrical parameters.
Geometrical values related to Figure 1 are presented in Table 1. The radius of the chamber is selected to be 21 cm. The CH4/H2 fuel jet has a fixed mass flow rate of 2.5 g/s with a temperature of Tf = 300 K. The air jet has variable mass flow rates to provide the same equivalence ratios for various cases and has a temperature of Ta = 300 K. The air is assumed to be composed of 21% oxygen and 79% nitrogen based on volume. The chamber pressure is set to be P0 = 1 atm. The chamber wall is assumed to be adiabatic. The combustion and emission characteristics of fuels with various hydrogen concentrations, including 0%, 30%, 70%, and 99%, are investigated. Various equivalence ratios, including ϕ = 0.5, 0.7, 0.9, 1, 1.1, 1.2, 1.3, 1.5, are considered to analyze the combustion of the hydrogen-enriched fuel under various combustion regimes. The horizontal distance from the inlets is defined by “x” and the radial distance from the axis is “r”.
Table 1.
Geometrical values of the parameters in Figure 1.
2.1. Boundary Conditions
For the inlets, the inlet mass flow rates at the defined pressure and temperature are considered. The molar fractions of hydrogen and methane in the fuel jet should be applied as molar fractions. For the outlets, the pressure outlet is selected to be 1 atm. The walls are assumed to be stationary, without slip, and adiabatic. The standard wall functions are applied to model the near-wall zones.
2.2. Meshing
The geometry of the considered combustion chamber was produced by ANSYS Design Modeler (see Figure 2). The dimensions of the domain are sufficient to establish a stable flame, allowing for a thorough analysis of its combustion behavior. To decrease the computational costs, the geometry is considered to be 2D axisymmetric [17]. A structured quadrilateral mesh with a maximum element size of 3.5 mm is chosen for the geometry. Because of severe changes in the flow properties, the region close to the jets has smaller and more compacted elements.
Figure 2.
Structured meshing of the chamber for the numerical solution.
2.3. Governing Equations
In non-premixed combustion, the fuel and air enter the reaction zone through separate jets. The chemical equilibrium model reduces the complex chemistry to a single conserved scalar, the Mixture Fraction (f), which is defined as follows:
The Mixture Fraction represents the local mass fraction of the fuel stream in the mixture. In Equation (1), ci is the mass fraction of the ith component in the mixture, ci,f is the mass fraction of the ith component in the fuel, and ci,a is the mass fraction of the ith component in the air. Hence, for fuel inlet, f = 1, and for air inlet, f = 0.
In the non-premixed combustion model, it is assumed that the rate of chemical reactions is very high compared to the diffusion rate. The flow is treated as a low-Mach-number, variable-density flow which follows the ideal gas equation of state. Based on this physical assumption, the CFD analysis and mathematical framework rely on the fundamental conservation laws for gas mixture flows. Specifically, the model solves for the conservation of mass, momentum, energy, and chemical species via the PDF approach and RANS (Reynolds-Averaged Navier−Stokes) equations as defined in Equations (2)–(5):
In addition to Equations (2)–(5), NOX concentration is determined by an extra conservation equation with thermal and prompt source terms for NO production. The RANS equations are solved in the 2D axisymmetric configuration. In Equations (2)–(5), ρ represents the mixture density, and t is time. The velocity vector is given by , while P and μt refer to pressure and dynamic viscosity, respectively. Thermal properties are defined by the effective conductivity keff and total stress tensor . For the combustion model, hj is the enthalpy of the jth component, which is determined from the sum of the enthalpy of formation and sensible enthalpy:
In the current Mixture Fraction model, it is assumed that the reactions are so fast that they reach a state of thermodynamic equilibrium at every point. Therefore, there is no need to solve the conservation equation for each species. In Equation (5), indicates the mean mixture fraction. In Equation (4), Srad is the radiation source term. To determine the state and physical properties of the gas mixture, the ideal gas Equation of State (EOS) is applied. Furthermore, the mass diffusion flux for each species (jth), accounting for turbulent effects, is derived using Fick’s law:
In this formulation, Dm represents the mass diffusion coefficient of the mixture, while DT denotes the thermal diffusion coefficient; the term μt refers to the turbulent viscosity, and Sct is the turbulent Schmidt number, which is assigned a constant value of 0.7. To account for the turbulent flow effects, a standard two-equation k − ε realizable model is applied, which is presented in detail in Appendix A.
2.4. Definitions
In this study, the ratio of the fuel mass flow rate to the air is defined as the fuel−air mass ratio as follows:
where is the fuel jet mass flow rate and is the air mass flow rate. The relation between fuel−air mass ratio (FAm) and fuel−air mole ratio (FAmol) is provided in Equation (9):
where Mf is the molar weight of the fuel and Ma is the molar weight of air. To determine the regime of the fuel−air mixture for combustion, the parameter equivalence ratio is defined as follows:
If ϕ < 1, the mixture is theoretically fuel-lean; if ϕ = 1, the mixture is stoichiometric, and if ϕ > 1, the mixture is fuel-rich. Since the fuel mass flow rate is constant, to provide the same equivalence ratio between various fuels containing different hydrogen concentrations, the following equation is used to determine the air mass flow rate for applying its boundary condition value through simulations:
where FAmol,st is the fuel−air mole ratio under the stoichiometric mixture. To determine the stoichiometric fuel−air ratio for various studied hydrogen-enriched cases, the following stoichiometric reactions are used. For the case with :
CH4 + 2(O2 + 3.76N2) → CO2 + 2H2O + 7.52N2
Fore the case with :
0.7CH4 + 0.3H2 + 1.55(O2 + 3.76N2) → 0.7CO2 + 1.7H2O + 5.828N2
Fore the case with :
0.3CH4 + 0.7H2 + 0.95(O2 + 3.76N2) → 0.3CO2 + 1.3H2O + 3.572N2
Fore the case with :
H2 + 0.5(O2 + 3.76N2) → H2O + 1.88N2
2.5. Solution Method
To optimize computational efficiency, the simulation utilized single-precision accuracy alongside a stationary, pressure-based solver. The fundamental conservation equations, including continuity, momentum, energy, and species transport, were discretized with an upwind first-order method with finite-volume and implicit approaches according to the details that are available in Appendix A.
The jet boundary conditions were defined by a 10% turbulence intensity and corresponding hydraulic diameters. In the current problem, due to the small width of the chamber, the effect of gravity and buoyancy is very low. Therefore, the gravity effects were not considered in the models.
The gas mixture was managed via a Probability Density Function (PDF) approach in the applied non-premixed combustion. The mean scalar (like temperature, density, or mass fraction) is calculated by integrating the equilibrium data over the PDF as follows [41]:
where P(f) is the Beta distribution function. In non-adiabatic mode, this integration is repeated for different enthalpy values, and the results are stored in a look-up table. The lookup table is discretized using 100 uniform grid intervals along the mixture fraction coordinate (f), covering thermal boundaries from 300 K up to adiabatic flame temperature limits exceeding 2600 K depending on the specific H2 enrichment ratio (0%, 30%, 70%, and 99% H2). The intermediate species distributions stored within the PDF look-up table are fundamentally generated based on minimization of Gibbs free energy using standard high-temperature combustion thermochemistry data, which is based on well-established elementary reaction mechanisms (such as NASA polynomial coefficients [42,43] and standard species thermochemical data for hydrocarbon−hydrogen mixtures [44]). Although the equilibrium PDF approach assumes infinitely fast chemistry to evaluate local compositions, justified here by the high peak temperatures (around 2000 K), the underlying thermochemical property data rigorously account for the thermodynamic characteristics of all participating species, including CH4, H2, N2, O2, H2O, CO, CO2, C, H, O, HO2, H2O2, C2H6, HCO, HONO, HCOOH, HOCO, and CH2O. Furthermore, secondary pollutant tendencies are evaluated based on the resulting thermal fields and concentration profiles. During the solution, the temperature and species concentration values are extracted from this table based on the local value of mean mixture fraction, its fluctuations, and enthalpy (h), instead of solving complex chemical equations. More information on the numerical procedures and implementation of the equilibrium mixture-fraction/PDF framework is available in Appendix A.
To predict nitrogen oxide emissions across the varying CH4/H2 compositional spectrum, three distinct pathways were modeled: Thermal NOx, Prompt NOx, and the N2O-intermediate route (See Appendix A for more details). Thermal NOx was evaluated using the Extended Zeldovich mechanism, which is highly sensitive to the peak temperatures (exceeding 2000 K) induced by hydrogen addition [45]. The forward and reverse reaction rate constants for the Zeldovich reactions (O + N2 ⇌ NO + N, N + O2 ⇌ NO + O, and N + OH ⇌ NO + H) were adopted from standard literature values with well-established activation energies. Prompt NOx was modeled via the Fenimore mechanism, accounting for the rapid formation pathways active in flame zones containing hydrocarbon radicals (relevant to methane-rich blends). Additionally, the N2O-intermediate mechanism was included, which gains relative importance under specific lean or high-hydrogen conditions where intermediate N2O species significantly contribute to total NO through reactions involving O and M. The turbulent−chemistry interaction for NOx was solved by coupling the transport equations with the PDF look-up table fields, ensuring that local fluctuations in temperature and radical concentrations (O, H, and OH) are rigorously accounted for.
To model the radiation, the P1 model was implemented according to the details that are available in Appendix A. Applying radiation changes the outflow parameters by the following values: a 2.3% decrease in temperature; a 10.8% decrease in CO molar fraction; a 0.09% decrease in CO2 molar fraction; and a 3.7% decrease in maximum NO ppm at the channel outflow, when comparing cases with and without radiation for the combustion of a case containing 99% hydrogen. Moreover, the SIMPLE algorithm was employed to solve the governing equations and handle pressure−velocity coupling, in addition to the PRESTO! (Pressure Staggered Option) discretization for pressure. More details about the SIMPLE algorithm can be found in Appendix A. The simulation was launched with a hybrid initialization and progressed through 14,000 iterations to reach convergence and accurately resolve the combustion phenomena. Convergence was achieved when the continuity residuals reached a threshold of approximately 10−3.
3. Results and Discussion
In Section 3.1, first, the validation of the numerical method against the experimental data from the combustion chamber of Pierce and Moin [39,40] is presented. Then, in Section 3.2, the grid independence of the solution is presented. Afterwards, in Section 3.3, the mass flow rates of the fuel jet are fixed, and the air mass flow rate is set at the stoichiometric condition to investigate the effect of the hydrogen molar fraction at the fuel jet inlet on combustion parameters through the chamber. Then, in Section 3.4, the mass flow rate of fuel is fixed, and the air mass flow rate varies across the cases to analyze its effect on combustion and flow parameters in the outflow for different hydrogen molar fractions in the fuel jet. Finally, in Section 3.5, the industrial and practical implications of the current combustion system are discussed.
3.1. Validation Against Experimental Data
To validate the numerical model, a 2D axisymmetric simulation of non-premixed methane−air combustion was conducted in ANSYS Fluent 19.1, replicating the flow and geometric parameters established by Pierce and Moin [39,40]. The only differences between the current problem and their experimental benchmark are in the geometrical and flow values (see Figure 1). In the work of Pierce and Moin [37,38], the methane jet has an inlet velocity of Uf = 0.9278 m/s with the temperature of Tf = 300 K. The air jet has an inlet velocity of Ua = U = 20.63 m/s and a temperature of Ta = 750 K. The chamber pressure is fixed to be P0 = 3.8 atm. The chamber wall temperature is fixed to be Tw = 500 K. The geometrical parameters of their chamber are presented in Table 2.
Table 2.
Geometrical values of the parameters related to the Pierce and Moin benchmark (See Figure 1).
Figure 3a,b compare the simulated axial velocity profiles against experimental data of Pierce and Moin [39,40] at various radial positions and downstream distances. The results indicate that the PDF non-premixed combustion model aligns well with the experimental benchmarks, yielding a normalized absolute error of 19.7% for radial velocity. It is obvious that the flow behavior, such as the maximums of the velocity profile in the core flow and the zero-flow velocity on the walls, is predicted accurately.
Figure 3.
Validation of the numerical model by the axial velocity distribution through the various radial positions in different sections of the Pierce and Moin combustion chamber (R = 46.85 mm and U = 20.63 m/s are the inlet fuel jet radius and mean velocity, respectively) [39,40].
Figure 4a,b illustrate the validation of thermodynamic parameters such as temperature through the various radial positions obtained by the simulations and the experimental data at different distances from the inlets. As can be seen, the thermodynamic parameters determined by the numerical simulations are in good agreement with the experimental data, by a maximum normalized absolute error of 23%. Moreover, the behavior of the diagrams, such as the peaks and turning points, is predicted well.
Figure 4.
Validation of the numerical model by the temperature distribution through the various radial positions in different sections of the Pierce and Moin combustion chamber [39,40].
Figure 5a,b illustrate the validation of emission parameters through the CO mass fraction in various radial positions obtained by simulations and experimental data at different distances from the inlets. According to the figure, the CO mass fraction distribution is predicted well, and its maximum normalized absolute error is about 38%. However, the behavior of the diagrams on the walls and the core flow is predicted well. As CO and CO2 distributions are chemically coupled, the agreement between the distribution of CO by numerical and experimental approaches supports the validity of the CO2 predictions by the numerical model. The error between the numerical and experimental data is primarily attributed to the chemical equilibrium assumption, which does not account for the slow kinetic rates associated with CO oxidation. In the experimental setup, the finite-rate chemistry of CO leads to higher intermediate concentrations than the instantaneous equilibrium state predicted by the model. Furthermore, the use of a non-premixed PDF formulation, while necessary to capture enthalpy variations within the reaction zone, increases the sensitivity of intermediate species to local thermal fluctuations. It is important to mention that measurement errors during the experiments are also unavoidable. Nevertheless, the model accurately captures the peak locations and global reaction trends, making it a suitable tool for the comparative study of mixture combustion.
Figure 5.
Validation of the numerical model by the CO mass fraction distribution through the various radial positions in different sections of the Pierce and Moin combustion chamber [39,40].
3.2. Grid Independence
Figure 6a,b show the grid independence of the numerical solution. Five grid numbers, including 1950, 7800, 31,600, 129,000, and 516,000 elements, were selected for evaluation. The combustion of a stoichiometric mixture of CH4 enriched by 30% hydrogen was selected. As can be seen, the CO2 molar fraction is the most important emission parameter, and the maximum temperature of the flow at the outlet reaches approximately grid independence for the cases with 129,000 and 516,000 elements. The relative difference between the combustion and emission parameters is below 3% for these two cases. To avoid computational cost and running times, the case with 129,000 elements was chosen for parametric studies.
Figure 6.
Grid independence based on (a) outflow CO2 molar concentration and (b) outflow temperature of the channel for the case with the combustion of a stoichiometric mixture of CH4 enriched by 30% hydrogen.
3.3. Stoichiometric Combustion Analysis
To evaluate the effect of hydrogen enrichment on combustion parameters, it is appropriate to compare cases with varying hydrogen levels while maintaining a constant equivalence ratio. While this approach necessitates differences in fuel jet velocity due to the fixed fuel mass flow rate, the air mass flow rate is adjusted to ensure consistent combustion regimes through the same equivalence ratios across all cases. Consequently, while the chemical and aerodynamic effects remain intrinsically coupled under this parameterization, the comparison remains valid and meaningful from a combustion performance perspective. Figure 7a–d show the contours of turbulent intensity and flow streamlines for the stoichiometric combustion of fuel with various hydrogen molar fractions. Turbulent intensity is defined as the root-mean-square (RMS) of velocity fluctuations divided by the mean flow velocity. Since the general form of the contours is similar for various combustion regimes (lean, stoichiometric, and rich amounts of fuel in the mixture), in this section, only the stoichiometric cases are analyzed. According to the figure, the turbulence intensity in the air jet is higher due to the higher velocity. This jet deviates upward, forming one main circulation and a second small circulation in the corner of the chamber. Moreover, there is another small circulation that is formed in the combustion region. These circulations affect the fluid dynamics of the problem. By increasing the hydrogen molar fraction in the fuel, the inlet flow velocity and the turbulent intensity increase. This causes the main circulation to broaden and strengthen. Therefore, the combustion circulation is weaker, and its location moves downward. However, for the case with , due to the higher flammability of hydrogen, combustion happens sooner, and it has a stronger circulation with higher turbulent intensity. This weakens the main circulation in the flow. The maximum turbulent intensity is about 95% in the flame region for the case containing 99% hydrogen in the fuel. While cases contain less hydrogen, the maximum turbulence intensity is in the range of 40–60%. This increase in turbulence intensity is attributed to the intense volumetric expansion and the higher velocity gradients produced by the hydrogen-dominated flame front.
Figure 7.
Contours of turbulent intensity (in percent) and their corresponding streamlines for stoichiometric combustion of enriched methane with various hydrogen molar fractions in the chamber when .
The distributions of the velocity magnitude for stoichiometric combustion of the fuel with different hydrogen molar fractions are shown in Figure 8a–d. The upper jet is designated as the air jet. This configuration is chosen because the higher density of air compared to the fuel, coupled with a lower fuel mass flow rate, causes the air flow to deviate toward the fuel and promotes better mixing. Quantitatively, hydrogen enrichment induces a significant shift in the inlet velocity profiles. Therefore, with hydrogen enrichment, the density of the fuel decreases (in the standard state and ) so that the fuel velocity increases from 2.9 m/s to 22.7 m/s to provide the fixed mass flow rate. Meanwhile, the air velocity should also be increased from 10 m/s to 27.1 m/s to guarantee stoichiometric combustion. Consequently, the observed flame behavior is a coupled result of fluid dynamics and thermochemical properties. Notably, the upstream position of the combustion flame for the case containing 99% hydrogen in the fuel, despite significantly higher velocities, proves that the chemical acceleration of hydrogen outweighs the increased convective momentum of the jet. The physical mechanism driving the flow field deformation is the formation of the circulating flow in the combustion region. This causes the reactive jet to deviate more aggressively toward the outer wall. This upward trajectory has a direct impact on the chamber’s internal hydrodynamics: The collision with the outer boundary restricts the spatial development of the primary vortices, causing compression of the recirculation area as observed in Figure 7d and Figure 8d. The drastic volume expansion and local heat release induced by hydrogen combustion significantly alter the flow field topology. This phenomenon is due to the strong coupling between heat release and flow aerodynamics [46,47]. Moreover, for the case containing 99% hydrogen in the fuel, the flow has a higher level of velocity at the chamber outflow. In this case, the maximum outflow velocity magnitude is about 4.6 m/s. This exit acceleration is a direct result of thermal expansion-induced volumetric flow rate increases, where the high reactivity of hydrogen ensures that the expansion occurs much closer to the inlet, thereby maintaining higher momentum through the chamber’s longitudinal axis.
Figure 8.
Contours of velocity magnitude for stoichiometric combustion of enriched methane with various hydrogen molar fractions in the chamber when .
The distributions of the flow temperature through the combustion chamber for combustion of the CH4/H2 mixture, including various hydrogen molar fractions, are shown in Figure 9a–d. As can be seen, adding hydrogen increases the flow maximum temperature from 2100 K to about 2400 K, as the fuel transitions from pure methane to pure hydrogen. Convective transport and the local thermochemical equilibrium effects jointly dictate the spatial distribution of the temperature field. For H2 molar fractions up to 70%, the increase in inlet momentum (due to lower fuel density) dominates the physics, effectively stretching the flame and delaying the onset of the main reaction further downstream. However, at the 99% H2 limit, a mechanistic shift occurs: the exponential enhancement in thermodynamic reactivity and the high mass diffusivity overcome the convective velocity. This results in a 25% upstream shift of the flame position compared to the case with 70% hydrogen. In this case, due to the circulatory flow in the combustion zone, the main jet flow deviates upward around the inlets. Therefore, regions close to the adiabatic walls have higher temperatures. The increase in flame temperature due to hydrogen enrichment is attributed to hydrogen’s higher adiabatic flame temperature compared to methane, primarily because hydrogen requires less air for its combustion. Furthermore, the addition of hydrogen to the fuel alters the flame shape due to enhanced mixture diffusivity, flow momentum, and a reduction in its density.
Figure 9.
Contours of temperature for stoichiometric combustion of enriched methane with various hydrogen molar fractions in the chamber when .
The distributions of methane mole fraction through the domain for various hydrogen molar fractions in the fuel are shown in Figure 10a–d. For the case without hydrogen enrichment, the mole fraction of methane is 99% at the inlet. The methane jet travels approximately 45% of the chamber’s length before being completely consumed. The thickness and distance of methane travel decrease as the hydrogen molar fraction in the flow increases. The decrease in travel distance is driven by two primary mechanisms. Firstly, the addition of hydrogen enhances the thermodynamic reactivity and adiabatic flame temperature, resulting in a more rapid thermochemical response and oxidation of CH4 near the jet nozzle. Secondly, the presence of H2 improves the overall molecular diffusivity of the fuel blend. As the hydrogen molar fraction reaches over 70%, the axial distance required for complete methane consumption is reduced compared to the pure methane case, despite the increase in inlet fuel velocity.
Figure 10.
Contours of methane mole fraction for stoichiometric combustion of enriched methane with different hydrogen molar fractions in the chamber when .
The hydrogen travel distances of consumption are shown through the molar fraction contours in Figure 11a–d. According to Figure 10 and Figure 11, hydrogen has a longer and thicker consumption traveling distance relative to methane. By increasing the hydrogen molar fraction in the chamber up to 70%, the length of the traveling distance of hydrogen increases to more than 50% of the chamber length. This is due to the higher velocity and diffusion for cases with higher hydrogen content (hydrogen diffusivity is approximately 3 times higher than methane).
Figure 11.
Contours of hydrogen mole fraction for stoichiometric combustion of enriched methane with different hydrogen molar fractions in the chamber when .
A non-monotonic trend is observed in the hydrogen penetration length. As H2 enrichment increases from 0% to 70%, the fuel “core” elongates, eventually exceeding 50% of the chamber length. This expansion is a consequence of the increased convective momentum; the lower density of H2 necessitates higher inlet velocities, which initially outpace the chemical reaction rate.
However, at 99% H2, the penetration length undergoes a sharp contraction to approximately 40% of the chamber length. In this case, the sharply increased flame propagation potential and the enhanced mass diffusivity overcome the convective flow velocity. Therefore, significantly higher reactivity promotes a more rapid consumption of H2 near the inlet. This confirms that a fundamental change in the combustion regime occurs between 70% and 99% hydrogen content, where the governing regime transitions from a flow-dominated state to a thermodynamically driven state.
The contours of CO2 mole fractions in the chamber for different hydrogen contents in the fuel are shown in Figure 12a–d. As can be seen, in the jet inlets, due to the low reaction rate, there are no CO2 concentrations. However, the CO2 production is not concentrated in one specific zone; it continues to be produced toward the chamber outlet and outer corner of the chamber close to the jet inflows. After the completion of combustion, CO2 molar fractions reach about 9% for pure methane combustion in the air. By enriching the fuel with hydrogen, the degree of CO2 emission is decreased, such that for the case containing 99% hydrogen in the fuel, there is no CO2 production in the chamber. This is due to the replacement of carbon molecules by hydrogen in the fuel.
Figure 12.
Contours of CO2 mole fraction for stoichiometric combustion of enriched methane with different hydrogen molar fractions in the chamber when .
Figure 13a–d present the contours of CO mole fractions produced during the combustion process. For pure methane, the peak CO molar fraction is approximately 9% and is localized within the primary reaction zone. This concentration represents the incomplete oxidation stage before the final conversion to CO2. Mechanistically, the observed broadening and dilution of the CO field during hydrogen enrichment are driven by two competing factors. Firstly, the decrease in carbon-to-fuel ratio in the fuel causes lower CO production. Secondly, despite the enhanced reactivity, the higher inlet velocities associated with H2 enrichment (to maintain a fixed fuel mass flow) stretch the CO production zone downstream. Quantitatively, hydrogen enrichment reduces the peak CO molar fraction. While the 0% H2 case shows a concentrated CO core, the enriched cases exhibit a more dispersed distribution, indicating that the secondary oxidation of CO occurs over a larger spatial volume due to modified flow dynamics. As expected, CO production is eliminated in the 99% H2 case due to the total removal of carbon from the fuel stream.
Figure 13.
Contours of CO mole fraction for stoichiometric combustion of enriched methane with different hydrogen molar fractions in the chamber when .
In Section 3.1, it has been shown that the current model has enough accuracy in predicting the flow, thermodynamic, and emission parameters, such as CO and CO2 emissions. However, the NO predictions by the current model should be viewed mainly as qualitative trends rather than robust absolute values. Figure 14a–d illustrates the NO molar fraction contours, where the thermal (Zeldovich) mechanism serves as the primary driver for emissions. Quantitatively, the peak NO molar fraction doubles from 3000 ppm (pure CH4) to 6000 ppm (pure H2). This 100% increase is a non-linear response to the 300 K rise in maximum flame temperature. Mechanistically, the spatial broadening of NO in hydrogen-rich cases is attributed to two reasons. Firstly, enhanced thermal diffusivity expands the high-temperature residence zones toward the outer walls and outlet. Secondly, increased reactivity shifts the flame position closer to the inlets, initiating NO formation earlier in the flow path. The results indicate that while H2 enrichment eliminates carbon production, the intensified heat release significantly expands the NO formation volume.
Figure 14.
Contours of NO ppm for stoichiometric combustion of enriched methane with different hydrogen molar fractions in the chamber when .
3.4. Hydrogen Enrichment in Various Combustion Regimes
In this section, the cases with equivalence ratios of ϕ = 0.5 to ϕ = 1.5 for different molar fractions of hydrogen, including 0, 0.3, 0.6, and 1, were simulated. Figure 15 shows the diagrams of the chamber exit average temperature with equivalence ratio ϕ for different levels of hydrogen enrichment in the fuel. As can be seen, for the lean fuel mixtures with ϕ = 0.5, the outlet temperature is the minimum and approximately the same for all cases containing methane in the fuel (Tmin ≈ 1450 K). This means that enriching the fuel for fuel-lean mixtures does not change the exit temperature very much. By increasing the equivalence ratio up to ϕ = 1 − 1.1, the exit average temperature increases to reach a maximum. Under this condition, by enriching the fuel with hydrogen, the exit temperature increases from 2180 K to 2350 K (5.5% enhancement), which is considerable. By increasing the mixture equivalence ratio relative to stoichiometric mixtures, the exit temperature decreases. However, for the rich mixtures, unlike the cases with a low equivalence ratio, the exit temperature of the chamber changes significantly from 1800 K for the case with pure methane to 2300 K for the case containing 99% hydrogen in the fuel. For fuel-rich mixtures, several changes in behavior were observed for mixtures containing high hydrogen. For the cases with 99% hydrogen and 1 < ϕ < 1.3, the slope of reduction in the exit temperature with the mixture equivalence ratio is low. For the cases with 99% hydrogen and ϕ > 1.3, increasing the equivalence ratio of the combustion mixture not only does not reduce the outlet temperature, but even slightly increases it. A notable behavioral shift is observed around the 70% hydrogen enrichment region. In this compositional range, the mixture properties are largely dominated by the characteristics of H2, although the remaining CH4 still influences the global thermochemical behavior. This phenomenon is also governed by the shift in thermochemical equilibrium properties relative to the residence time, driven fundamentally by the competition between increased convective momentum and enhanced chemical reactivity. While the lower density of H2 necessitates a higher inlet jet velocity to maintain a constant fuel mass flow rate under stoichiometric conditions, the non-linear increase in flame speed at high enrichment levels eventually dominates the flow physics. Consequently, the flame remains significantly closer to the injector. This upstream shift leads to a contraction of the recirculation zones (as seen in Figure 7d) due to intense localized thermal expansion and modified pressure gradients in the near field. Furthermore, the intensified heat release near the inlet facilitates different downstream cooling characteristics, explaining the variations in exit temperature compared to lower enrichment cases.
Figure 15.
Change in temperature at the chamber outlet with the mixture equivalence ratio for different levels of hydrogen enrichment when .
Figure 16 illustrates the average exit CO2 mole fraction across the range of equivalence ratios (ϕ) and hydrogen enrichment levels. A non-symmetrical distribution is observed, where the maximum CO2 production is slightly shifted toward the lean regime ϕ < 1) rather than the exact stoichiometric point. Two main factors are responsible for this shift in both spatial and chemical distributions. The first one is oxidation completion. In the lean regime, excess oxygen ensures the complete conversion of CO to CO2. Conversely, as the mixture moves toward the rich limit (ϕ = 1.5), CO2 levels drop to their minimum because the lack of available oxygen favors the formation of CO and unburned intermediates over CO2. The second factor is carbon dilution. Hydrogen enrichment acts as a carbon-displacing agent. Quantitatively, the peak CO2 emission is reduced by increasing the H2 molar fraction. Mechanistically, the CO2 reduction is not merely a result of less carbon in the fuel, but also a modification of the reaction pathway. The presence of H2 accelerates radical-branching reactions, which typically would speed up CO oxidation; however, the simultaneous decrease in total carbon atoms dominates the global species balance, resulting in the observed linear decline in emissions across all equivalence ratios.
Figure 16.
Change in CO2 molar fraction at the chamber outlet with the mixture equivalence ratio for different levels of hydrogen enrichment when .
Figure 17 illustrates the CO mole fraction at the chamber outlet as a function of the equivalence ratio (ϕ). As expected, CO emissions scale with ϕ, peaking at approximately 8.5% for the fuel-rich case (ϕ = 1.5) due to oxygen-deficient conditions. Notably, CO is still present even at stoichiometric conditions (ϕ = 1), which is mechanistically attributed to the non-premixed nature of the injection and local thermodynamic/mixing constraints. In such systems, the local mixing time is often comparable to the characteristic residence time, potentially influencing the extent of conversion before the flow exits the domain. A significant shift in CO sensitivity is observed at the 70% H2 enrichment threshold. This means that below 70% enrichment, CO molar fractions decrease linearly as hydrogen displaces carbon in the fuel stream. However, between ϕ = 0.9 and 1.2, the 70% H2 case exhibits an unexpected stability in CO levels. This phenomenon is attributable to a transition in the flow dynamics of the CH4/H2 mixture; the enhanced thermodynamic reactivity of H2 shifts the flame upstream, thereby modifying the residence time within the primary recirculation zone.
Figure 17.
Change in CO molar fraction at the chamber outlet with the mixture equivalence ratio for different levels of hydrogen enrichment when .
Quantitatively, increasing H2 from 0% to 70% reduces the exit CO by 25% at ϕ = 1.5. This reduction is a synergistic result of lower initial carbon content and the enhanced OH radical, which facilitates more efficient conversion of CO to CO2 despite the shortened residence times caused by higher inlet velocities.
Figure 18 illustrates the exit NO concentration as a function of the equivalence ratio across various hydrogen enrichment levels. For all fuel blends, NO production peaks near the slightly lean condition (ϕ = 0.9), where the combination of high flame temperatures and available oxygen optimizes the thermal Zeldovich mechanism. Two significant deviations from standard NOx scaling are observed. Firstly, in the range of 1.0 < ϕ < 1.2, increasing hydrogen content from 30% to 70% results in a marginal decrease in NO emissions. This abnormal trend is directly coupled to the thermodynamic behavior observed in Figure 15, where the 70% H2 cases exhibit lower exit temperatures compared to 30% enrichment. This suggests that at this specific threshold, the convective cooling effect from the higher-velocity hydrogen jet outweighs the increased chemical heat release, effectively suppressing thermal NO formation. Secondly, contrary to conventional expectations, where NO typically decreases in fuel-rich conditions due to lower temperatures, the NO concentration increases from 3000 to 4750 ppm as ϕ moves from 1.1 to 1.5. This is explained by the thermal and recirculation behavior unique to this chamber geometry. As ϕ increases, the peak temperature zone shifts upstream, and for high-hydrogen cases, the temperature remains high enough to sustain NO production even as the global mixture becomes rich. Quantitatively, the transition to pure hydrogen results in a 100% increase in NO at ϕ = 0.9 compared to pure methane. This underscores that while hydrogen avoids carbon emissions, its impact on the thermal NO pathway is highly sensitive to local flow-field and temperature interactions between 70% and 99% enrichment.
Figure 18.
Change in NO concentration (ppm) at the chamber outlet with the mixture equivalence ratio for different levels of hydrogen enrichment when .
3.5. Industrial and Practical Implications
The results in the current study show a fundamental behavioral shift as hydrogen enrichment reaches higher fractions (such as the 70% level investigated). While existing methane-dominant configurations can likely handle lower hydrogen fractions (e.g., up to 30%), higher-fraction blends approaching or exceeding 70% indicate that nozzle or cooling system adaptations may be required due to the upstream shift in flame position. Therefore, it is suggested that active flow control or variable geometry injectors might be needed for very high-hydrogen blends.
Hydrogen enrichment moves the flame closer to the inlet and increases peak temperatures, creating thermal hot spots near the injector face. It is recommended to use high-temperature alloys or thermal barrier coatings specifically for the injector head and chamber walls, as these areas face higher heat fluxes under high-hydrogen operations compared to pure methane.
It is found that NOx emissions increase significantly while CO2 decreases with high hydrogen enrichment. Therefore, operators cannot simply switch to pure H2 without considering environmental compliance. It is suggested that industrial plants utilizing high concentrations should implement Exhaust Gas Recirculation (EGR) or Selective Catalytic Reduction (SCR) to mitigate the elevated thermal NOx levels highlighted in this study. Furthermore, stable operation observed around the 30% hydrogen enrichment range within ϕ = 0.9 to 1.2 provides an appropriate operational window. This specific equivalence range is recommended for industrial furnaces requiring high heat throughput with a stable flame position, balancing performance and emissions.
4. Future Work and Recommendations
While this study provides a comprehensive numerical framework for understanding the fluid dynamics, thermal behavior, and operational thresholds of methane−hydrogen (CH4/H2) non-premixed combustion, several directions remain open for future investigation. Building upon the macroscopic insights gained from the equilibrium-based PDF model, future studies should incorporate detailed finite-rate chemistry kinetics or unsteady flamelet models to enable precise quantitative prediction of kinetically controlled pollutants like NOx. Furthermore, given that hydrogen enrichment exceeding 70% necessitates burner structural modifications, subsequent research should focus on optimizing injector and chamber geometry configurations. Expanding physical testing into high-hydrogen regimes (>70%) and rich conditions (ϕ > 1.2), alongside transient 3D simulations to capture dynamic phenomena such as flame flashback, will also be crucial for further validating these industrial-scale applications.
5. Conclusions
This study investigated the thermochemical and fluid-dynamic transitions in methane−hydrogen non-premixed combustion through numerical simulation using a PDF non-premixed model. The CFD analysis revealed that hydrogen enrichment induces fundamental shifts in combustion performance that extend beyond simple fuel substitution effects. The findings demonstrate that hydrogen enrichment significantly intensifies the turbulent intensity by up to 95% and transforms the primary recirculation zone from an elongated elliptical structure into a compact circular form. This morphological transition directly dictates species residence time and flame stability. Crucially, the observed upstream shift of hydrogen-enriched combustion, despite higher inlet momentum, indicates that the enhanced thermodynamic reactivity provided by hydrogen blending outweighs the increased convective transport. Based on compositional sweeps, a transitional behavioral shift is observed around the 70% enrichment region. Below this level, behavior is largely governed by methane characteristics and convective transport, whereas above it, the high reactivity and diffusivity of hydrogen significantly alter thermal profiles and species distribution. Regarding environmental performance, hydrogen enrichment effectively reduces CO2 emissions. However, it triggers a non-monotonic trend in NO production. Notably, near the 70% hydrogen enrichment level, specific flow dynamic changes correspond to lower NOx emissions compared to lower enrichment levels. The system exhibits peak thermal sensitivity near ϕ ≈ 0.95, where NO emissions show a substantial increase when transitioning from pure methane to pure hydrogen fuel. Contrary to conventional expectations, where NO typically decreases in fuel-rich conditions, the NO concentration increases as ϕ moves from 1.1 to 1.5 because of the thermal and change in recirculation behavior in the chamber. While lean regimes allow for carbon footprint reduction without substantial NOx penalties, rich regimes maintain elevated exit temperatures (2300 K) where methane-dominant cases typically undergo thermal quenching. Based on these results, the mixtures close to 30% hydrogen blend are recommended for industrial applications within the efficient equivalence range (0.9 < ϕ < 1.2). These blends provide an optimal balance, yielding higher outflow temperatures and lower CO and NOx emissions compared to high-hydrogen configurations. Ultimately, the study highlights that a graded operational strategy is required for retrofitting industrial burners: an enrichment up to the 30% blend level allows for minimal operational adjustments, whereas high-hydrogen configurations approaching and exceeding the 70% level necessitate a redesign of the injector near field to mitigate localized heat release and accelerated NOx.
Author Contributions
Investigation, M.S.; resources, M.S. and A.T.; software, M.S.; writing—original draft, M.S.; methodology, M.S.; conceptualization, A.T., M.I., G.P. and D.F.; validation, M.S.; data curation, M.S.; writing—review and editing, A.T., G.P., M.I. and D.F.; formal analysis, A.T., G.P., M.I. and D.F.; supervision, A.T. All authors have read and agreed to the published version of the manuscript.
Funding
This study is financed by the European Union—NextGenerationEU—through the National Recovery and Resilience Plan of the Republic of Bulgaria, Project No. BG-RRP-2.004-0005.
Data Availability Statement
Details and clarifications could be obtained from the corresponding authors upon request.
Acknowledgments
M. Sahami would like to express his deep gratitude to the Technical University of Sofia for the opportunity to carry out a Mid-Career Research Fellowship. M. Sahami also wants to acknowledge University of Florence for supporting him in a postdoctoral research visit during part of this study.
Conflicts of Interest
The authors declare no conflict of interest.
Nomenclature
| Ai | cell-face area vector component |
| ap | central matrix coefficient |
| anp | neighboring matrix coefficient |
| standard-state specific heat, J/kg·K | |
| cj | mass fraction of jth component |
| Dm | mass diffusion coefficient, m2/s |
| DT | thermal diffusion coefficient, m2/s |
| e | specific total internal energy, J/kg |
| Ea | activation energy, kJ/mole |
| FA | fuel air ratio |
| f | mixture fraction |
| g | linear-anisotropic scattering phase function asymmetry factor |
| G | Gibbs free energy of the mixture, J |
| Ginc | incident radiation, W/m2 |
| h | specific enthalpy of flow, J/kg |
| diffusion flux, 1/s2 | |
| k | specific kinetic energy, J/kg |
| keff | effective thermal conductivity, W/(m·K) |
| kf,i | forward reaction rate of ith reaction, mole/m3·s |
| kr,i | forward reaction rate of ith reaction, mole/m3·s |
| L | length, m |
| mass flow rate, kg/s | |
| Mj | molar mass of jth component, kg/mole |
| Ma | Mach number |
| nj | mole number of jth component |
| [NO] | molar concentration of NO, Mol/m3 |
| P | static pressure field, Pa |
| P* | updated pressure field, Pa |
| P° | standard state pressure, Pa |
| P′ | correction for pressure field, Pa |
| P(f) | Beta distribution function |
| qr | radiative heat flux vector, W/m2 |
| R | channel radius, Universal gas constant, mm, J/(kg·K) |
| Rch | chemical consumption rate, kg/(m3·s) |
| r | radial distance from channel axis, μm |
| Si | remaining source terms |
| Sct | Schmidt number |
| Sij | mean rate of strain tensor, 1/s |
| Srad | heat source from radiations, J/(m3·s) |
| T | flow temperature, K |
| Tref | reference temperature, K |
| t | time, s |
| flow velocity vector, m/s | |
| correction for velocity field, m/s | |
| intermediate velocity fields, m/s | |
| ν | kinematic viscosity, m2/s |
| U | mean velocity of the air inlet, m/s |
| x | axial distance from the jet inlet, m |
| y | molar fraction |
| Greek letters | |
| ε | dissipation rate, m2/s3 |
| ϕ | equivalence ratio |
| ϕf | transported variable upstream cell-center |
| ϕP | transported variable in upstream node value |
| ϕNB | transported variable in downstream node value |
| mean scalar | |
| Γp | radiation diffusion coefficient, m2/s |
| μ | dynamic viscosity, Pa.s |
| μt | turbulent viscosity, Pa.s |
| standard chemical potential of jth component | |
| ρ | density, kg/m3 |
| σ | Stefan−Boltzmann coefficient, W/m2·K4 |
| mean rate of rotation tensor, 1/s | |
| τ | total stress, Pa |
| Subscripts | |
| a | air |
| f | fuel |
| j | component index |
| in | inlet |
| m | mass-based |
| M | molar based |
| st | stoichiometric |
| t | total |
| w | wall |
| Abbreviations | |
| CFD | Computational Fluid Dynamics |
| EOS | equation of state |
| ppm | particle per million |
| probability density function | |
| RANS | Reynolds-Averaged Navier−Stokes |
Appendix A. Supplementary Methodology and Specifications
Appendix A.1. Thermochemical Look-Up Table and Equilibrium PDF Framework
For any given mixture fraction f and enthalpy level, the chemical composition of the multi-component mixture (including major species, minor intermediates, and radical pools such as O, H, OH, CO, and H2O) is determined by assuming chemical equilibrium through the minimization of total Gibbs free energy (G) [48]:
where nj is the number of moles of species j, is the standard chemical potential, R is the universal gas constant, T is the temperature, P° is the standard state pressure, and P is the operating pressure.
Appendix A.2. NASA Polynomial Coefficients Database
Thermodynamic properties, specifically standard-state specific heat (), for all individual species are evaluated as a function of temperature using standard 7-coefficient NASA polynomial fits [48]:
where R is the universal gas constant. The coefficients a1 to a6 for CH4, H2, O2, N2, CO2, H2O, and associated dissociated radicals in the CH4/H2 combustion mechanism are detailed in Table A1 were imported directly from the standard NASA thermodynamic database [43] are detailed in Table A1.
Table A1.
NASA polynomial coefficients for species in Equations (A2) and (A4).
Within the equilibrium mixture-fraction/PDF framework, the absolute enthalpy of the reacting mixture is tracked as a conserved scalar to account for thermal energy transport and combustion heat release. The total enthalpy h for any multi-component mixture state is computed by summing the mass-fraction-weighted enthalpies of all individual species, combining their sensible heat and chemical formation energy [48]:
where cj represents the mass fraction of species j, is the standard enthalpy of formation at the reference temperature (Tref = 298.15 K), and Cp,j is the temperature-dependent specific heat at a constant pressure. To evaluate these values efficiently during look-up table generation, specific enthalpy for each species is explicitly integrated using the standard 7-coefficient NASA polynomial fits [48]:
where Mj is the species molecular weight. Coefficients a1 to a6 are presented in Table A1. Multiplying this dimensionless expansion by the universal gas constant R and local temperature T yields the absolute molar enthalpy, which is subsequently mapped against the mixture fraction coordinate to solve the energy conservation equation throughout the CFD domain.
Appendix A.3. NOx Formation Sub-Models
To predict nitric oxide (NO) emissions accurately across the varying hydrogen-enrichment ratios (0% to 99% H2), three primary chemical pathways are coupled with the equilibrium flow field: the Thermal (Extended Zeldovich), Prompt (Fenimore), and N2O-intermediate mechanisms. The transport equation for the mass fraction of NO (cNO) is solved alongside the main flow equations, incorporating source terms derived from these finite-rate kinetic pathways.
Appendix A.3.1. Thermal Mechanism
Operating predominantly at high flame temperatures (T > 1800 K), this mechanism is governed by three primary reversible reactions known as Extended Zeldovich mechanisms [45]:
O + N2 ⇌ NO + N
N + O2 ⇌ NO + O
N + OH ⇌ NO + H
The forward (kf,i) and reverse (kr,j) reaction rates are expressed using Arrhenius forms, . The standard kinetic parameters implemented in the solver for these reactions are as follows [45]:
Reaction (A5): A1 = 1.8 × 10¹¹ m3/kmol⋅s, β1 = 0.0, Ea,1 = 318.0 kJ/mol
Reaction (A6): A2 = 1.8 × 10⁴ m3/kmol⋅s, β2 = 1.0, Ea,2 = 20.8 kJ/mol
Reaction (A7): A3 = 7.1 × 10⁷ m3/kmol⋅s, β3 = 0.0, Ea,3 = 33.5 kJ/mol
Appendix A.3.2. Prompt Mechanism
The prompt mechanism is significant in fuel-rich regions where hydrocarbon radicals (CH, CH2) react rapidly with molecular nitrogen to form cyanogen species (e.g., HCN) before subsequently oxidizing into NO. The global formation rate of prompt NO is modeled using an empirical expression [49,50]:
where [NO] is the molar concentration of [NO]. The pre-exponential factor (kprompt) is set to fC⋅1.2 × 10¹¹ exp(−32,500/T), with fC being an aromaticity correction factor adjusted for methane−hydrogen blending effects.
Appendix A.3.3. N2O-Intermediate Mechanism
The N2O-intermediate mechanism is particularly relevant in lean, high-pressure, or high-hydrogen combustion environments where low flame temperatures suppress thermal NO. Nitrogen is oxidized via third-body interactions involving nitrous oxide [51]:
O + N2 + M ⇌ N2O + M
H + N2O ⇌ NO + NH
O + N2O ⇌ NO + NO
The forward reaction rate parameters implemented in the solver for these reactions are as follows [45]:
Reaction (A9): A1 = 3.5 × 1024 m6/kmol2⋅s, β1 = −1.25, Ea,1 = 28.6 kJ/mol
Reaction (A10): A2 = 7.6 × 10⁷ m3/kmol⋅s, β2 = 0, Ea,2 = 62.8 kJ/mol
Reaction (A11): A3 = 2.9 × 10⁷ m3/kmol⋅s⋅s, β3 = 0.0, Ea,3 = 116.0 kJ/mol
Appendix A.4. Turbulence Modeling
To model turbulent transport and closure for the 2D axisymmetric jet flame, the realizable k-ε turbulence model was employed. This formulation satisfies mathematical constraints on the Reynolds stresses consistent with the physics of turbulent flows, making it robust for boundary layers and round jets. The transport equations for turbulent kinetic energy (k) and its dissipation rate (ε) are defined as follows [52]:
where Gk, Gb, YM, Sk, and Sε are the source terms, σk is the kinetic Prandtl number, σε is the dissipative Prandtl number, and ν is the kinematic viscosity. The turbulent viscosity μt is computed using a variable Cμ parameter to ensure realizability [52]:
where , with Sij being the mean rate of strain tensor and being the mean rate of rotation tensor viewed in a rotating reference frame. The standard model constants implemented in the k-ε realizable turbulence model include , where and , alongside C2 = 1.9, σk = 1.0, and σε = 1.2.
Appendix A.5. SIMPLE Pressure−Velocity Coupling
To resolve the inherent linkage between the velocity and pressure fields within the governing Navier−Stokes equations, the Semi-Implicit Method for Pressure-Linked Equations (SIMPLE) algorithm was implemented. Because an explicit equation for pressure does not exist in standard conservation laws, the continuity equation is systematically transformed into a pressure-correction equation to enforce mass conservation iteratively. The numerical solution procedure begins with a predictor step where intermediate velocity fields () are calculated by solving the discretized momentum equations based on a guessed or previously updated pressure field (p*) [53]:
where aP and anb represent the central and neighboring matrix coefficients, respectively, Ai denotes the cell-face area vector component, and Si encapsulates the remaining source terms. Because the intermediate velocities do not generally satisfy the continuity equation, corrections for pressure (p′) and velocity (ui′) are introduced such that the true fields are expressed as p = p* + p′ and . Subtracting the intermediate velocity equation from the exact momentum equation yields the velocity correction relation [53]:
where di is a function of the central matrix coefficient aP. Substituting these corrected velocity expressions into the discretized continuity equation results in the governing pressure-correction Poisson equation [53]:
Solving this elliptic equation yields the pressure correction field p′, which is subsequently used to update the pressure field and correct the mass fluxes across cell faces. Under-relaxation factors are applied to both pressure and velocity updates to maintain numerical stability during high-temperature reactions involving CH4/H2 fuel blends. This iterative correction loop continues sequentially until the normalized residuals for continuity, momentum, energy, and turbulence scalars fall below the predefined values in the solver (such as 10−3).
Appendix A.6. Spatial Discretization Schemes
Spatial discretization of the governing partial differential equations was performed using a finite-volume framework featuring a consistent first-order upwind scheme across all convective transport terms. In this formulation, the face value of any transported variable ϕf is approximated by its upstream cell-center value based on the local mass flow direction as follows [53]:
where represents the mass flow rate through the control volume face, ϕP denotes the upstream node value, and ϕNB denotes the neighboring downstream node value. This approach guarantees robust numerical boundedness and prevents non-physical scalar oscillations across the steep temperature and concentration gradients of the reactive zone. Diffusive fluxes and viscous terms were integrated using corresponding numerical approximations to maintain a uniform order of spatial accuracy throughout the computational domain, ensuring stable convergence for the coupled turbulent combustion and flow field equations.
Appendix A.7. P1 Radiation Modeling
To account for radiative heat transfer within the high-temperature reactive zone of the CH4/H2 jet flame, the P-1 radiation model was implemented as the baseline differential approximation method. This approach is computationally efficient and well suited for absorbing and emitting combustion gases where the optical thickness is moderate to large. Rather than solving the full radiative transfer equation across all angular directions, the P1 model solves a transport equation for the incident radiation Ginc, defined as the integral of radiation intensity over all directions. The transport equation governing the incident radiation G is expressed as [54]:
where aab is the absorption coefficient of the gas mixture, σ is the Stefan−Boltzmann constant, T is the local absolute temperature, and Γp represents the radiation diffusion coefficient defined by [54]:
where σs denotes the scattering coefficient, and g is the linear-anisotropic scattering phase function asymmetry factor. The radiative heat flux vector qr is subsequently evaluated from the gradient of incident radiation via qr = −Γp∇Ginc, and its divergence serves as the volumetric sink or source term in the governing energy equation through −∇⋅qr = aabGinc − 4aabσT4, accurately coupling radiation heat losses with the thermochemical field.
∇⋅(Γp∇G) + aabGinc = 4aabσT4
References
- Balocco, C.; Pierucci, G.; Piselli, C. Green System Effects on Energy Environmental Sustainability of Urban Built-Up Areas. Energies 2025, 18, 1640. [Google Scholar] [CrossRef] [Scilit]
- Mardani, A.; Tabejamaat, S.; Hassanpour, S. Numerical study of CO and CO2 formation in CH4/H2 blended flame under MILD condition. Combust. Flame 2013, 160, 1636–1649. [Google Scholar] [CrossRef] [Scilit]
- Wang, J.; Huang, Z.; Tang, C.; Miao, H.; Wang, X. Numerical study of the effect of hydrogen addition on methane–air mixtures combustion. Int. J. Hydrogen Energy 2009, 34, 1084–1096. [Google Scholar] [CrossRef] [Scilit]
- Yilmaz, D.; Onbasioglu, S.U.; Gökalp, I. Computational modeling of hydrogen enriched non premixed turbulent methane air flames. In Proceedings of the European Combustion Meeting (ECM), 3–6 April 2005; Combustion Institute: Louvain-la-Neuve, Belgium, 2005; Volume 2005, pp. 3–6. [Google Scholar]
- Attia, M.; Boukhari, A.; Bouras, F.; Driss, Z. CFD Study of Methane-Hydrogen Behavior in a Non-Premixed Combustion Chamber. In Proceedings of the International Symposium on Sustainable Hydrogen ISSH2′2017, Algiers, Algeria, 26–27 November 2017; Available online: https://archives.univ-eloued.dz/handle/123456789/1064 (accessed on 1 September 2026).
- No, S.; Gu, J.; Moon, H.; Lee, C.; Jo, Y. An Introduction to Combustion Concepts and Applications; McGraw-Hill Korea: Seoul, Republic of Korea, 2011. [Google Scholar]
- Hafeez, M.A. Computational Fluid Dynamics Modelling of Non-Premixed Hydrogen Combustion in O2-H2O Mixtures Using ANSYS Fluent. Master’s Thesis, University of Lisbon, Lisbon, Portugal, 2022. Available online: https://scholar.tecnico.ulisboa.pt/records/PmICzPQdCx_mQWpdOFDfXb2J41juIPWb9ugN?lang=en (accessed on 1 September 2026).
- Alipour-Dehkordi, A.; Neek, S.J.; Shahnazar, A. Sustainable H2 production from glycerol steam reforming in the heat-integrated reactor: Using reforming-side by-products as feed for the catalytic combustion-side. J. Ind. Eng. Chem. 2022, 113, 264–274. [Google Scholar] [CrossRef] [Scilit]
- Castellani, S. High-Fidelity Numerical Modelling of Hydrogen-Methane Combustion; Università degli Studi di Firenze: Florence, Italy, 2025; Available online: https://flore.unifi.it/handle/2158/1426172 (accessed on 1 September 2026).
- Shi, L.; Meng, X.; Wu, Y. Numerical study on the propagation of CH4/H2 flame in a pipeline under different H2 enrichment conditions. J. Clean. Prod. 2023, 423, 138689. [Google Scholar] [CrossRef] [Scilit]
- Castellani, S.; Meloni, R.; Orsino, S.; Ansari, N.; Yadav, R.; Bessette, D.; Boxx, I.; Andreini, A. High-fidelity H2–CH4 jet in crossflow modelling with a flame index-controlled artificially thickened flame model. Int. J. Hydrogen Energy 2023, 48, 35291–35304. [Google Scholar] [CrossRef] [Scilit]
- Castellani, S.; Andreini, A.; Meloni, R. Development of a Virtual Chemistry Reaction Mechanism for H2/CH4 Turbulent Combustion Modelling. J. Eng. Gas. Turbines Power 2025, 147, 041003. [Google Scholar] [CrossRef] [Scilit]
- Sohrabi, A.; Mirsajedi, S. Three-dimensional simulation of wet combustion of hydrogen-methane mixture in the annular combustion chamber of a microturbine. J. Appl. Fluid Mech. 2025, 18, 1396–1411. [Google Scholar] [CrossRef] [Scilit]
- Huete Ruiz de Lira, C.; Martínez Ferrer, P.J.; Martínez-Ruiz, D.; Mira Martínez, D. Effect of inlet conditions in hydrogen–air supersonic reactive mixing layers. In Proceedings of the 29th International Colloquium on the Dynamics of Explosions and Reactive Systems (ICDERS), Seoul, Republic of Korea, 23–28 July 2023. [Google Scholar] [CrossRef]
- Domínguez-González, A.; Martínez-Ruiz, D.; Vervisch, L. Flame curvature in heat-loss-affected lean hydrogen flames: A one-dimensional manifold approach. Combust. Flame 2026, 283, 114571. [Google Scholar] [CrossRef] [Scilit]
- Gatón-Pérez, P.; Jiménez, C.; Martínez-Ruiz, D.; Kurdyumov, V.N. Numerical multi-scale analysis of premixed-flame thermoacoustic instabilities with wall heat quenching. Proc. Combust. Inst. 2026, 42, 106047. [Google Scholar] [CrossRef] [Scilit]
- Zohra, K.F.; Mounir, A.; Salah, C. Numerical simulation of CH4-H2-AIR non-premixed flame stabilized by a bluff body. Energy Procedia 2017, 139, 530–536. [Google Scholar] [CrossRef] [Scilit]
- Mouangue, R.; Obounou, M. Numerical simulation of a h2/air turbulent diffusion flame. Phys. Chem. News 2009, 50, 69–78. [Google Scholar]
- Lysenko, D.A.; Ertesvåg, I.S.; Rian, K.E. Numerical simulation of non-premixed turbulent combustion using the eddy dissipation concept and comparing with the steady laminar flamelet model. Flow Turbul. Combust. 2014, 93, 577–605. [Google Scholar] [CrossRef] [Scilit]
- Kekec, K.B.; Karyeyen, S. H2–CH4 blending fuels combustion using a cyclonic burner on colorless distributed combustion. Int. J. Hydrogen Energy 2022, 47, 12393–12409. [Google Scholar] [CrossRef] [Scilit]
- Muppala, S.; Manickam, B.; Dinkelacker, F. A comparative study of different reaction models for turbulent methane/hydrogen/air combustion. J. Therm. Eng. 2015, 1, 367–380. [Google Scholar] [CrossRef] [Scilit]
- Therkelsen, P.; Werts, T.; McDonell, V.; Samuelsen, S. Analysis of NOx Formation in a Hydrogen-Fueled Gas Turbine Engine. J. Eng. Gas Turbines Power 2009, 131, 031507. [Google Scholar] [CrossRef] [Scilit]
- Attia, M.E.H.; Khechekhouche, A.; Driss, Z. Numerical simulation of methane-hydrogen combustion in the air: Influence on combustion parameters. Indian J. Sci. Technol. 2018, 11, 1–8. [Google Scholar] [CrossRef] [Scilit]
- Li, P.; Wang, F.; Mi, J.; Parente, A. Mechanisms of NO formation in MILD combustion of CH4/H2 fuel blends. Int. J. Hydrogen Energy 2014, 39, 19187–19203. [Google Scholar] [CrossRef] [Scilit]
- Wang, Y.; Zhang, X.; Li, Y. Numerical simulation of methane-hydrogen-air premixed combustion in turbulence. Int. J. Hydrogen Energy 2023, 48, 7122–7133. [Google Scholar] [CrossRef] [Scilit]
- Ziani, L.; Chaker, A.; Chetehouna, K.; Malek, A.; Mahmah, B. Numerical simulations of non-premixed turbulent combustion of CH4–H2 mixtures using the PDF approach. Int. J. Hydrogen Energy 2013, 38, 8597–8603. [Google Scholar] [CrossRef] [Scilit]
- Amez, I.; Castells, B.; Garcia-Torrent, J.; Medic, L. Influence of the addition of hydrogen on the flammability intervals of the methane, air and CO2 mixtures. In Proceedings of the 19th International Multidisciplinary Scientific GeoConference, Varna, Bulgaria, 28 June–7 July 2019; STEF92 Technology Ltd.: Sofia, Bulgaria, 2019; Volume 19, pp. 239–245. Available online: https://oa.upm.es/63206/ (accessed on 1 September 2026).
- Khalifehei, M.; Yalcinkaya, Y.; Padilla-Montero, I.; Gungor, A.G.; Rodríguez, D. Investigation of the coupling between the dynamics of vortical structures and flame stability in bluff-body premixed combustion using extended spectral proper orthogonal decomposition. J. Eng. Gas. Turbines Power 2025, 147, 031001. [Google Scholar] [CrossRef] [Scilit]
- Ziani, L.; Chaker, A. Ambient pressure effect on non-premixed turbulent combustion of CH4–H2 mixture. Int. J. Hydrogen Energy 2016, 41, 11842–11847. [Google Scholar] [CrossRef] [Scilit]
- Paccati, S.; Mazzei, L.; Andreini, A.; Facchini, B. Reduced-order models for effusion modeling in gas turbine combustors. J. Turbomach. 2022, 144, 081013. [Google Scholar] [CrossRef] [Scilit]
- Pampaloni, D.; Nassini, P.C.; Andreini, A.; Facchini, B.; Cerutti, M. Numerical investigations of pollutant emissions from novel heavy-duty gas turbine burners operated with natural gas. J. Eng. Gas. Turbines Power 2020, 142, 031025. [Google Scholar] [CrossRef] [Scilit]
- De Robbio, R. Innovative combustion analysis of a micro-gas turbine burner supplied with hydrogen-natural gas mixtures. Energy Procedia 2017, 126, 858–866. [Google Scholar] [CrossRef] [Scilit]
- dos Reis, P.R.S.; Martin, F.E.; Oliveira, T.D.; Tofaneli, L.A.; Santos, A.Á.B. Reproduction and Adaptation of Literature-Derived Modeling: Numerical Simulation of Methane/Hydrogen Non-Premixed Combustion. J. Bioeng. Technol. Health 2025, 8, 352–358. [Google Scholar] [CrossRef] [Scilit]
- Ouali, S. Numerical simulation of H2 addition effect to CH4 Premixed turbulent flames for gas turbine burner. J. Appl. Fluid Mech. 2024, 17, 1746–1758. [Google Scholar] [CrossRef] [Scilit]
- Parente, A.; Galletti, C.; Tognotti, L. A simplified approach for predicting NO formation in MILD combustion of CH4–H2 mixtures. Proc. Combust. Inst. 2011, 33, 3343–3350. [Google Scholar] [CrossRef] [Scilit]
- Du Toit, M.; Engelbrecht, N.; Oelofse, S.P.; Bessarabov, D. Performance evaluation and emissions reduction of a micro gas turbine via the co-combustion of H2/CH4/CO2 fuel blends. Sustain. Energy Technol. Assess. 2020, 39, 100718. [Google Scholar] [CrossRef] [Scilit]
- Bettagli, N.; Desideri, U.; Fiaschi, D. A biomass combustion-gasification model: Validation and sensitivity analysis. J. Energy Resour. Technol. 1995, 117, 329–336. [Google Scholar] [CrossRef] [Scilit]
- Serbin, S.; Burunsuz, K.; Chen, D.; Kowalski, J. Investigation of the characteristics of a low-emission gas turbine combustion chamber operating on a mixture of natural gas and hydrogen. Pol. Marit. Res. 2022, 29, 64–76. [Google Scholar] [CrossRef] [Scilit]
- Pierce, C.D.; Moin, P. Progress-variable approach for large-eddy simulation of non-premixed turbulent combustion. J. Fluid Mech. 2004, 504, 73–97. [Google Scholar] [CrossRef] [Scilit]
- Bouras, F.; Attia, M.E.H.; Khaldi, F.; Si-Ameur, M. Control of methane flame properties by hydrogen fuel addition: Application to power plant combustion chamber. Int. J. Hydrogen Energy 2017, 42, 8932–8939. [Google Scholar] [CrossRef] [Scilit]
- Ansys, I. ANSYS FLUENT User’s Guide; ANSYS: Canonsburg, PA, USA, 2011; p. 15317. Available online: https://ansyshelp.ansys.com/public/account/secured?returnurl=/Views/Secured/corp/v242/en/flu_th/flu_th.html (accessed on 1 September 2026).
- Gordon, S.; McBride, B.J. Computer program for calculation of complex chemical equilibrium. NASA Ref. Publ. 1994, 1311, 19–20. Available online: https://ntrs.nasa.gov/api/citations/19780009781/downloads/19780009781.pdf (accessed on 1 September 2026).
- McBride, B.J. Coefficients for Calculating Thermodynamic and Transport Properties of Individual Species; NASA Langley Research Center: Hampton, VA, USA, 1993; Volume 4513. [Google Scholar]
- Smith, G.P.; Frenklach, M.; Moriarty, N.W.; Eiteneer, B.; Goldenberg, M.; Bowman, C.T.; Hanson, R.K.; Song, S.; Gardiner, W.C., Jr.; Lissianski, V.V.; et al. GRI-Mech 3.0. 1999. Available online: http://www.me.berkeley.edu/gri_mech (accessed on 1 September 2026).
- Hanson, R.K.; Salimian, S. Survey of rate constants in the N/H/O system. In Combustion Chemistry; Springer: Berlin/Heidelberg, Germany, 2018; pp. 361–421. [Google Scholar] [CrossRef] [Scilit]
- Tang, T.; Sun, M.; Yan, B.; Wang, H.; Zhu, J. Flow structures and combustion regimes in an axisymmetric scramjet combustor with high Reynolds number. J. Fluid Mech. 2024, 1000, A3. [Google Scholar] [CrossRef] [Scilit]
- Tang, T.; Wang, Z.; Yu, J.; Yang, Y.; Xiong, D. Investigation of multi-scale flow structures and combustion characteristics in a cavity-enhanced circular scramjet. Combust. Flame 2024, 264, 113431. [Google Scholar] [CrossRef] [Scilit]
- Gordon, S.; McBride, B.J. Computer Program for Calculation of Complex Chemical Equilibrium Compositions and Applications. Part 1: Analysis. 1994. Available online: https://ntrs.nasa.gov/citations/19950013764 (accessed on 1 September 2026).
- Fenimore, C.P. Formation of nitric oxide in premixed hydrocarbon flames. In Symposium (International) on Combustion; Elsevier: Amsterdam, The Netherlands, 1971; pp. 373–380. [Google Scholar] [CrossRef] [Scilit]
- De Soete, G.G. Overall reaction rates of NO and N2 formation from fuel nitrogen. In Symposium (International) on Combustion; Elsevier: Amsterdam, The Netherlands, 1975; pp. 1093–1102. [Google Scholar] [CrossRef] [Scilit]
- Miller, J.A.; Bowman, C.T. Mechanism and modeling of nitrogen chemistry in combustion. Prog. Energy Combust. Sci. 1989, 15, 287–338. [Google Scholar] [CrossRef] [Scilit]
- Shih, T.-H.; Liou, W.W.; Shabbir, A.; Yang, Z.; Zhu, J. A new k-ϵ eddy viscosity model for high reynolds number turbulent flows. Comput. Fluids 1995, 24, 227–238. [Google Scholar] [CrossRef] [Scilit]
- Patankar, S. Numerical Heat Transfer and Fluid Flow; Taylor & Francis: Abingdon, UK, 2018. [Google Scholar] [CrossRef] [Scilit]
- Modest, M.F.; Mazumder, S. Radiative Heat Transfer; Academic press: Cambridge, MA, USA, 2013. [Google Scholar] [CrossRef] [Scilit]
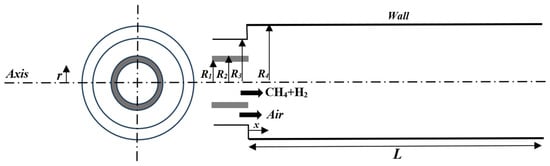
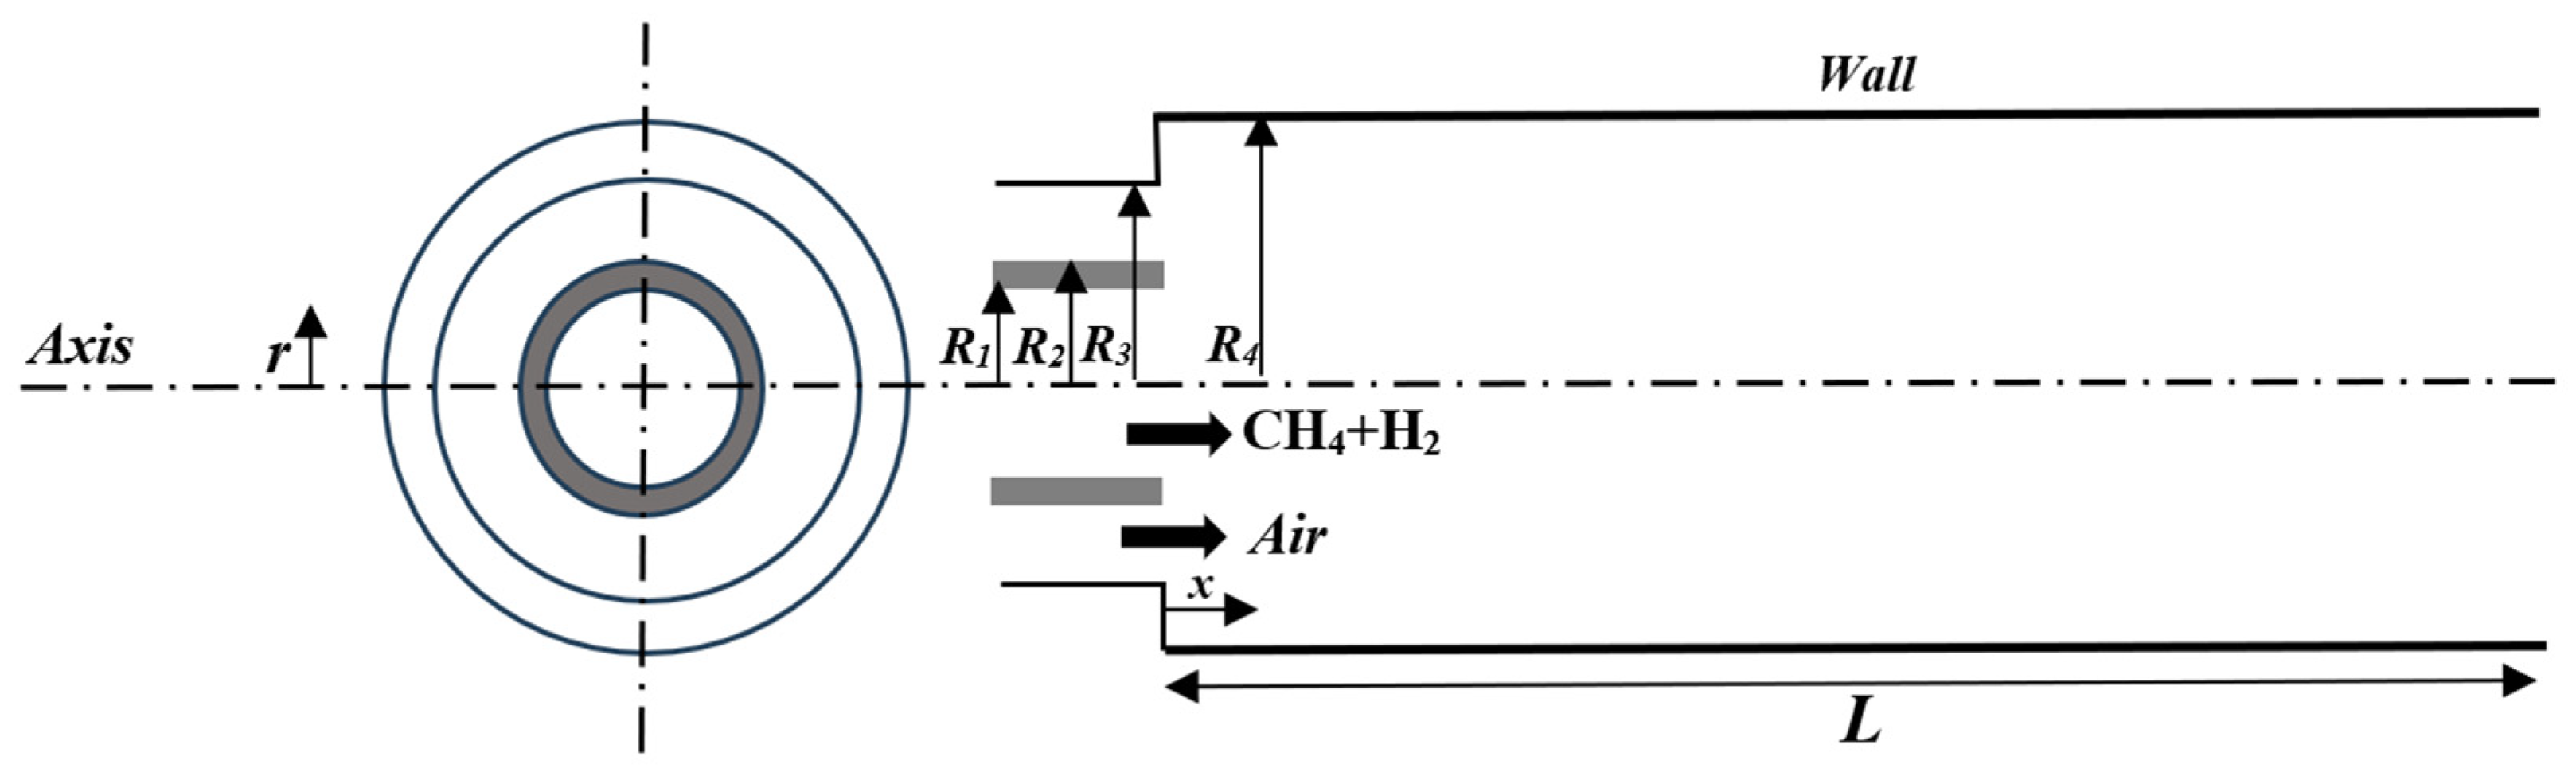
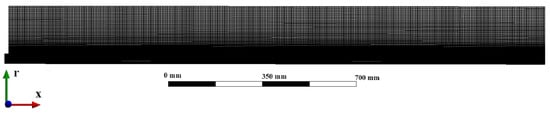
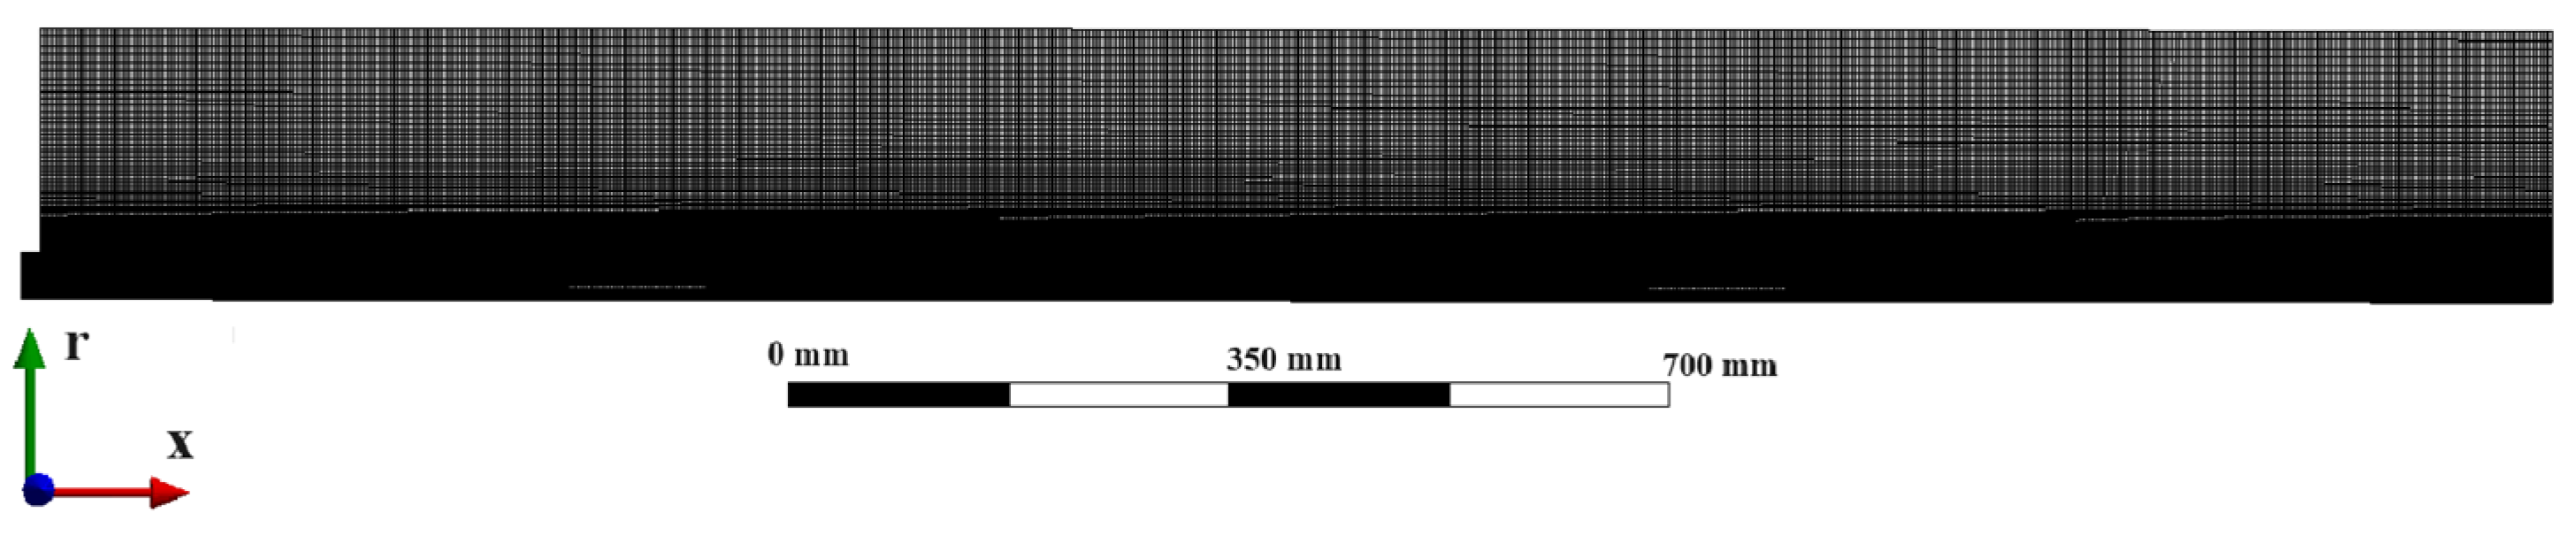
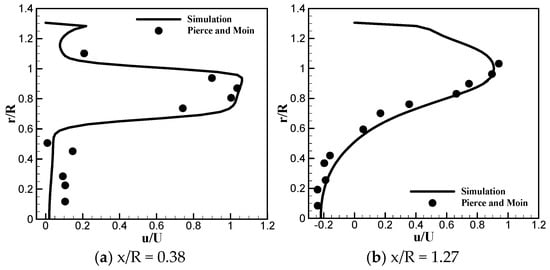
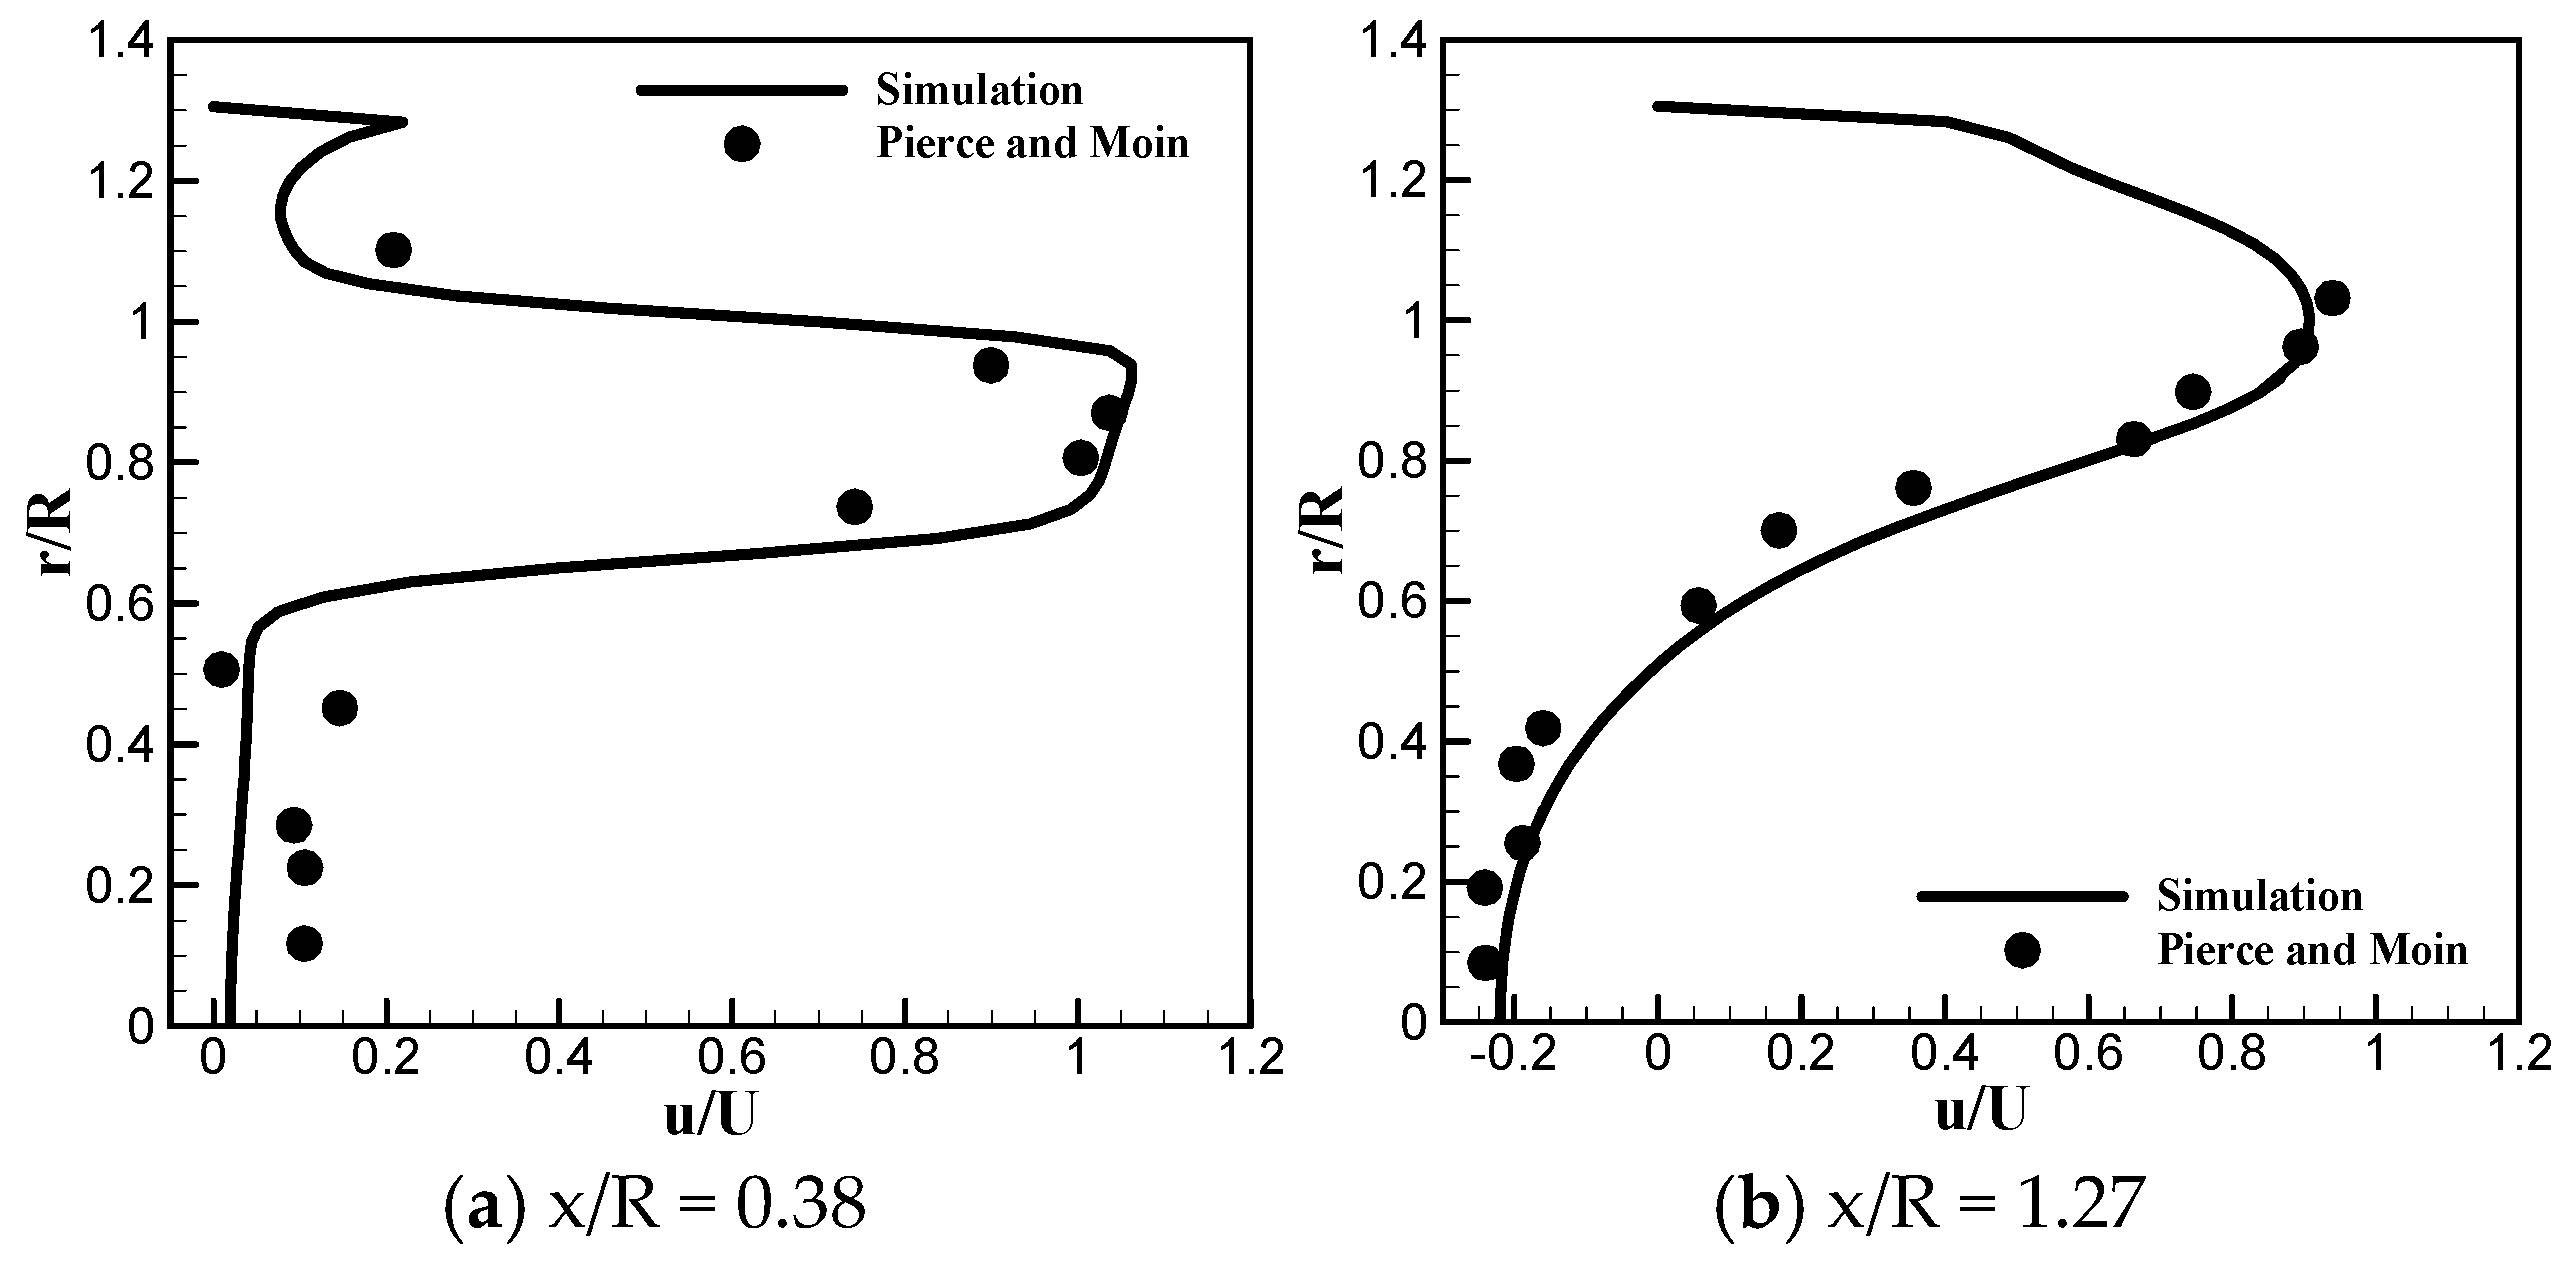
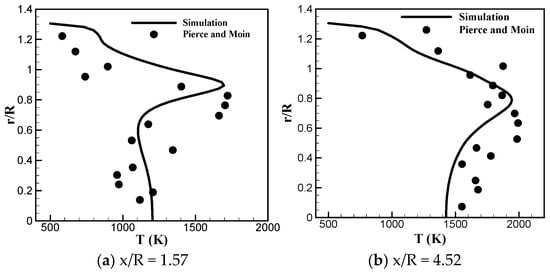
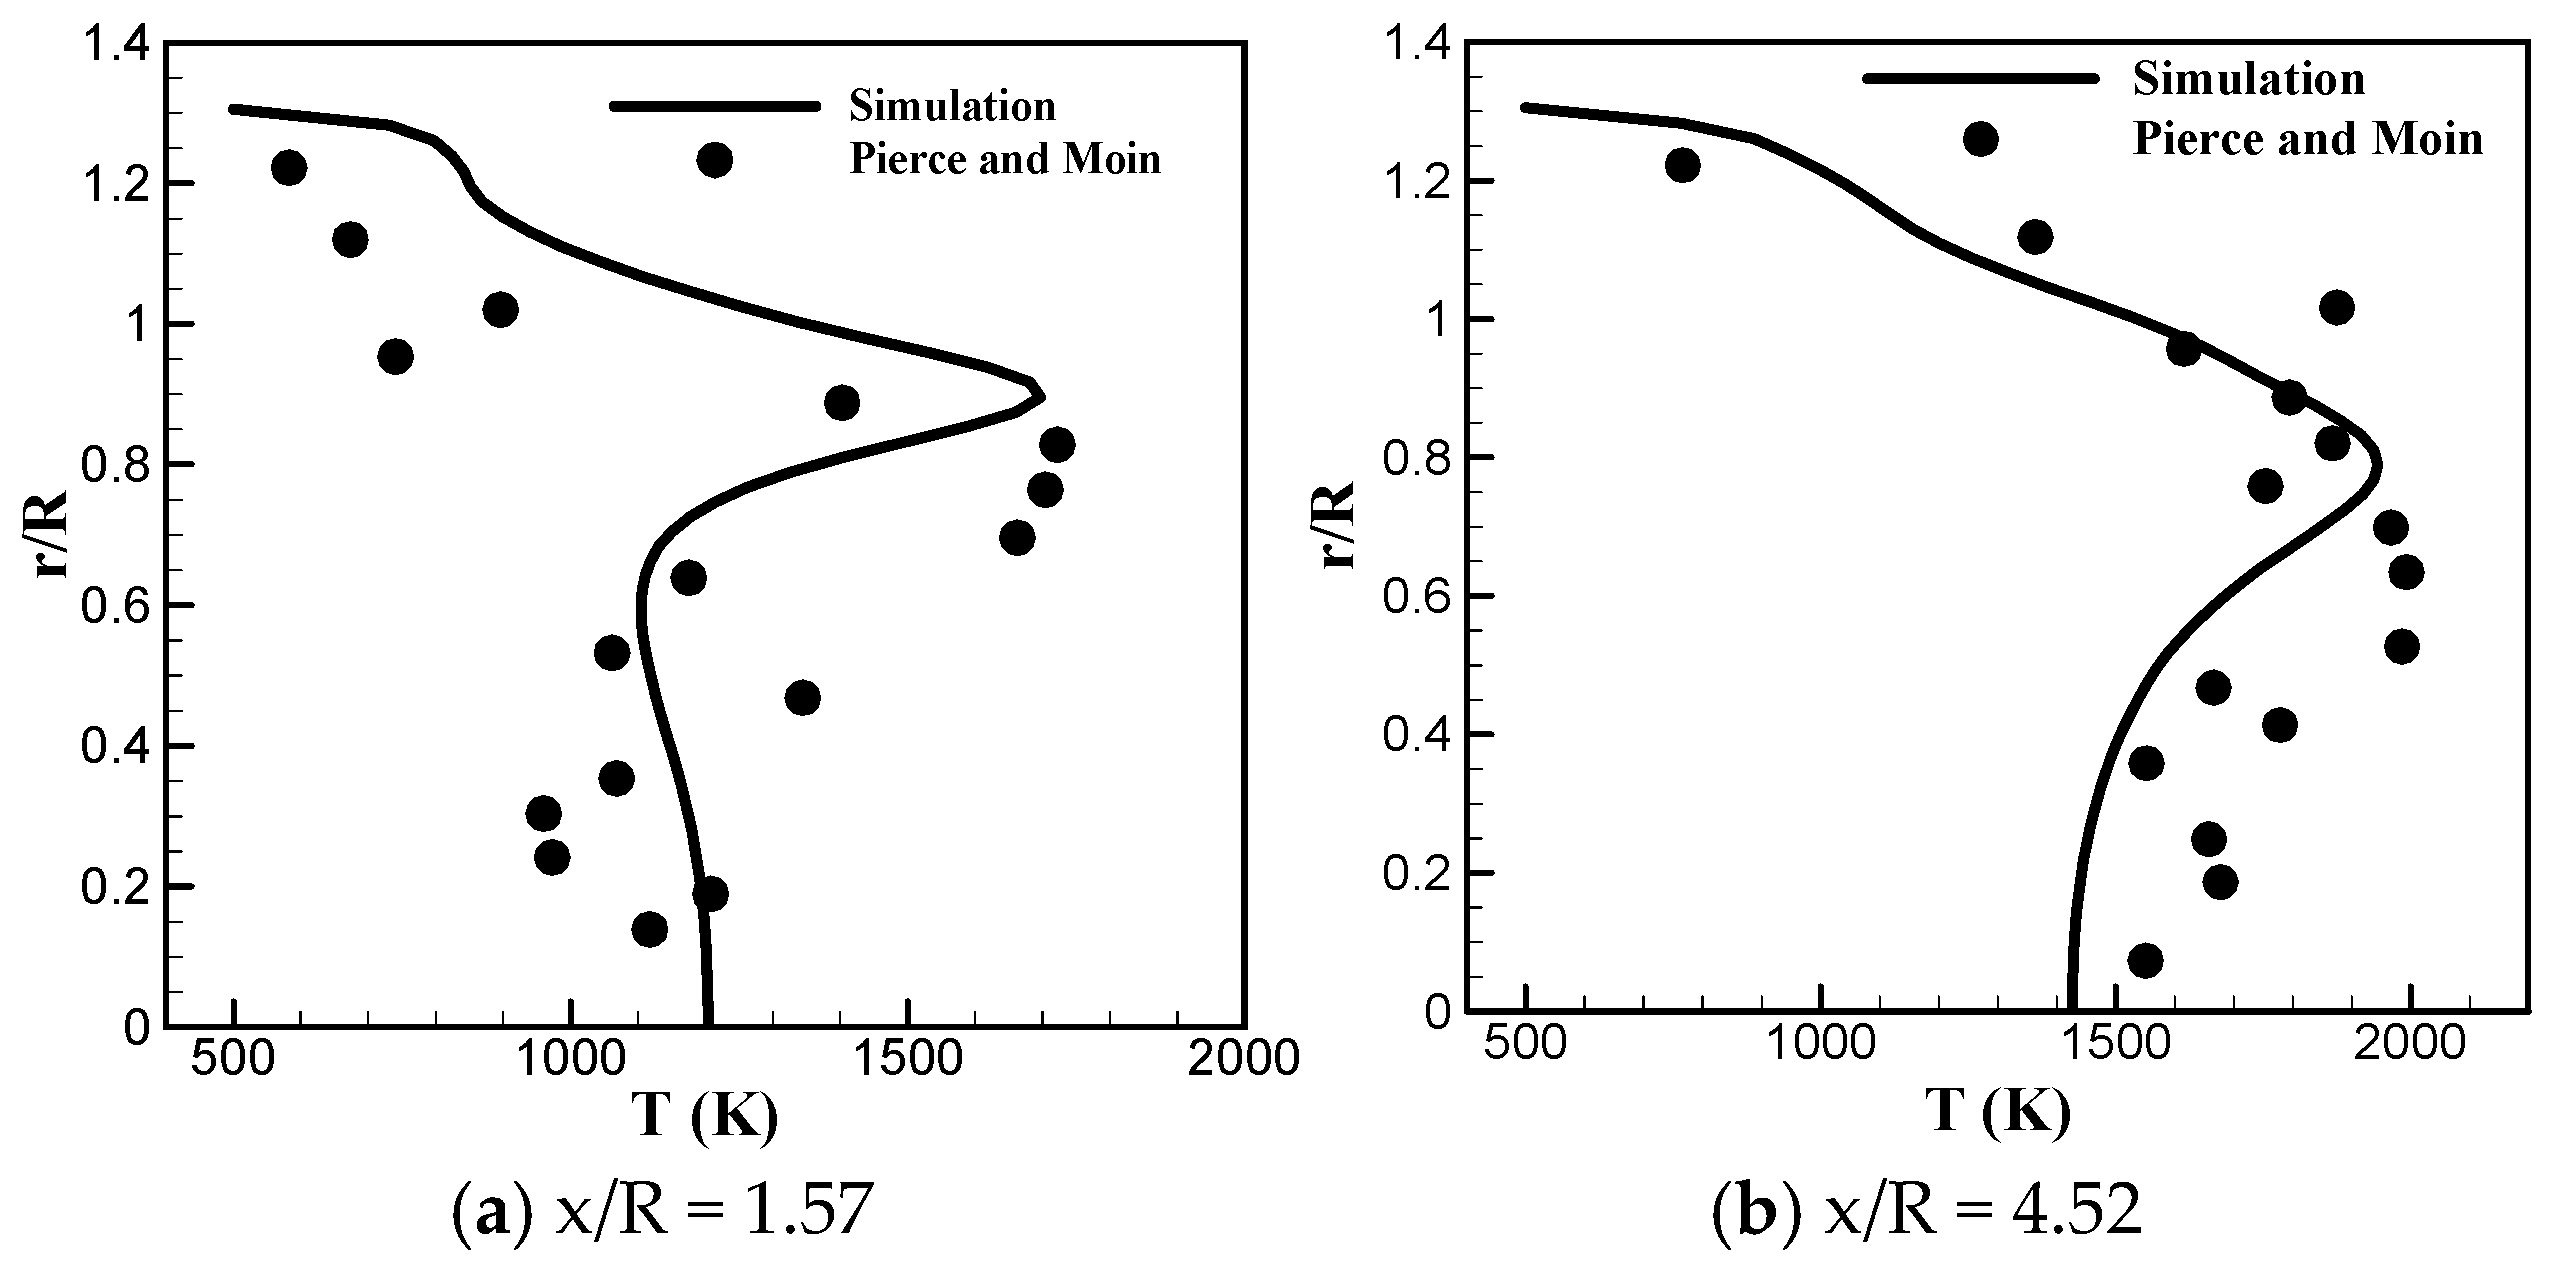
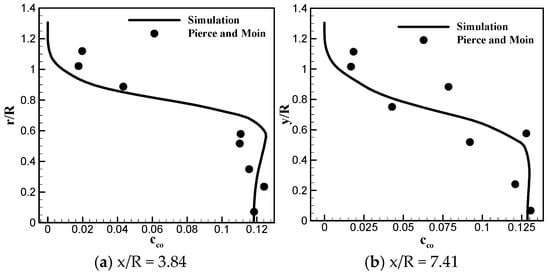
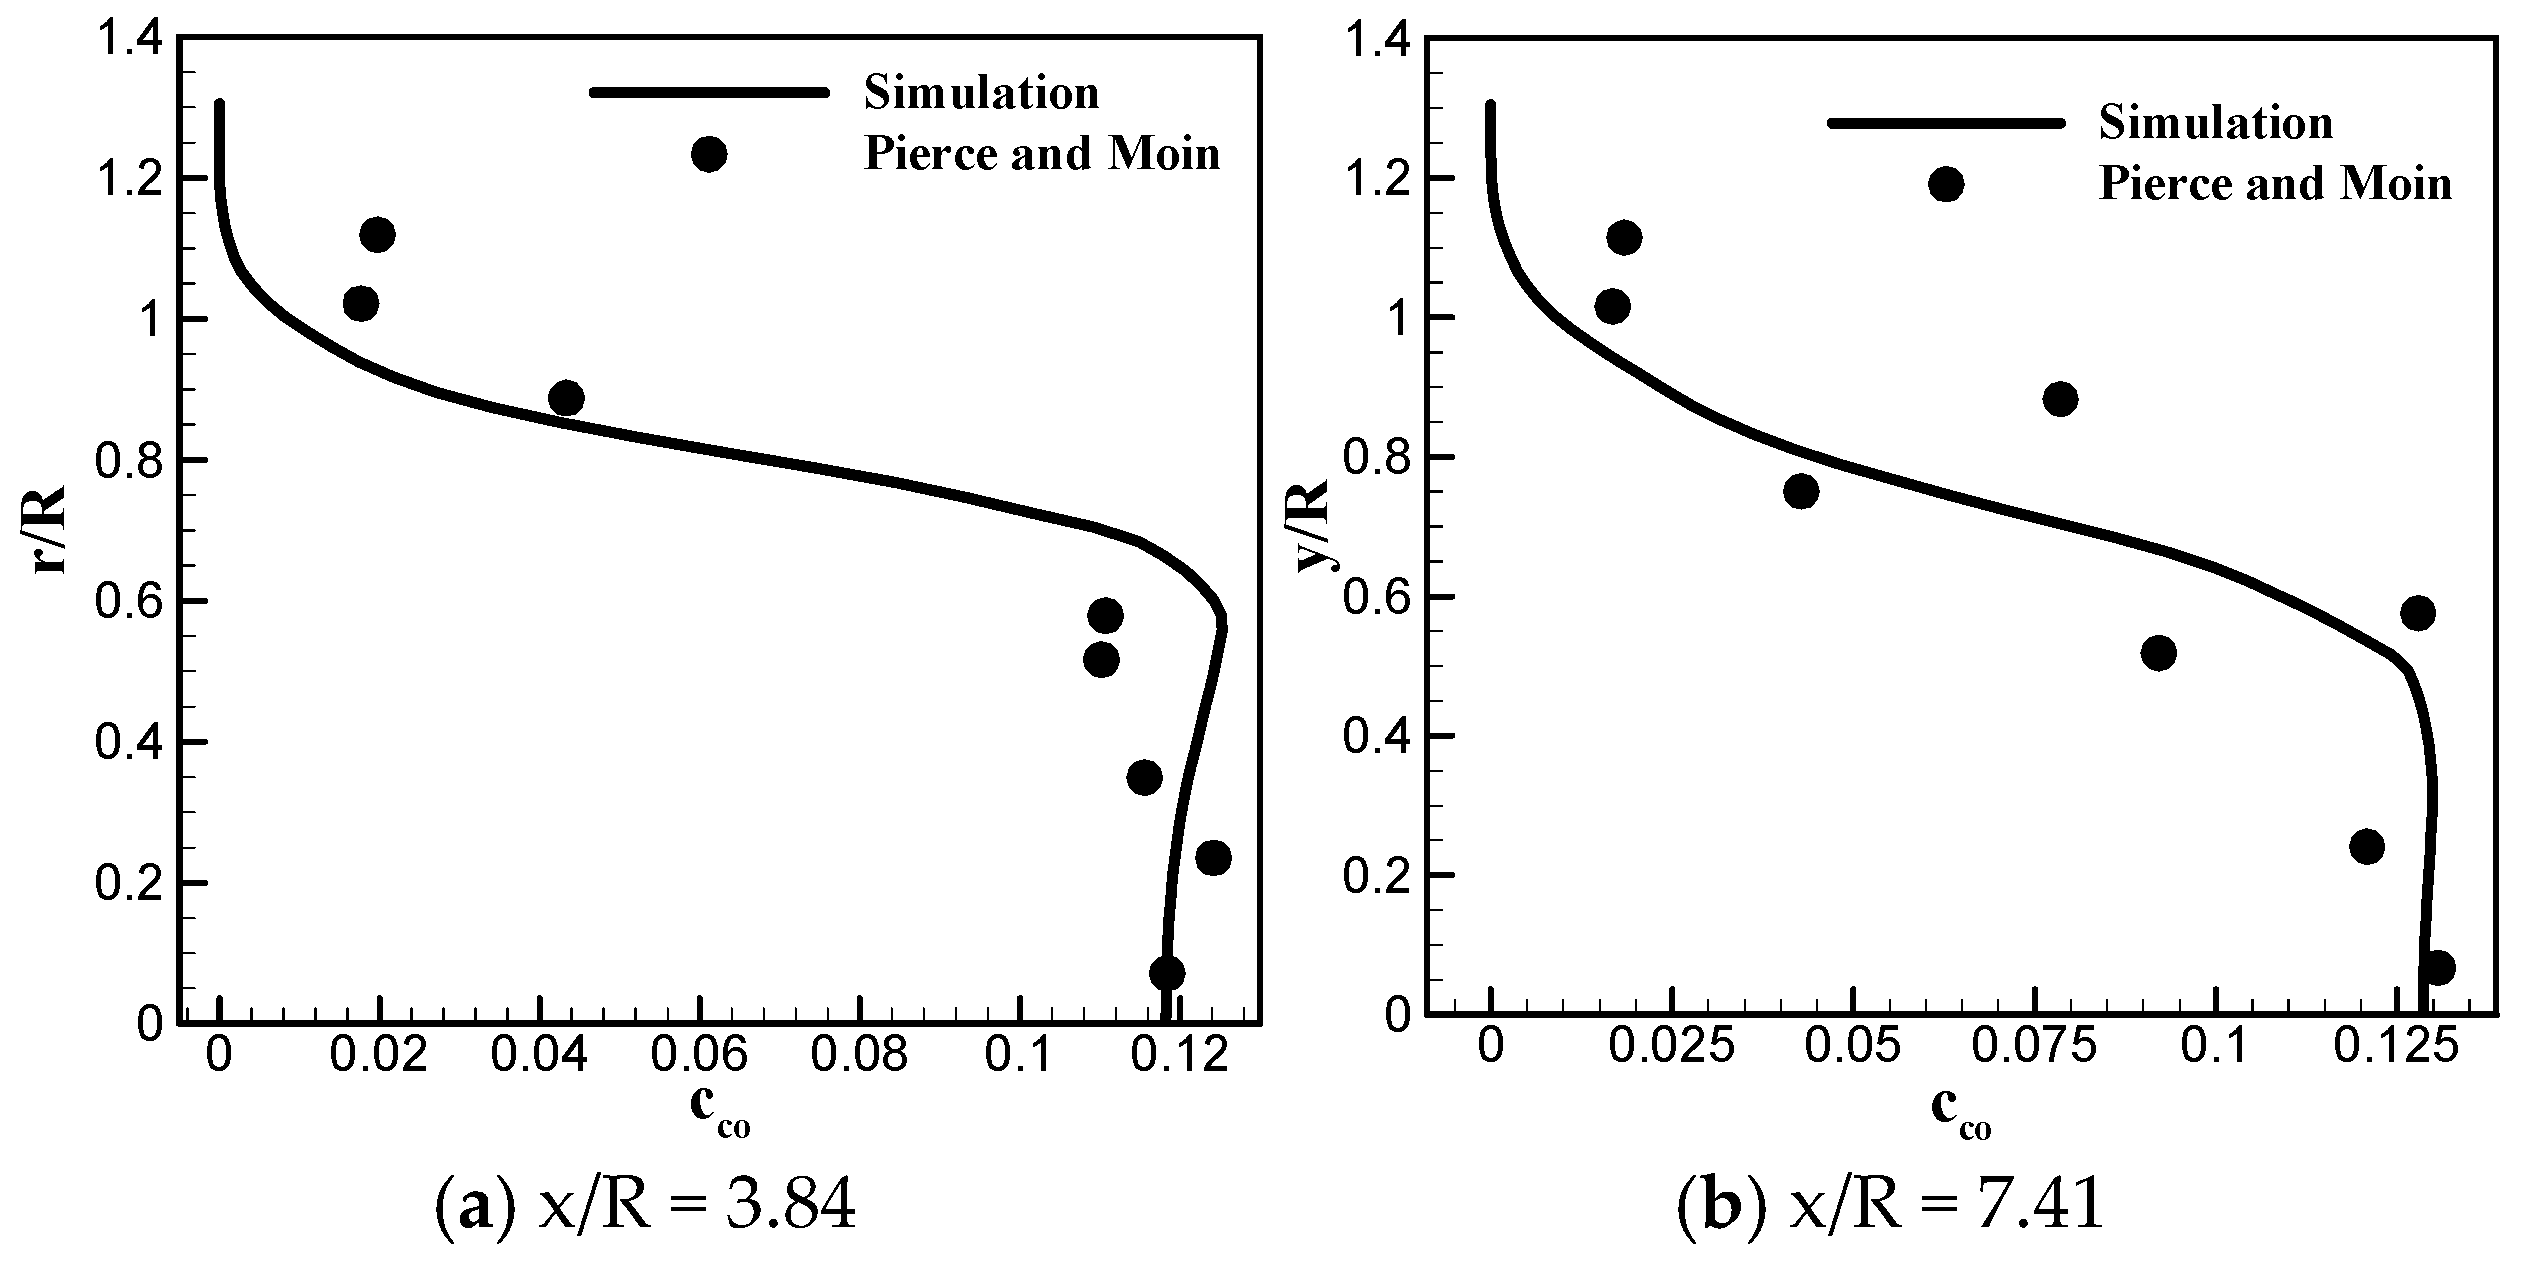
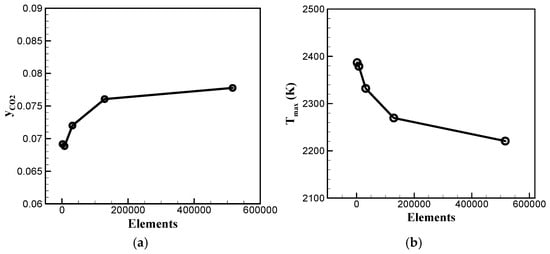
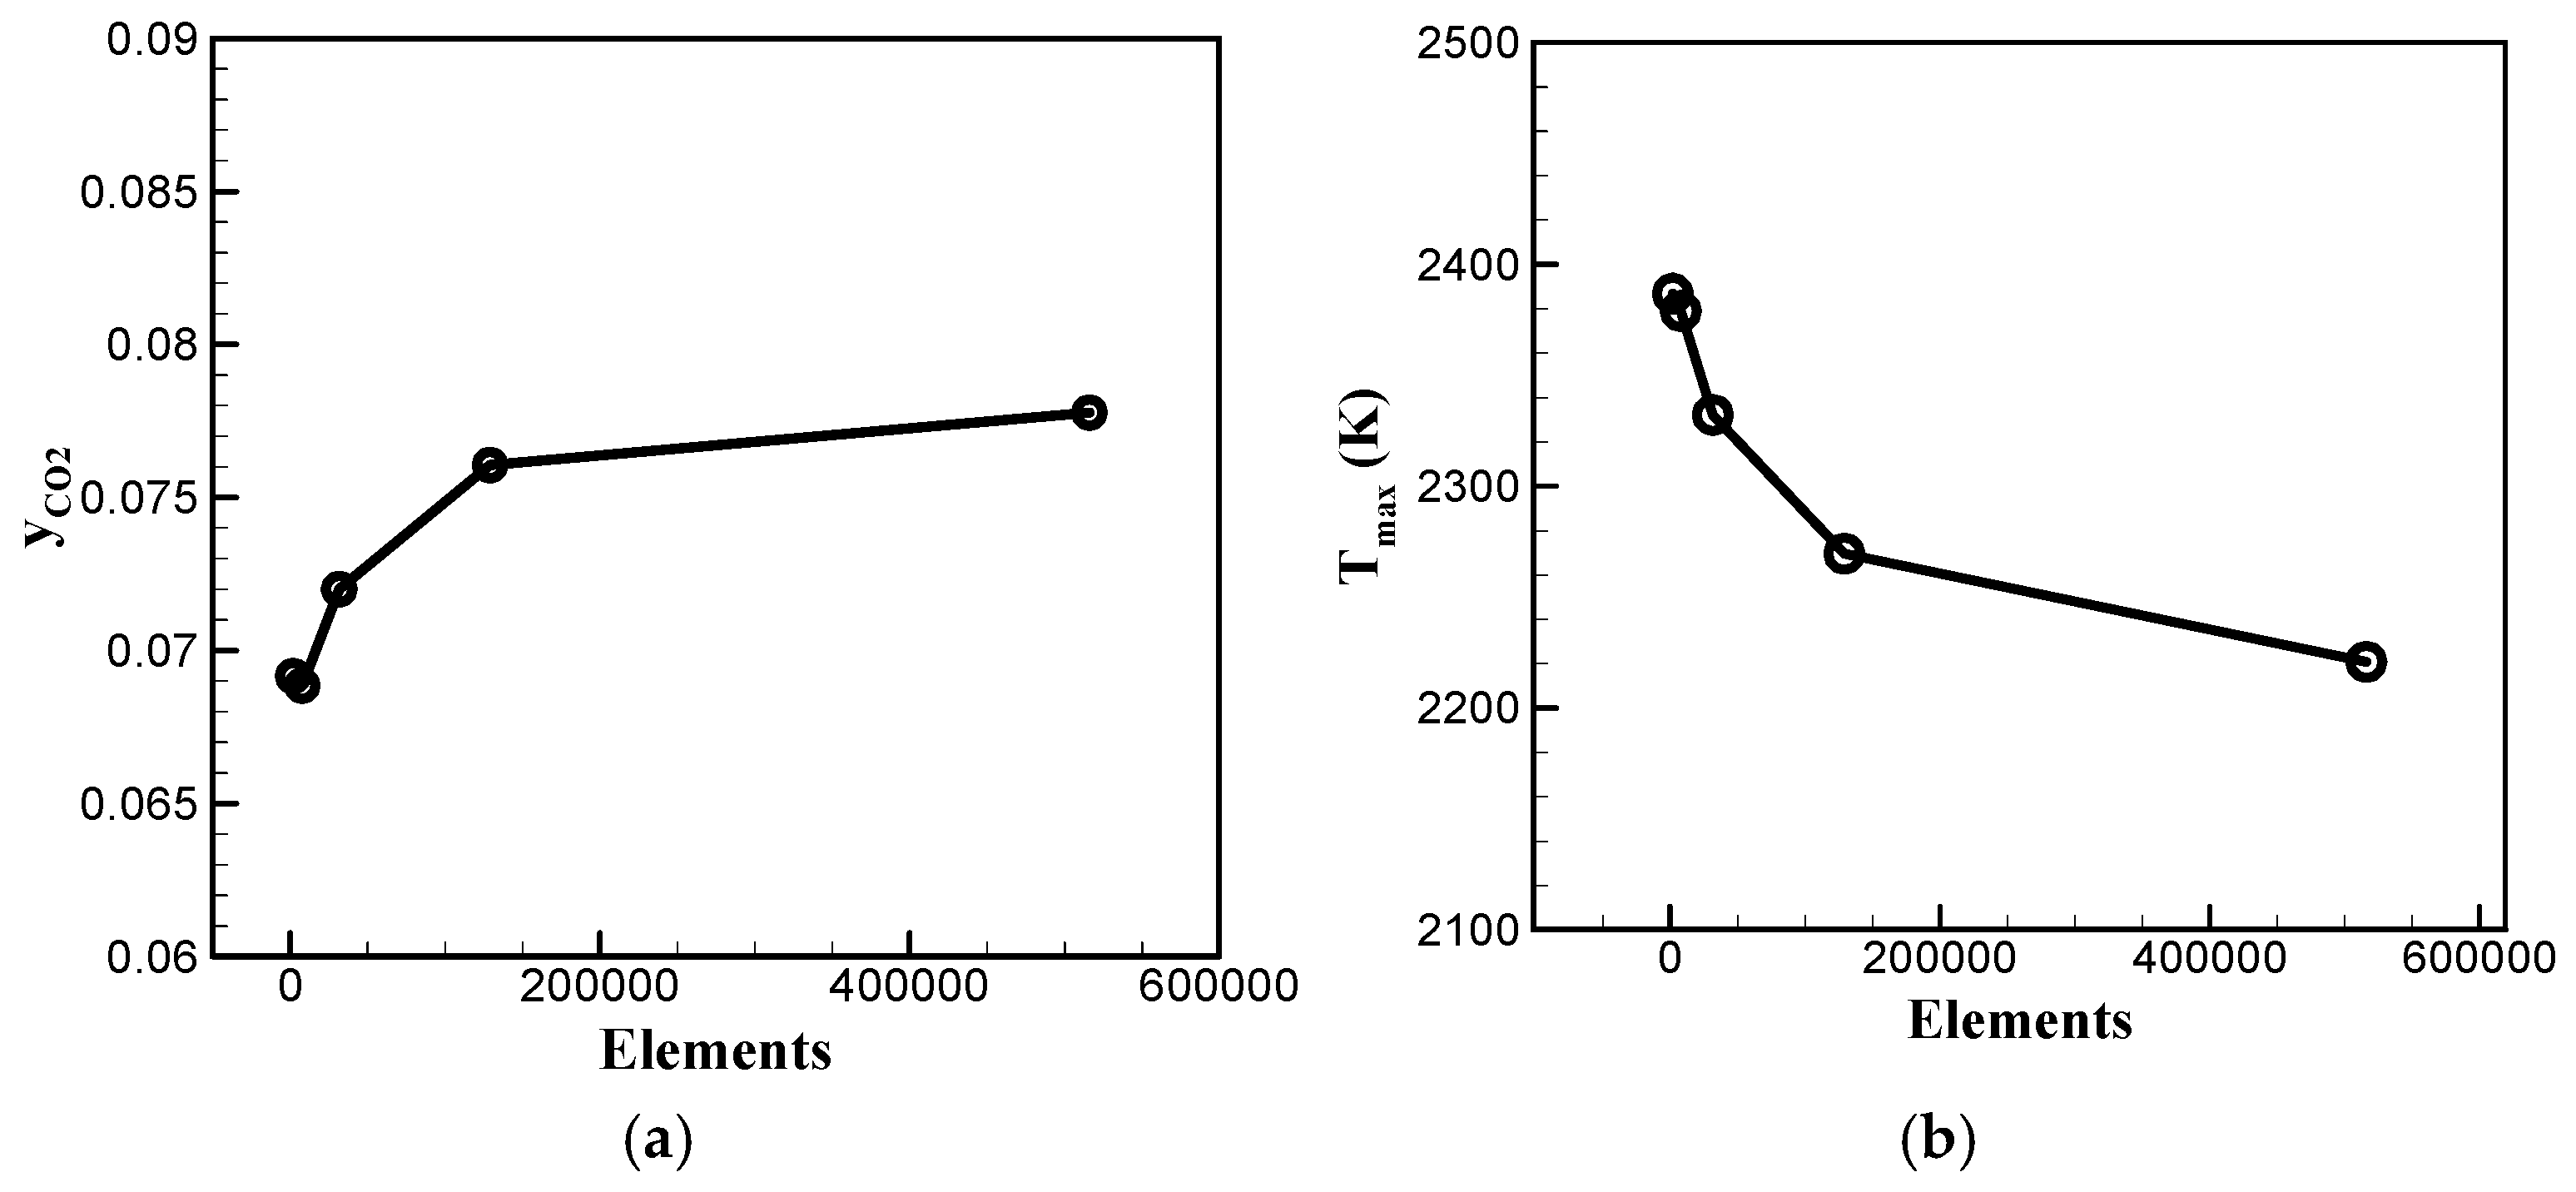
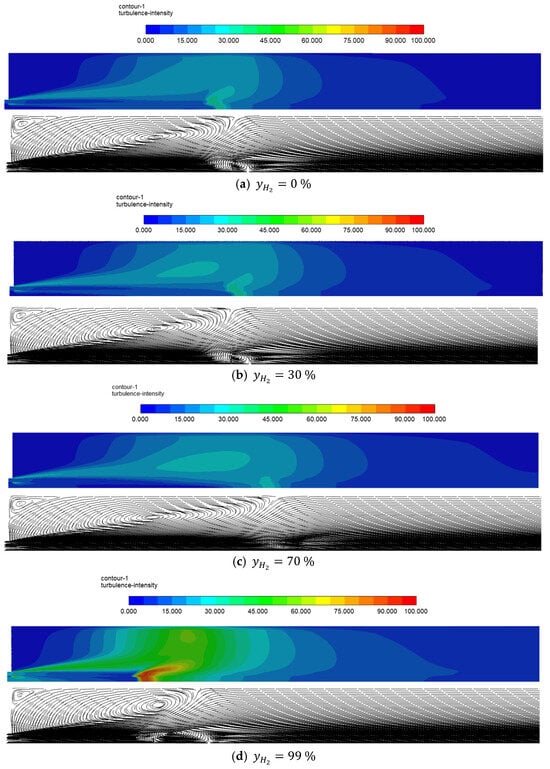
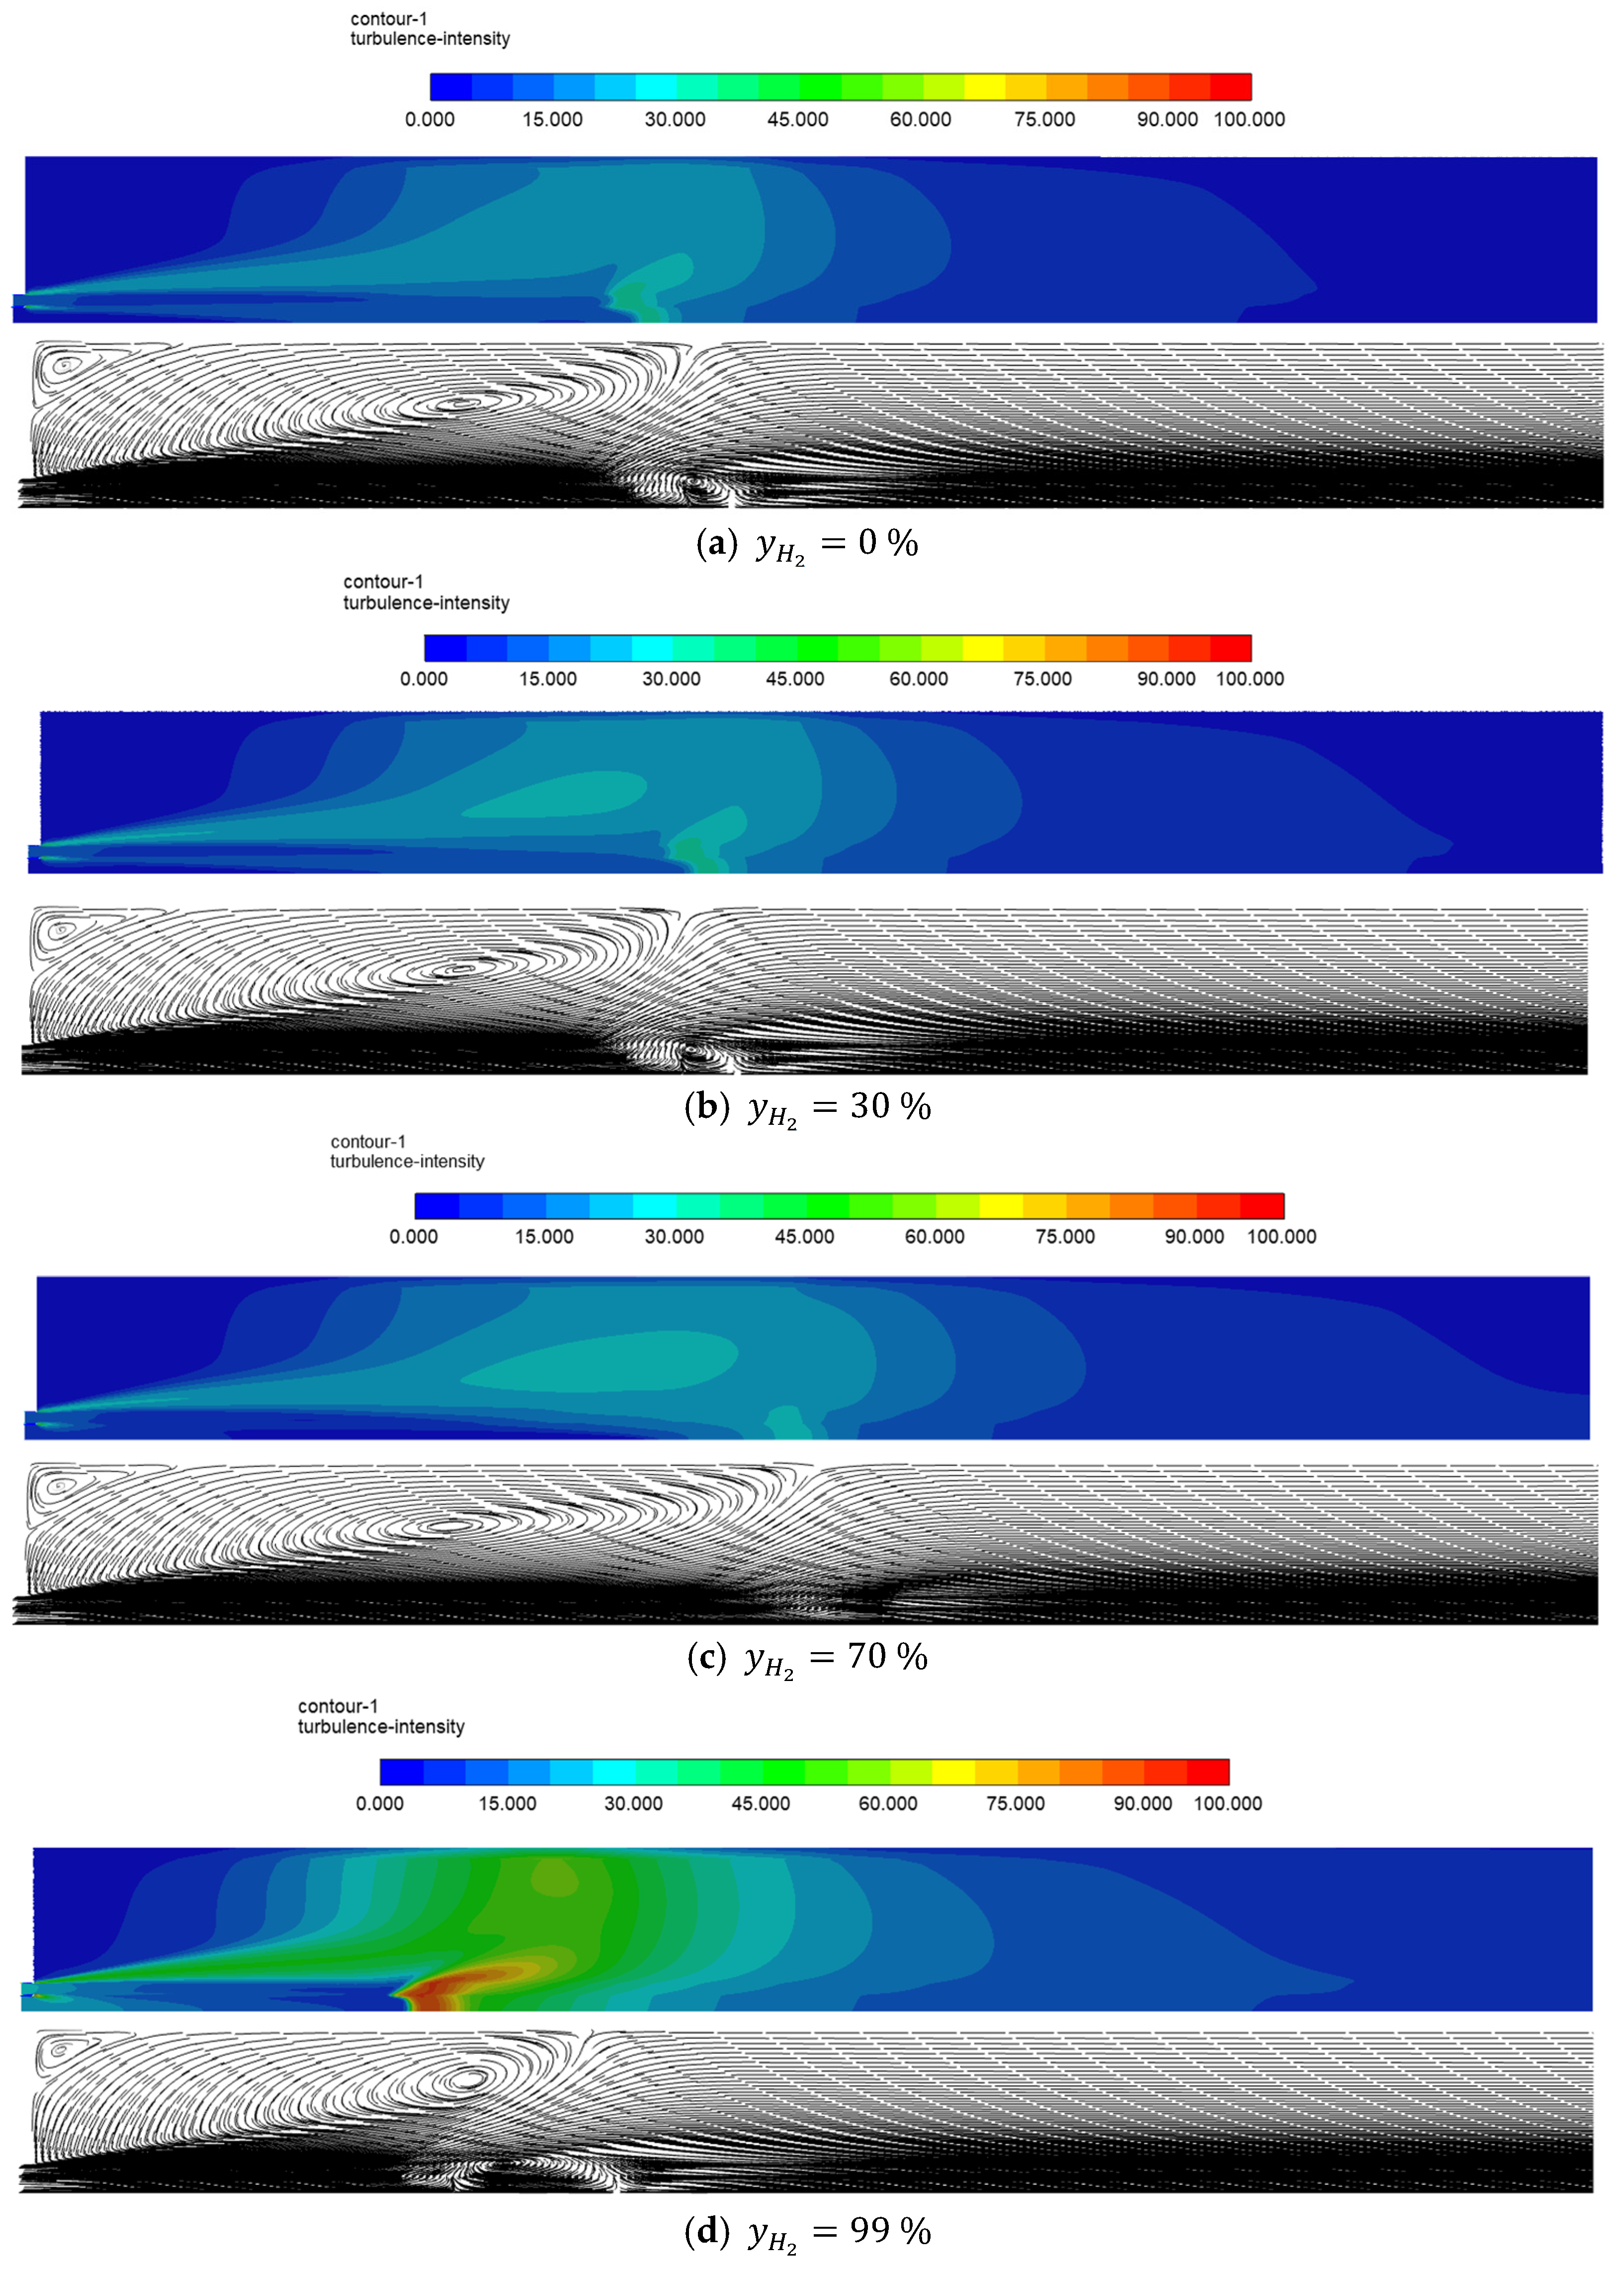
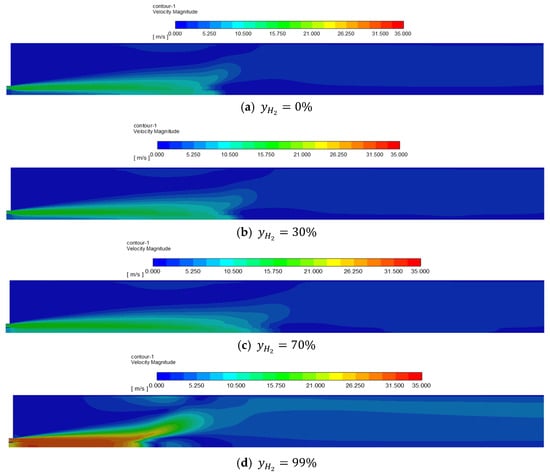
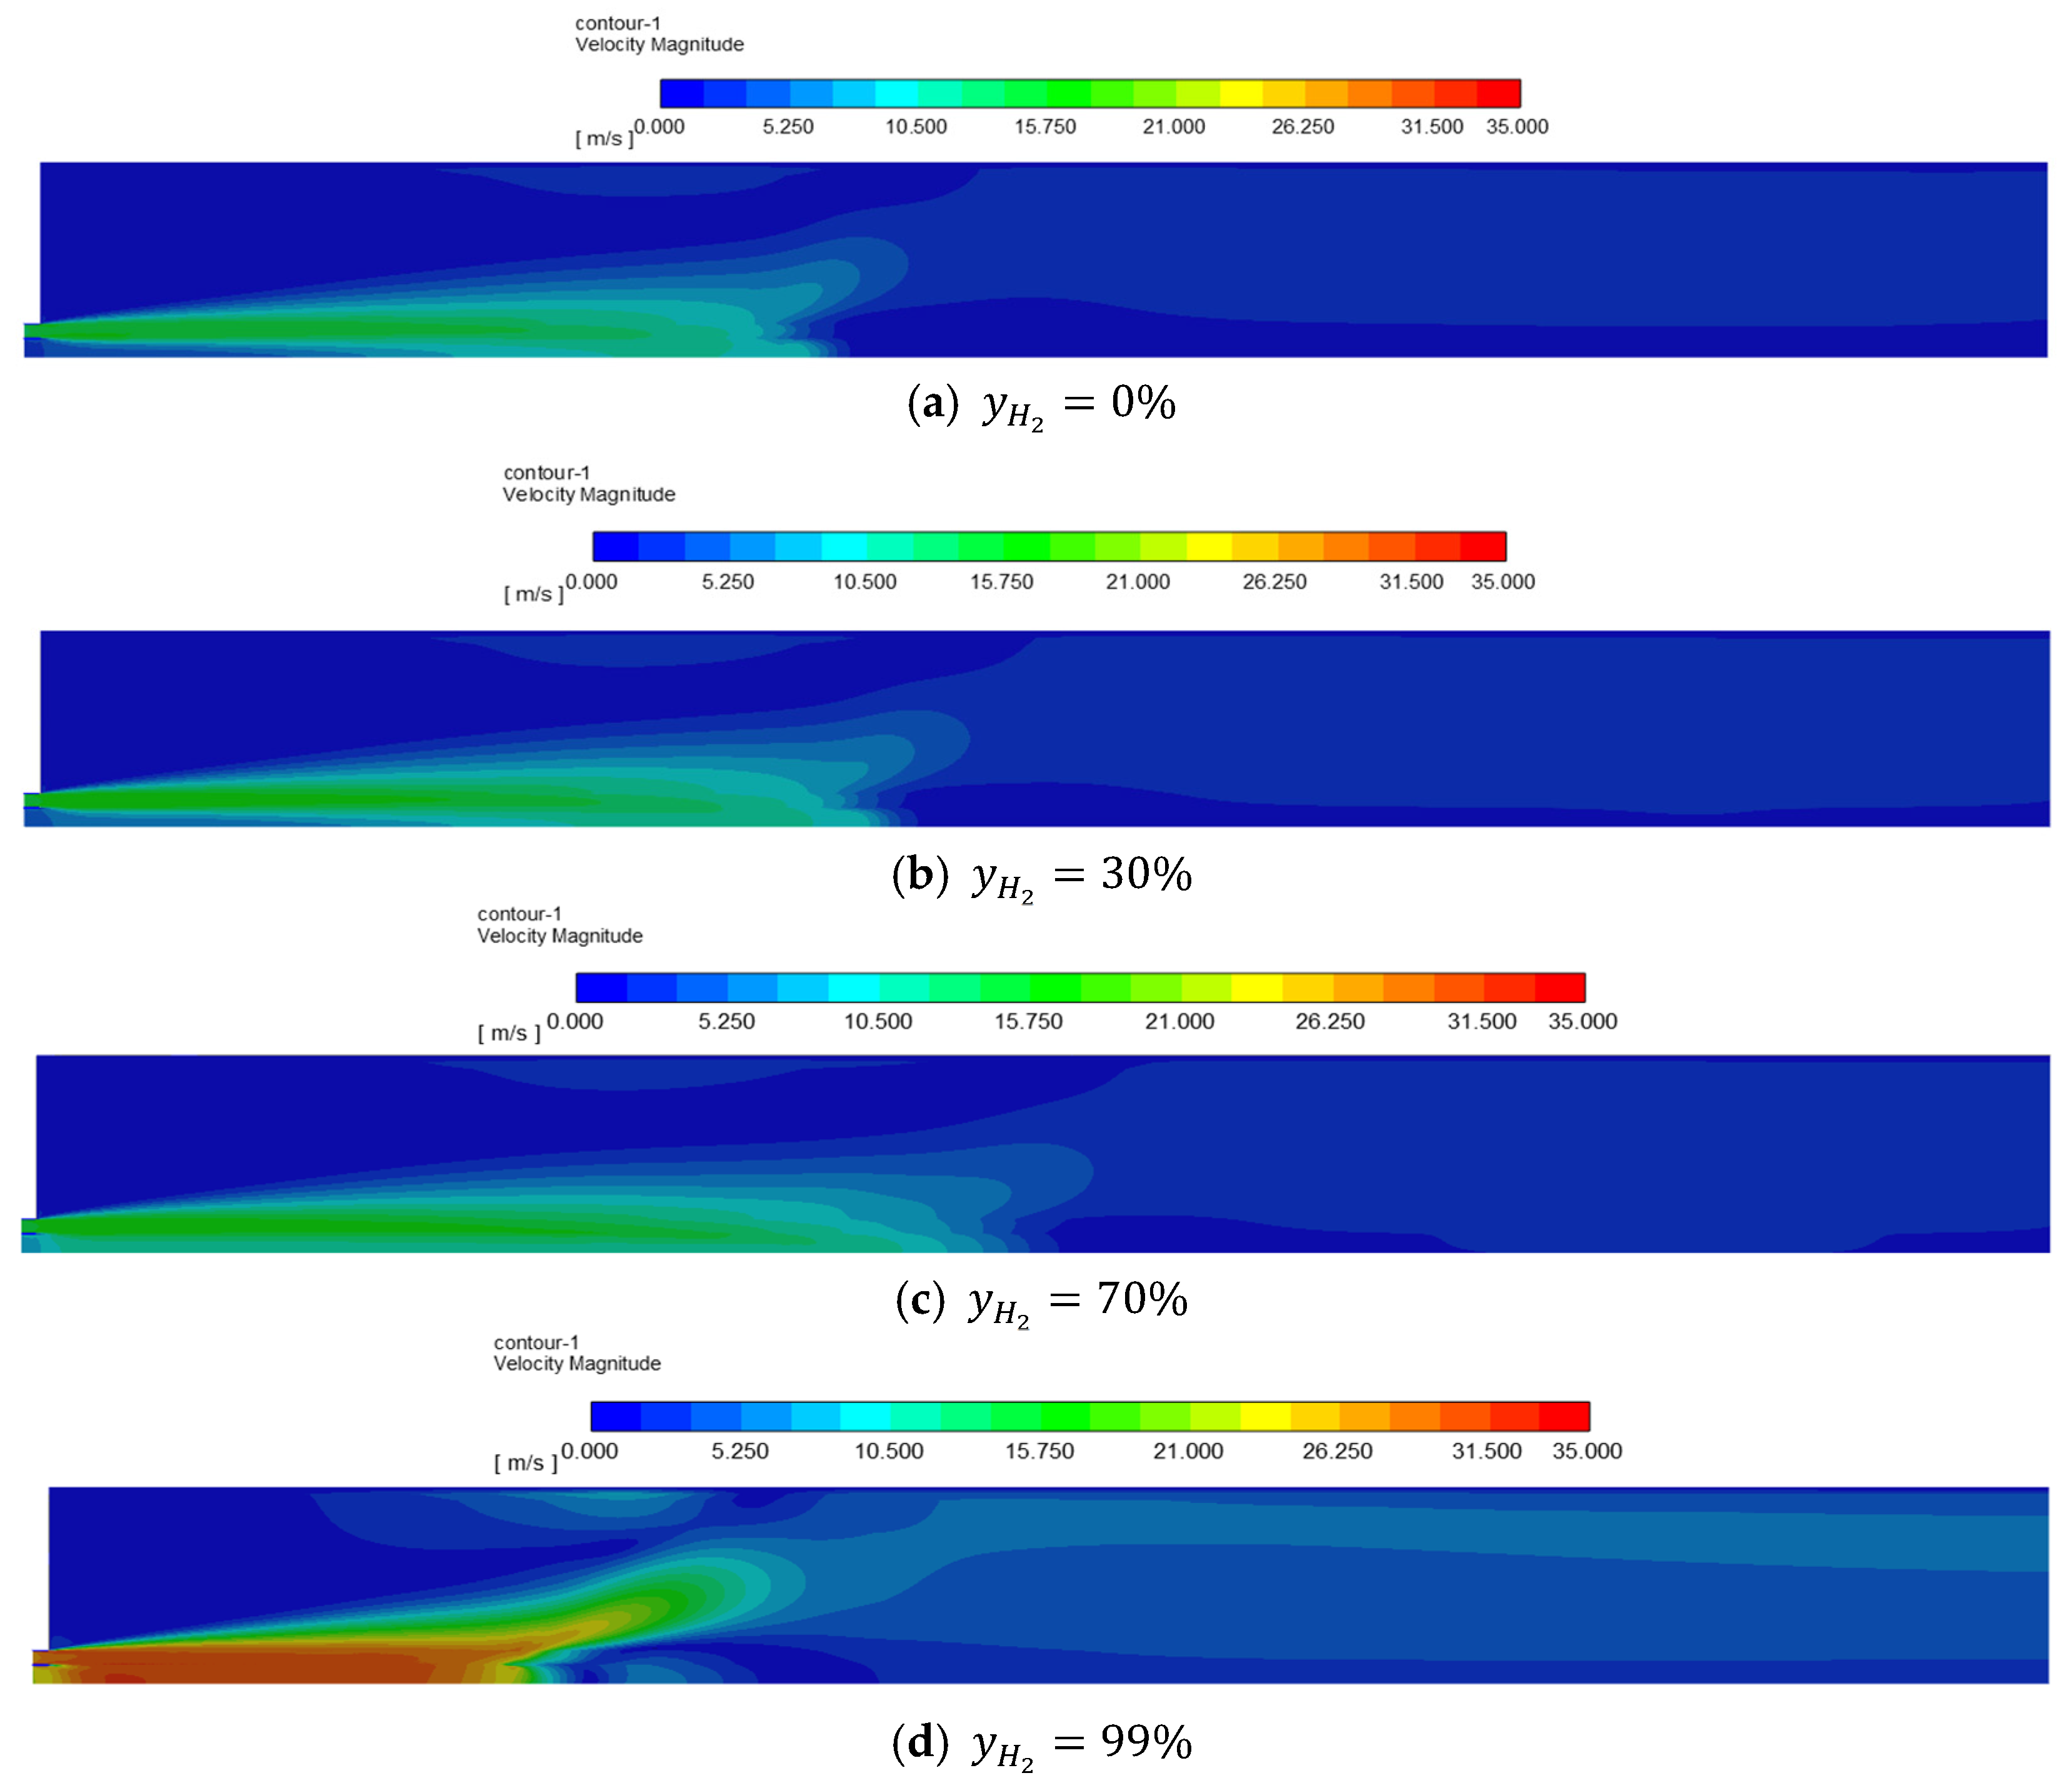
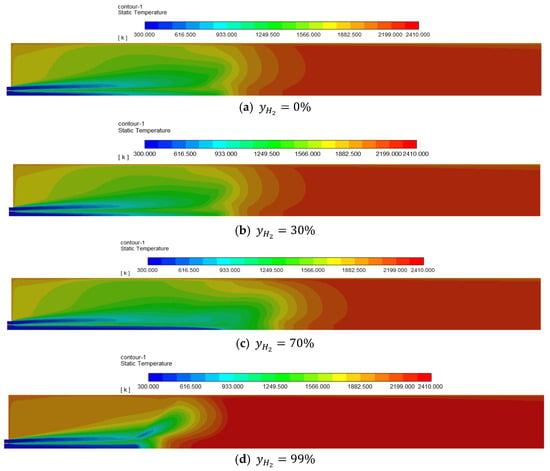
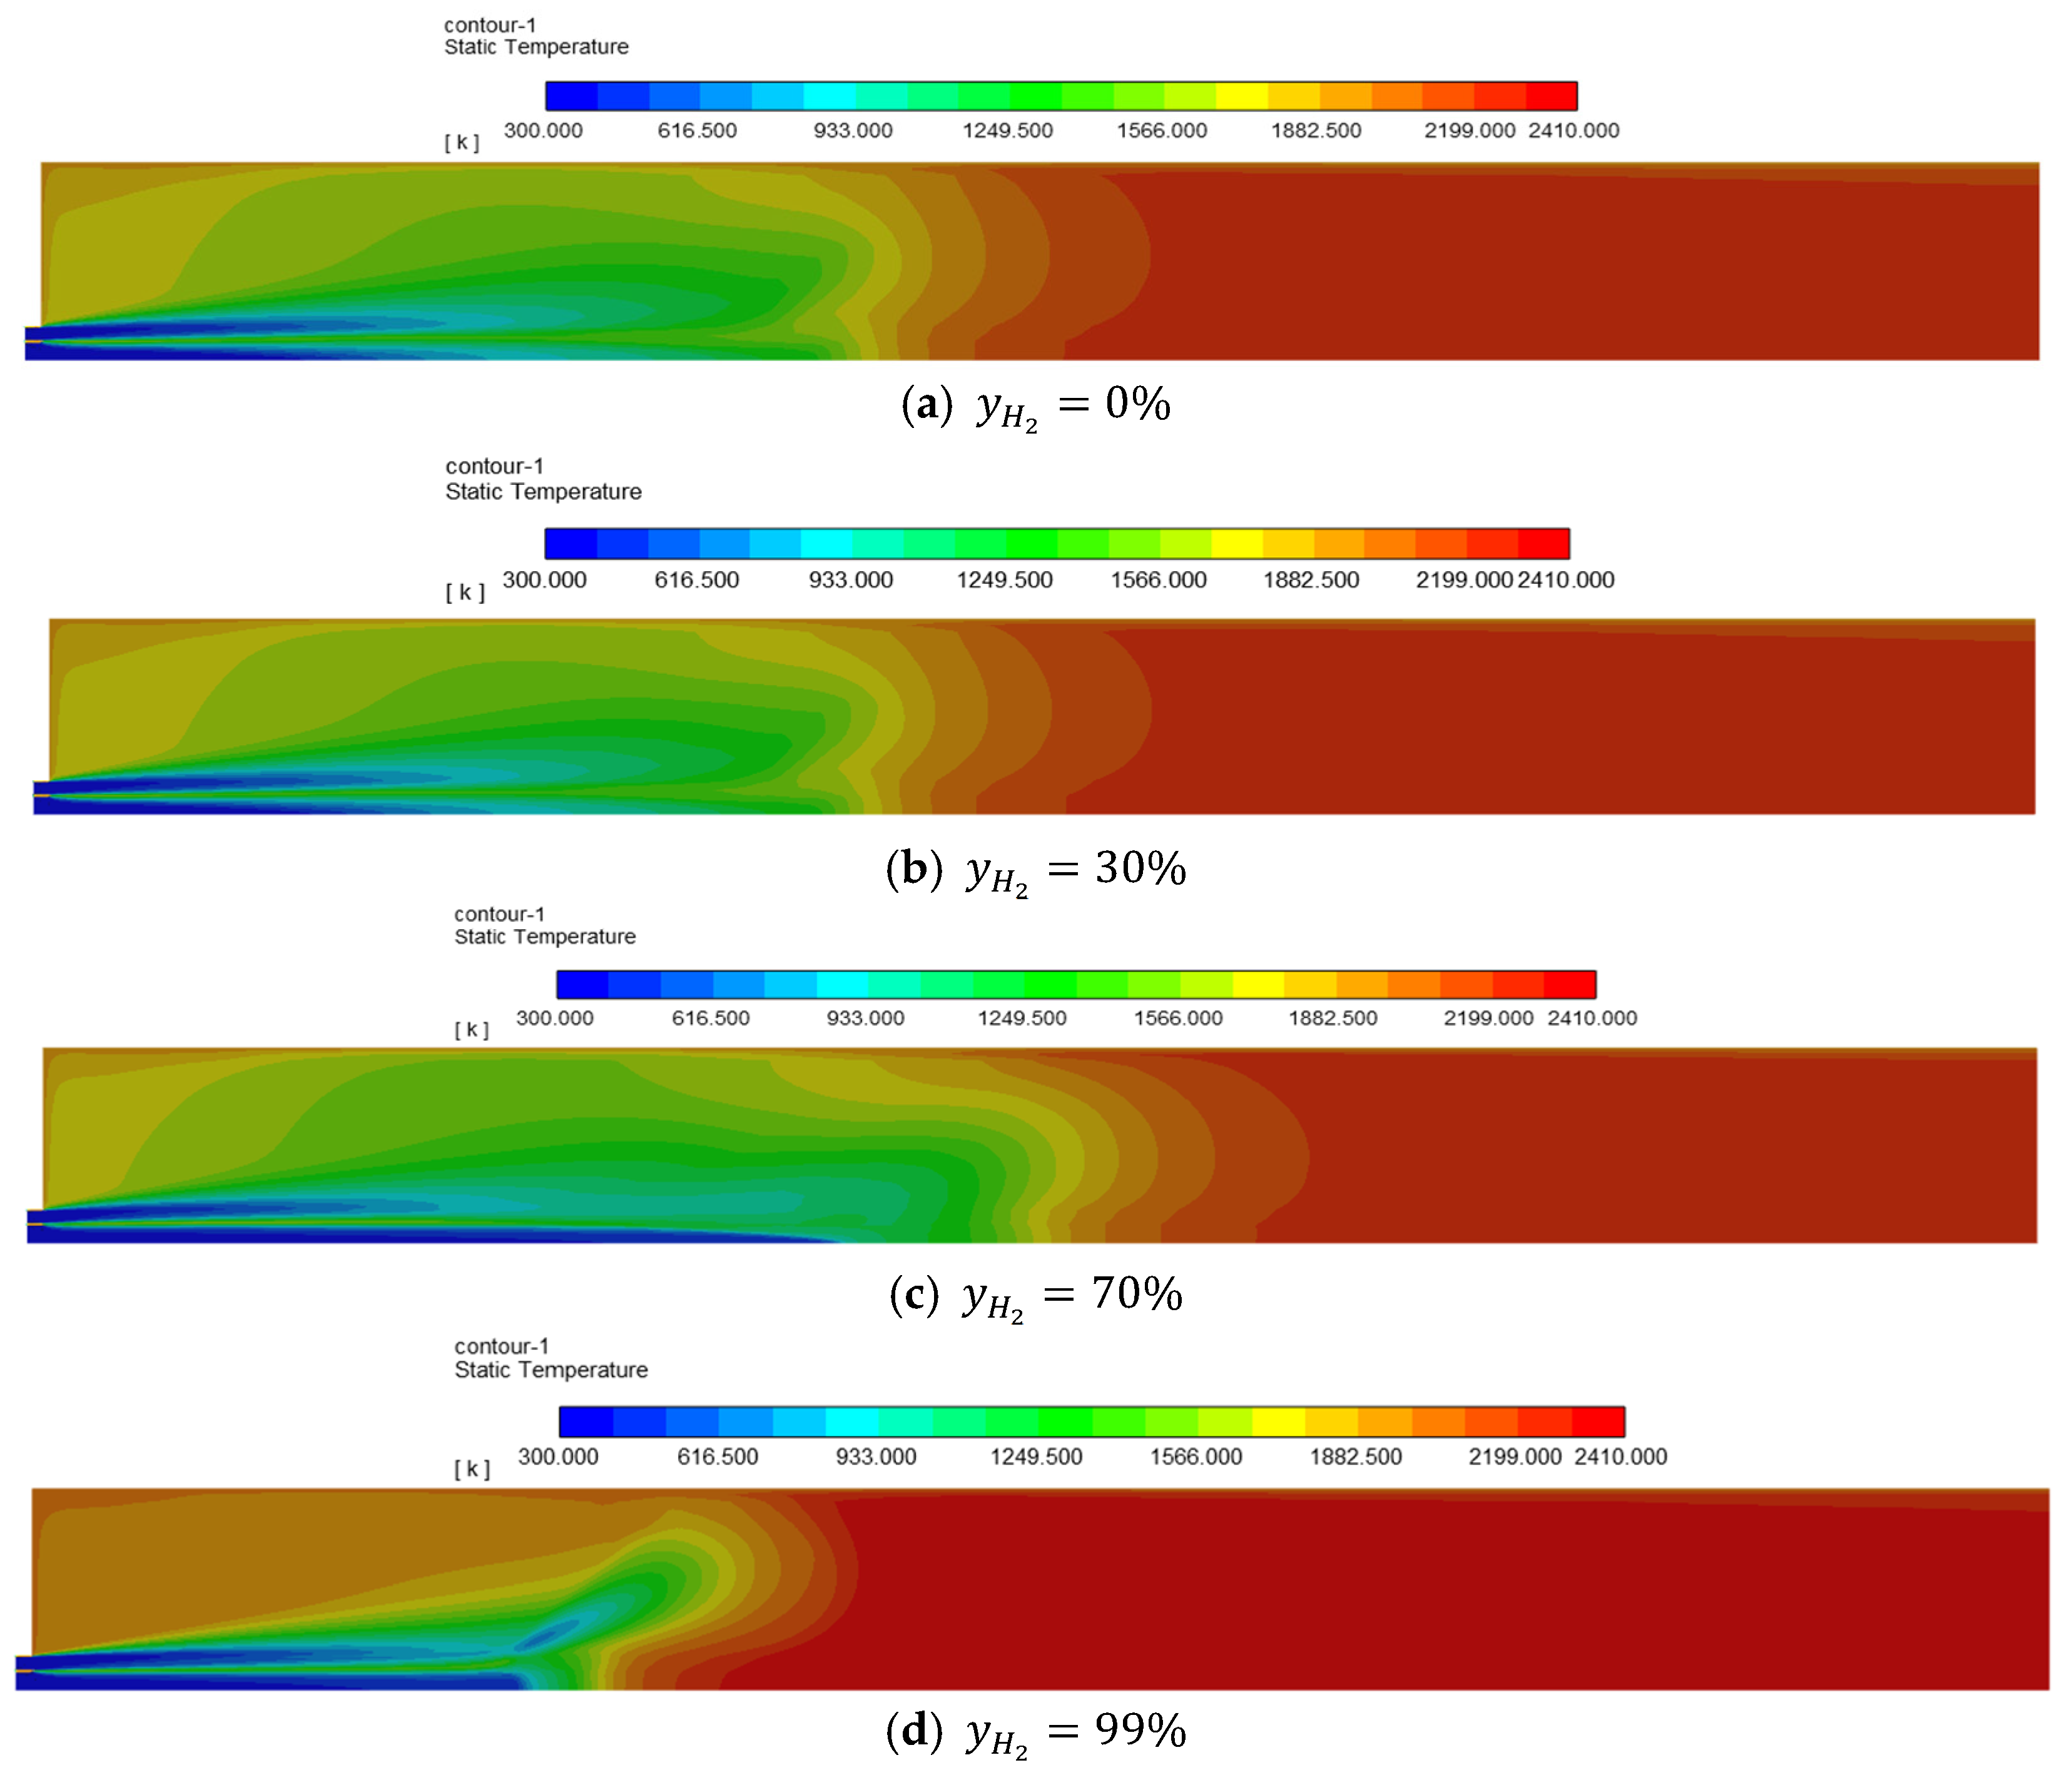
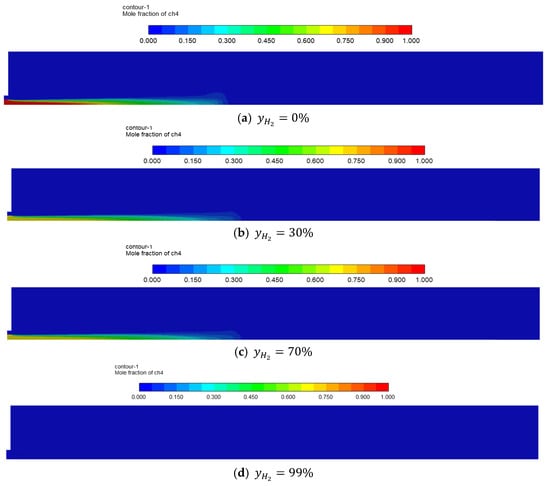
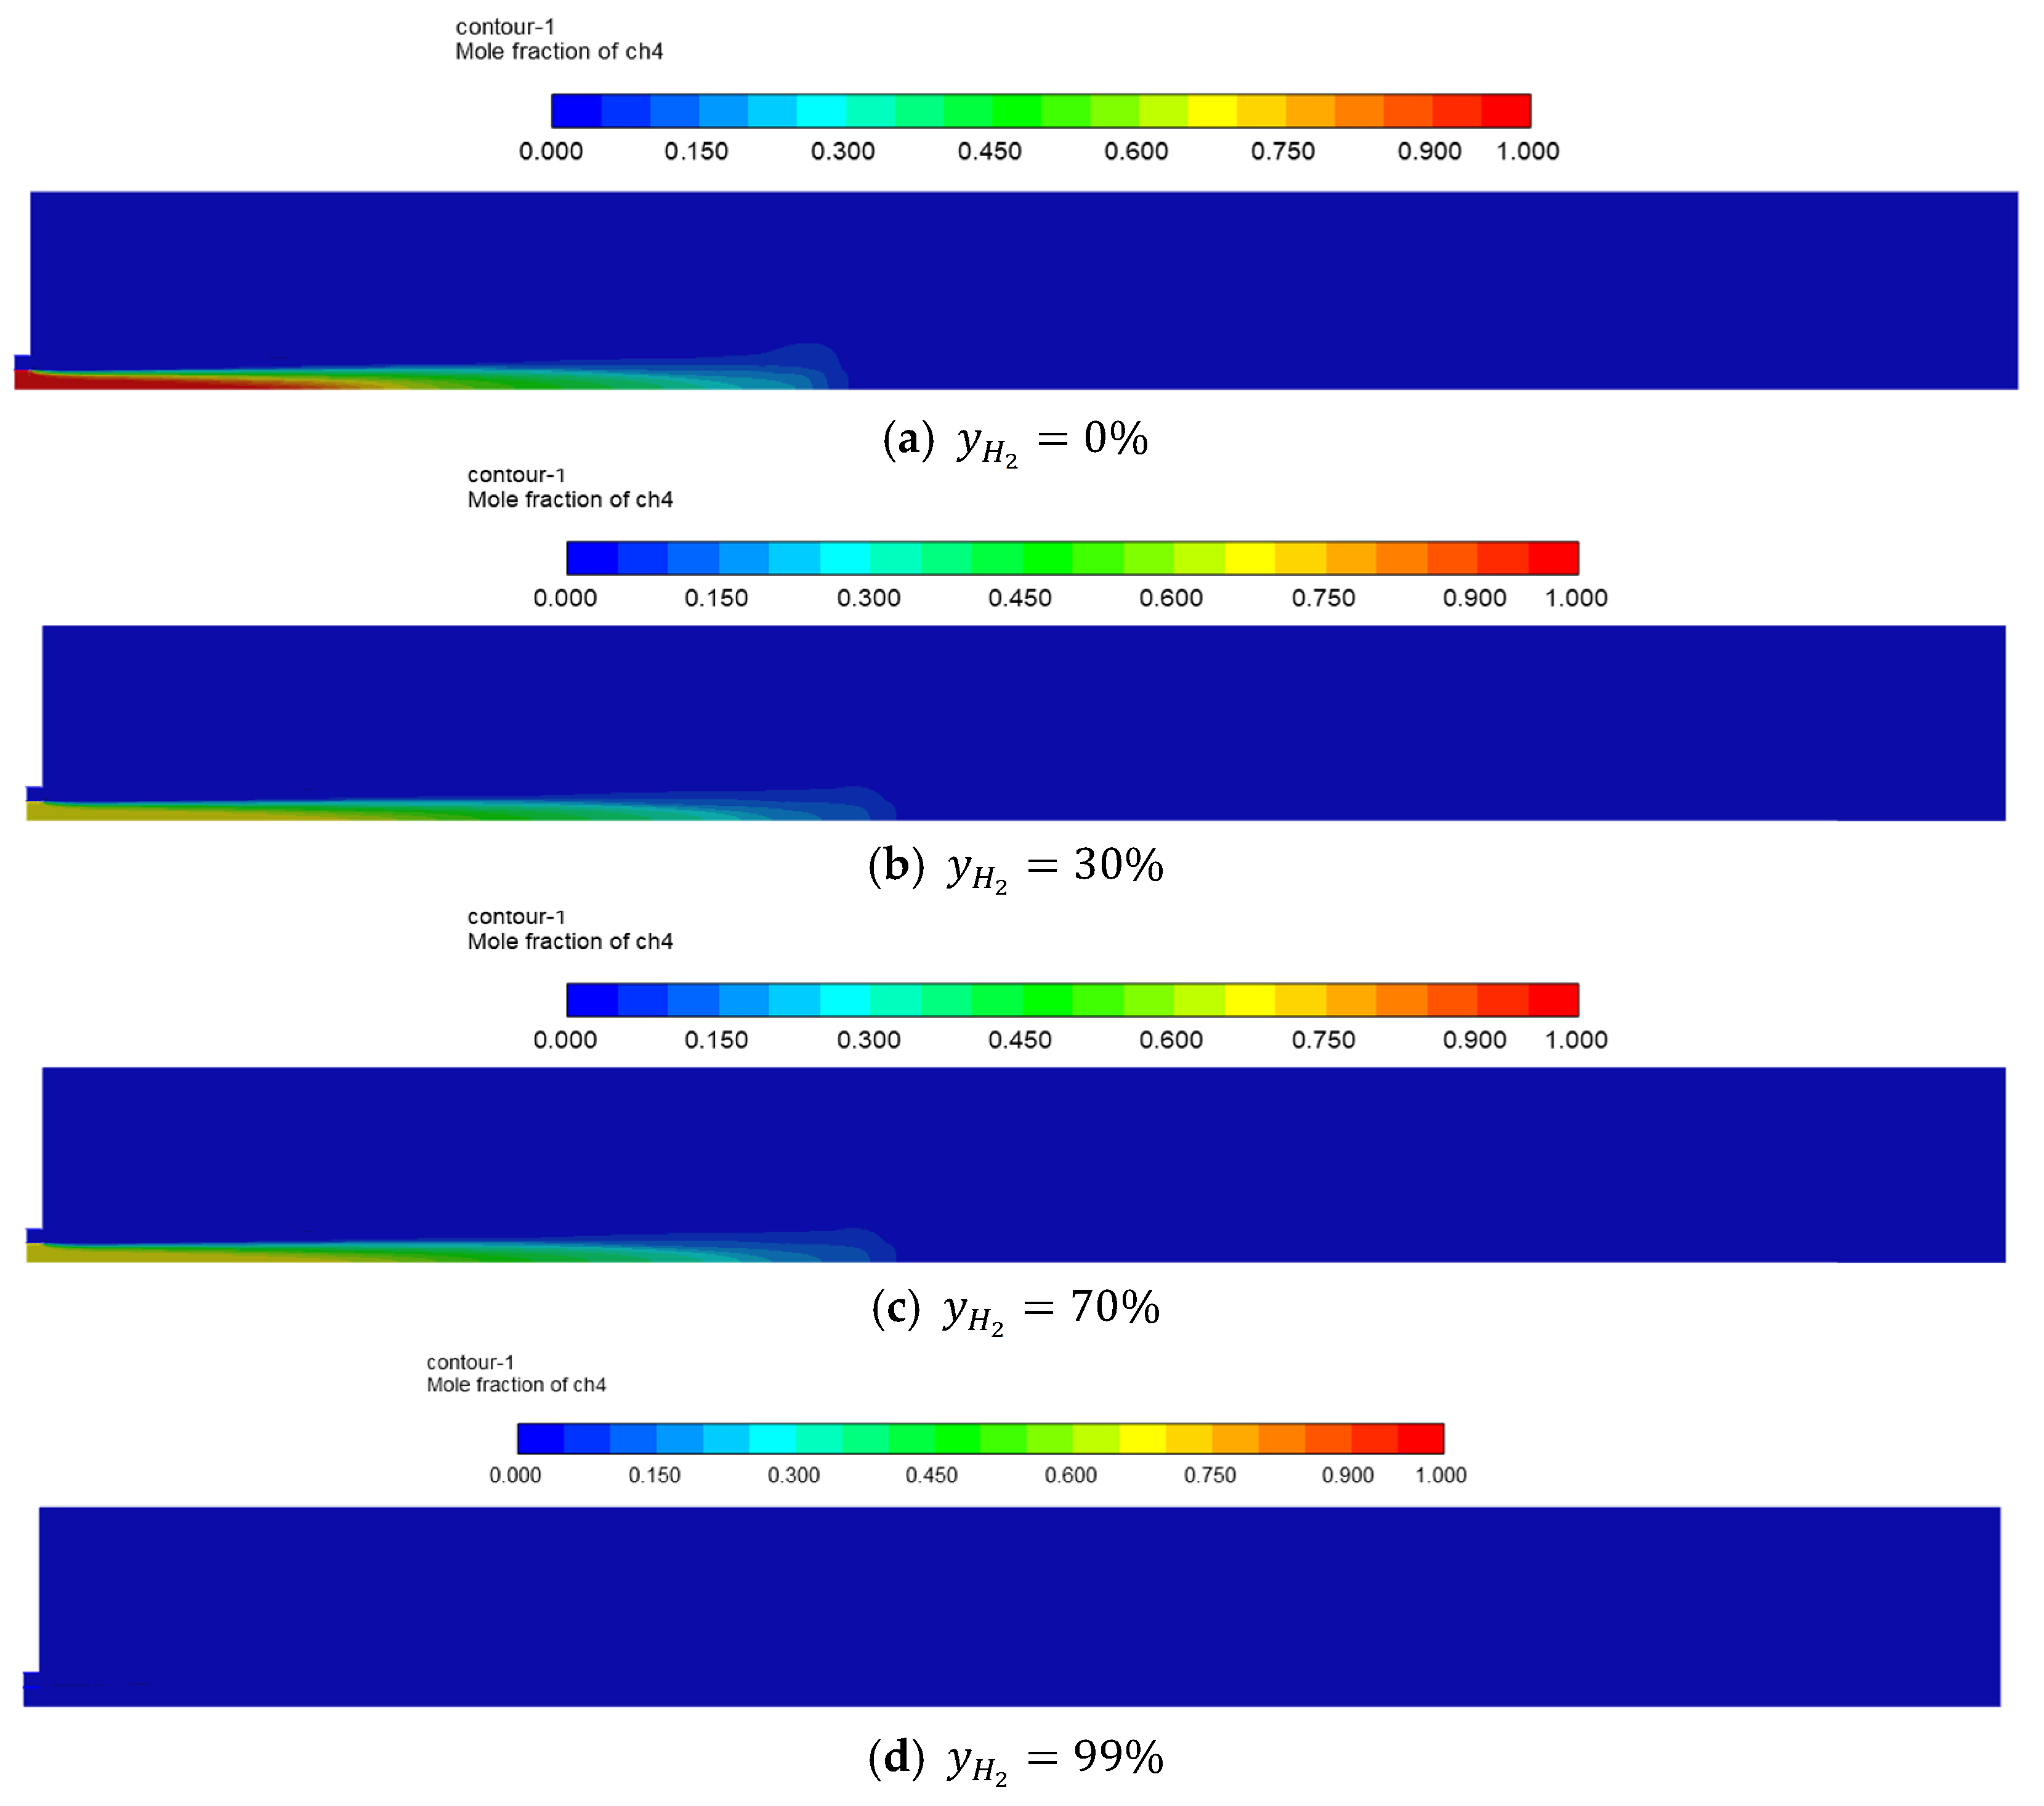
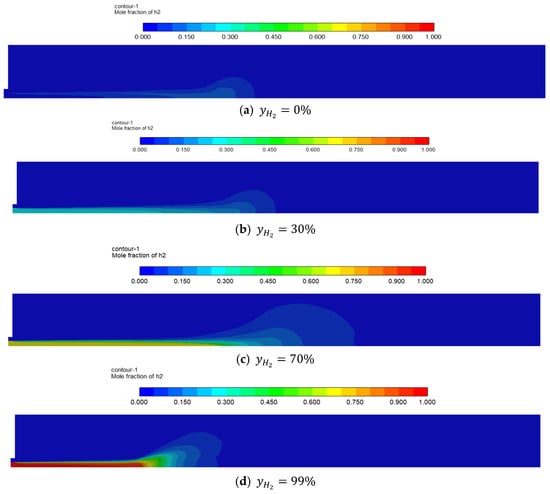
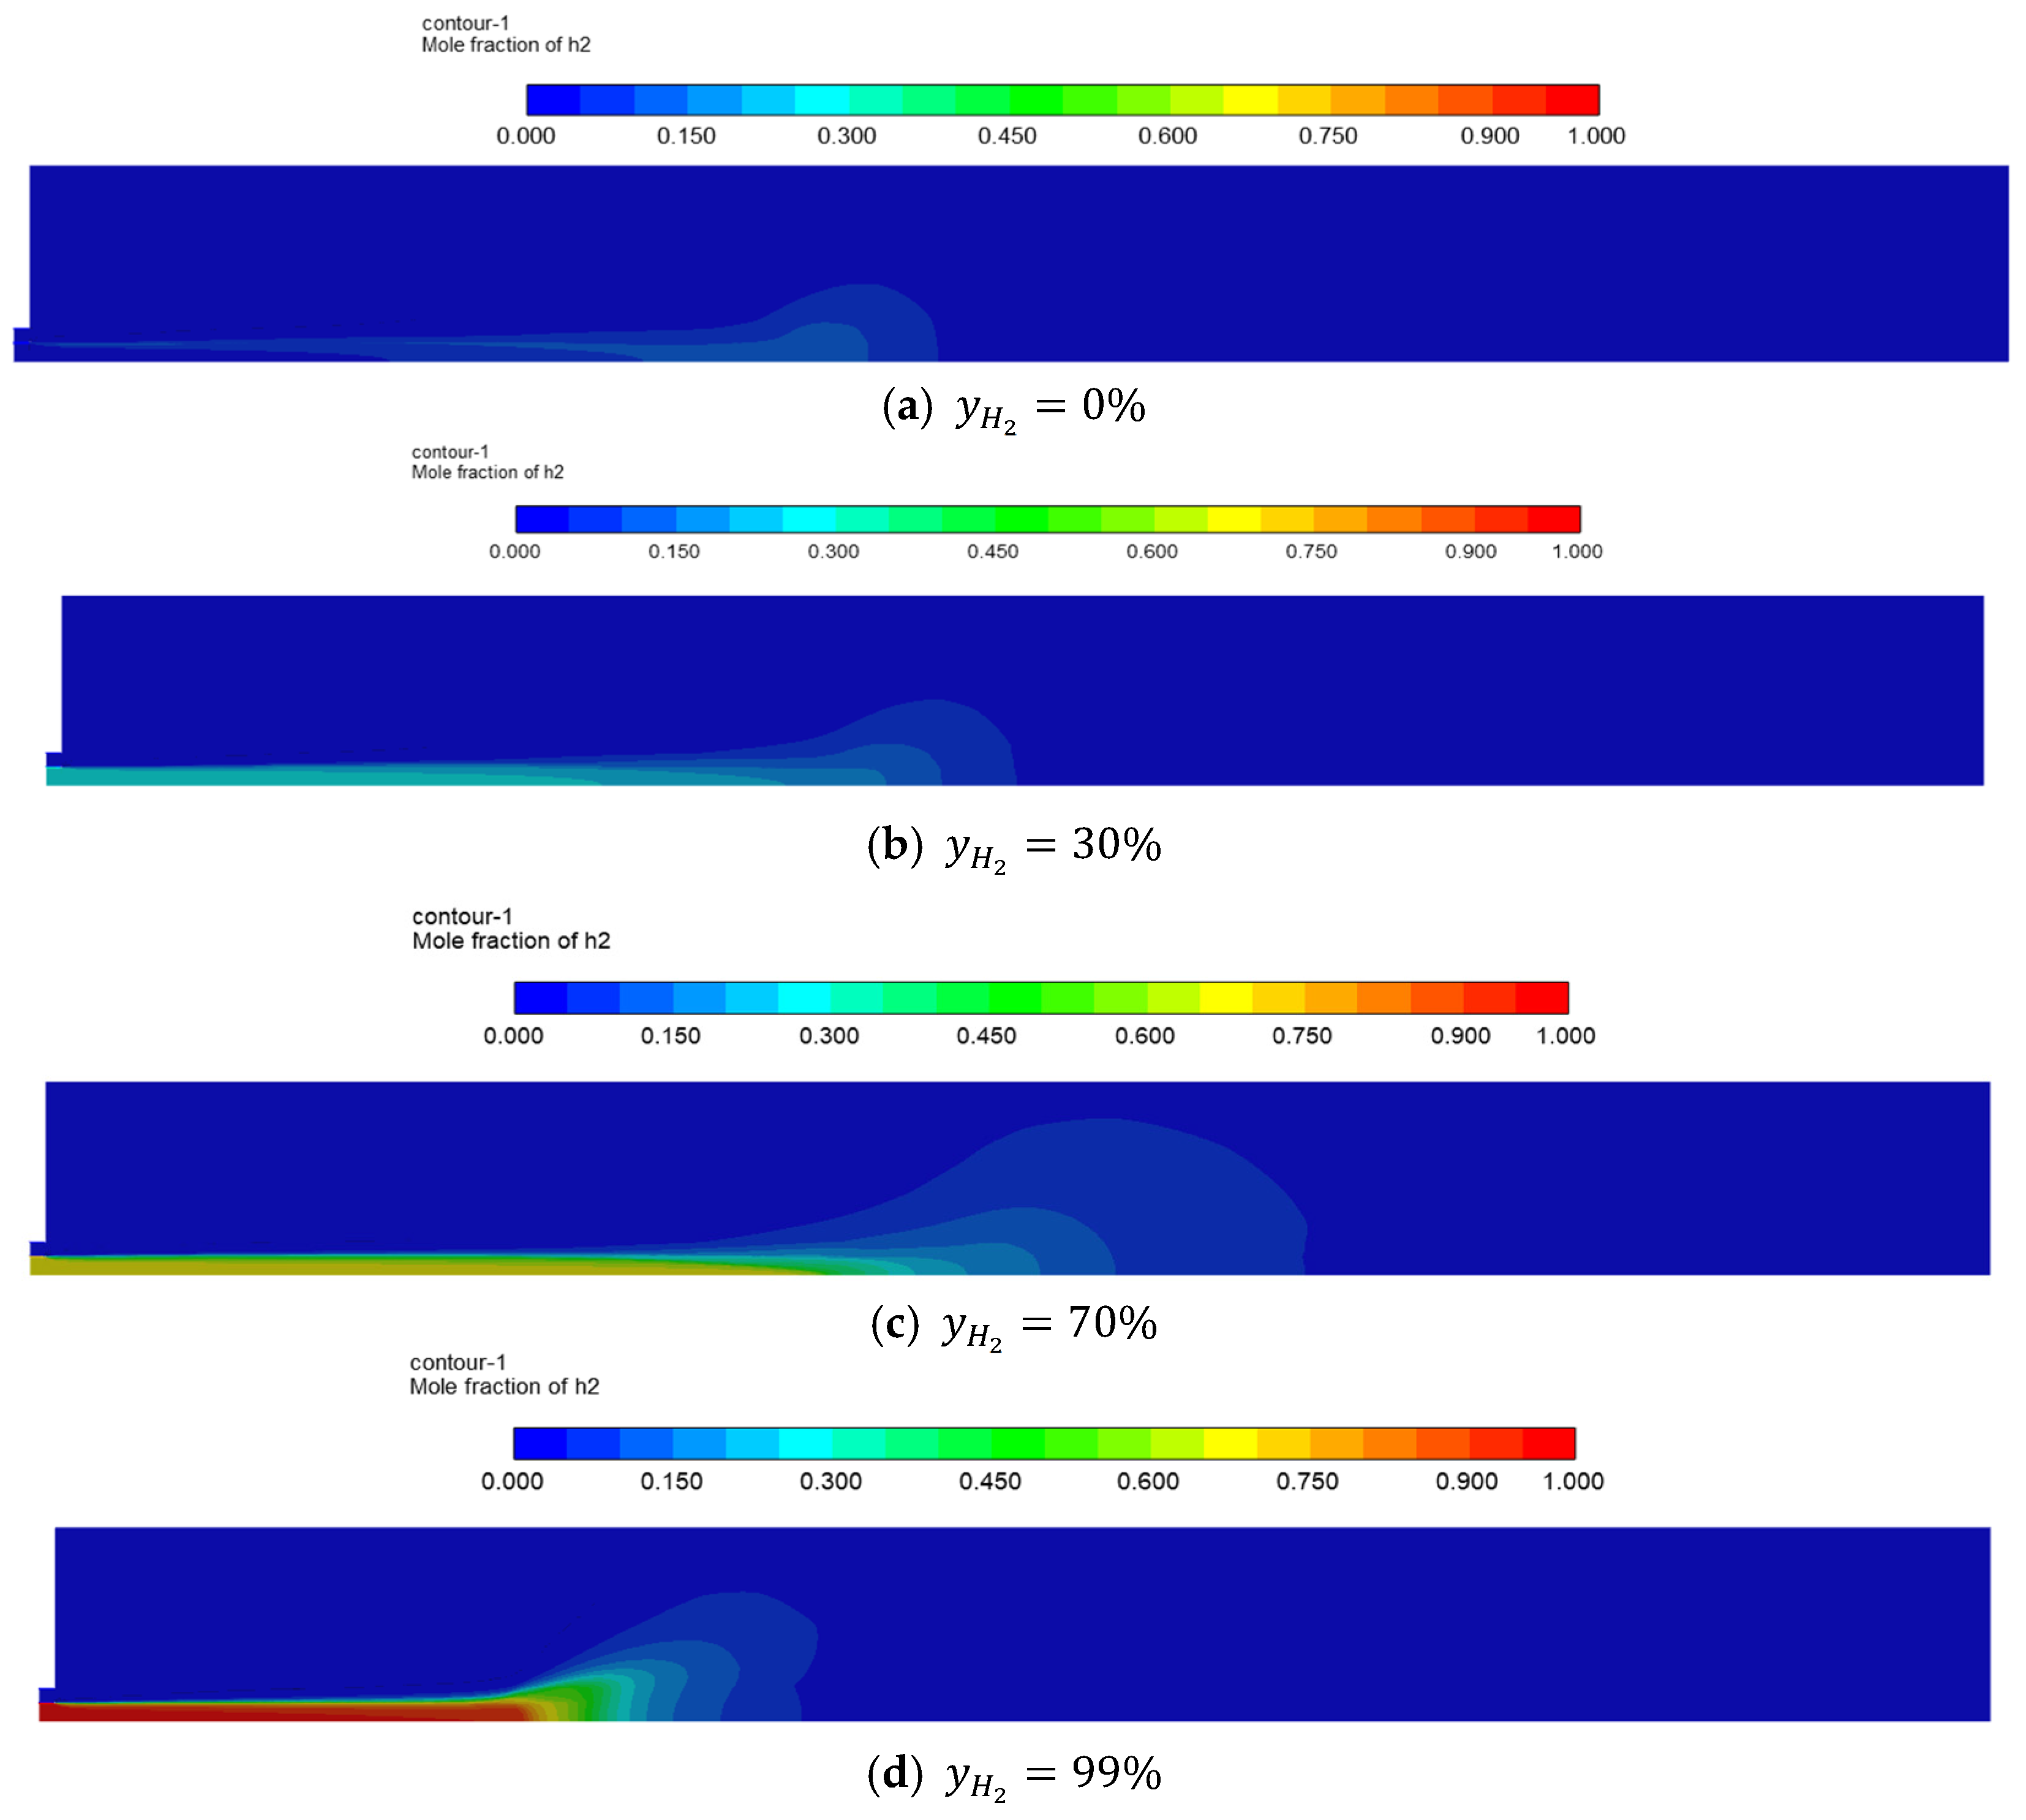
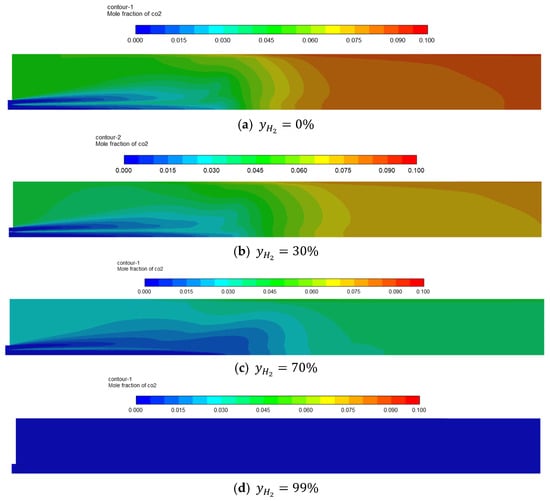
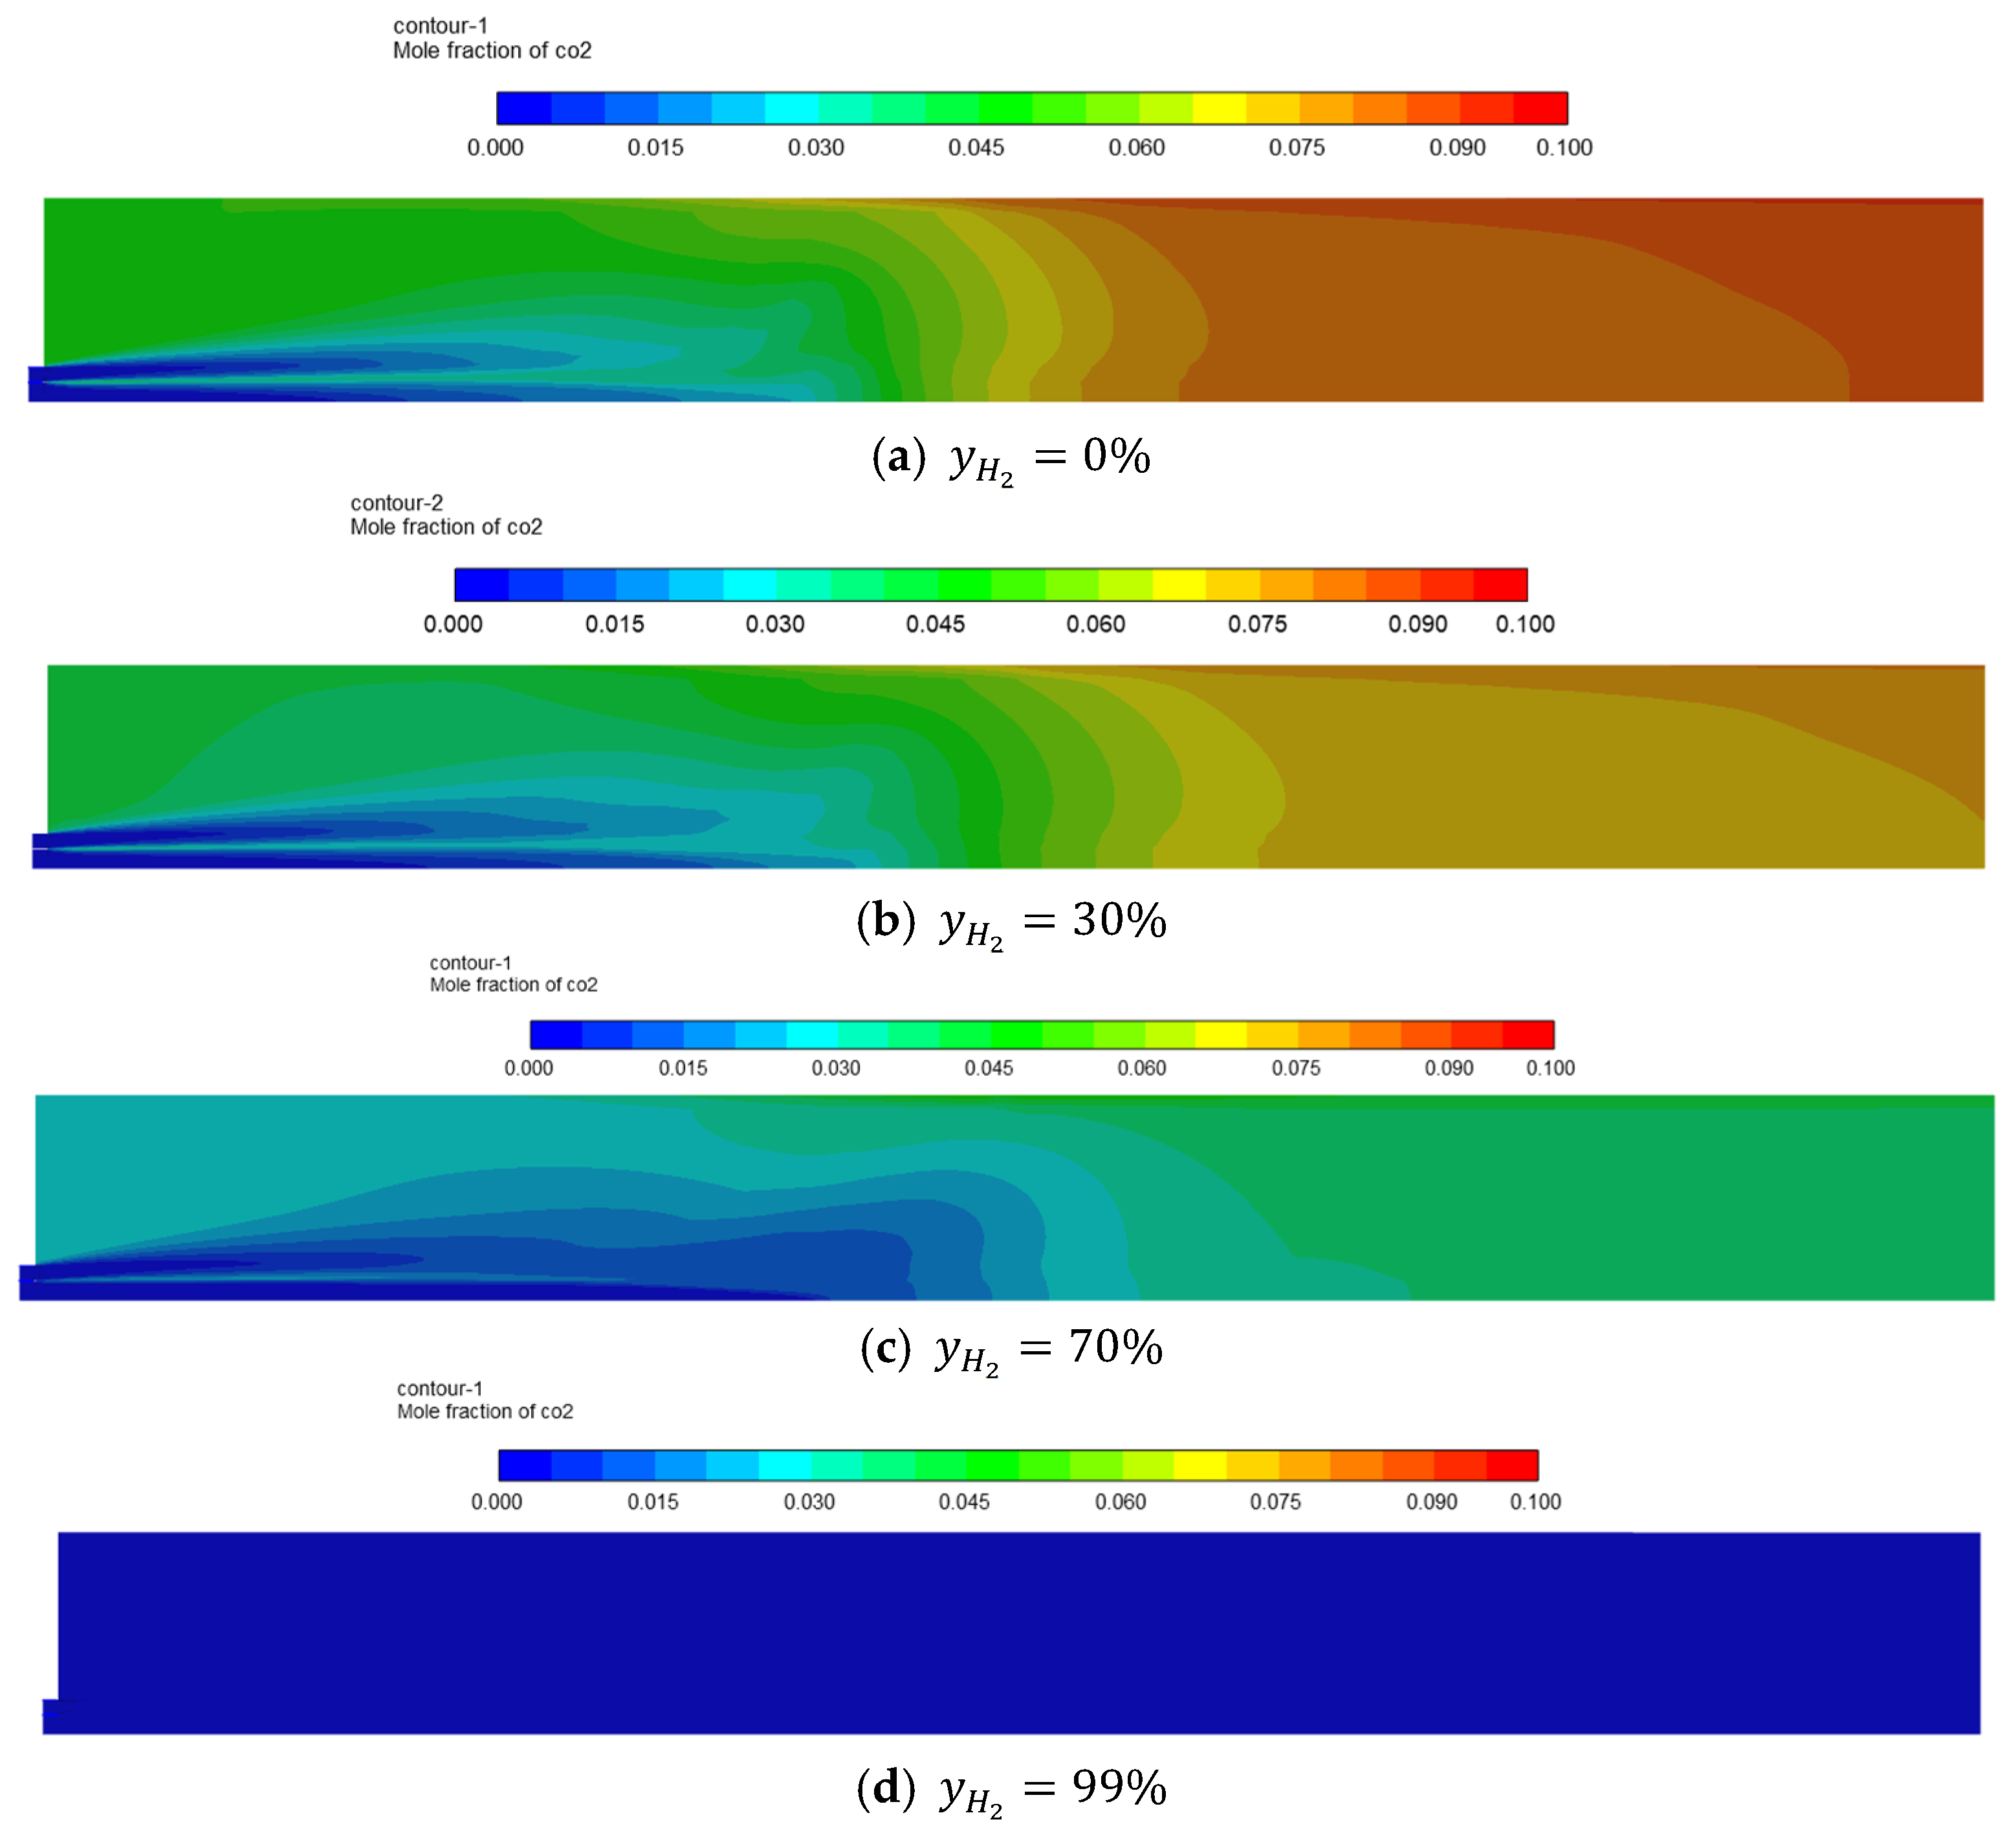
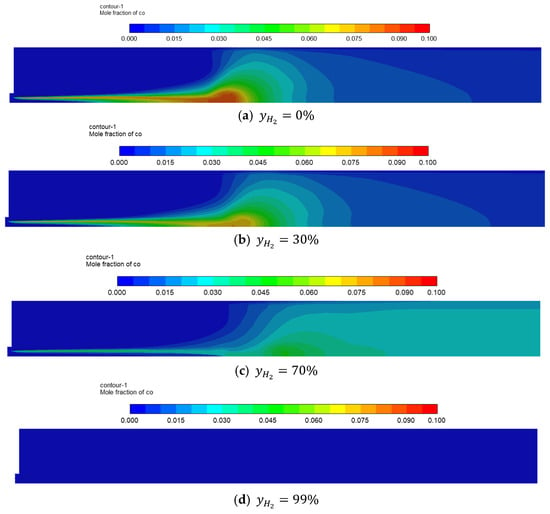
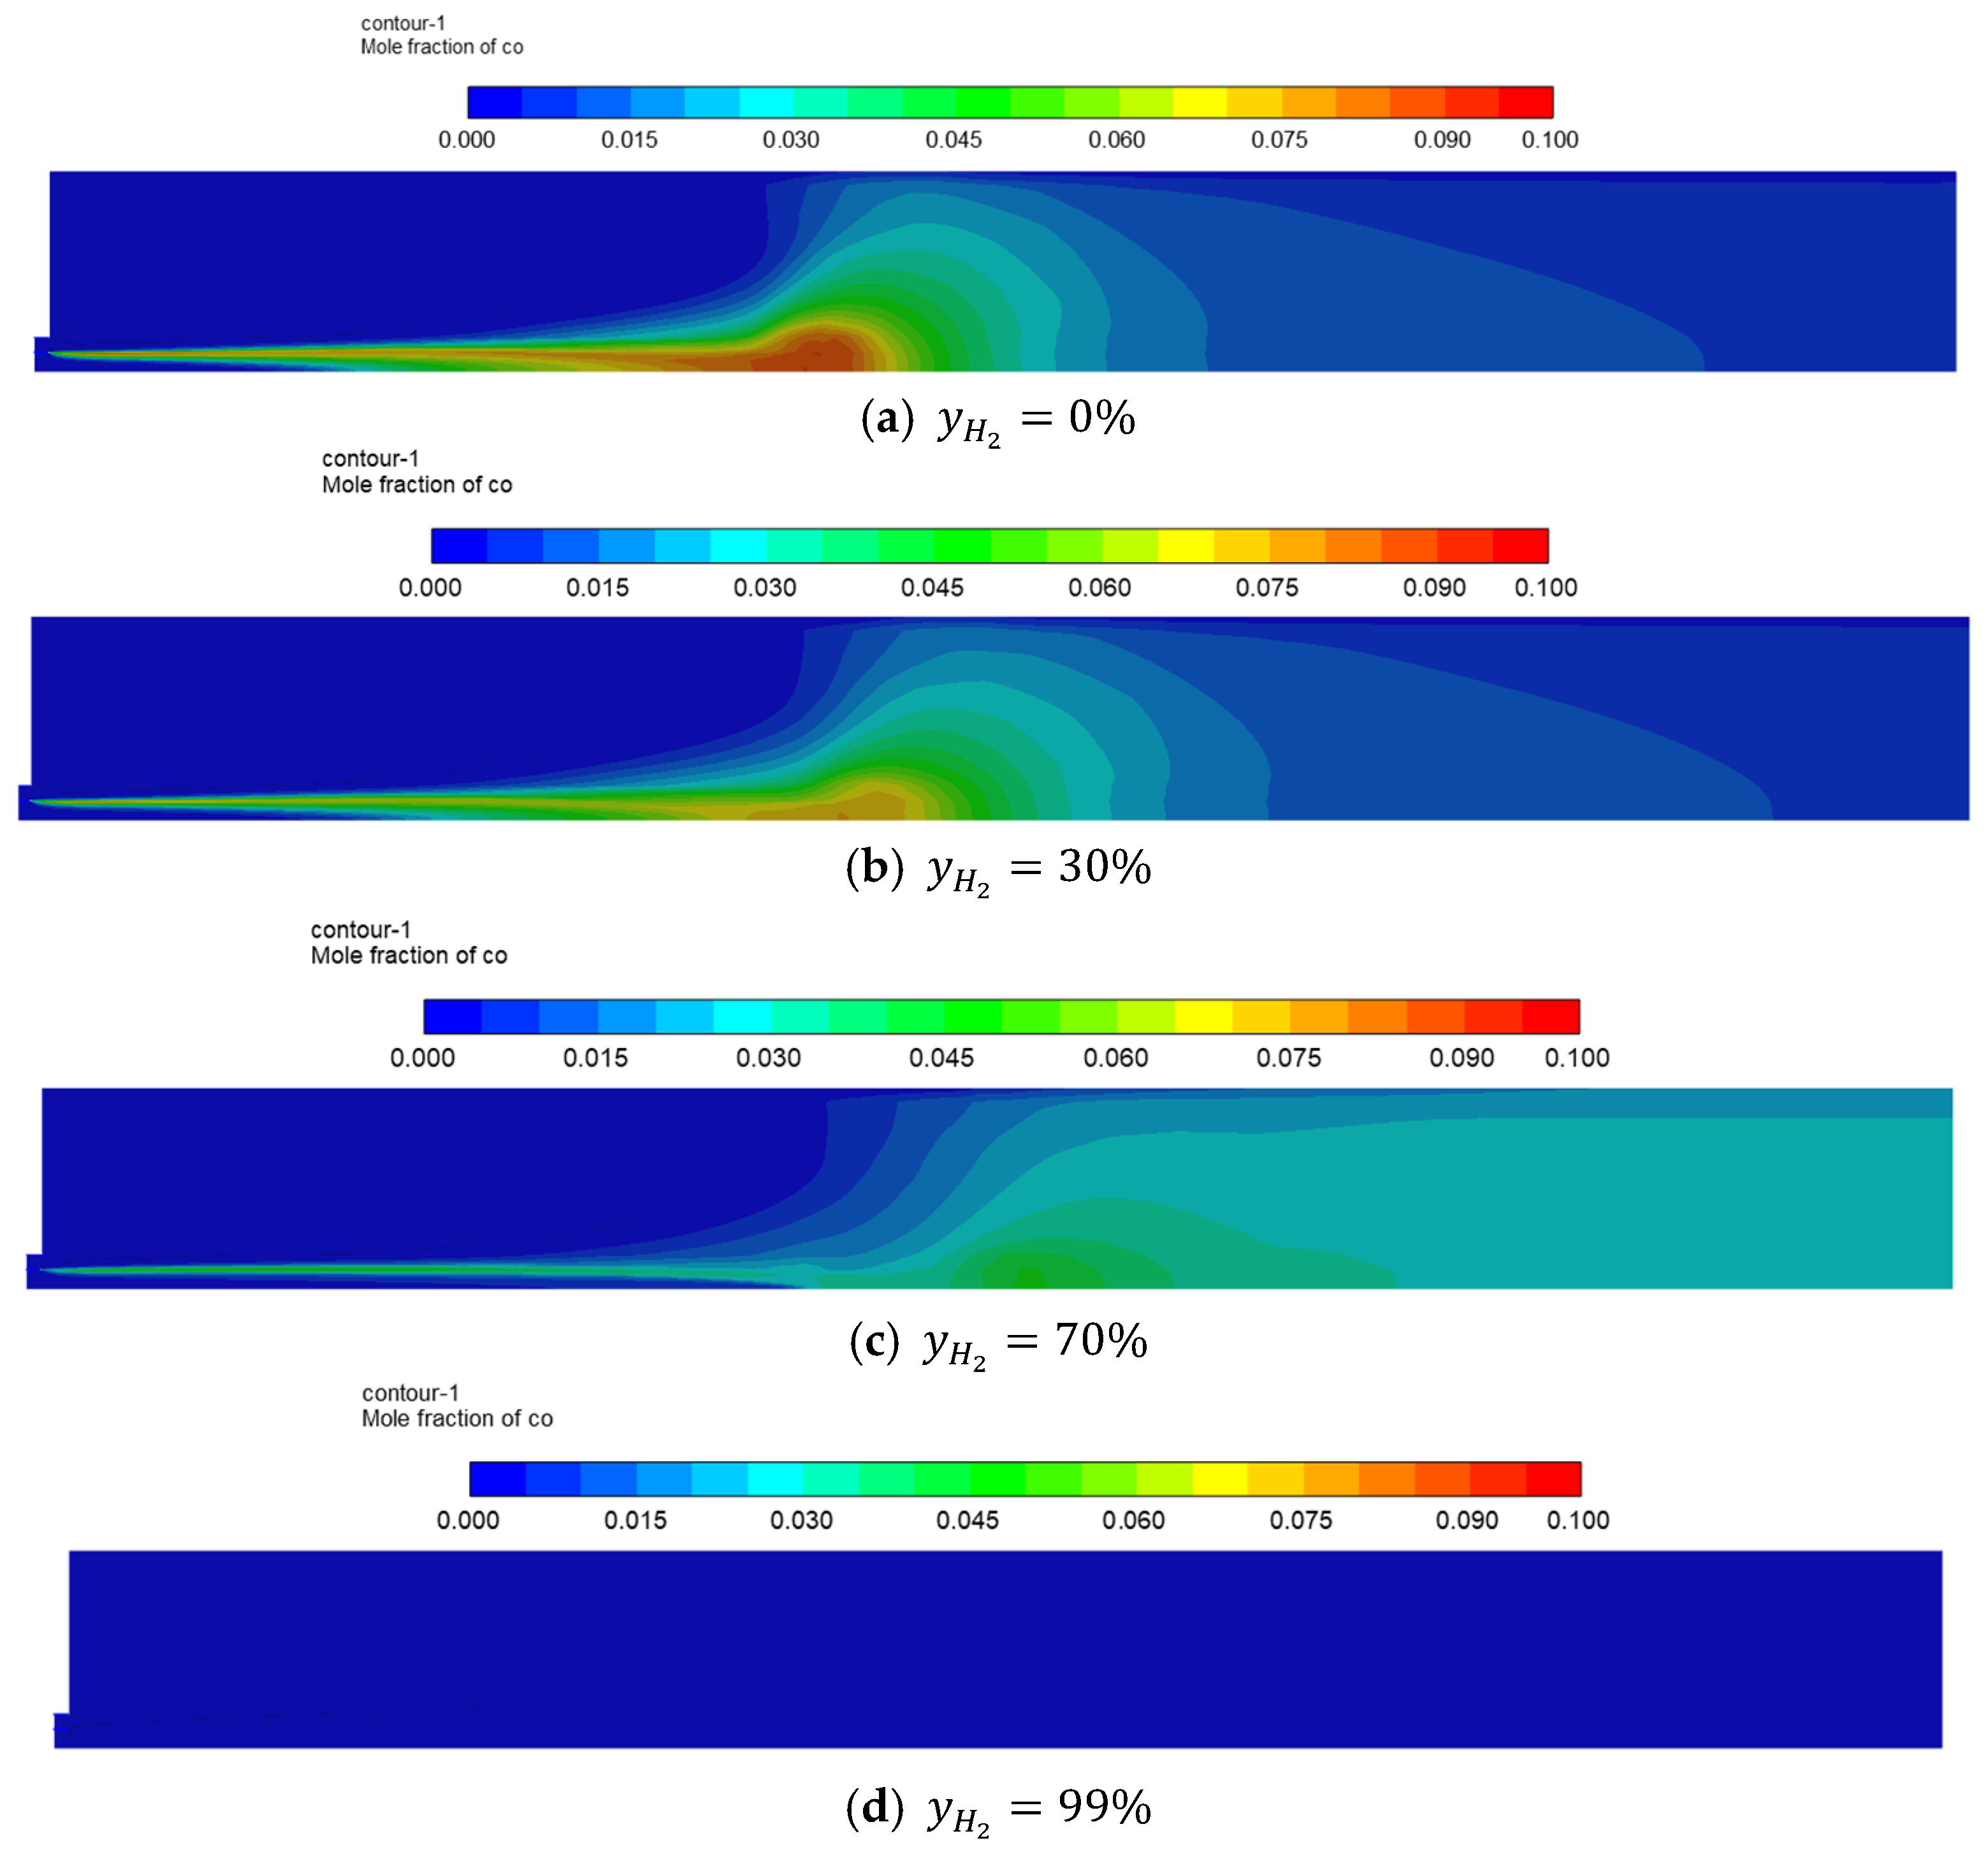
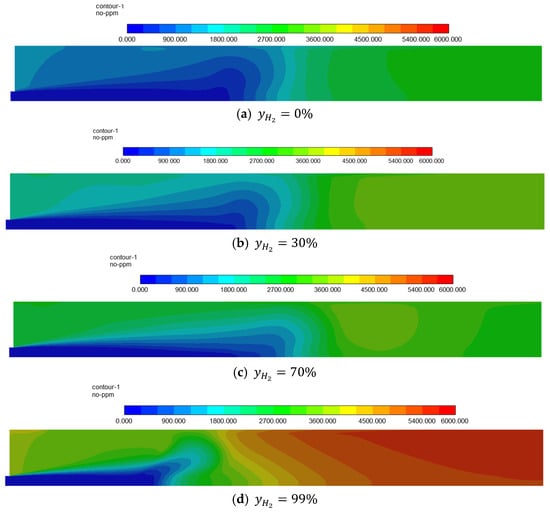
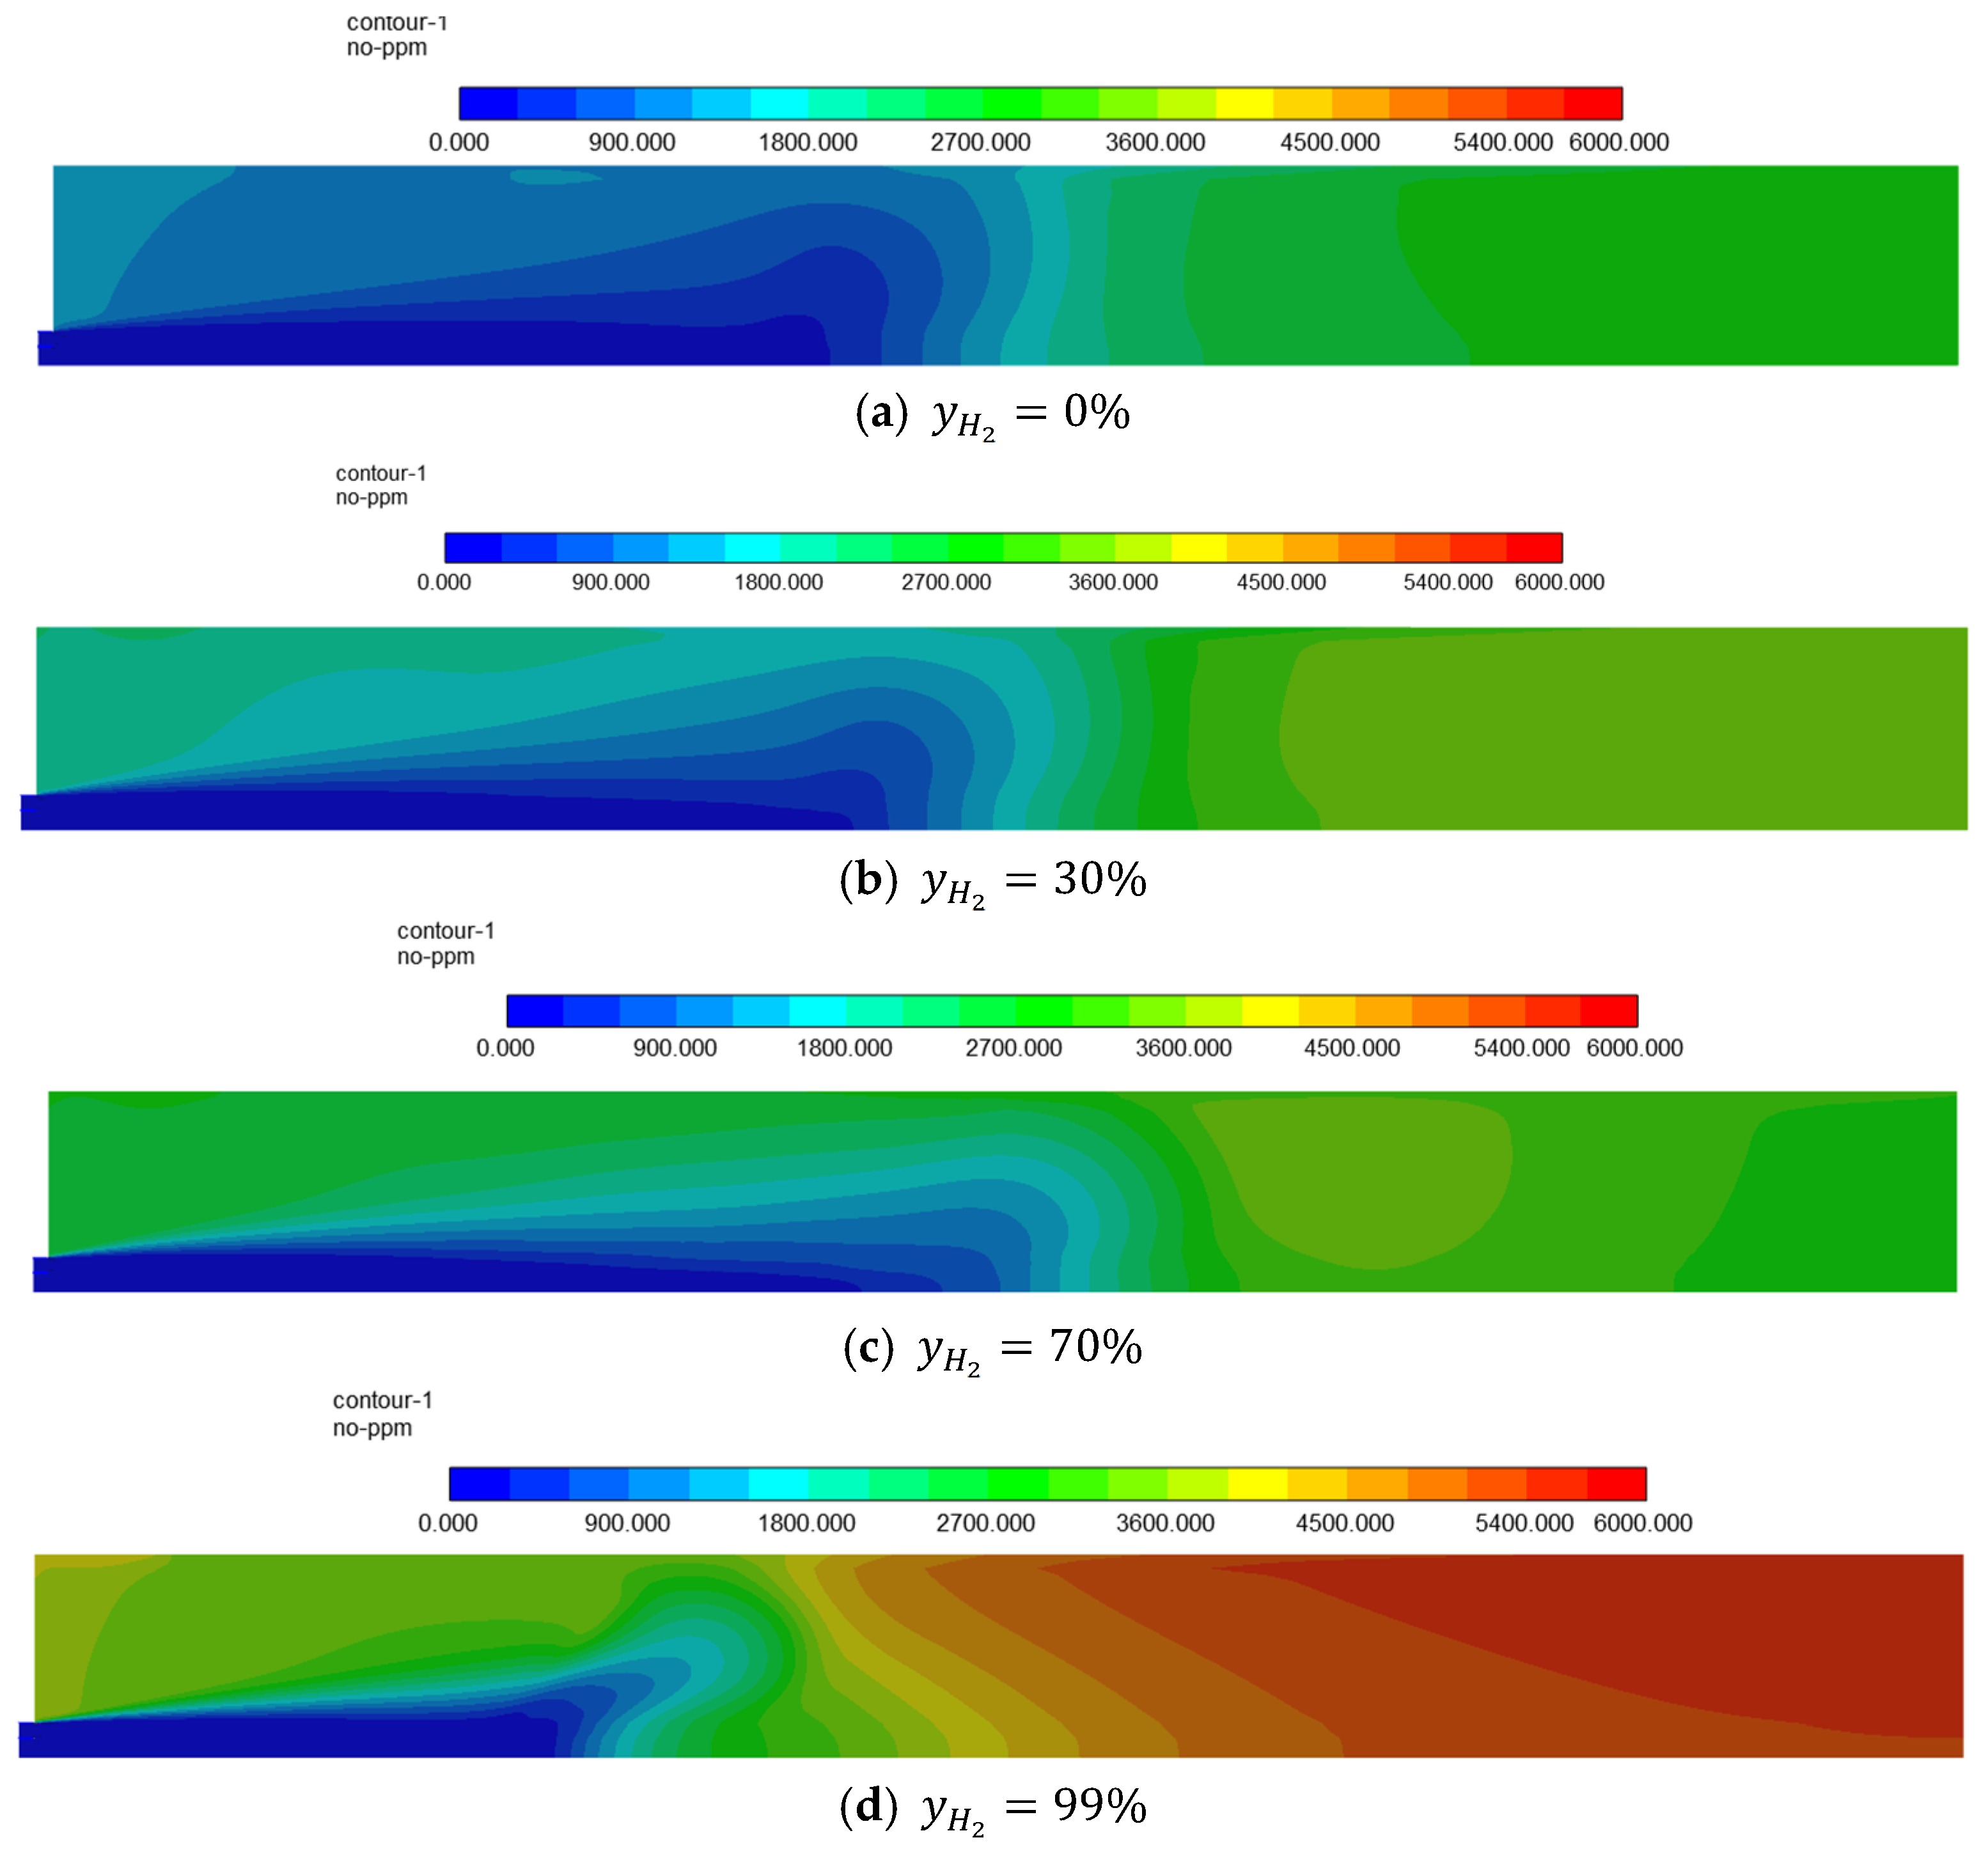
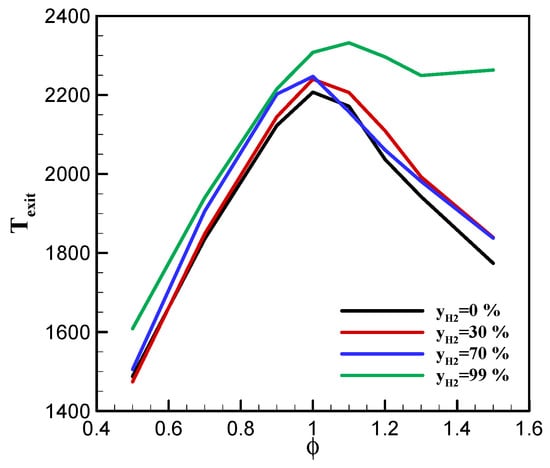
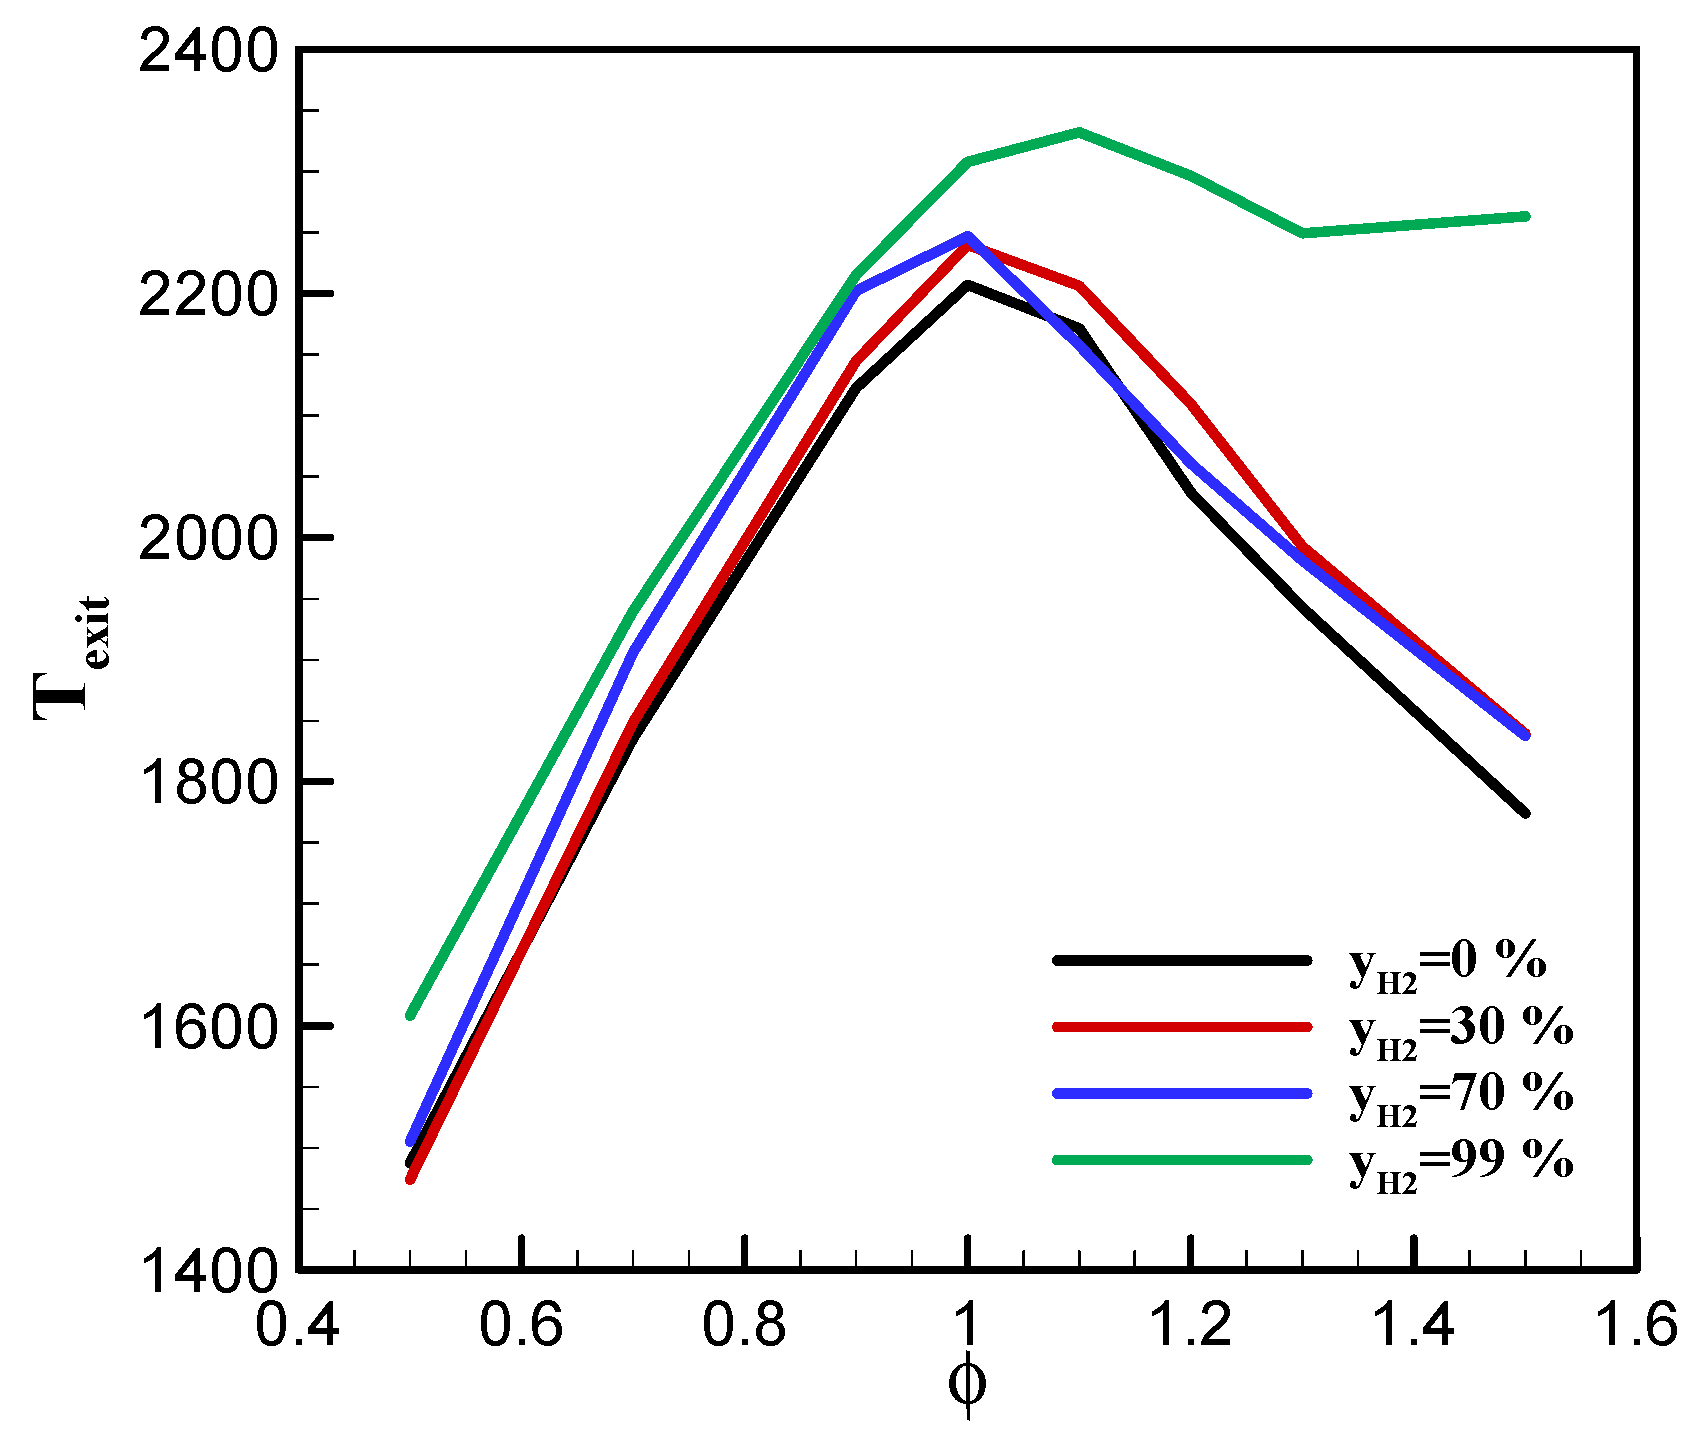
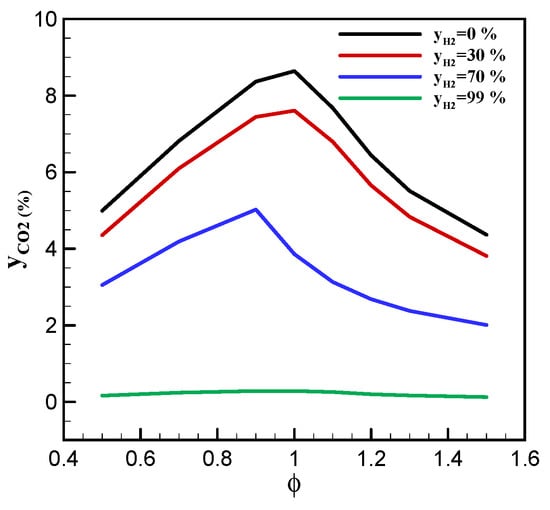
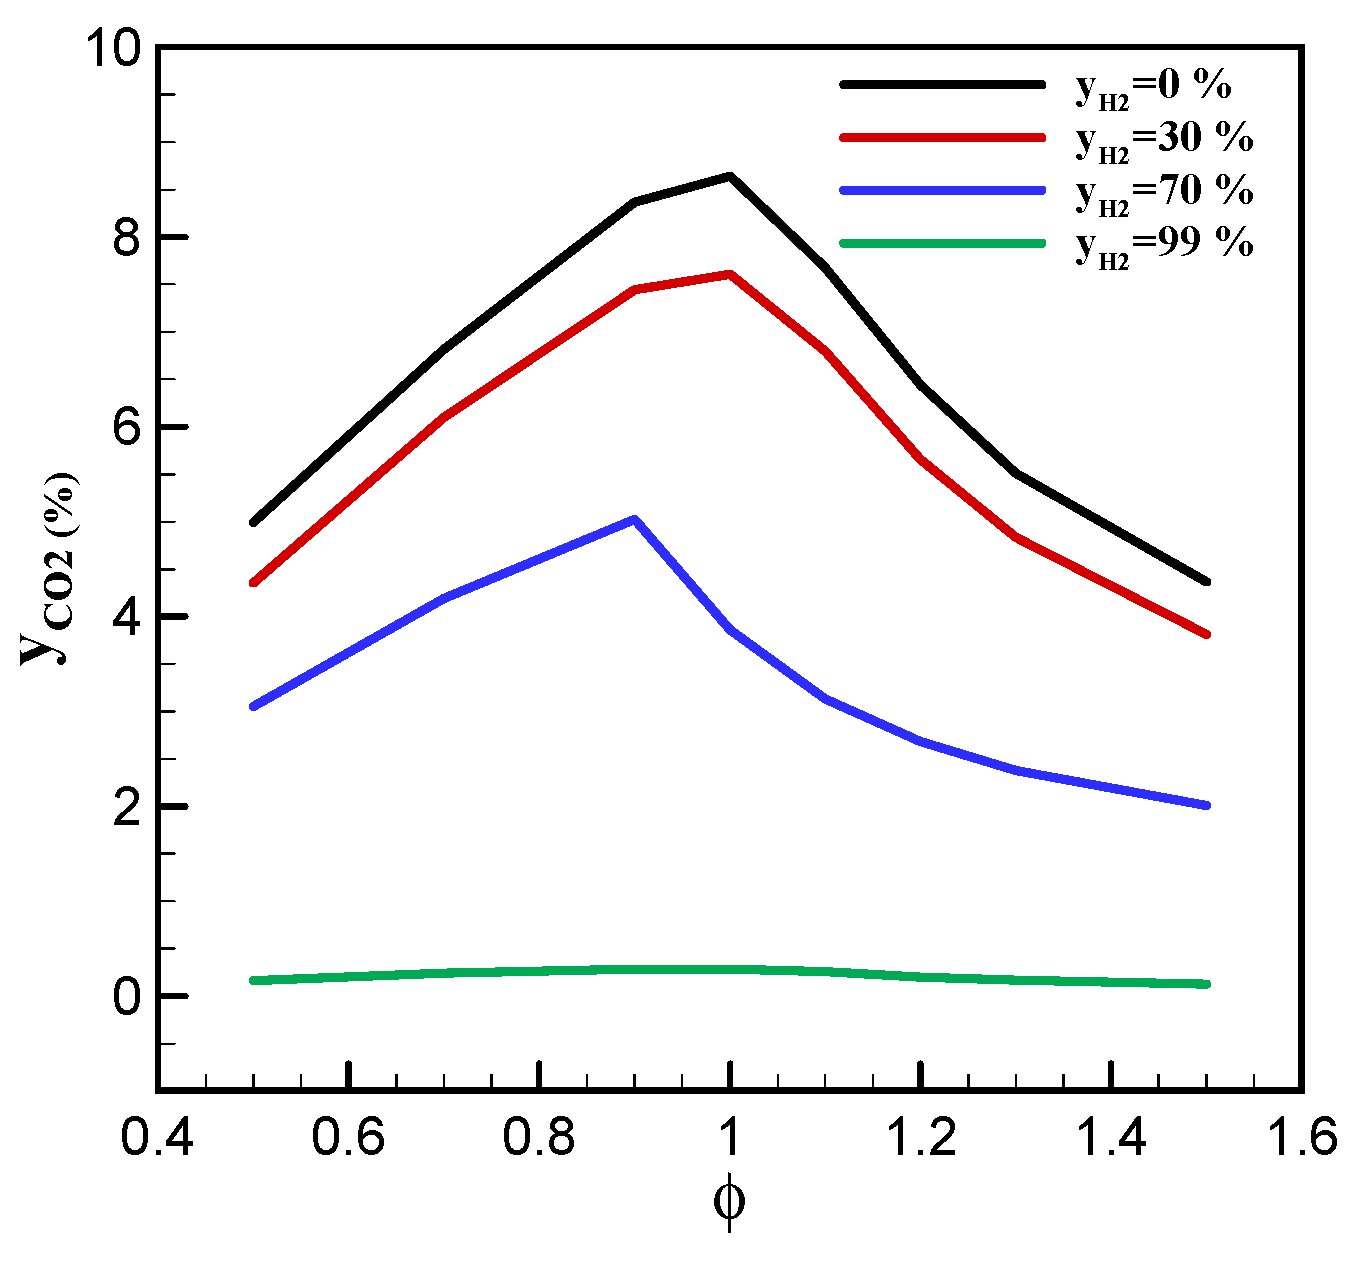
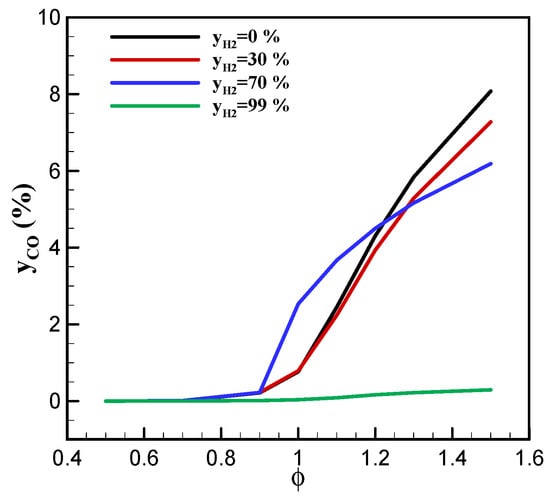
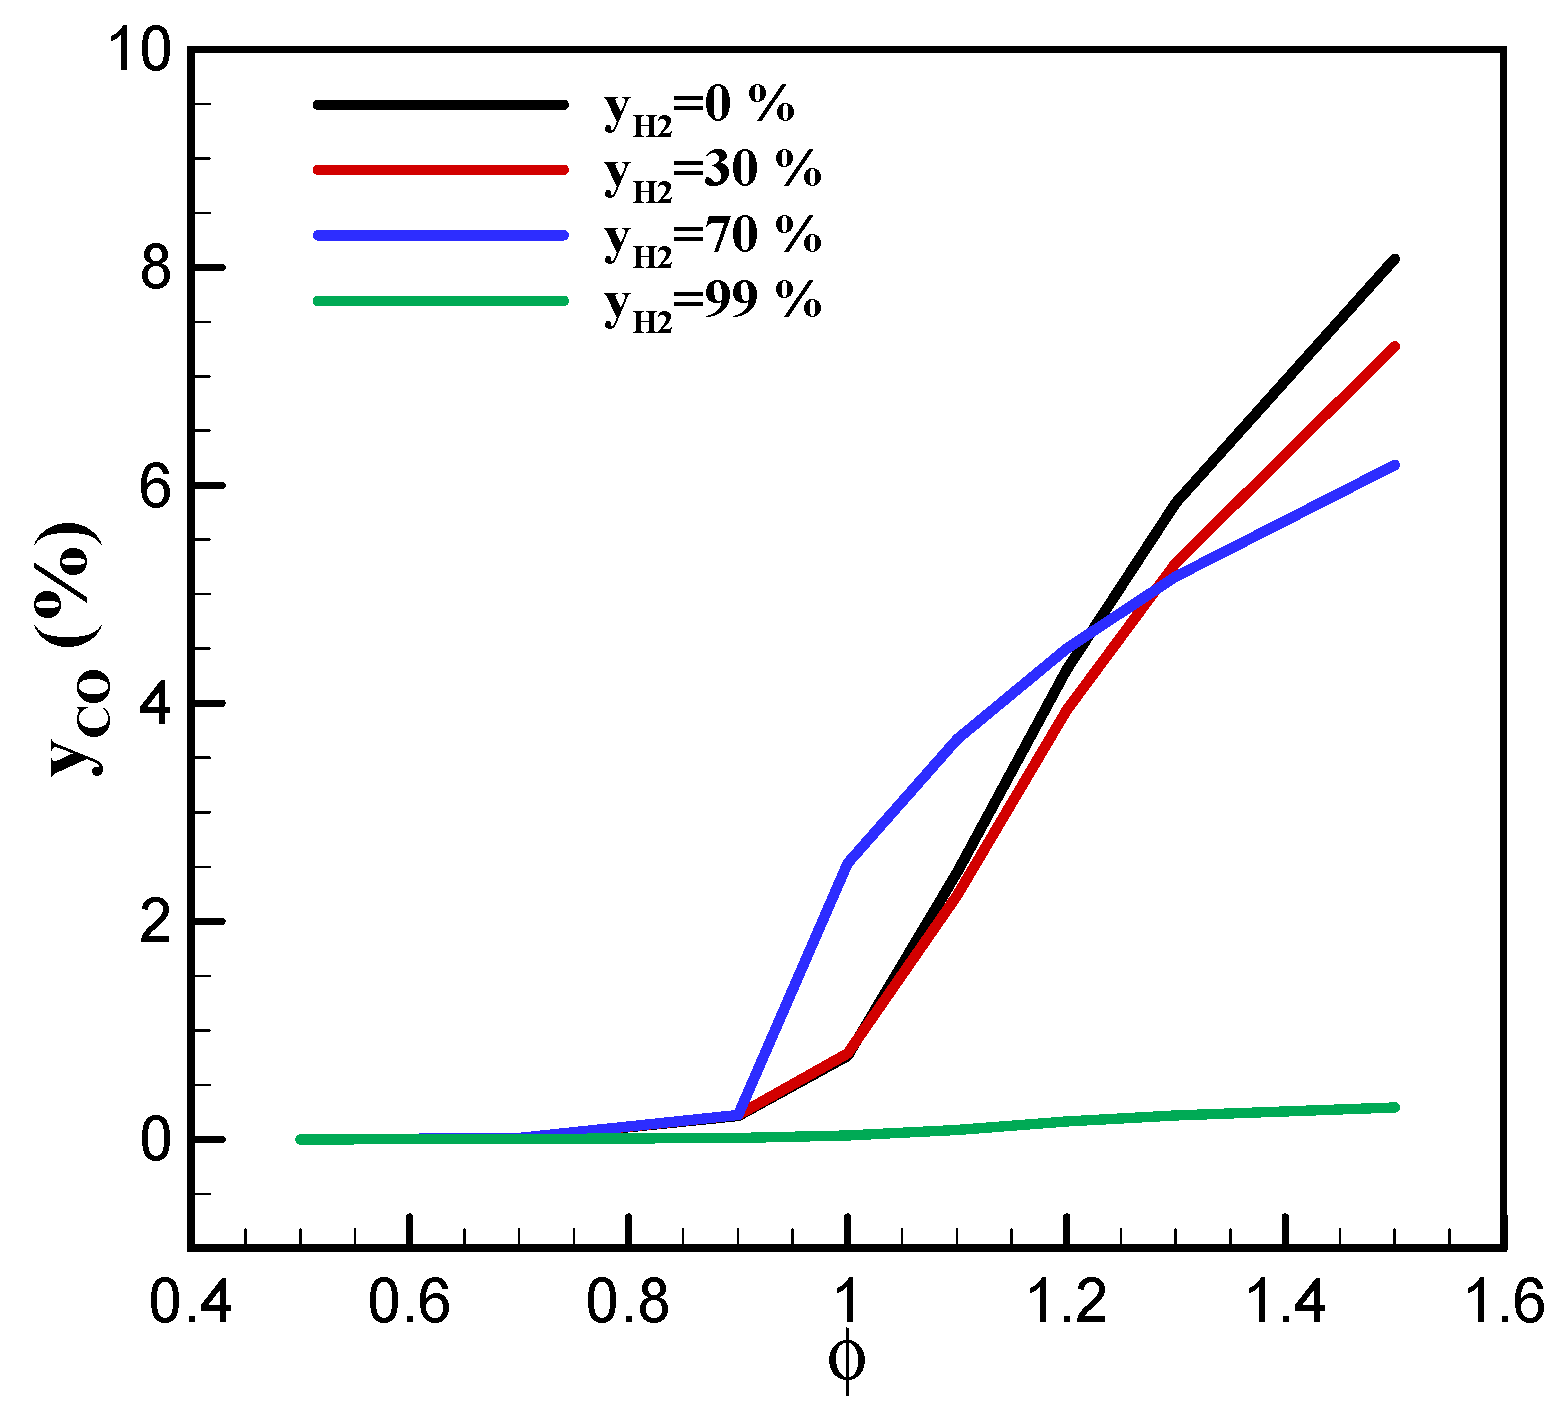
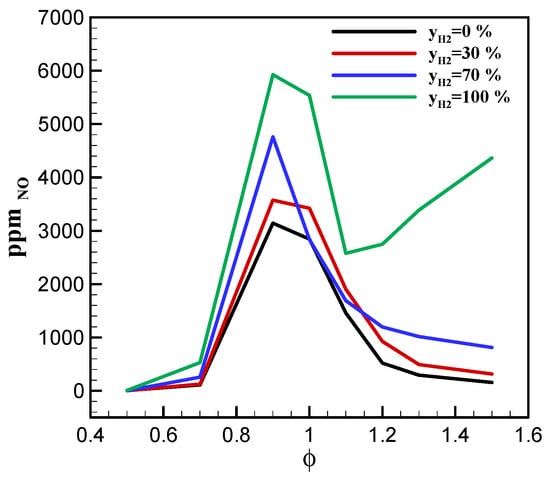
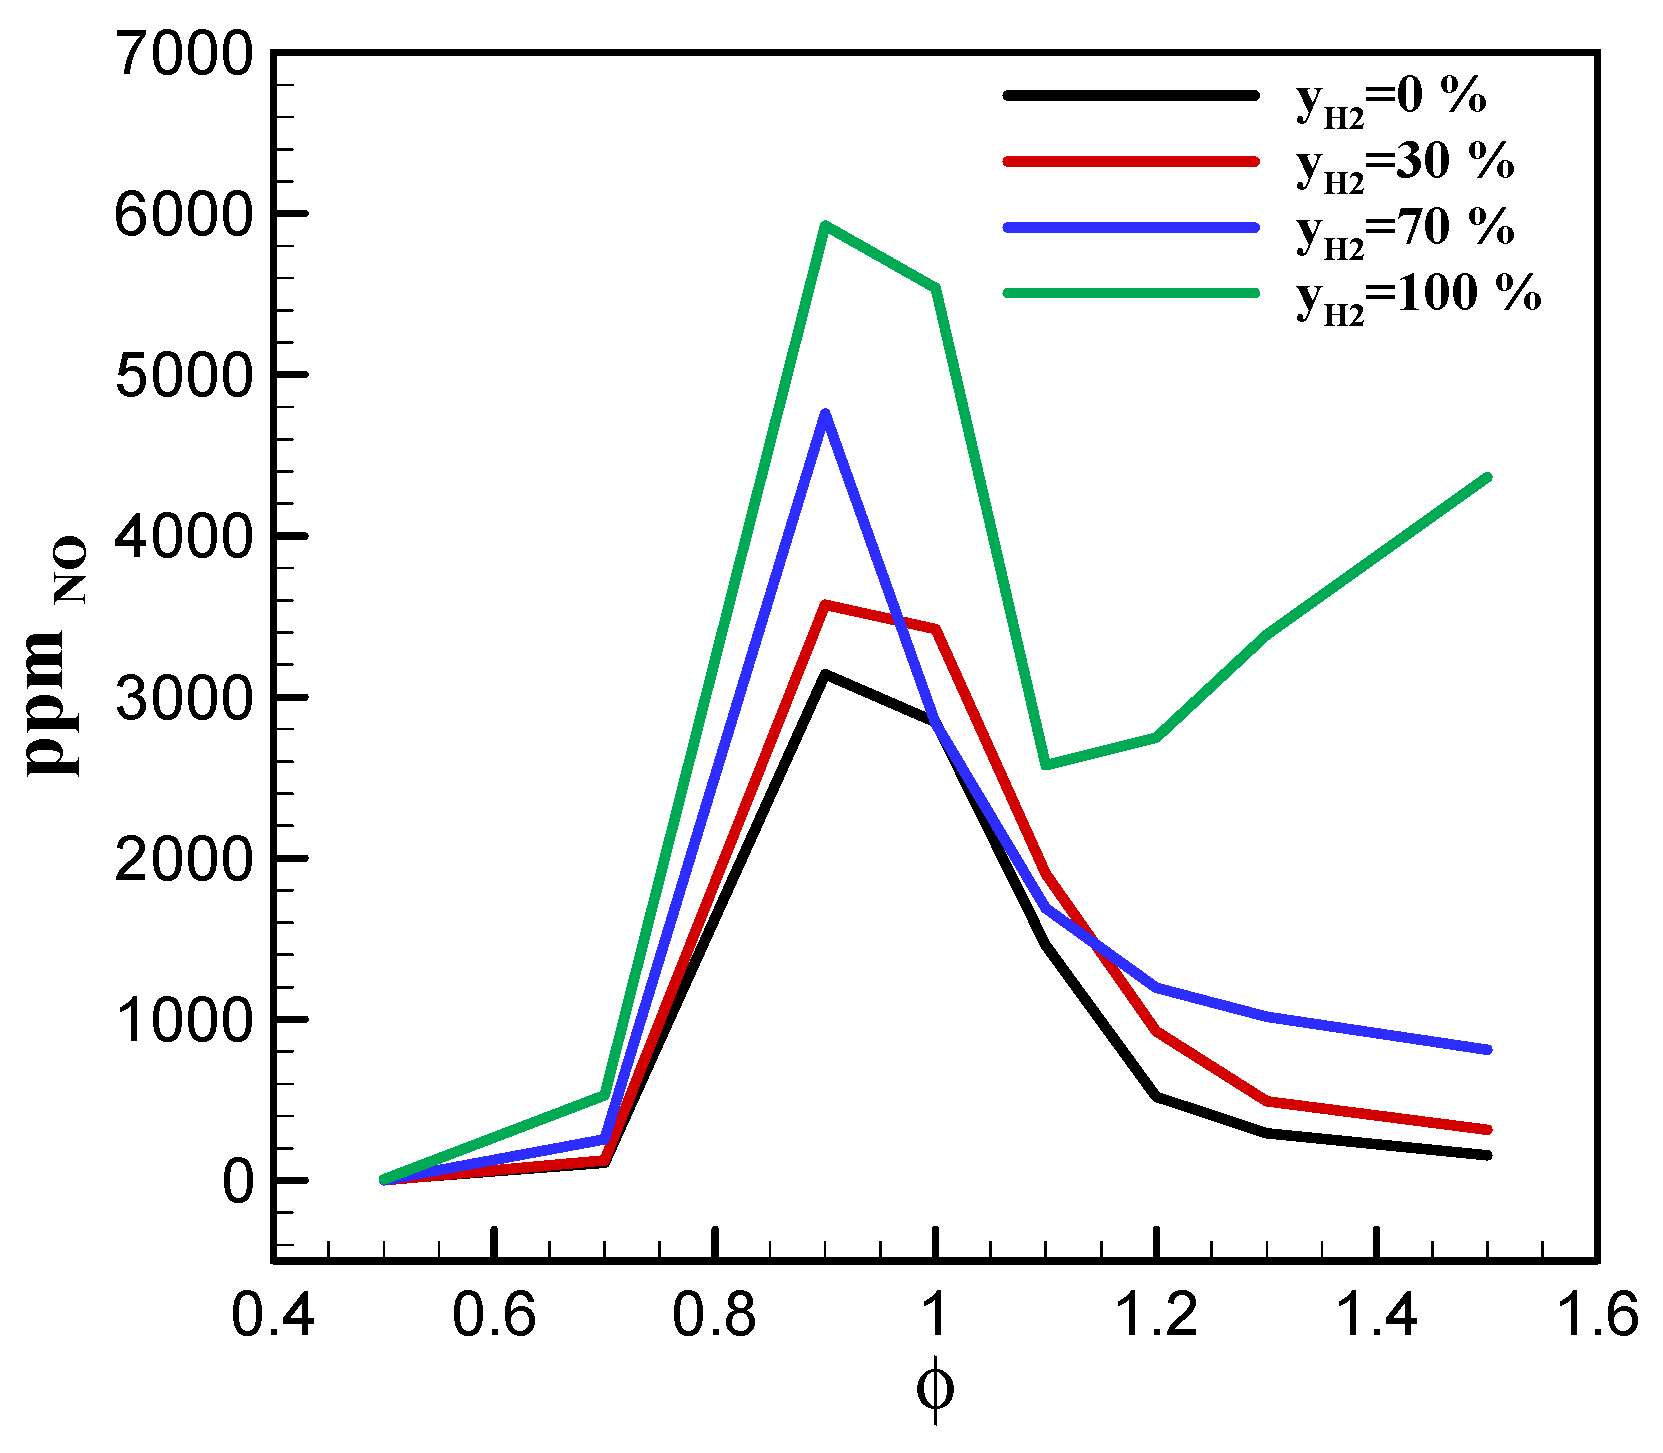

Disclaimer/Publisher’s Note: The statements, opinions and data contained in all publications are solely those of the individual author(s) and contributor(s) and not of MDPI and/or the editor(s). MDPI and/or the editor(s) disclaim responsibility for any injury to people or property resulting from any ideas, methods, instructions or products referred to in the content. |
© 2026 by the authors. Licensee MDPI, Basel, Switzerland. This article is an open access article distributed under the terms and conditions of the Creative Commons Attribution (CC BY) license.