


Abstract
The hydrogen economy has emerged as a promising pathway to address climate change and ensure long-term global energy security, with water electrolysis powered by renewable energy as a key enabler of sustainable hydrogen production. Recent advances in various electrolyser technologies have enhanced their suitability for industrial applications, creating new opportunities for deploying green hydrogen. To address the gap in integrated, multi-dimensional assessment tools for groundwater-based hydrogen systems in water-scarce developing countries, this study develops and presents a Structured Assessment Framework for Green Hydrogen Production from Groundwater in South Africa—the first framework to simultaneously integrate hydrogeological sustainability screening, electrolyser technology selection under groundwater quality constraints, disaggregated levelised cost of hydrogen (LCOH) analysis including water treatment costs, comparative life cycle assessment (LCA) of green, blue, and grey hydrogen pathways, and policy and governance alignment within a single operationalised architecture. This included integrating five thematic dimensions: groundwater resource assessment, electrolyser technology integration, economic viability, environmental sustainability, and policy and governance considerations. This systematic review was conducted in accordance with the PRISMA 2020 guidelines, drawing on 130 studies retrieved from Scopus and Web of Science (2015–2025). The analysis examines groundwater quality and suitability, the technical feasibility of electrolyser systems, and the comparative implications of grey, blue, and green hydrogen pathways on cost and environmental performance. The framework also provides strategic guidance for deploying renewable-energy-powered hydrogen systems, emphasising life-cycle impacts, regulatory alignment, and the potential for decentralised hydrogen hubs. Findings highlight the significance of strengths, weaknesses, opportunities, and threats (SWOT) for green hydrogen production using groundwater in South Africa, including export potential and strong linkages to the circular economy. The study offers actionable insights for policymakers, planners, and industry stakeholders seeking to advance a sustainable and economically competitive hydrogen landscape.
1. Introduction
Global energy and environmental challenges underscore the urgent need to replace fossil fuels with clean, renewable energy sources [1]. In this context, hydrogen, with a high gravimetric energy density (142 MJ/Kg), zero pollution, high efficiency, and recyclability, is gaining global attention as a source for the clean energy transition [2,3]. With the unique advantages of hydrogen and concerns about environmental pollution and climate change, many countries have considered hydrogen as a promising future energy source for decarbonisation across heavy manufacturing, long-haul transport, electricity production, and agriculture [1,2,3]. However, the most anticipated technology for producing low-cost, zero-carbon hydrogen to replace fossil fuels remains highly challenging. Notwithstanding, water electrolysis, considered one of the most promising technologies for producing hydrogen, also requires substantial renewable energy (solar and wind) and water sources [2]. However, the substantial water requirements of water electrolysis constrain its large-scale deployment, particularly in a water-scarce country such as South Africa. Addressing this problem by exploring groundwater alongside ocean-based energy sources (wave, wind, and solar power) can significantly reduce hydrogen production costs [1]. In essence, green hydrogen (H2) produced via water electrolysis powered by renewable energy sources (RES) differs from conventional “grey” or “brown” hydrogen derived from fossil fuels, offering a promising future for South Africa’s energy landscape [3,4]. It is also versatile, capable of being stored and delivered in forms such as green ammonia or methylcyclohexane, further enhancing its role in decarbonisation efforts [5].
Hydrogen production is water-intensive, requiring approximately 9–11 kg of water per kg of hydrogen, with additional losses during purification, which is also a pressing challenge [6,7]. In water-scarce regions such as South Africa, the transition from a coal-based economy to a green hydrogen economy presents significant opportunities and challenges. Economically, the production of green hydrogen incurs high costs, with current estimates ranging from USD 3.6 to 10.30 kg−1, primarily due to the high cost of electrolysers, the cost of critical mineral exploration (e.g., platinum, iridium), and the need for substantial infrastructure investment [3,8]. Additionally, the country’s coal-based energy economy, water pollution risks (e.g., elevated nitrate and fluoride concentrations), mineral exploration, and associated environmental risks further complicate the sustainable deployment of water electrolysis [9]. The energy-intensive nature of desalination, along with land-use conflicts with agriculture and communities, poses significant barriers [10]. Moreover, although green hydrogen is carbon-neutral, its life-cycle emissions, from the manufacture of renewable infrastructure to transportation, must be minimised to ensure net environmental benefits [11].
Furthermore, geopolitical and equity concerns add another layer of complexity. Critics warn of “green colonialism,” in which Global South countries supply raw materials while the Global North controls high-value technologies and patents [12]. With the rapidly increasing demand for energy/hydrogen technologies, coupled with South Africa’s rich mineral resources, harnessing groundwater for inclusive growth and the sustainable development of hydrogen is essential [9]. Despite a growing body of literature on green hydrogen in South Africa (Olifant et al., 2025 [3]; Hussein et al., 2025 [13]; Dyantyi-Gwanya et al., 2025 [4]), a critical gap persists: no published framework simultaneously integrates groundwater hydrogeology, electrolyser technology selection, structured economic assessment (including levelised cost of hydrogen, LCOH), environmental life cycle assessment (LCA), and policy governance within a single, operationalised decision architecture tailored to a water-constrained developing-country context. Existing global frameworks, such as IRENA’s hydrogen readiness assessments and the IEA’s technology roadmaps, do not account for South Africa’s specific aquifer characteristics, the dual water-energy stress of electrolysis in arid provinces, or the regulatory fragmentation between the Department of Water and Sanitation (DWS) and the Department of Mineral Resources and Energy (DMRE). Similarly, national-level reviews (e.g., the HySA Hydrogen Valley Report, 2021) [14] address individual pillars but do not integrate them into a structured, multi-dimensional framework with explicit causal linkages and assessment criteria.
Therefore, this systematic review and framework development was conducted to address this gap, providing policymakers, planners, and industry stakeholders with a structured, evidence-based assessment framework encompassing: (i) groundwater resource suitability and sustainability; (ii) electrolyser technology integration with groundwater quality constraints; (iii) LCOH modelling disaggregated by CAPEX, OPEX, and water treatment costs; (iv) comparative LCA of green, blue, and grey hydrogen pathways; and (v) policy and governance alignment for South Africa.
2. Research Themes and Publication Trends in Hydrogen as an Energy Vector
The current systematic review was conducted following PRISMA 2020 guidelines. The present systematic review was not pre-registered in PROSPERO or any other systematic review database. Nevertheless, the research protocol was a priori defined by the research team, which is presented in detail in this section. A desktop study was conducted to explore green hydrogen production in South Africa using the Preferred Reporting Items for Systematic Reviews and Meta-Analyses (PRISMA) methodology. The search was conducted across two major databases, being Scopus (SC) and Web of Science (WoS), yielding 1974 published articles between the period 2015–2025. Within this scope, a four-step approach was employed to describe the study flow, which included identifying studies through a database search, screening titles and abstracts, conducting an eligibility assessment by reviewing full-text articles, and finally, including studies that met all the criteria for data analysis. The analysis began by using the keywords and the OR Boolean operator within the search bar, across all fields. The study was then refined to include only articles published within the last 10 years (2015–2025), specifically open-access review articles in English, as outlined in the inclusion and exclusion criteria in Figure 1. The title and abstract screening was performed independently by two reviewers; disagreements were resolved by consensus with a third reviewer.
Figure 1.
Inclusion and exclusion criteria for PRISMA analysis.
Figure 2 presents the PRISMA (Preferred Reporting Items for Systematic Reviews and Meta-Analyses) methodology flow chart, which provides a standardised and transparent framework for documenting the study selection process. The search was further refined to focus solely on South Africa and to exclude subject areas such as medicine and the social sciences, resulting in a total of 1974 articles. The papers were then exported to EndNote in the RIS format for further refinement. Before the screening began, duplicate articles were automatically removed using an EndNote function. The first screening was conducted to remove articles that did not mention green hydrogen within their titles or abstracts. A second screening was then performed to remove articles that were not primarily South African studies or lacked experimental data to support further analysis. The total number of articles was reduced to 130 for evaluation. The PRISMA methodology is shown in Figure 2 below and the procedure was adapted from Yeboaa, Tetteh [15].
Figure 2.
PRISMA flow chart illustrating the sequential progression phases of the literature review.
Figure 2 shows the key phases of the literature review progression, including identification, screening, eligibility assessment, and final inclusion, which enhanced the reproducibility, transparency, and methodological rigour of the review process for the number of articles obtained (Table 1). Figure 3 illustrates the publication trend in green hydrogen research, based on papers from two major research databases: Web of Science (WoS) and Scopus. The trend showed that publications on green hydrogen gained traction across both databases from 2015 to 2024. This is evident in the gradual increase in the number of publications recorded, with Scopus recording the largest number. This increase in interest could be linked to the shift from fossil to renewable and sustainable energy sources.
Table 1.
Total number of articles retrieved from each database and corresponding search terms.
Figure 3.
Publication trend of green hydrogen from 2015 to 2025 obtained from Web of Science (WoS) and Scopus.
Quantitative Synthesis of Included Studies
After performing the aforementioned screening and selection procedure, the 130 selected papers were subjected to quantitative analysis to provide an overview of the existing body of knowledge on the production of green hydrogen in South Africa. Given that the included studies differed greatly in methodology, ranging from techno-economic analyses and life cycle analyses to bibliometric analyses, policy analysis, and stakeholder surveys, it would not have been appropriate to conduct a quantitative meta-analysis. Data extraction for all 130 articles that were included in the analysis was carried out by the first author utilising a structured Excel sheet that contains information such as authorship, year of publication, country of interest, type of study, LCOH, electrolyser energy efficiency, water demand, water footprint, CO2 footprint, and barriers to green hydrogen production; all data were cross-checked independently by the second author based on the original publications. Instead, the paper adopted a quantitative-descriptive approach whereby the most significant numerical parameters and recurring themes within the literature were identified and categorised under four main themes: (A) economic and cost parameters, (B) technical and process parameters, (C) resource availability and infrastructure-related issues, and (D) strategic considerations, barriers and policy gaps. Table 2 consolidates these findings, with each reported value attributed to its source to ensure traceability and reproducibility.
Table 2.
Quantitative synthesis of key parameters reported across the included studies, organised by thematic category.
2.1. Authors’ Keywords Analysis
The authors’ keywords related to green hydrogen production were analysed using VOSviewer® (Version 1.6.20). The minimum number of occurrences was set to 5 to eliminate duplicates, yielding 10,650 keywords; only 650 met the threshold. Figure 4 below shows a visualisation of the strength of cluster-linked keywords, coloured by publication year. It was found that the average number of publications with the first 12 most connected keywords ranged from 2019 to 2023. “South Africa” was the most prominent keyword, with 460 occurrences and a total link strength of 3578. This highlights the rise of strong green hydrogen publications in South Africa, which plays a vital role in the country’s green energy transition. The second-most-frequently linked keyword was “review,” with 213 occurrences and 3153 links to other keywords. Other keywords included “renewable energy” with 96 occurrences and 789 links, “energy conversion” with 8 occurrences and 90 links, and “hydrogen production” with 13 occurrences and 92 links. Keywords associated with green hydrogen, economic frameworks, green energy, sustainable development, and biofuel were prominently observed.
Figure 4.
Graphical presentation of the publication keywords overlay visualisation strength generated using VOS viewer using Scopus data [25].
2.2. Clusters of Research Keywords
Figure 5 shows the graphical intersection of keyword networks for the research frame of green hydrogen from groundwater research. The term co-occurrence analysis identifies several related research areas, particularly those relevant to groundwater-based green hydrogen research. A strong research emphasis on sustainable energy alternatives, with hydrogen as a key energy carrier, is evident in Cluster 2 (green), which highlights issues related to fossil fuels, energy systems, renewable energy resources, and hydrogen production. This cluster highlights the vital link between water resources and hydrogen generation, as it exhibits strong connections to Cluster 3 (dark blue), which focuses on wastewater management, groundwater, and water quality.
Figure 5.
Graphical intersection of keyword networks for the research field of green hydrogen from groundwater research from 2015–2025, showing 6 clusters generated using VOS viewer using Scopus data [25].
The overlap between these two clusters illustrates how groundwater can serve as a feedstock for electrolysis to produce hydrogen, provided that challenges related to pre-treatment and water quality are addressed. Green hydrogen’s significant role in reducing reliance on fossil fuels and lowering carbon emissions is further supported by cluster 1 (red), which focuses on climate change and environmental sustainability. Collectively, these clusters illustrate how South African research is increasingly integrating advances in renewable energy, groundwater sustainability, and climate change mitigation, establishing green hydrogen production from groundwater as a multidisciplinary field with important policy, environmental, and engineering implications. Table 3 summarises the research outcomes from each research theme and Cluster keywords.
Table 3.
South Africa research works associated with the research theme and cluster keywords.
2.3. Hydrogen Development Resources in Africa and Challenges
Sub-Saharan African countries, particularly South Africa, are richly endowed with critical minerals for green hydrogen development and have a long history of beneficiation (e.g., gold, platinum, steel, and iron). As demonstrated in Table 4, harnessing mineral resources in SSA can enhance green hydrogen infrastructure and technological development. However, persistent challenges, including an electricity supply crisis, rising energy costs, and logistics bottlenecks, have led to increased exports of unprocessed minerals. Addressing these challenges requires integrated policies that balance cost reduction, resource sustainability, and inclusive development to avoid the recurrence of historical extractive practices [30].
Table 4.
Sub-Sharan African countries’ mineral resources harnessed for hydrogen infrastructure.
The versatility of hydrogen extends to its capacity to decarbonise multiple sectors, including transportation, chemicals, and energy storage, as some Sub-Saharan African countries have expressed interest. As shown in Table 5, the prioritisation of hydrogen economy applications across Sub-Saharan African countries reflects each country’s economic structure, decarbonisation priorities, and existing industrial capabilities. This versatility fosters innovation and a sense of possibility in the energy sector by integrating intermittent renewable energy sources into the grid [7,31]. While renewable energy resources such as solar and wind are abundant, the initial costs of electrolysis technology and policy gaps hinder large-scale deployment [5,12]. Additionally, the shift from fossil-fuel-based industries to green hydrogen may disrupt traditional labour markets, necessitating workforce reskilling to mitigate socioeconomic impacts [32].
Table 5.
Prioritisation of the hydrogen economy in South Africa and other Sub-Saharan countries.
Sub-Saharan Africa’s (SSA) green hydrogen landscape is diverse and strategically positioned, with countries varying in productive capacities, institutional quality, market size, and industrial depth, as shown in Table 6. Abundant sunshine and strong wind resources, as well as strategic ports and coastal locations, shape the pace and scale of hydrogen deployment. However, turning this natural advantage into bankable projects depends on each country’s institutional and economic readiness. Most countries may have renewable energy resources (e.g., solar and wind), but lack the infrastructure, rules and regulations, and skilled personnel to build and operate large-scale plants safely and reliably [4].
Table 6.
Setbacks in advancing green hydrogen production in Africa.
Today’s challenge of institutional capacity to turn potential pilot projects to scale up is tailored to case-by-case agreements. Adding to the risk of investment is the creation of hydrogen-specific bylaws and standards covering production licensing, water abstraction, certification (including carbon intensity), storage and pipelines, transport, export rules, emergency response, and EHS (environment, health and safety) [4,5]. This requires regional bodies to build pipelines, secure offtake agreements, and attract long-term capital for investment. In essence, a hydrogen economy needs more than electrolyser infrastructure; it also requires a more reliable grid, storage and distribution networks, water treatment, and renewable electricity to coastal hubs [4,30]. For instance, South Africa’s coastal concept for integrated wind/solar power, seawater desalination, and an electrolyser to produce hydrogen at Saldanha-Namakwa for ammonia export [4]. However, investment in electricity networks, port logistics, and permitting has been identified as the principal bottleneck.
Furthermore, electrolysis requires pure water, which overburdens scarce supplies. However, in South Africa’s coastal hubs, desalination exploration is constrained by high power, utility, and logistics costs [4]. This prompts inland projects to adopt groundwater and reclaimed wastewater to meet stringent water-quality standards and licensing requirements [4]. Addressing financial risks and credible partnerships across the value chain of hydrogen is encouraged to blend finance, green bonds, public participation and risk mitigation (credit enhancement, political risk insurance, foreign-exchange hedging) [21]. This complements South Africa’s strategies, like the Hydrogen Society Roadmap and the Green Hydrogen Commercialisation Strategy, that set priorities for national development [33,34].
3. Hydrogen Production from Water Resources
3.1. South Africa’s Green Hydrogen Transition State
South Africa’s energy transition offers a sustainable pathway to decarbonisation, economic revitalisation, and energy security. The country’s abundant renewable energy resources, particularly solar and wind, position it as a potential leader in the global hydrogen economy [4,17]. The South Africa Hydrogen Valley Final Report, a comprehensive study on the potential of hydrogen in South Africa’s energy transition, highlights hydrogen’s strategic role in the shift toward a low-carbon economy and its use of platinum group metals (PGMs) for electrolyser and fuel cell production [21]. As a developing country, South Africa is well-positioned to become a leader in the hydrogen economy, owing to its abundant renewable energy resources. The country’s strategic efforts to decarbonise and promote economic growth are centred on leveraging these resources to produce hydrogen primarily via water electrolysis [3]. The abundance of sunlight in South Africa is a major driver for green hydrogen production by solar power utilisation. Annually, this country receives at least 2600 h of sunlight with 4.5–6.5 kWh/m2 of irradiation per day, which is the ideal solar radiation for photovoltaic installation [4,13]. The vast land available in sparsely populated arid or semi-arid regions is suitable for solar farms dedicated to hydrogen production [22]. The inherently low cost of solar energy positions solar power as the leading approach for powering electrolysers, making it the most economically viable option. In addition to solar resources, South Africa has an advantage in wind power, particularly along its extensive coastline. The coastal regions are known to receive winds of speeds up to 5.6–8.7 m/s up to a height of 10 m on an annual basis [13,35]. The annual capacity of wind energy is approximately 60 TWh. Because of wind’s versatility, it can serve as a complementary energy source to solar power, for instance, at night or during changing seasons and unprecedented weather patterns. This can enable a more durable and reliable system to power an electrolyser, thereby forming a hybrid system [22].
With South Africa continuing to expand wind farms, the country has set a goal to increase installations sevenfold by the year 2030, underscoring its role in the energy mix. Economically, green hydrogen presents significant opportunities for job creation and GDP growth [4]. The Hydrogen Valley initiative, a government-led program spanning Johannesburg, Durban/Richards Bay, and Mogalakwena/Limpopo, is projected to contribute $3.9–8.8 billion to GDP by 2050 and generate 14,000–30,000+ jobs annually across the hydrogen value chain [21]. These jobs span research, manufacturing, and operations and support a just transition in both urban and rural areas. Additionally, integrating hydrogen into key industries like mining, steel, and chemicals could enhance South Africa’s position in global green supply chains [3]. From an environmental perspective, green hydrogen is vital for decarbonising hard-to-abate sectors such as steel and petrochemicals, which contribute significantly to national emissions [13]. Pilot projects in hydrogen-powered mining trucks, buses, and industrial feedstock substitution (e.g., green ammonia) are key steps toward reducing carbon footprints [35]. Furthermore, the use of hydrogen in transport, particularly freight and port logistics, can improve urban air quality while aligning with South Africa’s climate commitments under the Paris Agreement [21].
3.1.1. South Africa’s Groundwater Source
South Africa faces significant water scarcity challenges due to its diverse climatic conditions, making groundwater a critical resource, particularly in arid regions. Globally, groundwater accounts for 12% of all freshwater, far exceeding the 1% found in rivers and lakes, underscoring the importance of sustainable management. In South Africa, approximately 70% of groundwater is allocated to agriculture, highlighting its role in food security and economic productivity [36]. The availability and distribution of groundwater are influenced by three key factors: rainfall patterns, geological conditions, and water infiltration capacity. Rainfall varies dramatically across the country, with some regions receiving abundant precipitation while others experience minimal rain. Geologically, South Africa’s aquifers are categorised into intergranular and combined intergranular-fractured systems, each with distinct yield and quality characteristics [37]. Regional variations in groundwater storage and recharge create complex distribution patterns. Groundwater can accumulate over centuries, but unsustainable extraction, as seen in Mogwadi/Dendron, Limpopo, has led to aquifer depletion. Quantitative assessments estimate South Africa’s groundwater storage at 235,500 Mm3, with an annual recharge of 30,520 Mm3. However, the sustainable yield, accounting for physical and environmental constraints, is significantly lower, with an Average Groundwater Exploitation Potential (AGEP) of 19,073 Mm3/a under normal conditions [37]. Coastal regions offer brackish water potential but require desalination, while the Northern Cape, with high solar irradiation (2282 kWh m−2 annually), is ideal for green hydrogen production but faces water scarcity [3]. Sustainable management is essential to prevent over-abstraction and long-term aquifer damage [1,2].
3.1.2. Governance of Groundwater in South Africa
Water governance and policy landscapes are crucial for protecting and managing South Africa’s precious water resources. This is reflected in the essential legislation, policies, and strategic tools in place to protect water resources in terms of use, development, conservation, management and control [38]. The water governance framework in South Africa is primarily founded upon the National Water Act 36 (NWA) of 1998 and the Water Services Act 106 (WSA) of 1997 [39] which are aligned with the National Water Resource Strategies (NWRS). The NWRS and its most recent amendment, National Water Resource Strategies Edition 3 (NWRS-3), function as a guide for water resource management within the country by promoting sustainable use and equitable access to water while supporting socio-economic co-benefits and growth [40]. Both national pieces of legislation allow the Minister of Water and Sanitation to act as a public trustee of water resources and facilitate just and sustainable uses available to all citizens [40]. This framework encourages a decentralised management system through institutions such as Catchment Management Agencies (CMAs) and Water User Associations (WUAs), in collaboration with municipalities and water utilities that deliver services under the WSA. The vital elements include national water resource strategies, water use licensing, and collaboration with transboundary water management bodies to manage shared resources. Hence, leveraging underground water resources offers greater advantages than using surface water alternatives, especially in regions with erratic climates.
In Sub-Saharan Africa, groundwater constitutes the largest freshwater reserve on the African continent and has significant potential to meet current and future water demands [41]. Therefore, the extraction of freshwater from underground aquifers and other subterranean water sources via wells and boreholes is used for a range of anthropogenic applications, including potable water, irrigation, flood control, and industrial uses [42,43]. South Africa’s Environmental Impact Assessment (EIA) regulations are primarily governed by the National Environmental Management Act (NEMA) 107 of 1998, under Section 24 of the Constitution. These regulations ensure that any activity with potential environmental consequences is properly assessed before implementation. Over the years (1997–2017), EIA laws and regulations have advanced toward sustainable development and cooperative environmental governance. Some of the key advancements in this area include the introduction of an integrated environment management (IEM) system in 2006, the introduction of three primary listing notices requiring a Basic Assessment Report (BAR), a Scoping and Environmental Impact Report (EIR), and activities needing a BAR only if in sensitive geographic areas [44], and, ultimately, the inclusion of the One Environmental System, pertaining to the context of mining and Environmental Management Programmes (EMPrs) [45].
3.1.3. Groundwater Sustainability Assessment for Hydrogen Production
Before groundwater can be proposed as a viable feedstock for hydrogen production, its sustainability under electrolysis-scale abstraction must be assessed quantitatively. Green hydrogen production via water electrolysis consumes approximately 9–11 kg of water per kilogram of hydrogen (including purification losses) [6,7], equivalent to approximately 10–13 L per kilogram of H2. For a 10 MW PEM electrolyser producing approximately 4.3 tonnes of H2 per day (at 50% capacity factor), the daily water demand for feedstock is approximately 43,000–56,000 L (0.043–0.056 ML/day), rising to approximately 0.43–0.56 ML/day at 100 MW scale and 4.3–5.6 ML/day at 1 GW scale.
South Africa’s total estimated groundwater storage is 235,500 Mm3, with an annual recharge of 30,520 Mm3 and an Average Groundwater Exploitation Potential (AGEP) of 19,073 Mm3/a under normal conditions [21]. At the national scale, hydrogen production at 1 GW capacity (approximately 1.6 ML/day demand) would represent approximately 0.003% of the national AGEP—a negligible fraction. However, national averages mask severe regional heterogeneity. In the Northern Cape—South Africa’s most promising hydrogen production zone due to its exceptional solar irradiation (2282 kWh/m2/a) and available land—groundwater recharge rates are among the lowest in the country (<5 mm/a in many areas), and aquifer yields are limited and poorly characterised. In such areas, a single 10 MW project could represent a locally significant abstraction fraction, particularly where competing agricultural demands already approach or exceed sustainable extraction limits.
Approximately 70% of South Africa’s groundwater is allocated to agriculture [22], primarily for irrigation in the Western Cape, Limpopo, and Northern Cape provinces. In the Northern Cape’s Orange River Irrigation Area and the Limpopo Basin, groundwater tables have been declining due to sustained over-abstraction, as demonstrated by the Mogwadi/Dendron case study cited in Section 3.1.1 [35]. Introducing hydrogen-scale electrolysis abstraction into already-stressed aquifer systems without prior sustainability assessment risks: (i) accelerating aquifer depletion and reducing long-term sustainable yield; (ii) intensifying competition with agricultural users, who hold existing water use licences under NWA Section 21(a) allocations; (iii) promoting saline intrusion in coastal and brackish aquifer zones as freshwater pressure heads decline; and (iv) disrupting groundwater-dependent ecosystems (GDEs), particularly riparian vegetation in semi-arid regions [46].
To operationalise sustainability screening within the proposed framework, the Groundwater Sustainability Index (GSI) is defined as: GSI = (Q_H2/AGEP_local) × 100%, where Q_H2 is the annual hydrogen-related abstraction volume (ML/a), and AGEP_local is the local-scale AGEP estimate for the target aquifer (ML/a). Projects with GSI < 1% are classified as low sustainability risk; GSI 1–5% as medium risk, requiring hydrogeological monitoring; and GSI > 5% as high risk, requiring an aquifer recharge assessment and stakeholder consultation before licensing. For inland hydrogen hubs in water-scarce provinces, integration with desalination or reclaimed wastewater systems is recommended to reduce dependence on groundwater, as discussed in Section 6.2.
3.2. Groundwater as Electrolysis Feedstock
Groundwater is a viable and sustainable water source for green hydrogen production via electrolysis, particularly in water-scarce regions such as South Africa [4]. Unlike surface water, groundwater typically offers higher quality due to natural filtration, reducing the need for extensive pre-treatment [47]. This makes it an attractive option for electrolysis, which requires clean, deionised water to ensure efficient operation and minimise damage to electrolyser components [48]. However, large-scale groundwater use must be carefully managed to avoid exacerbating water stress. Excessive extraction can lead to ecological degradation, including aquifer depletion and saline intrusion, as well as socioeconomic conflicts [47].
In South Africa, where water scarcity is already critical, balancing energy needs with sustainable water management is essential [3]. Technologically, groundwater is less energy-intensive to process compared to seawater, which requires costly desalination and reverse osmosis (RO) systems [4]. Groundwater primarily needs RO treatment, making it a cost-effective option for inland electrolysis facilities [48]. Saline groundwater, although unsuitable for direct electrolysis, can be used in cooling systems, thereby reducing freshwater demand [49]. Groundwater suitability depends on hydrogeological characteristics, including salinity, contaminants, and recharge rates [1,2].
Pre-treatment or desalination may be required, particularly for sensitive technologies such as proton exchange membrane (PEM) systems [24]. Policymakers and industry stakeholders must prioritise regions with sustainable groundwater resources and integrate groundwater into energy system models to align with environmental and socioeconomic goals [5]. Nevertheless, in the siting of hydrogen plants, water availability and security concerns, feedwater chemical composition, and thermal management requirements pose fundamental challenges that must be addressed systematically. While individual projects face unique site-specific constraints, common themes emerge across multiple developments, suggesting opportunities for integrated design approaches that yield mutual benefits for both water treatment infrastructure and hydrogen production operations [50]. Water serves multiple essential functions within the emerging hydrogen economy. In this context, high-purity demineralised water or groundwater serves as the primary feedstock for electrolysis processes, requiring substantial volumes for cooling. Additionally, the purification of raw water sources generates concentrated waste streams, particularly brine from desalination units, which pose environmental management challenges that require careful consideration.
3.2.1. Groundwater Consideration as a Hydrogen Resources Risk
Groundwater contamination poses significant risks to sustainable hydrogen production, particularly in water-stressed regions. Key factors to consider for using groundwater as a hydrogen resource are shown in Table 7. Inland desalination plants further threaten groundwater quality through brine infiltration [51]. Over-abstraction risks long-term aquifer depletion, disrupting local ecosystems and livelihoods, particularly in arid and semi-arid regions such as South Africa [51,52]. Here, electrolysis requires substantial amounts of feedwater, which can exacerbate aquifer stress in areas with limited recharge rates or competing demands [51,53]. Contamination risks arise from desalination byproducts, such as toxic brine, which can pollute marine and terrestrial ecosystems if improperly disposed of [51]. Additionally, industrial processes such as desulphurisation in steam methane reforming (SMR) or cooling-water discharges may introduce heavy metals (e.g., zinc) or biocides into groundwater [54]. Legacy contaminants, such as polychlorinated biphenyls (PCBs) or asbestos from old mine sites, also require specialised disposal to prevent groundwater infiltration [53]. This necessitates rigorous wastewater management and pre-treatment. Mitigation strategies include sustainable extraction limits, advanced monitoring systems, and alignment with regulatory frameworks such as the Industrial Emissions Directive (IED) and ISO 14001 [2,53]. For South Africa, groundwater spatial data on water quality, renewable energy potential, and proximity to infrastructure are critical for balancing hydrogen production with sustainable water use [1,31].
Table 7.
Factors to consider for using groundwater as a hydrogen resource.
3.2.2. Hydrogeological Characteristics Impact of Groundwater on Electrolysis
The suitability of groundwater for electrolysis depends on hydrogeological characteristics such as salinity and contaminant levels [55]. Table 8 shows the impact of water quality parameters on different types of electrolysers. High salinity, typical in coastal and brackish aquifers, can hinder electrolysis efficiency by increasing energy consumption and promoting undesirable side reactions like chlorine gas formation [56,57]. Contaminants such as heavy metals (e.g., zinc, copper), sulphides, and organic impurities can degrade electrolyser membranes and catalysts, thereby reducing system longevity [58]. For instance, PEM electrolysers tested with impure water showed a voltage increase to 3 V compared to 1.8 V for ultrapure water, highlighting the need for pre-treatment [56]. Pre-treatment methods like reverse osmosis or electrodialysis can mitigate these issues but add to operational costs, estimated at USD 0.53–1.50 per m3 [4,59]. Emerging technologies, such as redox-mediated electrolysers, may enable direct seawater use, reducing freshwater demand [4]. A groundwater feasibility study that integrates salinity, recharge rates, and environmental limits is essential for identifying optimal sites for hydrogen production while ensuring sustainability [1,37].
Table 8.
Characteristics of water and their impact on electrolyser types.
3.2.3. Groundwater Treatment for Hydrogen Production
Emerging technologies such as membrane distillation (MD) and forward osmosis (FO) offer advantages for renewable energy integration, but face scalability challenges [60]. In regions such as South Africa, where water scarcity is a concern, integrating renewable energy (e.g., solar, wind) with desalination can mitigate energy costs, though intermittent supply remains a challenge [60]. The water treatment systems (Figure 6) are designed to process water and employ specific pre-treatment methods before entering a common polishing stage to produce ultrapure water suitable for electrolysis. For groundwater to serve as a viable feedstock, pre-treatment is often necessary to remove impurities, including iron, manganese, and heavy metals.
Figure 6.
Schematic diagram of groundwater treatment technologies for hydrogen production (designed with Copilot AI 5.5 Thinking tool).
Figure 6 shows treatment techniques employed for water treatment to meet hydrogen production requirements. Key technologies for suspended-solids removal include coagulation, flocculation, and filtration, followed by reverse osmosis (RO) or electrodialysis (ED) to achieve the required purity for proton exchange membrane (PEM) electrolysers [55,60]. RO is the most established desalination method, but it is energy-intensive (2–5 kWh/m3), whereas ED is better suited to brackish water due to its lower energy requirements [60]. However, desalination costs for groundwater treatment add approximately USD 0.53–1.50 per m3, increasing green hydrogen production costs by 0.1% compared to freshwater use [3,59]. Pre-treatment is critical to ensure optimal electrolyser performance and longevity, particularly for PEM systems, which are sensitive to contaminants [2,56]. The water quality parameters measured across these sources vary significantly, necessitating tailored treatment approaches [54]. The total suspended solids in this source range from 1 to 30 mg/L, while mineral content, including calcium (82–129 mg/L) and total hardness (1.6–3.19 mval/L), also requires attention during subsequent treatment stages [55]. The groundwater source exhibits consistent quality, with a conductivity of 380 μS/cm and a neutral pH of 7.4. The groundwater source has relatively low suspended solids content and moderate mineral levels, with chloride at 12 mg/L and sulphate at 65 mg/L [55]. Likewise, treated wastewater or surface water requires more intensive pre-treatment using ultrafiltration (UF) and ultraviolet (UV) disinfection. This combination effectively removes particles, pathogens, and organic matter. Surface water quality parameters show considerable variation, with pH ranging from 6.8 to 10.1 and moderate mineral content. The silica content in surface water (20–24 mg/L) is particularly noteworthy, as it must be reduced to prevent scale formation in electrolytic equipment [55]. Likewise, seawater represents the most challenging source, requiring desalination through reverse osmosis. The table data for mine water from the dewatering of non-working galleries demonstrates the complexity of treating highly mineralised water sources. This water exhibits high conductivity (793–908 μS/cm), extremely elevated suspended solids (556–664 mg/L), and high concentrations of various minerals, including chlorides (54–63 mg/L), sulphates (88–187 mg/L), iron (4–12 mg/L), and manganese (0.15–3.7 mg/L). The total hardness of this source (6.6–7.4 mval/L) is significantly higher than that of other sources [55]. The demineralisation system must handle the wide range of mineral concentrations present across different source waters [55]. The treatment system must consistently deliver this quality regardless of which source water is being processed, ensuring reliable operation of the electrolysis equipment and preventing premature equipment failure or reduced efficiency [61].
4. Electrolysis Integration with Groundwater for Hydrogen Production
4.1. Electrolyser Types and Conditions
Electrolyser selection and integration determine the feasibility of producing green hydrogen from treated groundwater. As shown in Figure 7, the three most dominant electrolysis methods are alkaline water electrolysis (AWE), proton exchange membrane (PEM), and solid-oxide electrolysis (SOE). Electrolysis integration with renewables (solar PV, wind, hybrid systems) requires power quality for PEM stacks, rectifiers for AWE, and thermal integration opportunities for SOE. The AWE (Figure 7a) utilises an alkaline electrolyte (e.g., KOH or NaOH) and nickel-based electrodes. The electrode chambers are separated by a porous diaphragm, allowing ionic flow while simultaneously separating the gas evolution reactions and, therefore, the production [62,63]. In contrast, the PEM (Figure 7b) utilises a polymer, such as polyfluoroalkyl substances, that serves as both the electrolyte and the gas-separation unit. This system requires high-purity deionised water as the feedstock and operates under highly acidic conditions. The electrodes are coated with expensive catalysts, especially those from the platinum group, to provide corrosion resistance and facilitate reactions [64]. The reliance on platinum-based catalysts and water purification makes PEMs more costly than AWEs; however, they offer significant advantages, such as high current densities, better response to dynamic power input (ideal for renewable energy integration), high-purity hydrogen, and a compact design [65].
Figure 7.
Schematic of an (a) alkaline water electrolysis (AWE) AWE, (b) proton exchange membrane (PEM), (c) anion exchange membrane (AEM) electrolyser, and (d) solid-oxide electrolysis (SOE) systems [66,67,68].
Table 9 shows that technology reviews and assessments indicate that AWE is mature and cost-effective, but it requires careful management of carbonates and impurities. PEM offers a compact design, dynamic operation, and higher-purity requirements. SOE offers high efficiency by operating at elevated temperatures but remains less mature for commercial deployment [6,7,9,10]. Currently, pilot-scale systems are available, as this technology is still in the early stages of commercial development and has been proven to deliver the highest efficiency [67]. Anion exchange membrane electrolysis (AEM, Figure 7c) is an emerging technique that aims to combine the benefits of PEM and AWE. On the other hand, SOE (Figure 7d) employs a solid-polymer membrane that conducts hydroxide ions, similar to the electrolyte in an AWE [62]. This approach has the potential to achieve high efficiency and durability while using low-cost catalysts. However, AEM technology remains in the developmental stage and has not yet been widely commercialised. Significant challenges remain, particularly regarding the membrane’s chemical stability and durability under alkaline conditions [69]. Although AWE is a robust, commercial technology, it has limitations in dynamic operations, including low current densities, a limited operating range, and the potential for gas crossover through the chambers [70].
Table 9.
Electrolysis technologies and associated challenges.
Quantitative Impact of Groundwater Impurities on Electrolyser Performance
The performance impacts of specific groundwater impurities on PEM and AWE electrolyser systems have been quantitatively characterised in the literature and are summarised here in the context of South African groundwater quality profiles. PEM electrolysers tested with impure feedwater demonstrated a cell voltage increase from the nominal 1.8 V (ultrapure water) to approximately 3.0 V under contaminated conditions, representing a 67% voltage increase that directly increases specific energy consumption and reduces hydrogen purity [52]. This voltage degradation occurs via several impurity-specific mechanisms.
Chloride ions (Cl−): At concentrations exceeding 0.05 mg/L in PEM feedwater, chloride initiates corrosion of the titanium porous transport layer (PTL) and bipolar plates, accelerating membrane degradation. South African groundwater in the Northern Cape coastal hinterland and semi-arid zones can contain 50–200 mg/L Cl− [51], requiring RO treatment to reduce this to <0.05 mg/L—a reduction factor of approximately 1000–4000×. AWE systems tolerate higher chloride levels (<0.5 mg/L) due to the use of corrosion-resistant nickel electrodes and KOH electrolyte, but still require pre-treatment for typical South African brackish groundwater. Iron and manganese (Fe2+/3+, Mn2+): Concentrations exceeding 0.01 mg/L Fe in PEM systems poison the platinum-group metal catalysts at the anode, reducing oxygen evolution reaction (OER) activity and increasing overpotential. The groundwater chemistry reported in Section 3.2.3 (Fe: 4–12 mg/L in mine-impacted water; 0.2–0.8 mg/L in typical inland South African groundwater) requires iron removal to <0.01 mg/L, achievable via oxidation-filtration or greensand filtration upstream of RO. Stack lifetime reduction from iron contamination is estimated at 15–30% over a 10-year operating period [54].
Hardness (Ca2+, Mg2+, as CaCO3): South African groundwater hardness values of 1.6–3.19 mval/L (equivalent to 80–160 mg/L CaCO3) [51] exceed the PEM threshold of <0.1 mg/L CaCO3, requiring water softening and RO/EDI. Without treatment, calcium carbonate scaling on internal membrane surfaces reduces ion transport efficiency and accelerates membrane degradation. Silica (SiO2): Surface water silica concentrations of 20–24 mg/L reported in Section 3.2.3 [51] significantly exceed the PEM threshold of <0.1 mg/L, necessitating RO treatment followed by EDI polishing. Silica breakthrough into the electrolyser stack causes irreversible fouling of the Nafion membrane proton exchange sites.
The integration of renewable energy variability also affects electrolyser performance under South African operating conditions. AWE systems have a minimum load threshold of approximately 20–40% of rated capacity and a slow dynamic response time (minutes), making them susceptible to gas crossover at low-load operation during periods of low solar irradiation [66]. PEM systems, by contrast, can operate from 5–10% to 160% of rated capacity with response times of seconds, making them better suited to intermittent renewable generation profiles. However, the increased frequency of load cycling under variable renewable generation accelerates membrane fatigue in PEM stacks, with studies reporting a degradation rate of 2–5 µV/hour under dynamic operation compared to <1 µV/hour under steady-state conditions. For South African solar-coupled systems with a typical daily irradiation profile (6–8 peak sun hours), this implies approximately 80–120 daily load-cycle events per year, equivalent to 800,000–1,200,000 operating cycles over a 10-year lifetime—a degradation factor that should be incorporated into LCOH modelling through adjusted stack replacement intervals.
4.2. Electrolyser Types and Water Resources Required
Hydrogen production places significant demands on water resources, and these requirements vary by technology and energy source, as shown in the table. Green hydrogen produced via water electrolysis powered by renewable energy is particularly water-intensive because it uses purified water as both a feedstock and a coolant [47]. PEM systems require the most water (58.4–74.1 L/kgH2) due to higher cooling demands, while AWE falls in the mid-range (49.37–66.96 L/kgH2). SOEC systems have the lowest water requirements (21.4–39.7 L/kgH2) [51]. Because renewable energy is intermittent, green hydrogen plants typically operate at lower load factors, around 50%, compared with fossil-based routes. This variability influences overall water demand and infrastructure planning, especially when groundwater is the primary source. Seawater consistently requires the highest water input across all technologies due to additional desalination and treatment processes, with increases of 36–59% compared to potable water sources [50]. For green hydrogen production, the choice between freshwater sources (potable, surface, or groundwater) results in minimal variation (typically within 2–4%), making water source selection primarily dependent on local availability and environmental considerations rather than efficiency differences [24,50].
4.3. Water–Energy Nexus: Integrated Mass and Energy Balance
Green hydrogen production from groundwater involves a coupled water–energy system in which the energy demand for water pre-treatment is non-trivial and must be incorporated into total system energy accounting and LCOH calculations. Figure 6 presents a simplified mass and energy balance for a representative 10 MW AWE system using brackish groundwater (TDS 1000–5000 mg/L) as feedstock.
Mass balance (per kg H2 produced): Raw groundwater input to RO pre-treatment system: 18–22 L/kg H2 (accounting for 75–80% RO recovery efficiency). RO permeate (treated water, conductivity < 50 µS/cm): 14–18 L/kg H2. RO concentrate/brine discharge: 4–5 L/kg H2. EDI/DI polishing water loss: 0.5–1 L/kg H2. Net electrolyser feedwater consumption: 9–11 L/kg H2 (theoretically 9 L/kg H2; additional losses from purification and cooling account for the remainder). Cooling water circulation (closed loop, make-up only): 2–4 L/kg H2. Total gross groundwater abstraction: 20–26 L/kg H2.
Energy balance (per kg H2 produced): Electrolysis energy (AWE at 55 kWh/kg H2) represents the dominant energy input. Groundwater pumping from borehole (estimated 50–150 m depth, pump efficiency 65%): 0.05–0.15 kWh/kg H2 (0.09–0.27% of total). RO pre-treatment (2–5 kWh/m3 of permeate, at 15 L/kg H2 feedwater): 0.03–0.08 kWh/kg H2 (0.05–0.14% of total). EDI polishing: 0.01–0.02 kWh/kg H2. Electrolyser cooling (AWE, water-cooled): 0.5–1.0 kWh/kg H2. Hydrogen compression (30 to 350 bar): 2.5–3.5 kWh/kg H2. Total system energy: approximately 58–65 kWh/kg H2 for the AWE scenario with brackish groundwater treatment.
The RO energy penalty (0.03–0.08 kWh/kg H2) is thus equivalent to a LCOH increment of approximately USD 0.001–0.005/kg H2 at a renewable electricity price of USD 0.04/kWh—confirming that while water treatment represents a modest absolute energy overhead (<0.2% of total), it has a disproportionate influence on groundwater sustainability and brine disposal costs at scale. For saline groundwater requiring full seawater-level desalination (SWRO at 3–5 kWh/m3), the energy penalty rises to 0.05–0.11 kWh/kg H2, and the associated brine disposal cost adds USD 0.01–0.04/kg H2.
These interactions constitute the water–energy nexus of the system: Increasing groundwater salinity increases RO energy demand, raises brine disposal costs, and—if abstracting from a declining aquifer—progressively elevates salinity in the remaining resource, compounding treatment requirements over time. The framework in Section 6.2 incorporates these feedback dynamics as a constraint (C1: abstraction ≤ sustainable yield) and recommends closed-loop brine management (e.g., brine crystallisation, sodium bicarbonate by-product recovery) as a co-benefits strategy for inland projects.
5. Environmental and Economic Impact of Groundwater for Hydrogen Production
5.1. Life Cycle Assessment of Green, Blue and Grey Hydrogen
This section presents a structured and comparative environmental assessment of green, blue, and grey hydrogen production from groundwater, guided by the Life Cycle Assessment (LCA) framework in accordance with ISO 14040/14044:2006, Environmental management, Life cycle assessment, Principles and framework, developed by the International Standardisation Organisation (ISO), Geneva, Switzerland. In addition, a harmonised and scientifically robust LCA framework enhances transparency, consistency, and comparability in evaluating environmental impacts, thereby strengthening the assessment of industrial process emissions and supporting sustainable decision-making in green hydrogen systems [73]. The system boundary is defined as cradle-to-gate: from groundwater extraction and pre-treatment, through electrolysis (green) or steam methane reforming with carbon capture (blue). To compress hydrogen at the plant gate to 350 bar, post-gate compression, distribution, and end-use were excluded from the system boundary, consistent with LCA studies and standard practice for hydrogen production by Roy et al. [74] and Weidner et al. [75].
The functional unit is 111 kg of compressed hydrogen (99.97% purity, 350 bar) at the plant gate. Background inventory data are drawn from ecoinvent v3.9, supplemented by published primary LCA data for South African grid electricity (Eskom CO2 emission factor = 0.928 kg CO2-eq/kWh, 2022; DWS, 2024 [9]) and solar PV generation (0.041 kg CO2-eq/kWh, consistent with Matenda, 2024 [76]). Foreground data for electrolyser manufacturing, water treatment chemicals (RO membranes, antiscalants), and groundwater extraction (pump energy) are sourced from published engineering datasets [11,77,78]. Table 9 presents the comparisons for the quantified midpoint characterisations of green, grey, and blue hydrogen pathways from groundwater. Following ISO 14040/14044 standards, this is a cradle-to-gate assessment, based on a functional unit of 111 kg of hydrogen, using ReCiPe 2016 midpoint and endpoint methods from the Hierarchist perspective [79].
Environmental impacts are characterised using ReCiPe 2016 midpoint and endpoint methods from the Hierarchist perspective [76]. Midpoint impact categories assessed are: global warming potential over 100 years (GWP100, kg CO2-eq), stratospheric ozone depletion (kg CFC-11-eq), freshwater eutrophication (kg P-eq), terrestrial acidification (kg SO2-eq), and water consumption (m3). Endpoint damage categories are: human health (DALYs), ecosystems (species × year), and resource scarcity (USD2013). These results are presented in Table 10 (midpoint) and Figure 8 (endpoint). The authors acknowledge that this assessment draws on secondary inventory data and that a primary LCA incorporating site-specific South African groundwater quality, regional infrastructure, and measured electrolyser performance data represents an important future research direction, as noted in the Conclusions. A life cycle assessment (LCA) evaluates impacts such as carbon footprint (GWP100), water scarcity (including consumptive use), biodiversity and ecosystem quality, and land use.
Table 10.
ReCiPe 2016 Midpoint characterisation of hydrogen routes.
Figure 8.
ReCiPe 2016 Endpoint impact of green, blue and grey hydrogen.
Hydrogen production pathways are commonly classified by “colour labels” that reflect the carbon intensity, energy source, and sustainability of the production route by a feedstock. The most common colours in use involve fossil fuel-based technologies because of matured infrastructure [80]. Grey hydrogen currently accounts for over 95% of the world’s hydrogen supply, which is produced primarily through steam methane reforming (SMR) of natural gas. It contributes substantial carbon emissions, averaging about 8 kg CO2/kg H2. Although grey hydrogen is the cheapest to produce at 0.7–2.3 USD/kg due to established infrastructure and abundant natural gas reserves, its environmental footprint reinforces the need for cleaner alternatives [81]. Blue hydrogen (Figure 8) occupies an intermediate position, combining conventional SMR with carbon capture, utilisation, and storage (CCUS) technologies to reduce emissions to 1–2.4 kg CO2/kg H2. This pathway offers a transitional solution that leverages existing fossil-fuel-based infrastructure while mitigating environmental impact. The production cost ranges from 1–3.2 USD/kg, reflecting the added expense of carbon capture systems [82]. While not entirely carbon-neutral, blue hydrogen can provide a viable bridge toward full adoption of green hydrogen as renewable energy penetration increases and electrolyser technologies mature. To mitigate carbon emissions, blue hydrogen integrates carbon capture, utilisation, and storage (CCUS) with grey hydrogen production methods [83]. However, there is consensus that green hydrogen is produced from renewable energy with no carbon emissions, whereas grey and blue hydrogen are produced from fossil fuels, yielding the highest carbon emissions [46,84,85]. Due to the developed infrastructure and established economy for fossil-fuel-based hydrogen production, grey and blue hydrogen are the cheapest forms to produce amongst the other colours [86]. Currently, researchers are more focused on green hydrogen because it offers the greatest promise as a centralised, clean energy production method. Green hydrogen produced by water electrolysis powered by renewable energy is considered the only truly zero-emission pathway, but it faces kinetic, economic, and scalability barriers that must be addressed [50]. Green hydrogen, in contrast, is produced via water electrolysis powered exclusively by renewable energy sources such as solar, wind, or hydropower. Because the process requires no fossil fuels, green hydrogen offers a near-zero-emission pathway and is considered central to global decarbonisation strategies. However, the cost remains relatively high—typically 1.9–8.2 USD/kg—depending on electricity prices, electrolyser efficiency, and renewable energy availability [82]. Ongoing technological advancements and decreasing renewable energy costs are expected to reduce these values, making green hydrogen increasingly competitive.
The life cycle inventory data for the three hydrogen production pathways is tabulated in Table 11 and forms the basis for the endpoint and risk assessment impacts. The upstream process data for the technosphere inputs and outputs were sourced from the Ecoinvent 3 database. The analysis below follows these inventory flows.
Table 11.
Summary of life cycle inventory (LCI).
- Global warming, human health
Grey hydrogen (Figure 8) accounts for the largest share of this impact category (77.8%), followed by blue hydrogen (14.5%) and green hydrogen (7.3%). This is likely due to grey hydrogen being produced by SMR without carbon capture, which releases all CO2 produced by the process, along with potential methane leakage. Blue hydrogen reduces these impacts through CCS, assumed to be 90% effective in this analysis, although methane leakage still occurs. Green hydrogen, generated by photovoltaic solar energy and groundwater electrolysis, has minimal operational emissions. Its carbon footprint mainly comes from manufacturing PV modules, electrolysers, and water treatment, but this is minor compared to the carbon footprint of grey and blue H2. Roy, Antonini [74] identify grey hydrogen as the most carbon-intensive, while blue hydrogen falls into an intermediate slot depending on capture efficiency and methane leakage rates. Green hydrogen is shown to have substantially lower emissions, primarily due to lower emissions from infrastructure and raw material acquisition.
- Stratospheric ozone depletion, human health
Grey hydrogen (Figure 8) accounts for 70.1%, blue hydrogen for 22.6%, and green hydrogen for 7.3%. These impacts likely stem from the production of chemicals and refrigerants in fossil-fuel-intensive systems. The SMR pathways are linked to petrochemical activities by feedstocks and grid power to drive the process. Green hydrogen’s contribution reflects the use of antiscalants within the system and the possible use of refrigerants during PV and electrolyser manufacturing, but it remains negligible relative to fossil routes. Fossil fuel-based production chains are well known to generate larger ozone-depleting substance equivalents, especially via industrial cooling and chemical feedstocks [77].
- Ozone formation, human health
Grey H2 (Figure 8) contributes 73.5%, blue 19.9%, and green 6.6%. Ozone formation is linked to emissions of precursors such as NOx and VOCs, with grey H2 accounting for the largest share due to the combustion of natural gas in the SMR process and along the natural gas supply chain. Blue hydrogen reduces some combustion-related emissions but requires a higher energy input for its CCS system. Green hydrogen’s emissions are minor, likely stemming from component manufacturing, groundwater extraction, and the transportation of feedstock. The analysis indicates that fossil fuels are the primary contributors to ozone formation, whereas electrolysis significantly reduces such emissions.
- Freshwater and marine eutrophication, ecosystems
Regarding freshwater (Figure 8), grey H2 accounts for 69.6%, blue 24.7%, and green 5.7%, whereas in marine systems, grey H2 accounts for 83.8%, blue 14.3%, and green 1.9%. Grey H2’s impact contribution comes from phosphorus- and nitrogen-related emissions, likely stemming from fossil fuel combustion and natural gas processing. Blue reduces these through CCS, with approximately 90% capture efficiency, but remains substantially higher than green, which has only emissions from supply and material acquisition. Elrhoul, Romero Gómez [87] attribute the main cause of eutrophication to NOx emissions from combustion in fossil-fuel systems, whereas renewable pathways, such as PV electrolysis, make minimal contributions beyond their manufacturing processes.
- Freshwater and marine ecotoxicity, ecosystems
For freshwater, grey H2 (Figure 8) accounts for 84.4%, blue 14%, and green 1.5%; marine shows grey at 84.2%, blue at 14.2%, and green at 1.6%. Grey and blue hydrogen impacts arise from metals, solvents, and organic emissions during fossil fuel extraction and refining, as well as from direct emissions. Green hydrogen’s contribution is minor, mainly from materials processing and groundwater boring. Ecotoxicity is generally higher in fossil fuel processes due to metal depletion, chemical releases, and industry, while green hydrogen’s impact, mostly from metal use in PV materials and electrolysers, remains low overall [75].
- Land use, ecosystems
The analysis indicates that grey H2 (Figure 8) accounts for 31.1%, blue for 19.2%, and green for 49.7%. The substantial land-use impact of green H2 is likely attributable to PV solar generation, which requires large areas of land for efficient energy production. The impacts of grey and blue can be attributed to the occupation of land by fossil-fuel infrastructure, along with associated modifications to industrial and agricultural land. Fossil fuel infrastructure requires less space than renewable energy infrastructure, owing to the higher energy density of its feedstock.
- Fossil resource scarcity, resources
The analysis (Figure 8) shows grey H2 at 84.5%, blue at 14.0%, and green at 1.5%. This sequence directly reflects the dependence of the processes on their feedstocks. Grey H2 relies on fossil fuels as both feed and energy sources, while blue H2 reduces this dependence but still consumes natural gas and electricity for capture. Green H2 utilises only minimal fossil resources in its supply chain, likely from groundwater extraction and related operations.
- Water consumption, human health and ecosystems
The impact category (Figure 8) shows grey at 57.4%, blue at 26.5%, and green at 16.1% regarding human health. Grey hydrogen’s water footprint comes from steam generation and cooling water demands, with blue’s requirements being lower due to CCS operations reducing steam and cooling demands [18]. Green hydrogen requires water for electrolysis and purification, as well as for material production, resulting in a greater environmental impact than previous averages. For the ecosystem’s impact, grey accounts for 29.4%, blue for 20.4%, and green for 50.2%. The significant impact of green hydrogen likely stems from its use of groundwater, disrupting the surrounding ecosystems, reducing long-term aquifer storage, and leading to detrimental effects for rivers, wetlands, and vegetation [88].
5.2. Risk Assessment of Green, Blue and Grey Hydrogen from Groundwater
The risk assessment (Figure 8) of green, blue, and grey hydrogen production from groundwater must consider impacts on human health, ecosystems, and long-term resource security. Green hydrogen, generated via water electrolysis, generally presents the lowest contamination risk because the process requires high-purity feedwater and produces minimal chemical by-products. However, extensive groundwater abstraction can result in lowered water tables, increased competition with local communities, and alterations in aquifer recharge dynamics. Improper well construction, leakage of pre-treatment chemicals, or saline intrusion may indirectly affect human health and freshwater ecosystems. On the other hand, blue hydrogen produced from natural gas with carbon capture introduces more complex risk pathways. Groundwater may be contaminated by substances associated with natural gas extraction, including methane, volatile organic compounds, or trace metals. Additionally, the use of amines and solvents in CO2 capture presents potential hazards in the event of spills or leaks. Geological storage of CO2 may increase the risk of brine displacement or upward migration, thereby degrading groundwater quality.
Conversely, grey hydrogen, derived from fossil fuels without carbon capture, entails the highest environmental burden. The process demands substantial quantities of cooling water and may discharge effluents containing heat, chemicals, or dissolved solids. Increased groundwater abstraction for large-scale production can exacerbate groundwater depletion, threaten ecosystems that depend on stable water levels, and reduce water availability for domestic and agricultural uses. Collectively, these risks underscore the importance of implementing stringent controls and adopting integrated water-resource planning.
The water resource implications of hydrogen technology choice extend beyond electrolysis to the broader technology pathway decision. Blue hydrogen produced via steam methane reforming (SMR) with carbon capture operates at high utilisation rates (typically 95%), with water demand primarily for steam generation and cooling (6–20 L/kg H2, lower than electrolysis) [47]. However, blue hydrogen’s reliance on carbon capture introduces additional water demands for solvent regeneration and CO2 compression cooling, and its dependence on natural gas infrastructure poses methane leakage risks that complicate its water-energy-climate trade-off. Grey hydrogen, without carbon capture, has the lowest direct water demand but the highest environmental burden. For South Africa’s inland groundwater context, the choice between green and blue hydrogen must therefore account not only for direct water consumption but also for the full suite of groundwater sustainability, emissions, and infrastructure constraints described in this framework.
- Human Health
Grey hydrogen (Figure 9) accounts for 76.9%, blue for 16.7%, and green for 6.4% of human health damage, highlighting grey hydrogen’s impact on climate change, ozone depletion, eutrophication, and ecotoxicity. Blue reduces some effects via carbon capture but still risks methane leakage. Green hydrogen’s footprint mainly comes from PV, electrolyser manufacturing, and water purification, with fossil-based hydrogen driving most impacts through emissions and pollutants. Green hydrogen remains lowest overall, except for material supply impacts on chains [11,89].
Figure 9.
Risk assessment impact of green, blue and grey hydrogen.
- Ecosystems
Grey hydrogen (Figure 9) accounts for 72.9%, blue hydrogen 16.8%, and green hydrogen 10.3%. This section covers damages such as eutrophication, ecotoxicity, land use, and water consumption. Grey hydrogen dominates most categories because it relies on fossil fuels and chemical supply chains. Blue hydrogen reduces some impacts but still depends on natural gas extraction and processing. Green hydrogen’s contribution is relatively low, although it has the highest impact in water consumption for terrestrial ecosystems in the characterisation. Fossil-based systems are well known to cause greater ecosystem harm through pollution, toxicity, and eutrophication, whereas green systems are cleaner operationally but still impact the environment through their supply chains and feedstock procurement [74,78].
- Resources
Grey hydrogen (Figure 9) accounts for 73.2%, blue for 15.2%, and green for 11.7%. Resource damage in ReCiPe predicts higher future extraction costs due to current use. Grey hydrogen is most affected by its reliance on natural gas as a feedstock and fuel. Blue hydrogen relies on fossil fuels and energy for capture, as indicated by its mid-range share. Green hydrogen has a higher share than in other endpoints, relying on resource-intensive materials like silicon, aluminium, copper, silver, nickel, and platinum used in PV panels and electrolysers.
5.3. Comparative Analysis of Green, Blue and Grey Hydrogen Environment Impact
The comparative assessment (Table 12) shows that green hydrogen, when powered by renewable energy and sourced sustainably, offers the most favourable environmental profile, with the lowest carbon emissions and manageable water use. For groundwater-based systems, site-specific water scarcity and biodiversity impacts must be integrated into design and policy decisions. The need for integrated water-energy-ecosystem management is recognised, and further research into closed-loop water systems and sustainable siting strategies is recommended. Policymakers must integrate water–energy–ecosystem management to ensure long-term viability. Water scarcity and aquifer sustainability are critical in groundwater-based systems. Biodiversity impacts depend on groundwater abstraction rates and infrastructure siting. Land use varies by technology; FPV and rooftop PV reduce impacts. Integrate carbon and water footprints into LCA. Develop closed-loop water systems and brine recovery strategies. Align hydrogen development with ecological safeguards and legal compliance. Green hydrogen has the lowest carbon footprint when generated using low-carbon electricity. Blue hydrogen serves as a transitional fuel; however, its reliance on carbon capture and storage (CCS) and on fossil fuels limits its sustainability due to challenges such as methane leakage, CCS-related energy penalties, and water demand. Conversely, grey hydrogen, which accounts for about 62% of global production, is environmentally unsustainable and emits approximately 830 million tons of CO2.
Table 12.
Comparative LCA of green hydrogen, grey hydrogen and blue hydrogen.
5.4. Economic Assessment of Green, Blue and Grey Hydrogen from Groundwater
The economic assessment of producing green, blue, and grey hydrogen from groundwater is shaped by the interplay among capital intensity, operating costs, resource quality, and broader market forces that influence technological deployment. For green hydrogen, capital expenditure (CAPEX) remains heavily dependent on electrolyser selection, with costs ranging from $800 to 1200/kW for alkaline water electrolysis (AWE), $1500–2200/kW for proton exchange membrane (PEM), and $2000–3000/kW for solid-oxide electrolysis (SOE), reflecting the higher material and thermal-management requirements of SOE systems [90,91]. A typical 10 MW AWE installation would require approximately 7.5 M€ in total capital outlay, underscoring the substantial upfront investment needed to deploy electrolysis-based hydrogen systems [91]. Operational expenditure (OPEX) introduces additional economic complexities: electricity consumption accounts for the majority of recurring costs, ranging from 40–50 kWh/kg H2 for efficient SOE systems and 50–60 kWh/kg H2 for AWE platforms [92]. Water purification contributes a secondary but significant operational burden, particularly because PEM systems require ultra-pure water (<10 ppm impurities) compared to AE (<50 ppm), necessitating more sophisticated and energy-intensive treatment trains such as RO, EDI, and ion exchange, with cost elements that become more pronounced in regions with brackish or saline groundwater [93,94].
Blue hydrogen production, driven by natural gas reforming with carbon capture, has a different cost structure, with reformer units, CO2 capture systems, and compression infrastructure accounting for most of the CAPEX [8]. Likewise, OPEX is influenced by natural gas price volatility, solvent regeneration requirements, and additional energy demands associated with CO2 transportation and storage [16,95]. Grey hydrogen, which lacks carbon capture, has the lowest production cost but entails high carbon emissions; its economic advantage is increasingly challenged by tightening climate policies and emerging carbon pricing mechanisms [8,96]. The Levelised Cost of Hydrogen (LCOH) provides an integrative metric for evaluating economic competitiveness. Globally, green hydrogen remains the most expensive at $4–6/kg, compared to $1–2/kg for grey hydrogen, while blue hydrogen falls into a transitional range that depends on natural gas prices, capture efficiency, and carbon pricing structures [8,97]. Electricity costs and electrolyser CAPEX are repeatedly identified as the largest contributors to green hydrogen LCOH, accounting for approximately 35% and 50% of the total cost, respectively [8,94]. Regional disparities persist, with LCOH estimates of $3–5/kg in Europe, $4–6/kg in North America, and up to $5–7/kg for SOE in the Asia-Pacific [4,8,16]. In South Africa, economic feasibility is shaped by high infrastructure investment requirements, grid-related constraints that elevate electricity prices, and groundwater scarcity that may require desalination, adding an estimated 4% to the total LCOH [90,98]. Nonetheless, the country’s exceptional solar and wind resources, combined with declining renewable-energy and electrolyser costs, are projected to reduce LCOH to $2.5–3.5/kg.
Expanding the hydrogen economy also faces market barriers, including higher upfront costs relative to grey hydrogen, inadequate transport and storage infrastructure, and concerns about hydrogen embrittlement in pipelines. Yet, strong global climate commitments, carbon-pricing frameworks, and hydrogen-specific policy incentives are emerging as powerful enablers. South Africa’s position is strengthened by its abundant renewable energy potential and its platinum-group metal endowment, which support both local electrolyser manufacturing and export competitiveness.
5.5. Strengths, Weaknesses, Opportunities, and Threats (SWOT) Analysis of Hydrogen Pathways
The SWOT analysis (Figure 10) highlights distinct trade-offs across hydrogen pathways and clarifies technology–policy choices for South Africa’s groundwater-linked hydrogen development. Green hydrogen offers the strongest long-term alignment with decarbonisation, with zero operational emissions, a high-purity product, and strong policy momentum. South Africa’s superior solar and wind resources further strengthen its competitiveness as electrolyser and renewable costs decline. However, green hydrogen remains constrained by the highest CAPEX and electricity intensity of production, stringent water-purity requirements that raise treatment costs for brackish groundwater, and, at present, a higher LCOH relative to alternatives. Blue hydrogen provides a transitional, scalable option that leverages existing natural gas and reforming assets while achieving lower emissions than grey hydrogen through carbon capture. Its economic performance is nevertheless sensitive to volatile gas prices, capture efficiency, and the availability of CO2 transport and storage infrastructure, all of which elevate CAPEX and OPEX. Grey hydrogen retains the lowest near-term cost and is supported by mature infrastructure and strong, sustained demand, but its high emissions profile exposes it to rising carbon prices, investor scrutiny, and regulatory phase-out risks; its advantage is expected to erode as green hydrogen costs fall toward projected parity. Overall, green hydrogen presents the most robust strategic opportunity, particularly for decentralised hubs and export markets, provided grid constraints, electricity tariffs, water treatment needs and permitting delays are addressed. Blue hydrogen can serve as a bridging pathway under credible methane management, reliable storage, and supportive carbon-pricing regimes. Grey hydrogen may satisfy short-term supply or enable retrofits yet lacks long-term viability under tightening climate commitments. These comparative insights justify prioritising policies and investments that accelerate renewable build-out, reduce electrolyser and power costs, secure fit-for-purpose water treatment, and develop hydrogen and CO2 infrastructure, thereby de-risking green and, where appropriate, blue deployment while managing an orderly transition away from grey.
Figure 10.
Strengths, weaknesses, opportunities, and threats (SWOT) analysis of blue, grey and green hydrogen (designed with Copilot AI 5.5 Thinking tool).
6. Challenges and Prospects of Green Hydrogen Production
6.1. Challenges Associated with Groundwater Resources for Green Hydrogen
This section presents the challenges and future directions for producing green hydrogen from groundwater in South Africa, where water scarcity, infrastructure constraints, and regional variability affect feasibility. In essence, limited and uneven groundwater availability, particularly in arid provinces with shallow or overexploited aquifers, intensifies competition among domestic, agricultural, and ecological needs.
- Technological Sovereignty and Cost Challenges
A major barrier to GH2 development is the high cost and complexity of technologies, including electrolysers and renewable energy storage systems. South Africa’s reliance on imported technology and high climate finance costs exacerbate these challenges [99]. To achieve technological sovereignty, there is a need to develop local R&D capabilities, create home-grown technology alternatives, and reverse-engineer existing technologies to suit domestic needs (Zulu, as cited in [99]). Ambitious targets, such as producing 500,000 tonnes of GH2 annually by 2030, require revisiting underlying assumptions and intensifying local technology development to avoid becoming unrealistic [99].
- Geopolitical Implications of Hydrogen Production in South Africa
The geopolitical implications of hydrogen production in South Africa depend on whether the country focuses on domestic, industrial, or export markets (Figure 11). Domestic production enhances energy security, as South Africa’s energy sector relies primarily on coal, making it vulnerable to global market volatility and supply disruptions [35]. Domestic hydrogen use diversifies energy sources and reduces reliance on fossil fuels in South Africa. However, this may create a new dependency, as the country lacks the materials for large-scale hydrogen infrastructure and might need to import technology and expertise from existing hydrogen development markets [100]. These dependencies are less risky than those with fossil fuels because hydrogen sources are more geographically diverse, thereby enabling open trade. Exporting hydrogen or its derivatives could enhance South Africa’s regional and global geopolitical influence. It also offers an opportunity to strengthen relations with key hydrogen importers, such as the EU, Japan, and South Korea, which see Africa as a vital supply region [101]. Large export volumes hinder industries from benefiting from renewable energy. Focusing on industrial use could help South Africa decarbonise fossil-fuel-intensive sectors such as mining and agriculture, reducing emissions and attracting energy-intensive industries seeking cleaner production locations [102,103]. South Africa’s geopolitical importance for hydrogen lies in its hosting of over 80% of the world’s platinum group metals, key catalysts in electrolysers and fuel cells [104]. This gives the country leverage in the global hydrogen supply chain but also presents risks, as the platinum market is volatile. In 2015, South African miner strikes disrupted nearly 40% of global supply [105]. South Africa’s mineral wealth and renewable energy potential position it centrally in global hydrogen geopolitics. It must foster mutually beneficial collaborations and sustainable economic development instead of merely exporting raw materials.
Figure 11.
Schematic framework for addressing challenges in green hydrogen production from groundwater (designed with AI 5.5 Thinking tool).
- Uncertainties in Groundwater Sustainability and Monitoring
Green hydrogen production via electrolysis consumes large amounts of water, posing a significant challenge in water-scarce regions such as South Africa. Although seawater electrolysis could help by easing the demand on freshwater sources, the sustainability of groundwater remains a concern, particularly in arid regions such as the Northern Cape, where GH2 projects are planned [19]. To address water scarcity, the proposal includes integrating desalination plants, especially in coastal hubs such as Saldanha Bay and Coega. However, this raises additional energy and cost considerations, and the environmental impacts of large-scale desalination, such as energy use and effects on marine ecosystems, are not yet fully accounted for in national strategies [10,13,106].
6.2. Framework Proposed to Address Green Hydrogen Production from Groundwater
The proposed Structured Assessment Framework for Groundwater-Based Green Hydrogen Production (Figure 11) is organised according to an Inputs–Processes–Outputs (IPO) architecture, with explicit causal linkages between variables and defined boundary conditions, as described below.
Framework Inputs include: (I1) groundwater quality parameters—electrical conductivity (µS/cm), chloride concentration (mg/L), iron and manganese content (mg/L), total dissolved solids (mg/L), and pH; (I2) site-specific renewable energy availability—solar irradiation (kWh/m2/day) and annual wind speed (m/s); (I3) aquifer hydrogeological parameters—estimated sustainable yield (Mm3/a) and recharge rate (mm/a); and (I4) applicable regulatory and governance requirements—NWA water use licences, NEMA environmental authorisation, and DMRE hydrogen production permits.
Framework Processes comprise: (P1) groundwater pre-treatment technology selection—reverse osmosis (RO), electrodialysis (ED), ultrafiltration (UF), or combinations thereof, driven by I1 inputs; (P2) electrolyser technology selection—AWE, PEM, AEM, or SOE, determined by treated water purity and renewable energy profile; (P3) system integration—electrolyser sizing, renewable energy coupling, compression and storage; and (P4) governance compliance assessment—water licensing, environmental impact assessment, and hydrogen certification.
Framework Outputs are: (O1) predicted LCOH (USD/kg H2), disaggregated into CAPEX (electrolyser, BOP, water treatment plant), OPEX (electricity, water, O&M, membrane replacement), and financing costs; (O2) life cycle GHG intensity (kg CO2-eq/kg H2), assessed from groundwater extraction to compressed H2 at the plant gate; and (O3) the Groundwater Sustainability Index (GSI), defined as the ratio of annual hydrogen-related abstraction to the local Average Groundwater Exploitation Potential (AGEP), expressed as a percentage.
Explicit constraint conditions are: (C1) groundwater abstraction rate ≤ local AGEP sustainable yield; (C2) life cycle GHG intensity ≤ 3 kg CO2-eq/kg H2 for green certification; (C3) LCOH target ≤ USD 4/kg H2 by 2030 (consistent with South African Hydrogen Society Roadmap projections); and (C4) treated feedwater quality must meet electrolyser OEM specifications (see Table 7). While formal multi-objective mathematical optimisation (e.g., minimise LCOH subject to C1–C4) is identified as a priority future research direction—and a candidate problem formulation is outlined in Section 7—the present framework provides the structured decision architecture and constraint set necessary to support such modelling. This addresses the recognised gap in localised techno-economic and environmental models for South Africa [14].
Addressing these through policy, smart infrastructure, and digital adoption is crucial to achieving sustainable, cost-effective groundwater-based green hydrogen production, positioning South Africa as a regional leader.
The proposed framework is benchmarked against four existing frameworks in the literature to clarify its scope and contributions. First, IRENA’s Green Hydrogen Cost Reduction framework [12] provides a global cost-reduction roadmap but does not address groundwater-specific constraints or governance contexts in developing countries. Second, the IEA Hydrogen Technology Perspectives framework [93] addresses technology readiness at a global level without integrating water resource sustainability as a primary design variable. Third, the South African Hydrogen Valley Final Report [106] provides a national strategic vision but focuses on coastal and metropolitan corridors, with limited attention to inland groundwater-based decentralised systems. Fourth, Olifant et al. (2025) [3] provide a comprehensive landscape review of green hydrogen in South Africa but do not formalise a decision framework with structured inputs, processes, outputs, and constraint conditions.
In contrast, the present framework explicitly defines: (a) decision inputs—groundwater quality parameters (salinity, conductivity, heavy metals), regional renewable energy availability (solar irradiation kWh/m2/day, wind speed m/s), and applicable regulatory requirements; (b) process logic—pre-treatment technology selection, electrolyser type selection, and governance compliance pathway; (c) decision outputs—predicted LCOH (USD/kg H2), life cycle GHG intensity (kg CO2-eq/kg H2), and groundwater sustainability index (abstraction rate vs. AGEP); and (d) explicit boundary conditions—abstraction limit ≤ sustainable yield, GHG target < 3 kg CO2-eq/kg H2, and LCOH target < USD 4/kg by 2030. The framework thereby advances beyond descriptive synthesis to provide a structured assessment tool applicable to site-specific project evaluation. Formal validation through pilot-scale demonstration is acknowledged as an important future research direction.
- Techno-Economic and Environmental Modelling Specific to SA
There is a recognised gap in localised techno-economic and environmental modelling for GH2 in South Africa. Current strategies often depend on international models and lack context-specific analyses [107,108]. Key metrics such as the Levelized Cost of Hydrogen (LCOH) are central to feasibility assessments, with projections aiming for $2.92–$4/kg H2 by 2030, depending on renewable energy integration and economies of scale [13,109]. Comprehensive life-cycle analyses and environmental impact assessments (Figure 11) are vital to ensure that GH2 deployment aligns with sustainable development goals and minimises adverse effects [19]. Such modelling is supported by organisations like the African Hydrogen Partnership (AHP) to foster investment and policy development [110].
- Integration with Desalination, Solar Hydrogen Farms, or Mining Reclamation
Integrating GH2 production (Figure 11) with other sectors can enhance sustainability and economic value. Reverse osmosis desalination is a viable option, adding only about $0.01 per kg of hydrogen to production costs and offering high energy efficiency [6,12]. South Africa’s abundant solar resources make it ideal for solar hydrogen farms, with projects already underway in regions like the Northern Cape [94,111]. Additionally, repurposing mining sites for GH2 production presents an opportunity for job creation and regional development, aligning with green steel production using domestic iron ore deposits [112,113].
- Role of Digital Twins, AI, and Smart Water-Energy Systems
Digital technologies (Figure 11), such as AI and digital twins, are expected to play a crucial role in optimising GH2 production, even though many national strategies do not explicitly detail this. Smart infrastructure and integrated systems can improve electrolyser efficiency, manage renewable energy integration, and enhance grid stability [13,91]. Advanced energy management strategies and data-driven systems are essential for monitoring performance, certifying green hydrogen standards, and reducing operational costs [91]. Future prospects depend on adopting these technologies to ensure efficiency, cost reduction, and environmental compliance, though this remains an emerging area of research in South Africa [90].
6.3. Policy, Regulatory, and Governance Landscape in South Africa
The policy reviews cover water rights, hydrogen standards, and ESG compliance, emphasising socioeconomic benefits such as job creation and rural energy access, as well as circular-economy strategies such as brine reuse and heat recovery. Table 13 lists several countries, their approaches to achieving a successful circular economy, and specific lessons applicable to South Africa. The output is a policy roadmap and governance model. South Africa should prioritise expanding electricity supply where viable, focusing on public and freight transport, urban areas, and railroads, where renewable energy use is most efficient for decarbonisation. Scaling up domestic hydrogen production, especially for heavy industries like mining and shipping, aligns with the Hydrogen Society Roadmap for South Africa (HSRM). To reduce reliance on coal and address climate change, South Africa must start producing hydrogen before prices become competitive. Currently, hydrogen demand is low due to high costs caused by a lack of large-scale production. A support scheme like REIPPPP—using government backing to attract private investment—can help. This support should be temporary, with projections indicating hydrogen prices will become competitive between 2038 and 2040 [111].
South Africa should consider contributing to national and international efforts to regulate the hydrogen market and to enable the creation of new organisations. Engagement with the African Union (AU) and the Southern African Development Community (SADC), alongside the International Energy Agency (IEA) and the International Renewable Energy Agency (IRENA), could position South Africa as a global player in the hydrogen sector. To strengthen these partnerships, South Africa should also advocate for the creation of green certification schemes, such as Energy Star or Green Seal, to standardise hydrogen production and distribution.
South Africa is currently pushing for effective policy integration to enforce key pillars, such as water rights, hydrogen standards, and overall Environmental, Social, and Governance (ESG) compliance, to build a sustainable and energy-resilient country. However, the country remains at the forefront and can learn from countries with established strategies. This will also ensure transparency regarding the sourcing, production, and emissions of the processes involved [114]. Certification enables South Africa to distinguish hydrogen produced from renewable sources from hydrogen produced by fossil-fuel methods such as SMR, thereby signalling sustainability for exports. While studies suggest South African hydrogen won’t be competitive until 2040, this estimate depends on factors such as technology costs, availability, and global demand that are uncertain [4].
Table 13.
International policy landscapes and lessons in support of the circular economy for South Africa.
7. Conclusions
Green hydrogen production from groundwater in South Africa represents a technically feasible and strategically important pathway for driving a just and sustainable energy transition, with strong potential to support national decarbonisation goals, stimulate industrial growth, and enhance long-term energy security. This study has proposed a comprehensive conceptual framework organised around five core pillars—groundwater resource assessment, electrolysis technology integration, economic performance, environmental sustainability, and policy and governance alignment—offering a structured lens through which the feasibility and implementation potential of groundwater-based hydrogen systems can be assessed in a water-constrained national context.
The findings highlight the central importance of sustainable groundwater management, robust hydrogeological characterisation, and the careful selection of electrolysis technologies, notably PEM and alkaline systems, which balance performance with water-quality requirements. The integration of abundant solar and wind resources is critical to reducing the levelised cost of hydrogen and improving the competitiveness of green hydrogen relative to blue and grey alternatives. Environmental assessments consistently confirm the environmental superiority of green hydrogen when sourced responsibly, though challenges remain in managing water use, protecting sensitive ecosystems, and addressing land-use pressures associated with large-scale renewable energy infrastructure. The study also acknowledges limitations, including the scarcity of detailed, region-specific techno-economic models, uncertainties regarding long-term groundwater sustainability under climate variability, and limited data on aquifer recharge dynamics, which constrain accurate forecasting and risk assessment. In addition, the evidence base is constrained by the small number of studies that meet the inclusion criteria, introducing uncertainty about the generalisability of certain findings. In addition to the problems with the evidence base, some process-related restrictions must also be noted. First, the search involved only two databases (Scopus and Web of Science) and was restricted to English-language, freely available review articles. This may have limited the identification of additional relevant studies from regional journals and grey literature, as well as those in non-English languages. Another restriction is the lack of complete dual screening: the lead author alone performed all screening and data abstraction, while another person only verified the findings, potentially introducing selection bias. Finally, the review protocol was not prospectively registered, but all a priori decisions regarding the search strategy, inclusion/exclusion criteria, and the synthesis method are described in Section 2. In interpreting the synthesis presented in this study, these review-process constraints must be considered.
Future research should prioritise high-resolution groundwater mapping and monitoring to identify priority production zones, coupled with pilot-scale demonstration projects to validate technical assumptions, refine cost trajectories, and test water-treatment configurations under real-world conditions. There is also a pressing need for advanced techno-economic, environmental, and spatial optimisation models tailored to the hydrological and energy-resource diversity of South Africa, thereby enabling more accurate planning and policy design. Emerging opportunities include integrating green hydrogen with desalination systems, hybrid renewable energy farms, agricultural irrigation innovations, wastewater reuse, and mine water reclamation to support circular resource efficiency. Further exploration of digital twins, AI-based forecasting tools, and smart water-energy management platforms will be essential for optimising system reliability and reducing operational risks. Strengthening the policy, regulatory, and governance landscape, particularly regarding water licensing, environmental safeguards, hydrogen certification, and investment incentives, remains a critical enabler of scalable deployment. Ultimately, South Africa stands at a pivotal moment in its energy future: if supported by coherent policy, robust science, and inclusive socio-economic planning, groundwater-based green hydrogen can shift the nation away from extractive models of the past and toward a resilient, equitable, and globally competitive clean-energy economy.
Author Contributions
Conceptualization: S.R., S.M. and E.K.T.; Formal Analysis: S.M.M., A.F.S., R.S.L., S.K., S.M.K. and T.P.; Resources: S.R., S.M. and E.K.T.; Writing—Original Draft Preparation: S.M.M., A.F.S., R.S.L., S.K., S.M.K. and T.P.; Writing—Review & Editing: S.R. and E.K.T.; Supervision: S.R., S.M. and E.K.T.; Funding Acquisition: S.R., S.M. and E.K.T. All authors have read and agreed to the published version of the manuscript.
Funding
This research was funded by the South African National Energy Development Institute (SANEDI-DUT-2023/2029).
Data Availability Statement
No new data were created or analyzed in this study.
Acknowledgments
The authors gratefully acknowledge the support of the Durban University of Technology, the Green Engineering Research Group and the South African National Energy Development Institute (SANEDI). The contributions of the research team and the guidance provided throughout this study are sincerely appreciated. The authors declare that there are no known competing financial interests or personal relationships that could have influenced the work reported in this paper. The authors also acknowledge the use of AI tools (Copilot AI 5.5 Thinking tool and Grammarly) to enhance the clarity, grammar, and readability of this manuscript. All content generated with these tools was critically reviewed, verified, and edited by the authors to ensure accuracy, originality and compliance with the journal’s standard. The authors take full responsibility for the final version of the manuscript.
Conflicts of Interest
The authors declare no conflicts of interest. The funders had no role in the study’s design; in the collection, analyses, or interpretation of data; in the writing of the manuscript; or in the decision to publish the results.
References
- Franco, A.; Giovannini, C. Recent and Future Advances in Water Electrolysis for Green Hydrogen Generation: Critical Analysis and Perspectives. Sustainability 2023, 15, 6917. [Google Scholar] [CrossRef] [Scilit]
- Nnabuife, S.G.; Darko, C.K.; Obiako, P.C.; Kuang, B.; Sun, X.; Jenkins, K. A Comparative Analysis of Different Hydrogen Production Methods and Their Environmental Impact. Clean Technol. 2023, 5, 1344–1380. [Google Scholar] [CrossRef] [Scilit]
- Olifant, G.E.; Ngubevana, L.; Mathetsa, S. Navigating the current landscape of green hydrogen, its potential, and challenges: A South African perspective. Prog. Energy 2025, 7, 033002. [Google Scholar] [CrossRef] [Scilit]
- Dyantyi-Gwanya, N.; Giwa, S.O.; Ncanywa, T.; Taziwa, R.T. Exploring Economic Expansion of Green Hydrogen Production in South Africa. Sustainability 2025, 17, 901. [Google Scholar] [CrossRef] [Scilit]
- Pillay, U.; Khan, M.F. Hydrogen for a Sustainable Tomorrow: Evaluating the Financial and Technical Dimensions of Green Hydrogen Production in South Africa—A Case Study in Ethekwini Municipality. SAIEE Afr. Res. J. 2025, 116, 68–78. Available online: http://www.scielo.org.za/scielo.php?script=sci_arttext&pid=S1991-16962025000200003&lng=en&tlng=en (accessed on 25 October 2025). [CrossRef] [Scilit]
- Siddiqui, O.; Ishaq, H.; Dincer, I. A novel solar and geothermal-based trigeneration system for electricity generation, hydrogen production and cooling. Energy Convers. Manag. 2019, 198, 111812. [Google Scholar] [CrossRef] [Scilit]
- Lagioia, G.; Spinelli, M.P.; Amicarelli, V. Blue and green hydrogen energy to meet European Union decarbonisation objectives. An overview of perspectives and the current state of affairs. Int. J. Hydrogen Energy 2023, 48, 1304–1322. [Google Scholar] [CrossRef] [Scilit]
- Oni, A.O.; Anaya, K.; Giwa, T.; Di Lullo, G.; Kumar, A. Comparative assessment of blue hydrogen from steam methane reforming, autothermal reforming, and natural gas decomposition technologies for natural gas-producing regions. Energy Convers. Manag. 2022, 254, 115245. [Google Scholar] [CrossRef] [Scilit]
- Department of Water and Sanitation (DWS). National State of Water Report 2023; Report Number WII/IWRS/NSoW 2023 PRETORIA, South Africa; DWS: Pretoria, South Africa, 2024. Available online: https://www.dws.gov.za/Projects/National%20State%20of%20Water%20Report/Documents/National%20State%20of%20Water%20Report%202023_FinalVer3.0.pdf (accessed on 15 January 2026).
- Beswick, R.R.; Oliveira, A.M.; Yan, Y. Does the Green Hydrogen Economy Have a Water Problem? ACS Energy Lett. 2021, 6, 3167–3169. [Google Scholar] [CrossRef] [Scilit]
- Osman, A.; Nasr, M.; Abdelhaleem, A.; Ayati, A.; Farghali, M.; Al-Muhtaseb, A.A.; Alfatesh, A.; Rooney, D. Life cycle assessment of hydrogen production, storage, and utilization toward sustainability. Wiley Interdiscip. Rev. Energy Environ. 2024, 13, e526. [Google Scholar] [CrossRef] [Scilit]
- International Renewable Energy Agency (IRENA). Making the Breakthrough Green Hydrogen Policies and Technology Costs; IRENA: Abu Dhabi, Saudi Arabia, 2021; Available online: https://sanedi.org.za/Green%20Hydrogen/assets/Investment%20Support%20Information/OECD-INNOVATION-AND-INDUSTRIAL-POLICIES-FOR-GREEN-HYDROGEN-policy-paper-Feb2022.pdf (accessed on 15 January 2026).
- Hussein, M.; Jen, T.-C.; Imoisili, P.E. South Africa clean energy transition: The future of green hydrogen energy technology. Energy Rep. 2025, 13, 5501–5511. [Google Scholar] [CrossRef] [Scilit]
- Department of Science and Innovation Republic of South Africa. Hydrogen Valley Feasibility Study Report Final Version. 2021. Available online: https://www.dsti.gov.za/images/2021/Hydrogen_Valley_Feasibility_Study_Report_Final_Version.pdf (accessed on 15 January 2026).
- Yeboaa, C.; Tetteh, E.K.; Chollom, M.N.; Rathilal, S. Sustainable Solutions for Plastic Waste Mitigation in Sub-Saharan Africa: Challenges and Future Perspectives Review. Polymers 2025, 17, 1521. [Google Scholar] [CrossRef] [Scilit] [PubMed]
- Anekwe, I.M.S.; Mustapha, S.I.; Akpasi, S.O.; Tetteh, E.K.; Joel, A.S.; Isa, Y.M. The hydrogen challenge: Addressing storage, safety, and environmental concerns in hydrogen economy. Int. J. Hydrogen Energy 2025, 167, 150952. [Google Scholar] [CrossRef] [Scilit]
- Hoffmann, J.E. On the outlook for solar thermal hydrogen production in South Africa. Int. J. Hydrogen Energy 2019, 44, 629–640. [Google Scholar] [CrossRef] [Scilit]
- Olaitan, D.; Bertagni, M.; Porporato, A. The water footprint of hydrogen production. Sci. Total Environ. 2024, 927, 172384. [Google Scholar] [CrossRef] [Scilit] [PubMed]
- Mtolo, S.; Tetteh, E.; Mthombeni, N.; Rathilal, S.; Moloi, K. Challenges and Prospects of Solar-Powered Seawater Electrolysis for Green Hydrogen Production in South Africa: A Comprehensive. In Proceedings of the 41st CAPE TOWN Int’l Conference on Chemical, Biological and Environmental Engineering, Cape Town, South Africa, 21–22 November 2024. [Google Scholar]
- Kweinor Tetteh, E.; Sijadu, N.G.; Rathilal, S. An overview of non-carbonaceous and renewable-powered technologies for green hydrogen production in South Africa: Keywords occurrence analysis. Energy Strategy Rev. 2024, 54, 101486. [Google Scholar] [CrossRef] [Scilit]
- Imasiku, K.; Ballo, A.; Koffi, K.V.; Farirai, F.; Agbo, S.N.; Olwoch, J.; Korgo, B.; Ogunjobi, K.O.; Koné, D.; Savadogo, M.; et al. Potential Financing Mechanisms for Green Hydrogen Development in Sub-Saharan Africa. Hydrogen 2025, 6, 59. [Google Scholar] [CrossRef] [Scilit]
- Béres, R.; Mararakanye, N.; Auret, C.; Bekker, B.; van den Broek, M. Analysing the prospects of grid-connected green hydrogen production in predominantly fossil-based countries—A case study of South Africa. Int. J. Hydrogen Energy 2024, 83, 975–986. [Google Scholar] [CrossRef] [Scilit]
- Gbiete, D.; Narra, S.; Mani Kongnine, D.; Narra, M.M.; Nelles, M. Insights into Biohydrogen Production Through Dark Fermentation of Food Waste: Substrate Properties, Inocula, and Pretreatment Strategies. Energies 2024, 17, 6350. [Google Scholar] [CrossRef] [Scilit]
- Carmo, M.; Fritz, D.L.; Mergel, J.; Stolten, D. A comprehensive review on PEM water electrolysis. Int. J. Hydrogen Energy 2013, 38, 4901–4934. [Google Scholar] [CrossRef] [Scilit]
- Van Eck, N.; Waltman, L. Software survey: VOSviewer, a computer program for bibliometric mapping. Scientometrics 2010, 84, 523–538. [Google Scholar] [PubMed]
- Mudhoo, A.; Torres-Mayanga, P.C.; Forster-Carneiro, T.; Sivagurunathan, P.; Kumar, G.; Komilis, D.; Sánchez, A. A review of research trends in the enhancement of biomass-to-hydrogen conversion. Waste Manag. 2018, 79, 580–594. [Google Scholar] [CrossRef] [Scilit] [PubMed]
- Badea, G.E.; Hora, C.; Maior, I.; Cojocaru, A.; Secui, C.; Filip, S.M.; Dan, F.C. Sustainable Hydrogen Production from Seawater Electrolysis: Through Fundamental Electrochemical Principles to the Most Recent Development. Energies 2022, 15, 8560. [Google Scholar] [CrossRef] [Scilit]
- Islam, M.T.; Ali, A. Sustainable green energy transition in Saudi Arabia: Characterizing policy framework, interrelations and future research directions. Next Energy 2024, 5, 100161. [Google Scholar] [CrossRef] [Scilit]
- Becker, H.; Murawski, J.; Shinde, D.V.; Stephens, I.E.L.; Hinds, G.; Smith, G. Impact of impurities on water electrolysis: A review. Sustain. Energy Fuels 2023, 7, 1565–1603. [Google Scholar] [CrossRef] [Scilit]
- Utomo, B.; Riatmaja, D.; Aninam, J.; Wahyudi, F. Environmental Sustainability And Economic Growth: Policy Implications for Developing Countries. Nomico J. 2024, 1, 87–93. [Google Scholar] [CrossRef] [Scilit]
- Pan, X.; Zhou, H.; Baimbetov, D.; Syrlybekkyzy, S.; Akhmetov, B.B.; Abbas, Q. Development Status and Future Prospects of Hydrogen Energy Technology: Production, Storage, and Cost Analysis. Adv. Energy Sustain. Res. 2025, 6, 2400451. [Google Scholar] [CrossRef] [Scilit]
- Hamukoshi, S.S.; Mama, N.; Shimanda, P.P.; Shafudah, N.H. An overview of the socio-economic impacts of the green hydrogen value chain in Southern Africa. J. Energy S. Afr. 2022, 33, 12–21. [Google Scholar] [CrossRef] [Scilit]
- Pinto, J.; Chege, K. Regulating green and low-carbon hydrogen in africa: A case study of South Africa. Adv. Sci. Technol. 2024, 142, 15–24. [Google Scholar] [CrossRef] [Scilit]
- Bessarabov, D.; van Niekerk, F.; van der Merwe, F.; Vosloo, M.; North, B.; Mathe, M. Hydrogen Infrastructure within HySA National Program in South Africa: Road map and specific needs. Energy Procedia 2012, 29, 42–52. [Google Scholar] [CrossRef] [Scilit]
- Ayodele, T.R.; Munda, J.L. The potential role of green hydrogen production in the South Africa energy mix. J. Renew. Sustain. Energy 2019, 11, 044301. [Google Scholar] [CrossRef] [Scilit]
- Geoss & Hortgro. Groundwater Guidelines Managing an Unseen Resource; GEOSS & HORTGRO: Paarl, South Africa; Available online: https://www.hortgro.co.za/wp-content/uploads/docs/2025/05/Groundwater-Management_English_May2025.pdf (accessed on 21 August 2024).
- Woodford, A.; Rosewarne, P.; Girman, J. How Much Groundwater Does South Africa Have? SRK Consulting & Department of Water Affairs and Forestry: Pretoria, South Africa, 2020; Available online: https://dxi97tvbmhbca.cloudfront.net/upload/user/image/1_A_Woodford20200304180745931.pdf (accessed on 15 February 2026).
- Makanda, K.; Nzama, S.; Kanyerere, T. Assessing the role of water resources protection practice for sustainable water resources management: A review. Water 2022, 14, 3153. [Google Scholar] [CrossRef] [Scilit]
- Stuart-Hill, S.; Schulze, R. Reflections on the framework of water governance in South Africa. New Water Policy Pract. 2017, 3, 46–65. [Google Scholar] [CrossRef] [Scilit]
- Makaya, E.; Rohse, M.; Day, R.; Vogel, C.; Mehta, L.; McEwen, L.; Rangecroft, S.; Van Loon, A.F. Water governance challenges in rural South Africa: Exploring institutional coordination in drought management. Water Policy 2020, 22, 519–540. [Google Scholar] [CrossRef] [Scilit]
- Sorensen, J.P.; Davies, J.; Ebrahim, G.Y.; Lindle, J.; Marchant, B.P.; Ascott, M.J.; Bloomfield, J.P.; Cuthbert, M.O.; Holland, M.; Jensen, K. A influência da captação da água subterrâneas na interpretação de controles climáticos e eventos de recarga extremos em hidrogramas de poços no semiárido do Sul da África. Hydrogeol. J. 2021, 29, 2773–2787. [Google Scholar] [CrossRef] [Scilit]
- Gejl, R.N.; Rygaard, M.; Henriksen, H.; Rasmussen, J.; Bjerg, P.L. Understanding the impacts of groundwater abstraction through long-term trends in water quality. Water Res. 2019, 156, 241–251. [Google Scholar] [CrossRef] [Scilit] [PubMed]
- H2OTeam. What Is Water Abstraction? The Process, Uses, and Impact. 2025. Available online: https://h2oglobalnews.com/what-is-water-abstraction/ (accessed on 15 February 2026).
- South African Government. Government of South Africa. New Environmental Impact Assessment (EIA) Regulations Come Into Effect Today|South African Government. 2010. Available online: https://www.gov.za/news/media-statements/new-environmental-impact-assessment-eia-regulations-come-effect-today-02-aug?utm_source=chatgpt.com (accessed on 15 February 2026).
- Bowmans. The National Environmental Management Act: 2017 Amendments to the Environmental Impact Assessment Regulations. Available online: https://bowmanslaw.com/insights/national-environmental-management-act-2017-amendments-environmental-impact-assessment-regulations/?utm_source=chatgpt.com (accessed on 15 February 2026).
- Arcos, J.M.M.; Santos, D.M. The hydrogen color spectrum: Techno-economic analysis of the available technologies for hydrogen production. Gases 2023, 3, 25–46. [Google Scholar] [CrossRef] [Scilit]
- Simoes, S.G.; Catarino, J.; Picado, A.; Lopes, T.F.; di Berardino, S.; Amorim, F.; Gírio, F.; Rangel, C.M.; Ponce de Leão, T. Water availability and water usage solutions for electrolysis in hydrogen production. J. Clean. Prod. 2021, 315, 128124. [Google Scholar] [CrossRef] [Scilit]
- Rhys Hart, R.; Jay Nyathi, R.; Shaifali Sood, R.; Maggie Adams, R.; Gwyn Rees, U.; Vicky Bell, U.; Helen Davies, U.; Ponnambalam Rameshwaran, U.; Majdi Mansour, B.; Marco Bianchi, B.; et al. Water Demand for Hydrogen Production; UK Department for Energy Security and Net Zero (DESNZ): London, UK, 2024.
- Jon Fennell, M.A.; Leece, A. Hydrogen Production Water Management: Understanding the Challenges. Whitepaper. Available online: https://www.integratedsustainability.com/insights/whitepapers/hydrogen-production-water-management/ (accessed on 15 February 2026).
- Hart, G.R.; Nyathi, J.; Sood, S.; Adams, M.; Rees, G.; Bell, V.; Davies, H.; Rameshwaran, P.; Mansour, M.; Bianchi, M.; et al. Water Demand for Hydrogen Production; Ricardo, UK Centre for Ecology & Hydrology, and British Geological Survey: North Bristol, UK, 2024. [Google Scholar]
- Tunn, J.; Kalt, T.; Müller, F.; Simon, J.; Hennig, J.; Ituen, I.; Glatzer, N. Green hydrogen transitions deepen socioecological risks and extractivist patterns: Evidence from 28 prospective exporting countries in the Global South. Energy Res. Soc. Sci. 2024, 117, 103731. [Google Scholar] [CrossRef] [Scilit]
- Kayastha, V.; Patel, J.; Kathrani, N.; Varjani, S.; Bilal, M.; Show, P.L.; Kim, S.-H.; Bontempi, E.; Bhatia, S.K.; Bui, X.-T. New Insights in factors affecting ground water quality with focus on health risk assessment and remediation techniques. Environ. Res. 2022, 212, 113171. [Google Scholar] [CrossRef] [Scilit] [PubMed]
- EIGA. Environmental Impacts of Hydrogen Plants; European Industrial Gases Association Aisbl: Brussels, Belgium, 2018; Available online: https://www.veiligheidvoorop.com/wp-content/uploads/2023/10/DOC122.pdf (accessed on 15 January 2026).
- Brannock, M.W.D.; Dagg, B.J.; Mitchell, K.P. Water for hydrogen production: Challenges and opportunities supported by real-world case studies. In Proceedings of the International Desalination Association World Congress 2022, Sydney, Australia, 20 October 2022; Available online: https://www.brendandagg.com/documents/Matthew-William-Darcey-Brannock-GHD.pdf (accessed on 15 February 2026).
- Iwona, K.-B.; Gono, M.; Švehláková, H. Water for Green Hydrogen Production. In Proceedings of the 2024 24th International Scientific Conference on Electric Power Engineering (EPE), Loučná nad Desnou, Czech Republic, 15–17 May 2024; pp. 1–5. [Google Scholar]
- El-Shafie, M. Hydrogen production by water electrolysis technologies. Results Eng. 2023, 20, 101426. [Google Scholar] [CrossRef] [Scilit]
- Khosravi, M.; Thomas, H.; Peeters, L.; Holland, K.; Hosseini, T.; Carter, L.; Bayatsarmadi, B.; Hou, Y. Sustainable seawater electrolysis: Evaluating environmental impacts and technological development opportunities. Sustain. Energy Fuels 2025, 9, 4238–4261. [Google Scholar] [CrossRef] [Scilit]
- Ahsan, A.; Mat Ali, M.J.B.; Rashid, M.R.; Kabir, M.U.; Shafiquzzaman, M.; Imteaz, M.; Idrus, S.; Aljaradin, M.; Alresheedi, M.T. Sustainable leachate treatment by integrating electrolysis with palm-shell activated carbon contactor for environmental protection. Sci. Rep. 2025, 15, 560. [Google Scholar] [CrossRef] [Scilit] [PubMed]
- Emam, A.S.; Hamdan, M.O.; Abu-Nabah, B.A.; Elnajjar, E. A review on recent trends, challenges, and innovations in alkaline water electrolysis. Int. J. Hydrogen Energy 2024, 64, 599–625. [Google Scholar] [CrossRef] [Scilit]
- Liang, Y.Y. Production of green hydrogen from desalinated water using membranes: A review. Desalination 2025, 614, 119200. [Google Scholar] [CrossRef] [Scilit]
- Eurowater. Water Treatment for Green Hydrogen: What You Need to Know. Silhorko-Eurowater A/S. Reprinted from Hydrogen Tech World Magazine. Water Treatment for Green Hydrogen: What You Need to Know. Silhorko-Eurowater A/S. Reprinted from Hydrogen Tech World Magazine. 2024. Available online: https://eurowater.com (accessed on 15 February 2026).
- Ahmad Kamaroddin, M.F.; Sabli, N.; Tuan Abdullah, T.A.; Siajam, S.I.; Abdullah, L.C.; Abdul Jalil, A.; Ahmad, A. Membrane-based electrolysis for hydrogen production: A review. Membranes 2021, 11, 810. [Google Scholar] [CrossRef] [Scilit] [PubMed]
- Rashid, M.M.; Al Mesfer, M.K.; Naseem, H.; Danish, M. Hydrogen production by water electrolysis: A review of alkaline water electrolysis, PEM water electrolysis and high temperature water electrolysis. Int. J. Eng. Adv. Technol. 2015, 4, 2249–8958. [Google Scholar]
- Chi, J.; Yu, H. Water electrolysis based on renewable energy for hydrogen production. Chin. J. Catal. 2018, 39, 390–394. [Google Scholar] [CrossRef] [Scilit]
- Koponen, J. Review of Water Electrolysis Technologies and Design of Renewable Hydrogen Production Systems. Master’s Thesis, LUT University, Lappeenranta, Finland, 2015. [Google Scholar]
- George, L. On-the-Modelling of a Green Hydrogen System: Electrolyzer- and Fuel Cell Modeling. Ph.D. Thesis, Uppsala University, Uppsala, Sweden, 2022. Available online: https://urn.kb.se/resolve?urn=urn:nbn:se:uu:diva-479077 (accessed on 15 February 2026).
- Ahmed, K.W.; Jang, M.J.; Habibpour, S.; Chen, Z.; Fowler, M. NiFeOx and NiFeCoOx Catalysts for Anion Exchange Membrane Water Electrolysis. Electrochem 2022, 3, 843–861. [Google Scholar] [CrossRef] [Scilit]
- Shiva Kumar, S.; Himabindu, V. Hydrogen production by PEM water electrolysis—A review. Mater. Sci. Energy Technol. 2019, 2, 442–454. [Google Scholar] [CrossRef] [Scilit]
- Vidas, L.; Castro, R. Recent developments on hydrogen production technologies: State-of-the-art review with a focus on green-electrolysis. Appl. Sci. 2021, 11, 11363. [Google Scholar] [CrossRef] [Scilit]
- Holladay, J.D.; Hu, J.; King, D.L.; Wang, Y. An overview of hydrogen production technologies. Catal. Today 2009, 139, 244–260. [Google Scholar] [CrossRef] [Scilit]
- Wang, Y.; Pang, Y.; Xu, H.; Martinez, A.; Chen, K.S. PEM Fuel cell and electrolysis cell technologies and hydrogen infrastructure development–a review. Energy Environ. Sci. 2022, 15, 2288–2328. [Google Scholar] [CrossRef] [Scilit]
- Santoro, C.; Lavacchi, A.; Mustarelli, P.; Di Noto, V.; Elbaz, L.; Dekel, D.R.; Jaouen, F. What is next in anion-exchange membrane water electrolyzers? Bottlenecks, benefits, and future. ChemSusChem 2022, 15, e202200027. [Google Scholar] [CrossRef] [Scilit] [PubMed]
- Finkbeiner, M.; Inaba, A.; Tan, R.; Christiansen, K.; Klüppel, H.-J. The New International Standards for Life Cycle Assessment: ISO 14040 and ISO 14044. Int. J. Life Cycle Assess. 2006, 11, 80–85. [Google Scholar] [CrossRef] [Scilit]
- Roy, R.; Antonini, G.; Hayibo, K.S.; Rahman, M.M.; Khan, S.; Tian, W.; Boutilier, M.S.H.; Zhang, W.; Zheng, Y.; Bassi, A.; et al. Comparative techno-environmental analysis of grey, blue, green/yellow and pale-blue hydrogen production. Int. J. Hydrogen Energy 2025, 116, 200–210. [Google Scholar] [CrossRef] [Scilit]
- Weidner, T.; Tulus, V.; Guillén-Gosálbez, G. Environmental sustainability assessment of large-scale hydrogen production using prospective life cycle analysis. Int. J. Hydrogen Energy 2023, 48, 8310–8327. [Google Scholar] [CrossRef] [Scilit]
- Matenda, F.; Raihan, A.; Zhou, H.; Sibanda, M. The influence of economic growth, fossil and renewable energy, technological innovation, and globalisation on carbon dioxide emissions in South Africa. Carbon Res. 2024, 3, 69. [Google Scholar] [CrossRef] [Scilit]
- Küfeoğlu, S. Industrial Process Emissions. In Net Zero: Decarbonizing the Global Economies; Küfeoğlu, S., Ed.; Springer Nature: Cham, Switzerland, 2024; pp. 341–414. [Google Scholar]
- Mbaba, O. A Prospective Comparative Lifecycle Assessment for Green and Grey Hydrogen Production and Utilisation in the South African Context. Ph.D. Thesis, University of Cape Town, Cape Town, South Africa, 2022. [Google Scholar]
- Jones, E.; Qadir, M.; Van Vliet, M.T.; Smakhtin, V.; Kang, S.-M. The state of desalination and brine production: A global outlook. Sci. Total Environ. 2019, 657, 1343–1356. [Google Scholar] [CrossRef] [Scilit] [PubMed]
- Ham, K.; Bae, S.; Lee, J. Classification and technical target of water electrolysis for hydrogen production. J. Energy Chem. 2024, 95, 554–576. [Google Scholar] [CrossRef] [Scilit]
- Bachar, Y. The Path to Zero Carbon for Data Centers—Hydrogen; ECL—1099E; EdgeCloudLink. Inc.: Mountain View, CA, USA, 2024; Available online: https://ecldc.com/wp-content/uploads/2024/02/Hydrogen-Carbon-White-Paper-Jan-2024.pdf (accessed on 24 August 2025).
- Howarth, R.W.; Jacobson, M.Z. How green is blue hydrogen? Energy Sci. Eng. 2021, 9, 1676–1687. [Google Scholar] [CrossRef] [Scilit]
- Singla, M.K.; Gupta, J.; Beryozkina, S.; Safaraliev, M.; Singh, M. The colorful economics of hydrogen: Assessing the costs and viability of different hydrogen production methods-A review. Int. J. Hydrogen Energy 2024, 61, 664–677. [Google Scholar] [CrossRef] [Scilit]
- Ajanovic, A.; Sayer, M.; Haas, R. The economics and the environmental benignity of different colors of hydrogen. Int. J. Hydrogen Energy 2022, 47, 24136–24154. [Google Scholar] [CrossRef] [Scilit]
- Incer-Valverde, J.; Korayem, A.; Tsatsaronis, G.; Morosuk, T. “Colors” of hydrogen: Definitions and carbon intensity. Energy Convers. Manag. 2023, 291, 117294. [Google Scholar] [CrossRef] [Scilit]
- Lubbe, F.; Rongé, J.; Bosserez, T.; Martens, J.A. Golden hydrogen. Curr. Opin. Green Sustain. Chem. 2023, 39, 100732. [Google Scholar] [CrossRef] [Scilit]
- Elrhoul, D.; Romero Gómez, M.; Naveiro, M. Review of green hydrogen technologies application in maritime transport. Int. J. Green Energy 2023, 20, 1800–1825. [Google Scholar] [CrossRef] [Scilit]
- Esteban, E.; Dinar, A. The Role of Groundwater-Dependent Ecosystems in Groundwater Management. Nat. Resour. Model. 2016, 29, 98–129. [Google Scholar] [CrossRef] [Scilit]
- Saha, P.; Akash, F.A.; Shovon, S.M.; Monir, M.U.; Ahmed, M.T.; Khan, M.F.H.; Sarkar, S.M.; Islam, M.K.; Hasan, M.M.; Vo, D.-V.N. Grey, blue, and green hydrogen: A comprehensive review of production methods and prospects for zero-emission energy. Int. J. Green Energy 2024, 21, 1383–1397. [Google Scholar] [CrossRef] [Scilit]
- Wang, L.; Liu, W.; Sun, H.; Yang, L.; Huang, L. Advancements and Policy Implications of Green Hydrogen Production from Renewable Sources. Energies 2024, 17, 3548. [Google Scholar] [CrossRef] [Scilit]
- International Renewable Energy Agency. Renewable Power Generation Costs in 2020; International Renewable Energy Agency: Abu Dhabi, Saudi Arabia, 2021; Available online: https://energypedia.info/wiki/Publication_-_Renewable_Power_Generation_Costs_in_2020 (accessed on 15 February 2026).
- Jaradat, M.; Almashaileh, S.; Bendea, C.; Juaidi, A.; Bendea, G.; Bungau, T. Green Hydrogen in Focus: A Review of Production Technologies, Policy Impact, and Market Developments. Energies 2024, 17, 3992. [Google Scholar] [CrossRef] [Scilit]
- IEA. World Energy Outlook 2022; IEA: Paris, France, 2022; Available online: https://www.iea.org/reports/world-energy-outlook-2022 (accessed on 12 October 2025).
- Al-Ghussain, L.; Ahmad, A.D.; Abubaker, A.M.; Hovi, K.; Hassan, M.A.; Annuk, A. Techno-economic feasibility of hybrid PV/wind/battery/thermal storage trigeneration system: Toward 100% energy independency and green hydrogen production. Energy Rep. 2023, 9, 752–772. [Google Scholar] [CrossRef] [Scilit]
- The Presidency of Republic of South Africa. South Africa’s Just Energy Transition Investment Plan (JET IP) for the Initial Period 2023–2027. Available online: https://justenergytransition.co.za/ (accessed on 15 February 2026).
- Osei, L.; Odoi-Yorke, F.; Opoku, R.; Baah, B.; Yaw Obeng, G.; Mensah, L.; Forson, F. Techno-economic viability of decentralised solar photovoltaic-based green hydrogen production for sustainable energy transition in Ghana. Sol. Compass 2024, 9, 100068. [Google Scholar] [CrossRef] [Scilit]
- Capurso, T.; Stefanizzi, M.; Torresi, M.; Camporeale, S.M. Perspective of the role of hydrogen in the 21st century energy transition. Energy Convers. Manag. 2022, 251, 114898. [Google Scholar] [CrossRef] [Scilit]
- Benalcazar, P.; Komorowska, A. Techno-Economic Analysis and Uncertainty Assessment of Green Hydrogen Production in Future Exporting Countries. Renew. Sustain. Energy Rev. 2024, 199, S1364032124002351. Available online: https://EconPapers.repec.org/RePEc:eee:rensus:v:199:y:2024:i:c:s1364032124002351 (accessed on 15 February 2026). [CrossRef] [Scilit]
- Matinde, E. South Africa’s Green Hydrogen Strategy. J. Pres. Corner. 2025, 125, v–vi. [Google Scholar]
- Saleh, M.T. Hydrogen in africa: Navigating the continent’s unique energy transition landscape and unsustainable energy supply backbone. Adv. Sci. Technol. 2024, 142, 3–14. [Google Scholar] [CrossRef] [Scilit]
- Agyekum, E.B.; Ampah, J.D.; Uhunamure, S.E.; Shale, K.; Onyenegecha, I.P.; Velkin, V.I. Can Africa serve Europe with hydrogen energy from its renewables?—Assessing the economics of shipping hydrogen and hydrogen carriers to Europe from different parts of the continent. Sustainability 2023, 15, 6509. [Google Scholar] [CrossRef] [Scilit]
- Payton, B. Can Africa’s heavy industries go green? African Business, 24 October 2023. Available online: https://african.business/2023/10/resources/can-africas-heavy-industries-go-green (accessed on 15 February 2026).
- van Sluisveld, M.A.; de Boer, H.S.; Daioglou, V.; Hof, A.F.; van Vuuren, D.P. A race to zero-Assessing the position of heavy industry in a global net-zero CO2 emissions context. Energy Clim. Change 2021, 2, 100051. [Google Scholar] [CrossRef] [Scilit]
- Burlakovs, J.; Vincevica-Gaile, Z.; Krievans, M.; Jani, Y.; Horttanainen, M.; Pehme, K.-M.; Dace, E.; Setyobudi, R.H.; Pilecka, J.; Denafas, G. Platinum group elements in geosphere and anthroposphere: Interplay among the global reserves, urban ores, markets and circular economy. Minerals 2020, 10, 558. [Google Scholar] [CrossRef] [Scilit]
- Tsotetsi, O.J. The Effects of Strikes on the Share Returns of Gold and Platinum Mining Companies. Ph.D. Thesis, University of Cape Town, Cape Town, South Africa, 2023. [Google Scholar]
- DSI. Hydrogen Society Roadmap for South Africa 2021; Department of Science and Innovation: London, UK, 2021. Available online: https://www.dsti.gov.za/images/South_African_Hydrogen_Society_RoadmapV1.pdf (accessed on 25 August 2025).
- DTIC. Green Hydrogen Commercialisation Strategy for South Africa (2022); Department of Trade, Industry and Competition (DTIC): Pretoria, South Africa, 2022. Available online: https://www.thedtic.gov.za/green-hydrogen-commercialisation-strategy/ (accessed on 15 February 2026).
- National Business Initiative (NBI). Financing South Africa’s Just Transition. Strategy& (2020); Unlocking South Africa’s Hydrogen Potential; National Business Initiative (NBI): Johannesburg, South Africa, 2022; Available online: https://www.nbi.org.za/focus-areas/environmental-sustainability/climate-pathways-and-a-just-transition-for-south-africa/#reports (accessed on 15 February 2026).
- Hasan, M.; Genç, G. Techno-economic analysis of solar/wind power based hydrogen production. Fuel 2022, 324, 124564. [Google Scholar] [CrossRef] [Scilit]
- Dixon, A.; Hampton, D. South Africa and Green Hydrogen. Norton Rose Fulbright. Available online: https://www.nortonrosefulbright.com/en-za/knowledge/publications/3f097e6c/south-africa-and-green-hydrogen-at-an-economic-turning-point (accessed on 15 February 2026).
- Godfrey, L.; Roman, H.; Smout, S.; Maserumule, R.; Mpofu, A.; Ryan, G.; Mokoena, K. Unlocking the opportunities of a circular economy in South Africa. In Circular Economy: Recent Trends in Global Perspective; Springer: Berlin/Heidelberg, Germany, 2021; pp. 145–180. [Google Scholar]
- Strategy&. Unlocking South Africa’s Hydrogen Potential; PwC: Lodon, UK, 2019; Available online: https://www.bbrief.co.za/content/uploads/2020/10/Unlocking-South-Africas-Hydrogen-Economy.pdf (accessed on 15 February 2026).
- Fessehaie, J.; Rustomjee, Z. Resource-Based Industrialisation in Southern Africa. Dev. S. Afr. 2018, 35, 404–418. [Google Scholar] [CrossRef] [Scilit]
- Stamm, A.; Altenburg, T.; Strohmaier, R.; Oyan, E.; Thoms, K. Green hydrogen. Implications for international cooperation. With special reference to South Africa. Miscellaneous 2023, 9, 2751–4447. [Google Scholar]
- Kusoglu, A. (Re) defining clean hydrogen: From colors to emissions. Electrochem. Soc. Interface 2022, 31, 47. [Google Scholar] [CrossRef] [Scilit]
- Erbach, G.; Svensson, S. EU Rules for Renewable Hydrogen: Delegated Regulations on a Methodology for Renewable Fuels of Non-Biological Origin; European Parliament: Strasbourg, France, 2023. [Google Scholar]
- Eckardt, J.; Hoehne, J.; Stenzel, B. Factsheet: Germany’s Updated National Hydrogen Strategy (July 2023); Adelphi: Bollington, UK, 2023. [Google Scholar]
- Commission, E. Renewable Hydrogen—European Commission. Available online: https://energy.ec.europa.eu/topics/eus-energy-system/hydrogen/renewable-hydrogen_en (accessed on 15 February 2026).
- Donau, C.-L.; Hombach, K.; Meringdal, I.E.; Müller, M.A.; Sellhorn, T.; Wagner, V. Targeting Transparency: Early Evidence on Mandatory Adoption of European Sustainability Reporting Standards. 2024. Available online: https://papers.ssrn.com/sol3/papers.cfm?abstract_id=5010700 (accessed on 15 February 2026).
- Government, A. Guarantee of Origin|Clean Energy Regulator. Available online: https://cer.gov.au/schemes/guarantee-origin?utm_source=chatgpt.com (accessed on 15 February 2026).
- DCCEEW. Guarantee of Origin Scheme. Available online: https://www.dcceew.gov.au/energy/renewable/guarantee-of-origin-scheme?utm_source=chatgpt.com (accessed on 15 February 2026).
- de Villiers, C.; Dimes, R.; La Torre, M.; Molinari, M. The International Sustainability Standards Board’s (ISSB) past, present, and future: Critical reflections and a research agenda. Pac. Account. Rev. 2024, 36, 255–273. [Google Scholar] [CrossRef] [Scilit]
- DCCEEW. National Hydrogen Strategy 2024; Department of Climate Change, Energy, the Environment and Water: Canberra, Australia, 2024.
- Gilbert+Tobin. Mandatory Climate-Related Financial Disclosure Has Commenced: What You Need to Know About the New Regime, Standards and Regulatory Guidance. 2025. Available online: https://www.gtlaw.com.au/insights/mandatory-climate-related-financial-disclosure-has-commenced-what-you-need-to-know-about-the-new-regime%2C-standards-and-regulatory-guidance?utm_source=chatgpt.com (accessed on 15 February 2026).
- Government of Canada. Clean Hydrogen Investment Tax Credit—Validation and Verification Guidance Document—Natural Resources Canada. Available online: https://natural-resources.canada.ca/taxes/income-tax/corporations/federal-tax-credits/clean-economy-itc/clean-hydrogen-itc/clean-hydrogen-investment-tax-credit-validation-verification-guidance-document?utm_source=chatgpt.com (accessed on 15 February 2026).
- Bergamini, K.; Rugiero, V.; Ángel, P.; Mollenhauer, K.; Alarcón, A.; Manríquez, G. Global Challenges and National Responses: Indicators to Evaluate Public Policies for Mining Development in Chile in the Context of the Global Energy Transition. Sustainability 2025, 17, 7814. [Google Scholar] [CrossRef] [Scilit]
- Cardemil, A. Water Code Reform Has Been Enacted to Law. Available online: https://www.carey.cl/en/water-code-reform-has-been-enacted-to-law/ (accessed on 15 February 2026).
- DUE. Chile Launches Green Hydrogen Explorer: A Key Step Toward Sustainable Energy Transition. Available online: https://teameuroperh2.com/chile-lanza-explorador-de-hidrogeno-verde-un-paso-clave-hacia-la-transicion-energetica-sostenible/ (accessed on 15 February 2026).
- Altenburg, T.; Kantel, A. Green Hydrogen in Namibia. Opportunities and Risks; German Institute of Development and Sustainability (IDOS): Bonn, Germany, 2024; pp. 2751–4447. [Google Scholar] [CrossRef]
- Gabor, D.; Sylla, N.S. Derisking developmentalism: A tale of green hydrogen. Dev. Change 2023, 54, 1169–1196. [Google Scholar] [CrossRef] [Scilit]
- Gerrard, M.; Orts, E.W. New California Legislation Would Be a Major Step Forward for Climate Disclosure. 2023. Available online: https://blogs.law.columbia.edu/climatechange/2023/08/08/new-california-legislation-would-be-a-major-step-forward-for-climate-disclosure/ (accessed on 15 February 2026).
- Marks, A.B. Transitioning to Regenerative Agriculture: One “Net-Zero” Pledge at a Time. William Mary Environ. Law Policy Rev. 2024, 49, 521. [Google Scholar]
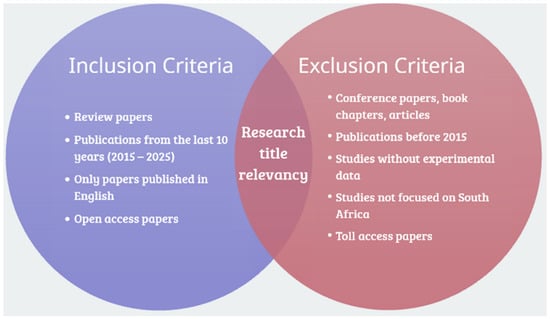
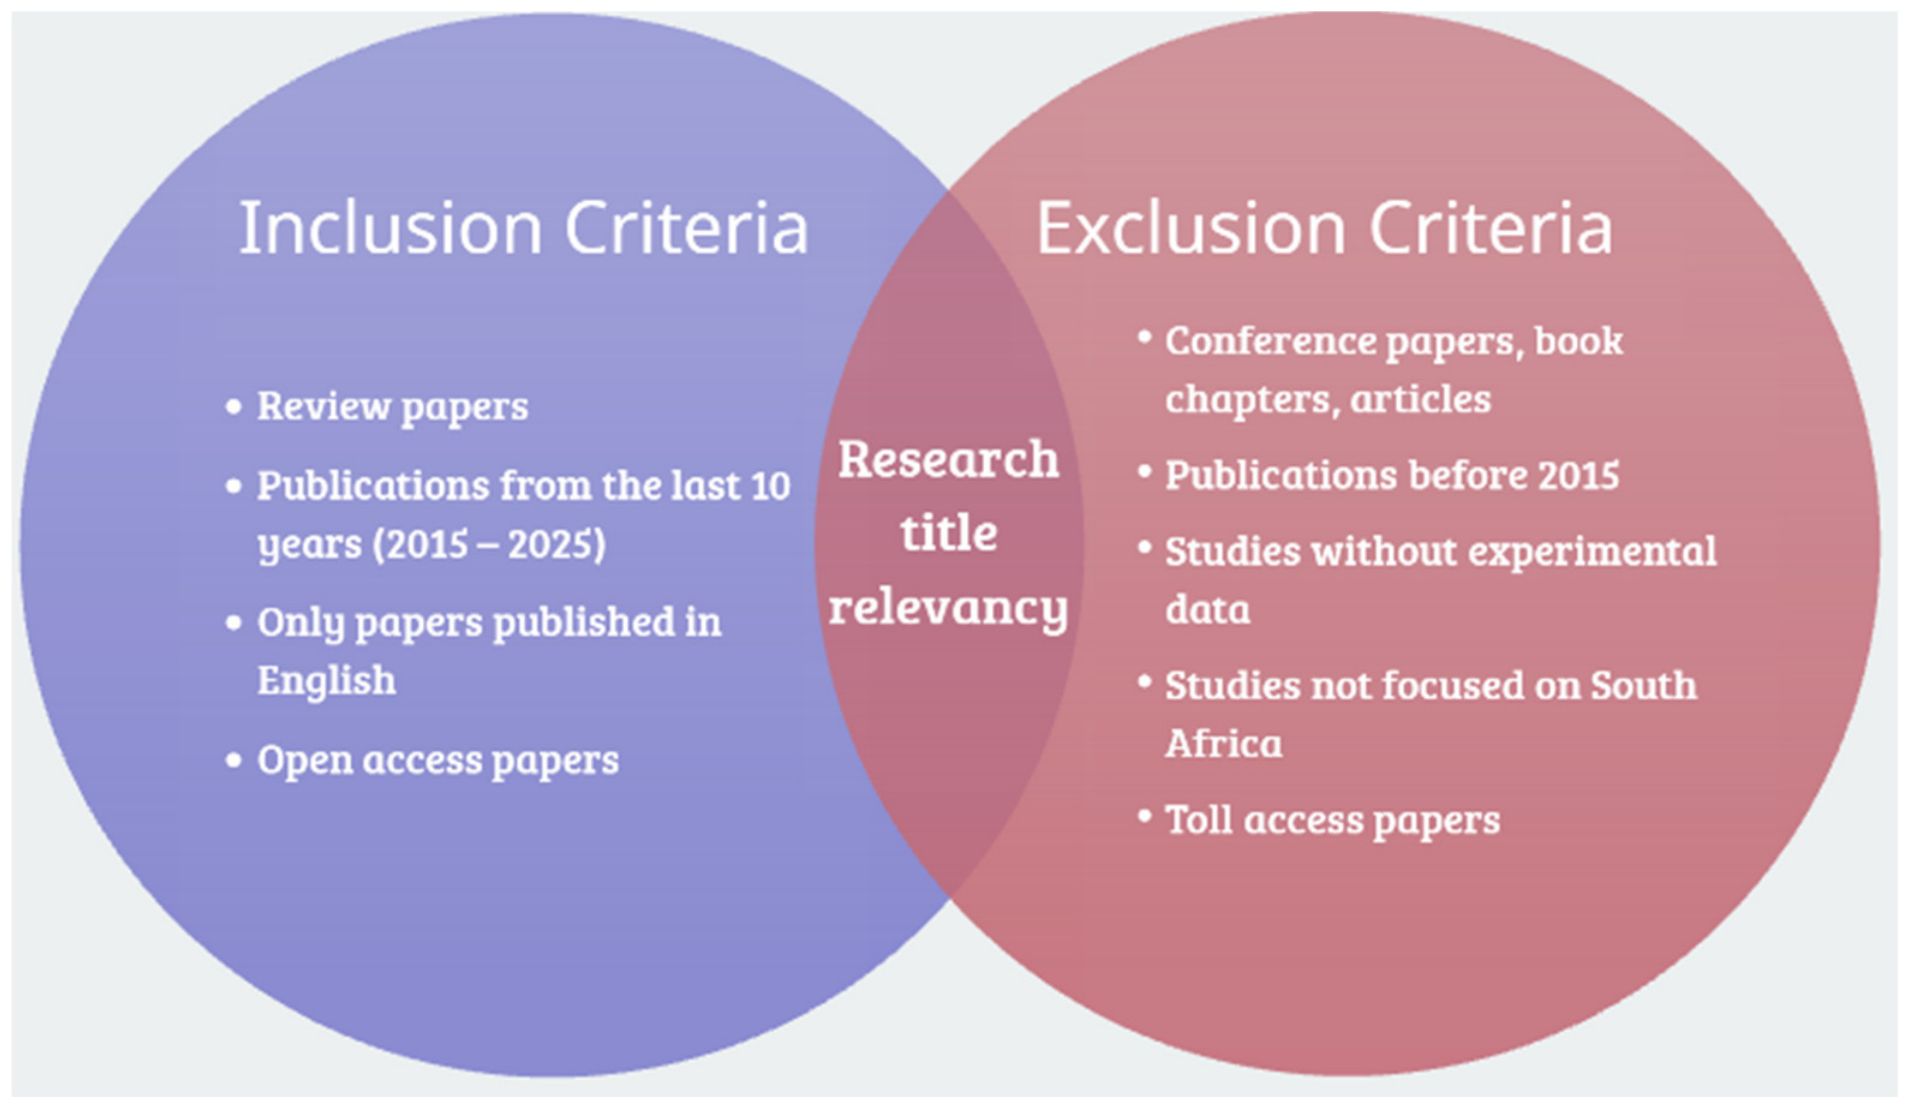
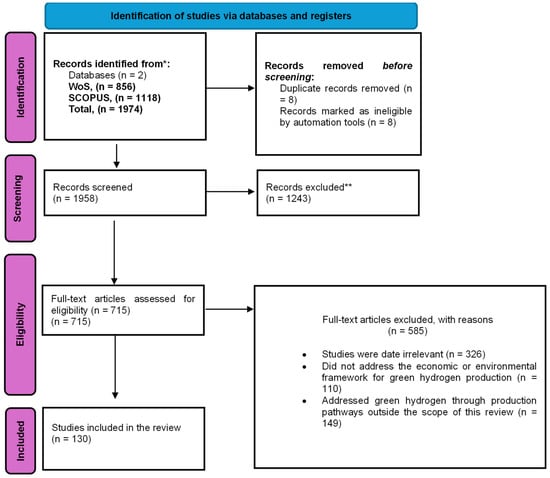
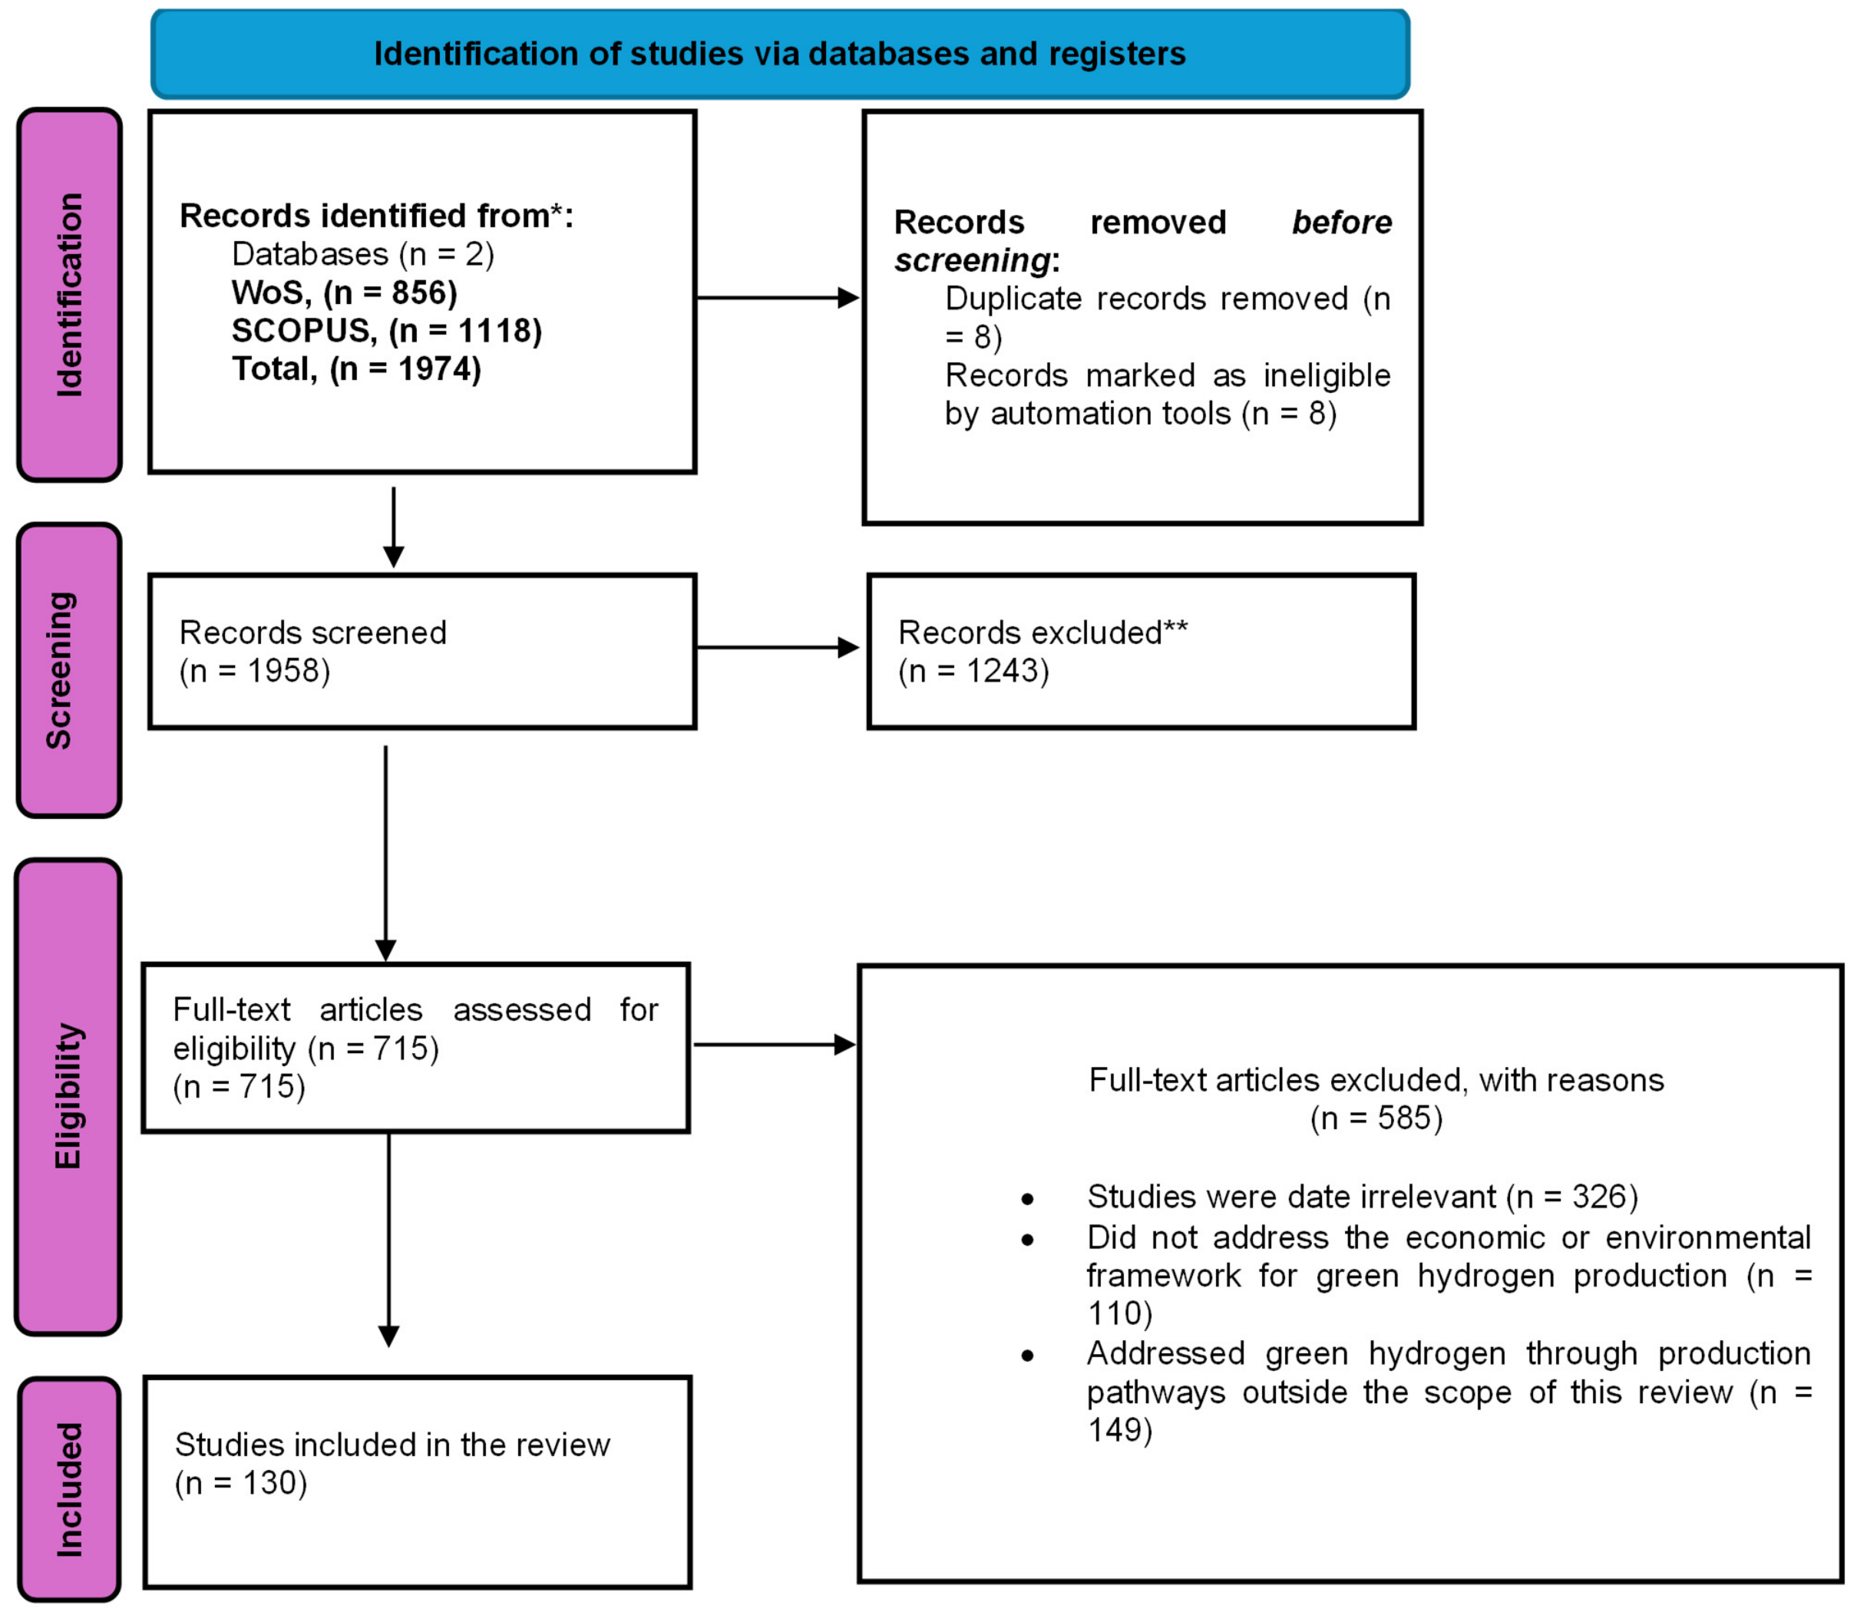
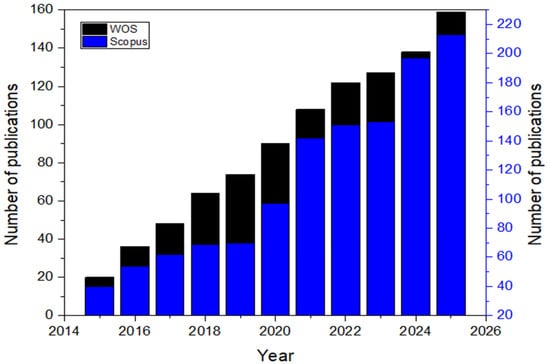
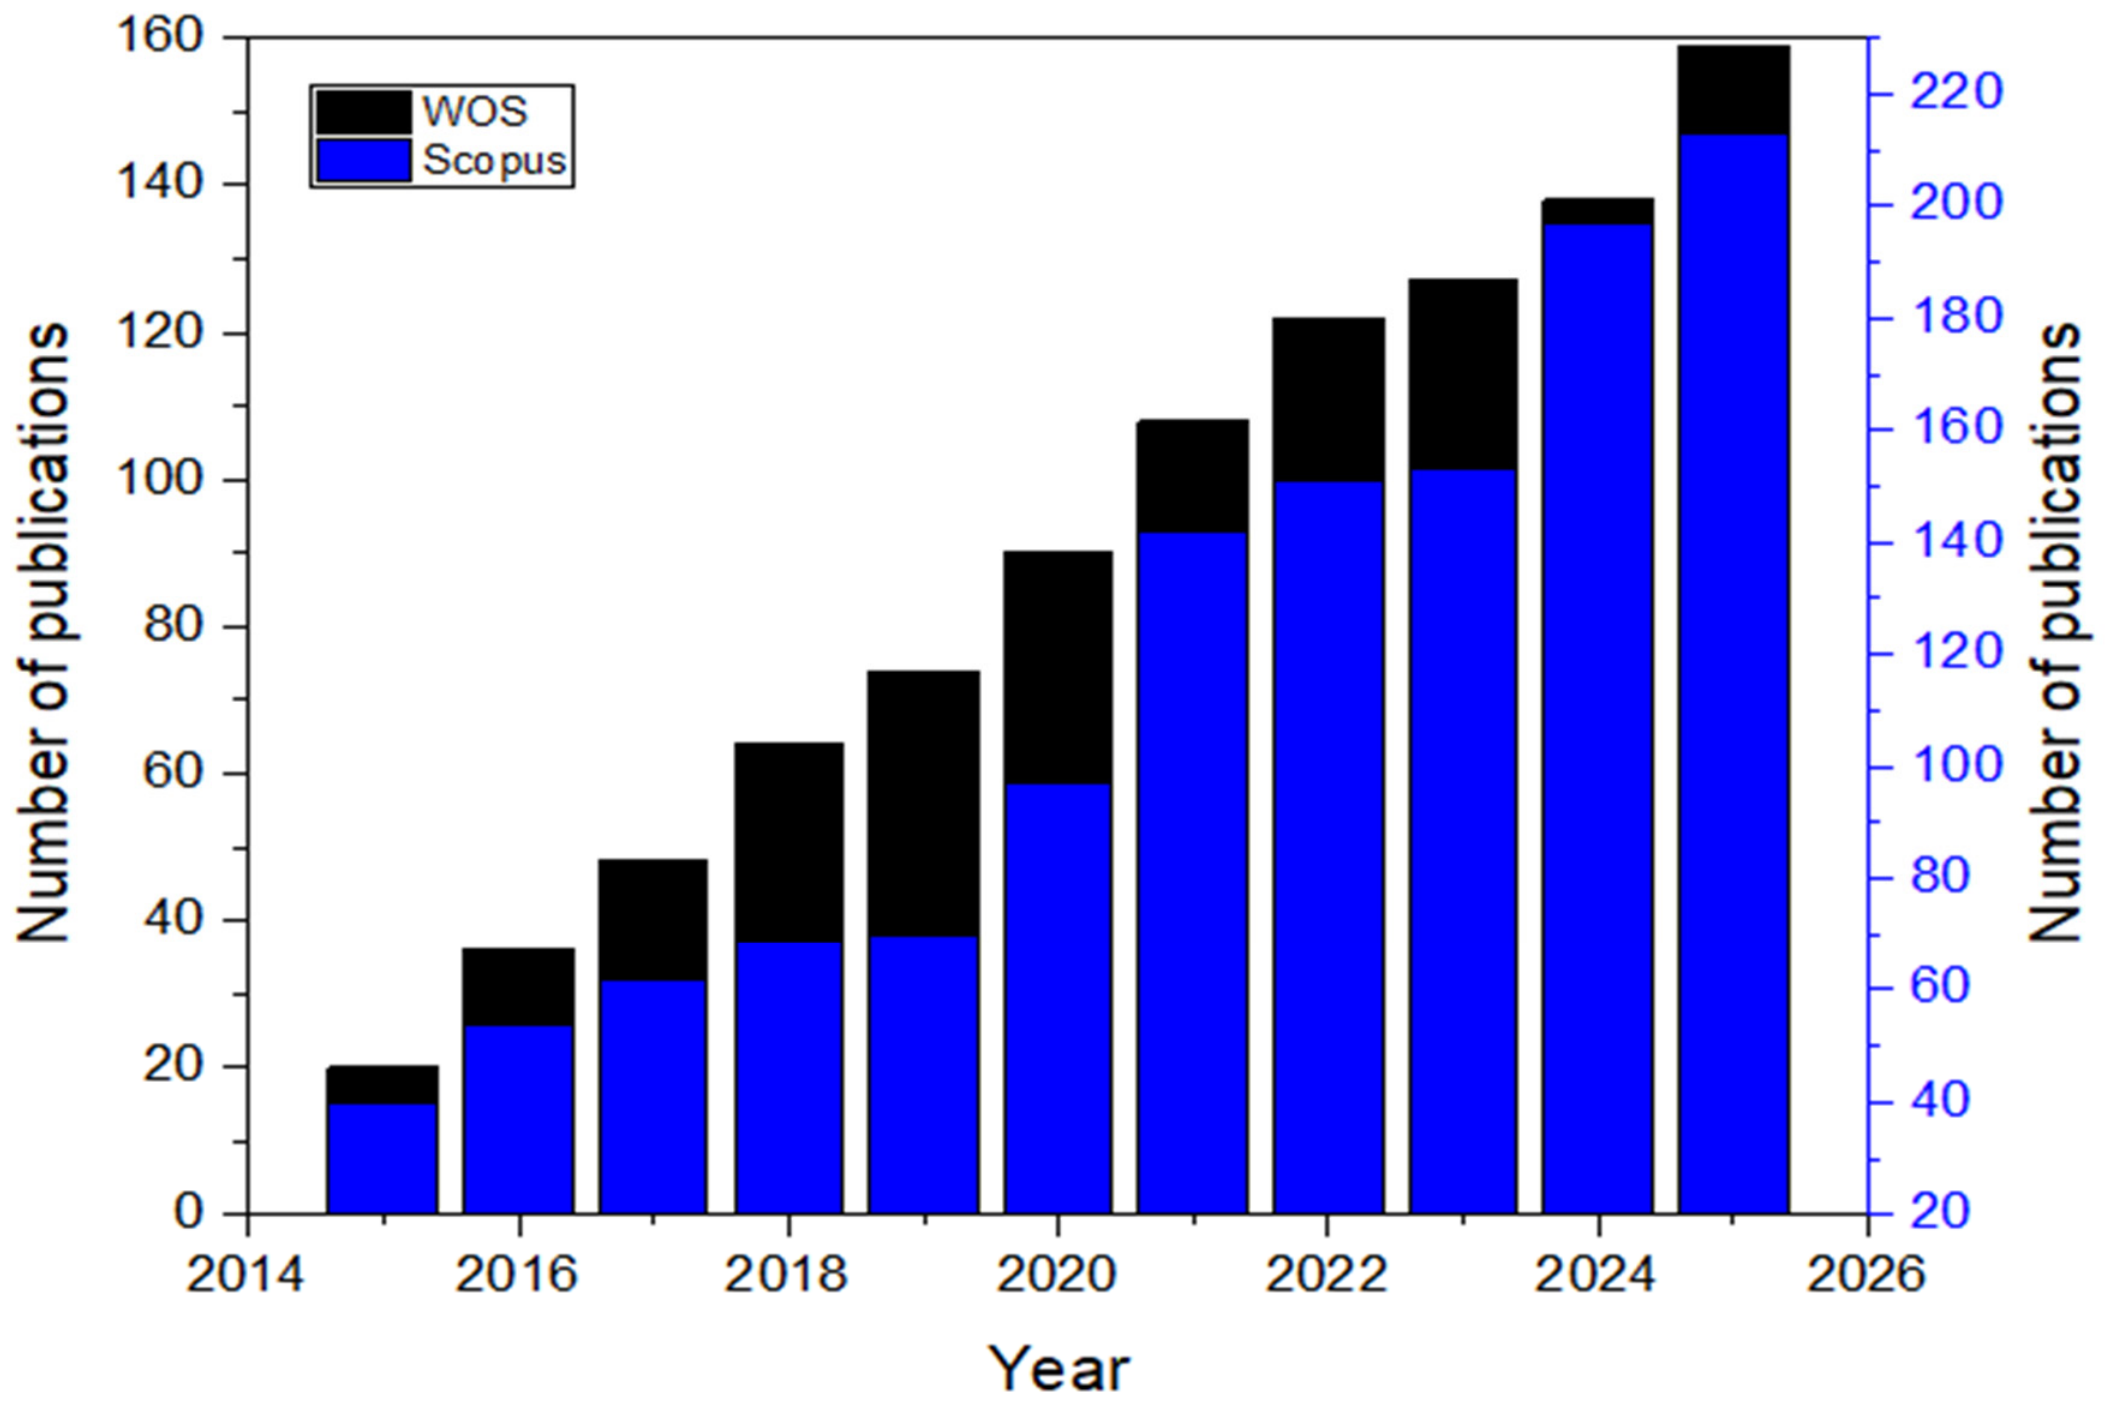
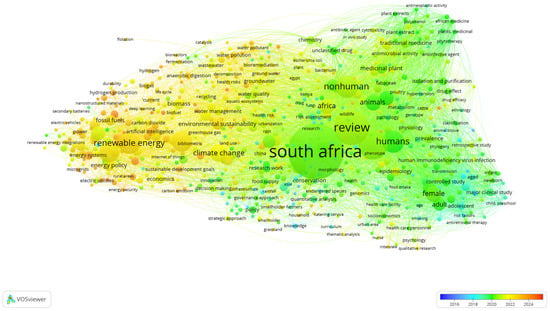
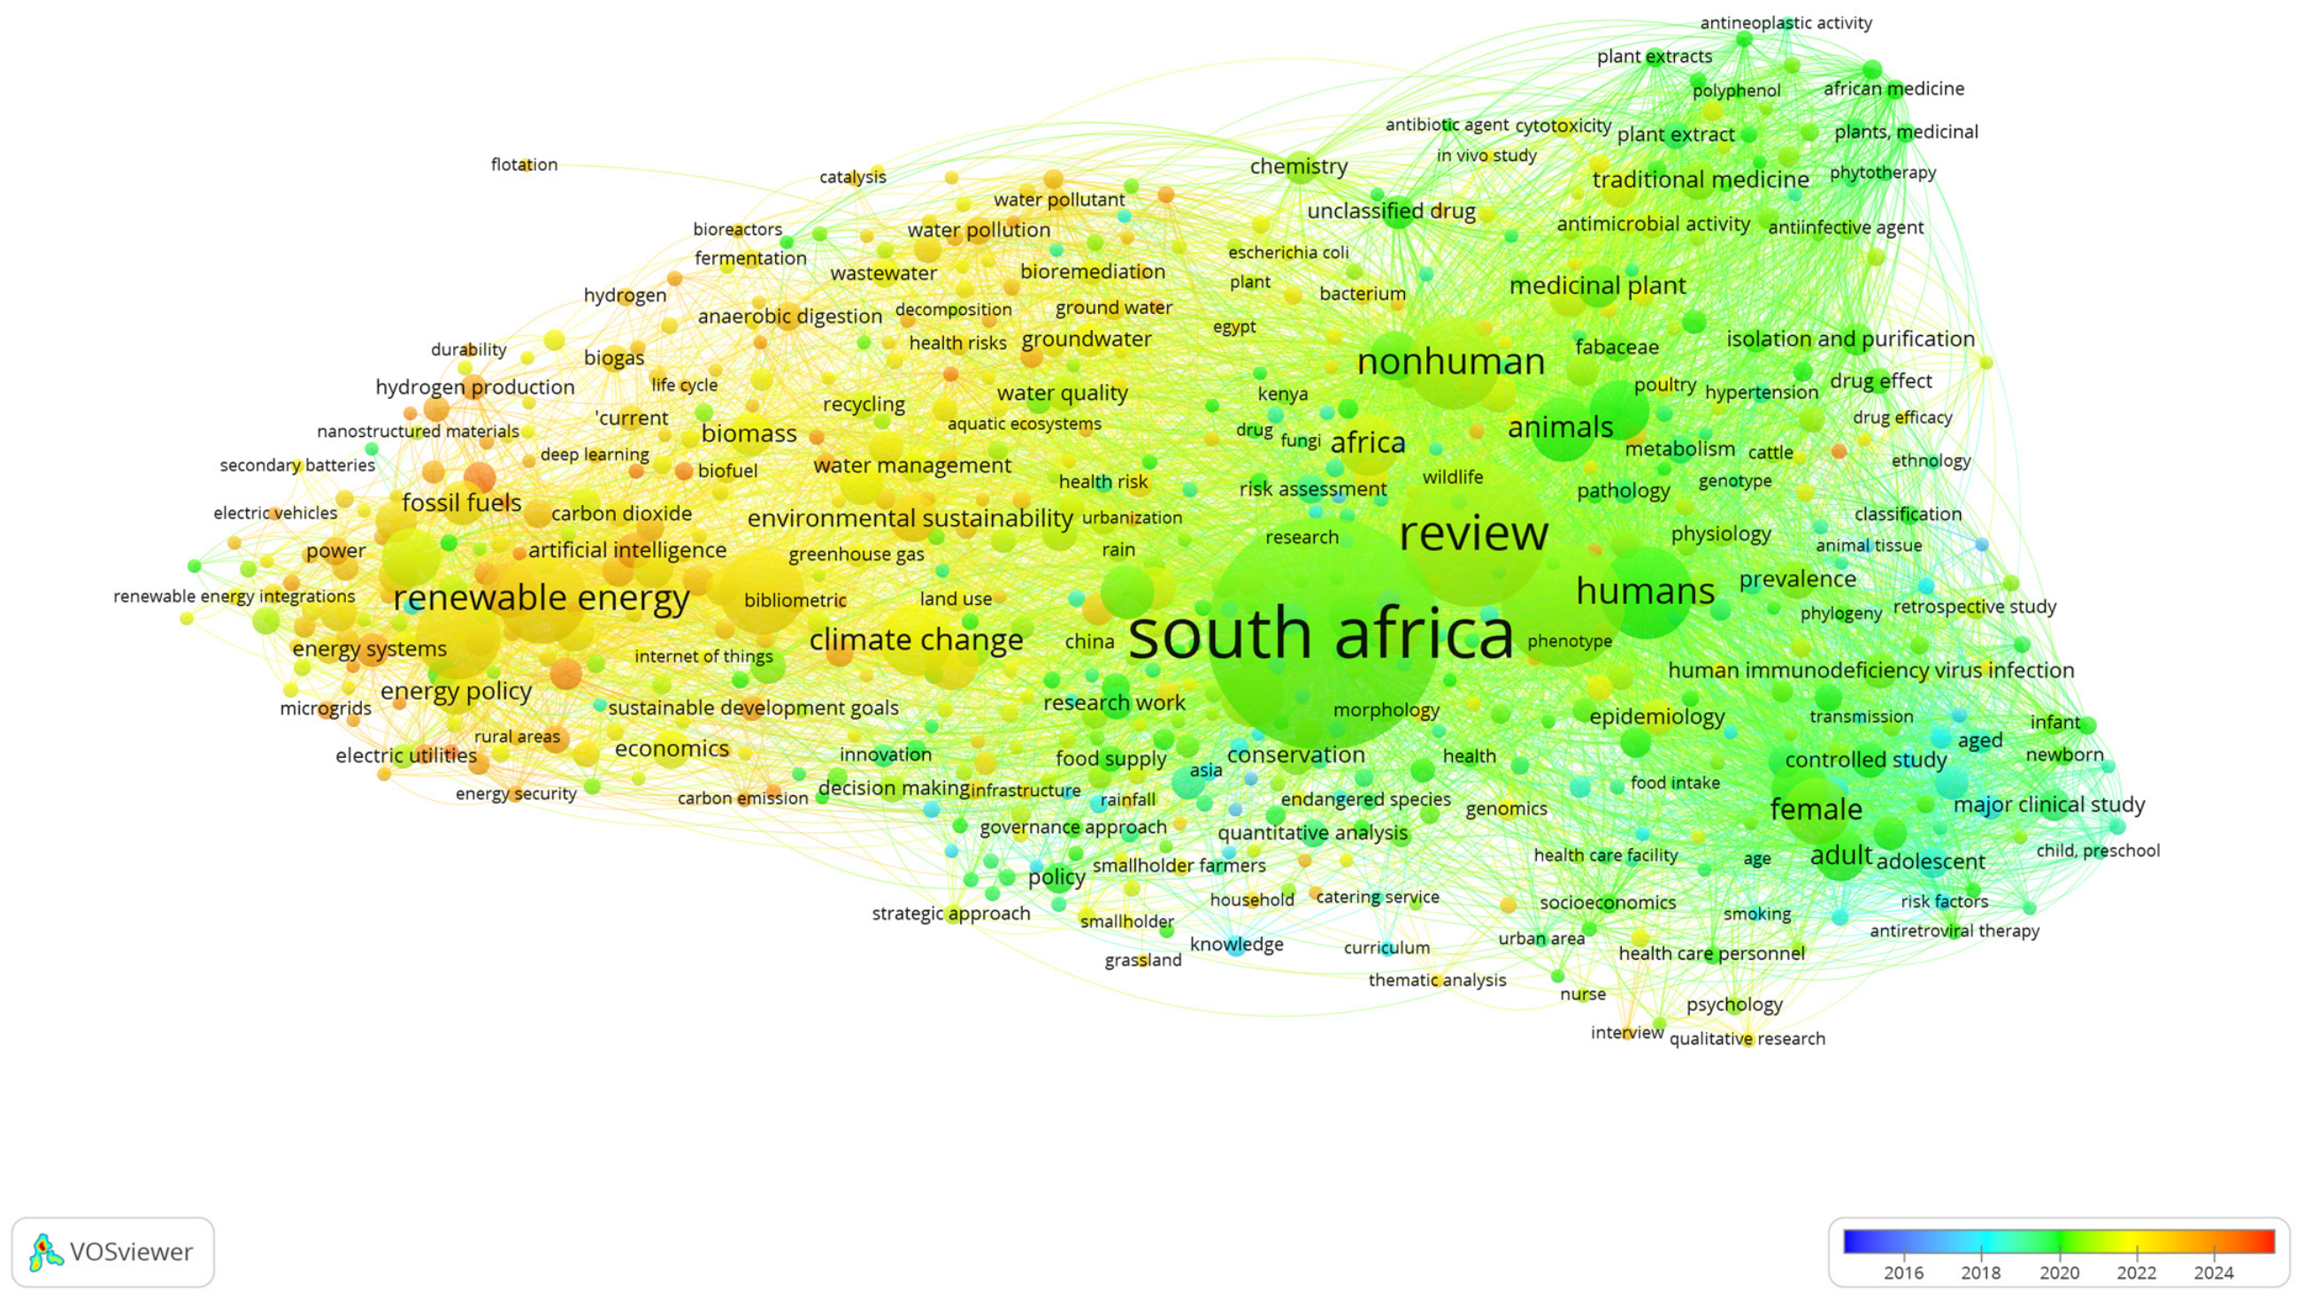
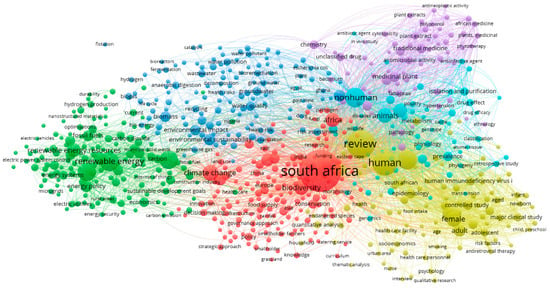
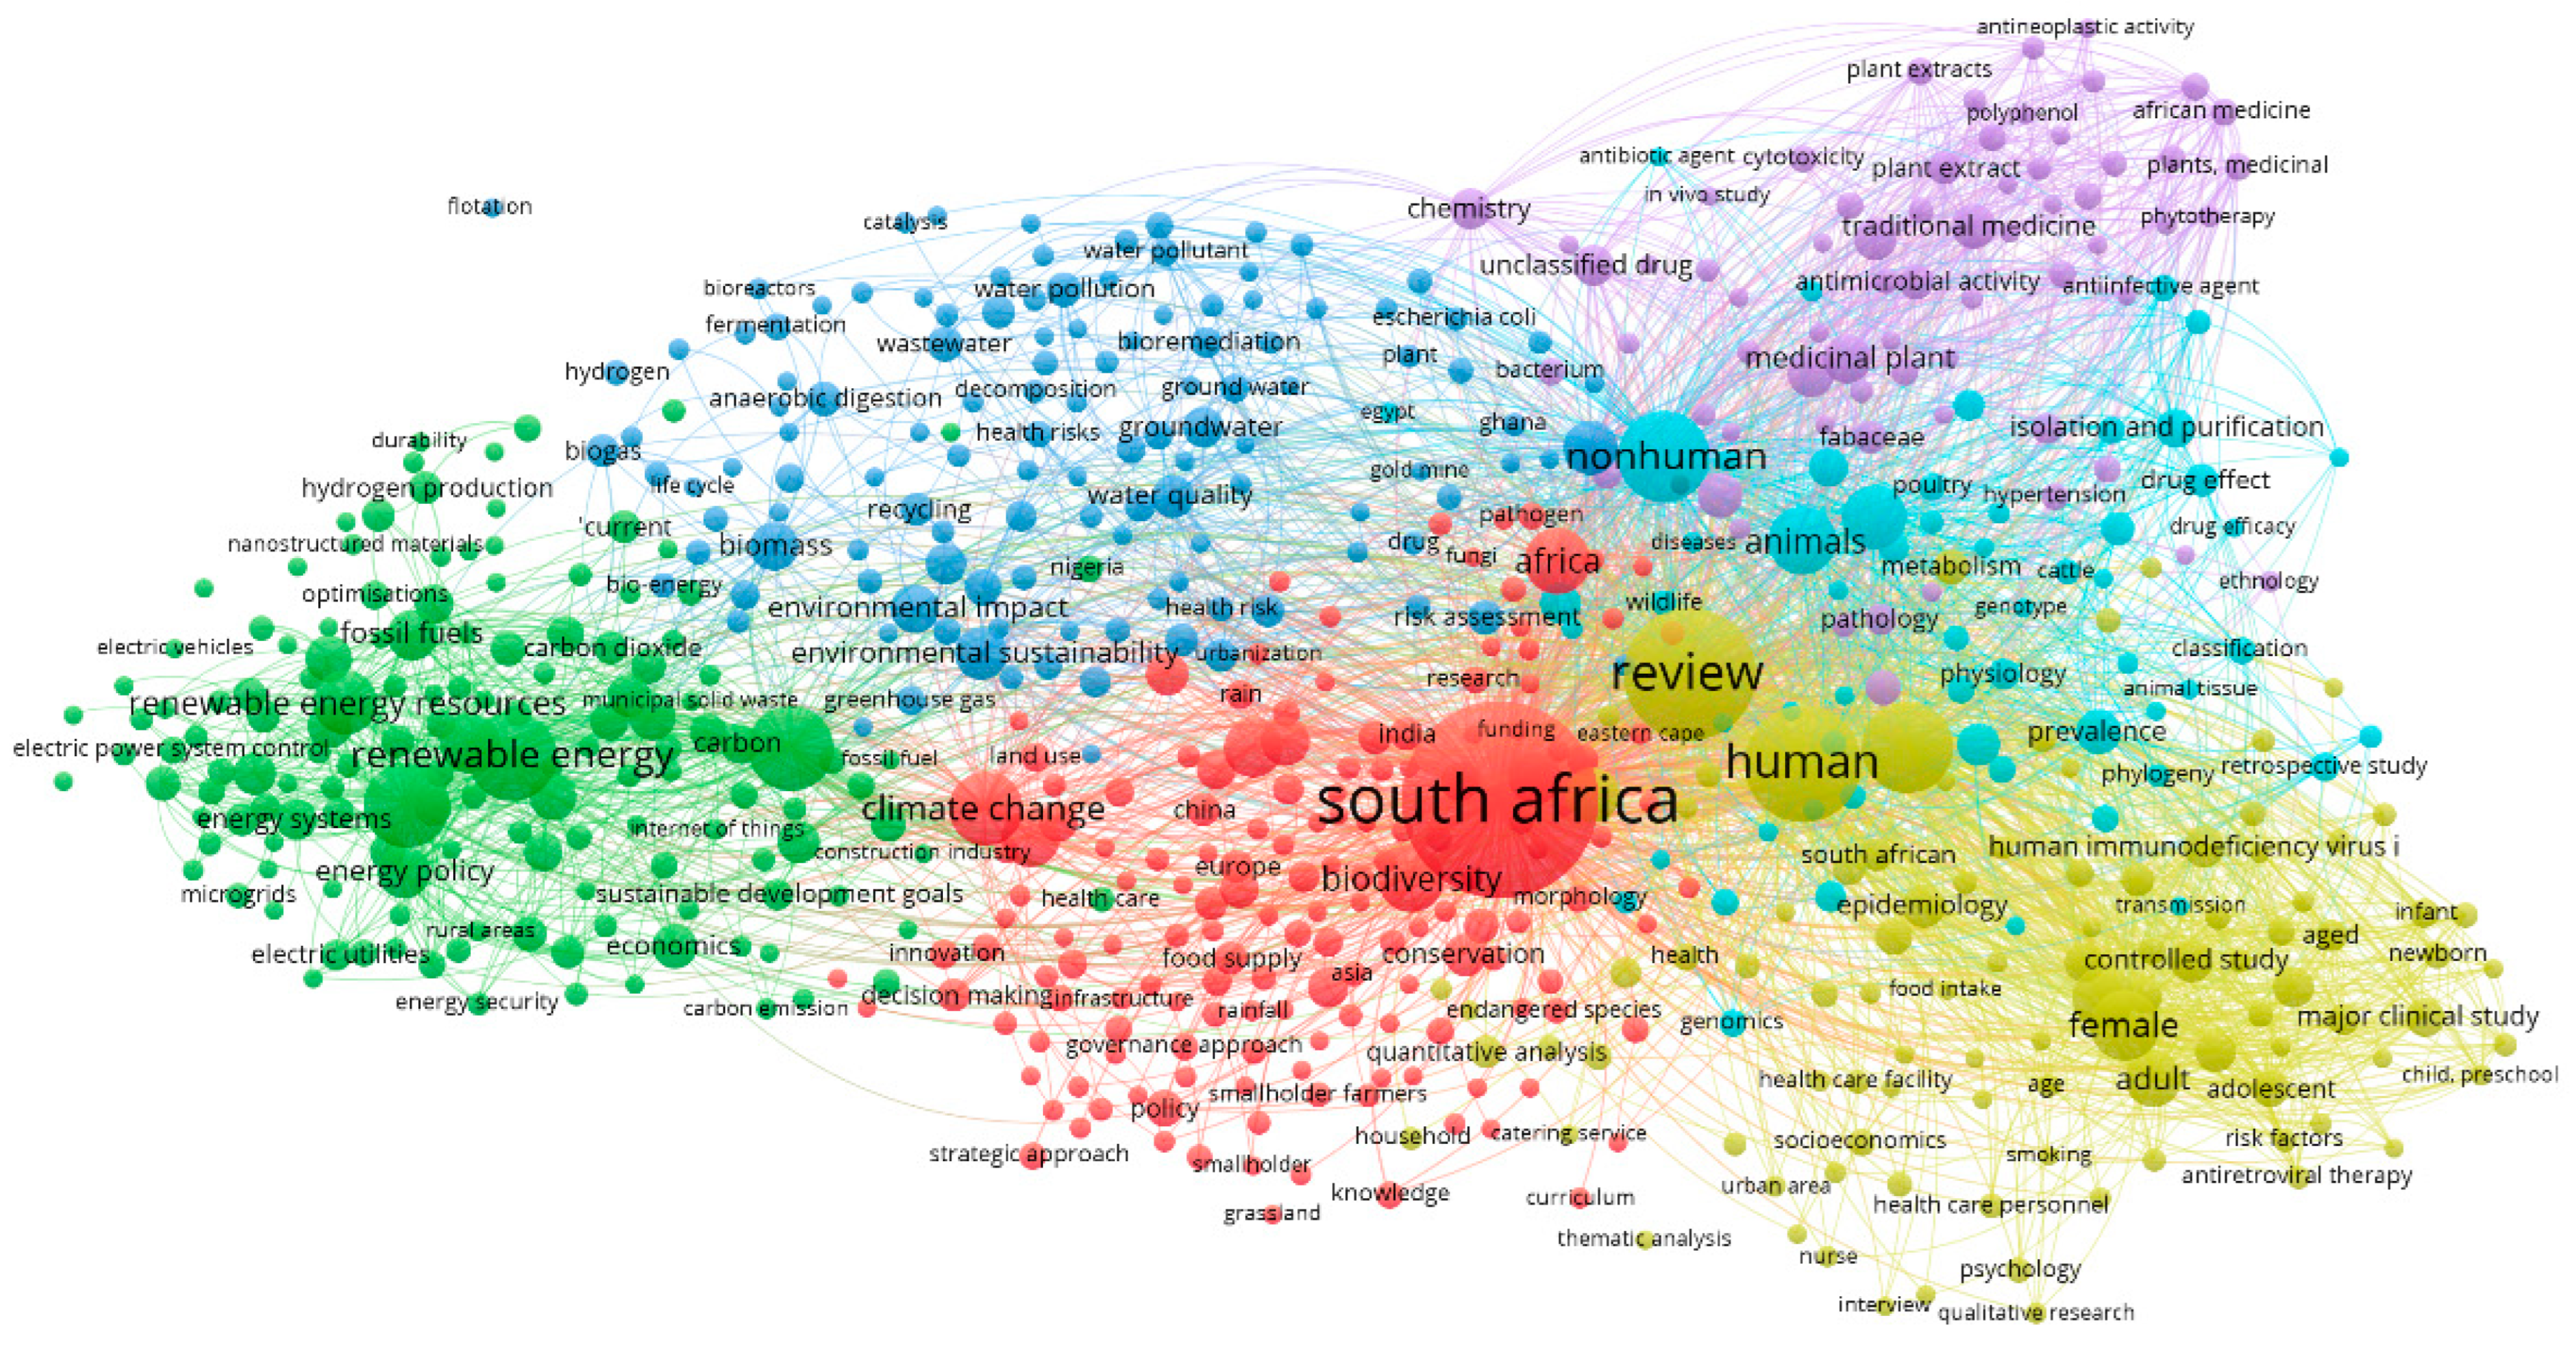
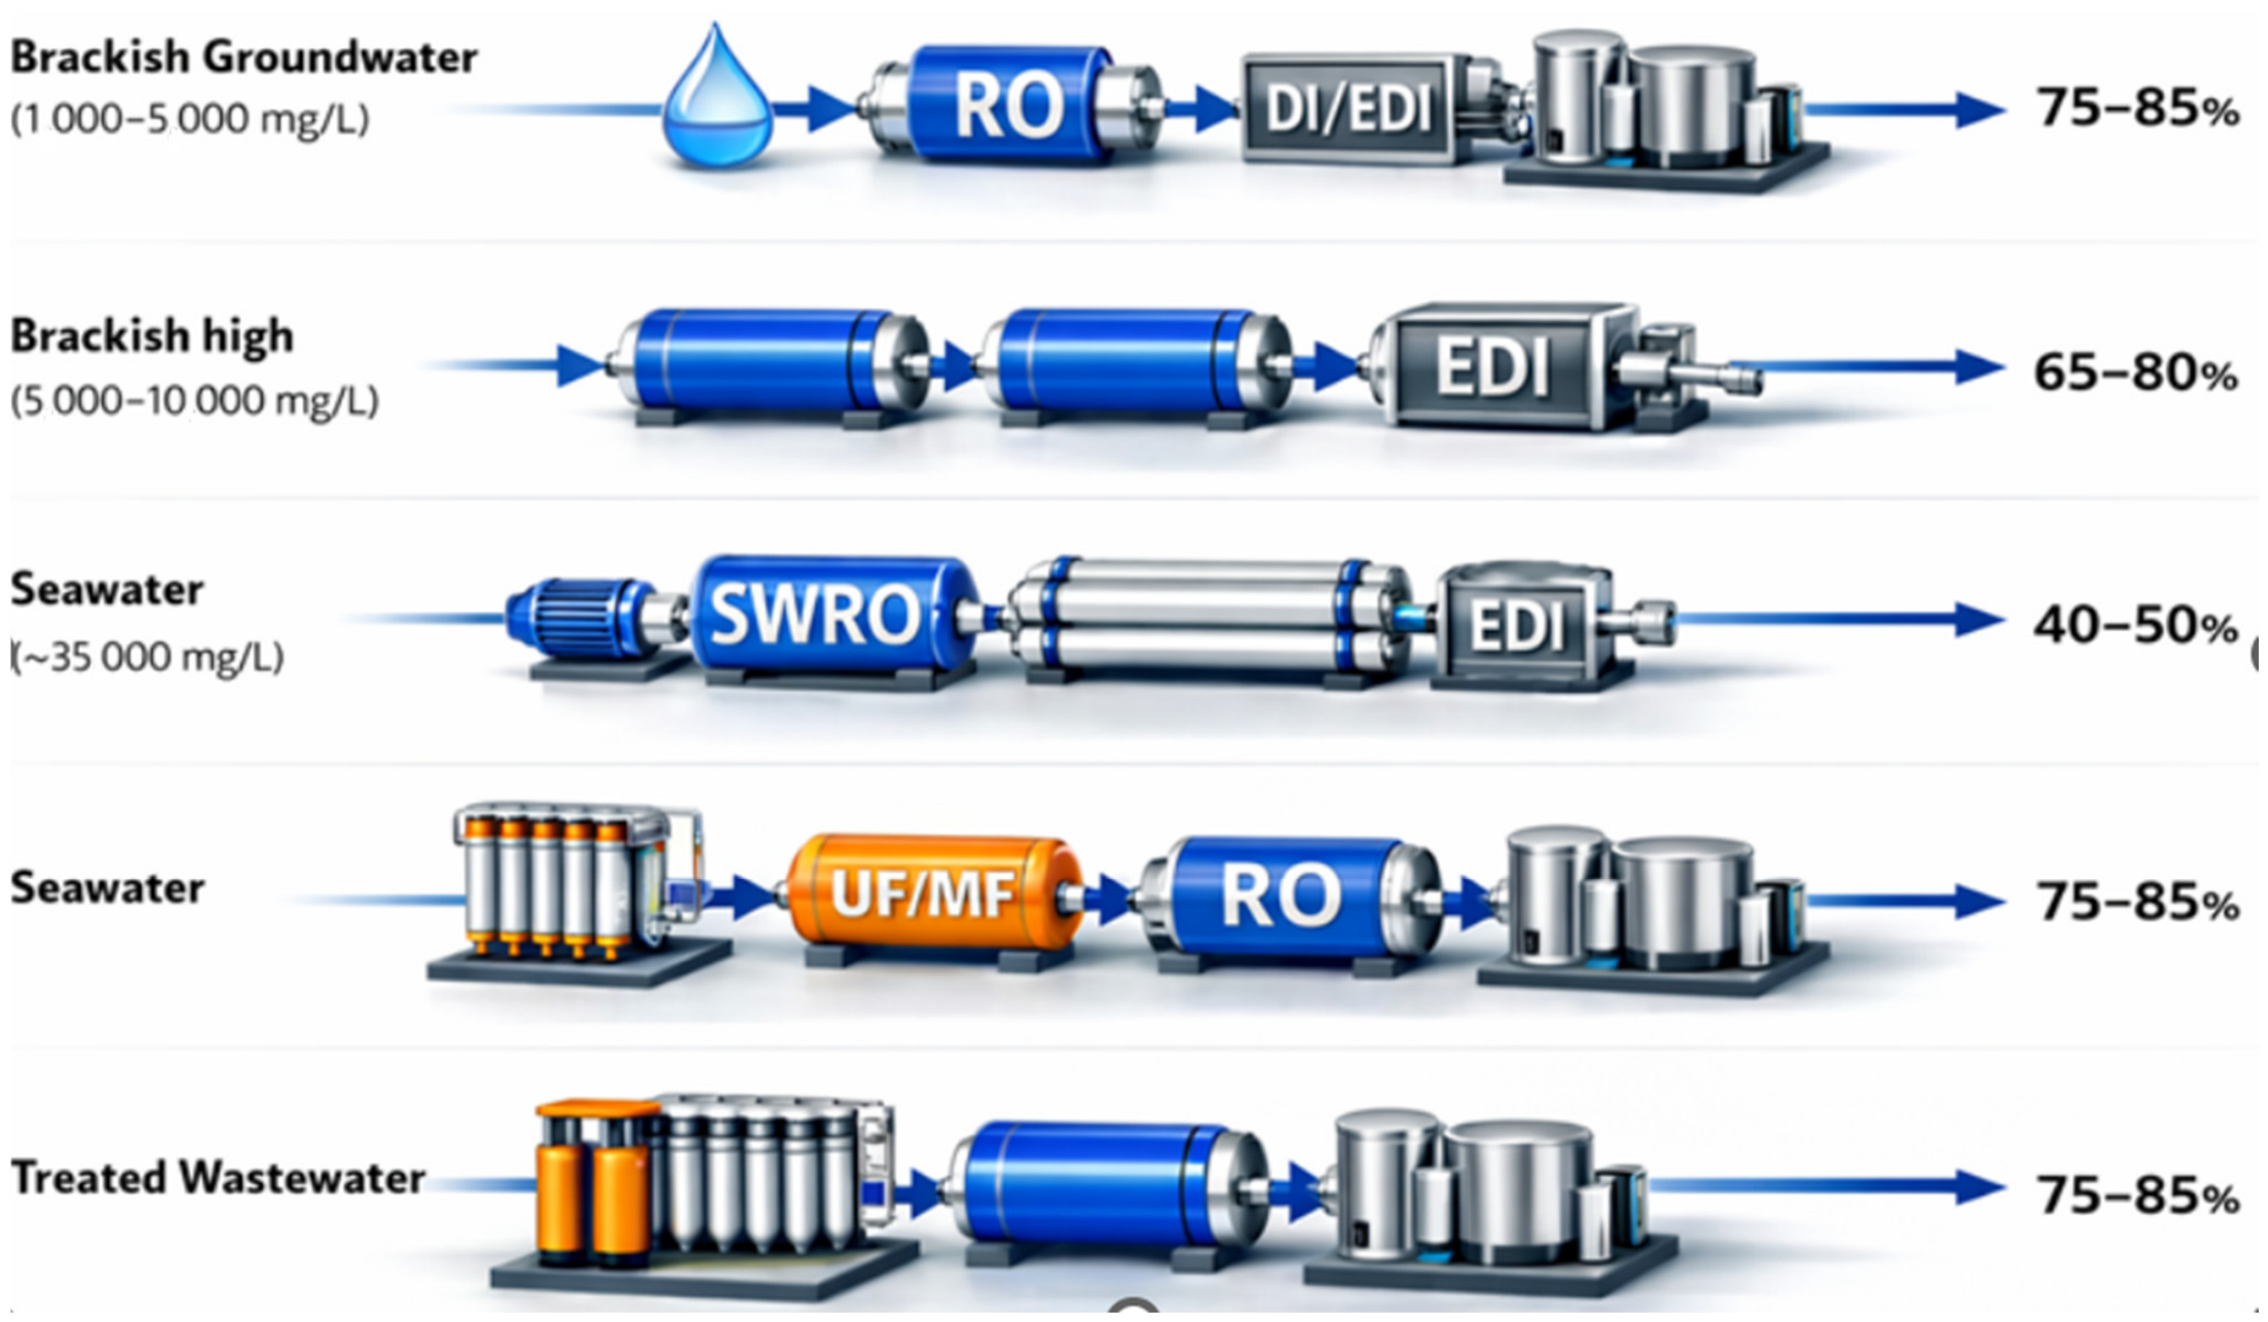
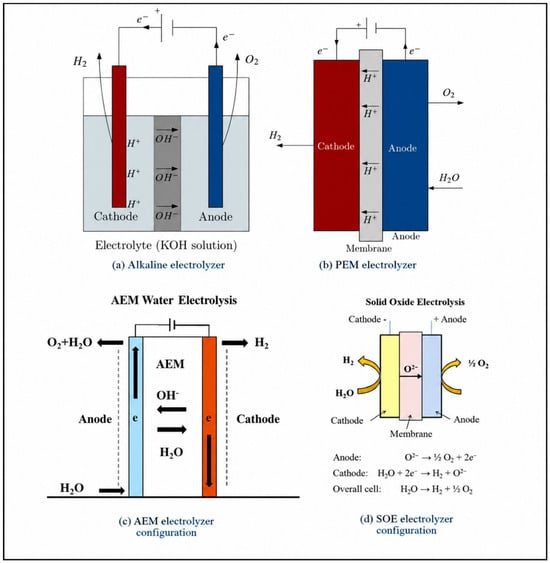
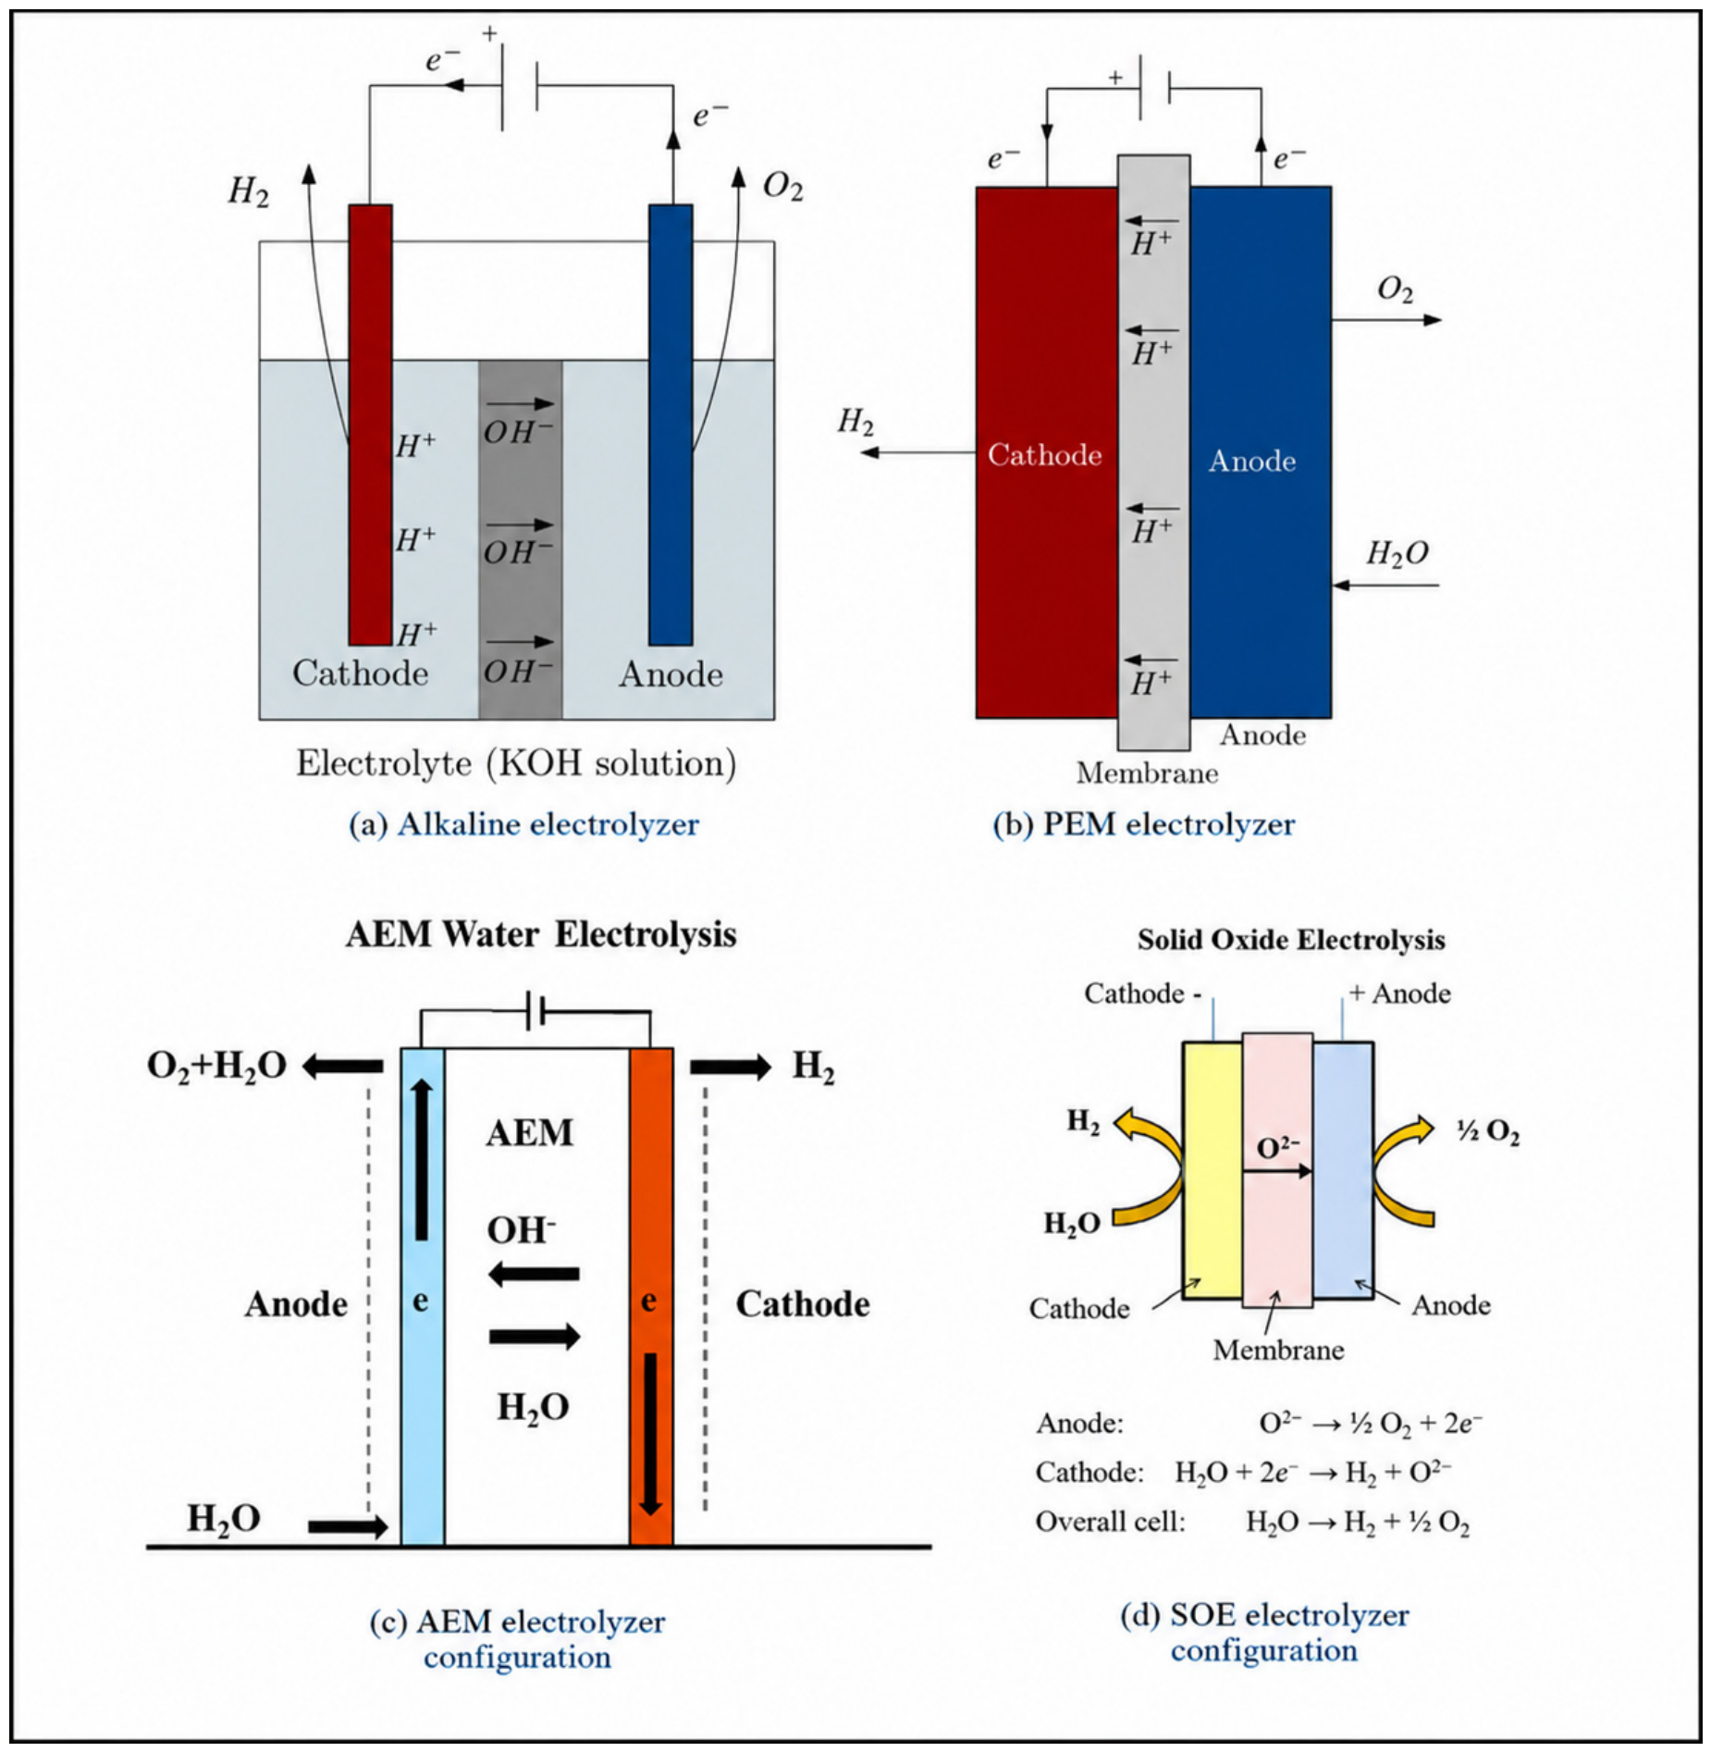
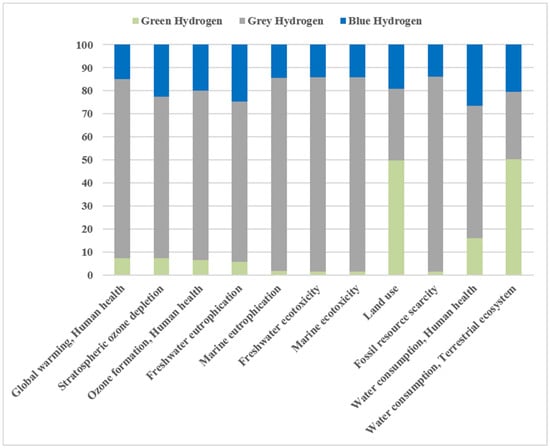
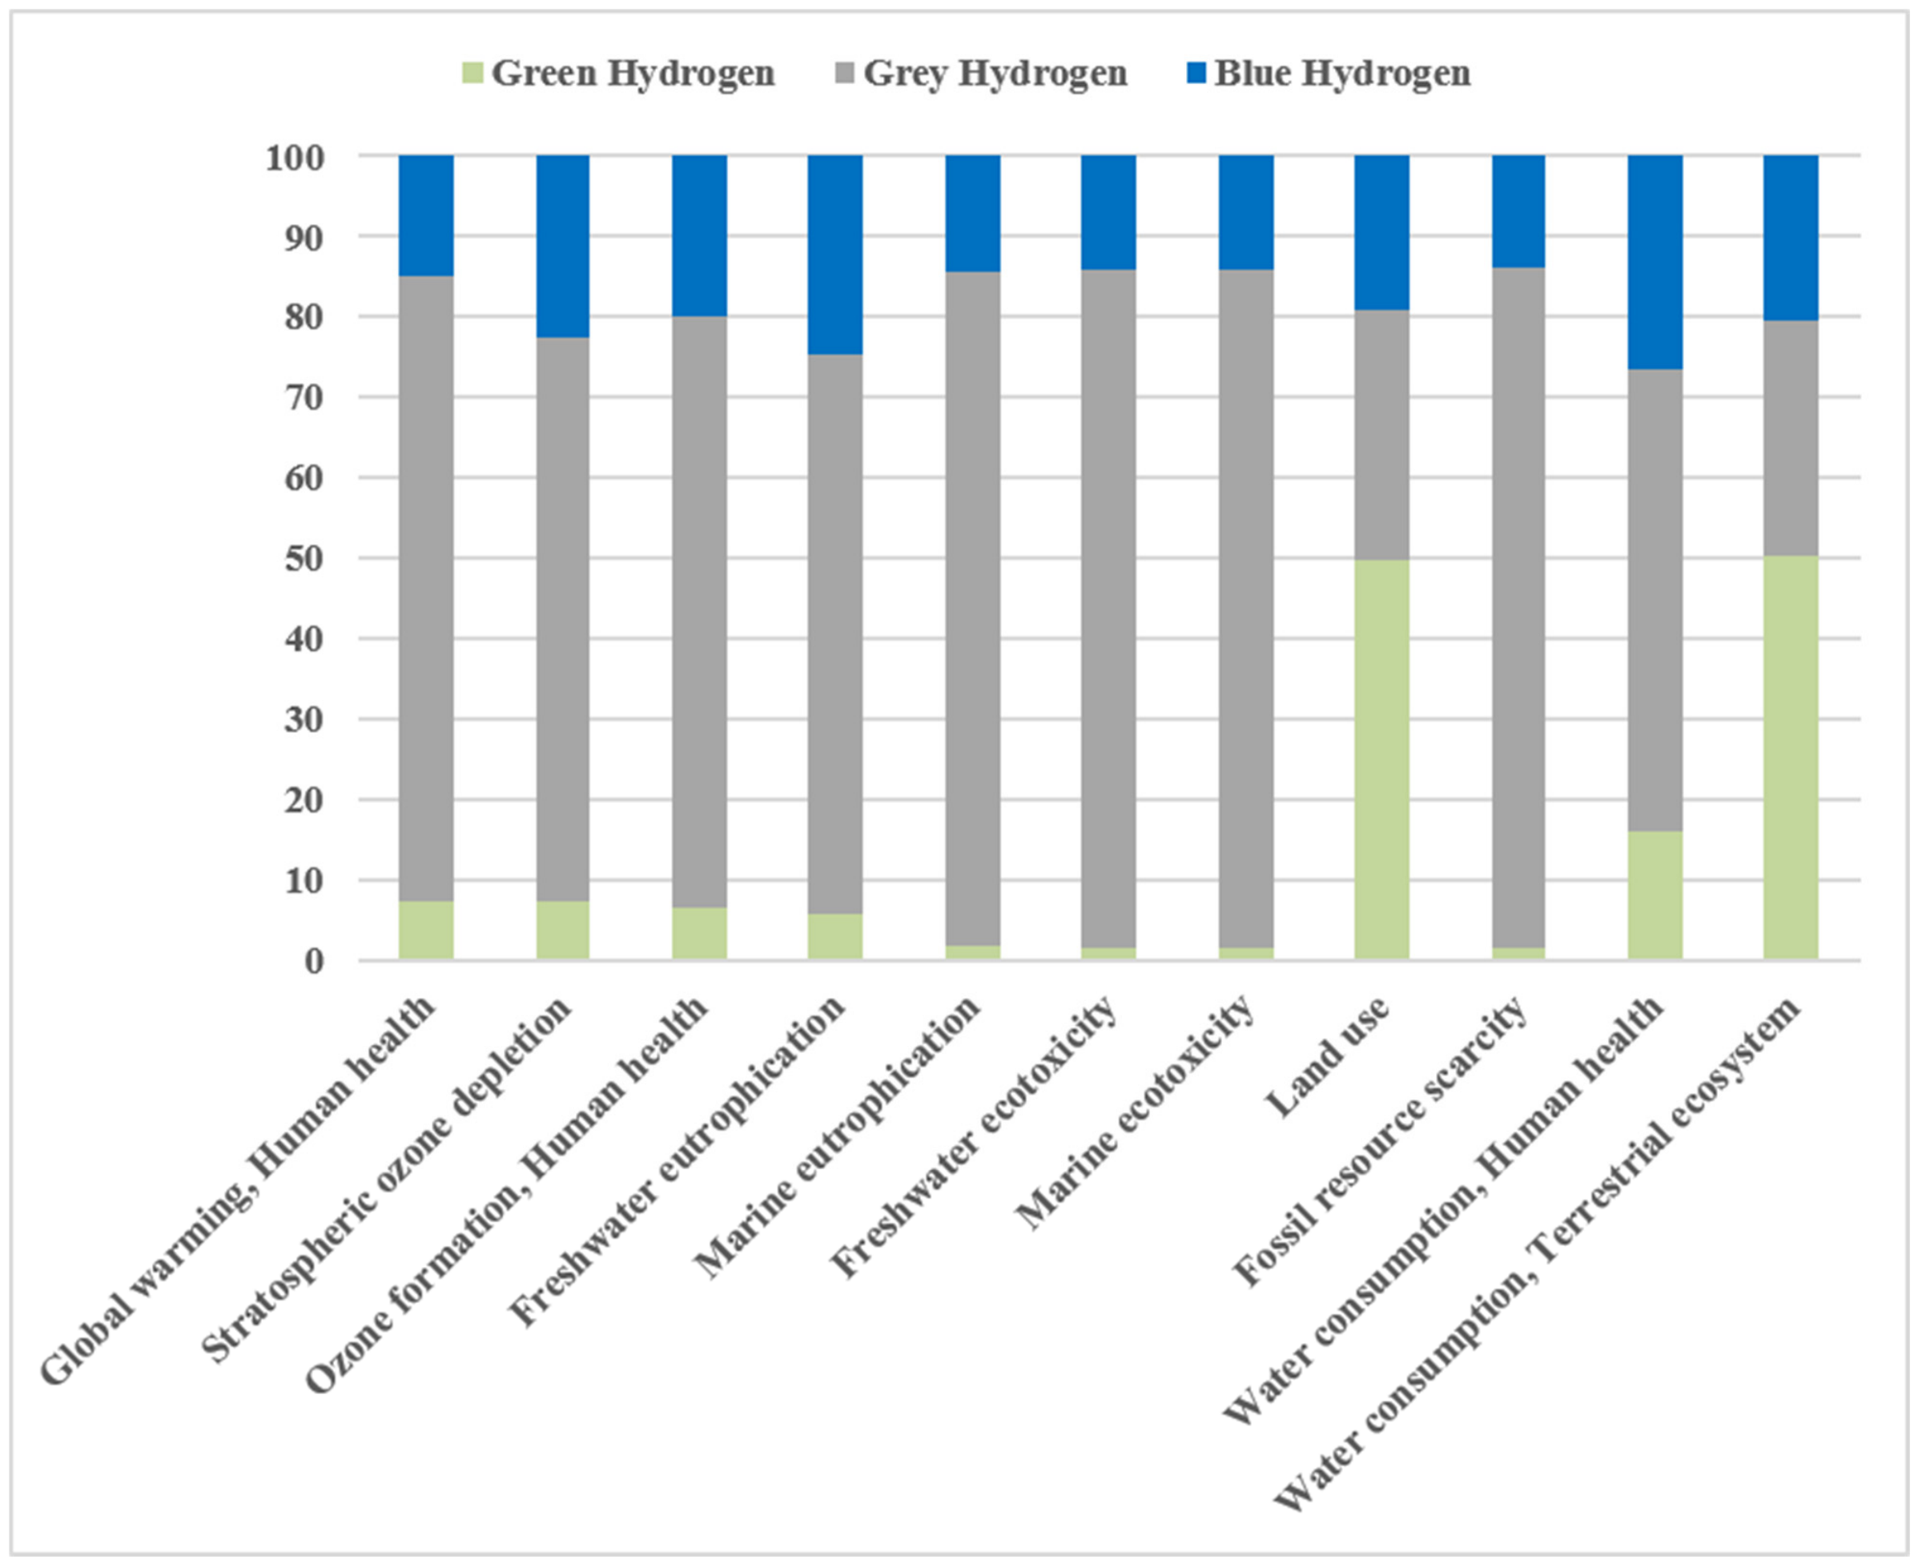
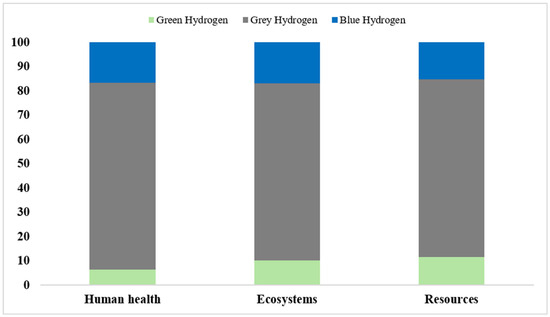
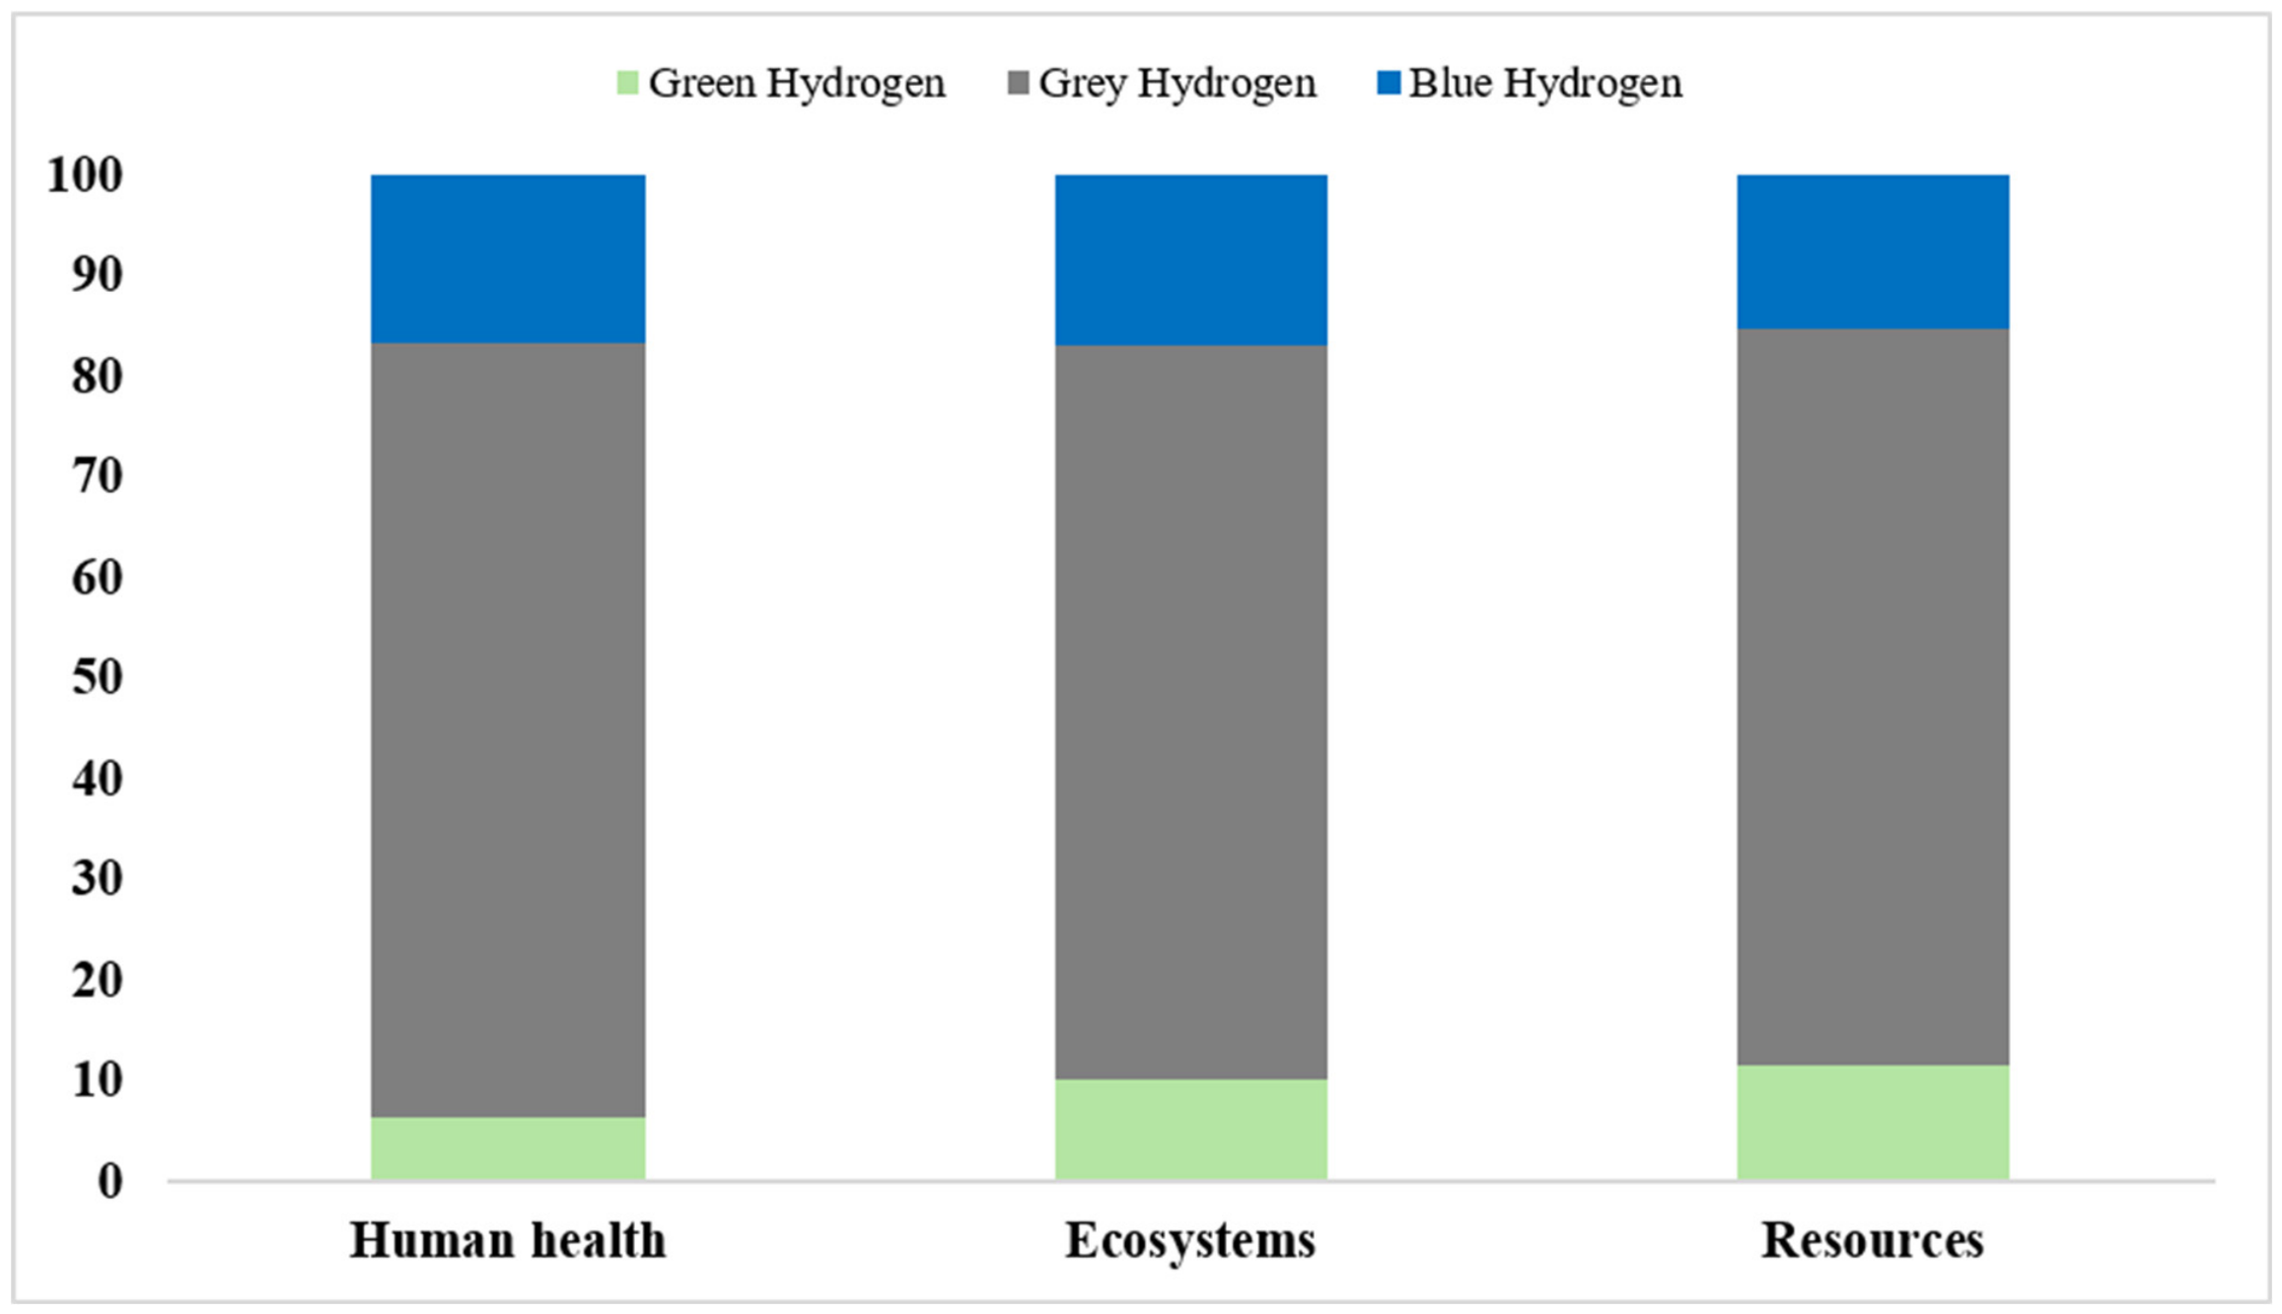
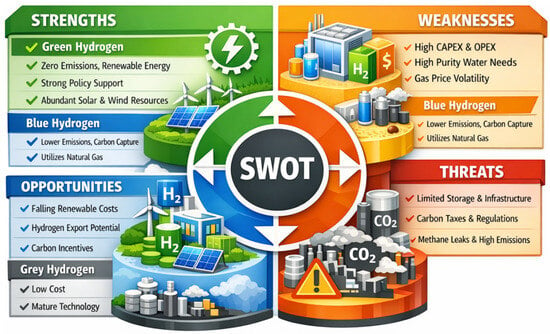
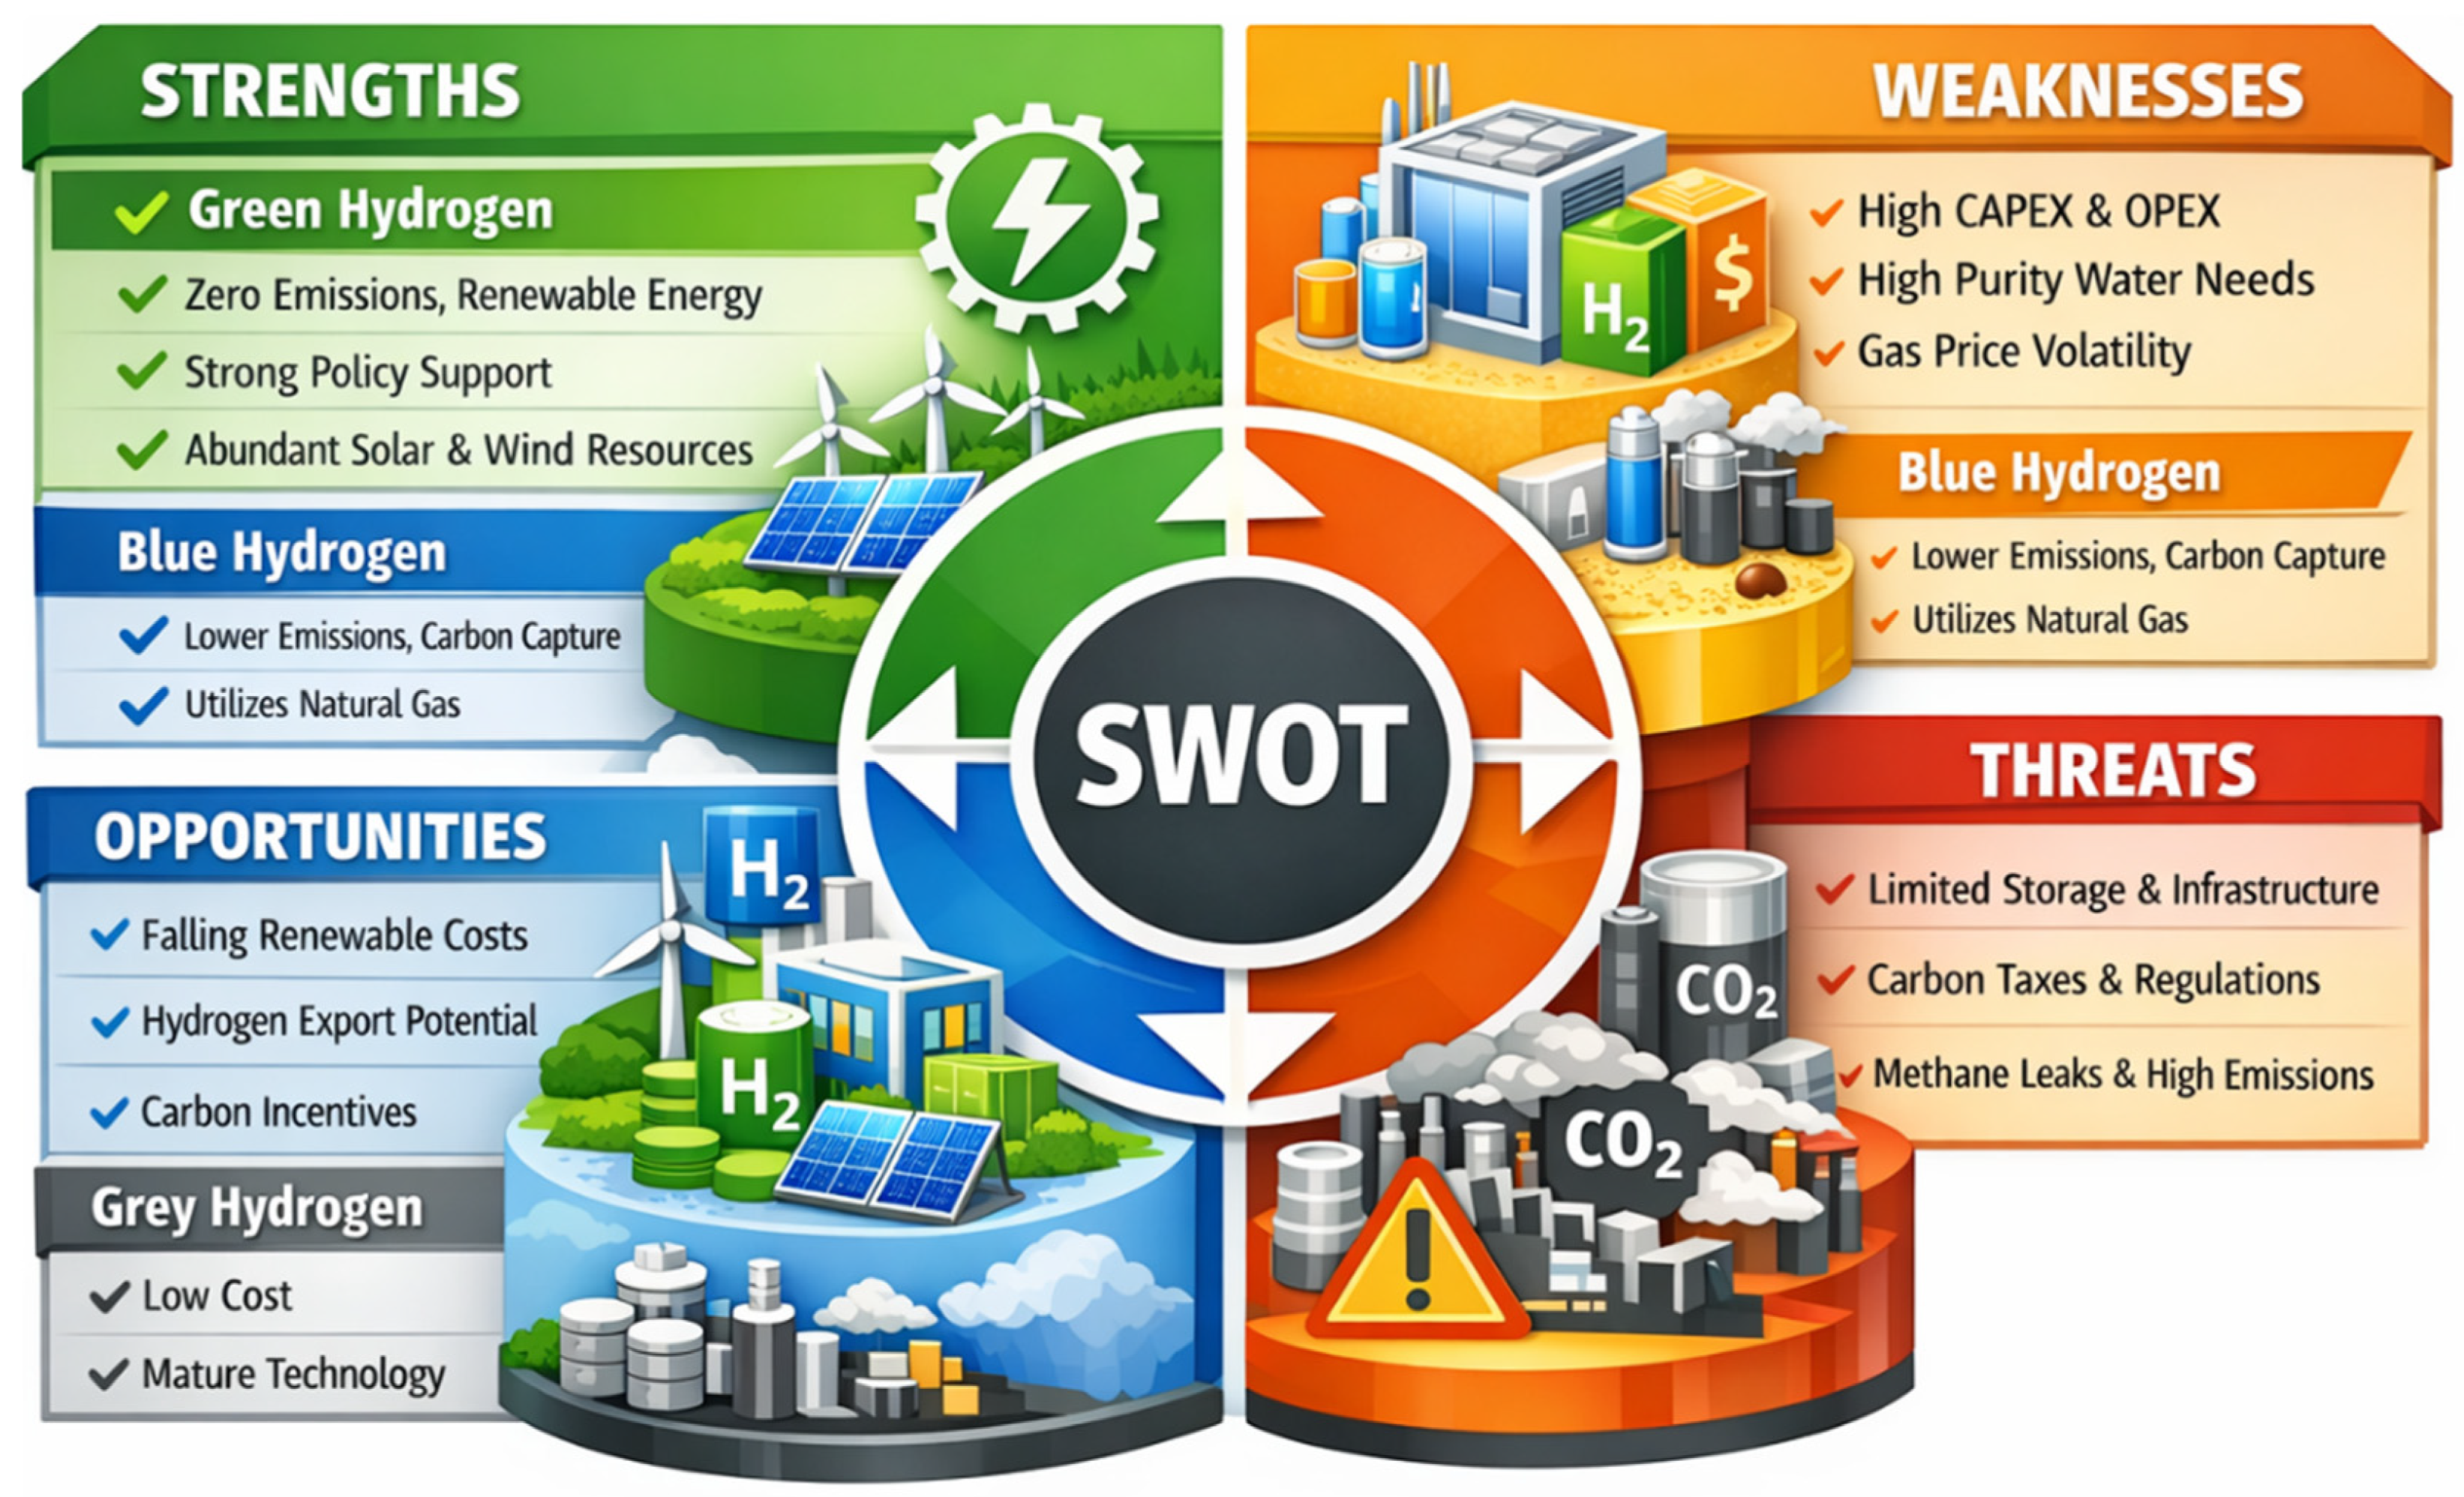
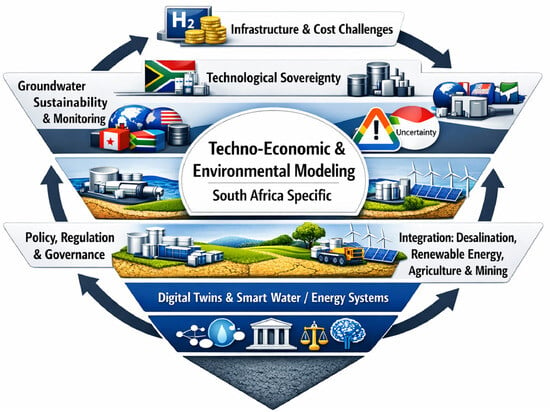
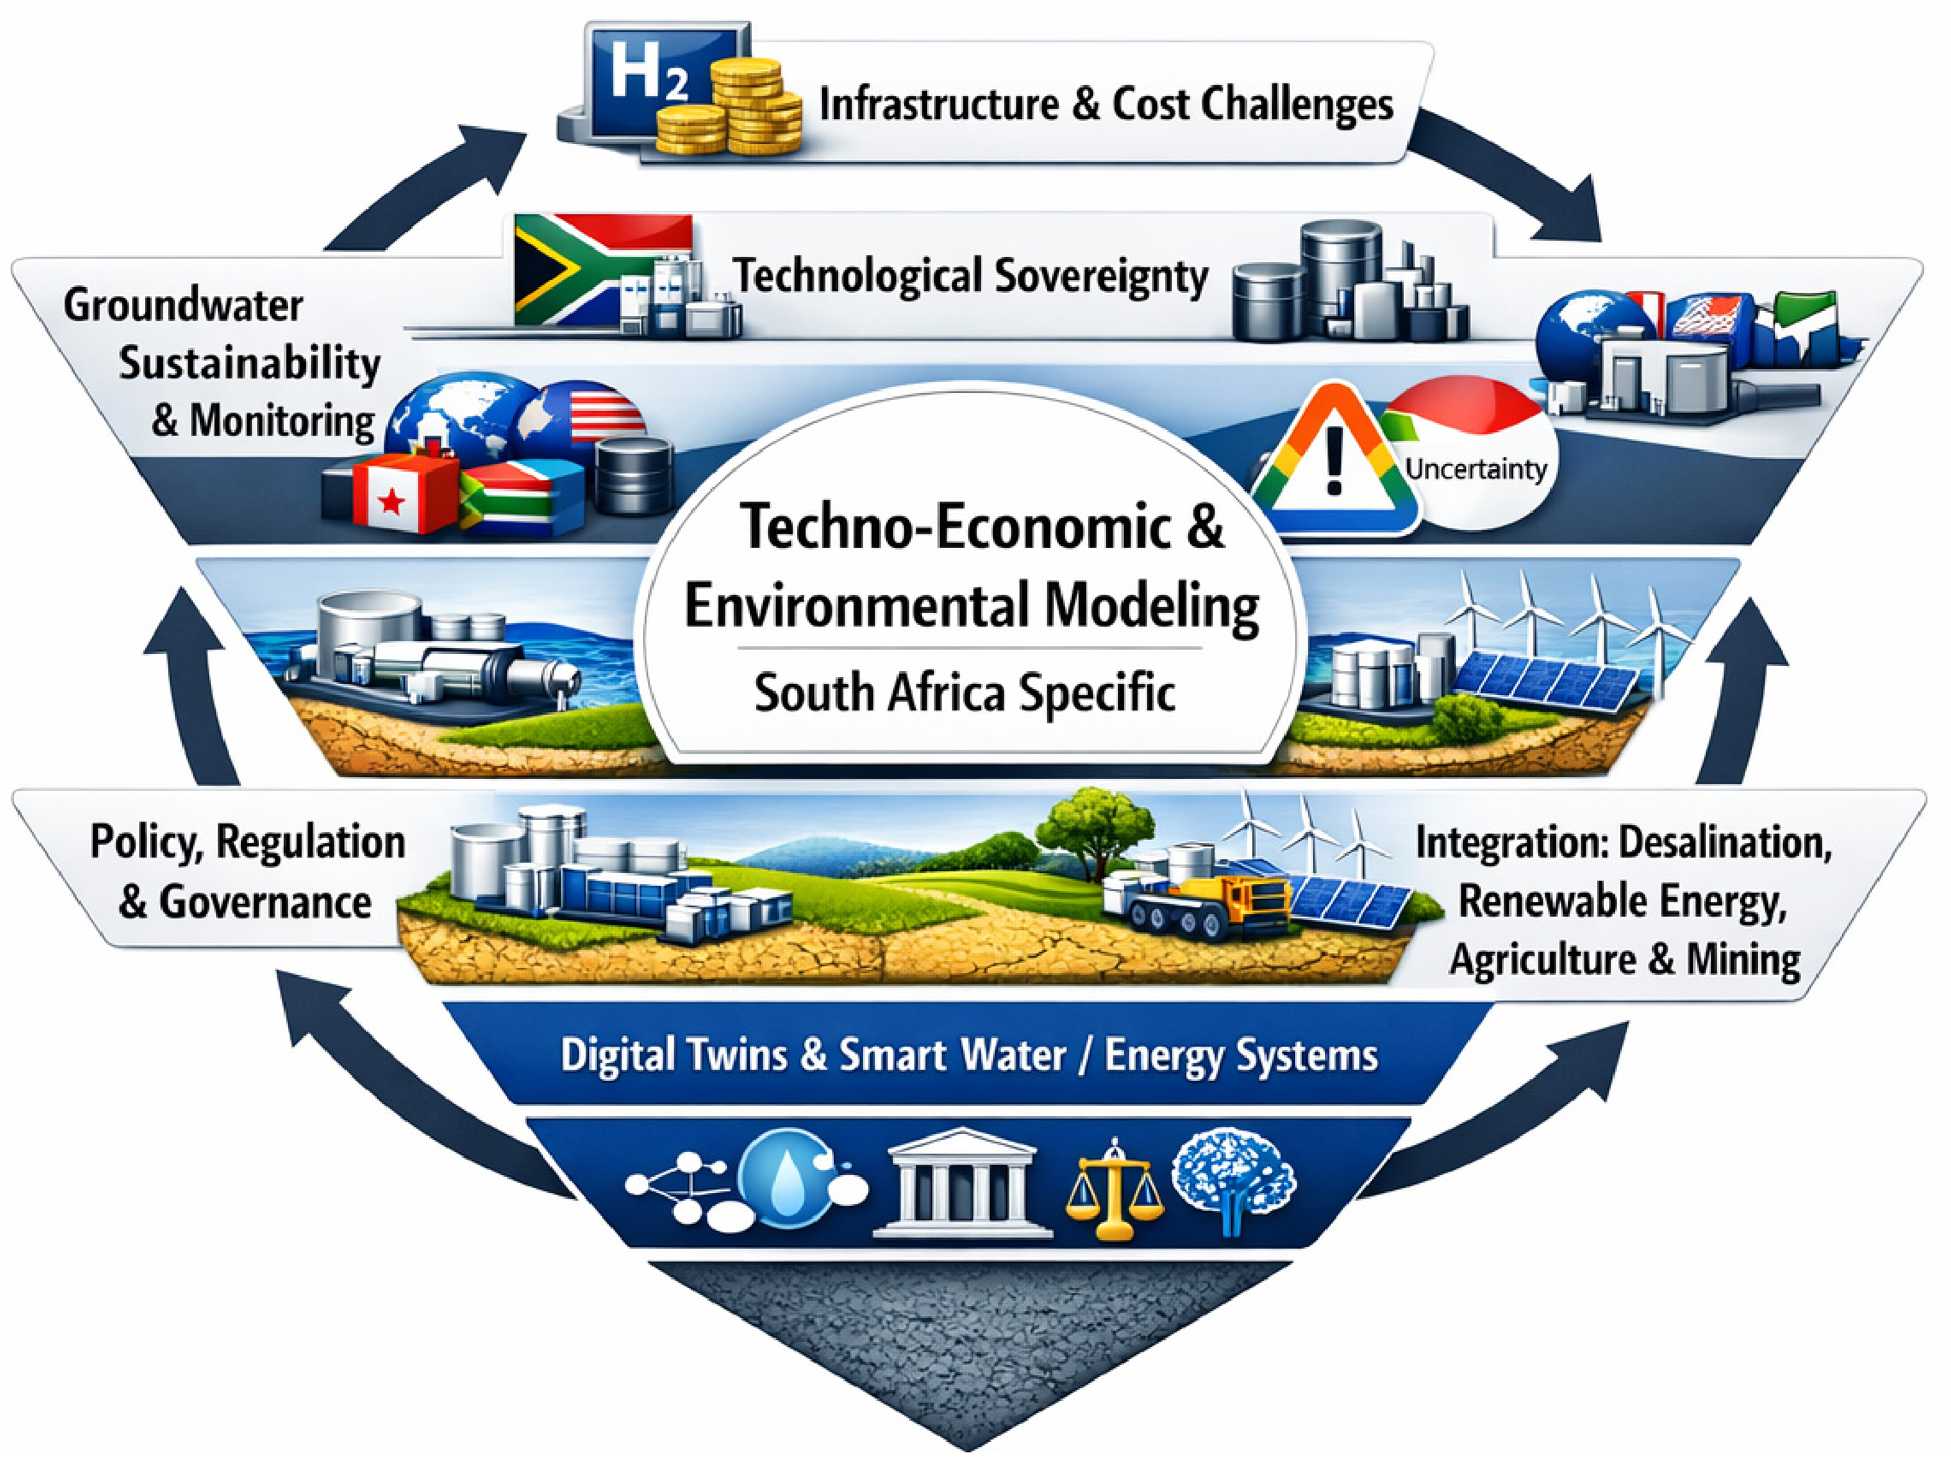

Disclaimer/Publisher’s Note: The statements, opinions and data contained in all publications are solely those of the individual author(s) and contributor(s) and not of MDPI and/or the editor(s). MDPI and/or the editor(s) disclaim responsibility for any injury to people or property resulting from any ideas, methods, instructions or products referred to in the content. |
© 2026 by the authors. Licensee MDPI, Basel, Switzerland. This article is an open access article distributed under the terms and conditions of the Creative Commons Attribution (CC BY) license.