


Abstract
Mountain transition zones are highly sensitive to environmental change, yet the nonlinear coupling between topography and hydroclimate in controlling vegetation Net Primary Productivity (NPP) remains insufficiently constrained. Here, we reconstructed a 2003–2025 annual NPP time series for the West Qinling Mountains using a Carnegie–Ames–Stanford Approach (CASA)-based workflow that integrated Moderate Resolution Imaging Spectroradiometer (MODIS) vegetation products, fifth-generation European Centre for Medium-Range Weather Forecasts reanalysis for land (ERA5-Land) meteorological data, Shuttle Radar Topography Mission (SRTM) topography, and an Aridity Index (AI) dataset. Product-based validation against the annual MOD17A3HGF dataset indicated strong agreement, with a 23-year mean spatial Spearman correlation of 0.823 and a mean annual Pearson correlation of 0.773. The reconstructed dataset showed that 98.50% of the study area experienced increasing NPP, including 50.26% with significant increases, and the domain-wide mean Sen slope reached approximately 3.08 g C m−2 yr−1. Factor detection further showed that radiation (q = 0.253), elevation (q = 0.252), and temperature (q = 0.249) were the dominant single controls, whereas Aridity–Temperature (q = 0.367) and Elevation–Aridity (q = 0.367) represented the strongest interactions. The concentration of the strongest gains in gentle-slope and moderate-aridity settings suggests that vegetation recovery is maximized where topographic buffering and water-energy balance are jointly optimized. These results strengthen the interpretation of NPP dynamics in mountainous climate-transition environments and provide a basis for spatially targeted ecological restoration, regional carbon-budget assessment, and climate adaptation planning.
1. Introduction
Terrestrial ecosystems play a central role in the global carbon cycle, and vegetation Net Primary Productivity (NPP) is a widely used indicator of ecosystem functioning, carbon sequestration capacity, and terrestrial carbon-sink strength [1,2,3,4]. Under ongoing climate change, ecologically fragile regions and climate transition zones are particularly sensitive to environmental disturbance [5,6]. Monitoring NPP dynamics in these settings is therefore important both for understanding biosphere–atmosphere feedbacks and for supporting ecological conservation and carbon-neutrality strategies [7,8].
Extensive research has examined the climatic drivers of NPP, most often emphasizing the isolated effects of temperature and precipitation [9,10]. In mountainous terrain, however, topography redistributes water and energy locally and thereby alters vegetation growth conditions [11,12,13,14]. Even so, many previous studies have treated climate and topography as independent controls or have focused mainly on single-factor effects [15,16]. A key unresolved issue is how multidimensional topographic features interact nonlinearly with climatic gradients, especially wet–dry gradients, to shape NPP dynamics. Recent studies increasingly suggest that aridity thresholds and vegetation sensitivity are tightly linked to topographic variation [2,13,14,17,18], but the coupled mechanisms through which topographic heterogeneity and local hydroclimate jointly regulate ecosystem productivity remain poorly resolved.
The Carnegie–Ames–Stanford Approach (CASA), a light-use-efficiency model, has been widely applied to large-scale NPP estimation [19,20]. Cloud-based platforms such as Google Earth Engine (GEE) have further improved the efficiency of implementing CASA at high spatiotemporal resolution, as shown in recent studies of grassland and urbanized regions [21,22,23]. Nevertheless, many applications still face limitations related to coarse meteorological forcing, insufficient topographic correction, and limited validation, even where improved tCASA-type approaches have been explored in complex mountain environments [24,25].
The West Qinling Mountains form a critical ecological security barrier in China and provide an ideal natural laboratory for addressing these questions. Located at the junction of the Qinghai-Tibet Plateau and the Loess Plateau, the region is characterized by fragmented terrain, strong elevational gradients, and sharp environmental contrasts that contribute to marked spatiotemporal heterogeneity in carbon dynamics [26,27,28]. It also represents a typical transition from warm-temperate semi-humid conditions to alpine semi-arid conditions. Recent studies have highlighted both the dynamic NPP changes of this region and its vulnerability to extreme climate events [29,30]. These features make vegetation dynamics in the West Qinling Mountains especially responsive to both large-scale climate forcing and local topographic control.
Against this background, this study investigates the vegetation–climate–topography nexus in the West Qinling Mountains. We test three working hypotheses: (H1) topographic factors regulate the spatial heterogeneity of NPP by redistributing hydrothermal conditions; (H2) interaction effects involving topography and aridity-related hydroclimatic gradients are dominant drivers of NPP dynamics; and (H3) an optimal topographic–climatic coupling zone exists in which vegetation productivity enhancement is maximized. Accordingly, the objectives are to: (1) reconstruct and evaluate a long-term annual NPP dataset for 2003–2025 using a CASA-based workflow; (2) quantify the spatiotemporal dynamics of NPP and its stratified responses to topography and aridity; (3) identify the dominant topographic–climatic drivers of NPP variation using Geodetector; and (4) locate ecologically favorable zones for targeted restoration.
2. Materials and Methods
2.1. Study Area
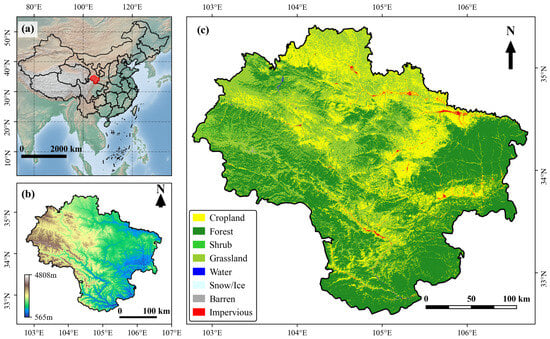
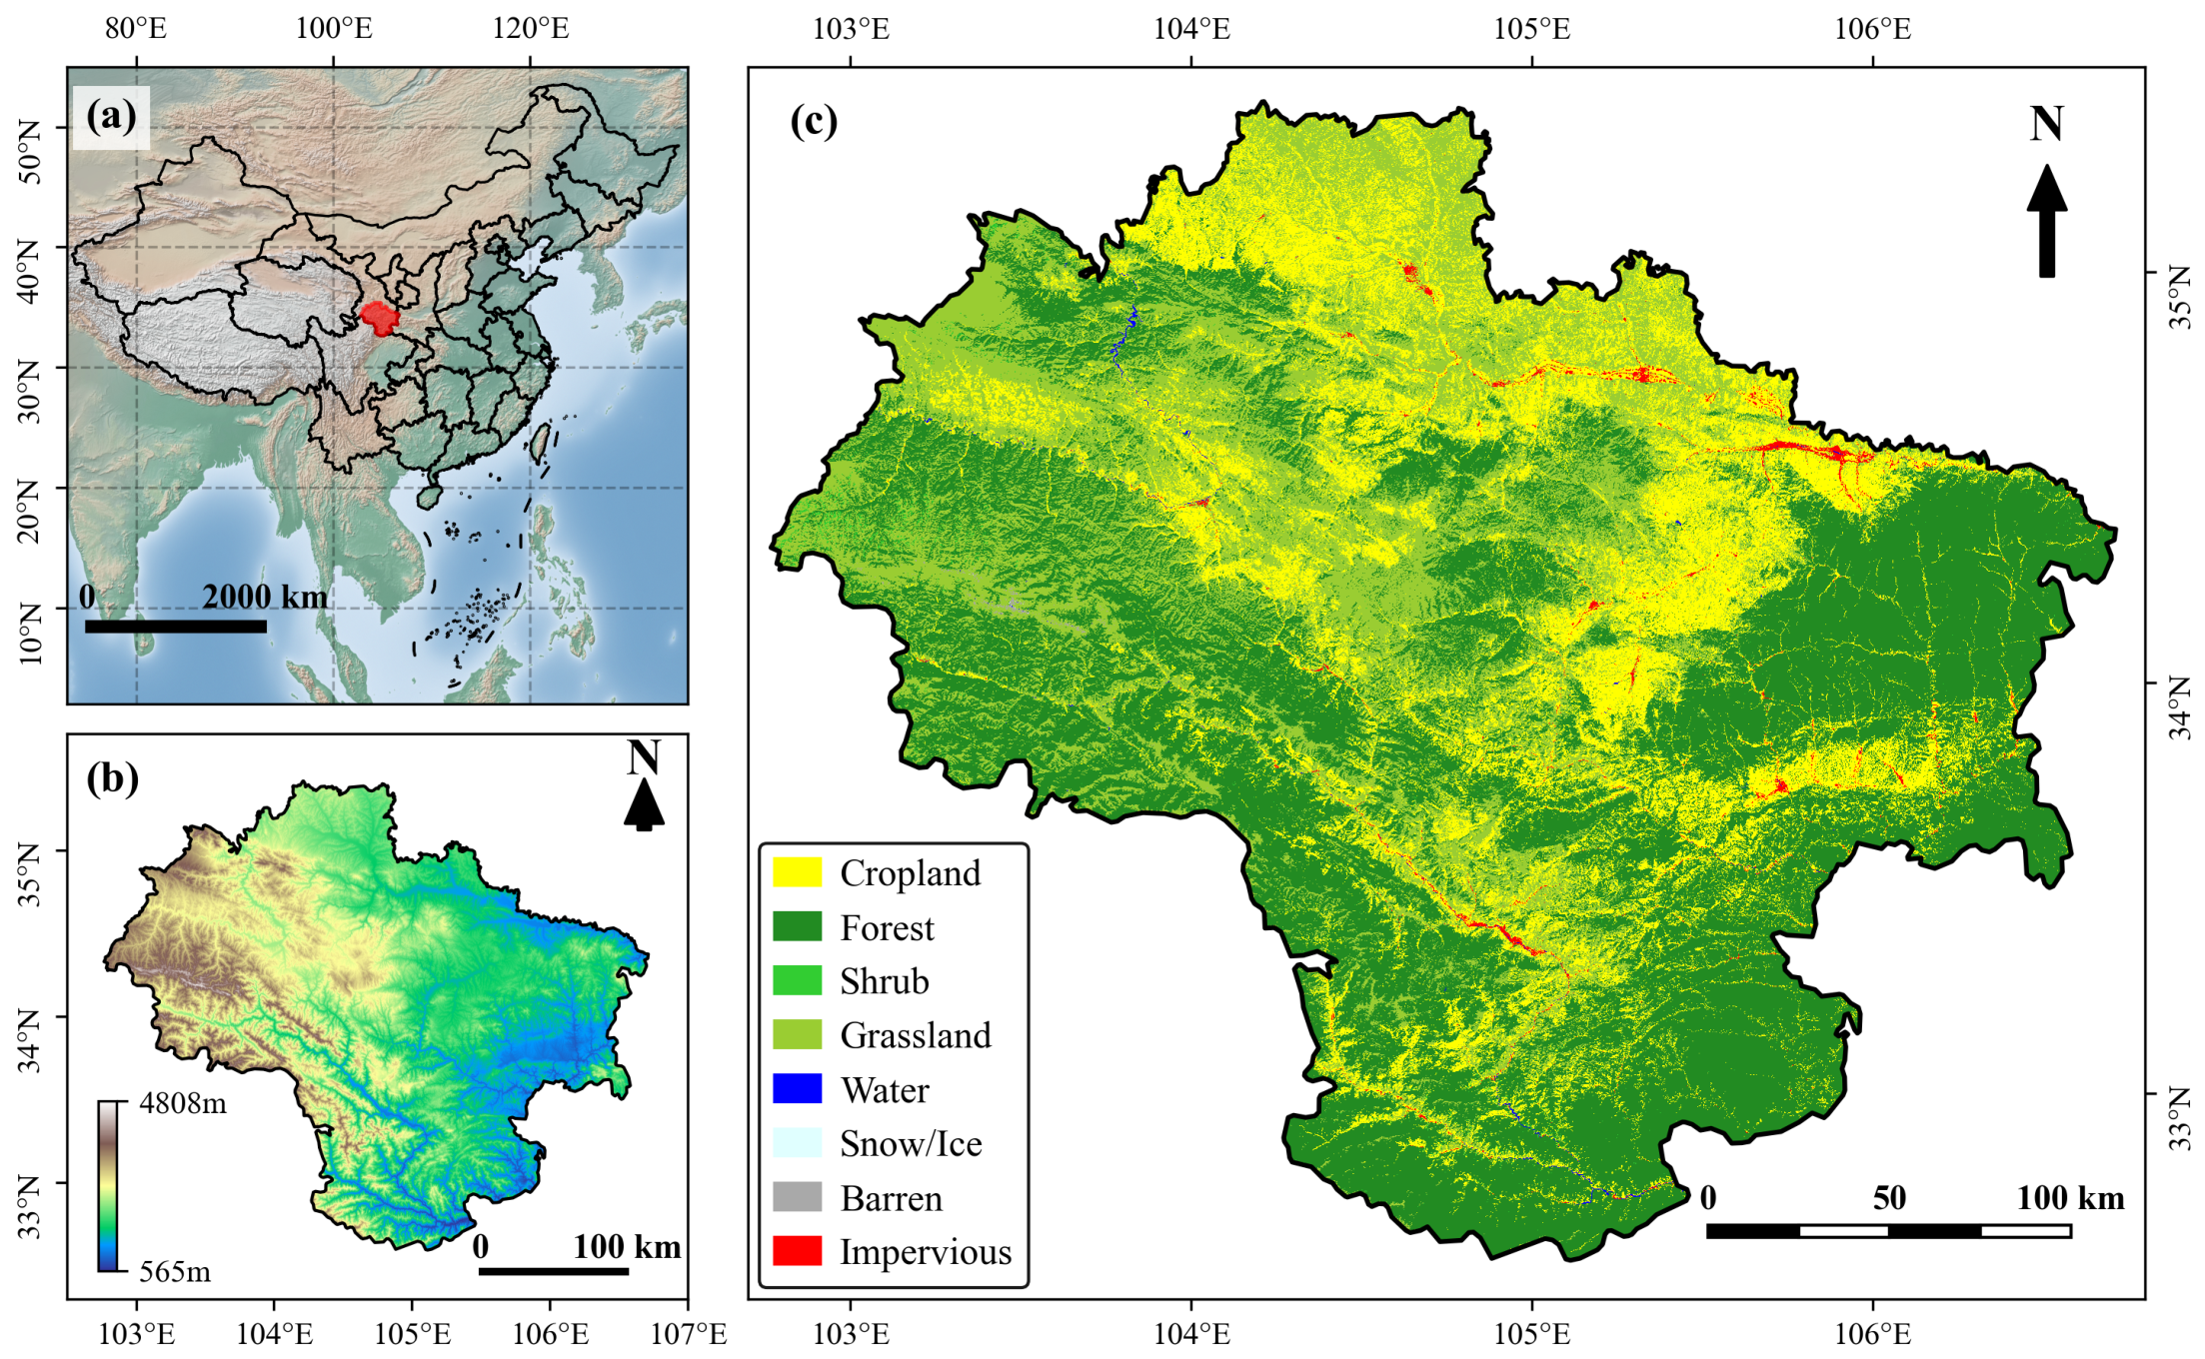
The West Qinling Mountains (102.7°–106.7° E, 32.5°–35.4° N) occupy a critical geographic juncture in central China, characterized by extreme topographic relief and profound climatic gradients. The study area covers approximately 62,000 km2, with elevations ranging from 460 m to over 5500 m (average elevation ~2300 m). The region experiences a transitional climate, with mean annual temperatures varying from −2.4 °C to 14.3 °C (regional average ~6.0 °C) and mean annual precipitation ranging from 400 mm to 800 mm. The complex terrain fosters a highly diverse distribution of vegetation types, predominantly including deciduous broadleaf forests, mixed broadleaf–conifer forests, and alpine meadows. The soil types are closely associated with the elevation gradient, encompassing brown earth, cinnamon soil, and alpine meadow soil. The regional setting and its environmental characteristics are shown in Figure 1.
Figure 1.
Location and characteristics of the study area in the West Qinling Mountains. (a) Location of the study area within China; (b) topography based on the Digital Elevation Model (DEM); (c) spatial distribution of land cover types in 2025.
2.2. Data Sources
Accurate NPP estimation requires consistent inputs of vegetation state, meteorological conditions, and topography. Moderate Resolution Imaging Spectroradiometer (MODIS) source products were accessed from NASA LP DAAC, meteorological fields were derived from the fifth-generation European Centre for Medium-Range Weather Forecasts reanalysis for land (ERA5-Land), and the annual CASA reconstruction was implemented through a hybrid workflow that combined remote-sensing data acquisition with local Python 3.11.15-based preprocessing, reprojection, annual aggregation, validation, and statistical analysis. The specific data sources are detailed in Table 1.
Table 1.
Detailed information of data sources used in this study.
2.3. CASA Model Implementation
The CASA model determines NPP as the product of Absorbed Photosynthetically Active Radiation (APAR) and actual light use efficiency ().
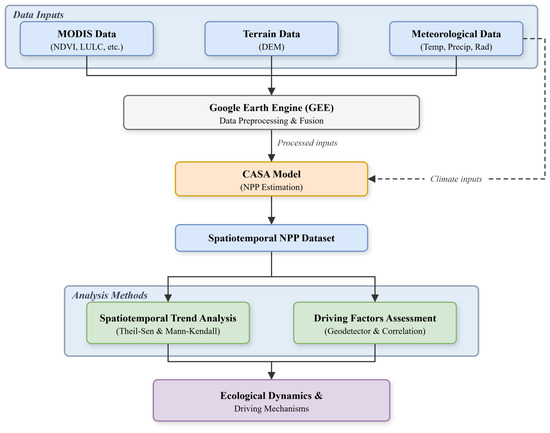
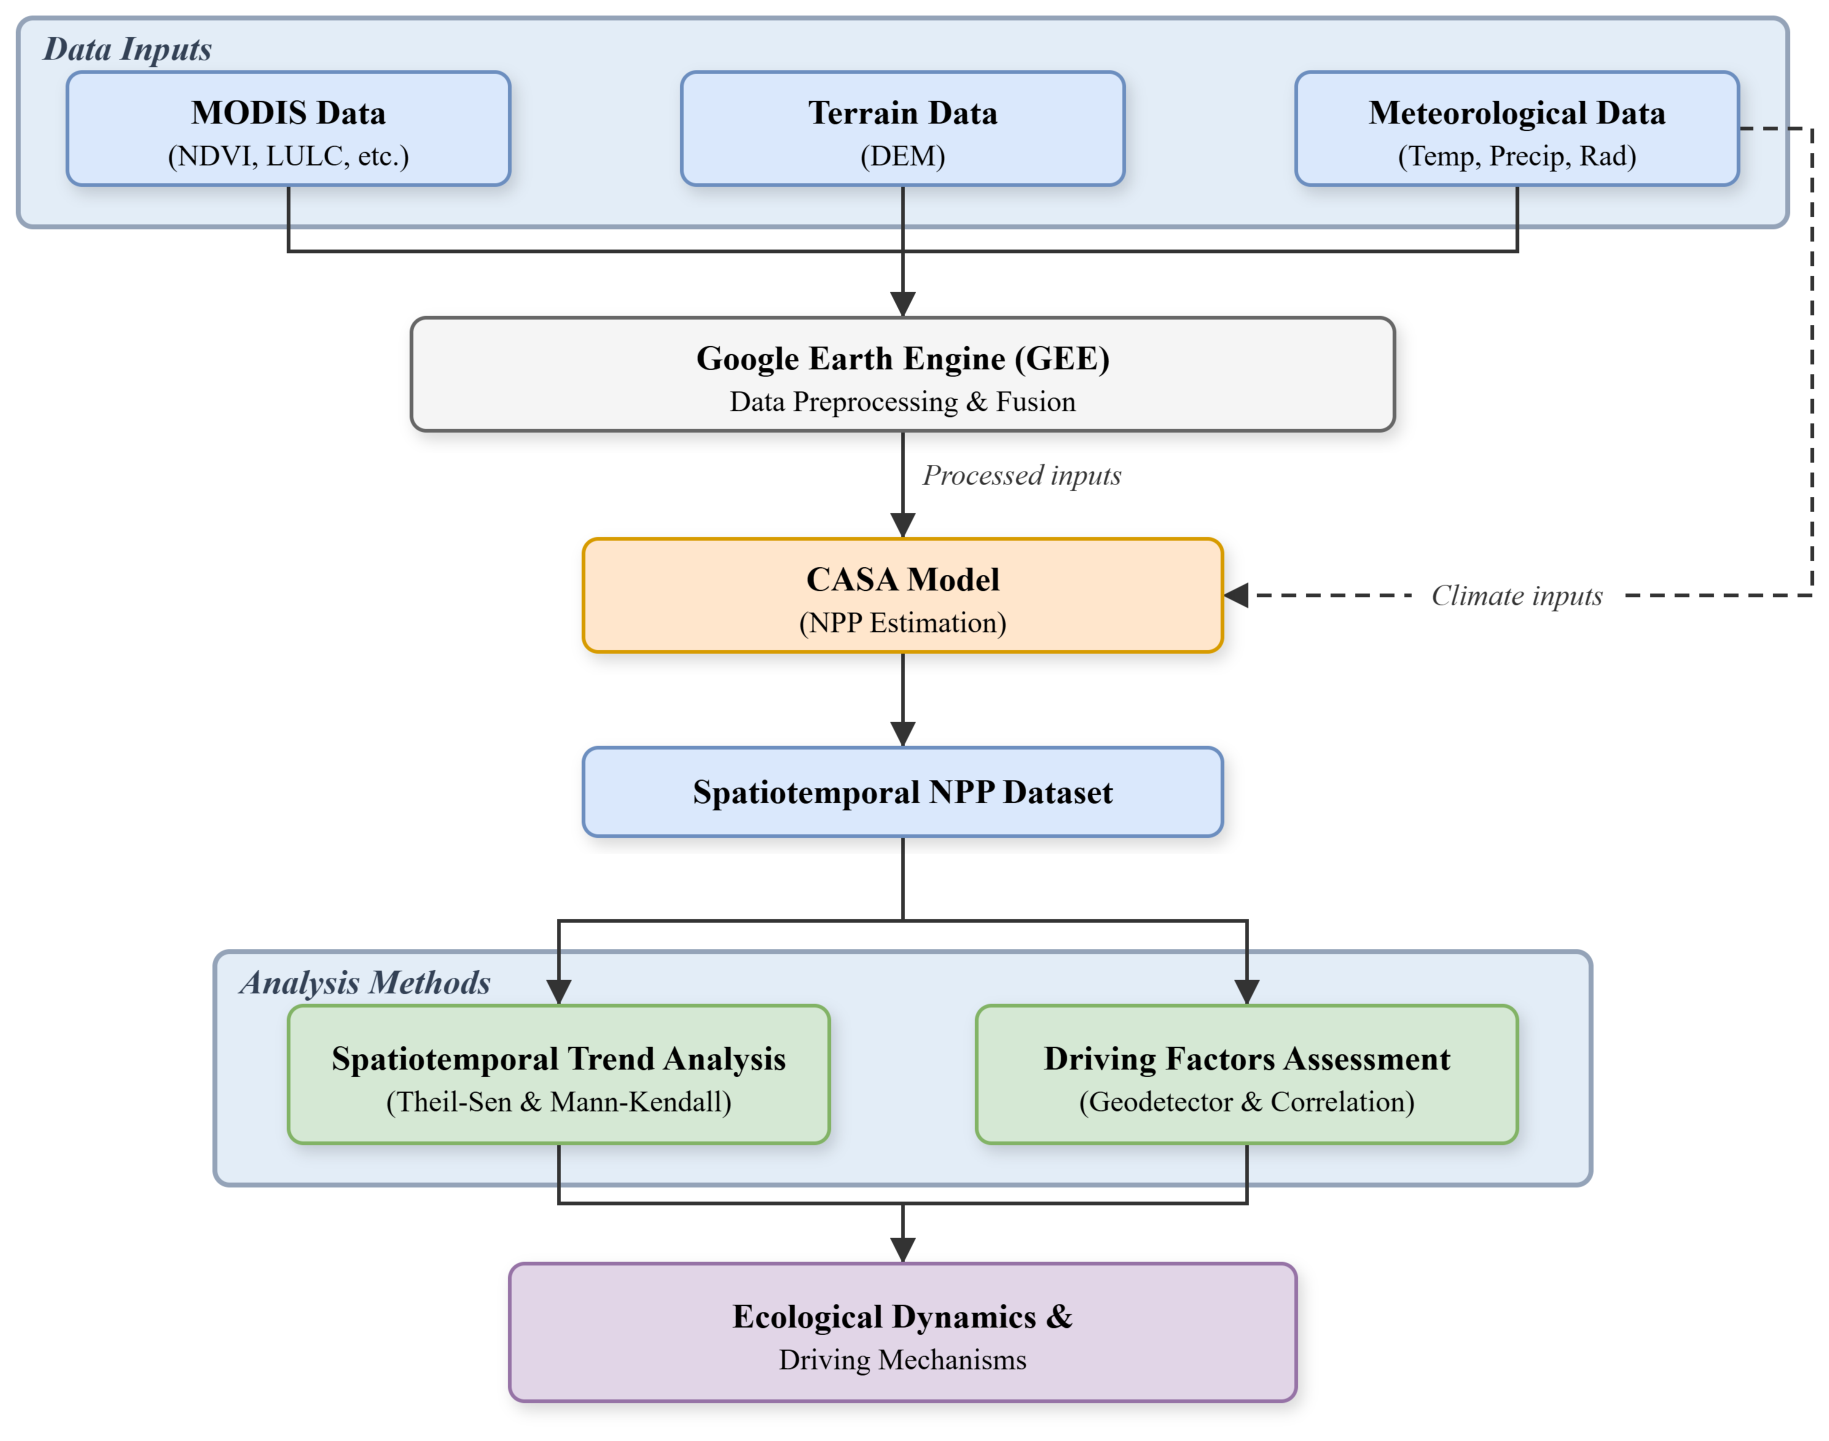
where is total solar radiation, is the fraction of photosynthetically active radiation absorbed by vegetation, is the fraction of incoming solar radiation considered photosynthetically active, and and are temperature and moisture stress scalars. For the annual CASA reconstruction adopted in this manuscript, annual NPP was obtained by aggregating monthly CASA estimates from January to December using a calibrated parameter set with g C MJ−1 and . MODIS and ancillary datasets were first organized for the study area, and monthly CASA calculations were then executed in a local Python workflow that unified FPAR and ERA5-Land grids, aggregated monthly outputs to annual NPP, and generated the final 2003–2025 validation and trend products. The overall analytical workflow is summarized in Figure 2.
Figure 2.
Flowchart of the methodology applied in this study. The framework integrates MODIS, meteorological, aridity, and terrain data, estimates annual Net Primary Productivity (NPP) using the CASA model, and evaluates spatiotemporal dynamics together with topographic–climatic driving effects.
2.4. Topographic Factor Extraction
Topographic factors were extracted from the 30 m SRTM DEM. Elevation was stratified into five zones: <1500 m, 1500–2000 m, 2000–2500 m, 2500–3000 m, and >3000 m. Slope was classified into five grades: <5°, 5–15°, 15–25°, 25–35°, and >35°. Aspect was categorized into four principal directions (North, East, South, West). These stratifications align with established geomorphological and ecological zoning standards in mountainous regions [12,15].
2.5. Statistical Analysis
To robustly quantify the interannual variations of NPP, we applied the Theil–Sen median slope estimator coupled with the Mann–Kendall (MK) significance test at the pixel level. This non-parametric combination is insensitive to outliers and provides a reliable assessment of monotonic trends. The interactive effects of topography and climate were assessed using the Geodetector method [1,31,32], which quantifies the explanatory power (q-value) of individual factors and their non-linear interactions. Continuous variables were discretized into 5 classes using equal interval classification prior to Geodetector analysis. Additionally, annual-scale correlation analysis was conducted between regional mean NPP and aggregated climatic variables (temperature, radiation, evapotranspiration, and AI) to characterize first-order climatic associations.
2.6. Validation Approach
To ensure the robustness of our CASA-derived estimates, we performed pixel-by-pixel spatial and interannual consistency checks against the standard MOD17A3HGF annual NPP product. Validation metrics included annual Pearson correlation, spatial Pearson correlation, spatial Spearman correlation, Root Mean Square Error (RMSE), Mean Absolute Error (MAE), and mean Bias.
2.7. Uncertainty Considerations
Given the complex topography of the West Qinling Mountains, uncertainty in NPP estimation arises from multiple sources. We recognized potential error propagation from coarse spatial resolution meteorological inputs (ERA5-Land at 0.1°) when downscaled to match the 500 m vegetation indices. Furthermore, the assumption of fixed maximum light use efficiency () across broad vegetation types introduces systematic biases. Future validation strategies should include sensitivity analysis varying and cross-referencing with localized eddy covariance flux tower measurements to better constrain these uncertainties.
3. Results
3.1. Model Validation
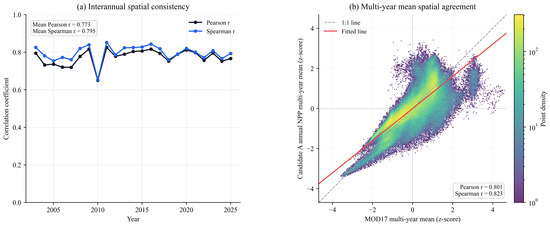
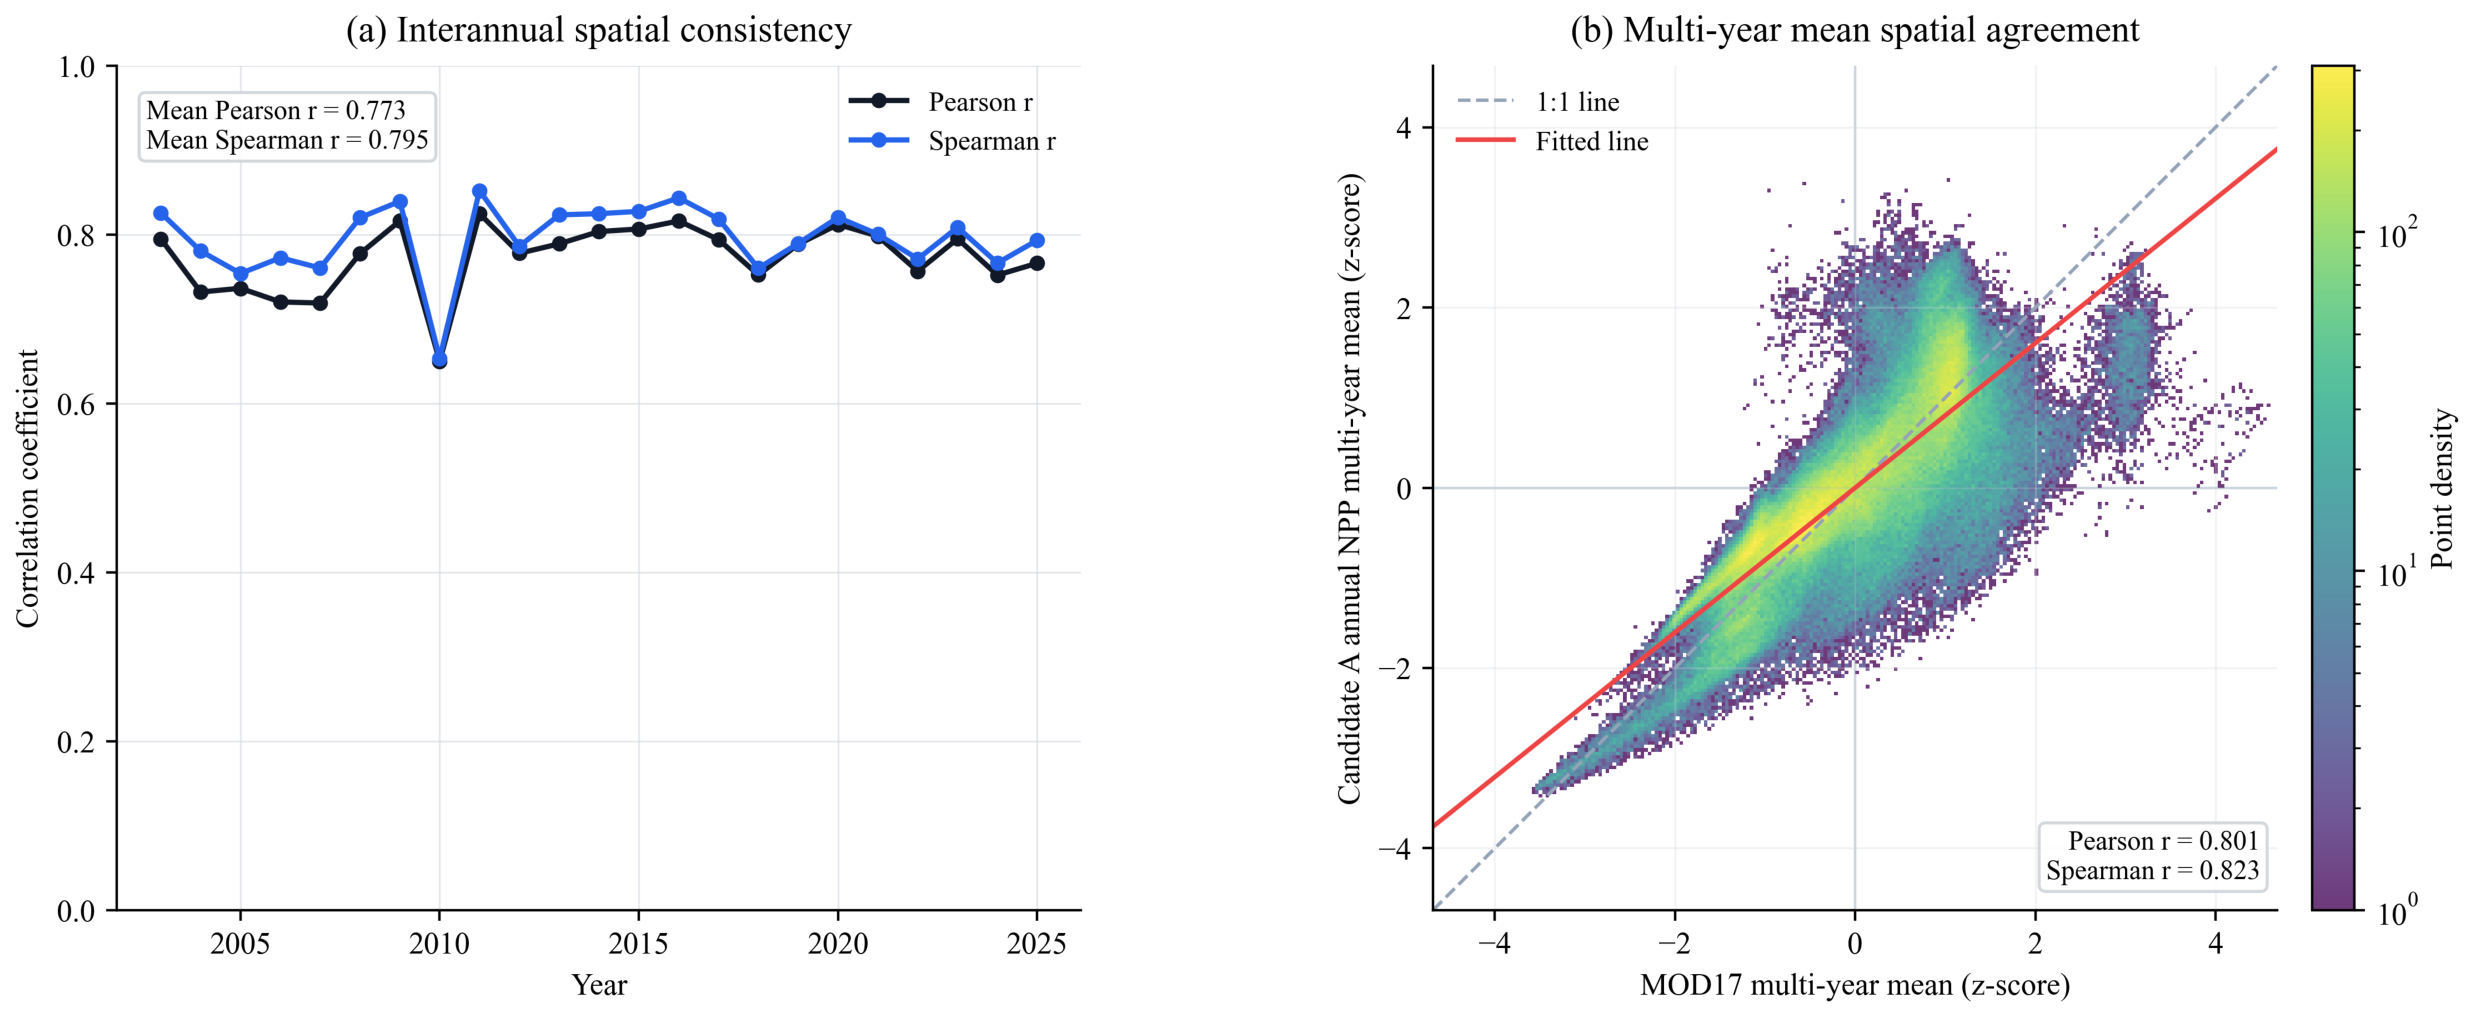
The CASA-derived annual NPP showed strong agreement with the MOD17A3HGF annual product. Across 2003–2025, the mean spatial Pearson and Spearman correlations were 0.801 and 0.823, respectively, and the mean annual Pearson correlation was 0.773. These results indicate that the reconstructed product captured both the regional spatial pattern of NPP and its interannual variability. Absolute magnitudes remained systematically lower than those of MOD17A3HGF, but the discrepancy was substantially reduced relative to the previous product, with mean annual Bias, RMSE, and MAE of −301.812, 321.464, and 301.838 g C m−2 yr−1, respectively. Summary validation metrics are reported in Table 2, and the pixel-wise comparison with MOD17A3HGF is shown in Figure 3.
Table 2.
Summary validation metrics of annual CASA NPP relative to MOD17A3HGF.
Figure 3.
Validation of annual CASA-estimated NPP against the MOD17A3HGF annual product.
3.2. Spatiotemporal Patterns and Trend Characteristics of NPP
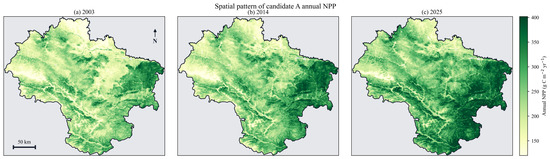
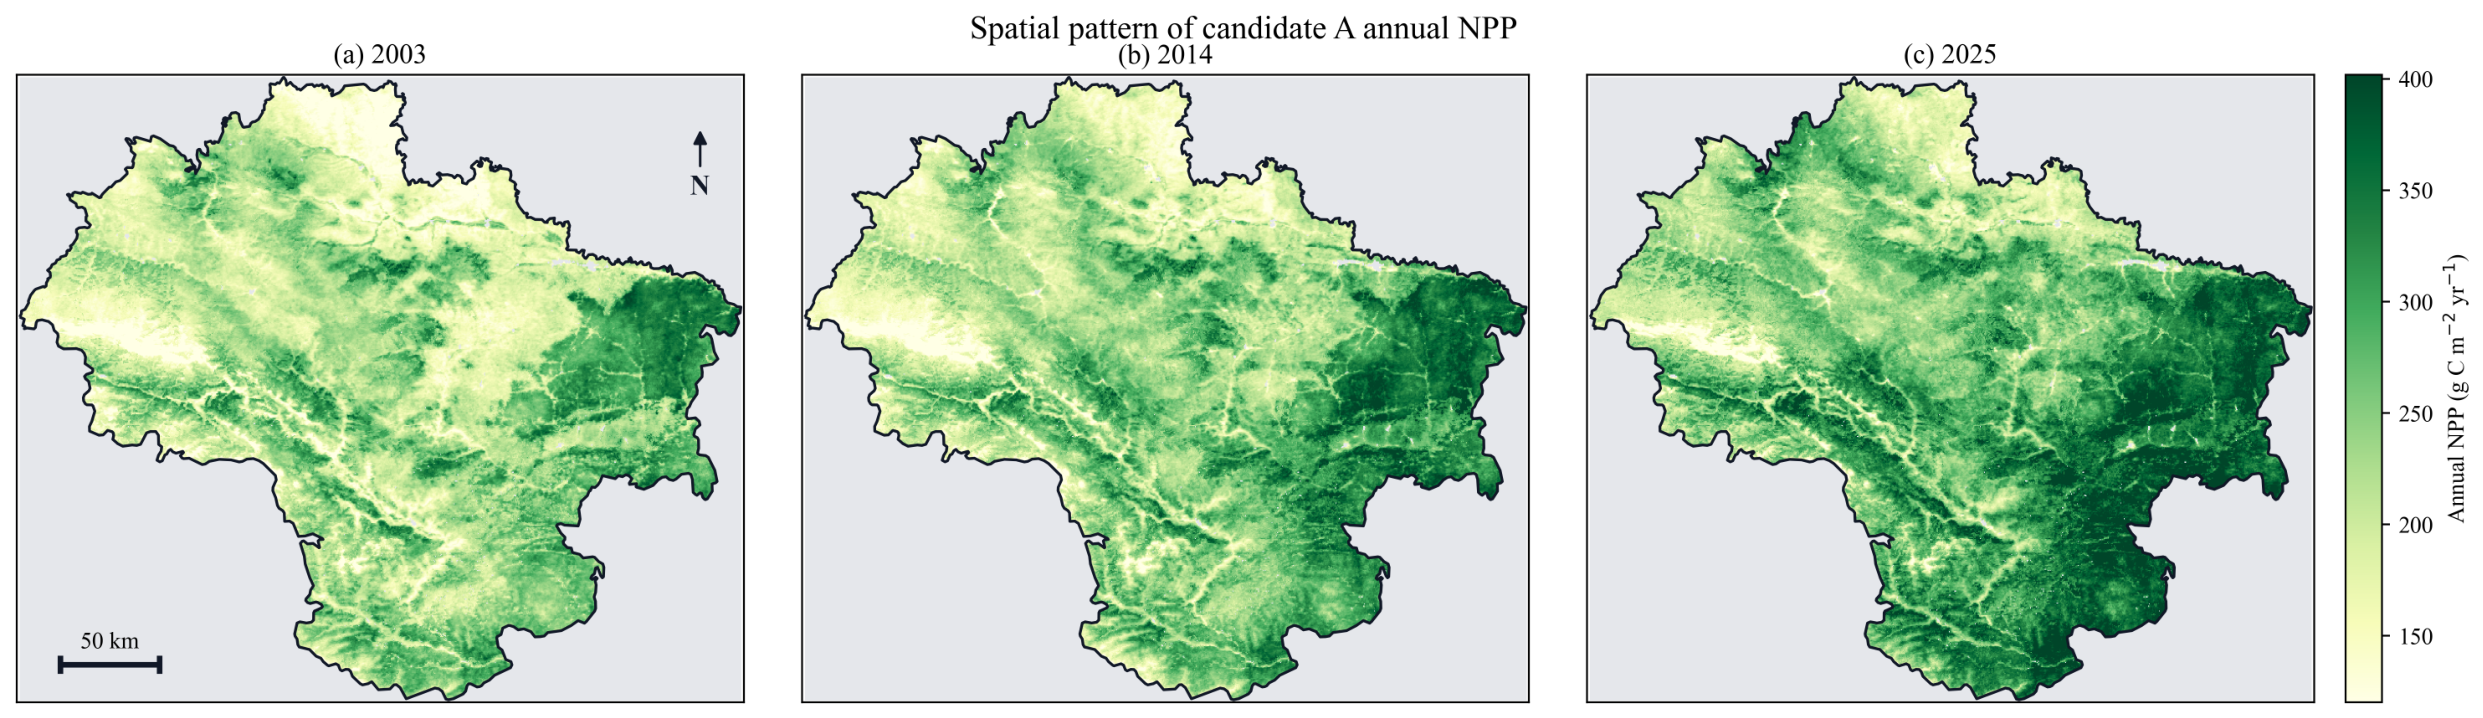
Annual NPP in the West Qinling Mountains increased markedly between 2003 and 2025. Regional mean NPP rose steadily through time, indicating a persistent strengthening of ecosystem productivity. Spatially, productivity remained highly heterogeneous, with the highest values concentrated in the humid southeastern sector and lower values in the semi-arid, high-altitude northwestern sector. Representative spatial patterns for 2003, 2014, and 2025 are presented in Figure 4.
Figure 4.
Spatiotemporal pattern of annual NPP in the West Qinling Mountains (2003–2025).
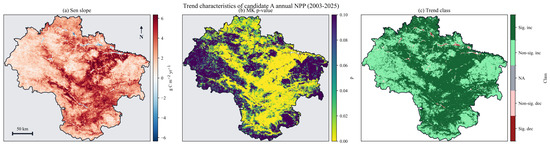
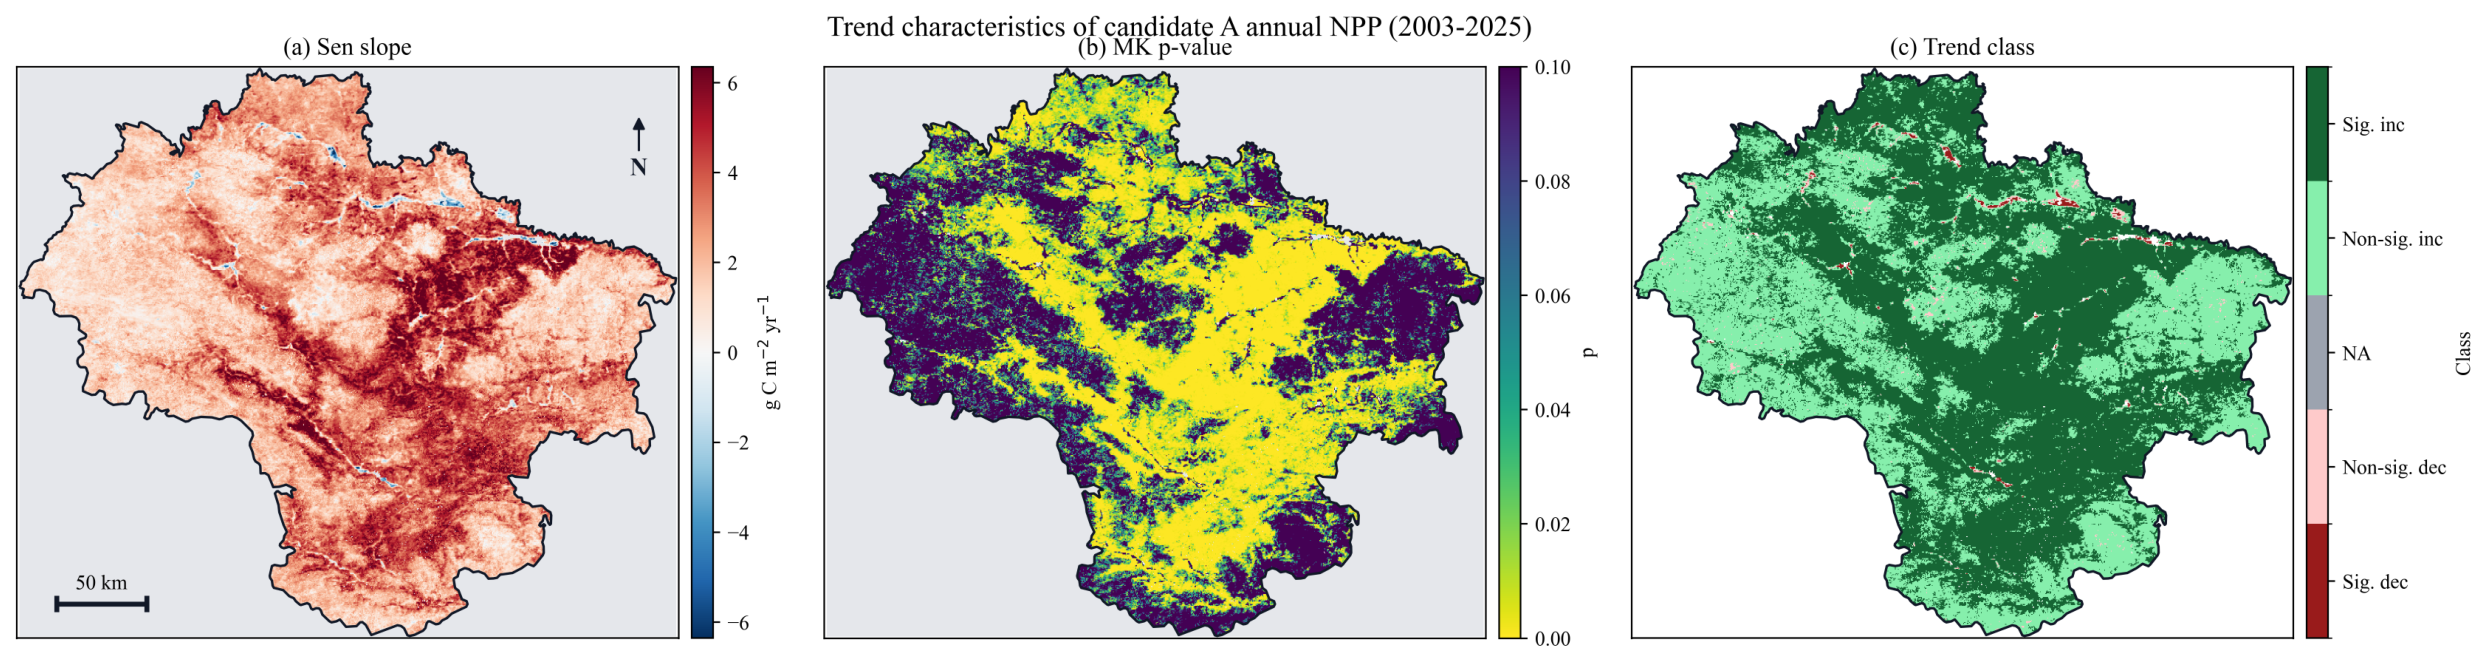
Trend analysis showed that 98.50% of the study area experienced increasing NPP, including 50.26% with statistically significant increases () and 48.24% with non-significant increases. The Sen slope raster yielded a domain-wide mean trend of approximately 3.08 g C m−2 yr−1, further indicating sustained biological recovery across the mountainous terrain. Decreasing trends were confined to 1.50% of the area, including 1.26% with significant declines and 0.25% with non-significant declines. Area statistics for the trend classes are summarized in Table 3, and the spatial distribution of Sen slope classes is shown in Figure 5.
Table 3.
Area statistics of annual NPP trend categories in the West Qinling Mountains.
Figure 5.
Overall trends of annual NPP in the West Qinling Mountains (2003–2025).
3.3. Topographic Stratification and Interaction Effects
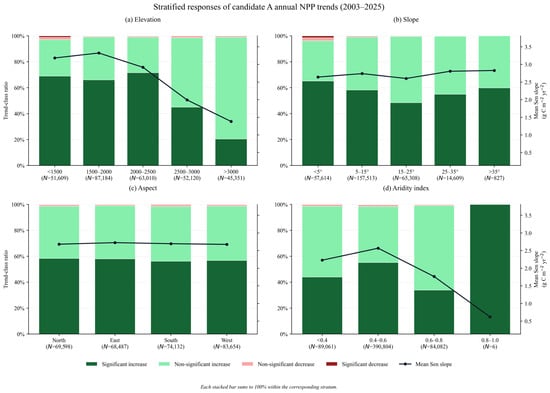
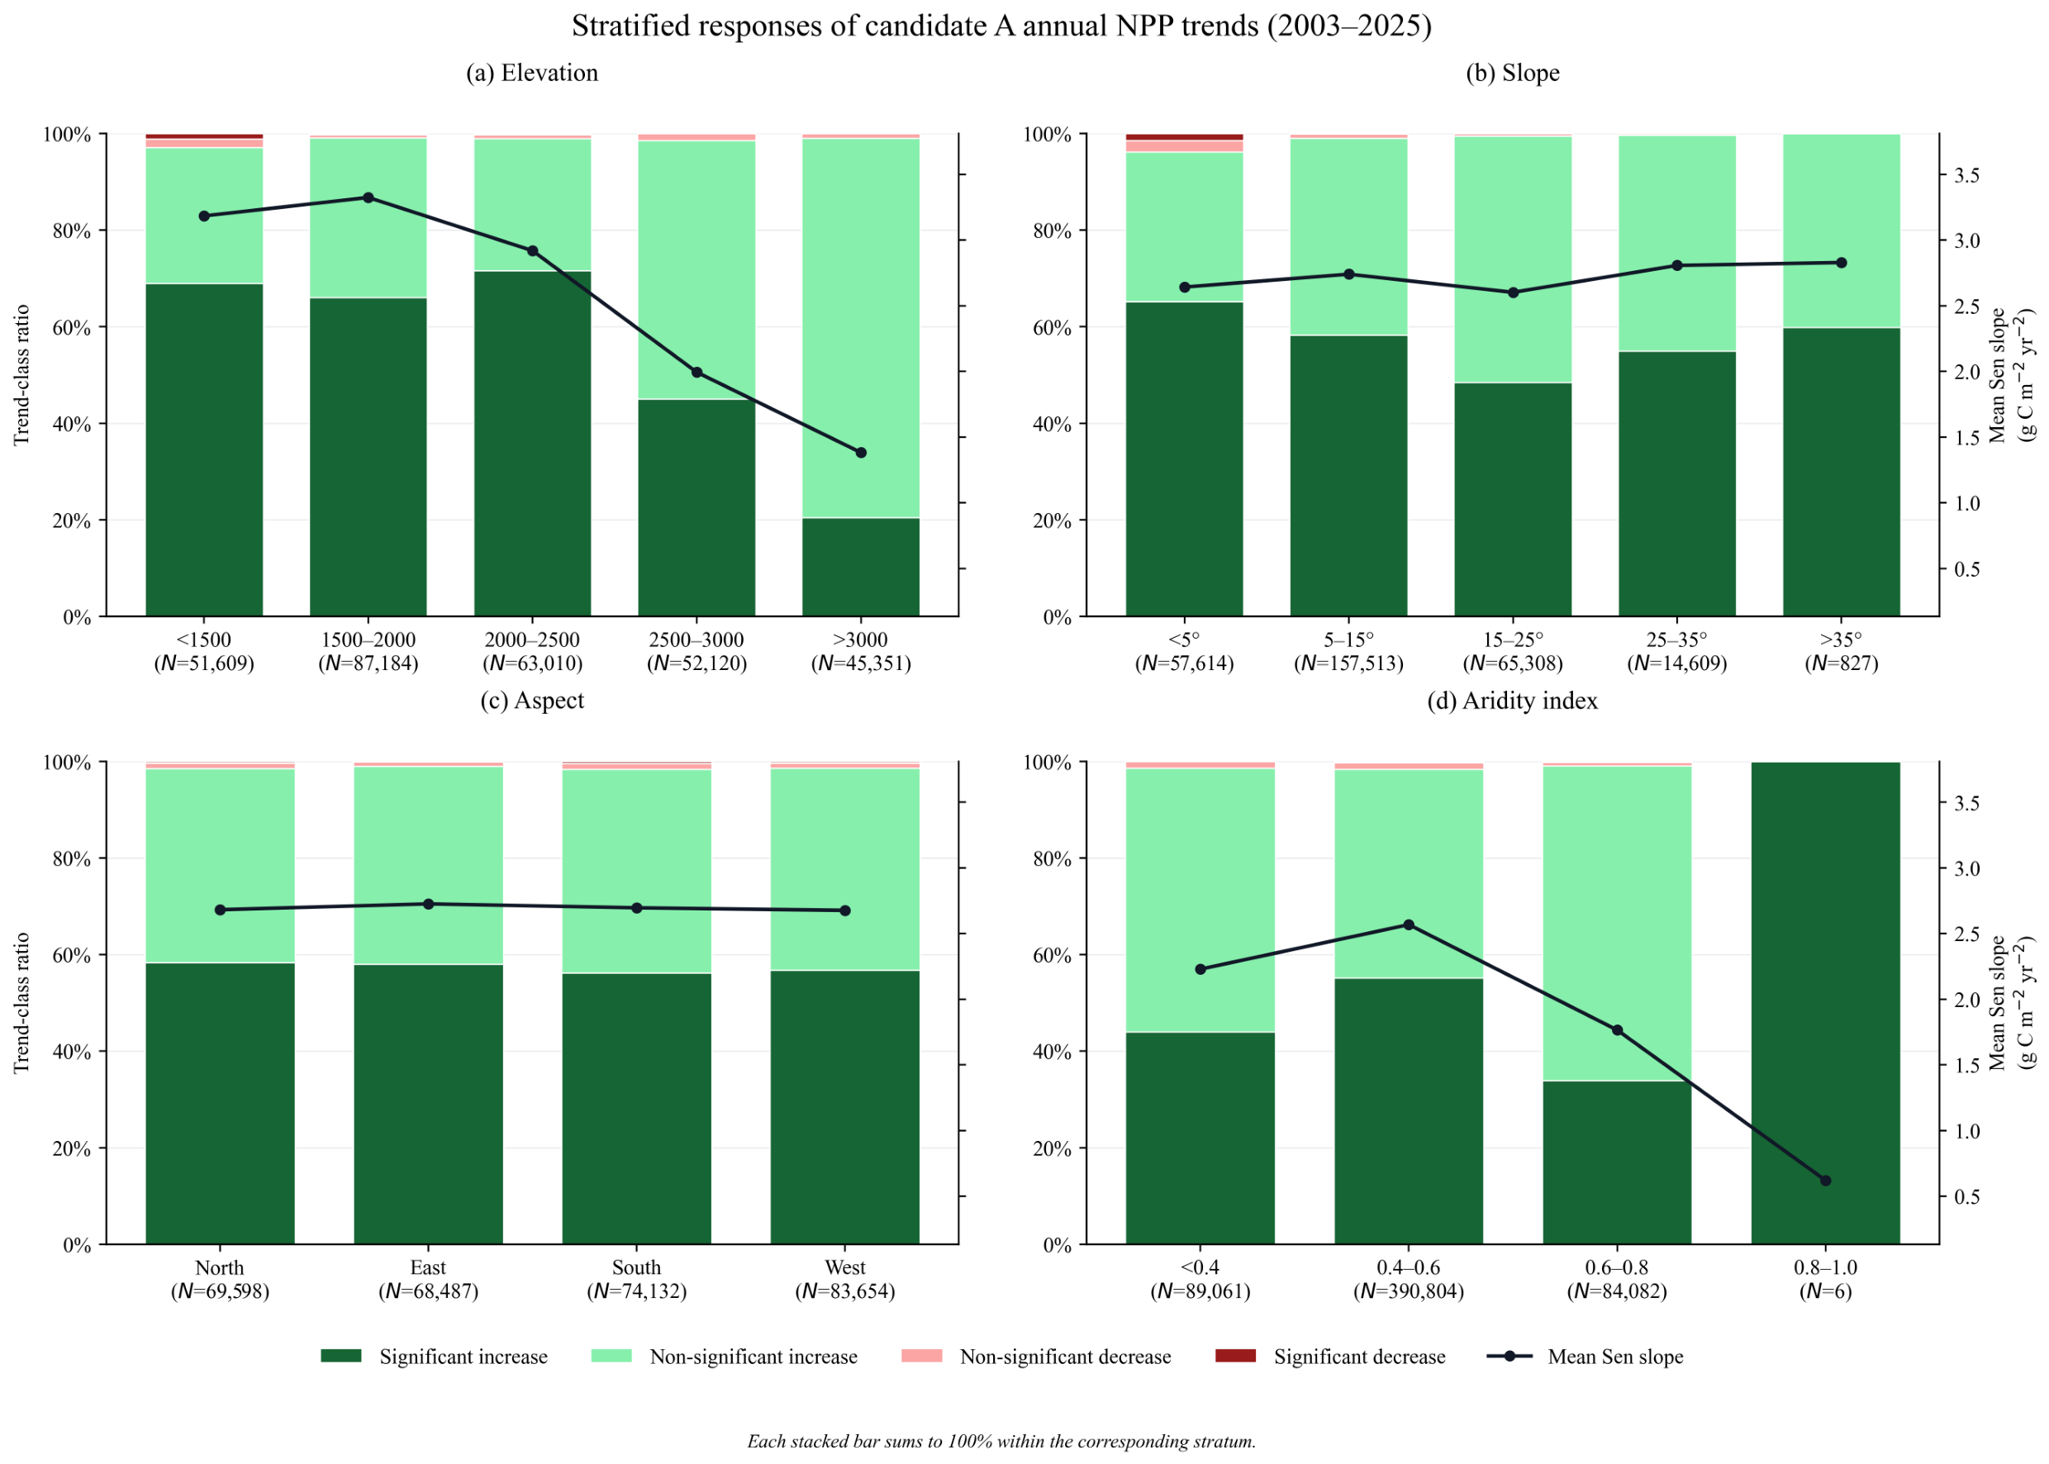
Vegetation NPP showed clear stratified responses along topographic and aridity gradients. The strongest mean Sen slopes occurred in the 1500–2000 m (3.32 g C m−2 yr−1), <1500 m (3.18 g C m−2 yr−1), and 2000–2500 m (2.92 g C m−2 yr−1) elevation zones, whereas the >3000 m belt showed a much weaker mean trend (1.38 g C m−2 yr−1) and was dominated by non-significant increases (78.57%). Slope effects were more nuanced: low-slope classes (<15°) occupied most of the area and maintained consistently positive trends, whereas the 15–25° band showed the weakest mean trend (2.60 g C m−2 yr−1). The moderate-moisture aridity band (AI 0.4–0.6) showed the highest mean trend (2.57 g C m−2 yr−1) and the largest proportion of significant increases (55.18%), whereas drier (<0.4) and wetter (0.6–0.8) belts were dominated by non-significant increases. These stratified responses are illustrated in Figure 6.
Figure 6.
Stratified responses of annual CASA NPP trends to topographic and aridity gradients.
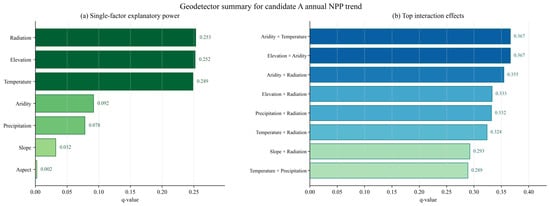
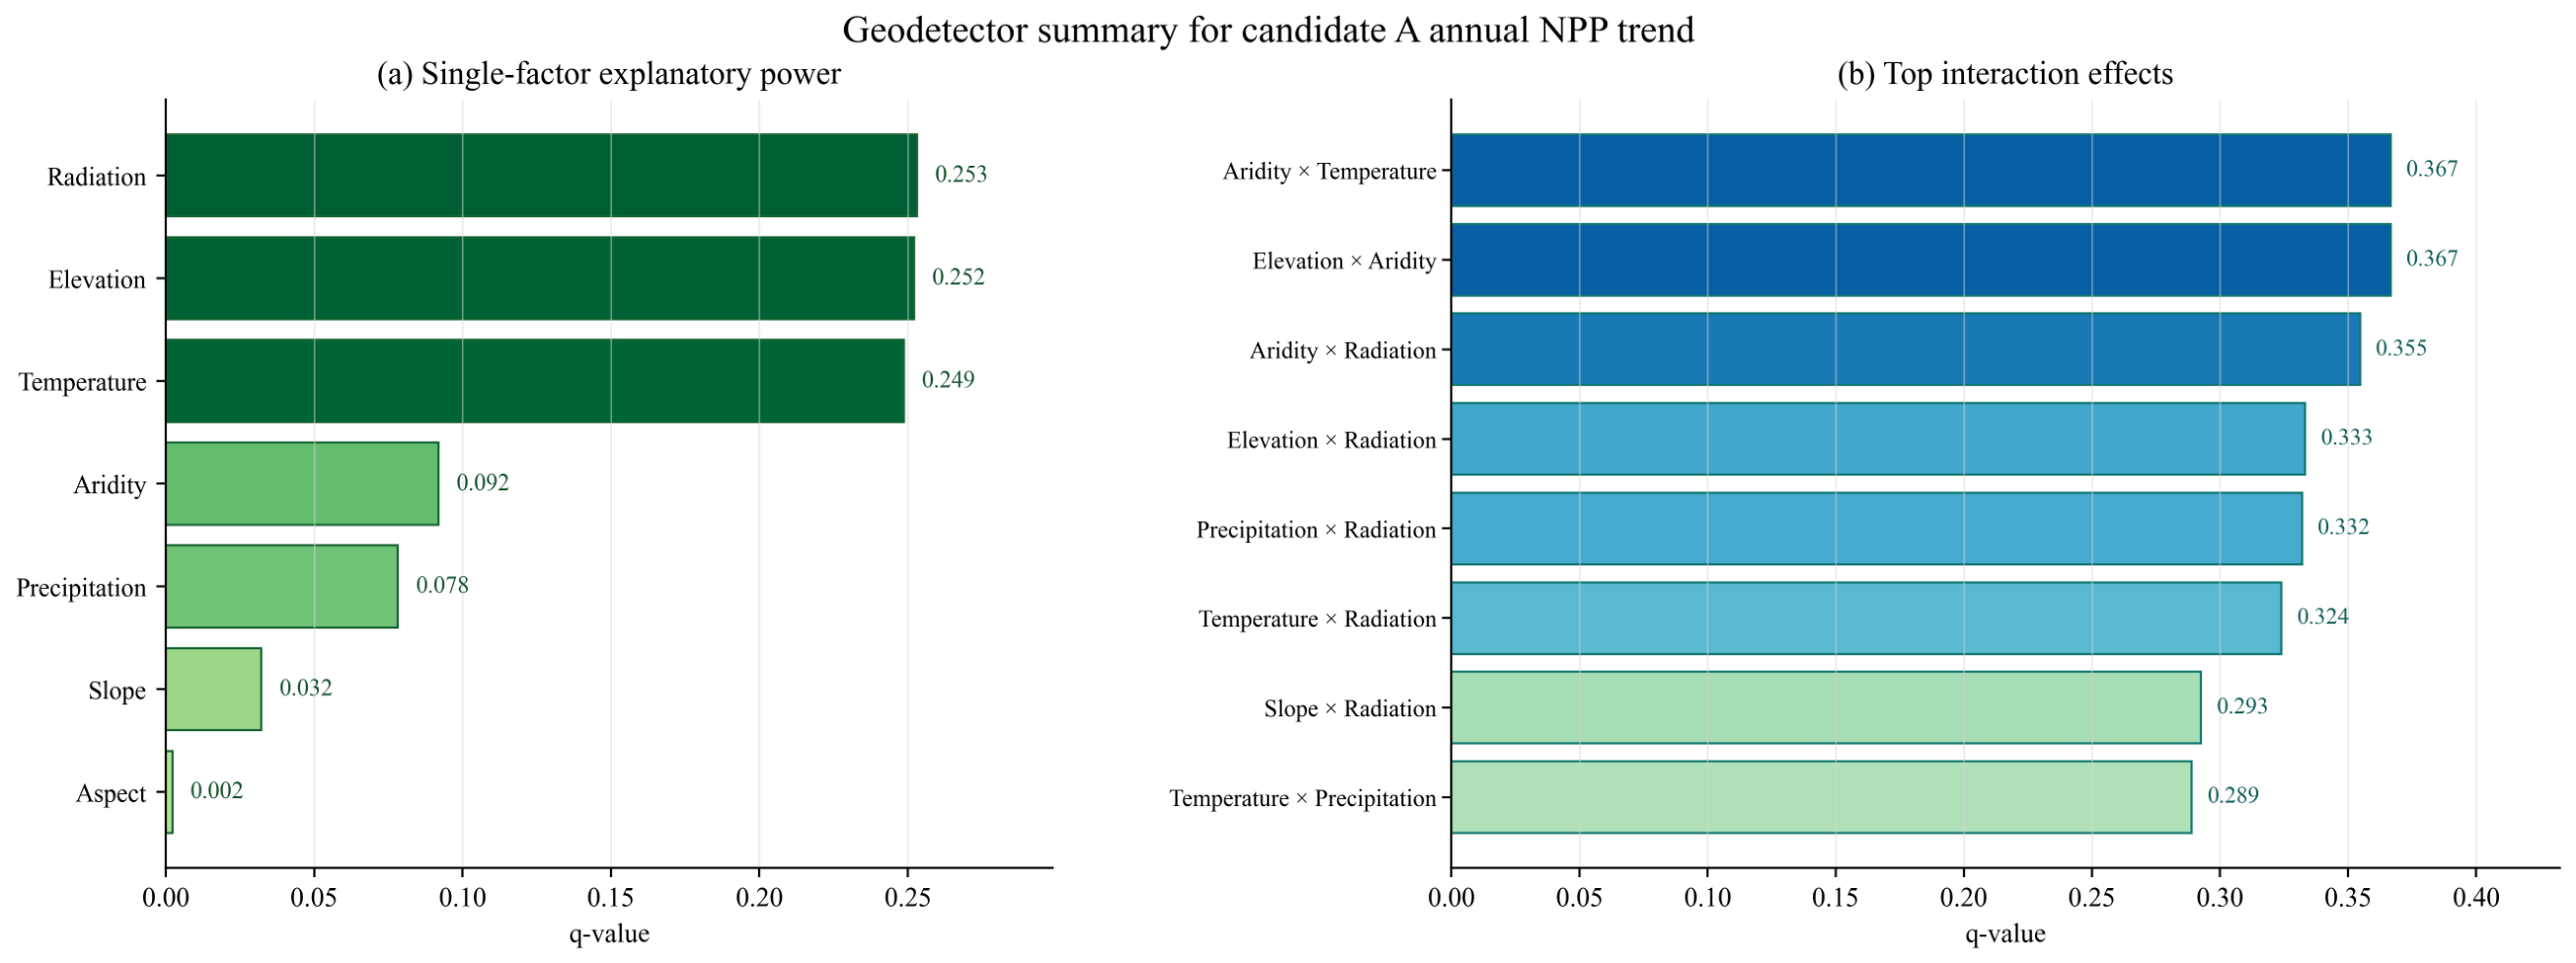
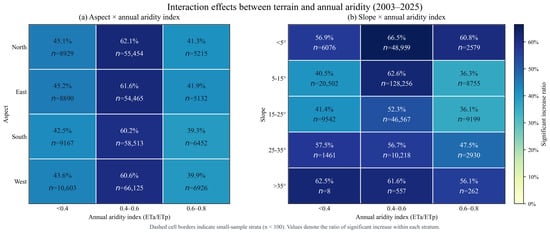
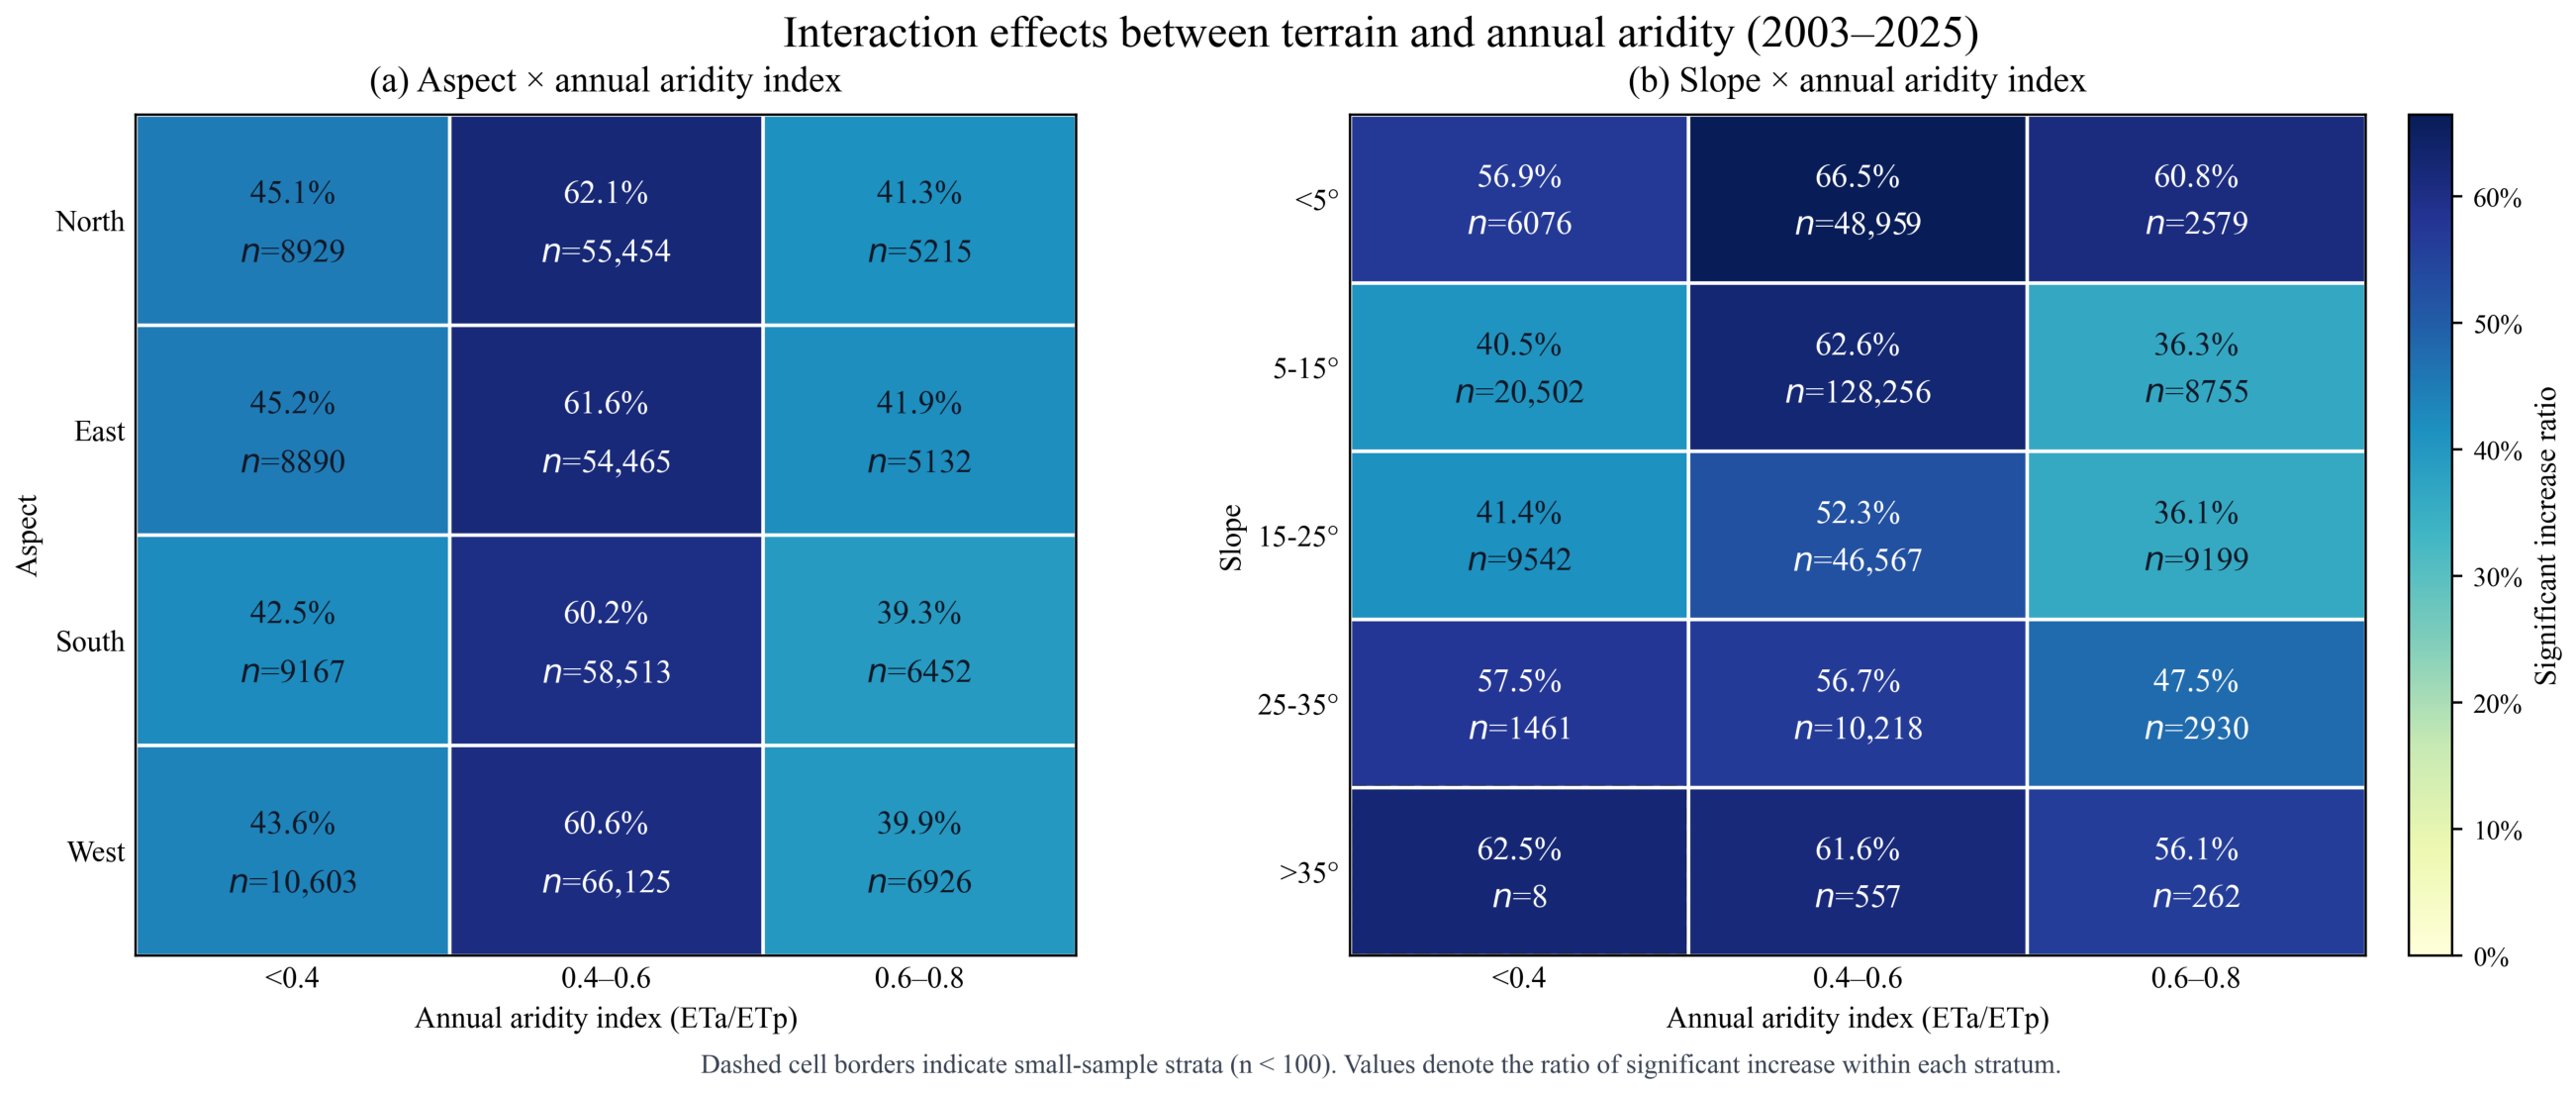
Geodetector analysis quantified the explanatory power of individual factors and their interactions on spatial variation in NPP trends (Table 4). Radiation (), elevation (), and temperature () were the dominant single factors, followed by aridity () and precipitation (). All pairwise interactions enhanced explanatory power relative to single factors (Figure 7). The strongest interactions were Aridity × Temperature () and Elevation × Aridity (), indicating that vegetation dynamics were jointly constrained by hydrothermal conditions and terrain. The interaction heatmaps further showed that the moderate-aridity band (AI 0.4–0.6) consistently supported the highest proportion of significant increases across most terrain classes (Figure 8). Within large-sample slope strata, the strongest response occurred on gentle slopes <5° under AI 0.4–0.6, where the significant-increase ratio reached 66.45% (n = 48,959), while north-facing slopes under the same moisture regime reached 62.09% (n = 55,454).
Table 4.
Geodetector single-factor explanatory power (q-values) for NPP trends.
Figure 7.
Geodetector summary of annual CASA NPP trends, including single-factor explanatory power and interaction effects.
Figure 8.
Interaction effects of terrain and annual aridity on annual CASA NPP trends.
3.4. Climatic Drivers of Interannual Variability
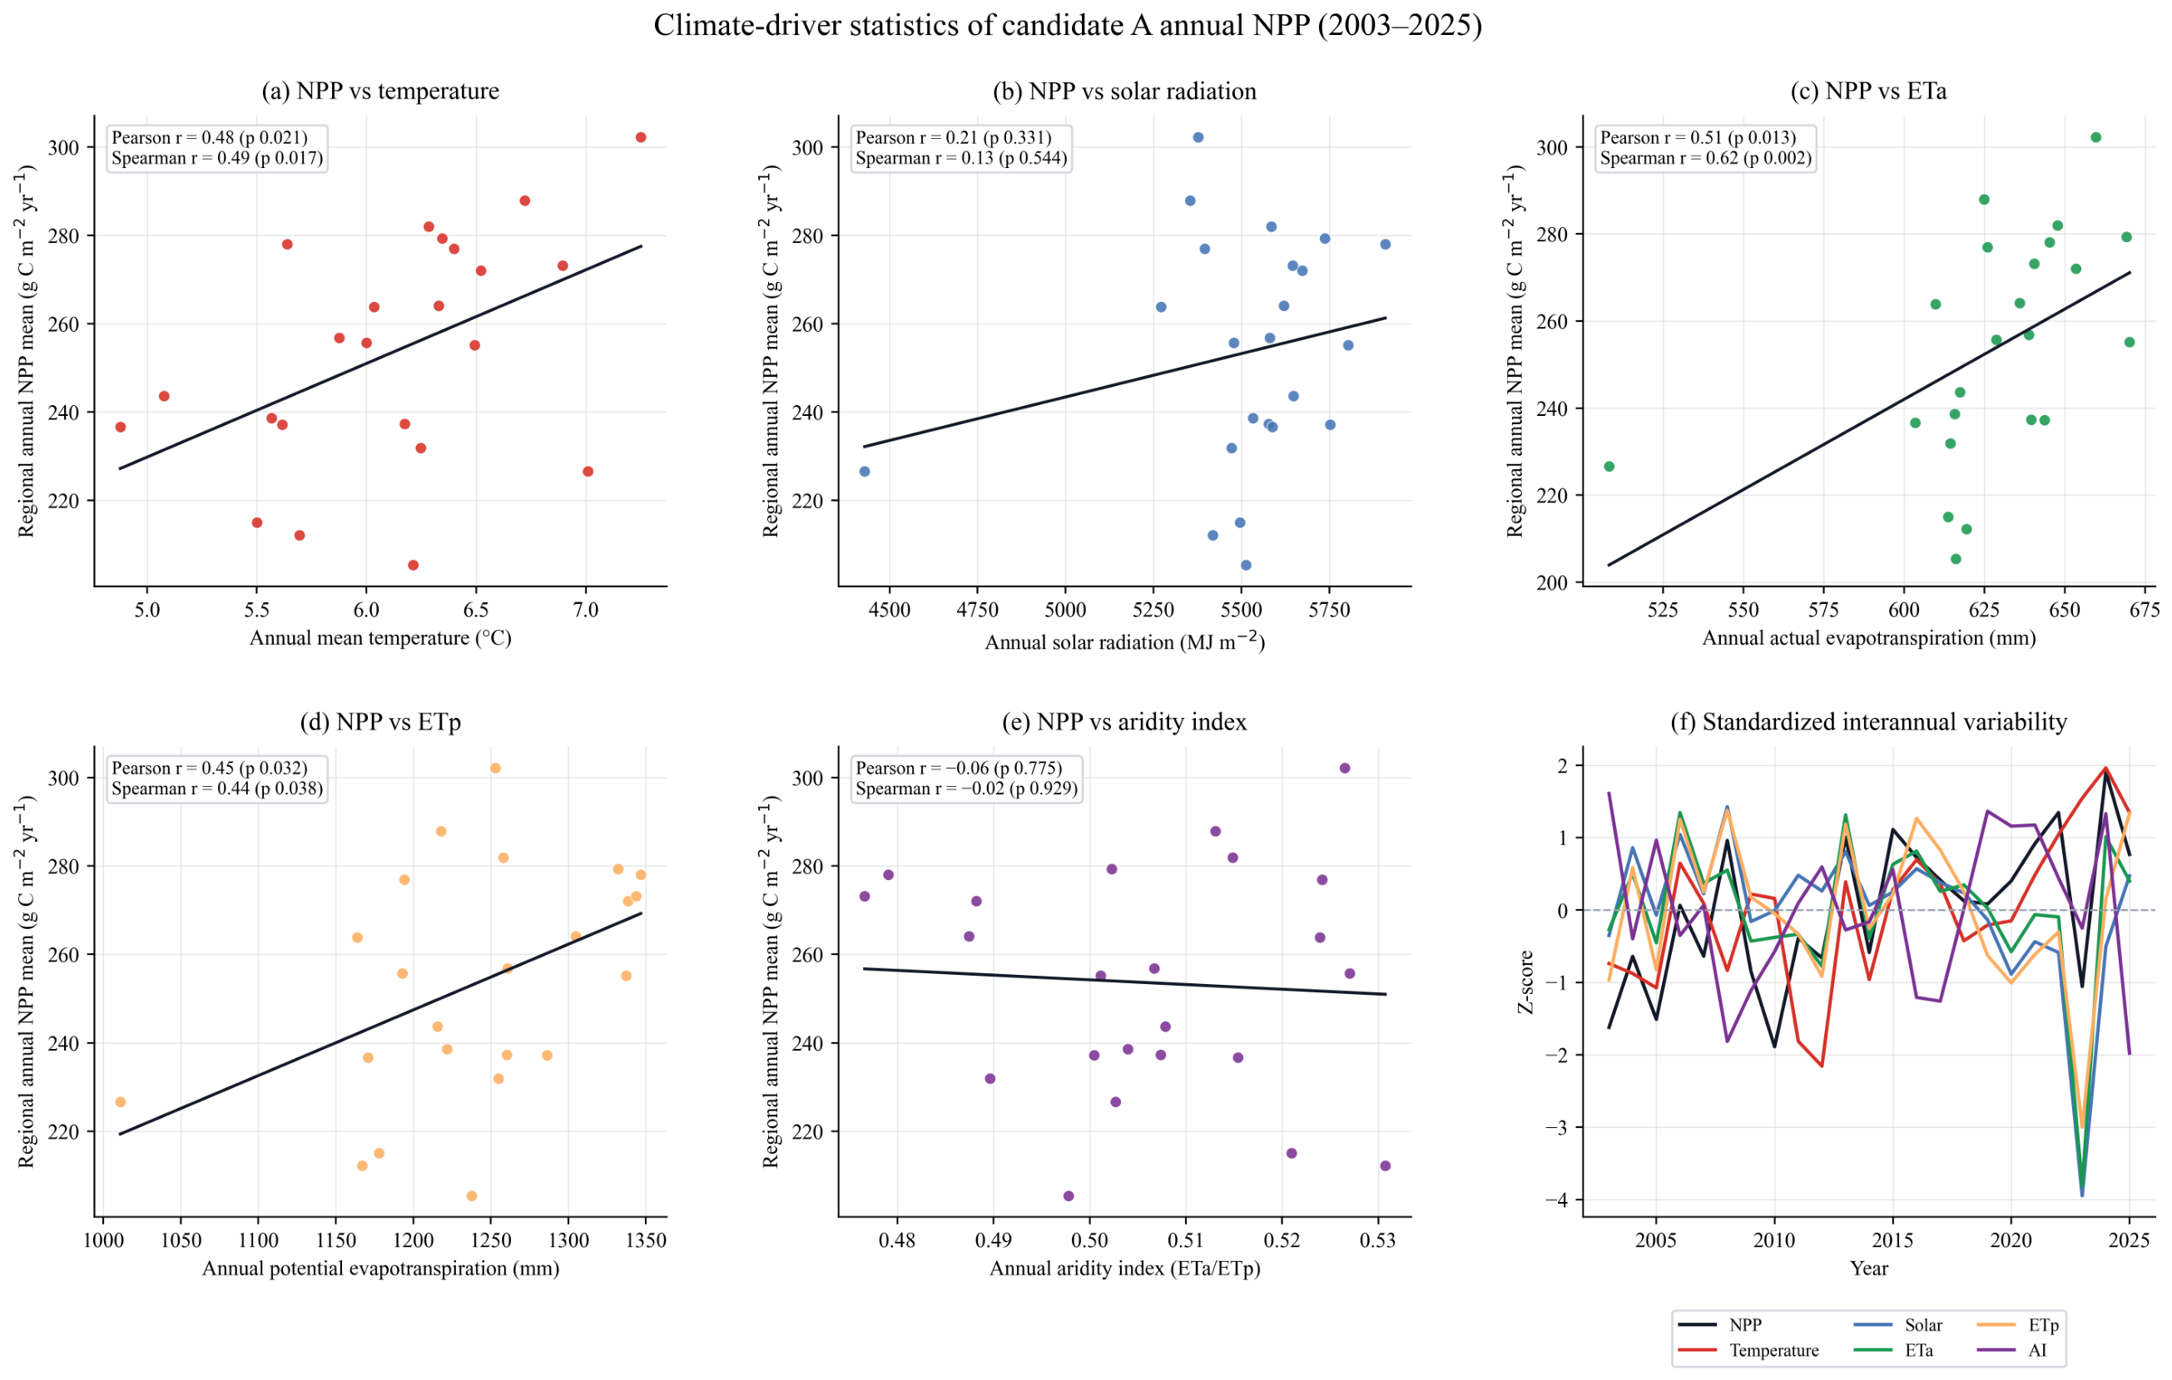
Annual-scale correlation analysis indicated that regional climate conditions acted as important first-order controls on interannual productivity. Among the tested drivers, annual actual evapotranspiration (ETa) showed the strongest positive association with regional mean NPP (Pearson , ; Spearman , ), followed by annual mean temperature (Pearson , ). Potential evapotranspiration also showed a positive but weaker relationship (Pearson , ), whereas annual precipitation, solar radiation, and annual AI showed limited linear association at the regional mean scale. Together, these results suggest that moisture-use conditions and thermal background regulate year-to-year variability in annual NPP.
Notably, Figure 9 reveals a pronounced anomaly in 2023, where regional mean NPP, solar radiation, and potential evapotranspiration (ETp) simultaneously exhibited Z-scores of approximately −4, while temperature reached a Z-score peak of +2 in 2024. This extreme co-variation suggests a potential climate-driven perturbation, possibly linked to large-scale atmospheric circulation patterns or regional extreme weather events that temporarily suppressed vegetation productivity. While the long-term trend remains positive, such anomalies highlight the vulnerability of mountain ecosystems to short-term climatic fluctuations.
Figure 9.
Climate-driver statistics and interannual co-variability of annual CASA NPP.
4. Discussion
4.1. Regional Greening and Topographic–Climatic Controls
Our results indicate a broad regional greening signal in the West Qinling Mountains, with 98.50% of the study area showing increasing annual NPP and 50.26% showing significant increases during 2003–2025. This pattern is broadly consistent with reported vegetation recovery across adjacent mountain and plateau systems [29,33,34], suggesting that the West Qinling Mountains are part of a wider regional trajectory of ecological improvement. A plausible interpretation is that this pattern reflects the combined influence of more favorable hydrothermal conditions and long-term ecological engineering programs, especially the Grain to Green Program [28,35,36]. Even so, the high proportion of increasing pixels should not be read as uniformly improved ecosystem condition, because productivity gains may coexist with structural simplification, water-stress trade-offs, or heightened sensitivity to extreme events in specific topographic niches.
The topographic signal is not a simple elevation or slope effect; rather, it reflects spatial variation in water-energy balance, soil-moisture retention, and growing-season constraints. Elevation showed the clearest pattern, with stronger positive trends below 2500 m and much weaker increases above 3000 m, implying a shift from relatively balanced hydrothermal regimes at low-to-middle elevations to increasingly energy-limited conditions at high elevations. Slope effects were similarly non-monotonic. Gentle slopes likely buffer drought through deeper soils, slower runoff, and greater water-holding capacity, whereas steeper terrain tends to reduce rooting depth and accelerate water loss. This pattern supports the view that topography regulates vegetation productivity primarily by redistributing hydrothermal resources rather than by slope steepness alone [13,37].
Our Geodetector analysis shows that NPP trend heterogeneity is governed by coupled hydrothermal and topographic processes rather than by any single factor. The two strongest interactions, Aridity × Temperature and Elevation × Aridity (both ), exceeded the explanatory power of all individual variables, indicating that climatic forcing is most informative when interpreted together with terrain context. This is plausible for a mountain transition zone: aridity influences potential water deficit, temperature constrains phenological activity and photosynthetic duration, and topography redistributes radiation, runoff, and soil moisture across slopes and aspects. The interaction heatmaps further suggest that the AI 0.4–0.6 zone represents a transitional hydrothermal window in which topographic buffering becomes especially effective. Under these conditions, gentle slopes and north-facing terrain likely retain enough moisture to sustain gains in productivity while avoiding the severe energy limitation characteristic of high elevations. This helps explain why the strongest increases are concentrated not in the wettest or driest environments, but in intermediate settings where modest shifts in moisture or topographic position can move ecosystems between water-limited and energy-limited regimes.
4.2. Methodological Limitations and Uncertainty
The CASA-based workflow enabled efficient reconstruction of annual NPP over a 23-year period, but several limitations must be acknowledged. First, validation remains product-based and therefore cannot establish absolute accuracy in the same way that flux-tower or plot observations could. The agreement with MOD17A3HGF supports pattern fidelity, but it does not eliminate shared structural biases between remote-sensing products. Second, the annual CASA reconstruction still applies a spatially uniform calibrated parameter set; the assumption of constant and PAR fraction across heterogeneous vegetation and terrain may bias absolute NPP magnitude [24,38,39]. Third, the mismatch between coarse ERA5-Land meteorology and finer MODIS grids remains a structural source of uncertainty even after reprojection and annual aggregation. Finally, although Geodetector is useful for diagnosing spatial heterogeneity, its results are affected by discretization strategy and should be interpreted as statistical evidence of enhanced joint control rather than direct proof of causality. These limitations do not overturn the major spatial patterns identified here, but they do require caution when translating relative trend signals into absolute ecological or carbon-accounting estimates.
4.3. Ecological and Management Implications
Beyond the immediate interpretation of NPP trends, our results have implications for biodiversity conservation, ecosystem services, and land management. Areas with strong and persistent NPP gains, especially gentle slopes under moderate aridity, may provide favorable settings for restoration because they combine relatively high productivity gains with lower hydro-geomorphic constraints. However, these zones should not be viewed only as carbon-gain areas. Rising productivity may alter habitat structure, phenological timing, and competitive balance among species, potentially benefiting some communities while disadvantaging specialists adapted to low-productivity environments. From an ecosystem-service perspective, increasing NPP implies greater carbon-uptake potential, but it may also intensify evapotranspiration and local water demand in already water-limited landscapes. Restoration planning in the West Qinling Mountains should therefore emphasize spatial targeting rather than uniform greening, with priority given to zones where productivity gains, erosion control, and ecological resilience are likely to co-occur.
These findings also provide practical guidance for ecological restoration and climate adaptation in mountain transition environments. The concentration of strong positive trends in low-to-moderate slope areas under AI 0.4–0.6 suggests that these landscapes are likely to yield the most reliable returns for restoration investment, including vegetation recovery, soil protection, and carbon sequestration potential [27,40]. In contrast, extremely dry zones and high-elevation or terrain-limited areas were dominated by weaker or non-significant responses, indicating that these settings may function more as ecological stability zones than as rapid-recovery hotspots [17,41]. Management should therefore distinguish between areas suited to active restoration and areas where the more appropriate goal is conservation, disturbance prevention, and maintenance of topographic refugia under increasing climate stress.
4.4. Future Directions
Future work should move beyond pattern diagnosis toward stronger process attribution and uncertainty control. Three directions are particularly important: integrating flux-tower, plot, or other field observations to strengthen validation beyond product-to-product comparison; introducing terrain-sensitive or vegetation-specific parameterization into the CASA framework to better represent mountain heterogeneity; and explicitly testing how extreme events such as flash droughts and heatwaves alter the stability of the topographic–climatic relationships reported here. Complementary uncertainty analysis, multi-product comparison, and hybrid modeling approaches, including machine-learning-assisted parameter optimization, would further improve predictive confidence under future climate change scenarios [42,43].
5. Conclusions
This study reconstructed and analyzed annual vegetation NPP in the West Qinling Mountains from 2003 to 2025 using a CASA-based workflow. The main conclusions can be organized into four connected points.
- (1)
- The reconstructed annual product is sufficiently robust for regional pattern analysis. Agreement with MOD17A3HGF remained strong at both spatial and interannual scales, with a mean spatial Spearman correlation of 0.823 and a mean annual Pearson correlation of 0.773, indicating that the reconstructed product captures the dominant structure of annual NPP variability.
- (2)
- Regional productivity increased persistently during 2003–2025. Approximately 98.50% of the study area showed increasing NPP, including 50.26% with significant increases, and the domain-wide mean Sen slope reached about 3.08 g C m−2 yr−1, supporting a clear long-term greening signal across the mountain system.
- (3)
- NPP dynamics were governed mainly by coupled topographic–climatic controls rather than by isolated single factors. Radiation, elevation, and temperature were the strongest individual controls, whereas Aridity × Temperature and Elevation × Aridity produced the highest interaction strength, showing that vegetation responses are shaped by the joint regulation of water-energy conditions and terrain context.
- (4)
- Moderate-aridity and low-to-moderate slope settings are the most favorable zones for spatially targeted restoration. The strongest positive responses were concentrated in gentle-slope and AI 0.4–0.6 environments, suggesting that restoration and adaptation planning should prioritize locations where hydrothermal balance and topographic buffering are jointly optimized.
Author Contributions
Conceptualization, L.N. and Q.B.; methodology, Q.B.; software, Q.B.; validation, Q.B., L.N., Y.L. and X.Z.; formal analysis, Q.B.; investigation, Q.B., Y.L. and X.Z.; resources, L.N.; data curation, Q.B., Y.L. and X.Z.; writing—original draft preparation, Q.B.; writing—review and editing, L.N. and Q.B.; visualization, Q.B. and X.Z.; supervision, L.N.; project administration, Q.B.; funding acquisition, L.N. All authors have read and agreed to the published version of the manuscript.
Funding
This research was funded by the Special Project for Scientific Research Innovation Team Building of Tianshui Normal University (Grant No. TDJ2023-04) and the Youth Doctoral Support Project of Gansu Provincial Department of Education (Grant No. 2023QB-008).
Institutional Review Board Statement
Not applicable.
Informed Consent Statement
Not applicable.
Data Availability Statement
All data used in this study are publicly available. MODIS products were obtained from NASA LP DAAC (https://lpdaac.usgs.gov/, accessed on 1 June 2026). ERA5-Land data were accessed through the Copernicus Climate Data Store (https://cds.climate.copernicus.eu/, accessed on 1 June 2026). SRTM DEM data were downloaded from USGS EarthExplorer. The annual CASA reconstruction and post-processing workflow were executed locally in Python; scripts and derived outputs are available at GitHub (https://github.com/yarree/WestQinling-NPP, accessed on 1 June 2026) and will be archived at Zenodo upon acceptance.
Acknowledgments
The authors acknowledge the open availability of the remote sensing, meteorological, and terrain datasets used in this study.
Conflicts of Interest
The authors declare no conflicts of interest.
References
- Zhang, S.; Zhou, Y.; Yu, Y.; Li, F.; Zhang, R.; Li, W. Using the Geodetector Method to Characterize the Spatiotemporal Dynamics of Vegetation and Its Interaction with Environmental Factors in the Qinba Mountains, China. Remote Sens. 2022, 14, 5794. [Google Scholar] [CrossRef] [Scilit]
- Zhang, Y.; Li, S.; Zhang, Y.; Wang, B. Aridity Thresholds and Vegetation Sensitivity Influence Carbon–Water Trade-Offs in the Qilian Mountains. Land Degrad. Dev. 2026, 37, 2440–2453. [Google Scholar] [CrossRef] [Scilit]
- Liu, Y.; Han, X.; Weng, F.; Xu, Y.; Zhang, Y.; Tang, S. Estimation of terrestrial net primary productivity in China from Fengyun-3D satellite data. J. Meteorol. Res. 2022, 36, 401–416. [Google Scholar] [CrossRef] [Scilit]
- Shi, S.; Zhu, L.; Luo, Z.; Qiu, H. Quantitative Analysis of the Contributions of Climatic and Anthropogenic Factors to the Variation in Net Primary Productivity, China. Remote Sens. 2023, 15, 789. [Google Scholar] [CrossRef] [Scilit]
- Zhao, W.; Yu, X.; Liu, Y.; Xu, L.; Chen, Z.; Li, S. Distinct vegetation response to drying and wetting trends across an aridity threshold. Environ. Res. Commun. 2021, 3, 011003. [Google Scholar] [CrossRef] [Scilit]
- Bai, Y.; Zha, T.; Bourque, C.P.A.; Jia, X.; Ma, J.; Liu, P.; Yang, R.; Li, C.; Du, T.; Wu, Y. Variation in ecosystem water use efficiency along a southwest-to-northeast aridity gradient in China. Ecol. Indic. 2020, 110, 105932. [Google Scholar] [CrossRef] [Scilit]
- Roushon, S.K.; Yin, Y.; Deng, H.; Ma, D. Complex effects of moisture conditions and temperature enhanced vegetation growth in the Arid/humid transition zone in Northern China. Sci. Total Environ. 2022, 808, 150152. [Google Scholar] [CrossRef] [Scilit] [PubMed]
- Wang, S.; Zhang, Q.; Yue, P.; Wang, J.; Yang, J.; Zhang, H.; Ren, X. Precipitation-Use Efficiency and Its Conversion with Climate Types in Mainland China. Remote Sens. 2022, 14, 2467. [Google Scholar] [CrossRef] [Scilit]
- Xu, H.; Wang, X.; Zhao, C. Drought sensitivity of vegetation photosynthesis along the aridity gradient in northern China. Int. J. Appl. Earth Obs. Geoinf. 2021, 104, 102418. [Google Scholar] [CrossRef] [Scilit]
- Li, X.; Zou, L.; Xia, J.; Wang, F.; Li, H. Identifying the Responses of Vegetation Gross Primary Productivity and Water Use Efficiency to Climate Change under Different Aridity Gradients across China. Remote Sens. 2023, 15, 1563. [Google Scholar] [CrossRef] [Scilit]
- Shoshany, M. Climate and aridity measures relationships with spectral vegetation indices across desert fringe shrublands in the South-Eastern Mediterranean Basin. Environ. Monit. Assess. 2023, 195, 563. [Google Scholar] [CrossRef] [Scilit] [PubMed]
- Liu, B.; Liu, B.; Sun, J.; Liu, M.; Zeng, T.; Zhu, J. The aridity index governs the variation of vegetation characteristics in alpine grassland, Northern Tibet Plateau. PeerJ 2019, 7, e7272. [Google Scholar] [CrossRef] [Scilit] [PubMed]
- Li, H.; Zhang, H.; Li, Q.; Zhao, J.; Guo, X.; Ying, H.; Deng, G.; Rihan, W.; Wang, S. Vegetation productivity dynamics in response to climate change and human activities under different topography and land cover in Northeast China. Remote Sens. 2021, 13, 975. [Google Scholar] [CrossRef] [Scilit]
- Zhang, J.; Liu, Y.; Labat, D.; Zhang, J.; Xie, Z.; Guo, J. Topographic-mediated climate-NPP relationships in subtropical mountain heterogeneity units. Sci. Rep. 2025, 15, 27541. [Google Scholar] [CrossRef] [Scilit] [PubMed]
- Khanal, P.; van Dijke, A.J.H.; Schaffhauser, T.; Li, W.; Paulus, S.; Zhan, C.; Orth, R. Relevance of near-surface soil moisture vs. terrestrial water storage for global vegetation functioning. Biogeosciences 2024, 21, 1533–1547. [Google Scholar] [CrossRef] [Scilit]
- Li, Y.; Zheng, L.; Zhang, W. Decoupling and Insensitivity of Greenness and Gross Primary Productivity Across Aridity Gradients in China. Remote Sens. 2024, 16, 4234. [Google Scholar] [CrossRef] [Scilit]
- Wang, B.; Cheng, W.; Xu, H.; Wang, R.; Song, K.; Bao, A.; Shi, Q. Vegetation differentiation characteristics and control mechanisms in the Altay region based on topographic gradients. Ecol. Indic. 2024, 160, 111838. [Google Scholar] [CrossRef] [Scilit]
- Bilgili, B.C.; Erşahin, S.; Kavakligil, S.S.; Öner, N. Net primary productivity of a mountain forest ecosystem as affected by climate and topography. Cerne 2020, 26, 356–368. [Google Scholar] [CrossRef] [Scilit]
- Ma, W.; Zhao, C.; Zhou, N. Identifying the Factors Driving Vegetation Dynamics in Arid, Semiarid, and Semihumid Regions of the Mongolian Plateau. Ecosyst. Health Sustain. 2025, 11, 407. [Google Scholar] [CrossRef] [Scilit]
- Zarei, A.R. A Hydro-Physiological Aridity Index for Agricultural Aridity Assessment Accounting for Effective Precipitation and Vegetation Regulation. Environ. Sustain. Indic. 2026, 31, 101332. [Google Scholar] [CrossRef] [Scilit]
- Ji, R.; Tan, K.; Wang, X.; Pan, C.; Xin, L. Spatiotemporal Monitoring of a Grassland Ecosystem and Its Net Primary Production Using Google Earth Engine: A Case Study of Inner Mongolia from 2000 to 2020. Remote Sens. 2021, 13, 4480. [Google Scholar] [CrossRef] [Scilit]
- Deng, H.; Chen, Y. Remote-Sensing-Based Monitoring of Spatiotemporal Variations and Driving Forces of Terrestrial Vegetation NPP in a Subtropical Urbanizing Region. Environ. Monit. Assess. 2025, 197, 1028. [Google Scholar] [CrossRef] [Scilit] [PubMed]
- Dong, D.; Zhang, R.; Guo, W.; Gong, D.; Zhao, Z.; Wang, Y.; Zhao, J.; Guo, Q. Assessing Spatiotemporal Dynamics of Net Primary Productivity in Shandong Province, China (2001–2020) Using the CASA Model and Google Earth Engine: Trends, Patterns, and Driving Factors. Remote Sens. 2025, 17, 488. [Google Scholar] [CrossRef] [Scilit]
- Xu, L.; Zhao, Z.; Wang, C.; Wang, H.; Ma, C. Quantitative Estimation of Net Primary Productivity by an Improved tCASA Model Using Landsat Time Series Data: A Case Study of Central Plains, China. IEEE J. Sel. Top. Appl. Earth Obs. Remote Sens. 2025, 18, 10403–10418. [Google Scholar] [CrossRef] [Scilit]
- Du, Y.; Li, X.; He, X.; Zong, Q.; Yang, G.; Zhang, F. Spatiotemporal Variation Characteristics and Driving Mechanisms of Net Primary Productivity of Vegetation on Northern Slope of Tianshan Mountains Based on CASA Model, China. Plants 2025, 14, 2499. [Google Scholar] [CrossRef] [Scilit] [PubMed]
- Liu, C.; Huang, X.; Islam, T.; Jui, M.A.; Li, Y.; Gu, L. Analysis on spatiotemporal heterogeneity and impact mechanism of carbon sink in Qinling Mountains based on leaf area index. Trees For. People 2025, 22, 100985. [Google Scholar] [CrossRef] [Scilit]
- Ma, Y.; Wang, J.; Xin, P.; Zhao, Z.; Zhang, X.; Yang, Y.; Gao, T.; Qiu, L. Assessing carbon storage dynamics and policy impacts: Application of InVEST-PLUS framework in the Qinling Mountains, China. Land Use Policy 2026, 164, 107947. [Google Scholar] [CrossRef] [Scilit]
- Cheng, D.; Qi, G.; Song, J.; Zhang, Y.; Bai, H.; Gao, X. Quantitative Assessment of the Contributions of Climate Change and Human Activities to Vegetation Variation in the Qinling Mountains. Front. Earth Sci. 2021, 9, 782287. [Google Scholar] [CrossRef] [Scilit]
- Yuan, Y.; Huang, G.; Zhao, T.; Zhang, X.; Zheng, M.; Lei, L. Spatio-Temporal Variations and the Climatic and Human Activity Driving Factor Analysis of Net Primary Productivity (2000–2022) in the Qinling Shaanxi Section of China. J. Indian Soc. Remote Sens. 2026, 54, 737–753. [Google Scholar] [CrossRef] [Scilit]
- Zeng, Q.; Hao, C. Response of Vegetation Net Primary Productivity to Extreme Climate in a Climate Transition Zone: Evidence from the Qinling Mountains. Atmosphere 2025, 16, 1208. [Google Scholar] [CrossRef] [Scilit]
- Chen, Y.; Guo, D.; Cao, W.; Li, Y. Changes in Net Primary Productivity and Factor Detection in China’s Yellow River Basin from 2000 to 2019. Remote Sens. 2023, 15, 2798. [Google Scholar] [CrossRef] [Scilit]
- Hao, X.; Wang, X.; Ma, J.; Chen, Y.; Luo, S. Spatiotemporal Characteristic Prediction and Driving Factor Analysis of Vegetation Net Primary Productivity in Central China Covering the Period of 2001–2019. Land 2023, 12, 2121. [Google Scholar] [CrossRef] [Scilit]
- Moameri, M.; Mohammadnezhad, P.; Ghorbani, A.; Dadjou, F.; Mohammadi, V. Modeling of Aboveground Net Primary Production Using Topography Factors in Siahpoush and Ganjgah Rangelands of Ardabil Province, Iran. J. Rangel. Sci. 2023, 13, 1596. [Google Scholar] [CrossRef]
- Zhang, Y.; Cao, G.; Zhao, M.; Zhang, Q. Topographic effects on vegetation phenology in response to climate change on the southern slope of Qilian Mountains, Northwest China. Chin. J. Appl. Ecol. 2025, 36, 2131–2138. [Google Scholar] [CrossRef] [Scilit] [PubMed]
- Zhou, Y.; Zhou, Y.; Zhang, L.; Xiao, J.; Williams, C.B.; Vitkovskaya, I.; Bao, A. Spatiotemporal transition of institutional and socioeconomic impacts on vegetation productivity in Central Asia over last three decades. Sci. Total Environ. 2019, 658, 922–935. [Google Scholar] [CrossRef] [Scilit] [PubMed]
- Zhang, X.; Ning, J. Patterns, Trends, and Causes of Vegetation Change in the Three Rivers Headwaters Region. Land 2023, 12, 1127. [Google Scholar] [CrossRef] [Scilit]
- Li, X. The Relationship Between Vegetation and Terrain Factor Based on Topographic Correction. Acad. J. Sci. Technol. 2023, 6, 162–167. [Google Scholar] [CrossRef] [Scilit]
- Zhou, P.; Zhao, D.; Liu, X.; Duo, L.; He, B.J. Dynamic Change of Vegetation Index and Its Influencing Factors in Alxa League in the Arid Area. Front. Ecol. Evol. 2022, 10, 922739. [Google Scholar] [CrossRef] [Scilit]
- Wang, C.; Zhang, R.; Chang, L.; Tian, Q. Contrasting response mechanisms and ecological stress of net primary productivity in sub-humid to arid transition regions: A case study from the Loess Plateau, China. Front. Ecol. Evol. 2023, 11, 1157981. [Google Scholar] [CrossRef] [Scilit]
- Liu, Z.; Lin, H.; Li, H.; Li, M.; Zhou, P.; Wang, Z.; Niu, J. Response Mechanisms of Vegetation Productivity to Water Variability in Arid and Semi-Arid Areas of China: A Decoupling Analysis of Soil Moisture and Precipitation. Atmosphere 2025, 16, 933. [Google Scholar] [CrossRef] [Scilit]
- Tian, R.; Liu, L.; Zheng, J.; Li, J.; Han, W.; Liu, Y. Combined Effects of Meteorological Factors, Terrain, and Greenhouse Gases on Vegetation Phenology in Arid Areas of Central Asia from 1982 to 2021. Land 2024, 13, 180. [Google Scholar] [CrossRef] [Scilit]
- Wang, H.; Sun, B.; Yu, X.; Xin, Z.; Jia, G. The driver-pattern-effect connection of vegetation dynamics in the transition area between semi-arid and semi-humid northern China. Catena 2020, 194, 104713. [Google Scholar] [CrossRef] [Scilit]
- Wang, Z.; Chen, W.; Piao, J.; Chen, S.; Wu, C. Aridification enhancing vegetation sensitivities to soil and atmospheric dryness in Northeast Asia. Glob. Planet. Chang. 2026, 257, 105244. [Google Scholar] [CrossRef] [Scilit]

Disclaimer/Publisher’s Note: The statements, opinions and data contained in all publications are solely those of the individual author(s) and contributor(s) and not of MDPI and/or the editor(s). MDPI and/or the editor(s) disclaim responsibility for any injury to people or property resulting from any ideas, methods, instructions or products referred to in the content. |
© 2026 by the authors. Licensee MDPI, Basel, Switzerland. This article is an open access article distributed under the terms and conditions of the Creative Commons Attribution (CC BY) license.