


Abstract
As the share of nonlinear loads in the power supply systems of industrial enterprises increases, the importance of accurately estimating higher harmonics through modeling grows both in operation and in design. In this case, all network elements and loads are represented by their corresponding models or equivalent circuits (ECs), and the simulation results depend on the modeling assumptions adopted for these circuits. This paper investigates equivalent circuits of an induction motor under higher-harmonic conditions. Laboratory tests were carried out for 1.5 and 5.5 kW squirrel-cage induction motors operating under distorted supply voltage and at different shaft loads. The experimentally obtained impedance characteristics were compared with those calculated using the T-type and parallel resistive–inductive equivalent circuits. The selected induction motor models were then used in a comprehensive simulation of a typical industrial enterprise power supply system, and power quality indices were evaluated for different total motor capacities. The experimental results obtained for the 1.5 and 5.5 kW motors up to the 19th harmonic were extrapolated, as an engineering assumption, to the 160 kW motor and to the harmonic range up to the 49th order. The obtained results demonstrate significant qualitative and quantitative differences, indicating that the choice of the induction motor-equivalent circuit can substantially influence harmonic power quality assessment.
1. Introduction
In the current context of industrial and energy-sector development, there is a steady increase in electricity consumption due to the growth of production capacity [1,2,3]. At the same time, the structure of electrical loads is changing significantly: the share of power receivers equipped with power electronics, which represent nonlinear loads, is increasing [4,5,6]. Such loads are sources of higher current harmonics [7,8], which lead to distortion of the sinusoidal voltage waveform in electrical networks [9,10,11].
Ensuring the required power quality (PQ) has therefore become one of the key tasks both at the design stage of power supply systems (PSSs) and during their operation [12,13,14]. Particular attention to PQ issues is given in regulatory documents and standards [15]. At present, compliance with these requirements is a mandatory condition for ensuring the electromagnetic compatibility of equipment and the reliable operation of consumers.
The relevance of this problem is especially high for the distribution networks of industrial enterprises [16,17,18], particularly those in the mining [19,20,21] and oil industries [22]. Such facilities are typically characterized by the presence of high-power loads [23,24], the reliability of which may deteriorate significantly due to poor PQ [25,26,27]. The use of filter-compensating devices in the presence of higher harmonic sources requires a careful assessment of their current overload capacity, as well as an analysis of resonant operating conditions [25,26].
Simulation methods are a modern approach to solving this problem. Simulation includes the development of the network calculation model through equivalent representation [28,29,30], as well as the selection and justification of the parameters of equivalent circuits [31,32,33]. The use of adequate mathematical models of power supply system elements is the key criterion determining the accuracy of simulation results [34,35]. As the number of studies devoted to PQ increases, the number of models used to describe the operation of devices under higher harmonics is also growing. For example, for the induction motor (IM), a number of sources [15,36,37] propose different equivalent circuits for higher harmonics, which raises the need to assess how equivalent-circuit selection affects calculated harmonic indicators.
The aim of this study is to compare IM equivalent circuits used for harmonic power quality assessment, evaluate their agreement with experimentally measured harmonic impedance characteristics, and determine how equivalent-circuit selection affects the calculated power quality indices of an industrial power supply system. The novelty of the study consists of combining qualitative and quantitative experimental assessment of the agreement between measured harmonic impedance characteristics and the two equivalent-circuit models with an assessment of how model selection affects voltage and current distortion indices as the total installed motor power increases.
2. Materials and Methods
The object of the study is a squirrel-cage induction motor. The subject of the study is the complex impedance characteristic of the induction motor, obtained by representing the real object with its equivalent circuit (model).
The study is organized as follows. First, laboratory tests are used to obtain the impedance characteristics of two squirrel-cage induction motors operating under distorted supply voltage. Then, the experimentally obtained characteristics are compared with those calculated using the T-type equivalent circuit and the parallel resistive-inductive equivalent circuit to assess how each model reproduces the experimentally observed harmonic impedance behavior of the induction motor. Finally, the considered motor models are included in a simulation model of a typical industrial power supply system in order to determine how the equivalent-circuit selection affects the calculated power quality indicators. The laboratory study was conducted using relatively low-power motors rated at 1.5 and 5.5 kW, whereas the simulation study considered industrial-scale motor loads represented by 160 kW motors, with the total installed motor capacity varied from 160 to 640 kW.
Section 2.1 describes the experimental setup and the procedure used to determine the harmonic impedance characteristics of the induction motors. Laboratory tests are carried out for two squirrel-cage induction motors of different rated powers and at several mechanical load levels. The voltage and current waveforms are measured under distorted supply-voltage conditions and processed using the fast Fourier transform. The obtained voltage and current phasors are then used to determine the resistance R(n) and reactance X(n) of the motors up to the 19th harmonic.
Section 2.2 presents the induction motor-equivalent-circuit models selected for harmonic analysis. The experimentally obtained characteristics are compared with those calculated using the T-type equivalent circuit and the parallel resistive-inductive equivalent circuit. The section describes the structure of both models, the calculation or selection of their parameters, and the determination of their complex impedance characteristics for the same motor operating conditions as those considered experimentally.
Section 2.3 presents a simplified typical power supply scheme of an industrial enterprise with various types of electrical loads, including a nonlinear load. The same section also provides the parameters of all elements of the power supply system, on the basis of which the equivalent circuits are developed. The induction motor included in the industrial power supply system is represented by the two models described in Section 2.2. The parameters of both equivalent-circuit models are provided for a 160 kW induction motor.
The study uses simulation modeling in the MATLAB Simulink R2021a environment with the Specialized Power Systems library. Based on simulation modeling, the equivalence of the induction motor-equivalent circuits is determined from the equality of active, reactive, and apparent power at the fundamental harmonic for the different circuits. For the complex impedance characteristics obtained from the selected models, a comparative analysis is carried out up to the 49th harmonic, allowing quantitative and qualitative differences between the models at higher harmonics to be identified.
Section 2.4 presents a comprehensive simulation of the enterprise power supply scheme described in Section 2.3, using the induction motor-equivalent circuits described in Section 2.2. During the simulation, the load power of the induction motors is varied in proportion to the number of connected units, from one to four motors. As a result, eight simulation experiments were carried out, corresponding to two induction motor models and four values of the total installed motor power. Voltage and current waveforms are obtained for the 0.4 kV network voltage, the incoming network current, and the current of the reactive power compensator. By applying fast Fourier transform algorithms, the current and voltage spectra up to the 49th harmonic are derived from the waveforms. On this basis, the power quality indicators were calculated and compared depending on the induction motor-equivalent circuit used, as well as the maximum permissible values required by standards.
2.1. Experimental Determination of Induction Motor Harmonic Impedance
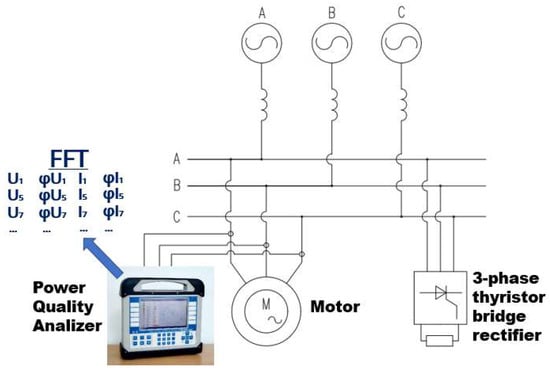
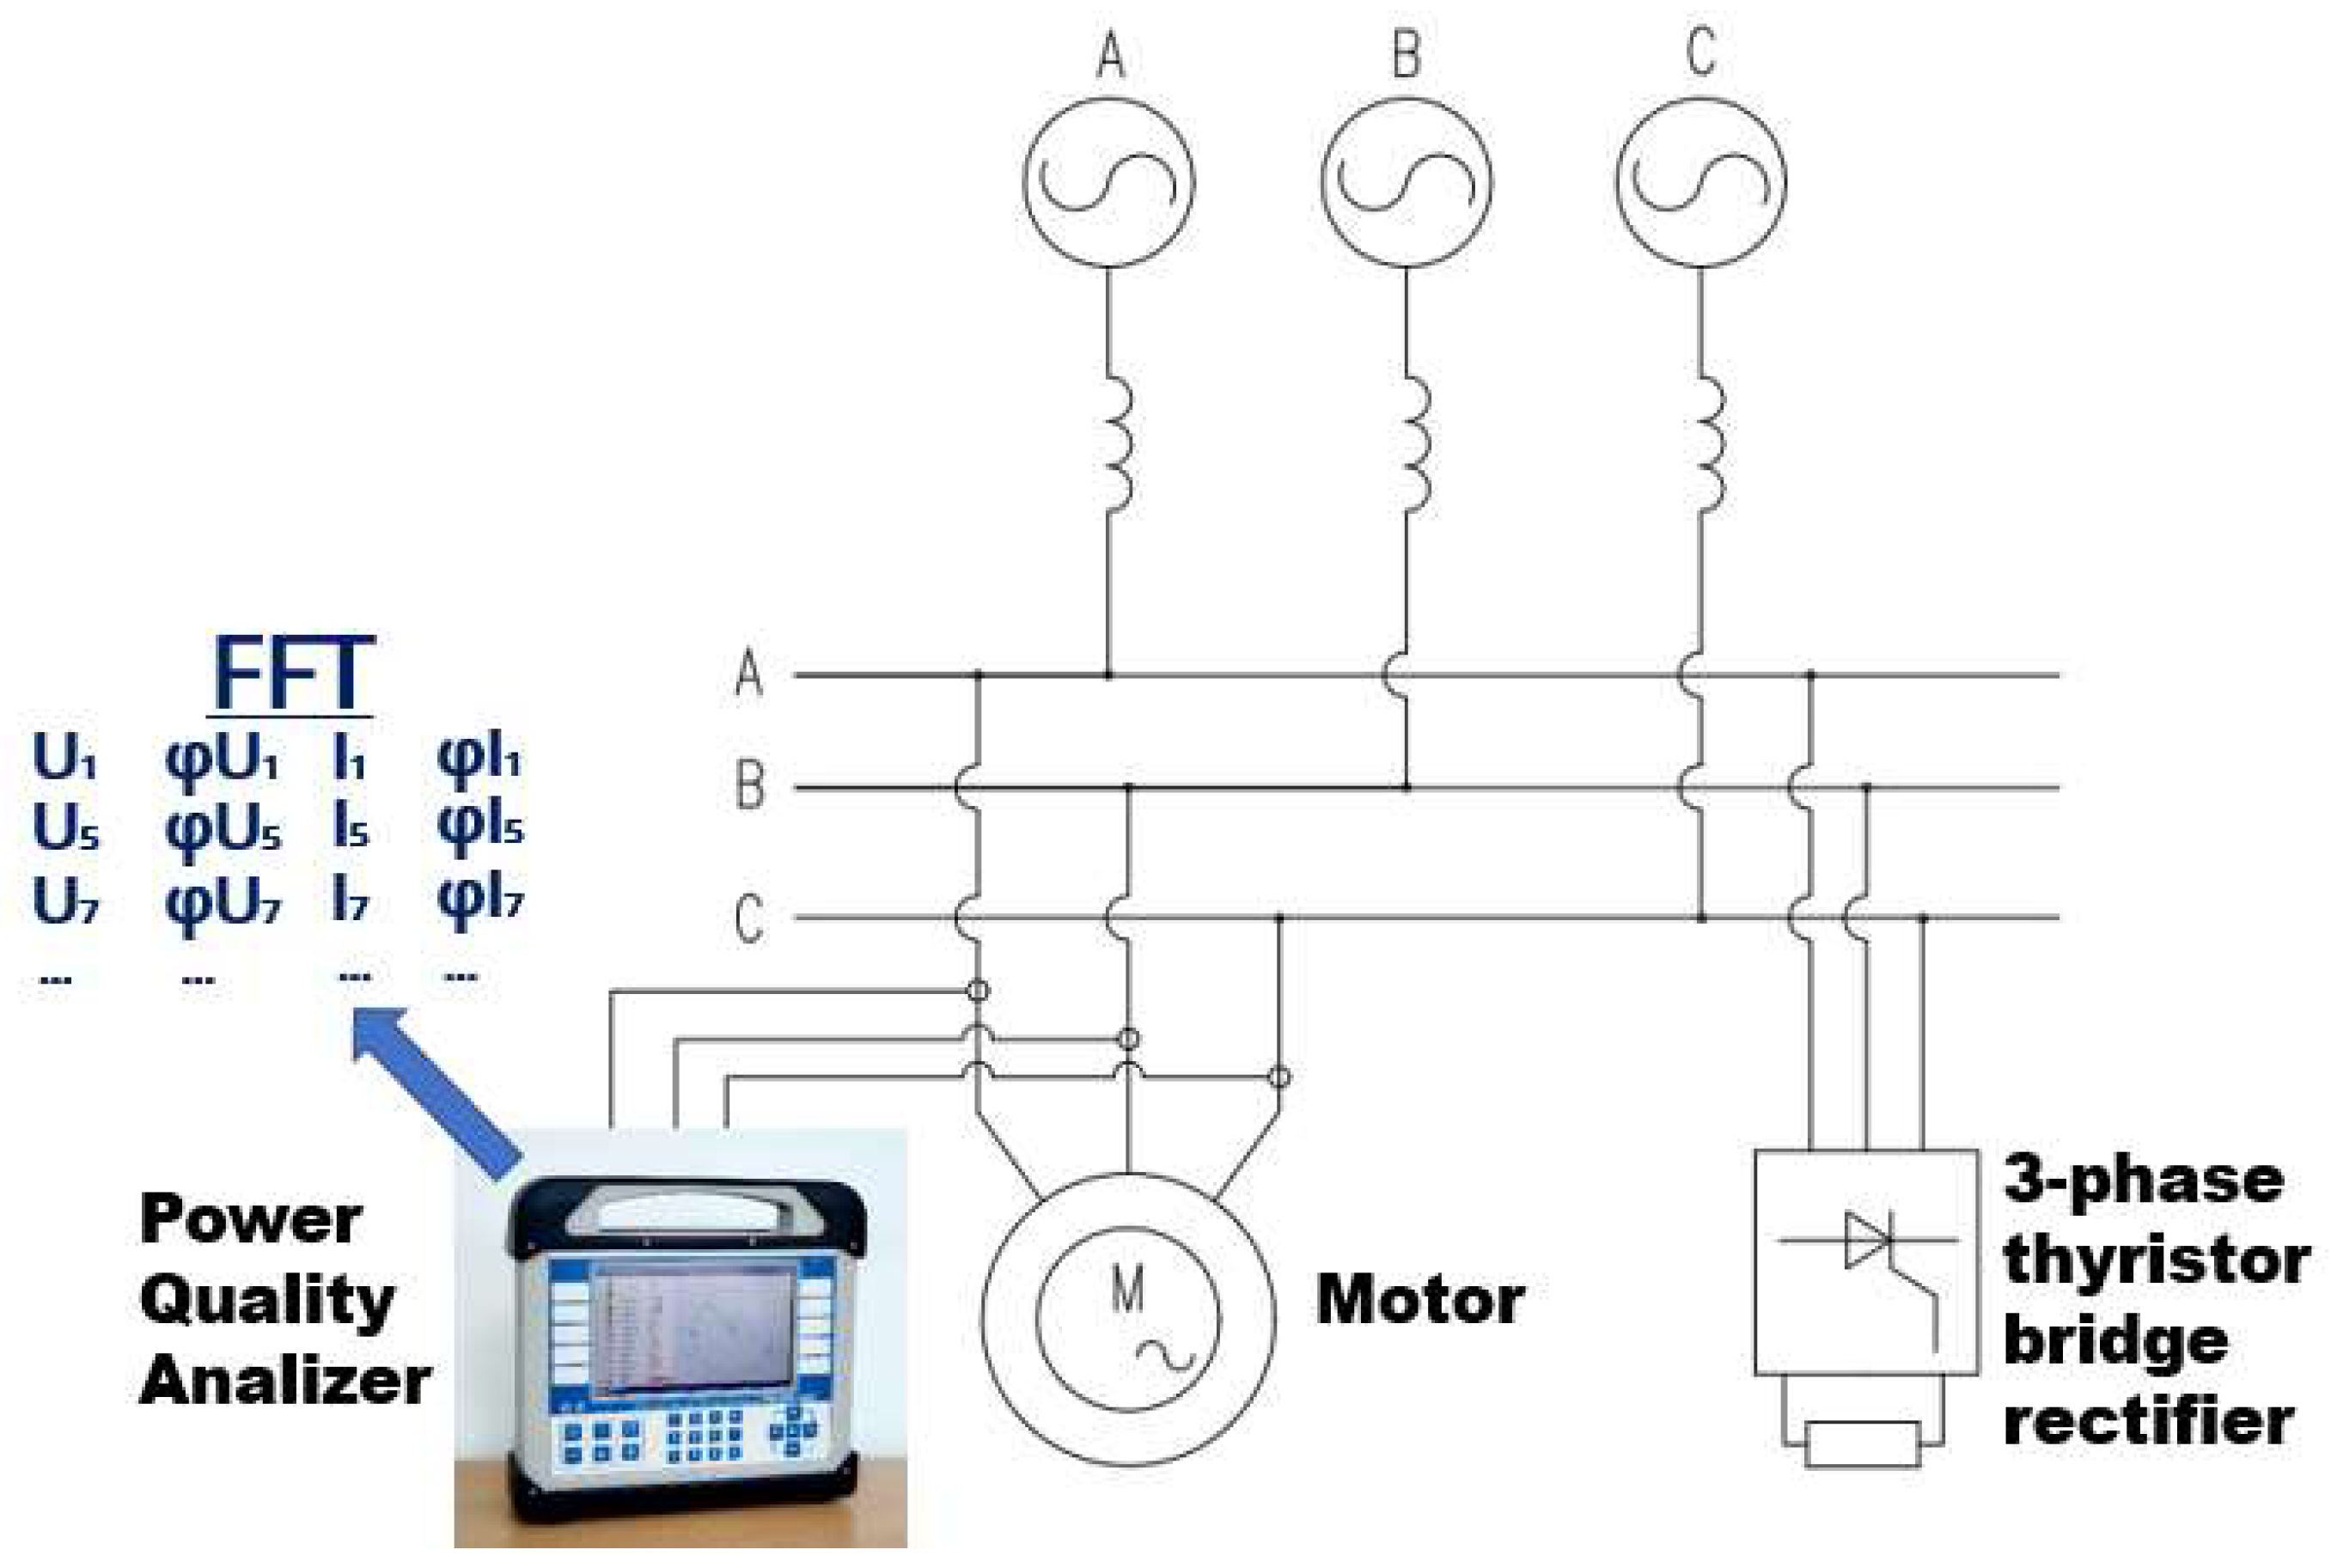
To compare the induction motor-equivalent circuits with experimental data, laboratory tests were carried out. The general scheme of the laboratory bench is shown in Figure 1. The bench consisted of a three-phase voltage source, an input impedance, an induction motor, and a six-pulse bridge thyristor rectifier. In Figure 1, M denotes the induction motor under test, and TR denotes the thyristor rectifier.
Figure 1.
An electrical diagram of the laboratory bench.
The three-phase source had an RMS phase voltage of 220 V. The input impedance of the laboratory network was represented by an active-inductive element. The thyristor rectifier was used as a nonlinear load. The higher harmonic currents generated by the rectifier caused voltage drops across the input impedance. As a result, a nonsinusoidal voltage was formed at the motor terminals. Under these conditions, the induction motor operated from a distorted supply voltage containing higher harmonic components. Two squirrel-cage induction motors were used in the experiment: 4A90L6UZ and 4A100L2UZ of IEK manufacturer, Moscow, Russia, which made it possible to obtain impedance characteristics for machines with different parameters under the same experimental method. The rated parameters of the motors are given in Table 1.
Table 1.
The rated parameters of the induction motors used in the laboratory study.
A DC motor with independent excitation was used as a mechanical load on the shaft of the induction motor. The shaft power was varied in steps. For the 1.5 kW induction motor, the following load levels were used: 189 W, 374 W, 512 W, and 613 W. For the 5.5 kW induction motor, the load levels were 603 W, 910 W, and 1650 W. The maximum load values were selected according to the current limitations of the laboratory bench.
During the experiment, voltage and current waveforms of the induction motor were recorded for phase A using a “RESURS-PQA” power quality analyzer of research and production enterprise “Energotechnika”, Penza, Russia. Since the laboratory system was symmetrical, the phase A data were used to determine the single-phase impedance characteristics. The recorded voltage and current waveforms contained 1000 samples over one 20 ms cycle at 50 Hz, corresponding to a sampling frequency of 50 kHz. The waveforms were processed in MATLAB/Simulink using FFT analysis, providing a frequency resolution of 50 Hz. Since the FFT interval contained exactly one complete fundamental period, the harmonic frequencies coincided with the FFT frequency bins, thereby minimizing spectral leakage. The measurement uncertainty of the recorded voltage and current waveforms was ±0.1% for both voltage and current.
The analysis was carried out up to the 19th harmonic. Harmonics of higher orders were not used, since their RMS voltage and current values were comparable with the measurement uncertainty of the instrument. For each harmonic order, the complex impedance of the induction motor was determined from the voltage and current phasors:
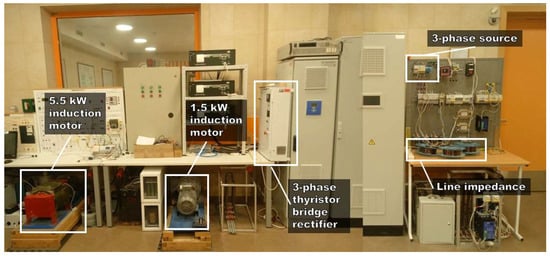
Since the complex impedance includes real and imaginary parts, the resistance R(n) and reactance X(n) were considered separately. Thus, experimental dependences of R and X on the harmonic order were obtained for each motor and each load level. The photograph of the laboratory bench is shown in Figure 2.
Figure 2.
A photo of the laboratory bench.
2.2. Induction Motor-Equivalent-Circuit Models for Harmonic Analysis
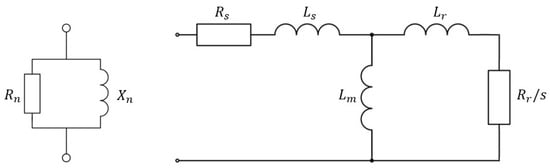
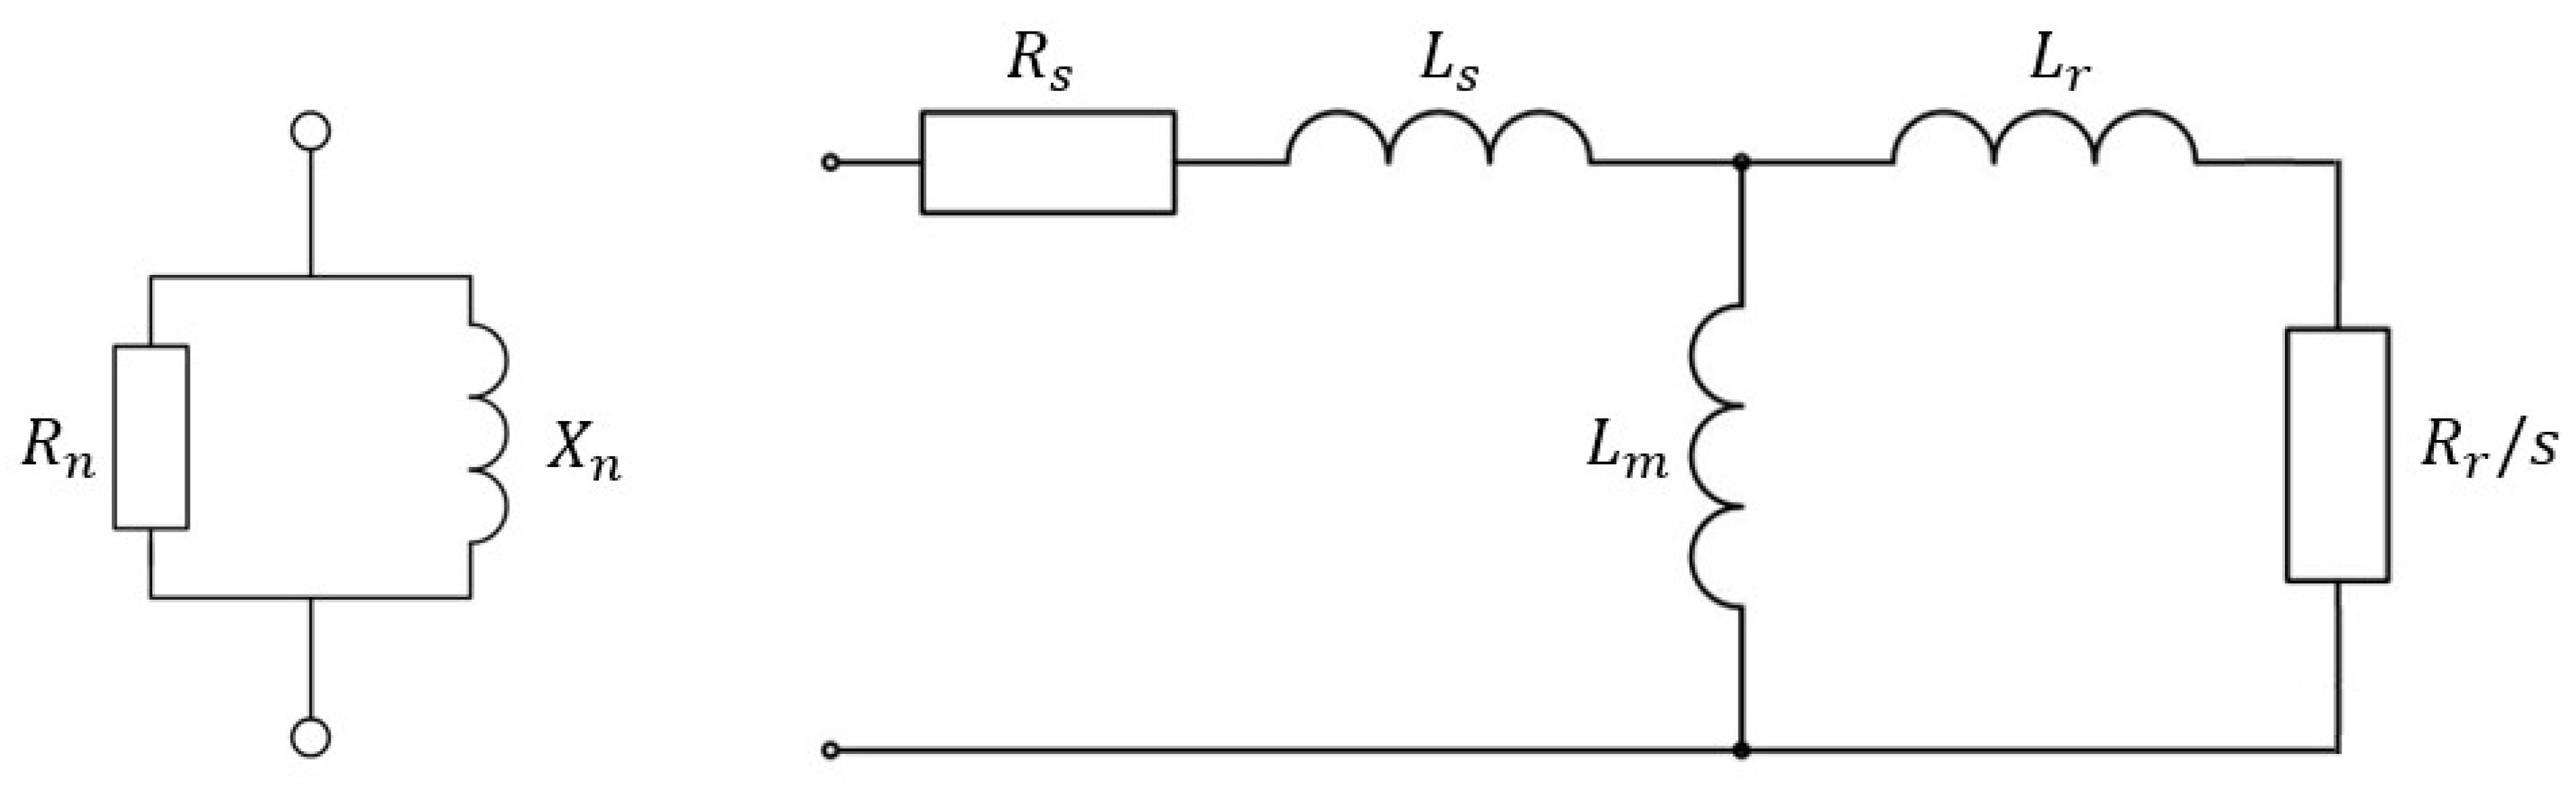
The experimentally obtained impedance characteristics were compared with the characteristics calculated using two single-phase induction motor models that are widely used in engineering calculations and research studies [38,39,40]: the T-type equivalent circuit (T-EC) [37] and the parallel-connected resistive-inductive equivalent circuit [15,36]. Although other induction motor representations for harmonic analysis have also been proposed in [15], the present study was limited to these two models to preserve the clarity of the comparative analysis and avoid unnecessary complication of its interpretation. The diagrams of the selected models are shown in Figure 3. In the parallel equivalent circuit, Rn and Xn denote the resistance and reactance. In the T-type equivalent circuit, Rs and Rr are the stator and rotor resistances; Ls, Lr, and Lm are the stator, rotor, and magnetizing inductances; and s is the slip.
Figure 3.
Induction motor single-phase models for higher-harmonic analysis: the parallel EC (left) and the T-EC (right).
The parameters of the induction motor models are calculated and selected according to the following methods:
- Parallel equivalent circuit. To calculate the impedances at all harmonics, it is necessary to know the motor’s active and reactive power at the fundamental frequency. These quantities can be determined easily from the rated parameters, since they can always be found in the manufacturer’s datasheet [15,36]. The calculation was performed using the following formulas:where U is the rated voltage; P1 is the rated active electrical power of one phase of the induction motor; Q1 is the rated reactive electrical power of one phase of the induction motor; and n is the harmonic order. The active resistance of the parallel equivalent circuit was recalculated for each load condition. The reactive component was kept equal to the rated value. This assumption was adopted because the reactive power associated with the magnetizing branch is mainly determined by the applied voltage. Based on these quantities, the impedance was calculated as follows:
- T-EC [37]. The use of this model requires the following parameters: the stator and rotor resistances, as well as the stator, rotor, and magnetizing inductances, which are not provided by the manufacturer and therefore require additional calculations or supplementary data.The harmonic slip sn is defined as follows:where n is the harmonic number, is the pulsation of supply voltage, is the mechanical speed of the rotor and z is the number of pole pairs.
The determination and identification of the above induction motor parameters with a high degree of accuracy remain a relevant problem nowadays [34,41,42]. This requirement may complicate the practical use of the T-type equivalent circuit. In order to avoid discussing the algorithm used to determine the parameters of the T-EC, the parameter values adopted for this study were taken from a reference handbook on Soviet/Russian 4A-series induction motors [43]. The T-type equivalent-circuit parameters adopted for the motors considered in the laboratory study are presented in Table 2.
Table 2.
Parameters of induction motors 4A90L6UZ and 4A100L2UZ.
For the theoretical calculation, the same load levels as in the experiment were used. Phase RMS voltage was taken as 220 V. The complex impedance characteristics of each equivalent circuit were calculated for the selected harmonic orders. To compare models with each other and experimental data, the obtained functions Z(n) from Formulas (1), (4) and (5) were represented in terms of their real and imaginary parts:
To supplement the qualitative comparison of the calculated and experimental impedance characteristics, quantitative error indicators were evaluated separately for the resistance R(n) and reactance X(n). The calculations were performed independently for each investigated motor, each shaft-power level, and each equivalent-circuit model. Only the higher harmonic orders n = 5, 7, 11, 13, 17, and 19 were included in the error assessment. The fundamental component (n = 1) was excluded because the present quantitative comparison was intended specifically to characterize the agreement of the models under higher-harmonic conditions. For a generic impedance component Y(n), where Y denotes either R or X, the absolute deviation between the calculated and experimentally obtained values at the n-th harmonic was determined as follows:
where Ymodel(n, P) is the resistance or reactance calculated using the considered equivalent-circuit model at harmonic order n and shaft power P, and Yexp(n, P) is the corresponding experimentally obtained value.
For each shaft-power level, the mean absolute error (MAE) was calculated as
The root mean square error (RMSE), which gives greater weight to larger deviations, was determined as
The maximum absolute deviation was determined as
In Expressions (9)–(11), N = 6 is the number of higher harmonic orders included in the comparison, with ni ∈ {5, 7, 11, 13, 17, 19}. The MAE, RMSE, and maximum absolute deviation were calculated separately for R(n) and X(n), for the T-type and parallel equivalent circuits, and for every investigated shaft-power level of both induction motors. Lower values of these indicators correspond to closer agreement between the calculated and experimental impedance characteristics.
2.3. Model of the Industrial Power Supply System
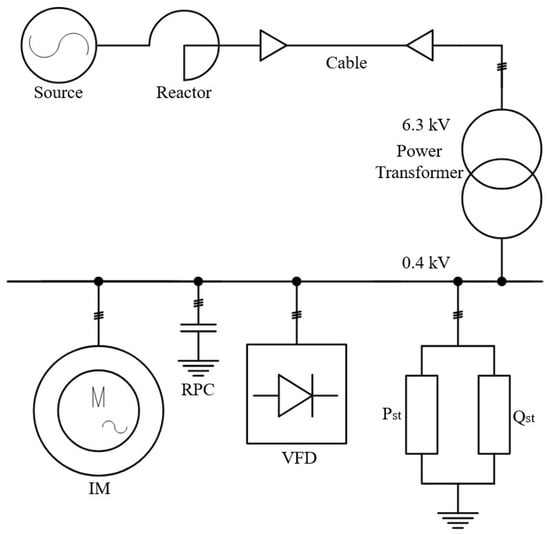
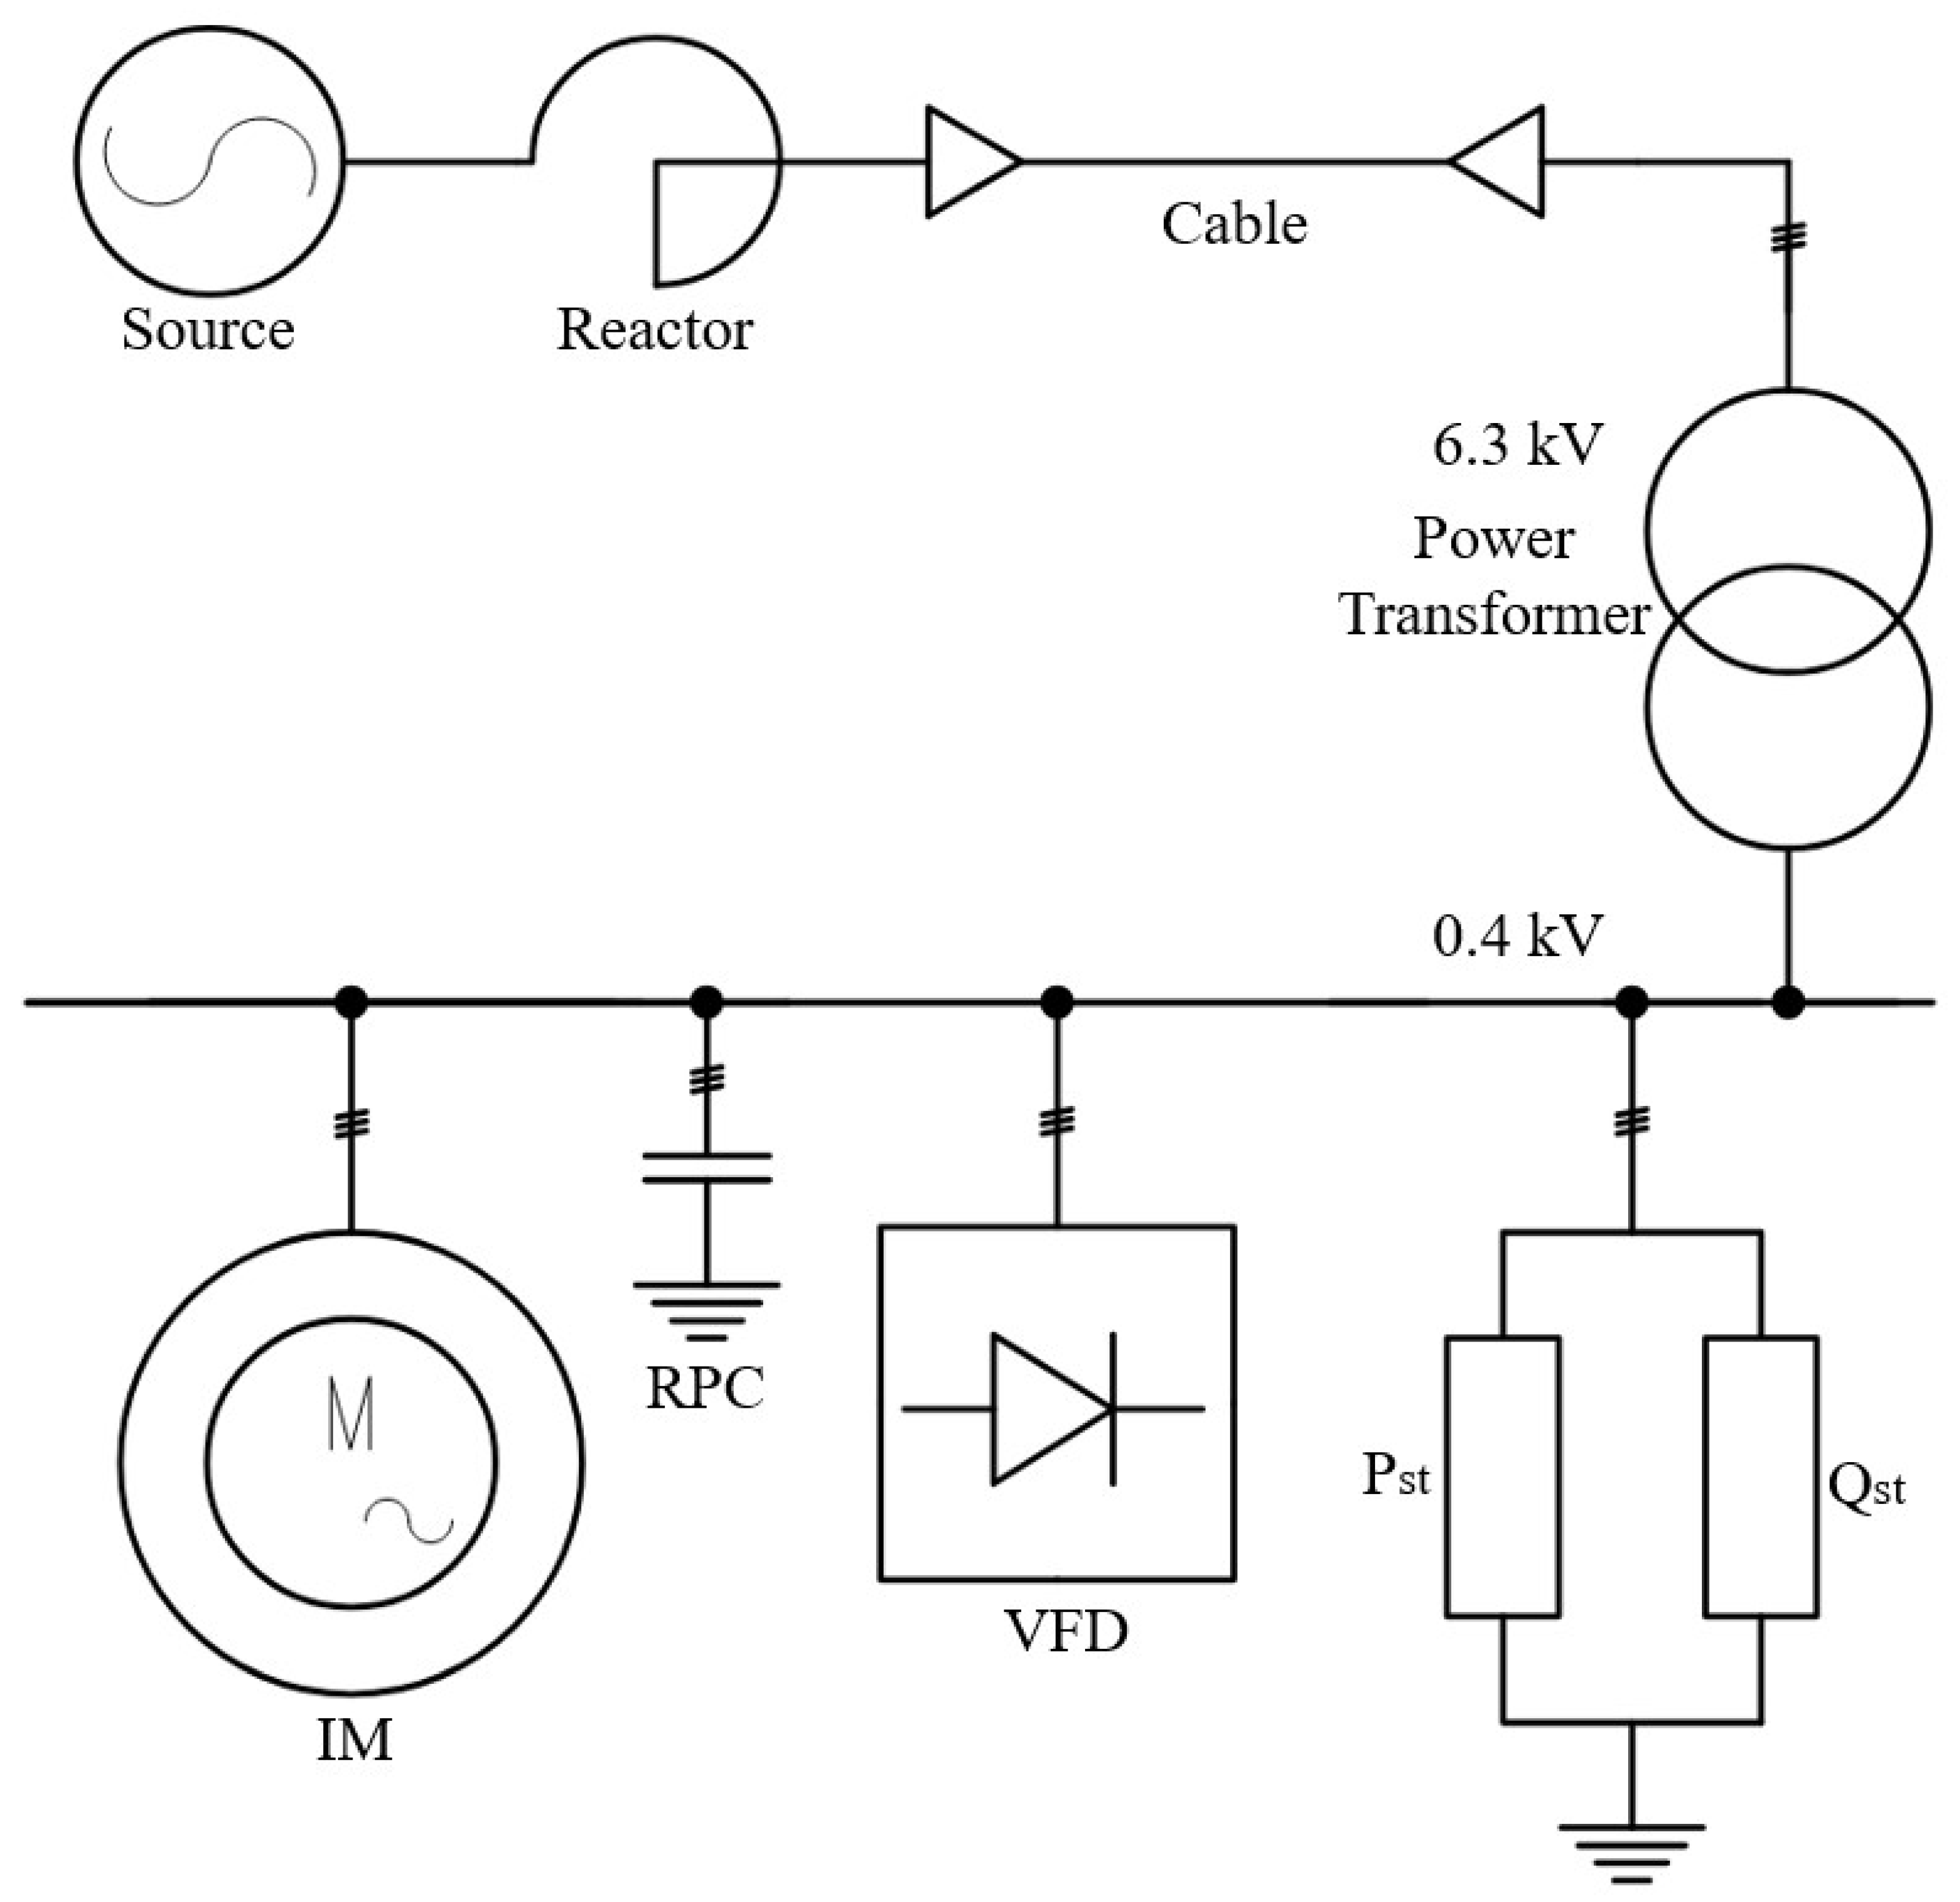
A typical modern power supply system (PSS) of an industrial enterprise at the first hierarchical level was considered as the study scheme. The first level includes the enterprise’s electrical loads and the networks directly connected to them, corresponding to individual transformer substations or load nodes. The schematic diagram of the facility is shown in Figure 4.
Figure 4.
Typical power supply scheme of an industrial enterprie.
Table 3 summarizes the parameters of the power supply system elements and their corresponding MATLAB Simulink representations, except for the induction motor, which is considered separately. The elements used to develop the simulation model described in Section 2.4 are as follows:
Table 3.
The parameters of the elements of the enterprise power supply scheme and their MATLAB Simulink models.
- Low-voltage-side devices (loads):
- Mercury-vapor lamps for lighting, represented as a static active-inductive load.
- A frequency converter, represented as a six-pulse uncontrolled rectifier with active power consumption on the DC side (Pdc). This load is a nonlinear component of the enterprise power system and therefore generates higher-order harmonic currents of odd orders that are not multiples of three.
- A reactive power compensator (RPC) unit, represented as a capacitance.
- Induction motors supplied directly from the grid. In the simulation study, one to four motors were connected. The equivalent-circuit models are described in Section 2.2, while the rated and equivalent-circuit parameters of the 160 kW motor are given below in Table 4 and Table 5.
Table 4. The rated parameters of the 160 kW induction motor.Table 5. The parameters of the induction motor-equivalent circuits. - High-voltage-side devices:
- Sinusoidal voltage source with internal active-inductive impedance;
- Current-limiting reactor, represented by inductive impedance;
- Cable transmission line, represented by resistive-inductive impedance;
- 6.3/0.4 kV power transformer, represented by the standard model of a two-winding three-phase transformer with parameters specified in per-unit values in the Specialized Power Systems library.
Table 4 presents the rated parameters of the induction motor used in the power supply scheme of the industrial enterprise.
The induction motor was represented using the two models described in Section 2.2: the T-type equivalent circuit, which forms the basis of the standard “Asynchronous Machine SI Units” block, and a parallel-connected resistive-inductive load. The parameters of the T-type equivalent circuit were adopted from experimental data reported in [34], whereas the parameters of the parallel equivalent circuit were calculated using the methodology described in Section 2.2. The resulting parameter values are presented in Table 5.
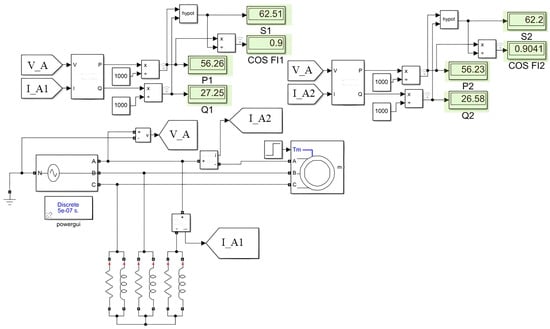
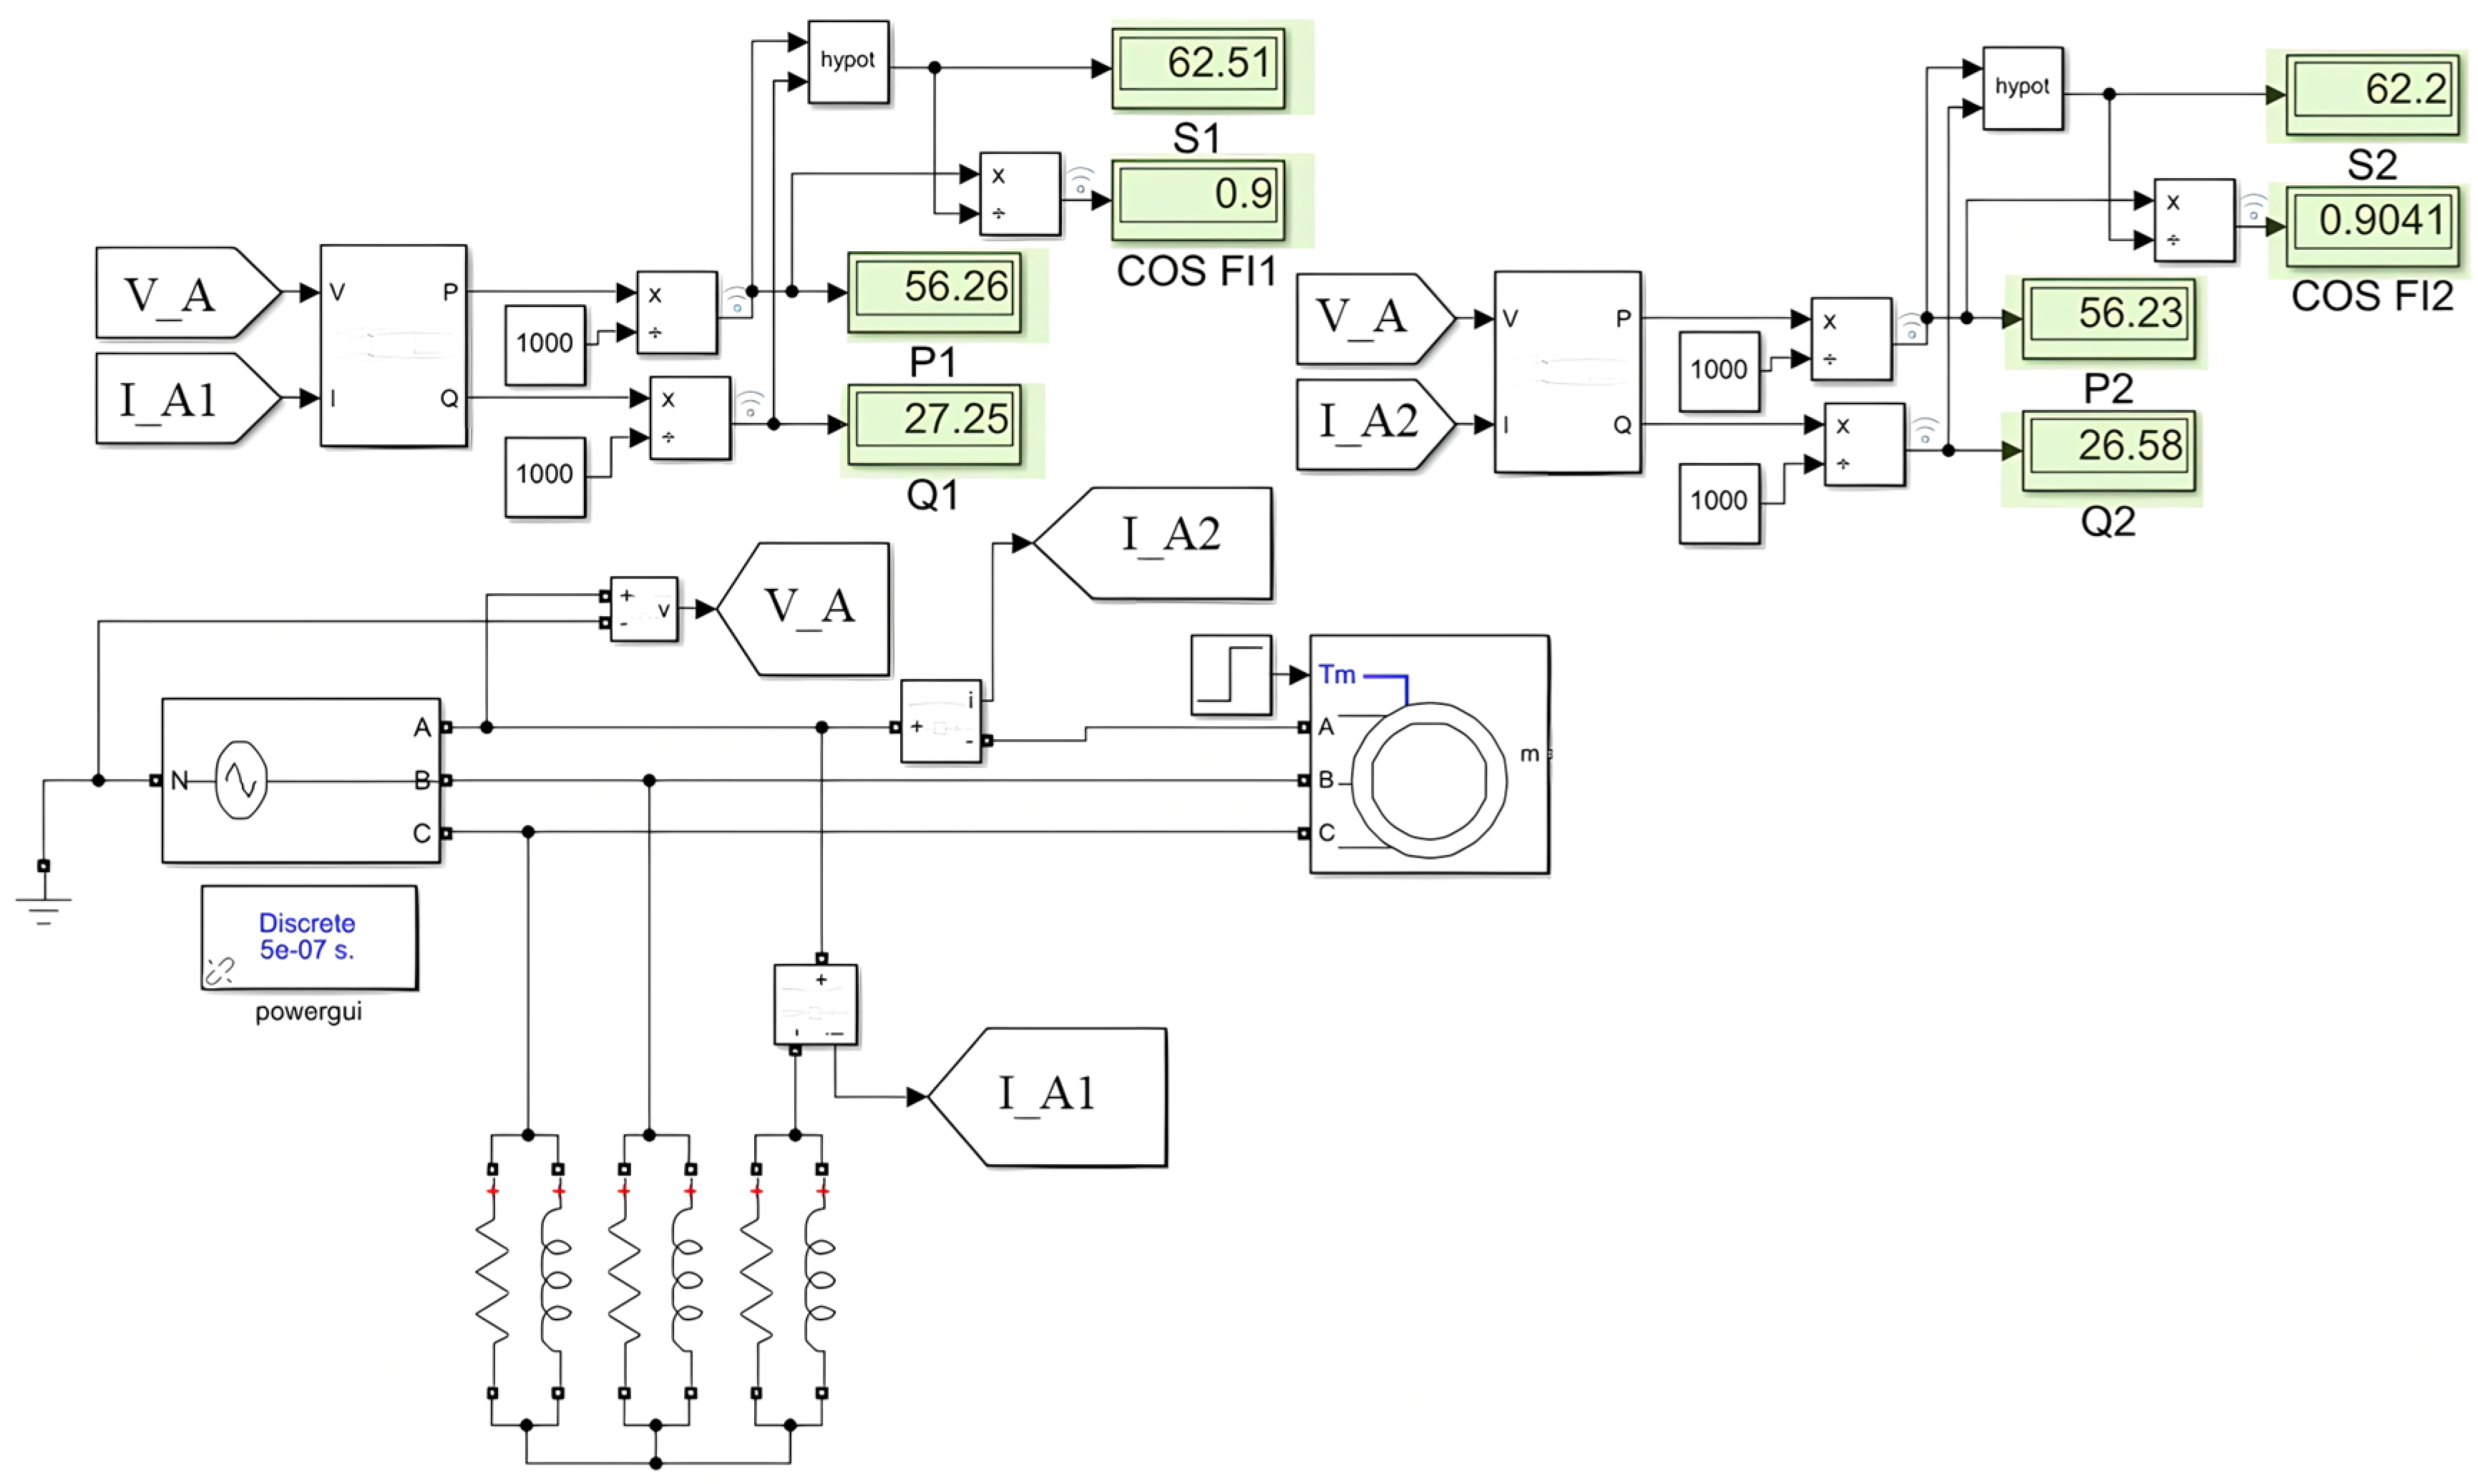
Using the selected parameter values of the induction motor-equivalent circuits, the models were checked for equivalence at the fundamental harmonic, which was determined based on the equality of active, reactive, and apparent power at the fundamental frequency. The MATLAB Simulink simulation model used to calculate the motor operating characteristics at the fundamental frequency is shown in Figure 5 below.
Figure 5.
The model for calculating the motor performance parameters at the fundamental frequency.
According to the simulation results, the characteristics at the fundamental frequency were compared, namely apparent, active, and reactive power, as well as the power factor. For the two models, the active power, apparent power, and power factor differed by less than 1%, whereas the reactive power differed by approximately 2.5%. The power characteristics of the equivalent circuits at the fundamental frequency are presented in Table 6.
Table 6.
A comparison of the power characteristics of the induction motor-equivalent circuits at the fundamental frequency.
In addition to the fundamental-frequency parameters, the complex impedance characteristics of the equivalent circuits were compared using the methodology described in Section 2.2.
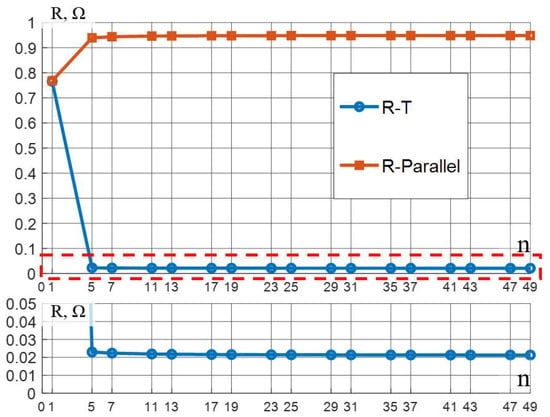
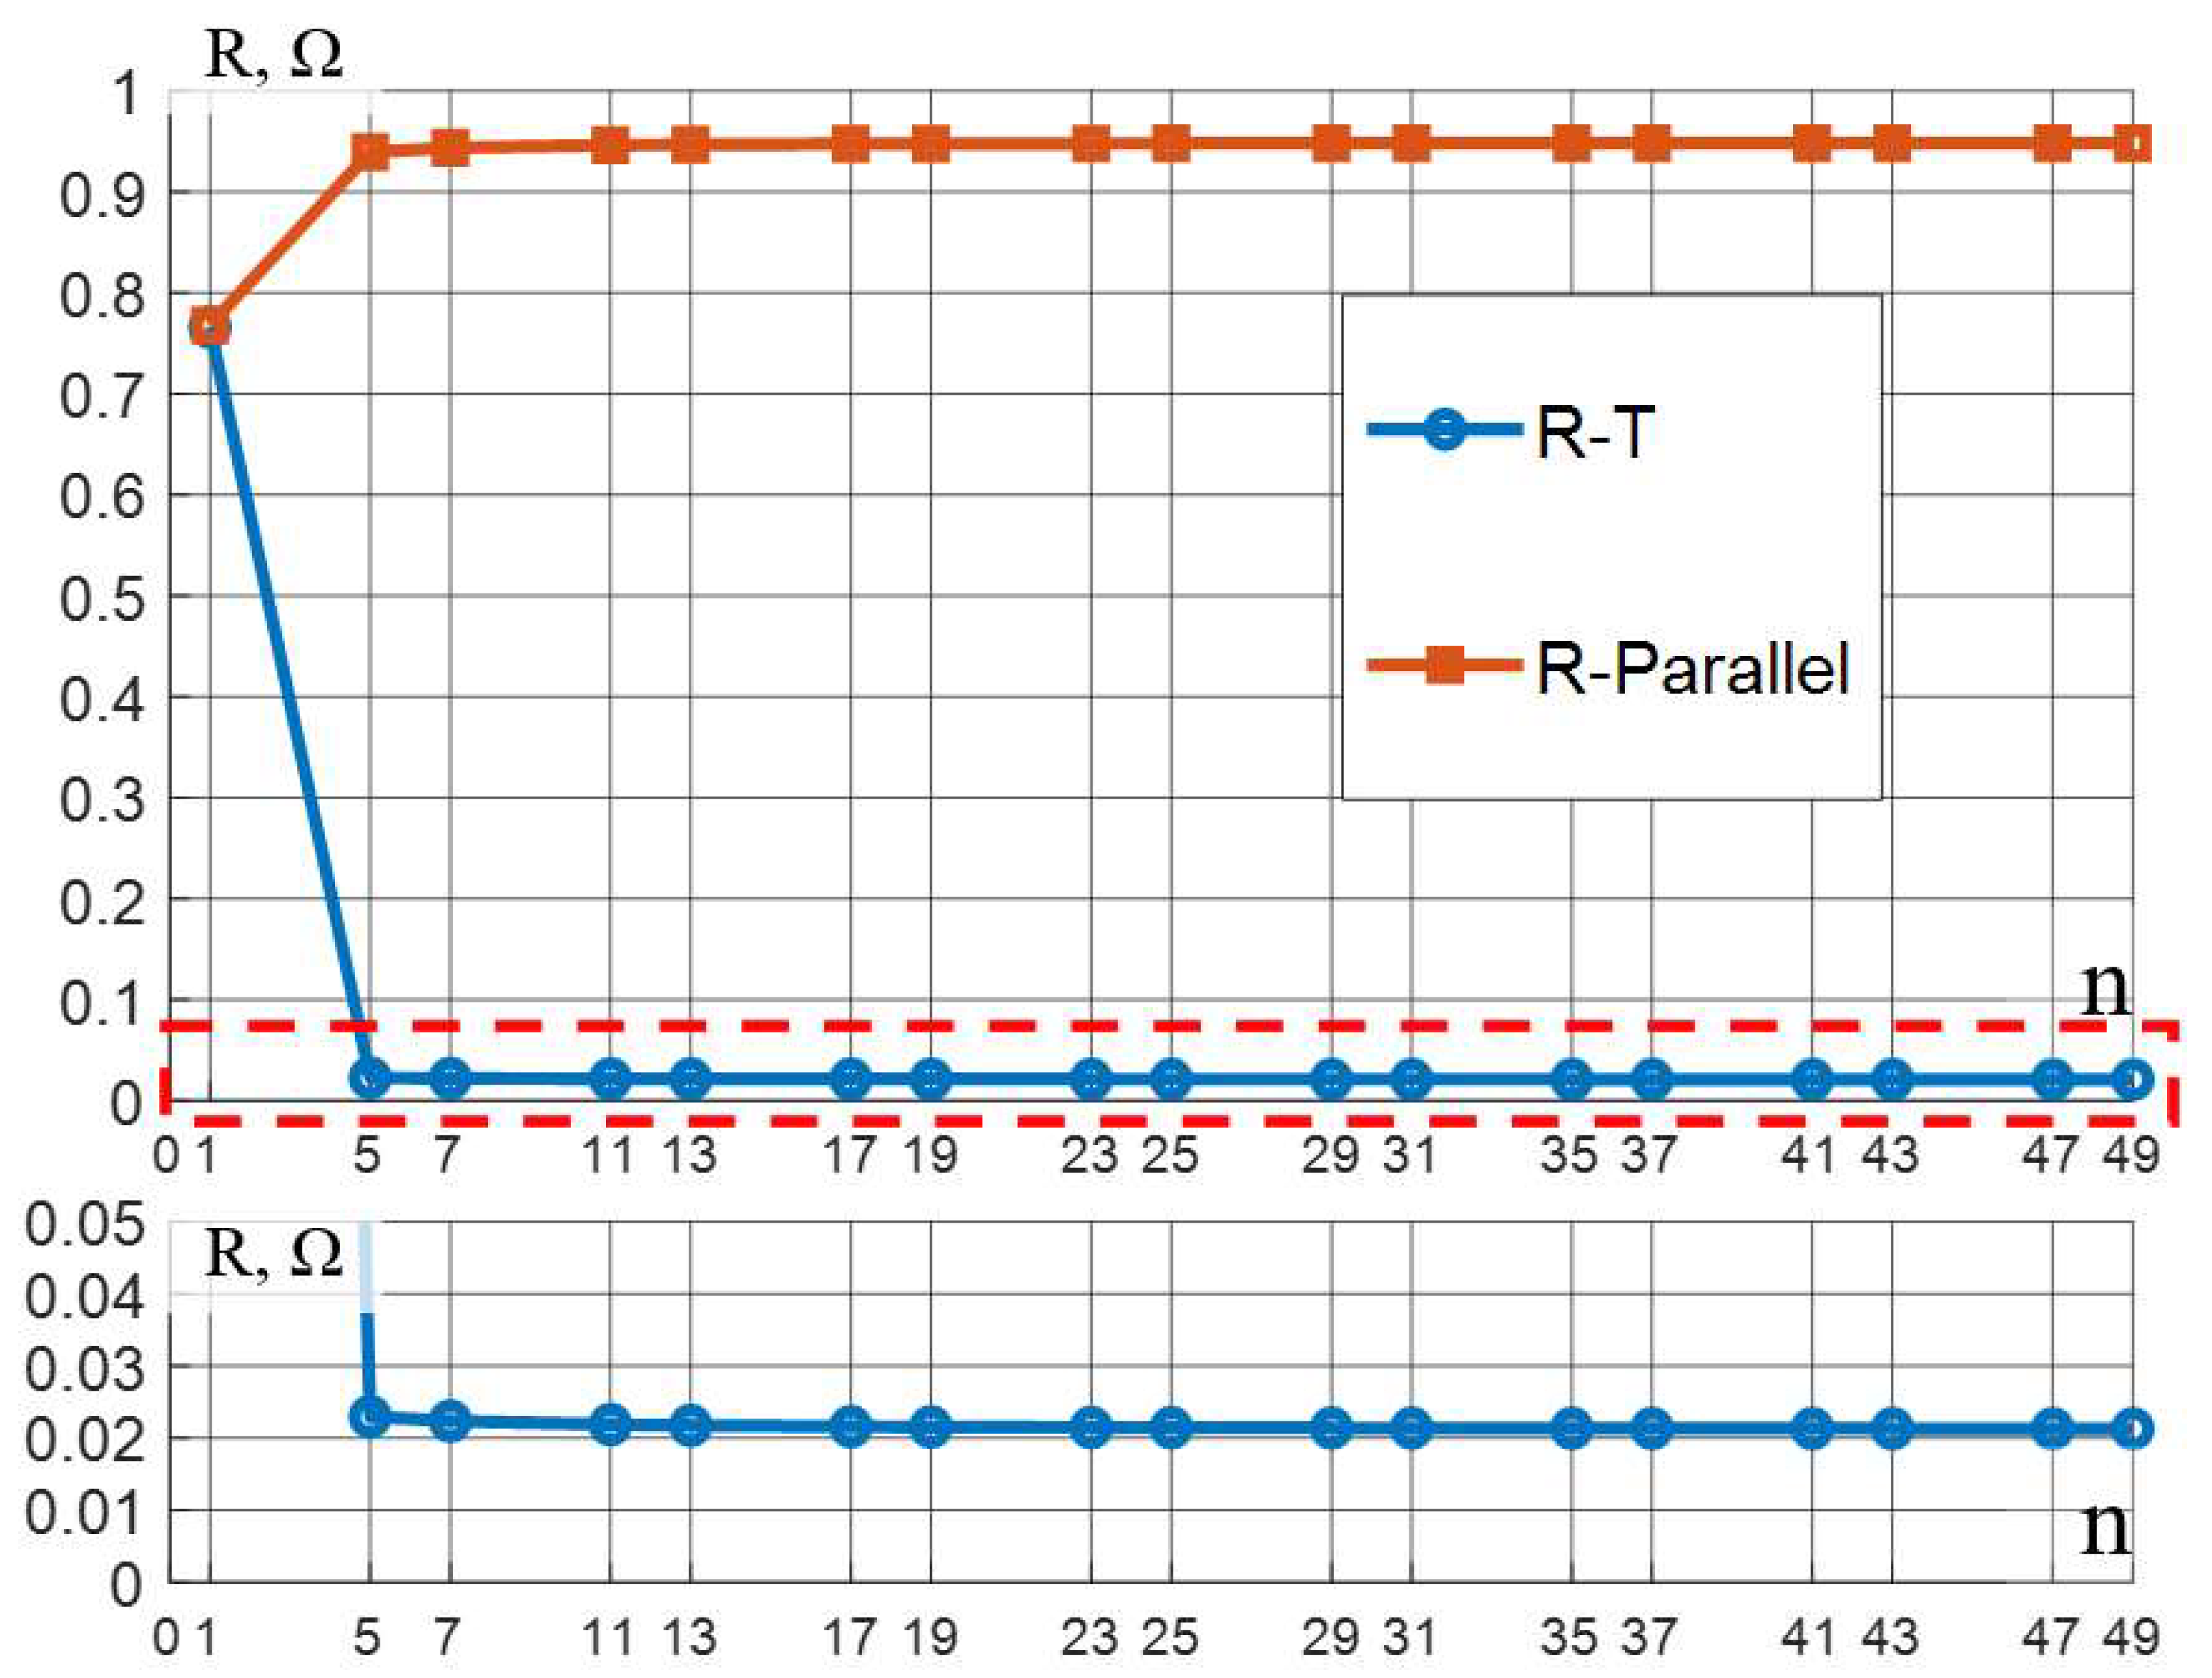
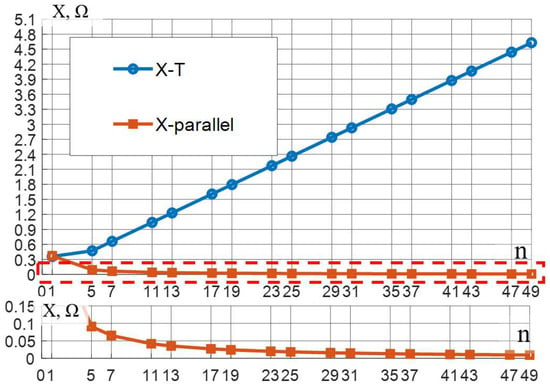
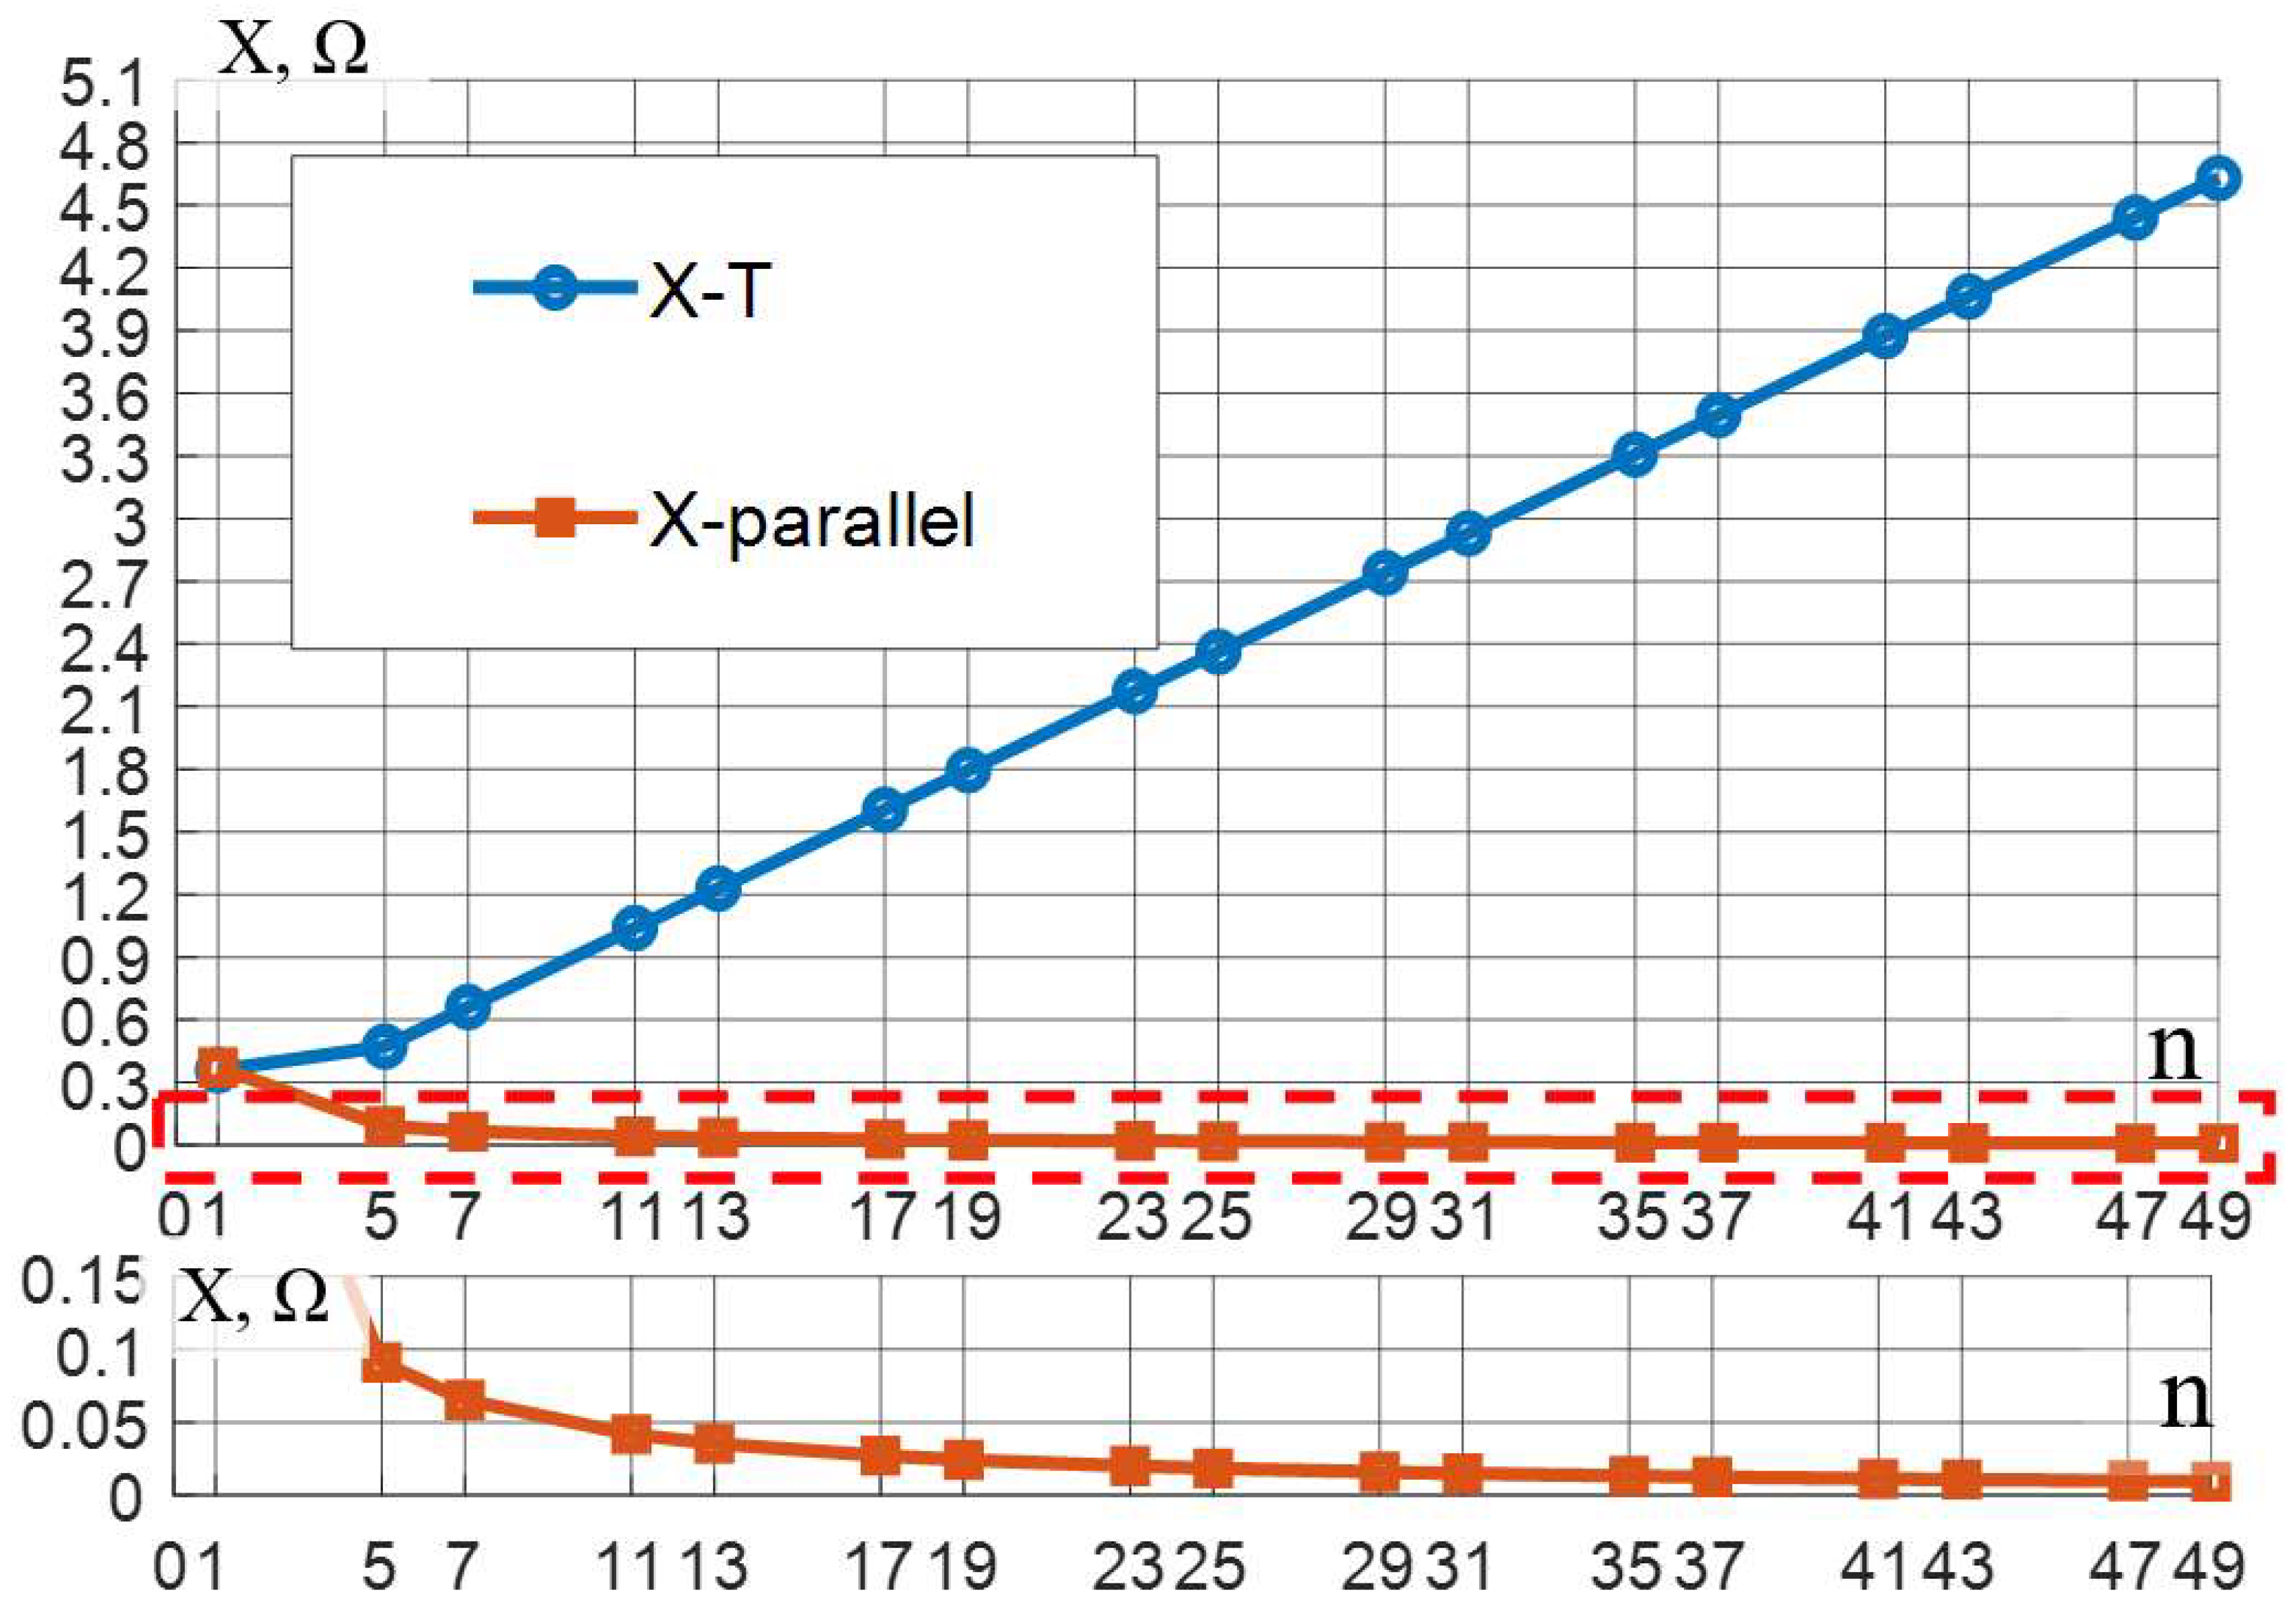
Thus, the comparative characteristics of the complex impedance of the induction motor models were obtained. The real part (R) is shown in Figure 6, and the imaginary part (X) is shown in Figure 7. In Figure 6 and Figure 7, T and Parallel denote the T-type and parallel equivalent circuits, respectively. The data used to plot the graphs are also provided in Appendix A.
Figure 6.
The dependence of the resistance R(n) on the harmonic order n for the selected induction motor-equivalent circuits. The enlarged region is indicated by the red dashed line.
Figure 7.
The dependence of the reactance X(n) on the harmonic order n for the selected induction motor-equivalent circuits. The enlarged region is indicated by the red dashed line.
A comparative analysis of the two equivalent circuits shows that their characteristics differ significantly from each other, both qualitatively and quantitatively. However, in order to accurately assess the extent to which the induction motor-equivalent circuit affects the results, simulation and calculations were carried out using the example of an industrial enterprise power supply system, in which the total motor power was varied.
2.4. Power Quality Simulation Under Different Induction Motor Representations
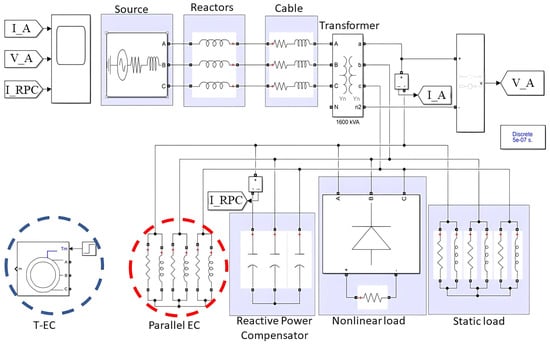
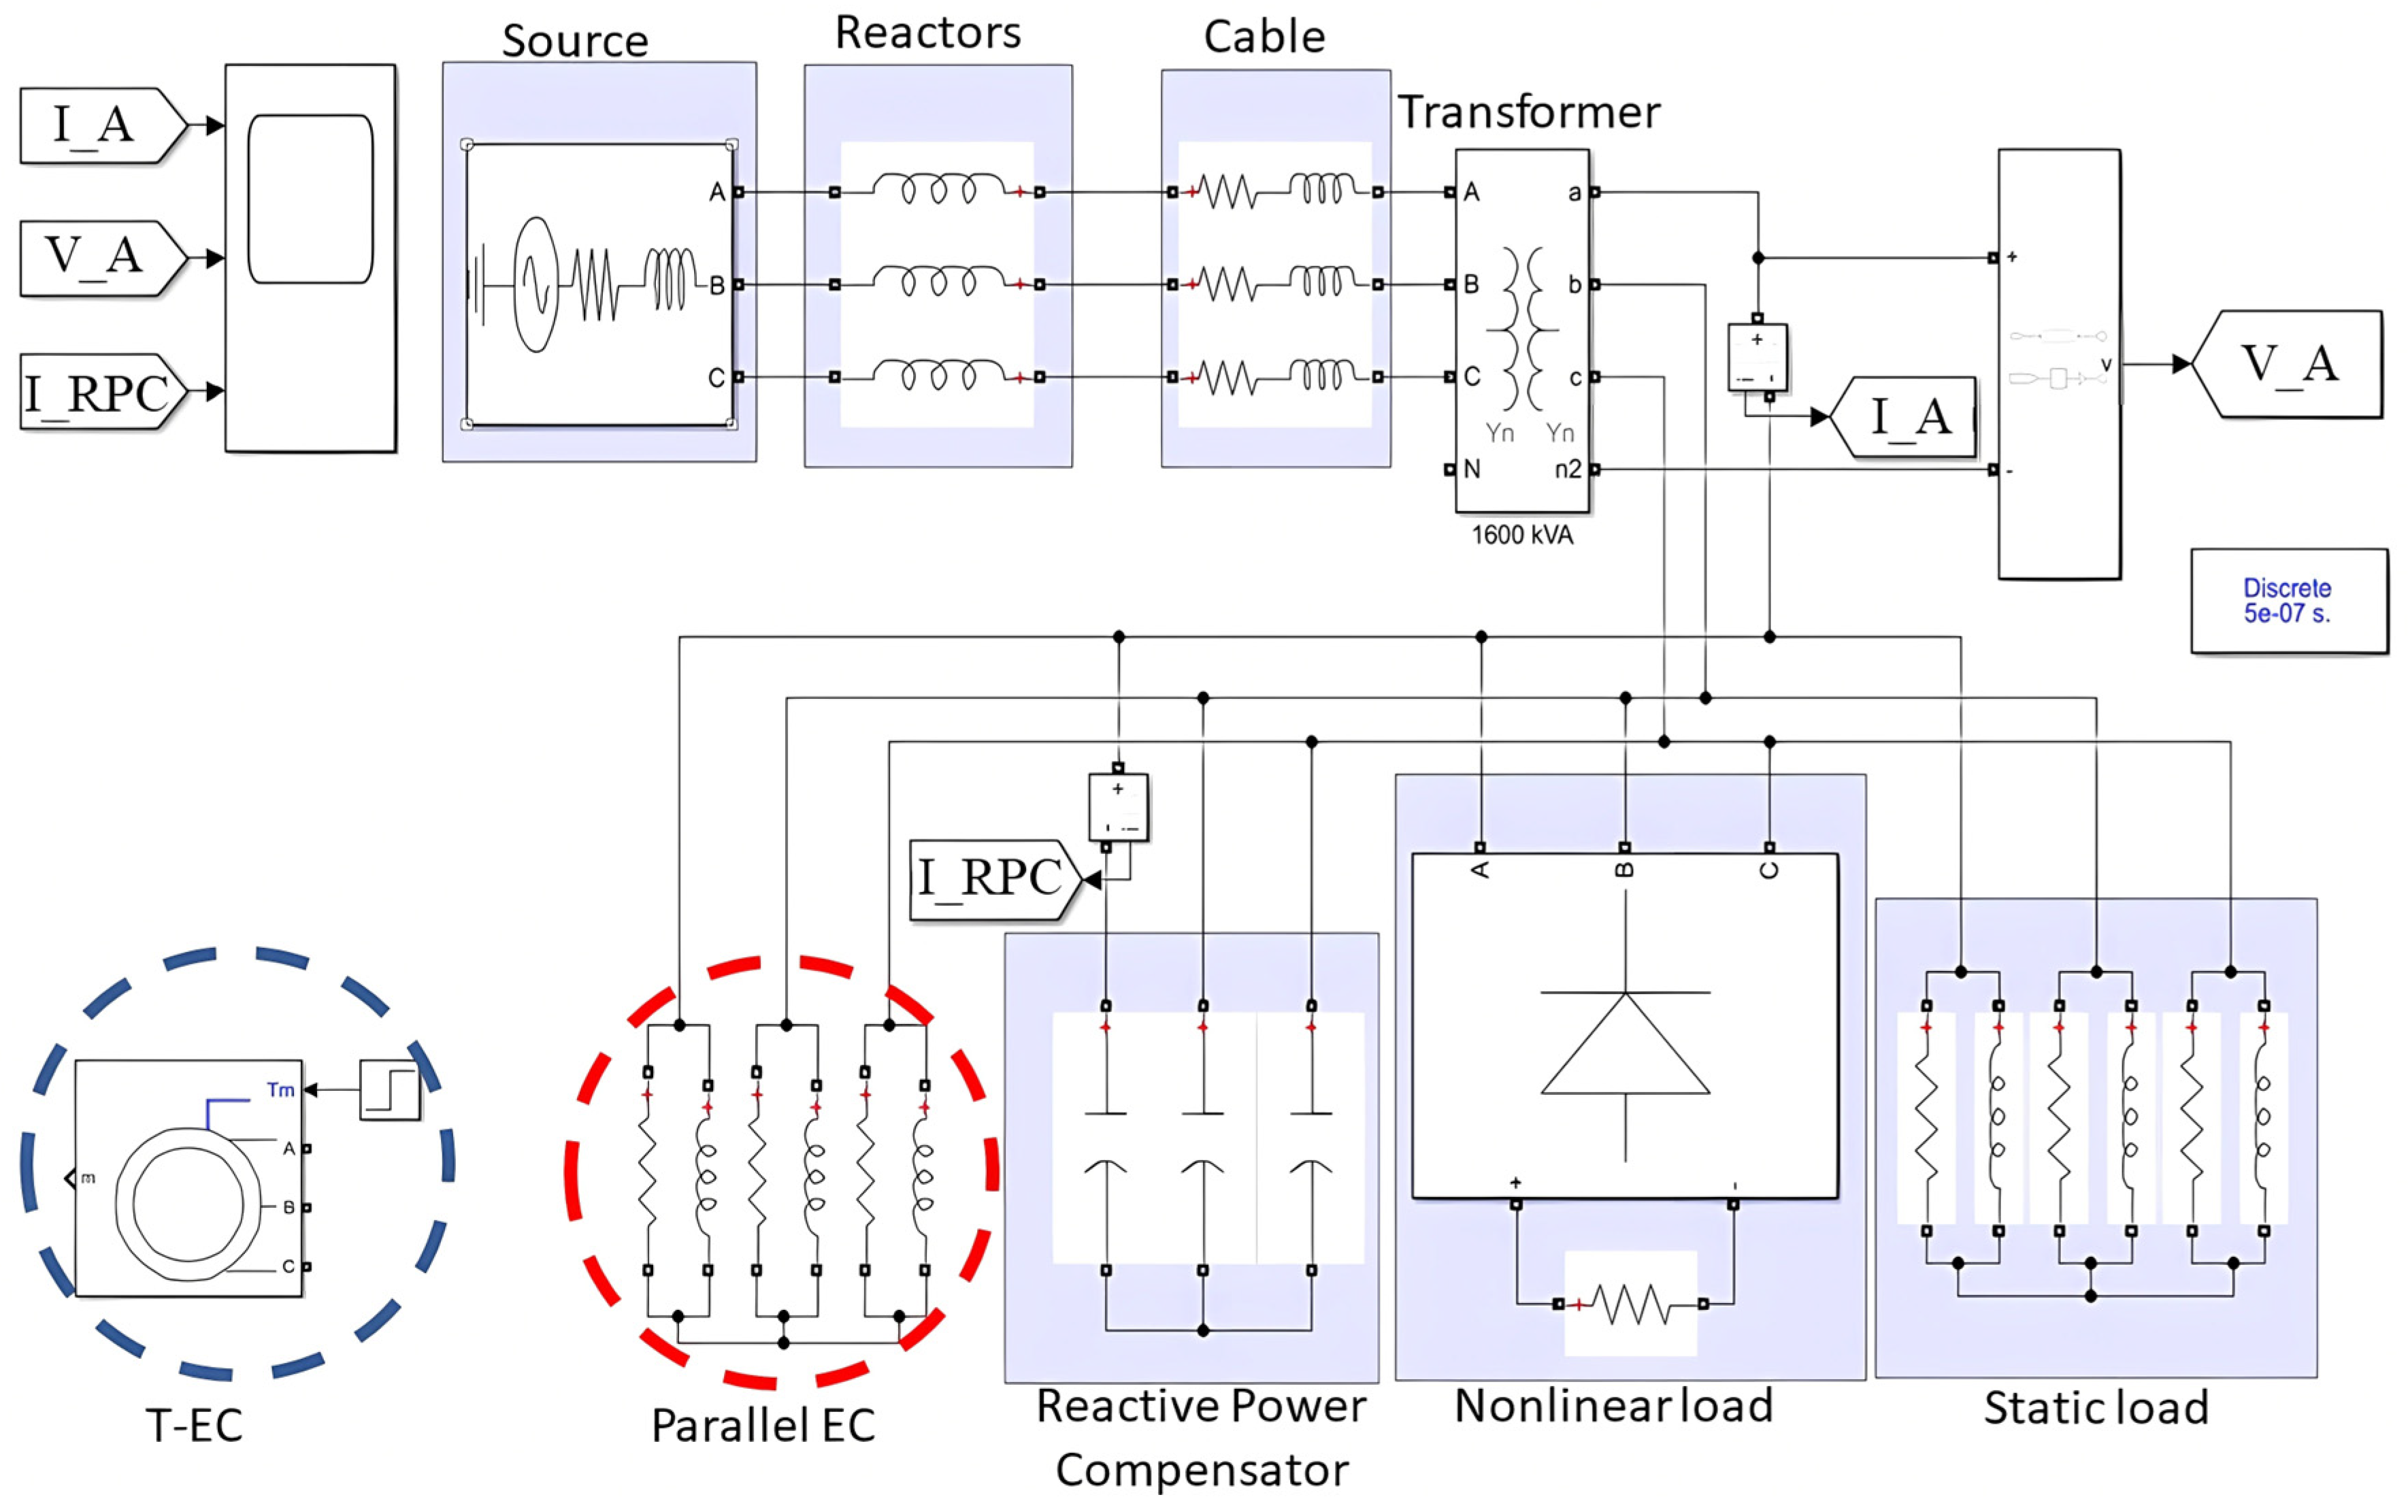
In accordance with the scheme shown in Figure 4, a simulation model of a typical industrial enterprise was developed in the MATLAB Simulink environment using standard blocks. The model is shown in Figure 8. Its parameters are given in Table 3 and Table 5.
Figure 8.
The simulation model of a typical industrial enterprise in the MATLAB Simulink environment.
In the simulation study, one to four induction motors were connected. In one series of experiments, the motor was represented by the parallel EC, while in the other series it was represented by the T-EC. The parameters of the other elements remained unchanged in all experiments; only the total power of the induction motor load was varied, from one motor (1 × 160, i.e., one 160 kW induction motor) to four motors (4 × 160). The power of the connected induction motors was limited by the network reactive power factor, with tgφ maintained below 0.4. The loading factor of all motors was equal to one, which corresponds to operation under rated conditions. Thus, a total of eight different simulation experiments of the industrial enterprise power supply system were carried out.
During the simulation, the following waveforms were recorded: the 0.4 kV network voltage, the incoming current on the 0.4 kV side, and the current of the reactive power compensator. Since the load was symmetrical, all measurements were performed for phase A. Using the built-in FFT function, the spectra of these signals were obtained up to the 49th harmonic, and the voltage and current distortion factors were calculated.
3. Results and Discussion
3.1. Experimental Results: Comparison of Equivalent-Circuit Models with Measured Harmonic Impedance Characteristics
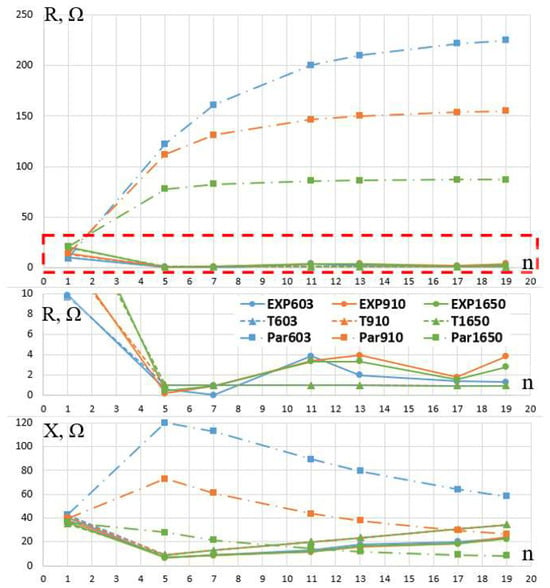
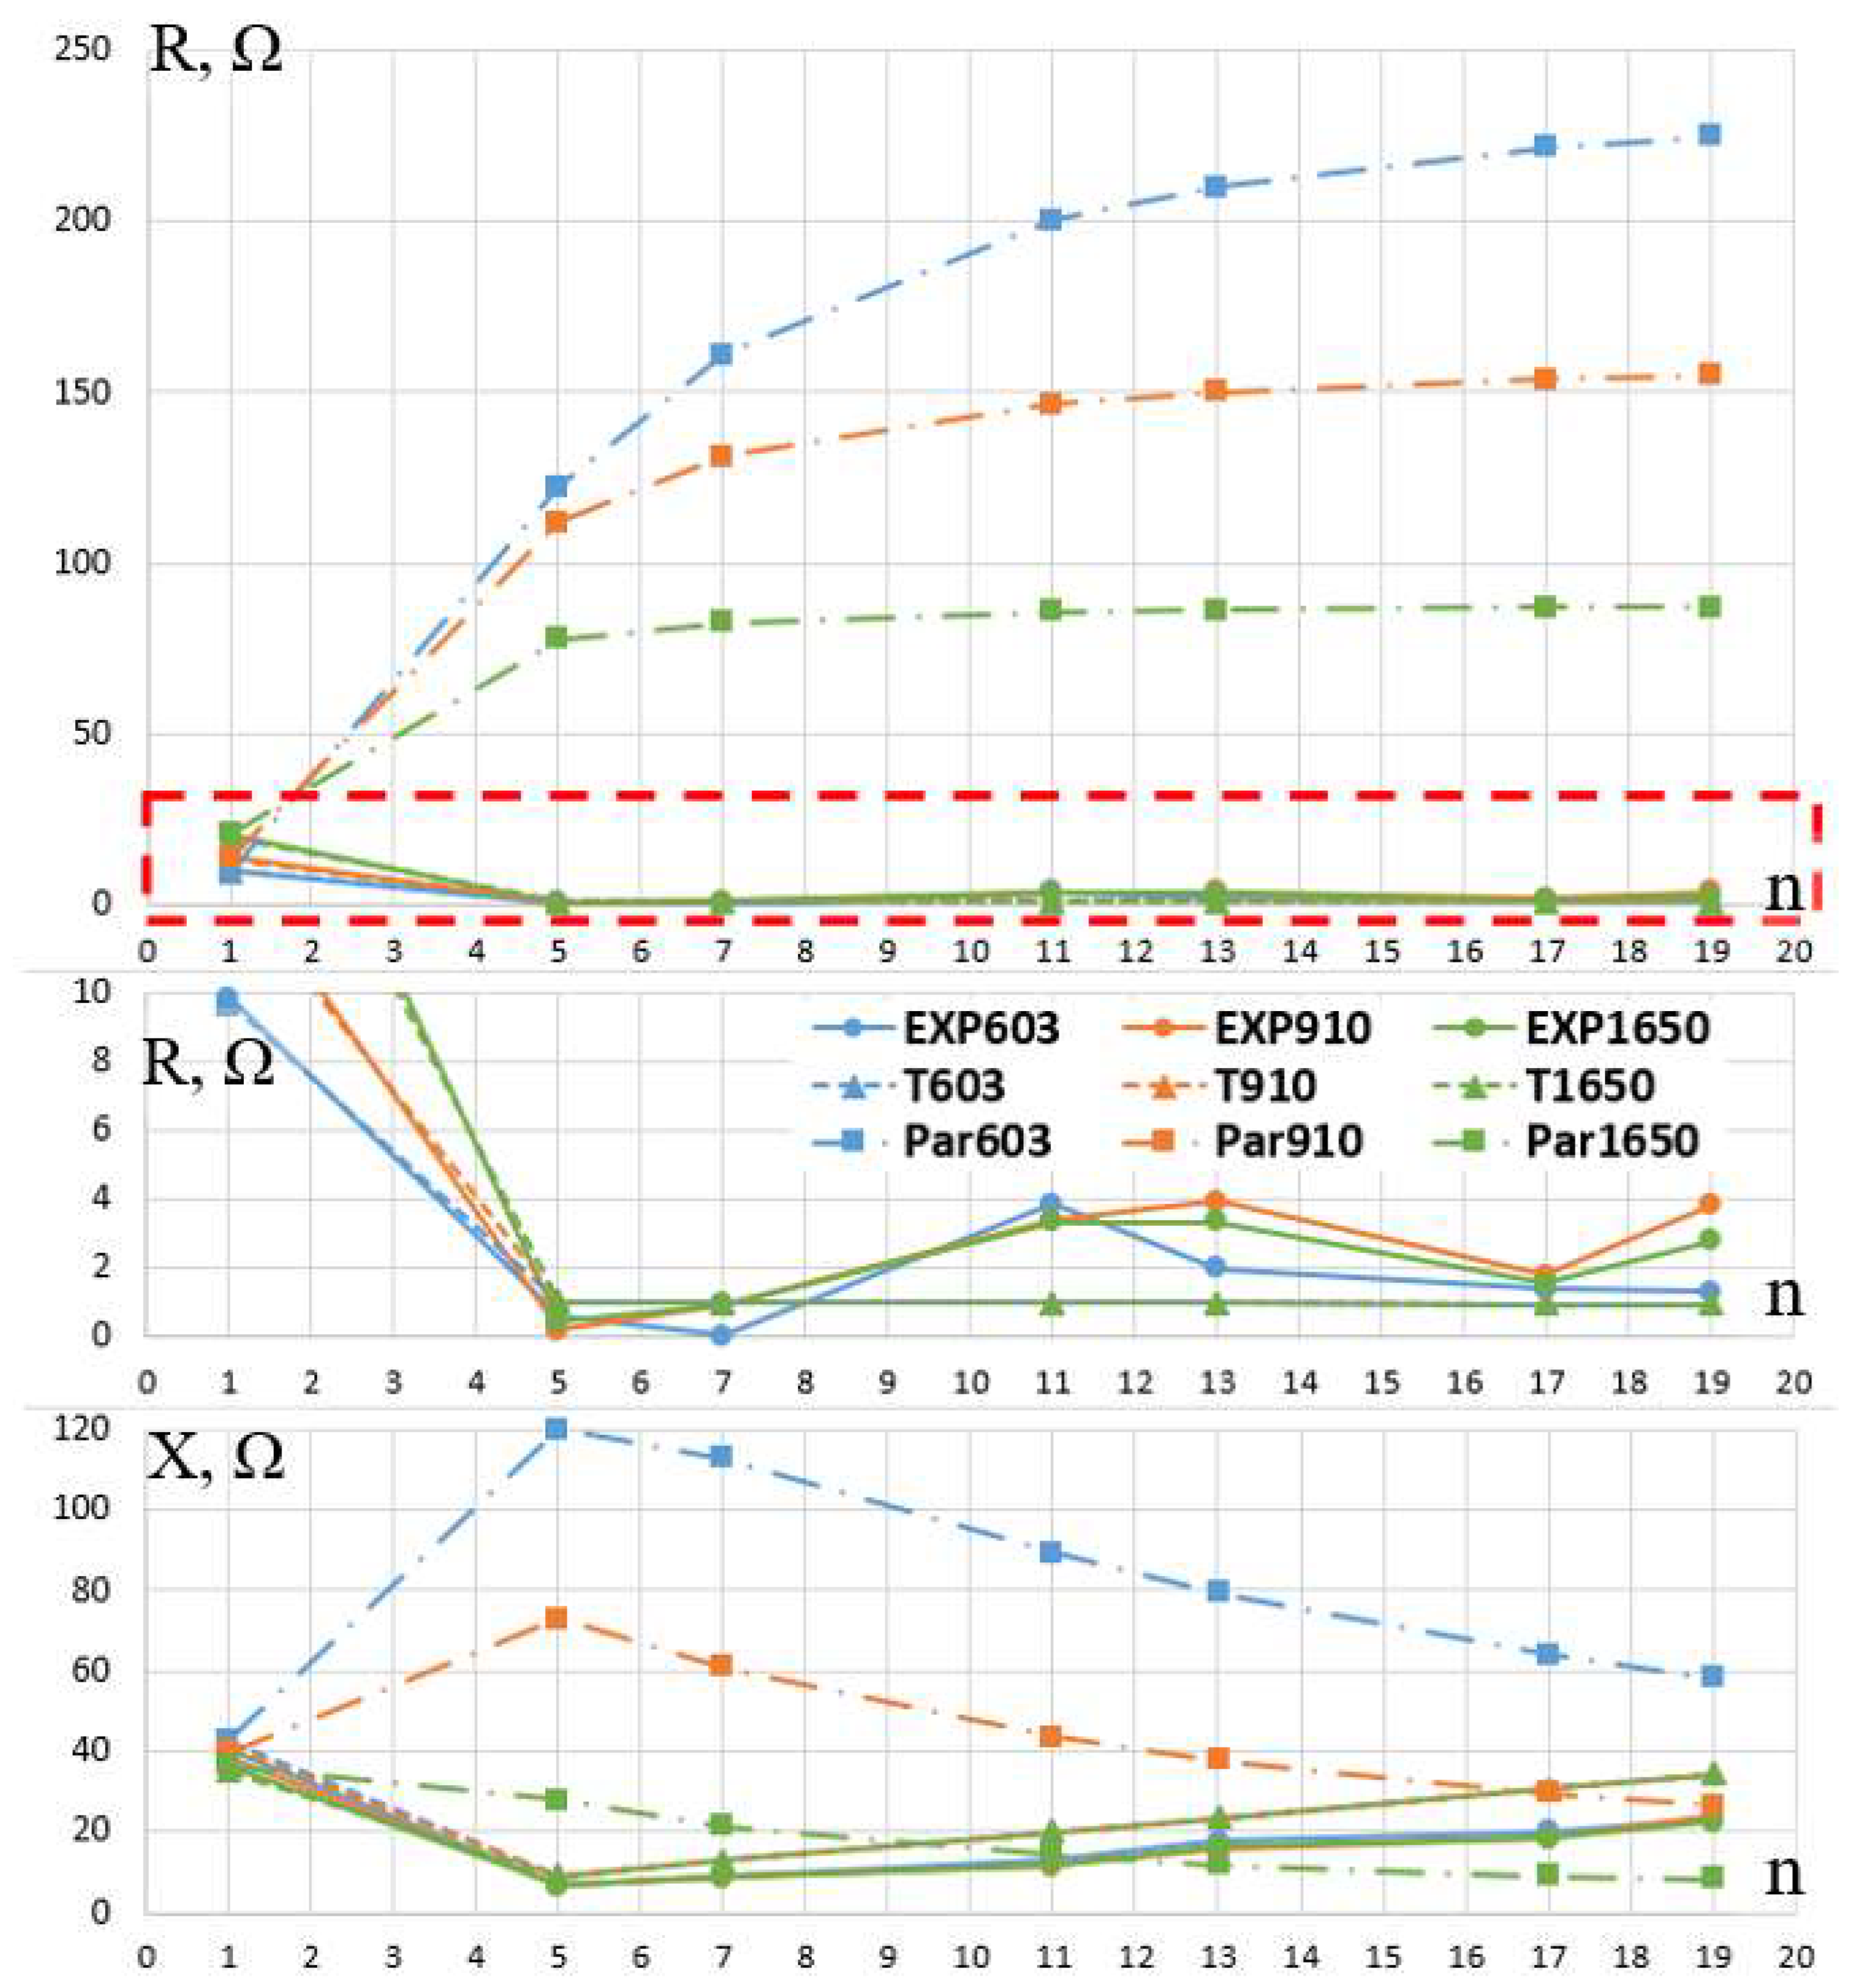
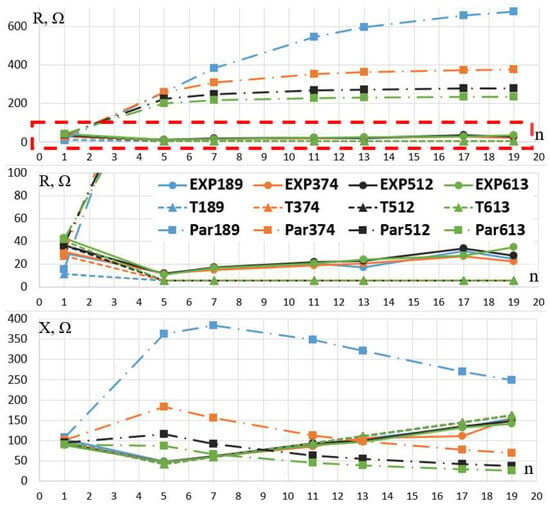
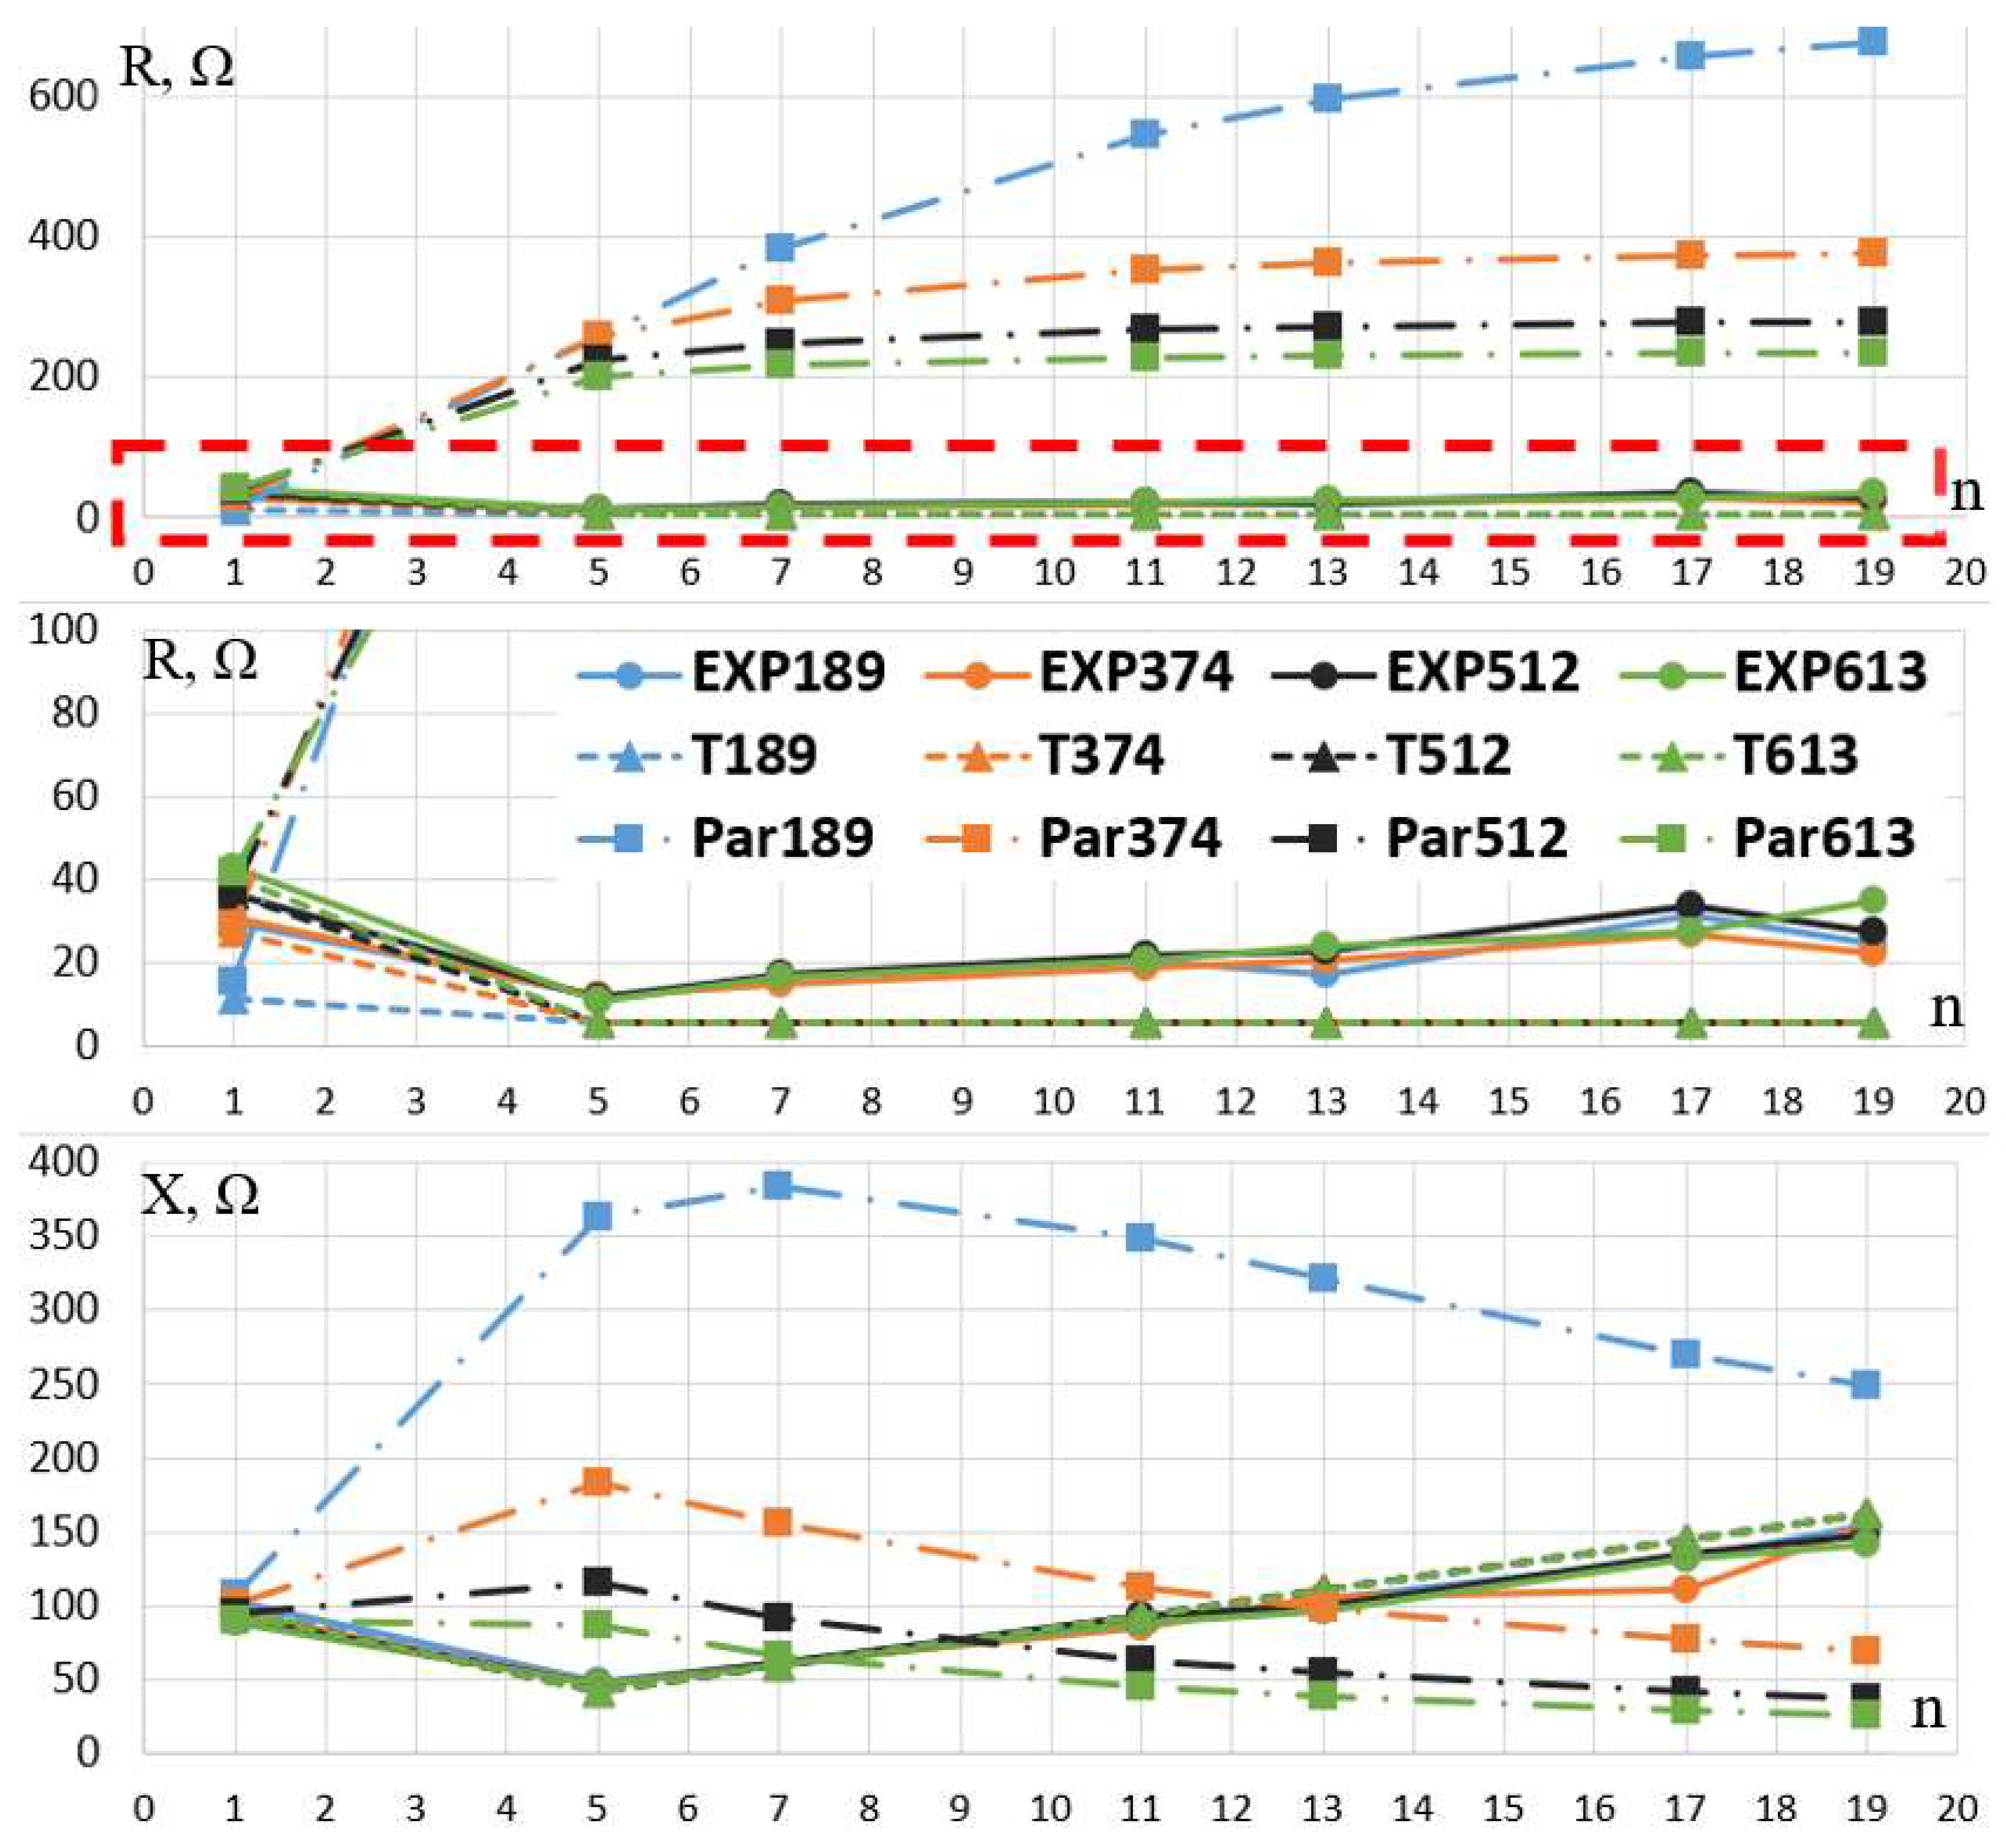
Based on the methodology described in Section 2.1 and Section 2.2, the dependences R(n) and X(n) were obtained for the 1.5 kW and 5.5 kW induction motors. The results calculated using the T-type equivalent circuit and the parallel equivalent circuit were compared with the experimental data. The corresponding characteristics are shown in Figure 9 and Figure 10. The numerical data used to plot the graphs are given in Appendix B.
Figure 9.
The dependence of the resistance R(n) and reactance X(n) on the harmonic order n for the 5.5 kW induction motor at different shaft-power levels. The enlarged region of the R(n) characteristics is indicated by the red dashed line.
Figure 10.
The dependence of the resistance R(n) and reactance X(n) on the harmonic order n for the 1.5 kW induction motor at different shaft-power levels. The enlarged region of the R(n) characteristics is indicated by the red dashed line.
In Figure 9 and Figure 10, the colors identify the corresponding shaft-power levels, whereas the marker shapes and line styles identify the method used to obtain the impedance characteristics. Circular markers connected by solid lines represent the experimental data (EXP), triangular markers connected by dashed lines represent the results calculated using the T-type equivalent circuit (T), and square markers connected by dash-dot lines represent the results calculated using the parallel equivalent circuit (Par). The numerical value following each designation indicates the corresponding shaft power in watts. For example, EXP603, T603, and Par603 denote the experimental, T-type equivalent-circuit, and parallel equivalent-circuit characteristics, respectively, for a shaft power of 603 W.
Based on the characteristics presented in Figure 9 and Figure 10, the following properties of the experimentally obtained complex impedance characteristics can be identified:
- For both investigated motors, the R(n) values obtained from the experimental data and calculated using the T-type equivalent circuit remain within the same order of magnitude. This indicates a similar qualitative behavior of these dependences. In contrast, the parallel equivalent circuit gives significantly higher R(n) values at higher harmonics and demonstrates a sharp increase in the active component of impedance, especially at low load levels.
- For both motors, the X(n) values at higher harmonics generally increase with harmonic order; however, they cannot be obtained by a simple proportional recalculation of X(1). The obtained form of this dependence is qualitatively consistent with the T-type equivalent circuit.
- The experimental complex impedance characteristics at higher harmonics have the same qualitative behavior for all considered load levels. When the mechanical load changes, the form of the R(n) and X(n) dependences does not change significantly. The same property is observed for the T-type equivalent circuit.
Based on Equations (8)–(11), the deviations between the calculated and experimental impedance characteristics were evaluated quantitatively. The MAE, RMSE, and maximum absolute deviation were calculated separately for R(n) and X(n), for each investigated shaft-power level and for both equivalent-circuit models. The results for the 1.5 kW IM are presented in Table 7 and Table 8 and for the 5.5 kW IM in Table 9 and Table 10.
Table 7.
Quantitative error indicators for the resistance R(n) of the 1.5 kW induction motor.
Table 8.
Quantitative error indicators for the reactance X(n) of the 1.5 kW induction motor.
Table 9.
Quantitative error indicators for the resistance R(n) of the 5.5 kW induction motor.
Table 10.
Quantitative error indicators for the reactance X(n) of the 5.5 kW induction motor.
The quantitative error indicators presented in Table 7, Table 8, Table 9 and Table 10 consistently demonstrate closer agreement between the T-type equivalent circuit and the experimental data. For both investigated motors, at every considered shaft-power level, the T-EC yields lower MAE, RMSE, and maximum absolute deviation values than the parallel equivalent circuit for both R(n) and X(n).
In addition to the quantitative differences, the two equivalent circuits demonstrate fundamentally different behavior at higher harmonics. In the parallel equivalent circuit, a change in shaft load leads to a significant variation in the calculated values of R(n) and X(n). The calculated R(n) values obtained using the parallel equivalent circuit substantially exceed the experimental values and demonstrate load-dependent behavior that is not observed in the experimental data. In contrast, the T-type equivalent circuit reproduces the main qualitative properties identified experimentally: the impedance characteristics at higher harmonics do not show a pronounced dependence on load, and the reactance X(n) increases with harmonic order. Although exact quantitative agreement between the experimental and calculated values was not obtained, the R(n) and X(n) values remained within the same order of magnitude, while their functional behavior was consistent with that predicted by the T-type equivalent circuit.
Thus, the laboratory tests carried out for two induction motors of different rated powers and under different shaft loads support the use of the T-type equivalent circuit as a physically justified representation of the induction motor for higher-harmonic impedance analysis. At the same time, the obtained results should be interpreted as an experimental justification of the adopted modeling approach rather than as a complete validation for all squirrel-cage induction motors. The experiments were limited to two low-power motors, since laboratory testing of motors with powers comparable to industrial drives requires a different experimental base. Work in this direction is currently being continued by the authors.
It should also be noted that the T-type equivalent circuit is widely used for the analysis of transient processes, starting modes, and mechanical characteristics of induction motors of different power ratings. This provides an additional argument for using this circuit in the analysis of higher-harmonic impedance characteristics. Therefore, in the following sections, the influence of induction motor-equivalent-circuit selection on calculated power quality indicators is analyzed using the example of a typical industrial power supply system with higher total motor power.
To highlight the practical significance of the obtained results, the qualitative properties identified from the experimental impedance characteristics were further extended to an induction motor of higher rated power. According to the harmonic modeling approach of Pedra et al. [37], motor rated power is not introduced into the harmonic impedance equations as an independent factor; differences between motors of different ratings are represented through their motor-specific equivalent-circuit parameters and harmonic slip. Since direct experimental testing of motors comparable with industrial drives requires a separate experimental base, this extension was adopted as an engineering assumption. To avoid an excessive increase in the scope of the study, only one higher-power motor rating was considered. For this motor, simulation modeling of a typical industrial power supply system was carried out using two equivalent-circuit representations: the T-type equivalent circuit and the parallel equivalent circuit. The obtained simulation results were used to determine how the choice of the induction motor-equivalent circuit affects the calculated power quality indicators.
3.2. Simulation Results: Influence of Equivalent-Circuit Selection on Power Quality Indicators
Based on the simulation results and calculations, the total harmonic distortion coefficients of the network voltage, the incoming current, and the RPC current, as well as their RMS values at the fundamental harmonic, were obtained and are presented in Table 11. In addition, the coefficients of the odd voltage harmonic components that were not multiples of three (Ku(n)) were determined and are given in Table 12. In accordance with EN 50160 [44] and GOST 32144-2013 [45], these characteristics are the main indicators used in the analysis of higher-harmonic conditions; therefore, the comparative analysis was based on them. The harmonic-voltage limits of EN 50160 and GOST 32144-2013 were adopted because the considered network has a nominal voltage of 0.4 kV and the analyzed 0.4 kV bus was treated as the common connection (supply) point of the modeled consumers. The standards specify 10 min aggregated harmonic values assessed over a one-week period; however, the present study considers steady-state operating points, so the limits were used only as reference values.
Table 11.
Total harmonic distortion coefficients and fundamental-frequency RMS values of the network voltage, incoming current, and RPC current.
Table 12.
Values of the coefficients of odd non-triplen voltage harmonic components—Ku(n).
In Table 11, the first row (1 × 160, 2 × 160, etc.) indicates the number of induction motors connected on the 0.4 kV load side. The columns “Par.” and “T-EC” denote the results obtained when the induction motor is represented by the parallel equivalent circuit and the T-type equivalent circuit, respectively. THDU and THDI denote the total harmonic distortion of voltage and current, respectively; U1RMS and I1RMS denote the RMS values of the fundamental-frequency voltage and current; and RPC denotes the reactive power compensator. An asterisk (*) indicates that the applicable power quality limit is exceeded.
The analysis of the obtained results with variation in each of the six variables showed the following: when determining the network voltage distortion coefficient, the difference between the values obtained using different equivalent circuits increases as the total power of the induction motors grows. It was also found that the simulation results obtained with the parallel EC remain within the limit specified by EN 50160, namely up to 8% for the 400 V voltage level. When the T-EC is used, the standard limit is exceeded by up to 2.27 percentage points.
The values of the network current distortion coefficient differed by 4.36 to 5.37 percentage points, with the difference increasing as the total power of the IMs increased. The difference in the current distortion coefficient of the reactive power compensator also increased with the total IM power, ranging from 22.10 to 71.42 percentage points. Such a quantitative difference may be critically important when assessing RPC overloading by higher-harmonic currents, which directly affects the reliability of its operation.
The difference in the fundamental-frequency RMS network voltage for all simulation cases is less than 0.2%, which confirms the equivalence of the models at the fundamental frequency. The fundamental-frequency RMS network current, however, shows a larger difference of up to 4%, which may affect the calculation of apparent power and the selection of incoming electrical equipment. The difference in the fundamental-frequency RMS current of the RPC, I1RMSRPC, obtained using the two IM equivalent circuits is less than 0.2%. This value remains almost unchanged because the same RPC capacitance was used in all simulations and the fundamental-frequency network voltage differed by less than 0.2%. In contrast, the different higher-harmonic impedances of the IM models result in different harmonic voltages at the 0.4 kV bus and, consequently, different harmonic currents through the RPC. Since the capacitive reactance decreases with harmonic order, these differences lead to a substantial variation in the RPC current THD despite the nearly identical fundamental-frequency current.
In Table 12, the first row indicates the IM model used, while the second row indicates the total installed motor power corresponding to the calculated voltage harmonic coefficients. The first column lists the harmonic order n up to the 49th harmonic. Ku(n) denotes the coefficient of the n-th voltage harmonic component, expressed as a percentage; IM denotes the induction motor; Par. denotes the parallel equivalent circuit; and T-EC denotes the T-type equivalent circuit. The notation 1 × 160, 2 × 160, 3 × 160, and 4 × 160 corresponds to total installed IM powers of 160, 320, 480, and 640 kW, respectively. An asterisk (*) indicates that the applicable limit specified by EN 50160 and GOST 32144-2013 is exceeded, whereas unmarked values comply with the corresponding limit. For the considered 0.4 kV network, the adopted limits were 6.0%, 5.0%, 3.5%, 3.0%, 2.0%, and 1.5% for the 5th, 7th, 11th, 13th, 17th, and 19th–25th harmonic orders, respectively. For odd non-triplen harmonics above the 25th order, the adopted limit was 1.5%.
According to the obtained data, when the total IM power is up to 320 kW, both models give qualitatively consistent results: the 11th- and 13th-harmonic voltage coefficients exceed the adopted limits. At 480 kW, the results begin to differ: with the T-EC, both the 11th and 13th harmonics exceed the limits, whereas with the parallel EC only the 11th harmonic remains above the limit. At 640 kW, both the 11th and 13th harmonics exceed the limits for the T-EC, while both remain within the adopted limits for the parallel EC. The observed differences are caused by the different frequency dependence of the motor impedance in the two models. At the 11th and 13th harmonics, the T-EC has a higher predominantly inductive impedance than the parallel EC. Consequently, the motor provides less shunting of these harmonic components, resulting in higher harmonic voltages at the 0.4 kV bus. Since the capacitive reactance of the RPC decreases with harmonic order, the increased 11th- and 13th-harmonic voltages produce substantially higher RPC harmonic currents and, therefore, higher current THD.
As described in Section 2.4, the transformer rating, cable impedance, nonlinear load level, reactive power compensator size, motor loading conditions, and network short-circuit capacity were kept unchanged in the present study in order to isolate the influence of induction motor-equivalent-circuit selection. Variation in these parameters would change the absolute values of the calculated harmonic indices and the magnitude of the differences between the two motor representations. However, it is expected that the main qualitative conclusion would remain unchanged: owing to the fundamentally different frequency-dependent impedance characteristics of the two equivalent circuits, the discrepancies between the calculated power quality indices would remain significant and would generally become more pronounced as the total installed induction motor power increases. Variation in the capacitor-bank size may produce even larger differences, since it changes the parallel-resonance frequency of the network. A detailed parametric analysis of these effects requires a separate study.
Although harmonic characterization based on FFT-derived indices is essential for steady-state power quality assessment, it may not capture all informative features of distorted waveforms, particularly under nonlinear or fault-related conditions. Recent studies of distribution-system fault assessment have shown that statistical waveform characteristics, such as kurtosis and skewness, can provide additional information beyond individual harmonic components [46]. In the present study, the analysis is intentionally limited to harmonic spectra, THD, and individual harmonic coefficients because the objective is to evaluate the influence of induction motor-equivalent-circuit selection on harmonic power quality indices. Statistical waveform characterization may be considered as a possible extension of the proposed assessment framework in future studies.
Thus, the considered IM models demonstrate significant quantitative and qualitative differences, which increase with the total IM power. In the study and simulation of industrial enterprise networks under higher harmonic conditions, especially when power quality improvement measures are being developed, such differences in the obtained estimates may have a decisive influence on the adopted technical solutions. As a consequence, incorrect technical decisions may lead to economic losses and premature equipment failure. The experimental results obtained for the 1.5 and 5.5 kW motors show that the T-type equivalent circuit provides closer agreement with the measured harmonic impedance characteristics than the parallel resistive-inductive equivalent circuit, both in terms of qualitative behavior and the calculated MAE, RMSE, and maximum absolute deviation. At the same time, the present simulation results show that equivalent-circuit selection can materially change the calculated PQ indicators. However, the experimental study was limited to two low-power motors and does not provide complete validation of the T-type equivalent circuit for motors of industrial power ratings. Therefore, the application of the obtained conclusions to a 160 kW motor in the simulation of an industrial power supply system should be regarded as an engineering assumption. For this reason, the selection of an induction motor-equivalent circuit for harmonic analysis should ultimately be supported by comparison with experimentally obtained impedance characteristics of real motors. A comprehensive assessment of this correspondence, including different motor ratings, designs, and operating conditions, goes beyond the scope of the present paper and requires a separate extended study.
4. Conclusions
In this study, a comparative analysis of induction motor-equivalent circuits used in the assessment of power quality indicators in industrial enterprise networks under higher-harmonic conditions was carried out. The T-type equivalent circuit and the parallel resistive-inductive equivalent circuit were compared analytically, experimentally, and using simulation modeling.
Laboratory tests on 1.5 and 5.5 kW motors showed that the T-type equivalent circuit provides closer agreement with the experimentally obtained harmonic impedance characteristics than the parallel equivalent circuit. For every investigated shaft-power level, the T-EC yielded lower MAE, RMSE, and maximum absolute deviation for both R(n) and X(n). The experimental results showed no pronounced dependence of the higher-harmonic R(n) and X(n) characteristics on shaft load. The same behavior was reproduced by the T-type equivalent circuit, whereas the parallel equivalent circuit demonstrated a pronounced load dependence that was not observed experimentally.
At the next stage, the same two equivalent-circuit models were applied to a 160 kW motor representative of industrial enterprise loads. Direct experimental verification for a motor of this power was not possible within the available laboratory facilities; therefore, the experimental results obtained for the 1.5 and 5.5 kW motors were extrapolated to the higher-power motor as an engineering assumption. In addition, the experimental harmonic analysis was limited to the 19th harmonic, whereas the simulation study was extended to the 49th harmonic; therefore, the results above the experimentally verified harmonic range should also be considered as an extrapolation. Experimental verification for higher-power motors and an extended harmonic range is considered a direction for future work.
The total motor power was then varied from 160 to 640 kW, and a typical industrial enterprise power supply scheme was simulated in MATLAB Simulink. Based on the obtained data, significant quantitative and qualitative differences in the power quality indicators were identified:
- When the parallel EC was used, the network voltage distortion coefficient did not exceed the standard limit of 8% and decreased as the total IM power increased. In contrast, when the T-EC of the IM was used, the network THDU exceeded the standard limit and increased with increasing total IM power. The maximum difference in THDU obtained using the different equivalent circuits reached 5.10 percentage points.
- The difference in the network current THDI obtained using different IM models reached 5.37 percentage points.
- The difference in the THDI of the RPC current obtained using different IM models reached 71.42 percentage points.
The obtained results demonstrate that the choice of the induction motor-equivalent circuit has a noticeable effect on harmonic power quality assessment. This confirms the need for additional measured data before reliable recommendations on model selection can be developed. The proposed analysis can be used to improve the accuracy of harmonic component assessment in industrial power supply networks, both at the design stage and during operation.
Author Contributions
Conceptualization and supervision, Y.S.; methodology, investigation, modeling, and writing—original draft, K.L.; editing and funding acquisition, S.S. All authors have read and agreed to the published version of the manuscript.
Funding
This research received no external funding.
Institutional Review Board Statement
Not applicable.
Informed Consent Statement
Not applicable.
Data Availability Statement
The original contributions presented in this study are included in the article. Further inquiries can be directed to the corresponding author.
Conflicts of Interest
The authors declare no conflicts of interest.
Abbreviations
The following abbreviations are used in this manuscript:
| IM | Induction motor |
| EC | Equivalent circuit |
| PQ | Power quality |
| PSS | Power supply system |
| RPC | Reactive power compensator |
Appendix A
Table A1 presents the data used to plot the graphs shown in Figure 6 and Figure 7. R and X denote the resistance and reactance of the induction motor-equivalent circuit, respectively; Parallel denotes the parallel equivalent circuit; T denotes the T-type equivalent circuit; and n is the harmonic order.
Appendix B
Table A2 presents the data used to plot Figure 9: the resistance R(n) and reactance X(n) of the 5.5 kW induction motor at shaft-power levels of 603, 910, and 1650 W, obtained experimentally and calculated using the T-type and parallel equivalent circuits. The designations EXP, T and Par correspond to the experimental data, the T-type equivalent circuit and the parallel equivalent circuit, respectively.
Table A3 presents the data used to plot Figure 10: the resistance R(n) and reactance X(n) of the 1.5 kW induction motor at shaft-power levels of 189, 374, 512, and 613 W, obtained experimentally and calculated using the T-type and parallel equivalent circuits. The designations EXP, T and Par correspond to the experimental data, the T-type equivalent circuit and the parallel equivalent circuit, respectively.
References
- Zhukovskiy, Y.; Suslikov, P. Identification and Classification of Electrical Loads in Mining Enterprises Based on Signal Decomposition Methods. J. Min. Inst. 2025, 275, 5–17. [Google Scholar]
- Nazarychev, A.; Tereshchenko, I. Power Quality Disturbances and Operating Regimes as Determinants of Reliability and Technical Condition of Industrial Electrical Equipment: A Comprehensive Review. Energies 2026, 19, 2685. [Google Scholar] [CrossRef] [Scilit]
- Zhukovskiy, Y.; Suslikov, P.; Rasputin, D. NILM-Based Feedback for Demand Response: A Reproducible Binary State-Detection Algorithm Using Active Power. Electricity 2026, 7, 23. [Google Scholar] [CrossRef] [Scilit]
- Shah, Z.; Klugman, N.; Cadamuro, G.; Hsu, F.-C.; Elvidge, C.D.; Taneja, J. The Electricity Scene from above: Exploring Power Grid Inconsistencies Using Satellite Data in Accra, Ghana. Appl. Energy 2022, 319, 119237. [Google Scholar] [CrossRef] [Scilit]
- Lunardi, A.S.; Sguarezi Filho, A.J.; Capovilla, C.E.; Casella, I.R.S.; de Medeiros, A.A.M. A Wireless Coded Predictive Direct Power Control for Renewable Energy Sources in Smart Grid Environment. Int. J. Electr. Power Energy Syst. 2019, 112, 319–325. [Google Scholar] [CrossRef] [Scilit]
- Torabi Jafrodi, S.; Ghanbari, M.; Mahmoudian, M.; Najafi, A.; Rodrigues, M.G.; Pouresmaeil, E. A Novel Control Strategy to Active Power Filter with Load Voltage Support Considering Current Harmonic Compensation. Appl. Sci. 2020, 10, 1664. [Google Scholar] [CrossRef] [Scilit]
- Nos, O.V.; Pudkova, T.V.; Nos, N.I. The Sliding-Mode Observer for {PMSM} Field-Oriented Sensorless Control with Adaptive Filter and {PLL}. Sci. Tech. J. Inf. Technol. Mech. Opt. 2024, 24, 415–423. [Google Scholar] [CrossRef] [Scilit]
- Siostrzonek, T.; Wójcik, J.; Dutka, M.; Siostrzonek, W. Impact of Power Quality on the Efficiency of the Mining Process. Energies 2024, 17, 5675. [Google Scholar] [CrossRef] [Scilit]
- Popa, G.N. Electric Power Quality through Analysis and Experiment. Energies 2022, 15, 7947. [Google Scholar] [CrossRef] [Scilit]
- Michalec, Ł.; Jasiński, M.; Sikorski, T.; Leonowicz, Z.; Jasiński, Ł.; Suresh, V. Impact of Harmonic Currents of Nonlinear Loads on Power Quality of a Low Voltage Network–Review and Case Study. Energies 2021, 14, 3665. [Google Scholar] [CrossRef] [Scilit]
- Buchner, M.; Rudion, K. Identification of Grid Impedance by Broadband Signals in Power Systems with High Harmonics. Energies 2021, 14, 7398. [Google Scholar] [CrossRef] [Scilit]
- Ullah, Q.; Costa Resende, E.; Carlos Gomes Freitas, L.; Laaksonen, H.; Godoy Simões, M. Enhancing Voltage Stability of Grid Forming Power Converters Based on Model Predictive Controller. Int. J. Electr. Power Energy Syst. 2024, 163, 110317. [Google Scholar] [CrossRef] [Scilit]
- Salles, R.S.; Rönnberg, S.K. Modeling and Assessment of Waveform Distortion Interaction at the Railway Grid Side in Low-Frequency Electrification Systems. Int. J. Electr. Power Energy Syst. 2025, 171, 111039. [Google Scholar] [CrossRef] [Scilit]
- Schirmer, P.A.; Glose, D. PyPowerSim: A Python Toolkit for Analysis of Waveform Distortions, Power Losses, and Self-Heating of Standard Converter Topologies. Comput. Electr. Eng. 2026, 132, 110934. [Google Scholar] [CrossRef] [Scilit]
- IEEE Std 399-1997; IEEE Recommended Practice for Industrial and Commercial Power Systems Analysis (Brown Book) (Color Book® Series). IEEE: New York, NY, USA, 1998. [CrossRef] [Scilit]
- Simakov, A.S.; Masko, O.N.; Nikolaev, M.Y. Technical Vision System for Quartz Raw Material Quality Assessment. Цветные Металлы 2025, 3, 81–88. [Google Scholar] [CrossRef] [Scilit]
- Bazhin, Y.V.; Tran, H.D. A Comprehensive Approach to Design of a Temperature Control System in Production Process of Aluminum Alloy Rolled Billets. Int. J. Eng. 2026, 39, 2371–2382. [Google Scholar] [CrossRef] [Scilit]
- Muratbakeev, E.; Novak, D.; Kozhubaev, Y. Investigation of Industrial Bearing Fault Diagnosis Based on {1D-CNN-Lstm}. In Proceedings of the 2025 International Conference on Industrial Engineering, Applications and Manufacturing ({ICIEAM}); IEEE: New York, NY, USA, 2025; pp. 1059–1067. [Google Scholar]
- Fedorova, E.R.; Morgunov, V.V.; Pupysheva, E.A. Effect of Variation of Internal Diameter along the Length of a Rotary Kiln on Material Movement. Non-Ferr. Met. 2024, 56, 28–34. [Google Scholar] [CrossRef] [Scilit]
- Fedorova, E.; Pupysheva, E.; Morgunov, V. Modeling of Particle Size Distribution in the Presence of Flocculant. Symmetry 2024, 16, 114. [Google Scholar] [CrossRef] [Scilit]
- Bazhin, V.Y.; Masko, O.N.; Anufriev, A.S. Substantiation of Choice of a Platform for Material Flow Control in Metallurgical Silicon Production. Min. Informational Anal. Bull. 2024, 2, 206. [Google Scholar] [CrossRef] [Scilit]
- Bondarenko, A.A.; Rogachev, M.K.; Skvortsov, A.S.; Dmitriev, K. V Catalytic Conversion of Heavy Oil Using Molybdenum Based Water-Soluble Catalyst. Int. J. Eng. 2026, 39, 1821–1828. [Google Scholar] [CrossRef] [Scilit]
- Mansurova, O.K.; Nguen, H.H. Parametric Analysis for Supervisory Control of Cathode Copper Production. Metallurgist 2025, 69, 599–606. [Google Scholar] [CrossRef] [Scilit]
- Safiullin, R.N.; Katsuba, Y.N.; Ungefuk, A.A.; Khisamutdinova, E.L.; Khokhlov, A.V. Bootstrap Method for Monitoring the Safety of Traffic Control Systems of Highly Automated Mining Machines. Гoрная Прoмышленнoсть 2025, 1, 73–80. [Google Scholar]
- Tariq, H.; Czapp, S.; Tariq, S.; Cheema, K.M.; Hussain, A.; Milyani, A.H.; Alghamdi, S.; Elbarbary, Z.M.S. Comparative Analysis of Reactive Power Compensation Devices in a Real Electric Substation. Energies 2022, 15, 4453. [Google Scholar] [CrossRef] [Scilit]
- Park, B.; Lee, J.; Yoo, H.; Jang, G. Harmonic Mitigation Using Passive Harmonic Filters: Case Study in a Steel Mill Power System. Energies 2021, 14, 2278. [Google Scholar] [CrossRef] [Scilit]
- Scicluna, K.; Azzopardi, B.; Spiteri, K. Power Quality Analysis for Light-Duty Electric Vehicles: A Case Study in Malta. Energies 2023, 16, 5673. [Google Scholar] [CrossRef] [Scilit]
- Verrelli, C.M.; Bigarelli, L.; di Benedetto, M.; Lidozzi, A.; Solero, L. A New Nonlinear Control of an Active Rectifier for Variable Speed Generating Units. Control Eng. Pract. 2023, 139, 105653. [Google Scholar] [CrossRef] [Scilit]
- Sindhu, K.; Karthik, B. Experimental Research on Performance Analysis of a UPFC Damping Controller. Int. J. Recent Technol. Eng. 2019, 8, 3261–3266. [Google Scholar] [CrossRef] [Scilit]
- Elsotohy, A.M.; Soliman, A.M.A.; Adail, A.S.; Eisa, A.A.; Othman, E.A. Comprehensive Power Quality Performance Assessment for Electrical System of a Nuclear Research Reactor. Sci. Rep. 2023, 13, 9915. [Google Scholar] [CrossRef] [Scilit] [PubMed]
- Dovgun, V.; Temerbaev, S.; Chernyshov, M.; Novikov, V.; Boyarskaya, N.; Gracheva, E. Distributed Power Quality Conditioning System for Three-Phase Four-Wire Low Voltage Networks. Energies 2020, 13, 4915. [Google Scholar] [CrossRef] [Scilit]
- Parihar, S.S.; Malik, N. Analysing the Impact of Optimally Allocated Solar PV-Based DG in Harmonics Polluted Distribution Network. Sustain. Energy Technol. Assess. 2022, 49, 101784. [Google Scholar] [CrossRef] [Scilit]
- Alasali, F.; Nusair, K.; Foudeh, H.; Holderbaum, W.; Vinayagam, A.; Aziz, A. Modern Optimal Controllers for Hybrid Active Power Filter to Minimize Harmonic Distortion. Electronics 2022, 11, 1453. [Google Scholar] [CrossRef] [Scilit]
- Gülbahçe, M.O.; Karaaslan, M.E. Estimation of Induction Motor Equivalent Circuit Parameters from Manufacturer ’ s Datasheet by Particle Swarm Optimization Algorithm for Variable Frequency Drives. Electrica 2022, 22, 16–26. [Google Scholar] [CrossRef] [Scilit]
- de Oliveira, M.M.; Silva, L.R.M.; Melo, I.D.; Duque, C.A.; Ribeiro, P.F. Independent Component Analysis-Based Harmonic Transfer Impedance Estimation for Networks with Multiple Harmonic Sources. Energies 2025, 18, 85. [Google Scholar] [CrossRef] [Scilit]
- Kostic, M. Equivalent Circuit Improvement Method for Induction Motor Efficiency. Facta Univ.-Ser. Electron. Energ. 2012, 25, 31–42. [Google Scholar] [CrossRef] [Scilit]
- Pedra, J.; Sainz, L.; Córcoles, F. Harmonic Modeling of Induction Motors. Electr. Power Syst. Res. 2006, 76, 936–944. [Google Scholar] [CrossRef] [Scilit]
- Bolaño Mart\’\inez, A.; Jimenez Navarro, I.; Sousa Santos, V.; Quispe, E.C.; Daniel Donolo, P. {MATLAB/Simulink} Modeling of Electric Motors Operating with Harmonics and Unbalance. Int. J. Electr. Comput. Eng. 2022, 12, 4640. [Google Scholar] [CrossRef] [Scilit]
- Babu, P.S. Harmonic Analysis of Inverter-Fed Induction Motor Drive System under Fault Conditions Using {FFT}. Indian J. Sci. Technol. 2016, 9, 1–6. [Google Scholar] [CrossRef] [Scilit]
- Hussein, A.S.; Hawas, M.N. Power Quality Analysis Based on Simulation and {MATLAB/Simulink}. Indones. J. Electr. Eng. Comput. Sci. 2019, 16, 1144. [Google Scholar] [CrossRef] [Scilit]
- Rajput, S.; Bender, E.; Averbukh, M. Simplified Algorithm for Assessment Equivalent Circuit Parameters of Induction Motors. IET Electr. Power Appl. 2020, 14, 426–432. [Google Scholar] [CrossRef] [Scilit]
- Helonde, A.R.; Mankar, M. Identifying Three Phase Induction Motor Equivalent Circuit Parameters from Nameplate Data by Different Analytical Methods. Int. J. Trend Sci. Res. Dev. 2019, 3, 642–645. [Google Scholar] [CrossRef] [Scilit]
- Kravchik, A.E.; Schlaf, M.M.; Afonin, V.I. Series 4A Asynchronous Motors; Energoizdat: Moscow, Russia, 1982. [Google Scholar]
- EN 50160; Voltage Characteristics of Electricity Supplied by Public Electricity Networks. CENELEC; Brussels, Belgium, 2022.
- GOST 32144-2013; Electric Energy. Electromagnetic Compatibility of Technical Means. Standards of Power Quality in General-Purpose Power Supply Systems. Standartinform: Moscow, Russia, 2014.
- Meng, Q.; Gao, Y.; Hussain, S.; He, Y.; Li, B. A Novel Approach for High Impedance Fault Detection in Resonant Grounding Systems Based on Statistical Characteristics. Sci. Rep. 2026, 16, 3188. [Google Scholar] [CrossRef] [Scilit] [PubMed]

Disclaimer/Publisher’s Note: The statements, opinions and data contained in all publications are solely those of the individual author(s) and contributor(s) and not of MDPI and/or the editor(s). MDPI and/or the editor(s) disclaim responsibility for any injury to people or property resulting from any ideas, methods, instructions or products referred to in the content. |
© 2026 by the authors. Licensee MDPI, Basel, Switzerland. This article is an open access article distributed under the terms and conditions of the Creative Commons Attribution (CC BY) license.