Article

TAMCA: Time-Aware Multi-Scale Convolutional Attention for Multi-Class Industrial Anomaly Detection

1
Applied Technology Engineering Center of Fujian Provincial Higher Education for Visual Perception and Intelligent Analysis, Quanzhou Vocational College of Economics and Business, Quanzhou 362000, China
2
Yantai Research Institute, Harbin Engineering University, Yantai 264000, China
3
Xiamen King Long United Automotive Industry Co., Ltd., Xiamen 361023, China
4
School of Intelligent Manufacturing (Pen-Tung Sah Institute of Micro-Nano Science and Technology), Xiamen University, Xiamen 361102, China
*
Authors to whom correspondence should be addressed.
These authors contributed equally to this work.
Eng 2026, 7(9), 480; https://doi.org/10.3390/eng7090480
Submission received: 26 July 2026 / Revised: 2 September 2026 / Accepted: 14 September 2026 / Published: 16 September 2026

Abstract

In multi-class industrial anomaly detection, latent diffusion models commonly use the same attention and receptive-field configuration across all noise stages. This stage-invariant design makes it difficult to balance global structure recovery at high noise levels with local detail preservation at low noise levels, which may lead to structural drift, over-smoothing, and unstable anomaly maps. To address this issue, we propose TAMCA, a time-aware multi-scale convolutional attention framework for diffusion-based anomaly detection. In TAMCA, a Multi-Scale Convolutional Attention module (MSCA) is embedded into the denoising network to jointly model local textures and long-range contextual dependencies through local depthwise convolution and decomposed large-kernel convolution. To further adapt contextual modeling to different denoising stages, diffusion timestep embeddings are mapped into gating coefficients, which selectively regulate the contribution of the large-kernel context branch according to the noise level. During inference, Diffusion-aware Consistency Ensembling (DiCE) estimates multi-view reliability through median consensus and performs reliability-weighted fusion to suppress view-specific false responses. Experiments on MVTec-AD and VisA show that TAMCA achieves pixel-level AUROC values of 97.2% and 97.0%, respectively, with consistent improvements in pixel-level AP, F1max, and PRO.

1. Introduction

Anomaly detection has become an important research topic across a wide range of application domains, with precise defect localization being particularly critical for quality control in industrial visual anomaly detection [1,2,3,4]. However, anomalous samples are scarce and diverse in appearance. This makes it difficult for conventional supervised methods to generalize well. Therefore, unsupervised anomaly detection based on normal samples has become a widely adopted paradigm. Existing unsupervised methods can be broadly grouped into three categories: feature embedding methods [5,6,7,8], pseudo-anomaly synthesis methods [9,10,11,12], and generative reconstruction methods [13,14,15,16]. Generative reconstruction methods learn the distribution of normal samples and localize anomalies using reconstruction errors. However, they often suffer from insufficient detail preservation and blurred boundaries.
Diffusion models have recently been introduced into anomaly detection due to their strong distribution modeling and image reconstruction capabilities [17,18,19,20]. Pixel-space DDPMs [21] can model fine details but incur high computational cost. Latent diffusion models (LDMs) [22] move the diffusion process into a latent space, achieving a better balance between efficiency and reconstruction quality. Nevertheless, existing LDM-based methods still face a critical bottleneck. Their denoising networks usually use the same attention and receptive-field configuration across all noise stages. At high-noise stages, this fixed design makes it difficult to restore global structures. At low-noise stages, overly strong context aggregation may suppress boundary details. This can lead to structural drift, over-smoothing, or artifacts. Consequently, the anomaly map may fluctuate around defect boundaries, weakening the stability of pixel-level localization.
To address the mismatch between denoising stages and contextual requirements, we propose TAMCA, a diffusion anomaly detection framework based on time-aware multi-scale convolutional attention. Unlike methods with fixed receptive fields, TAMCA uses a timestep-conditioned gate to dynamically adjust the contribution of the large-kernel context branch. This allows the network to emphasize structure recovery at high noise levels and detail preservation at low noise levels. The main contributions are summarized as follows:
  • We propose TAMCA, a time-aware diffusion reconstruction framework for multi-class industrial anomaly detection. It addresses the stage-wise mismatch caused by shared attention across all timesteps and fixed receptive-field configurations.
  • To enhance contextual modeling during diffusion denoising, a Multi-Scale Convolutional Attention (MSCA) module is incorporated into the reconstruction network. By combining local depthwise convolution with decomposed large-kernel convolution, MSCA jointly captures local texture details and long-range structural dependencies while maintaining a lightweight design.
  • To inject timestep information in a targeted manner, MSCA-T maps the diffusion timestep embedding to a branch-level gating coefficient. The generated gate selectively regulates the contribution of the large-kernel context branch at different noise levels, enabling a better balance between global structure recovery and local detail preservation.
  • During inference, Diffusion-aware Consistency Ensembling (DiCE) serves as a stabilization strategy for anomaly map fusion. It estimates the reliability of multi-view anomaly maps using median consensus and performs reliability-weighted fusion, thereby suppressing view-specific false responses and improving the spatial consistency and boundary stability of anomaly maps.

2. Related Work

2.1. Anomaly Detection

Unsupervised industrial anomaly detection is commonly based on normal-sample modeling. An anomaly is identified by measuring the deviation between a test sample and the learned normal pattern. Existing methods can be grouped into three categories. Feature embedding methods build statistical distributions or memory banks in a feature space extracted by a pretrained network, such as PatchSVDD [23], CIF [24], and PaDiM [25]. Distillation-based methods localize anomalies using the representation discrepancy between teacher and student networks. These methods usually provide strong localization performance, but they are sensitive to the generalization ability of pretrained features. Memory retrieval also introduces additional inference cost. Pseudo-anomaly synthesis methods simulate defects using cutting, pasting, or texture perturbations, such as CutPaste [9], DRAEM [11], and RegAD [26]. Their performance largely depends on the realism and diversity of synthesized defects. Generative reconstruction methods use AE [27], VAE [28], GAN [29], or related models to learn a normal reconstruction mapping. Anomalies are then localized by comparing the input and the reconstruction. UniAD [30] further attempts unified modeling for multi-class scenarios. However, in high-resolution and multi-class industrial settings, generative reconstruction methods still commonly suffer from insufficient detail fidelity, blurred boundaries, and unstable residual responses.

2.2. Diffusion Models

Diffusion models (DMs) are inspired by non-equilibrium thermodynamics. They learn data distributions through a forward noise-adding process and a reverse denoising process. Pixel-space diffusion models represented by DDPM [21] can model fine details, but their training and inference costs are high. DDIM [31] improves sampling efficiency using deterministic sampling. Latent diffusion models further reduce the computational complexity of high-resolution image generation by moving the diffusion process into a low-dimensional latent space through a pretrained VAE [17,18,32].
Recently, diffusion models have been introduced into unsupervised anomaly detection to improve reconstruction quality and localization accuracy. Lu et al. [33] constructed pixel-wise anomaly scores using intermediate denoising representations. DiffAD [34] enhanced reconstruction controllability through noise-conditioned embeddings. DDAD [35] used conditional denoising diffusion to obtain more stable anomaly evidence. DiAD [36] introduced a guidance fusion mechanism for multi-class anomaly detection. GLAD [18] improved reconstruction and localization using global and local adaptive designs. Although these methods improve conditional design and reconstruction strategies, most of their denoising networks still use shared attention across all timesteps and fixed receptive-field configurations. The same contextual aggregation strength is therefore applied throughout the denoising process. This makes it difficult to satisfy both global structure recovery at high noise levels and local detail preservation at low noise levels, which affects accurate anomaly-boundary localization.

3. Method

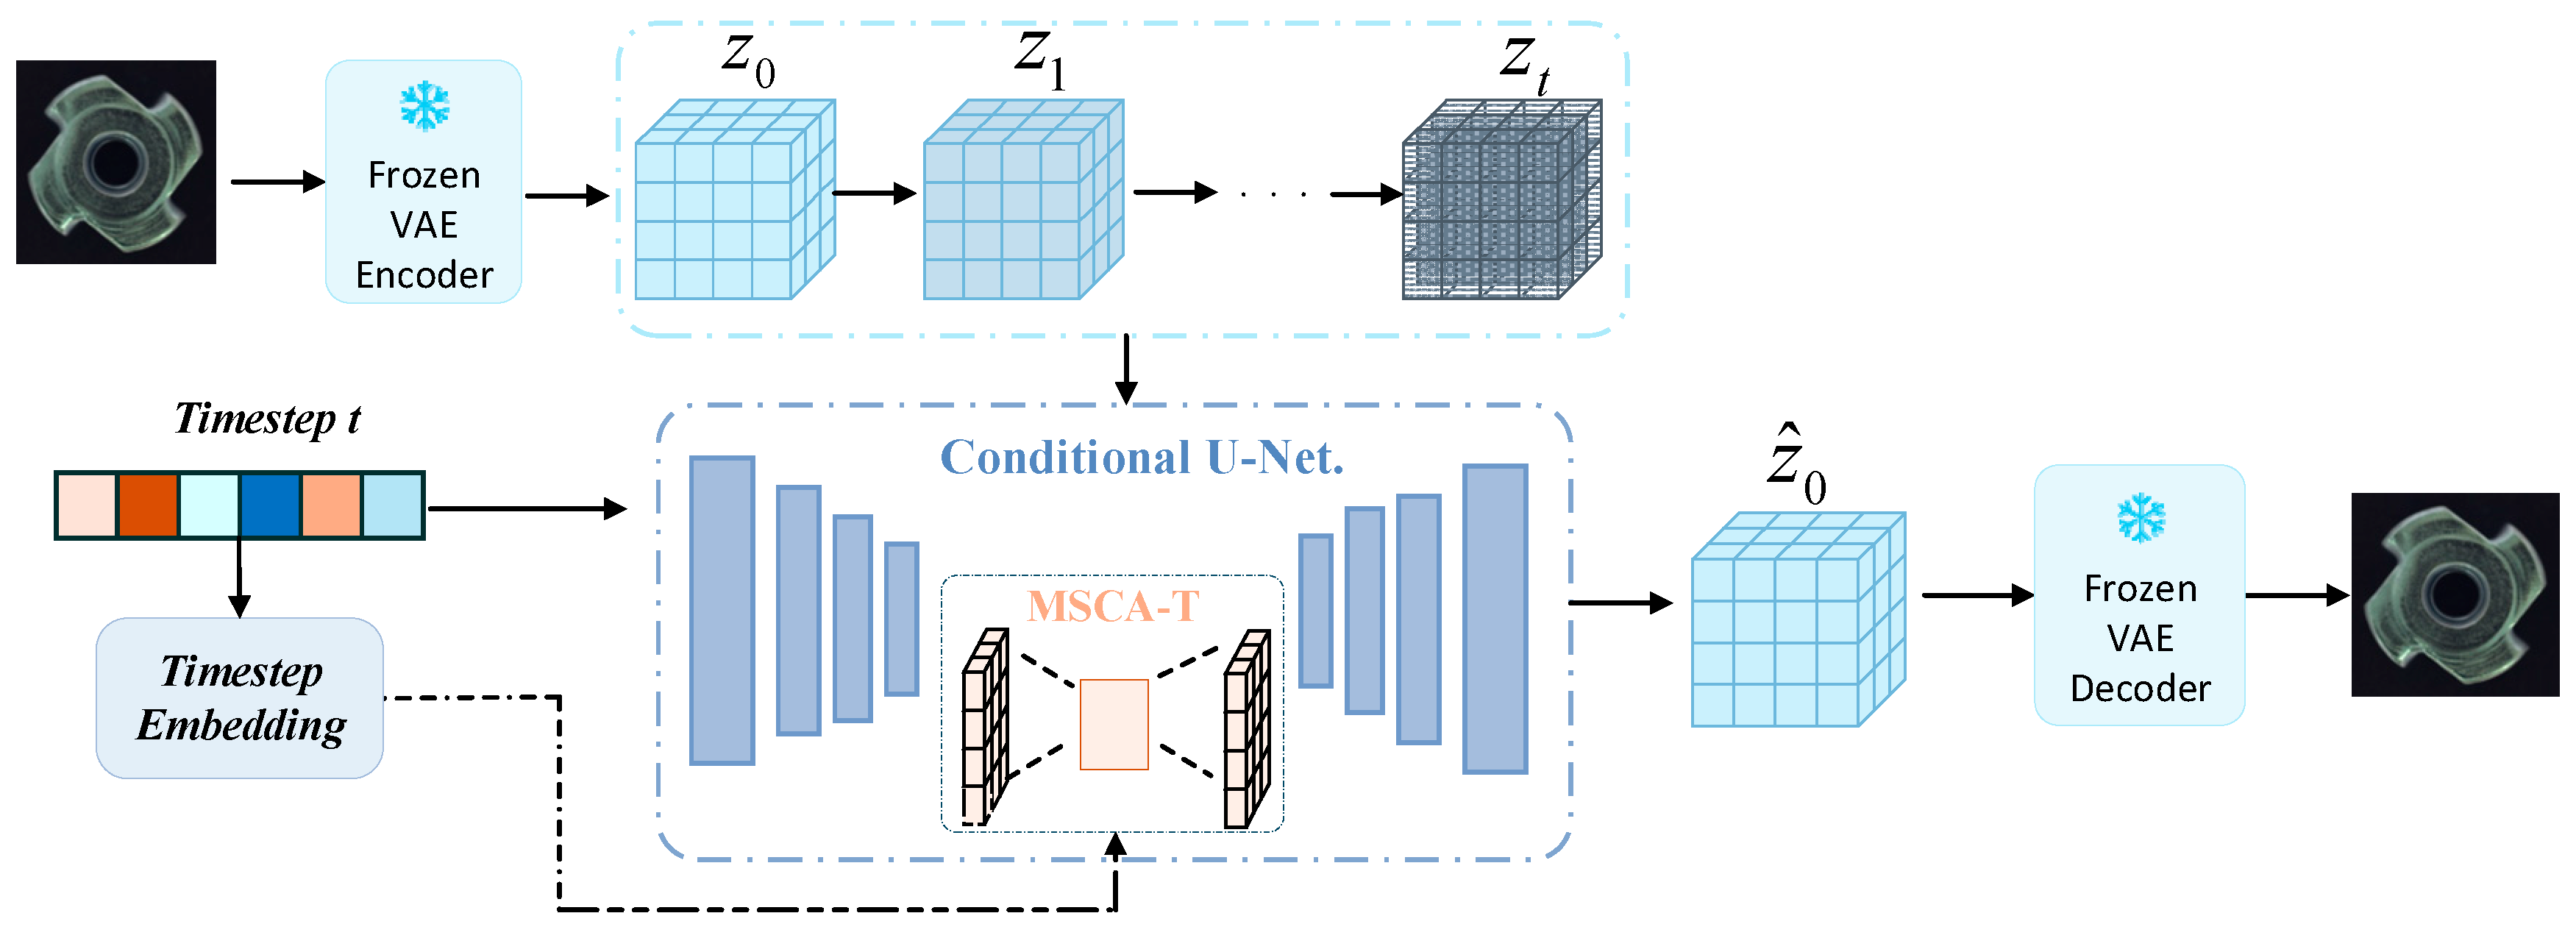
The latent diffusion reconstruction pipeline of TAMCA is shown in Figure 1. First, a pretrained encoder maps the input image into a low-dimensional latent representation z 0 , reducing the computational cost of diffusion modeling for high-resolution images. Diffusion reconstruction is then performed in the latent space. Under a given noise schedule, noise is progressively added to the latent representation z ^ 0 . A conditional denoising network then iteratively removes the Gaussian perturbation at each timestep. Here, the Gaussian noise is introduced by the standard diffusion process as a synthetic perturbation rather than as a model of the actual physical noise distribution in industrial images. During this process, the timestep-conditioned gate dynamically adjusts the contribution of the large-kernel context branch. The denoised latent is finally decoded back to the image space x ^ by a pretrained decoder.
For detection and localization, the input image and its reconstruction are fed into the same feature extractor to obtain multi-scale feature representations. Anomaly responses are computed from the differences between corresponding feature scales. During inference, DiCE further fuses multi-view anomaly maps using median-consensus-guided reliability weighting, producing the final image-level anomaly score and pixel-level anomaly map.

3.1. Latent Diffusion Model

Diffusion models consist of a forward noising process and a reverse denoising process. In the forward process, a Markov chain is used to gradually add Gaussian noise to an initial data sample x 0 . Starting from the original image x 0 , the forward transitions are defined in Equation (1).
p θ x t 1 | x t = N x t 1 ; μ θ x t , t , θ t
where β t represents the noise schedule that controls the amount of noise added at each timestep.
During reverse denoising, the model starts from pure Gaussian noise and iteratively estimates the noise component using a parameterized neural network. This process approximates the sampling trajectory from the noise distribution to the data distribution, as given in Equation (2).
p θ x t 1 | x t = N x t 1 ; μ θ x t , t , θ t
where μ θ x t , t denotes the model-predicted denoising mean, θ t is the time-dependent covariance matrix, and θ represents the learnable parameters of the diffusion model.
The forward diffusion process of latent diffusion models (LDMs) follows the same principle as in pixel space, where noise is progressively injected to obtain noisy latent variables. U-Net is employed to predict the noise component ε θ z t , t , c during the reverse diffusion stage. The training objective is formulated in Equation (3).
L L D M = Ε z 0 , t , ε , c ε ε θ z t , t , c 2 2
where ε N 0 , I , z t denotes the latent-space features, and c denotes the external conditioning features, which can be derived from text, images, or other semantic modalities. The training loss encourages the model to learn a denoising mapping in latent space. Semantic guidance signals are incorporated to modulate the reconstruction of latent variables.

3.2. Multi-Scale Convolutional Attention

The denoising network must model both local details and long-range structural information. At high noise levels, the latent representation contains weak structural cues, and the network requires broader contextual constraints to recover the global structure. At low noise levels, overly strong contextual aggregation may remove local textures and defect boundaries, leading to over-smoothed reconstructions. Standard self-attention can enlarge the receptive field, but it brings high computational and memory costs on high-resolution features. In contrast, local convolution alone cannot provide sufficient long-range structural constraints.
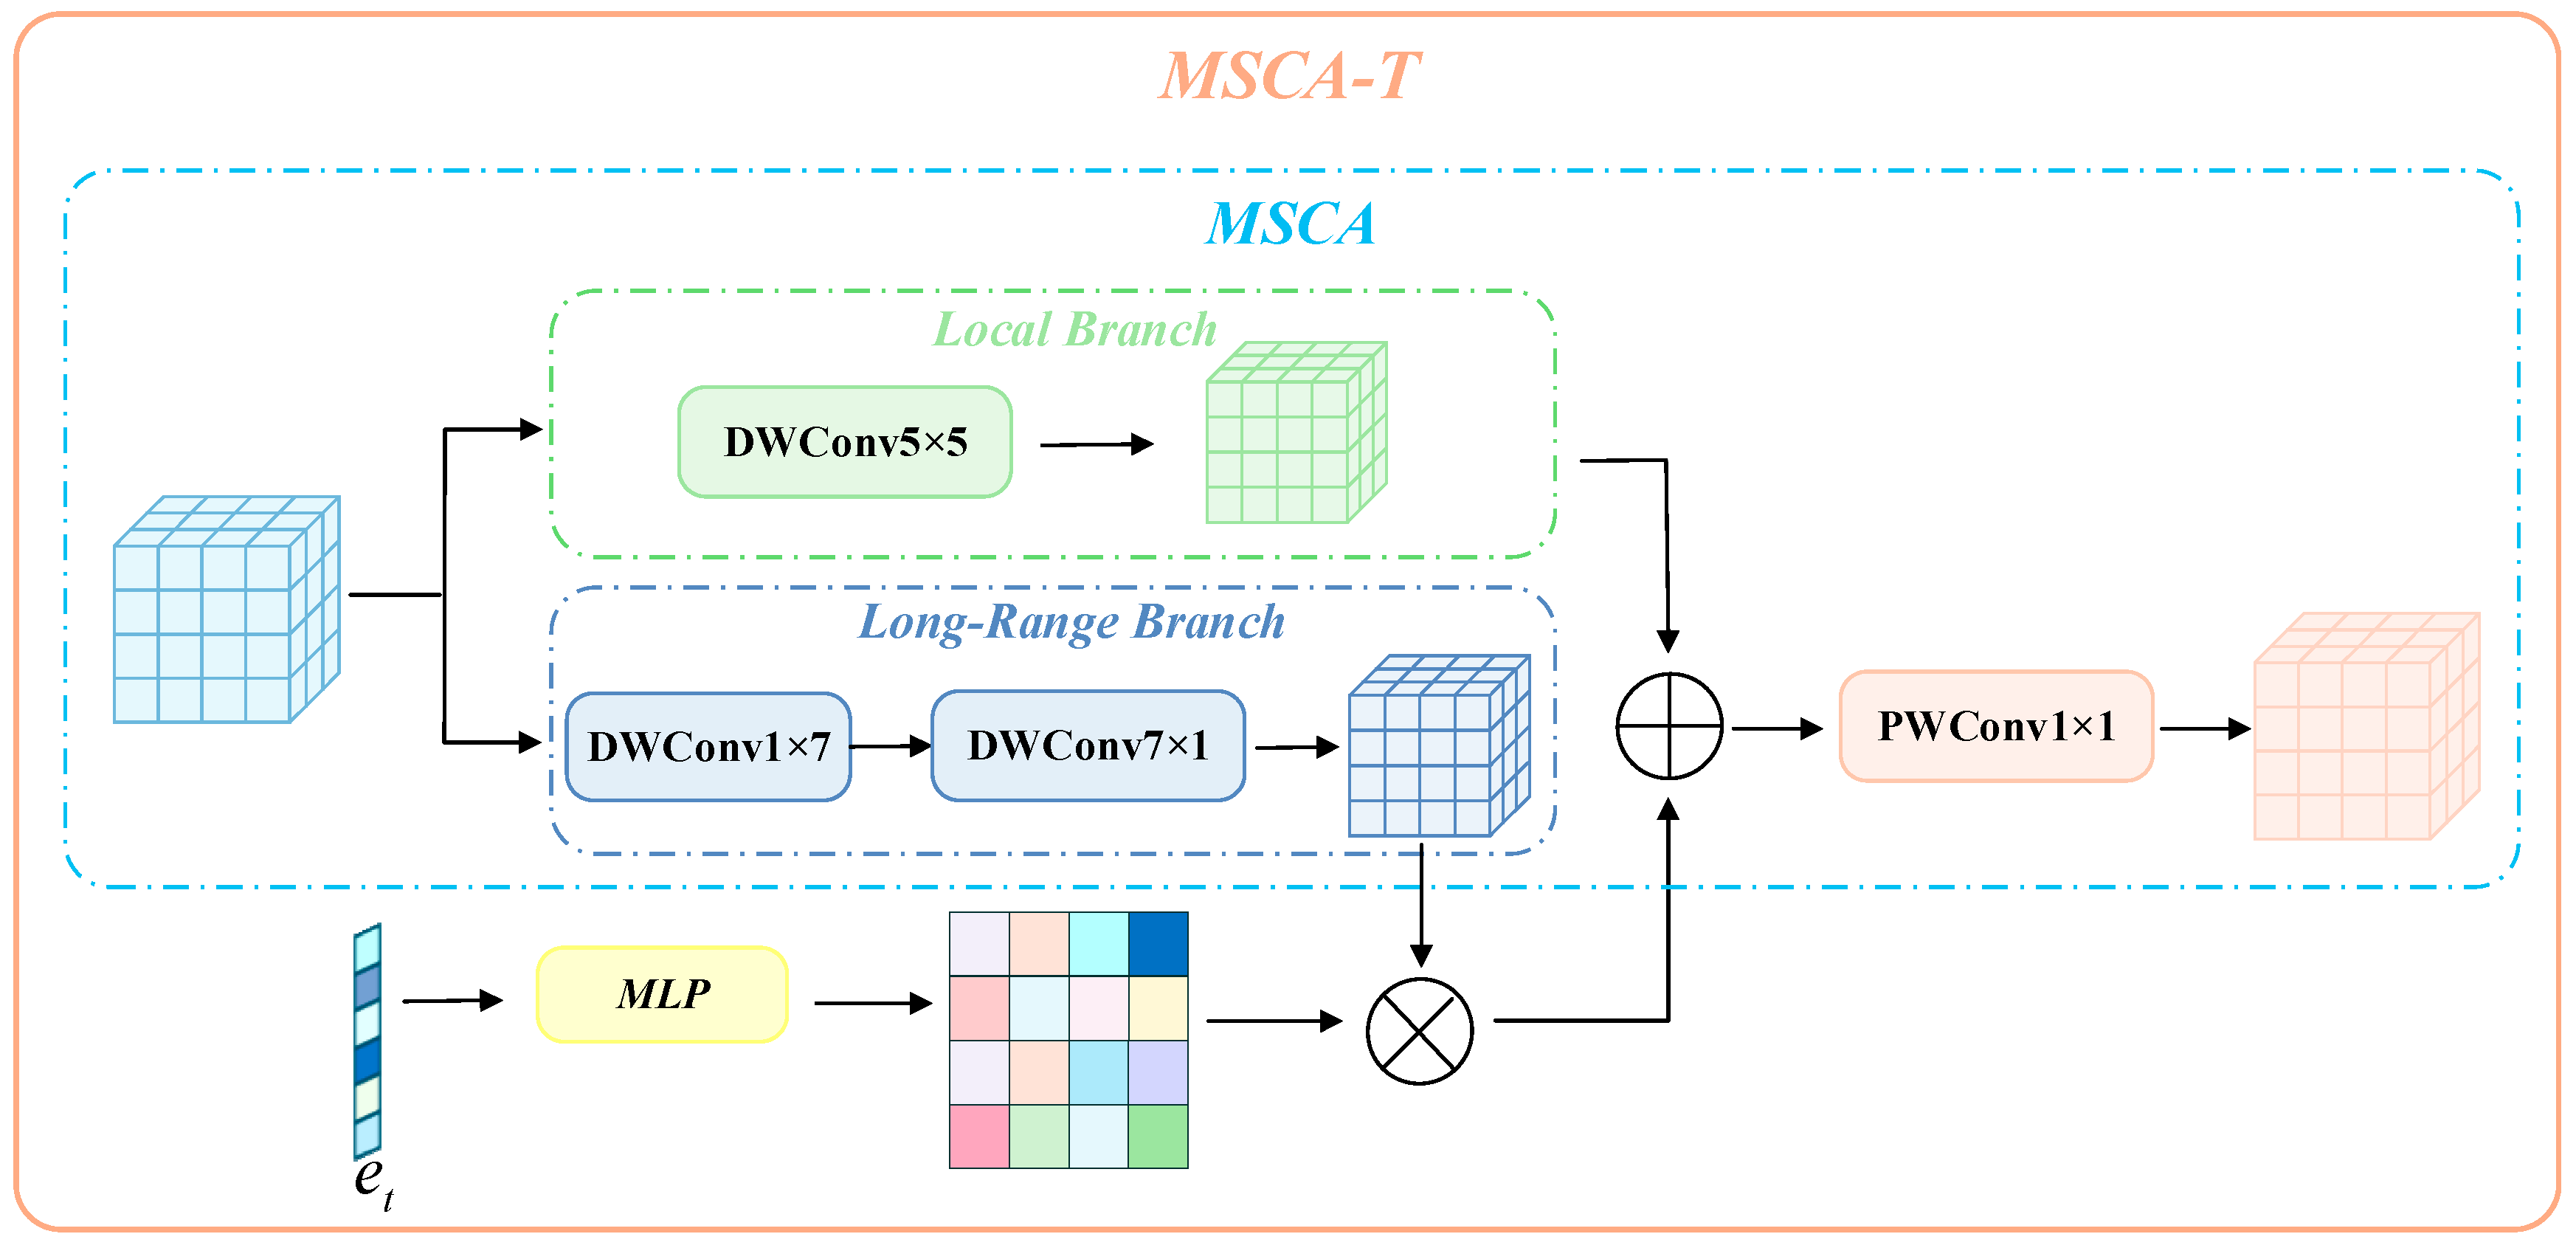
To address this issue, we design a Multi-Scale Convolutional Attention module (MSCA), as shown in Figure 2. MSCA builds a local response branch and a decomposed large-kernel context branch using depthwise separable convolutions. It jointly models local textures and long-range structural dependencies with low computational overhead. The fused multi-scale context is then mapped into a modulation map, which spatially reweights the input features through multiplicative modulation. This enhances the structural representation of denoising features.
Given an input feature X B × C × H × W first extracts the local response using a 5 × 5 depthwise convolution:
A = D W C o n v 5 × 5 X
Here, X denotes the input feature tensor, and D W C o n v 5 × 5 represents a learnable depthwise convolution. Each channel of X is independently convolved with its corresponding learnable spatial kernel to capture local texture and boundary information.
Then, decomposed large-kernel convolution is used to aggregate long-range context:
L = D W C o n v 7 × 1 D W C o n v 1 × 7 A
Here, D W C o n v 1 × 7 and D W C o n v 7 × 1 denote decomposed large-kernel depthwise convolutions along the horizontal and vertical directions, respectively.
Compared with a direct 7 × 7 large-kernel convolution, this decomposition expands the effective receptive field while reducing parameters and computational cost. The local response and long-range context are then fused, and a 1 × 1 pointwise convolution generates a spatial modulation map:
M = P W C o n v 1 × 1 A + L
Here, 1 × 1 PWConv denotes pointwise convolution. Finally, the modulation map is applied to the input feature by element-wise multiplication:
Y = X M
Here, ⊙ denotes element-wise multiplication.
It is worth noting that MSCA does not simply aim to enlarge the receptive field. Instead, it provides two complementary branches for diffusion denoising. The local branch preserves texture and boundary information, while the decomposed large-kernel branch provides broader structural constraints. These two branches form the multi-scale basis for the subsequent time-aware modulation.

3.3. Time-Aware Multi-Scale Convolutional Attention

Although MSCA provides multi-scale context modeling through local depthwise convolution and decomposed large-kernel convolution, the contribution of its large-kernel context branch remains fixed across all denoising timesteps. In diffusion reconstruction, different noise stages require different amounts of long-range context. At high noise levels, the latent representation contains weak structural cues, and stronger large-kernel context is needed to restore the global structure. As denoising progresses and the noise level decreases, the global structure is progressively recovered, while the remaining reconstruction errors become increasingly concentrated in fine textures, edges, and local boundaries. Therefore, local detail preservation becomes more important at low-noise stages, and excessive long-range aggregation may cause boundary over-smoothing or local artifacts. Consequently, a fixed large-kernel branch contribution cannot fully adapt to the stage-wise reconstruction requirements of diffusion denoising.
We therefore propose Time-aware Multi-Scale Convolutional Attention (MSCA-T), as shown in Figure 2. Unlike generic time modulation methods that directly add timestep embeddings to all features, MSCA-T maps the diffusion timestep embedding to a lightweight gate. The gate is used only to adjust the contribution of the large-kernel context branch. This design converts timestep information from a global feature bias into an explicit control signal for long-range context aggregation. This allows the same denoising network to adapt its context usage according to the noise level.
Given an input feature X B × C × H × W and a timestep embedding e t B × D , a 5 × 5 depthwise convolution first extracts the local response:
A = D W C o n v 5 × 5 X
Then, the long-range context branch is computed on the local response using decomposed large-kernel convolutions:
L = D W C o n v 7 × 1 D W C o n v 1 × 7 A
To make the large-kernel context branch aware of the denoising stage, the timestep embedding is passed through a lightweight MLP and a sigmoid function to generate a sample-level gate:
g t = σ M L P e t , g t 0 , 1 B × 1
Here, g t is a scalar gate for each sample. It is broadcast along the channel and spatial dimensions and is applied only to the large-kernel context branch:
L ˜ = g t · L
The local response and the time-modulated large-kernel context are then fused. A 1 × 1 pointwise convolution generates the modulation map:
M = P W C o n v 1 × 1 A + L ˜
Y = X M
Compared with generic time modulation methods, the key difference in MSCA-T lies in the target of the time information. Existing diffusion models often inject timestep embeddings into the entire feature through addition or concatenation. In contrast, MSCA-T maps the timestep information to a branch-level gate and only adjusts the contribution of the large-kernel context branch. The model can therefore adapt long-range contextual dependency according to the denoising stage.
With this design, MSCA-T preserves the lightweight structure of MSCA while converting diffusion timestep information into explicit control over large-kernel context strength. The branch-level gating mechanism enables contextual aggregation to vary with the noise level. This helps alleviate stage-wise mismatch caused by fixed large-kernel configurations.

3.4. Diffusion-Aware Consistency Ensembling

Based on the time-aware reconstruction provided by MSCA-T, we further improve the stability of anomaly maps during inference. Diffusion reconstruction can be sensitive to input views. Anomaly evidence obtained under different geometric transformations may be inconsistent. Some views may also introduce view-specific false responses. Conventional test-time augmentation usually averages or takes the maximum of multi-view results. It implicitly assumes that all views are equally reliable. This may allow unstable views to affect the final anomaly map.
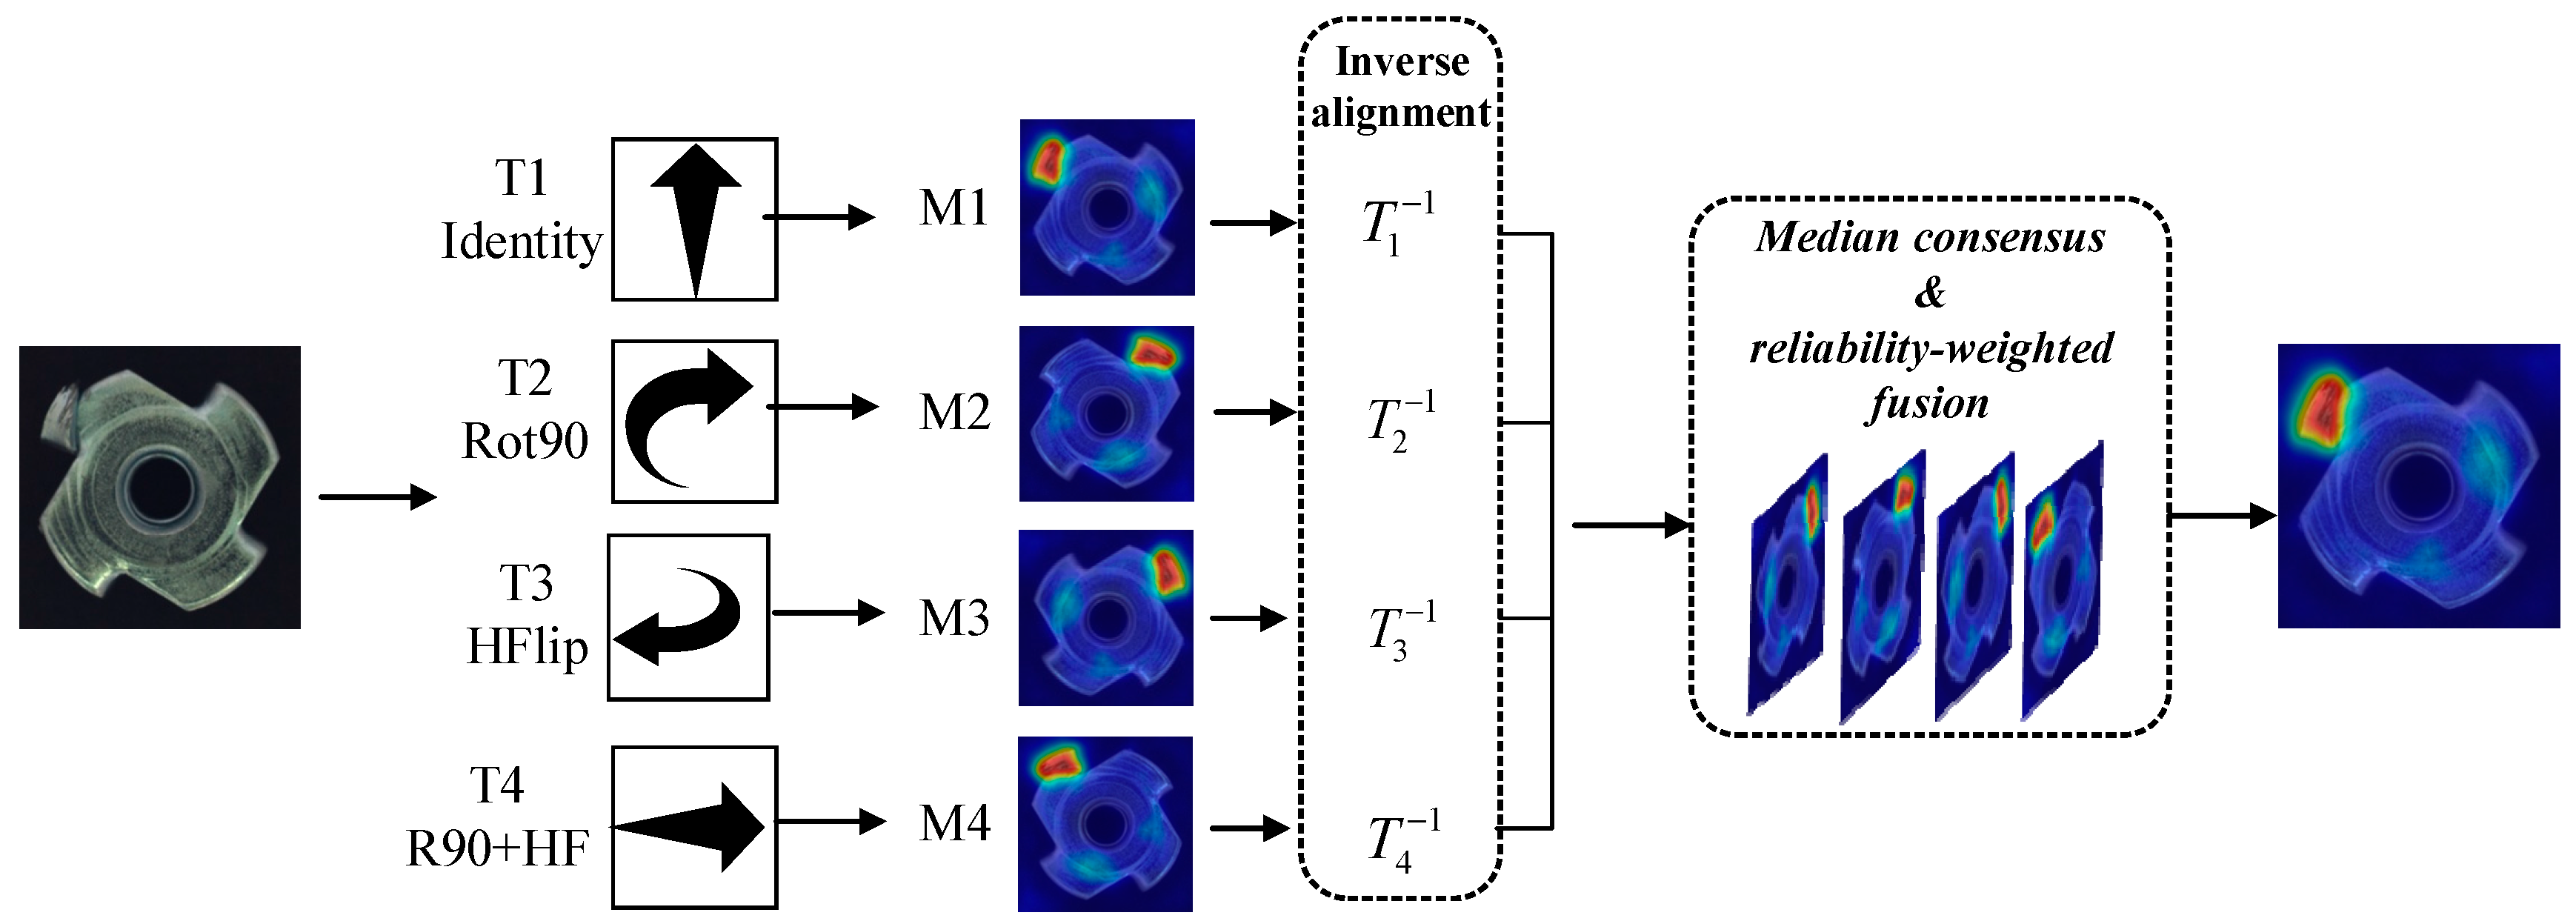
To address this problem, we introduce Diffusion-aware Consistency Ensembling (DiCE) as an inference-stage stabilization strategy, as shown in Figure 3. DiCE estimates view reliability using a median consensus and fuses multi-view anomaly maps using reliability-aware weights. This suppresses view-specific false responses and improves anomaly-map stability.
Given an input image x and its reconstruction x ^ , let Γ k k = 1 K denote a set of lightweight reversible geometric transformations. For the k-th view, the corresponding anomaly map is first computed and then aligned back to the original coordinate system by the inverse transformation:
M ˜ k = Γ k 1 ψ Γ k x , Γ k x ^ , k = 1 , , K
Here, ψ · denotes the anomaly evidence extractor, which generates an anomaly map from multi-layer feature differences between the input and reconstructed images. To estimate the multi-view consensus, we use the pixel-wise median of all aligned anomaly maps as the reference map:
M r e f = m e d i a n M ˜ 1 , , M ˜ K
The average deviation of each view from the consensus reference map is then defined as
d k = 1 | Ω | p Ω | M ˜ k p M r e f p |
A smaller deviation indicates that the view is more consistent with the multi-view consensus and is therefore more reliable. Based on this deviation, reliability weights are computed using softmax normalization, and the aligned maps are fused as
ω k = exp γ d k j = 1 K exp γ d j , M D i C E = k = 1 K ω k M ˜ k
Here, γ > 0 controls the weight distribution. A larger γ assigns higher weights to views that are more consistent with the consensus map. A smaller γ makes the fusion closer to ordinary averaging. This inference strategy does not change the training process. It reduces the influence of unstable views and suppresses view-specific false responses, thereby improving the stability of pixel-level localization.

4. Experiments

4.1. Datasets

To evaluate the proposed method in multi-class industrial anomaly detection, we conduct experiments on two public benchmark datasets: MVTec-AD [37] and VisA [38].
MVTec-AD covers 15 industrial categories, including 10 object classes and 5 texture classes. It contains 5354 high-resolution images. The training set consists of 3629 defect-free images, and the test set contains 1725 normal and anomalous images. Pixel-level defect annotations are provided for localization evaluation.
VisA is a larger industrial anomaly detection dataset. It contains 12 categories and 10,821 images, including 9621 normal images and 1200 anomalous images. It covers 78 defect types. Compared with MVTec-AD, VisA exhibits greater diversity in object appearance, defect scale, and spatial layout. It is therefore suitable for evaluating localization stability and generalization in complex multi-class scenarios.

4.2. Evaluation Metrics

Following common practice in multi-class anomaly detection [39,40], we evaluate performance at both image and pixel levels. For image-level detection, AUROC, AP, and F1max are used to measure the ability to distinguish normal images from anomalous images. For pixel-level localization, pixel-level AUROC (P-AUROC), pixel-level AP (P-AP), pixel-level F1max (P-F1max), and PRO are used to evaluate the consistency between anomaly maps and ground-truth defect regions.
AUROC measures the overall discriminative ability across different thresholds. AP is the area under the precision-recall curve and is more informative under class imbalance. F1max denotes the maximum F1 score over all thresholds and reflects the best balance between precision and recall. PRO measures region-level overlap between predicted anomaly regions and ground-truth defects. It complements pixel-level metrics by evaluating defect connectivity and boundary integrity.

4.3. Experimental Setup

The model is implemented and trained in PyTorch 1.12.1. All input images are resized and center-cropped to 256 × 256. In the reconstruction stage, a frozen Stable Diffusion VAE (KL-regularized autoencoder) encodes each image into a 32 × 32 × 4 latent representation. Diffusion reconstruction training is then performed in the latent space. The model is trained using AdamW with a batch size of 12 and an initial learning rate of 1 × 10⁻⁵. The AdamW optimizer is configured with β 1 = 0.9 , β = 0.999 , ϵ = 1 × 10 8 , and a weight decay of 0.01. The forward diffusion process consists of 1000 timesteps and adopts a scaled-linear noise schedule, with β increasing from 0.00085 to 0.012. The denoising network is trained using the standard ϵ -prediction objective with mean squared error loss. Training is conducted for 1000 epochs on a single NVIDIA A100 GPU with 80 GB memory.
A single unified model is trained jointly on all categories within each dataset rather than using separate category-specific models. Specifically, the 15 categories of MVTec-AD and the 12 categories of VisA are jointly modeled within their respective dataset-specific TAMCA models. Only normal training samples are used for model optimization, while normal and anomalous test samples are used exclusively for evaluation.
During inference, DDIM [31] is used for deterministic sampling with 10 steps. The reconstructed latent is decoded back to the image space using the frozen VAE. An anomaly map is generated from the differences between the input and reconstructed images. To improve localization robustness, DiCE is used to fuse multi-view anomaly maps. Specifically, maps obtained under several lightweight reversible geometric transformations are aligned through inverse transformation. View reliability is estimated using pixel-wise median consensus, followed by reliability-weighted fusion to obtain the final anomaly score map.

4.4. Quantitative Comparison

To verify the effectiveness of the proposed method in multi-class industrial anomaly detection, we compare TAMCA with representative non-diffusion and diffusion-based baselines. These baselines cover feature distribution modeling, knowledge distillation, generative reconstruction, and diffusion reconstruction. The non-diffusion methods include PaDiM [25], MKD [41], RD4AD [42], and UniAD [30]. The diffusion-based methods include pixel-space DDPM [21], latent diffusion model (LDM) [22], and DiAD [36]. These methods cover the major modeling paradigms in industrial anomaly detection and allow TAMCA to be evaluated from both image-level detection and pixel-level localization perspectives.
Table 1, Table 2 and Table 3 summarize the results on MVTec-AD. Table 1 reports image-level detection results. TAMCA achieves average I-AUROC, I-AP, and I-F1max scores of 97.2%, 99.0%, and 97.0%, respectively. These results are comparable to those of the competitive diffusion-based method DiAD (97.2%/99.0%/96.5%), with a slight improvement in I-F1max. This indicates that TAMCA maintains stable image-level anomaly discrimination while improving pixel-level localization. It should be noted that image-level detection is strongly affected by the aggregation strategy from anomaly maps to global anomaly scores. Its improvement may not fully reflect the spatial quality of anomaly localization. Therefore, we focus more on pixel-level metrics for defect-boundary and anomaly-region evaluation.
Table 2 reports pixel-level localization results. TAMCA achieves average P-AUROC, P-AP, and P-F1max values of 97.2%, 56.4%, and 58.1%, respectively, outperforming DiAD with 96.8%, 52.6%, and 55.5%. The P-AP improvements over DiAD, LDM, and UniAD are 3.8, 28.8, and 13.0 percentage points, respectively. The P-F1max improvements over DiAD and UniAD are 2.6 and 8.6 percentage points, respectively. Since P-AP and P-F1max are sensitive to the spatial separability of anomaly responses and threshold selection, these results show that TAMCA generates more discriminative anomaly maps and achieves better performance in practical threshold-based localization.
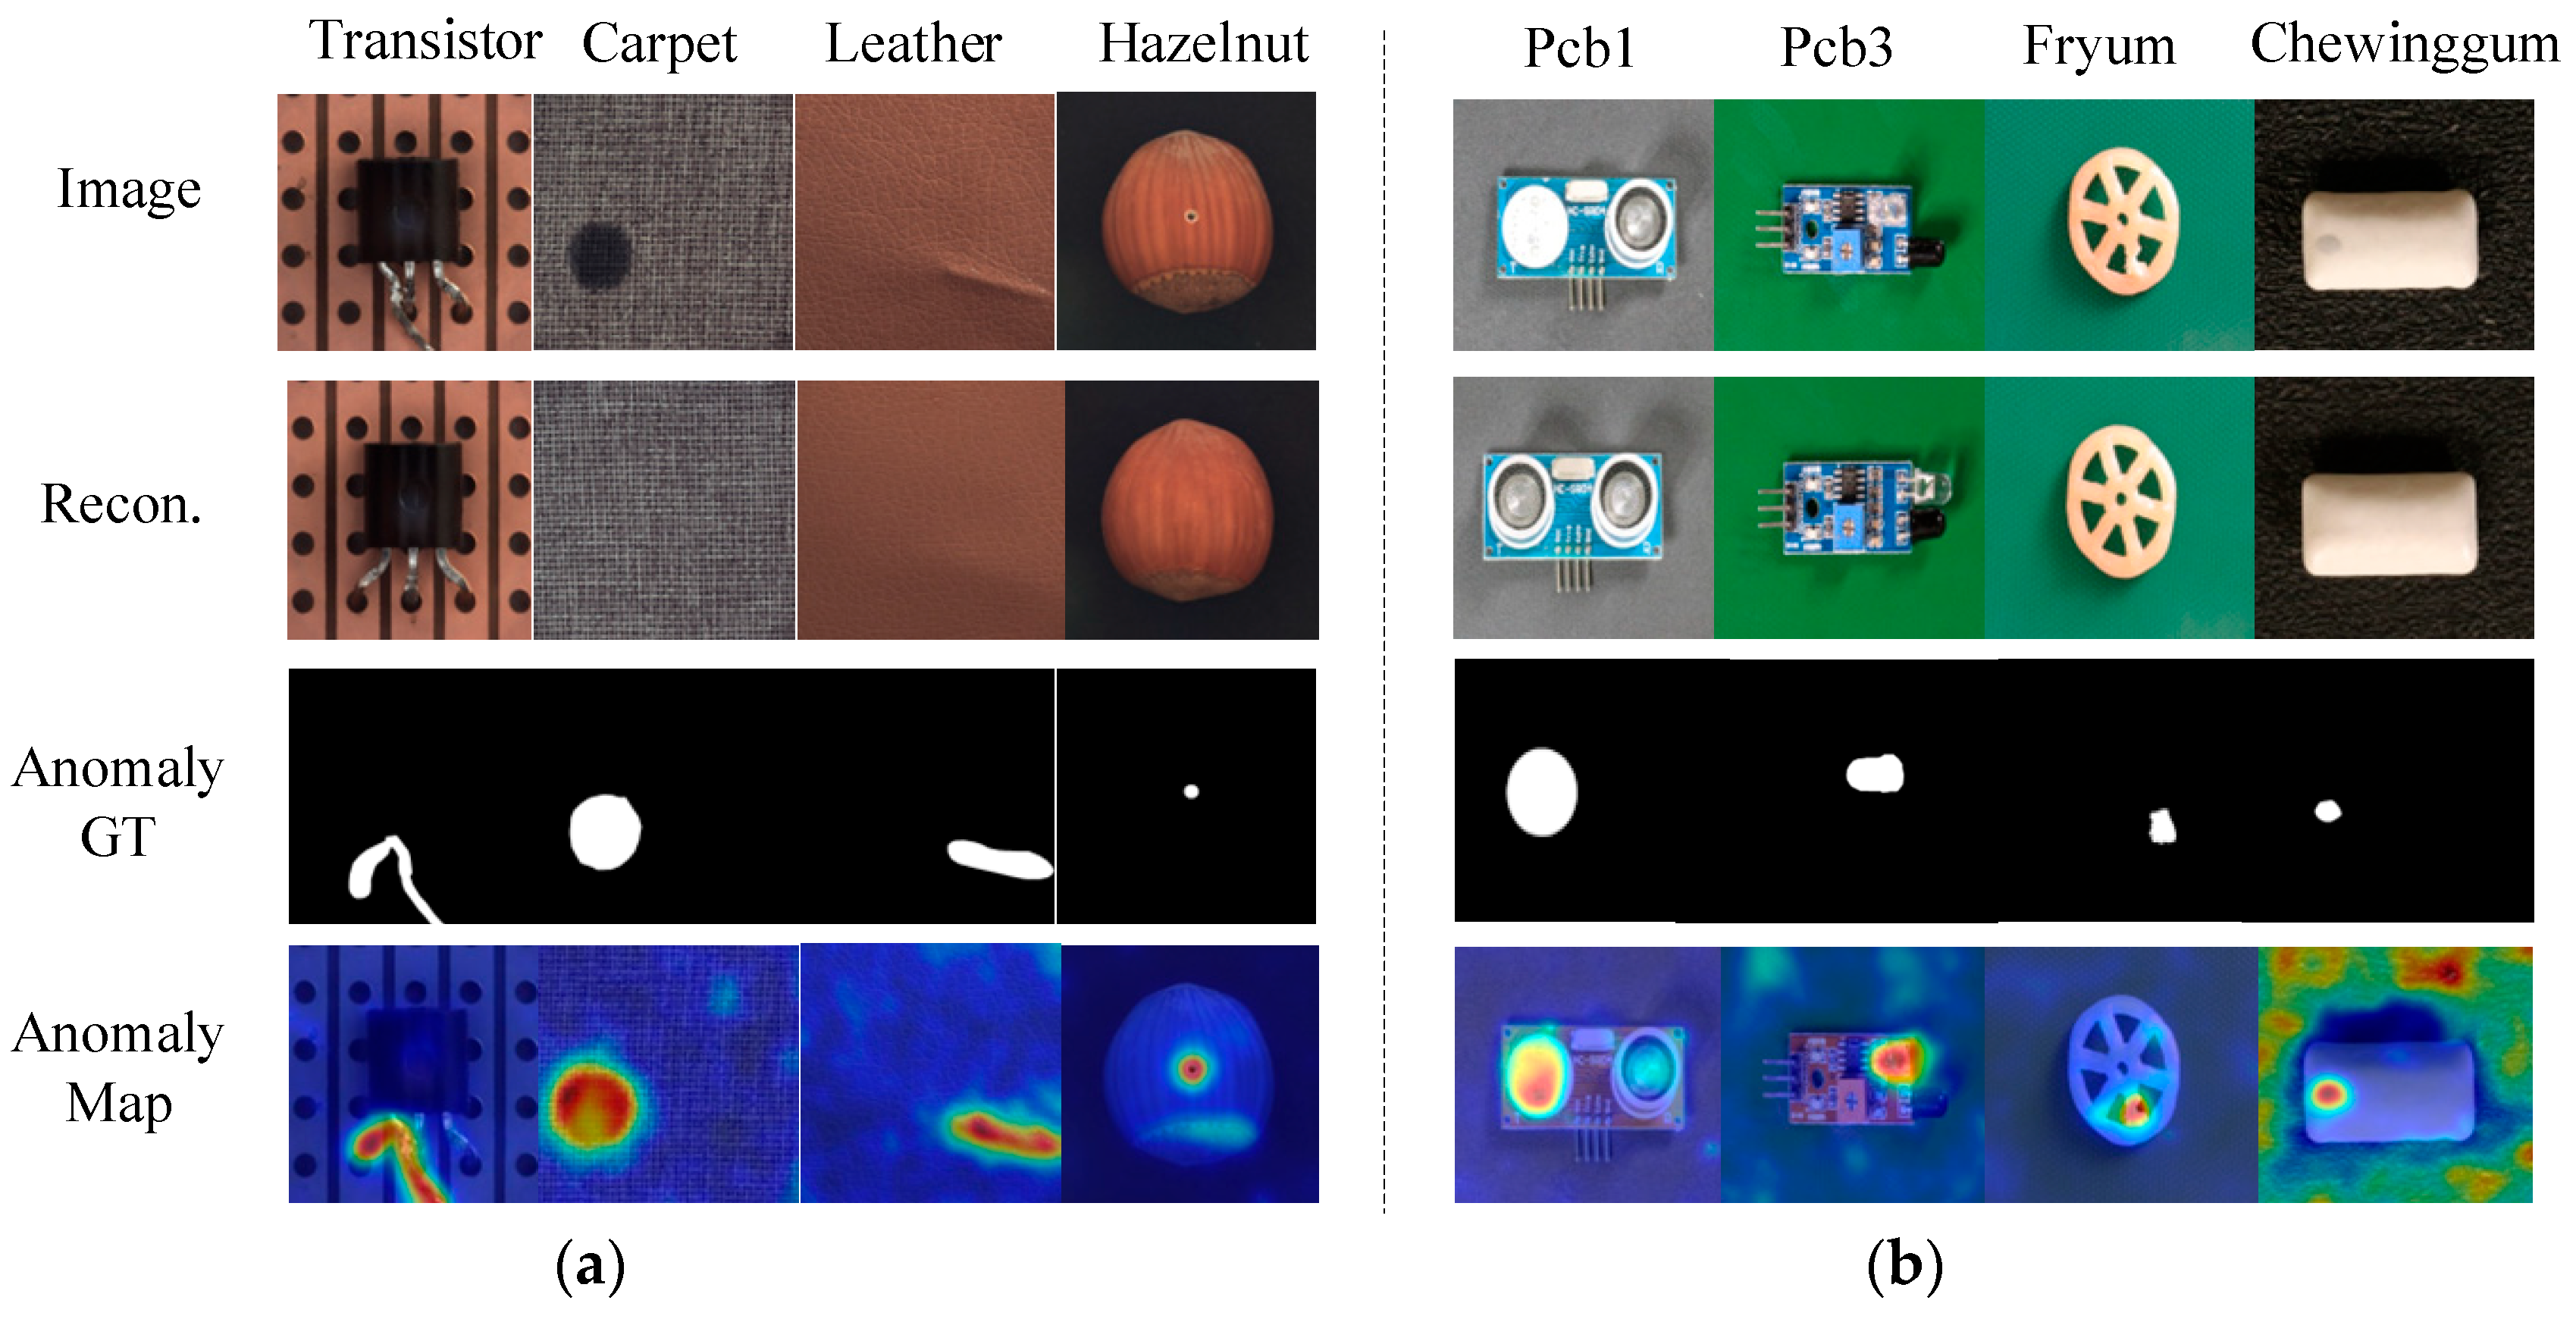
Table 3 further reports PRO, which measures region-level coverage consistency between predicted anomaly regions and ground-truth defects. TAMCA obtains the highest PRO of 91.8%, outperforming RD4AD (91.1%) and DiAD/UniAD (90.7%). This shows that TAMCA not only improves the separability of pixel-level anomaly responses but also covers real defect regions more consistently. It also reduces the influence of background false responses on defect contour recovery. Figure 4 presents qualitative anomaly localization results on two benchmark datasets. Specifically, (a) shows the results on MVTec-AD, while (b) presents the corresponding results on VisA.
To further evaluate the pixel-level localization ability of TAMCA in complex multi-class scenarios, we conduct experiments on the VisA dataset and report only pixel-level localization results. As shown in Table 4, TAMCA achieves average P-AUROC, P-AP, P-F1max, and PRO values of 97.0%, 29.6%, 36.1%, and 79.8%, respectively. These results outperform DiAD with 96.0%, 26.1%, 33.0%, and 75.2%. This indicates that TAMCA improves anomaly-region separability, threshold-based localization, and region-level coverage consistency.
VisA contains more complex variations in object appearance, defect scale, and spatial layout. It therefore places higher demands on localization stability. The improvement on VisA shows that time-aware context modulation is not limited to MVTec-AD. It can also generate stable anomaly responses in more complex multi-class industrial scenarios. In particular, the improvement in PRO indicates better region-level coverage of real defects, which helps reduce background false responses and improve boundary localization.

5. Ablation Study

5.1. Main Component Ablation

To validate the effectiveness of MSCA, MSCA-T, and DiCE, we conduct ablation studies on MVTec-AD. The results are shown in Table 5. “✓” indicates that the corresponding module is incorporated into the baseline network architecture. Overall, image-level metrics change only slightly across different configurations. The main gains are concentrated on pixel-level localization metrics. This indicates that the proposed modules improve defect localization mainly by enhancing spatial consistency and anomaly response separability in the diffusion reconstruction process, rather than simply boosting image-level anomaly scores.
Using only the baseline, the model achieves a P-AUROC of 96.4%, a P-AP of 52.3%, a P-F1max of 54.9%, and a PRO of 90.4%. Adding MSCA improves P-AP to 54.1%, P-F1max to 56.7%, and PRO to 90.9%. This shows that multi-scale context modeling with local depthwise convolution and decomposed large-kernel convolution enhances the spatial response of anomaly regions. Using MSCA-T further improves P-AUROC to 97.0%, P-AP to 56.1%, P-F1max to 57.9%, and PRO to 91.5%. These are improvements of 0.6, 3.8, 3.0, and 1.1 percentage points over the baseline, respectively. This demonstrates that mapping the timestep embedding into a gate for the large-kernel context branch better adapts the model to the reconstruction requirements of different denoising stages.
Adding DiCE to MSCA-T yields the best results in Table 5, with a P-AUROC of 97.2%, a P-AP of 56.4%, a P-F1max of 58.1%, and a PRO of 91.8%. This shows that DiCE serves as an inference-stage stabilization strategy. It further suppresses view-specific false responses through multi-view consensus and reliability weighting, improving the spatial consistency of anomaly maps.

5.2. Ablation on Time Modulation Strategies

To further verify the effectiveness of the branch-level temporal gate in MSCA-T, we construct two direct timestep-injection baselines: Add-time and Concat-time. Add-time maps the diffusion timestep embedding through a linear layer and directly adds it to MSCA features. Concat-time expands the mapped timestep embedding to the spatial dimensions, concatenates it with MSCA features, and fuses them using a 1 × 1 convolution. Unlike these generic time modulation strategies, MSCA-T does not modulate all features indiscriminately. Instead, it maps the diffusion timestep embedding into a gate and applies it only to the large-kernel context branch. This explicitly controls long-range context aggregation at different denoising stages. To avoid interference from inference-stage enhancement, DiCE is not used in this experiment.
Table 6 reports pixel-level localization results for different time modulation strategies on MVTec-AD. Compared with MSCA without time modulation, Add-time and Concat-time can introduce timestep information to some extent. However, both methods act on the entire feature map and cannot distinguish between the local detail branch and the long-range context branch. In contrast, MSCA-T uses branch-level gating to specifically adjust the contribution of the large-kernel context branch. The time condition therefore directly controls contextual aggregation. As shown in Table 6, MSCA-T outperforms both Add-time and Concat-time on all pixel-level metrics.

5.3. Visualization of Gate Coefficients

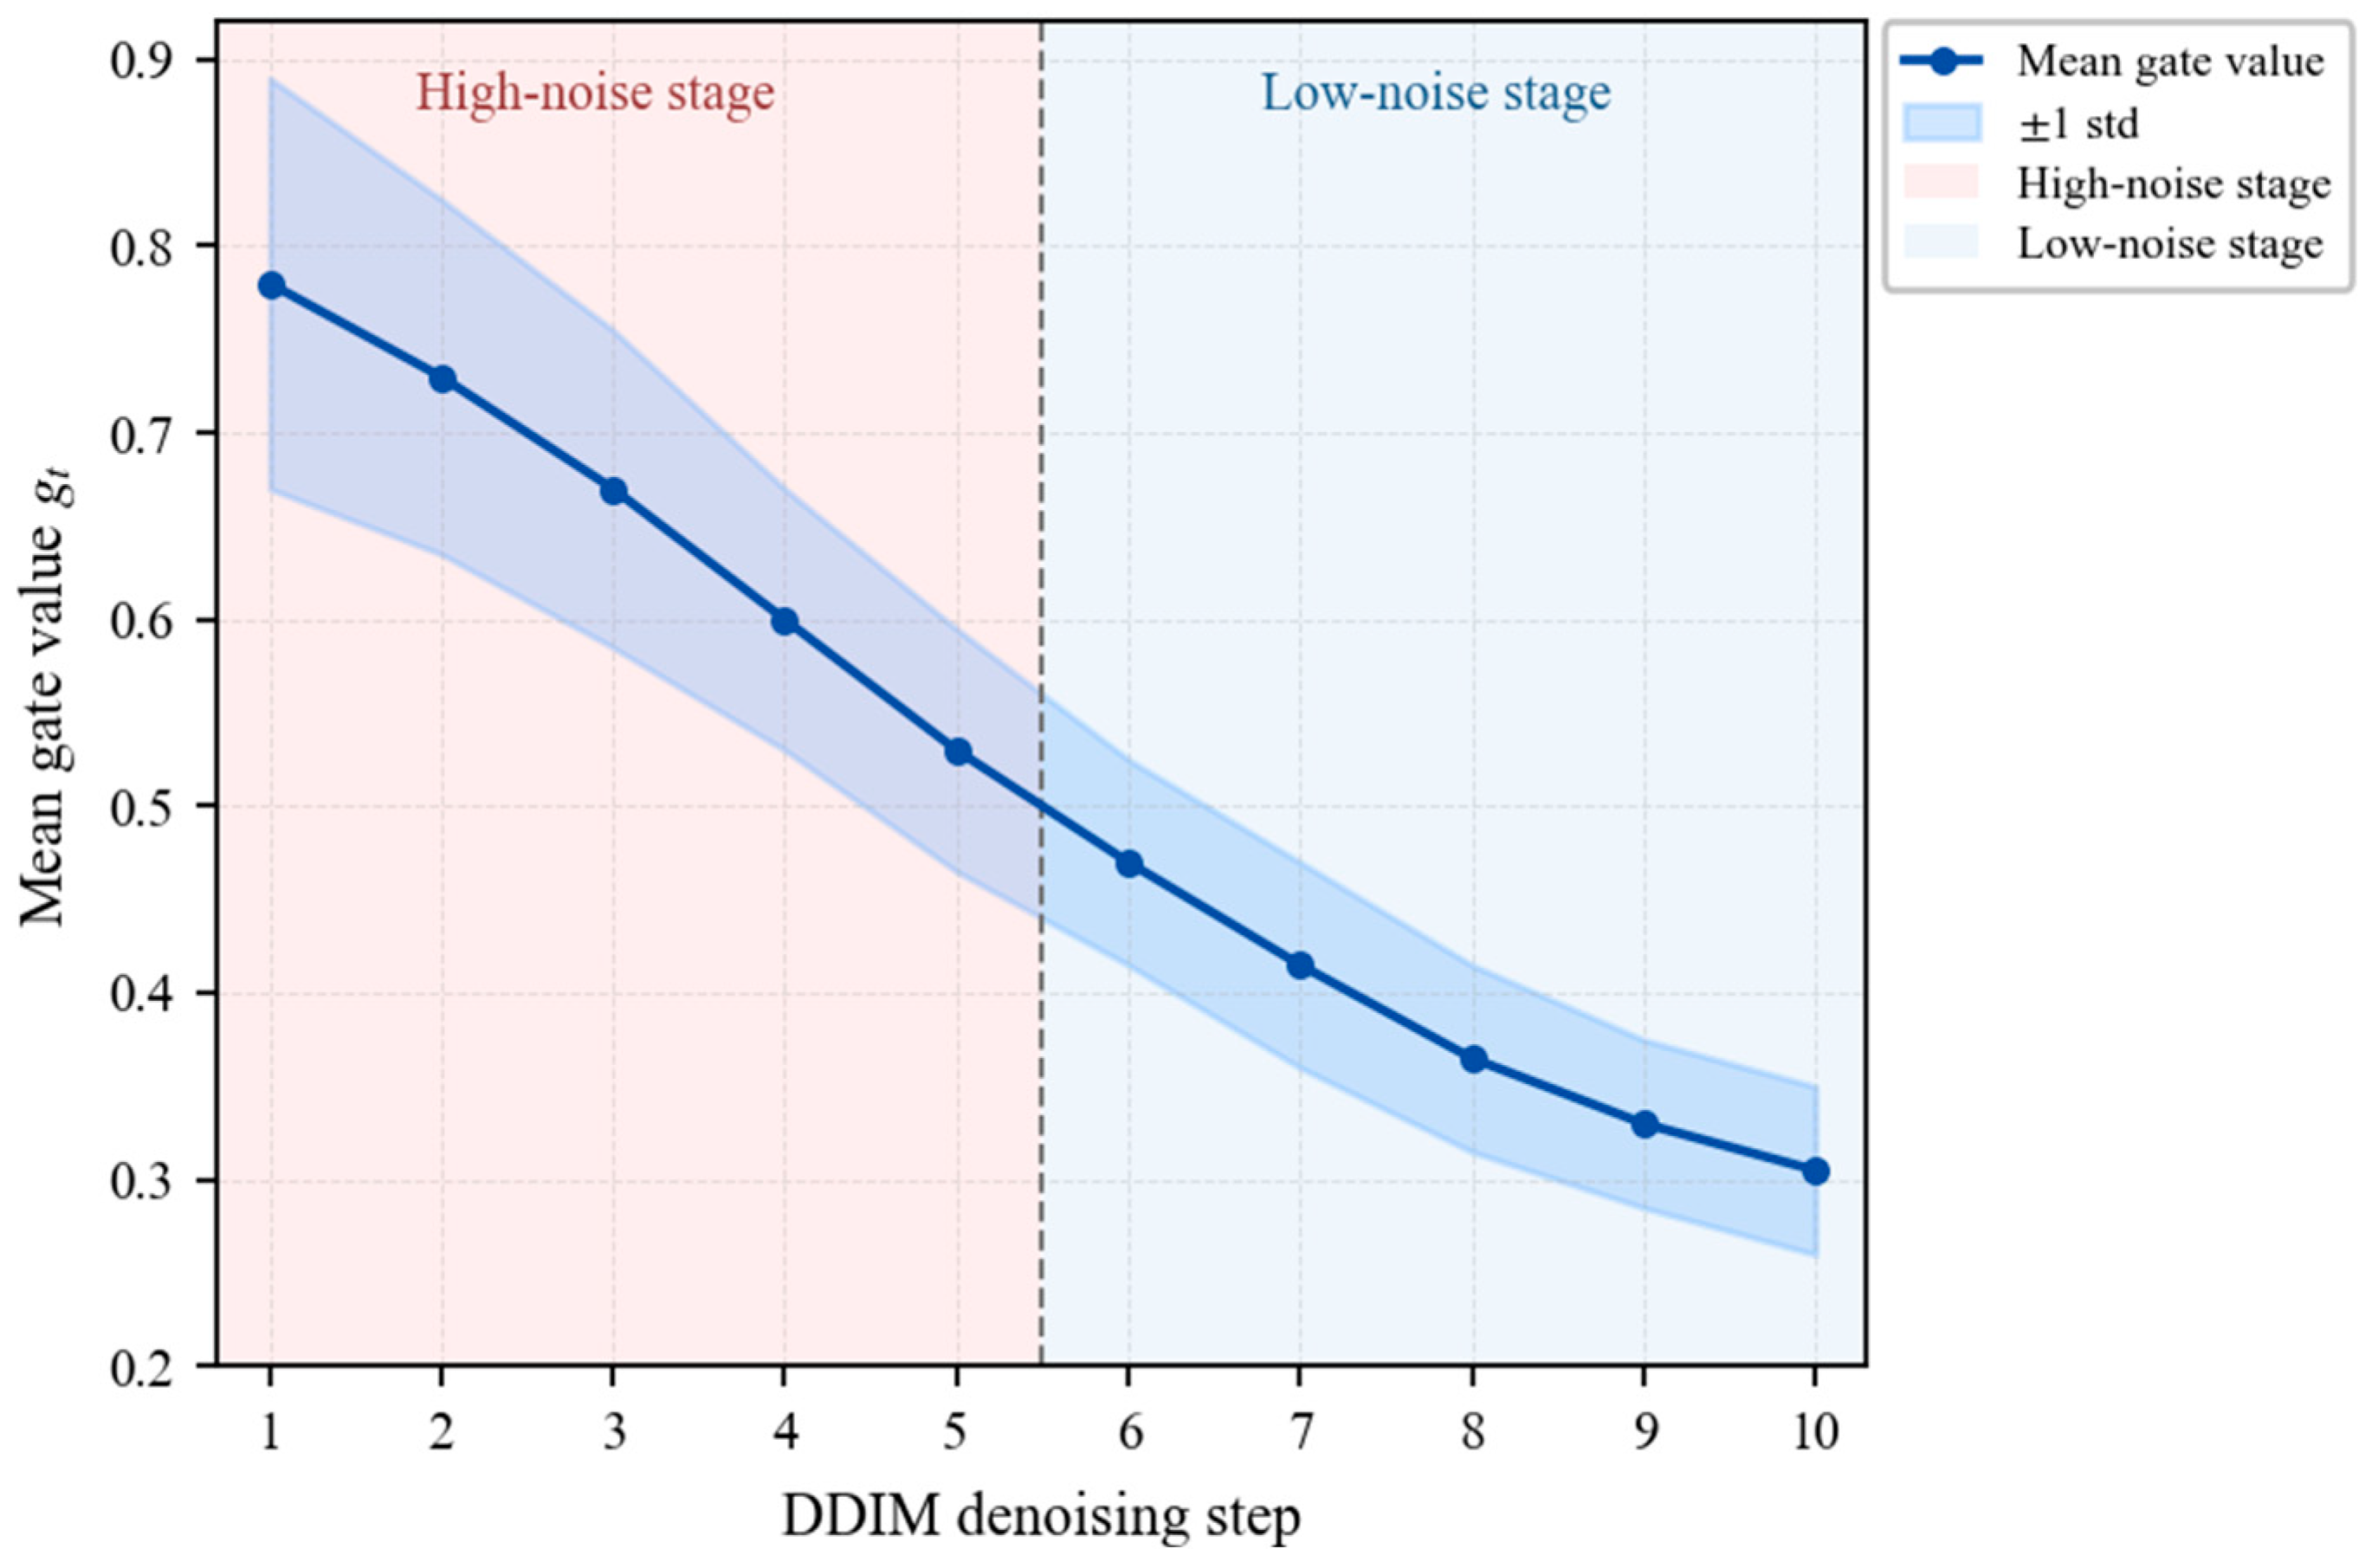
To verify whether MSCA-T learns denoising-stage-related context adjustment, we analyze the gate coefficients of the large-kernel branch at different DDIM denoising steps on the test set. During inference, we record the gate values produced by each MSCA-T module and average them over test samples and module locations. This yields the average gate curve at different denoising stages. As shown in Figure 5, the gate coefficient g t changes clearly during the denoising process. This indicates that MSCA-T can adaptively adjust the contribution of the large-kernel context branch according to the noise stage. Higher gate values at high noise levels suggest that the model tends to enhance long-range context aggregation when structural uncertainty is high. Lower gate values at low noise levels help reduce over-smoothing and preserve local boundary details.

5.4. Sensitivity Analysis on the Number of DiCE Views

To analyze the effect of view number in DiCE on pixel-level localization performance, we evaluate anomaly localization results using 1, 2, 4, and 8 views.
DiCE is applied exclusively during inference and introduces no additional trainable parameters. Therefore, the number of views does not affect model parameters or training time. The reported computational overhead is mainly reflected in GPU memory usage and inference latency.
As shown in Table 7, increasing the number of views from 1 to 4 leads to a moderate but consistent improvement in pixel-level localization performance. “N/A” indicates that training time is not applicable because DiCE is employed only during inference and does not affect the training process. P-AP increases from 56.1% to 56.4%, P-F1max from 57.9% to 58.1%, and PRO from 91.5% to 91.8%. Since DiCE is employed only during inference, varying the number of views does not introduce additional trainable parameters or affect the training process. The additional computational cost mainly arises from repeated multi-view reconstruction and anomaly-map fusion, resulting in increased inference latency and GPU memory usage. When the number of views is further increased to 8, the computational cost approximately doubles compared with the 4-view setting, while no additional performance gain is observed. Therefore, we adopt the 4-view configuration as a favorable trade-off between localization accuracy and computational efficiency.

6. Conclusions

This paper presents TAMCA, a time-aware multi-scale convolutional attention framework for multi-class industrial anomaly detection, aiming to alleviate the stage-wise mismatch between fixed contextual modeling and the varying reconstruction requirements of diffusion denoising. MSCA jointly captures local textures and long-range contextual information, while MSCA-T maps diffusion timestep embeddings to a branch-level gate that dynamically regulates the contribution of the large-kernel context branch across different noise stages. This design enables stronger structural modeling at high-noise stages while reducing excessive contextual aggregation at low-noise stages to better preserve local details and defect boundaries. During inference, DiCE further improves anomaly-map stability through median-consensus-guided reliability-weighted fusion.
Experiments on MVTec-AD and VisA show that TAMCA improves pixel-level anomaly localization while maintaining competitive image-level detection performance. The consistent gains in P-AP, P-F1max, and PRO indicate that the proposed time-aware contextual modulation better balances global structure recovery and local detail preservation across denoising stages, thereby improving defect-region separability, region-level coverage, and boundary localization quality.
Despite the promising results, several aspects can be further improved. DiCE introduces additional inference cost due to multi-view processing, and its performance may vary with the choice of geometric transformations. The current evaluation is conducted on MVTec-AD and VisA, while validation on more diverse industrial scenarios could further assess generalization. In addition, TAMCA relies on pretrained components such as the frozen VAE, whose representation capability may influence reconstruction quality. Future work will focus on improving inference efficiency, enhancing robustness to transformations, extending evaluation to broader industrial datasets, reducing dependence on pretrained components, and conducting more comprehensive statistical analysis.

Author Contributions

Writing—original draft preparation, Y.G. and X.L.; Writing—review and editing, Y.G. and H.Y.; Visualization, M.Y. and C.Z.; Supervision, J.J. and C.Z.; All authors have read and agreed to the published version of the manuscript.

Funding

This research was funded in part by the Applied Technology Engineering Center of Fujian Provincial Higher Education for Visual Perception and Intelligent Analysis, grant number SJGZ202502 and in part by the Major Science and Technology Special Project of Fujian Province, grant no. 2024HZ022013.

Institutional Review Board Statement

Not applicable.

Informed Consent Statement

Not applicable.

Data Availability Statement

The data used in this study are publicly available from the MVTec-AD and VisA database.

Conflicts of Interest

Jin Jiang is employed by Xiamen King Long United Automotive Industry Co., Ltd. The remaining authors declare that the research was conducted in the absence of any commercial or financial relationships that could be construed as a potential conflict of interest. The authors declare that this employment did not influence the design of the study, data collection, analysis, interpretation of results, writing of the manuscript, or the decision to submit the manuscript for publication. No other conflicts of interest are declared.

References

  1. Fu, Y.; Lin, A. RD-RE: Reverse Distillation with Feature Reconstruction Enhancement for Industrial Anomaly Detection. Computers 2026, 15, 21. [Google Scholar] [CrossRef] [Scilit]
  2. Liao, J.; Su, Y.; Tu, R.-C.; Jin, Z.; Sun, W.; Li, Y.; Xu, X.; Tao, D.; Yang, X. AD-FM: Multimodal LLMs for Anomaly Detection via Multi-Stage Reasoning and Fine-Grained Reward Optimization. Proc. AAAI Conf. Artif. Intell. 2026, 40, 15234–15242. [Google Scholar] [CrossRef] [Scilit]
  3. Hernandez-Jaimes, M.L.; Martinez-Cruz, A.; Ramírez-Gutiérrez, K.A.; Morales-Reyes, A. Network traffic inspection to enhance anomaly detection in the Internet of Things using attention-driven Deep Learning. Integration 2025, 103, 102398. [Google Scholar] [CrossRef] [Scilit]
  4. Wei, H.; Zhao, L.; Li, R.; Hu, G.; Zhang, M.; Ouyang, B.; Ruan, C.; Tan, J.; Xu, Y. PP-Former: Exploring Purified Intrinsic Normal Prototypes for Industrial Anomaly Detection. Knowl.-Based Syst. 2026, 331, 114759. [Google Scholar] [CrossRef] [Scilit]
  5. Li, Y.; Liu, F.; Liao, J.; Tian, S.; Foo, C.-S.; Yang, X. FIND: Few-Shot Anomaly Inspection with Normal-Only Multi-Modal Data. In Proceedings of the IEEE/CVF International Conference on Computer Vision, Honolulu, HI, USA, 19–23 October 2025; pp. 23290–23299. [Google Scholar] [CrossRef] [Scilit]
  6. Roth, K.; Pemula, L.; Zepeda, J.; Scholkopf, B.; Brox, T.; Gehler, P. Towards Total Recall in Industrial Anomaly Detection. In Proceedings of the IEEE/CVF Conference on Computer Vision and Pattern Recognition, New Orleans, LA, USA, 19–24 June 2022; pp. 14318–14328. [Google Scholar] [CrossRef] [Scilit]
  7. Kim, D.; Kim, H.; Jeong, D.; Suh, S.; Cho, H. SPACE: Spatial-Aware Consistency Regularization for Anomaly Detection in Industrial Applications. In Proceedings of the IEEE/CVF Winter Conference on Applications of Computer Vision, Tucson, AZ, USA, 28 February–4 March 2025; pp. 7184–7194. [Google Scholar] [CrossRef] [Scilit]
  8. Wu, R.; Zhu, H.; Zhang, S.; Wang, M.; Li, Z.; Li, H.; Zhou, J.; Cui, J.; Chen, F.; Sun, P.; et al. RcAE: Recursive Reconstruction Framework for Unsupervised Industrial Anomaly Detection. Proc. AAAI Conf. Artif. Intell. 2026, 40, 10736–10744. [Google Scholar] [CrossRef] [Scilit]
  9. Li, C.-L.; Sohn, K.; Yoon, J.; Pfister, T. CutPaste: Self-Supervised Learning for Anomaly Detection and Localization. In Proceedings of the IEEE/CVF Conference on Computer Vision and Pattern Recognition, Virtual, 19–25 June 2021; pp. 9664–9674. [Google Scholar] [CrossRef] [Scilit]
  10. Duan, Y.; Xu, W.; Wu, Q.; Xie, G.-S.; Zhao, F.; Shan, C. AnomalyControl: Highly-Aligned Anomalous Image Generation with Controlled Diffusion Model. In Proceedings of the 33rd ACM International Conference on Multimedia, Dublin, Ireland, 27–31 October 2025; pp. 8048–8057. [Google Scholar] [CrossRef] [Scilit]
  11. Zavrtanik, V.; Kristan, M.; Skočaj, D. DRAEM: A Discriminatively Trained Reconstruction Embedding for Surface Anomaly Detection. In Proceedings of the IEEE/CVF International Conference on Computer Vision, Virtual, 11–17 October 2021; pp. 8330–8339. [Google Scholar] [CrossRef] [Scilit]
  12. Zavrtanik, V.; Kristan, M.; Skočaj, D. DSR: A Dual Subspace Re-Projection Network for Surface Anomaly Detection. In Proceedings of the European Conference on Computer Vision, Tel Aviv, Israel, 23–27 October 2022; Springer: Cham, Switzerland, 2022; pp. 539–554. [Google Scholar] [CrossRef] [Scilit]
  13. Liu, W.; Li, R.; Zheng, M.; Karanam, S.; Wu, Z.; Bhanu, B.; Radke, R.J.; Camps, O. Towards Visually Explaining Variational Autoencoders. In Proceedings of the IEEE/CVF Conference on Computer Vision and Pattern Recognition, Seattle, WA, USA, 13–19 June 2020; pp. 8640–8649. [Google Scholar] [CrossRef] [Scilit]
  14. Zheng, B.; Gan, J.; Xu, X.; Chen, X.; Li, W.; Huang, X.; Ni, N.; Wu, Y. Bridging 3D Anomaly Localization and Repair via High-Quality Continuous Geometric Representation. In Proceedings of the IEEE/CVF International Conference on Computer Vision, Honolulu, HI, USA, 19–23 October 2025; pp. 27063–27072. [Google Scholar] [CrossRef] [Scilit]
  15. Fučka, M.; Zavrtanik, V.; Skočaj, D. SALAD: Semantics-Aware Logical Anomaly Detection. In Proceedings of the IEEE/CVF International Conference on Computer Vision, Honolulu, HI, USA, 19–23 October 2025; pp. 21843–21852. [Google Scholar] [CrossRef] [Scilit]
  16. Liang, Y.; Zhang, J.; Zhao, S.; Wu, R.; Liu, Y.; Pan, S. Omni-Frequency Channel-Selection Representations for Unsupervised Anomaly Detection. IEEE Trans. Image Process. 2023, 32, 4327–4340. [Google Scholar] [CrossRef] [Scilit] [PubMed]
  17. Lai, Z.; Lu, Y.; Li, X.; Lin, J.; Qu, Y.; Li, M.; Cao, L. AnomalyPainter: Vision-Language-Diffusion Synergy for Realistic and Diverse Unseen Industrial Anomaly Synthesis. Proc. AAAI Conf. Artif. Intell. 2026, 40, 5800–5808. [Google Scholar] [CrossRef] [Scilit]
  18. Yao, H.; Liu, M.; Yin, Z.; Yan, Z.; Hong, X.; Zuo, W. GLAD: Towards Better Reconstruction with Global and Local Adaptive Diffusion Models for Unsupervised Anomaly Detection. In Proceedings of the European Conference on Computer Vision, Milan, Italy, 29 September–4 October 2024; Springer: Cham, Switzerland, 2024; pp. 1–17. [Google Scholar] [CrossRef] [Scilit]
  19. Wu, K.; Xu, C.; Zhang, R. A Diffusion-Based Time-Frequency Dual-Stream Contrastive Learning Model for Multivariate Time Series Anomaly Detection. Entropy 2026, 28, 448. [Google Scholar] [CrossRef] [Scilit] [PubMed]
  20. Zhang, B.; Li, W.; Yu, G.; Liu, X.; Chen, W.; Tian, L. One-Step Diffusion with Inverse Residual Fields for Unsupervised Industrial Anomaly Detection. arXiv 2026, arXiv:2604.18393. [Google Scholar] [CrossRef] [Scilit]
  21. Ho, J.; Jain, A.; Abbeel, P. Denoising Diffusion Probabilistic Models. Adv. Neural Inf. Process. Syst. 2020, 33, 6840–6851. [Google Scholar] [CrossRef] [Scilit]
  22. Rombach, R.; Blattmann, A.; Lorenz, D.; Esser, P.; Ommer, B. High-Resolution Image Synthesis with Latent Diffusion Models. In Proceedings of the IEEE/CVF Conference on Computer Vision and Pattern Recognition, New Orleans, LA, USA, 19–24 June 2022; pp. 10684–10695. [Google Scholar] [CrossRef] [Scilit]
  23. Yi, J.; Yoon, S. Patch SVDD: Patch-Level SVDD for Anomaly Detection and Segmentation. In Proceedings of the Asian Conference on Computer Vision, Kyoto, Japan, 30 November–4 December 2020; Springer: Cham, Switzerland, 2021; Volume 12627, pp. 375–390. [Google Scholar] [CrossRef] [Scilit]
  24. Lin, Y.; Yan, H.; Tong, X.; Chang, Y.; Wang, H.; Zhou, Z.; Gao, S.; Wang, Y.; Zhang, W. Commonality in Few: Few-Shot Multimodal Anomaly Detection via Hypergraph-Enhanced Memory. Proc. AAAI Conf. Artif. Intell. 2026, 40, 7015–7023. [Google Scholar] [CrossRef] [Scilit]
  25. Defard, T.; Setkov, A.; Loesch, A.; Audigier, R. PaDiM: A Patch Distribution Modeling Framework for Anomaly Detection and Localization. In Proceedings of the International Conference on Pattern Recognition Workshops, Virtual, 10–15 January 2021; Springer: Cham, Switzerland, 2021; pp. 475–489. [Google Scholar] [CrossRef] [Scilit]
  26. Huang, C.; Guan, H.; Jiang, A.; Zhang, Y.; Spratling, M.; Wang, Y.-F. Registration Based Few-Shot Anomaly Detection. In Proceedings of the European Conference on Computer Vision, Tel Aviv, Israel, 23–27 October 2022; Springer: Cham, Switzerland, 2022; pp. 303–319. [Google Scholar] [CrossRef] [Scilit]
  27. Hinton, G.E.; Salakhutdinov, R.R. Reducing the Dimensionality of Data with Neural Networks. Science 2006, 313, 504–507. [Google Scholar] [CrossRef] [Scilit] [PubMed]
  28. Kingma, D.P.; Welling, M. Auto-Encoding Variational Bayes. arXiv 2013, arXiv:1312.6114. [Google Scholar] [CrossRef] [Scilit]
  29. Schlegl, T.; Seeböck, P.; Waldstein, S.M.; Schmidt-Erfurth, U.; Langs, G. Unsupervised Anomaly Detection with Marker Discovery. In Proceedings of the Information Processing in Medical Imaging, Boone, NC, USA, 25–30 June 2017; Springer: Cham, Switzerland, 2017; pp. 146–157. [Google Scholar] [CrossRef] [Scilit]
  30. You, Z.; Cui, L.; Shen, Y.; Yang, K.; Lu, X.; Zheng, Y.; Le, X. A Unified Model for Multi-Class Anomaly Detection. Adv. Neural Inf. Process. Syst. 2022, 35, 4571–4584. [Google Scholar] [CrossRef] [Scilit]
  31. Song, J.; Meng, C.; Ermon, S. Denoising Diffusion Implicit Models. arXiv 2020, arXiv:2010.02502. [Google Scholar] [CrossRef] [Scilit]
  32. Liu, Y.; Wang, Y.; Dai, Y.; Liu, X.; Li, Y.; Chen, B.; Hu, D. Spatially-Grounded Diffusion for Few-Shot Anomaly Image Generation. arXiv 2026, arXiv:2604.08301. [Google Scholar] [CrossRef] [Scilit]
  33. Lu, F.; Yao, X.; Fu, C.-W.; Jia, J. Removing Anomalies as Noises for Industrial Defect Localization. In Proceedings of the IEEE/CVF International Conference on Computer Vision, Paris, France, 2–6 October 2023; pp. 16166–16175. [Google Scholar] [CrossRef] [Scilit]
  34. Zhang, X.; Li, N.; Li, J.; Dai, T.; Jiang, Y.; Xia, S.-T. Unsupervised Surface Anomaly Detection with Diffusion Probabilistic Model. In Proceedings of the IEEE/CVF International Conference on Computer Vision, Paris, France, 2–6 October 2023; pp. 6759–6768. [Google Scholar] [CrossRef] [Scilit]
  35. Mousakhan, A.; Brox, T.; Tayyub, J. Anomaly Detection with Conditioned Denoising Diffusion Models. In Proceedings of the DAGM German Conference on Pattern Recognition, Munich, Germany, 10–13 September 2024; Springer: Cham, Switzerland, 2024; pp. 181–195. [Google Scholar] [CrossRef] [Scilit]
  36. He, H.; Zhang, J.; Chen, H.; Chen, X.; Li, Z.; Chen, X.; Wang, Y.; Wang, C.; Xie, L. A Diffusion-Based Framework for Multi-Class Anomaly Detection. Proc. AAAI Conf. Artif. Intell. 2024, 38, 8472–8480. [Google Scholar] [CrossRef] [Scilit]
  37. Bergmann, P.; Fauser, M.; Sattlegger, D.; Steger, C. MVTec AD: A Comprehensive Real-World Dataset for Unsupervised Anomaly Detection. In Proceedings of the IEEE/CVF Conference on Computer Vision and Pattern Recognition, Long Beach, CA, USA, 16–20 June 2019; pp. 9592–9600. [Google Scholar] [CrossRef] [Scilit]
  38. Zou, Y.; Jeong, J.; Pemula, L.; Zhang, D.; Dabeer, O. Spot-the-Difference Self-Supervised Pre-Training for Anomaly Detection and Segmentation. In Proceedings of the European Conference on Computer Vision, Tel Aviv, Israel, 23–27 October 2022; Springer: Cham, Switzerland, 2022; pp. 392–408. [Google Scholar] [CrossRef] [Scilit]
  39. He, H.; Bai, Y.; Zhang, J.; He, Q.; Chen, H.; Gan, Z.; Wang, C.; Li, X.; Tian, G.; Xie, L. MambaAD: Exploring State Space Models for Multi-Class Unsupervised Anomaly Detection. Adv. Neural Inf. Process. Syst. 2024, 37, 71162–71187. [Google Scholar] [CrossRef] [Scilit]
  40. Luo, W.; Cao, Y.; Yao, H.; Zhang, X.; Lou, J.; Cheng, Y.; Shen, W.; Yu, W. Exploring Intrinsic Normal Prototypes within a Single Image for Universal Anomaly Detection. In Proceedings of the IEEE/CVF Conference on Computer Vision and Pattern Recognition, Nashville, TN, USA, 11–15 June 2025; pp. 9974–9983. [Google Scholar] [CrossRef] [Scilit]
  41. Gu, Z.; Liu, L.; Chen, X.; Yi, R.; Zhang, J.; Wang, Y.; Wang, C.; Shu, A.; Jiang, G.; Ma, L. Remembering Normality: Memory-Guided Knowledge Distillation for Unsupervised Anomaly Detection. In Proceedings of the IEEE/CVF International Conference on Computer Vision, Paris, France, 2–6 October 2023; pp. 16401–16409. [Google Scholar] [CrossRef] [Scilit]
  42. Deng, H.; Li, X. Anomaly Detection via Reverse Distillation from One-Class Embedding. In Proceedings of the IEEE/CVF Conference on Computer Vision and Pattern Recognition, New Orleans, LA, USA, 19–24 June 2022; pp. 9737–9746. [Google Scholar] [CrossRef] [Scilit]
Figure 1. Latent diffusion reconstruction pipeline of TAMCA.
Eng 07 00480 g001
Figure 2. Illustration of MSCA and MSCA-T.
Eng 07 00480 g002
Figure 3. Diffusion-aware Consistency Ensembling strategy.
Eng 07 00480 g003
Figure 4. Qualitative anomaly localization results: (a) on the MVTec-AD dataset and (b) on the VisA dataset.
Eng 07 00480 g004
Figure 5. Trend analysis of large-kernel branch gate coefficients across DDIM denoising steps.
Eng 07 00480 g005
Table 1. Image-level results A U R O C / A P / F 1 max on the MVTec-AD dataset and comparison with representative methods.
CategoryNon-Diffusion MethodDiffusion-Based Method
PaDiM [25]MKD
[41]
RD4AD
[42]
UniAD
[30]
DRAEM
[11]
DDPM
[21]
LDM
[22]
DiAD
[36]
Ours
Bottle97.9/-98.7/-99.6/99.9/98.499.7/100./100.97.5/99.2/96.163.6/71.8/86.393.8/98.7/93.799.7/96.5/91.899.3/99.9/99.7
Capsule73.4/-68.3/-94.1/96.9/96.986.9/97.8/94.465.3/92.5/90.452.9/82.0/90.560.5/81.4/90.589.0/97.5/95.595.6/97.9/88.7
Metal nut88.0/-64.9/-100./100./99.599.2/99.9/99.572.8/95.0/92.060.0/74.4/89.453.0/80.1/89.499.1/96.0/91.697.5/99.8/98.9
Hazelnut85.5/-97.1/-60.8/69.8/86.499.8/100./99.393.7/97.5/92.387.0/90.4/88.193.0/95.8/89.899.5/99.7/97.397.5/99.5/99.1
Pill68.8/-79.7/-97.5/99.6/96.893.7/98.7/95.782.2/94.9/92.455.8/84.0/91.662.1/93.1/91.695.7/98.5/94.597.6/99.6/96.7
Transistor86.6/-73.4/-94.2/95.2/90.099.8/98.0/93.874.8/77.4/71.157.8/44.6/57.161.0/57.8/59.199.8/99.6/97.497.5/99.8/99.8
Screw56.9/-75.6/-97.7/99.3/95.887.5/96.5/89.092.0/95.7/89.953.6/71.9/85.958.7/81.9/85.690.7/99.7/97.990.8/94.3/86.1
Cable70.9/-78.2/-84.1/89.5/82.595.2/95.9/88.057.8/74.0/76.355.6/69.7/76.055.7/74.8/77.794.8/98.8/95.293.2/97.2/95.5
Zipper79.7/-87.4/-99.5/99.9/99.295.8/99.5/97.198.8/99.9/99.264.9/77.4/88.173.6/89.5/90.695.1/99.1/94.497.7/98.9/94.4
Toothbrush95.3/-75.3/-97.2/99.0/94.794.2/97.4/95.290.6/96.8/90.057.5/68.0/83.378.6/83.9/83.399.7/99.9/99.297.9/99.6/99.8
Carpet93.8/-69.8/-98.5/99.6/97.299.8/99.9/99.498.0/99.1/96.795.5/98.7/91.099.4/99.8/99.499.4/99.9/98.399.8/99.9/99.8
Leather99.9/-93.6/-100./100./100.100./100./100.98.7/99.3/95.098.4/99.5/96.397.4/99.0/96.399.8/99.7/97.6100./100./100.
Tile93.3/-89.5/-98.3/99.3/96.499.3/99.8/98.299.8/100./100.93.6/97.5/92.097.1/98.7/94.196.8/99.9/98.495.5/99.6/98.9
Grid73.9/-83.8/-98.0/99.4/96.598.2/99.5/97.399.3/99.7/98.283.5/93.9/86.967.3/82.6/84.498.5/99.8/97.799.3/99.8/98.6
Wood98.4/-93.4/-99.2/99.8/98.398.6/99.6/96.699.8/100./100.98.6/99.6/97.597.8/99.4/95.999.7/100./100.98.9/99.8/99.4
Average84.2/-81.9/-94.6/96.5/95.296.5/98.8/96.288.1/94.7/92.071.9/81.6/86.676.6/87.8/88.197.2/99.0/96.597.2/99.0/97.0
Table 2. Pixel-level results A U R O C / A P / F 1 max on the MVTec-AD dataset and comparison with representative methods.
CategoryNon-Diffusion MethodDiffusion-Based Method
PaDiM [25]MKD
[41]
RD4AD
[42]
UniAD
[30]
DRAEM
[11]
DDPM
[21]
LDM
[22]
DiAD
[36]
Ours
Bottle96.1/-91.8/-97.8/68.2/67.698.1/66.0/69.287.6/62.5/56.959.9/4.9/11.786.9/49.1/50.098.4/52.2/54.896.8/48.2/53.5
Capsule96.9/-88.3/-98.8/43.4/50.098.5/42.7/46.550.5/6.0/10.063.1/6.2/9.790.0/7.9/27.397.1/42.0/45.397.4/44.9/47.4
Metal nut84.8/-64.2/-93.8/62.3/65.494.8/55.5/66.462.2/31.1/21.062.7/14.6/29.270.5/19.3/30.797.3/30.0/38.397.5/79.9/82.3
Hazelnut96.3/-91.2/-97.9/36.2/51.698.1/55.2/56.896.9/70.0/60.591.2/24.1/28.395.1/51.2/53.598.3/79.2/80.498.5/65.0/61.7
Pill87.7/-69.7/-97.5/63.4/65.295.0/44.0/53.994.4/59.1/44.155.3/4.0/8.474.9/10.2/15.095.7/46.0/51.493.1/64.4/48.6
Transistor92.3/-71.7/-85.9/42.3/45.297.9/59.5/64.664.5/23.6/15.153.2/5.8/11.485.5/25.0/30.795.1/15.6/31.796.1/60.3/64.7
Screw94.1/-92.1/-99.4/40.2/44.698.3/28.7/37.695.5/33.8/40.691.1/1.8/3.891.7/2.2/4.697.9/60.6/59.698.1/33.8/63.4
Cable81.0/-89.3/-85.1/26.3/33.697.3/39.9/45.271.3/14.7/17.866.5/6.7/10.689.3/18.5/26.296.8/50.1/57.897.7/50.1/54.9
Zipper94.8/-86.1/-98.5/53.9/60.396.8/40.1/49.998.3/74.3/69.367.4/3.5/7.666.9/5.3/7.496.2/60.7/60.098.8/52.8/55.5
Toothbrush95.6/-88.9/-99.0/53.6/58.898.4/34.9/45.797.7/55.2/55.876.9/4.0/7.793.7/20.4/9.899.0/78.7/72.899.1/68.7/64.8
Carpet97.6/-95.5/-99.0/58.5/60.498.5/49.9/51.198.6/78.7/73.189.2/18.8/44.399.1/70.6/66.098.6/42.2/46.499.1/79.7/61.8
Leather84.8/-96.7/-99.3/38.0/45.198.8/32.9/34.497.3/60.3/57.497.3/38.9/43.299.0/45.9/44.098.8/56.1/62.398.9/45.7/59.5
Tile80.5/-85.3/-95.3/48.5/60.591.8/42.1/50.698.0/93.6/86.087.0/35.2/36.690.1/43.9/51.692.4/65.7/64.194.3/56.8/53.9
Grid71.0/-82.3/-99.2/46.0/47.496.5/23.0/28.498.7/44.5/46.263.1/0.7/1.952.4/1.1/1.996.6/66.0/64.199.4/49.5/51.3
Wood89.1/-80.5/-95.3/47.8/51.093.2/37.2/41.596.0/81.4/74.684.7/30.9/37.392.3/44.1/46.693.3/43.3/43.593.2/46.7/48.7
Average89.5/-84.9/-96.1/48.6/53.896.8/43.4/49.587.2/52.5/48.673.9/13.3/19.585.1/27.6/31.096.8/52.6/55.597.2/56.4/58.1
Table 3. Multi-class anomaly localization results on MVTec-AD measured by PRO.
Non-Diffusion MethodDiffusion-Based Method
RD4AD
[42]
UniAD
[30]
DRAEM
[11]
DDPM
[21]
LDM
[22]
DiAD
[36]
Ours
PRO91.190.771.149.066.390.791.8
Table 4. Pixel-level results A U R O C / A P / F 1 max /PRO on the VisA dataset and comparison with representative methods.
CategoryNon-Diffusion MethodDiffusion-Based Method
UniAD
[30]
DRAEM
[11]
DDPM
[21]
LDM
[22]
DiAD
[36]
Ours
PCB193.3/3.9/8.3/64.194.6/31.8/37.2/52.875.7/1.1/2.8/36.184.5/2.1/4.9/54.398.7/49.6/52.8/80.299.2/58.1/61.0/82.4
PCB293.9/4.2/9.2/66.992.3/10.0/18.6/66.276.2/0.7/1.6/30.889.5/2.5/6.7/52.795.2/7.5/16.7/67.097.3/11.2/17.8/78.7
PCB397.3/13.8/21.9/70.690.8/14.1/24.4/42.983.3/1.0/2.5/56.194.4/9.2/17.4/67.896.7/8.0/18.8/68.998.0/16.1/24.1/75.1
PCB494.9/14.7/22.9/72.394.4/31.0/37.6/75.773.0/1.4/3.5/29.980.4/2.1/4.2/40.397.0/17.6/27.2/85.098.1/26.1/28.9/89.3
Macaroni197.4/3.7/9.7/84.095.0/19.1/24.1/67.087.4/0.4/1.0/61.281.6/0.3/1.3/47.394.1/10.2/16.7/68.594.6/10.2/15.3/69.8
Macaroni295.2/0.9/4.3/76.694.6/3.9/12.4/65.284.8/0.2/0.6/54.187.2/0.3/0.6/57.293.6/0.9/2.8/73.195.5/4.0/4.4/79.6
Capsules88.7/3.0/7.4/43.797.1/27.8/33.7/62.877.1/1.1/2.8/34.675.5/1.1/2.7/34.897.3/10.0/21.0/77.998.6/17.5/31.9/81.6
Candle98.5/17.6/27.9/91.682.2/10.1/19.0/65.676.4/0.4/1.4/34.185.3/0.9/1.9/46.897.3/12.8/22.8/89.497.9/17.2/22.6/90.8
Cashew98.6/51.7/58.3/87.980.7/9.9/15.7/38.574.5/2.7/5.2/58.790.5/5.1/10.1/68.390.9/53.1/60.9/61.891.7/48.1/52.9/73.1
Chewing gum98.8/54.9/56.1/81.391.0/62.3/63.3/40.974.7/1.4/2.8/37.984.1/3.1/6.9/52.994.7/11.9/25.8/59.596.4/51.5/51.9/63.6
Fryum95.9/34.0/40.6/76.292.4/38.8/38.5/69.585.7/9.4/17.2/58.489.9/14.8/24.8/60.197.6/58.6/60.1/81.397.5/58.9/57.2/82.7
Pipe fryum98.9/50.2/57.7/91.591.1/38.1/39.6/61.887.0/6.9/12.9/69.696.4/31.0/37.2/77.699.4/72.7/69.9/89.999.2/36.3/65.0/91.8
Average95.9/21.0/27.0/75.691.3/24.7/30.3/59.079.7/2.2/4.5/46.886.6/6.0/9.9/55.096.0/26.1/33.0/75.297.0/29.6/36.1/79.8
Table 5. Main component ablation study.
BaselineMSCAMSCA-TDiCE I A U R O C I A P I F 1 m a x P A U R O C P A P P F 1 m a x PRO
96.798.796.396.452.354.990.4
96.998.896.696.754.156.790.9
97.098.996.796.854.757.091.1
97.098.896.797.056.157.991.5
97.299.097.097.256.458.191.8
Table 6. Ablation study on time modulation strategies.
MSCA+Add-Time+Concat-TimeMSCA-T P A U R O C P A P P F 1 m a x PRO
96.754.156.790.9
96.854.656.991.0
96.955.357.391.2
97.256.157.991.5
Table 7. Sensitivity analysis on the number of DiCE views.
ViewsParams (M)Peak GPU Memory (GB)Training TimeInference Time (ms/image) P A U R O C P A P P F 1 m a x PRO
186513.2N/A42097.056.157.991.5
286513.8N/A81097.056.258.091.6
486515.1N/A157097.256.458.191.8
886517.5N/A308097.256.358.191.7
Disclaimer/Publisher’s Note: The statements, opinions and data contained in all publications are solely those of the individual author(s) and contributor(s) and not of MDPI and/or the editor(s). MDPI and/or the editor(s) disclaim responsibility for any injury to people or property resulting from any ideas, methods, instructions or products referred to in the content.