3.1. Experimental Results: Comparison of Equivalent-Circuit Models with Measured Harmonic Impedance Characteristics
Based on the methodology described in
Section 2.1 and
Section 2.2, the dependences
R(
n) and
X(
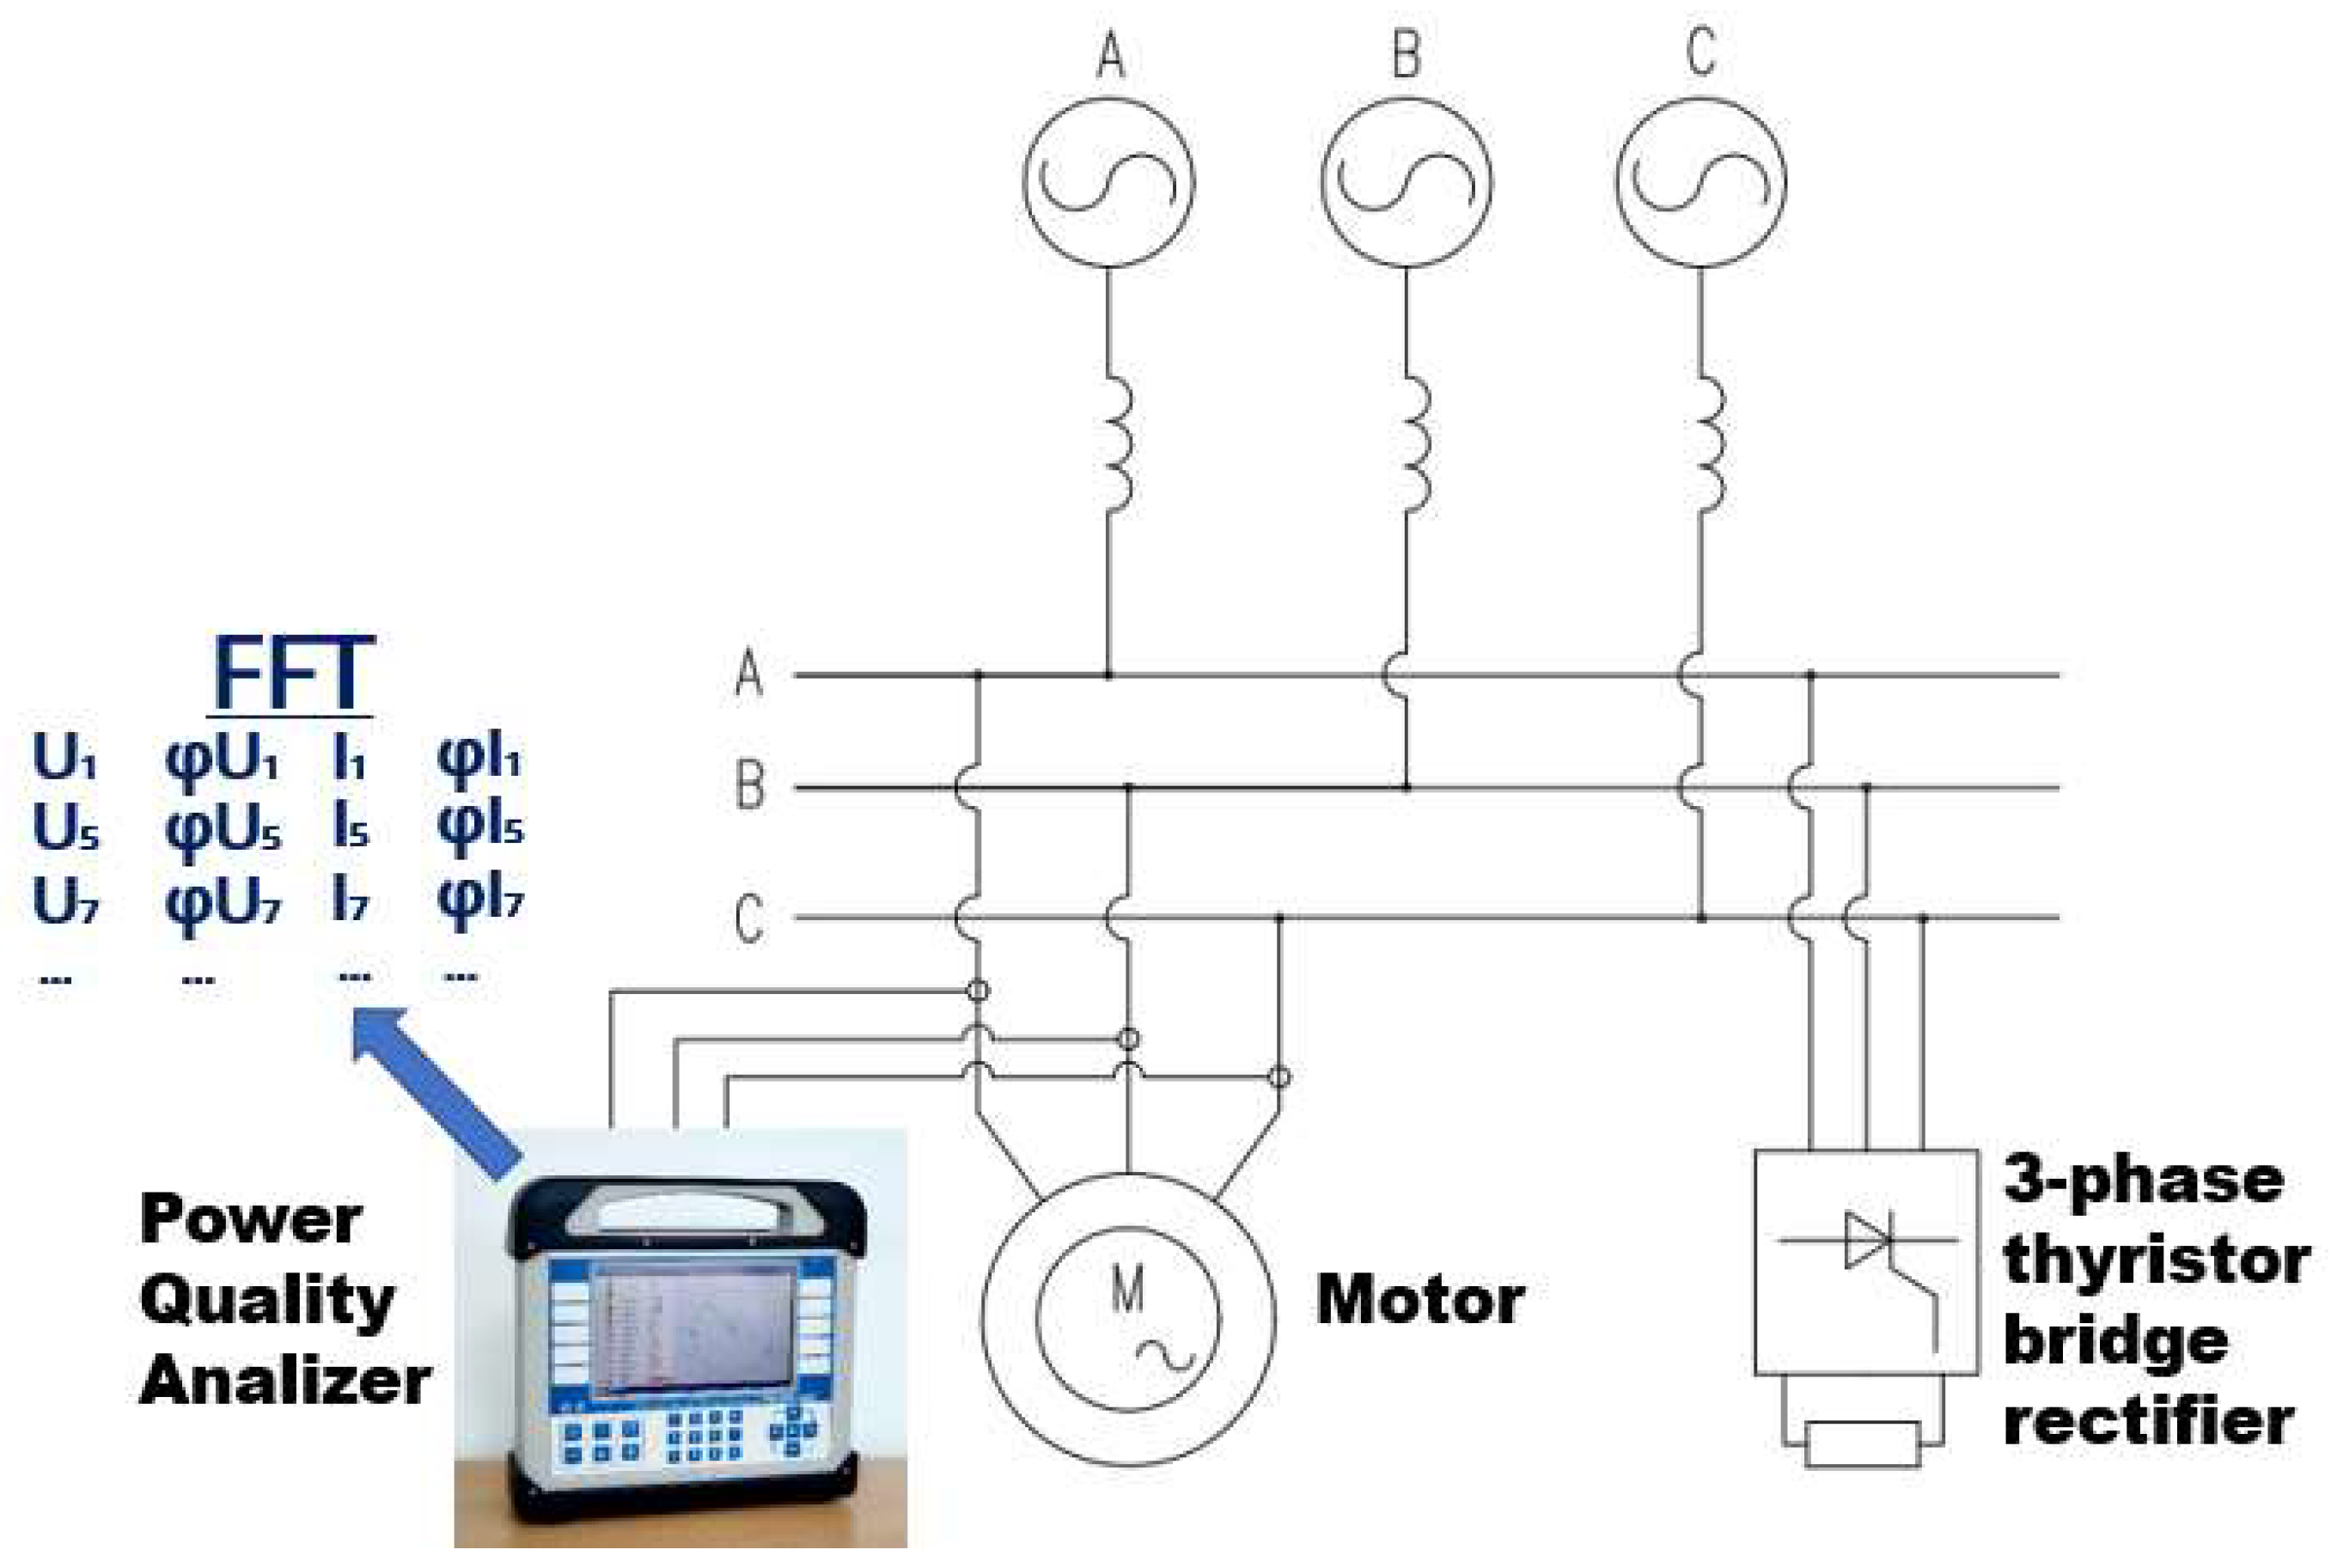
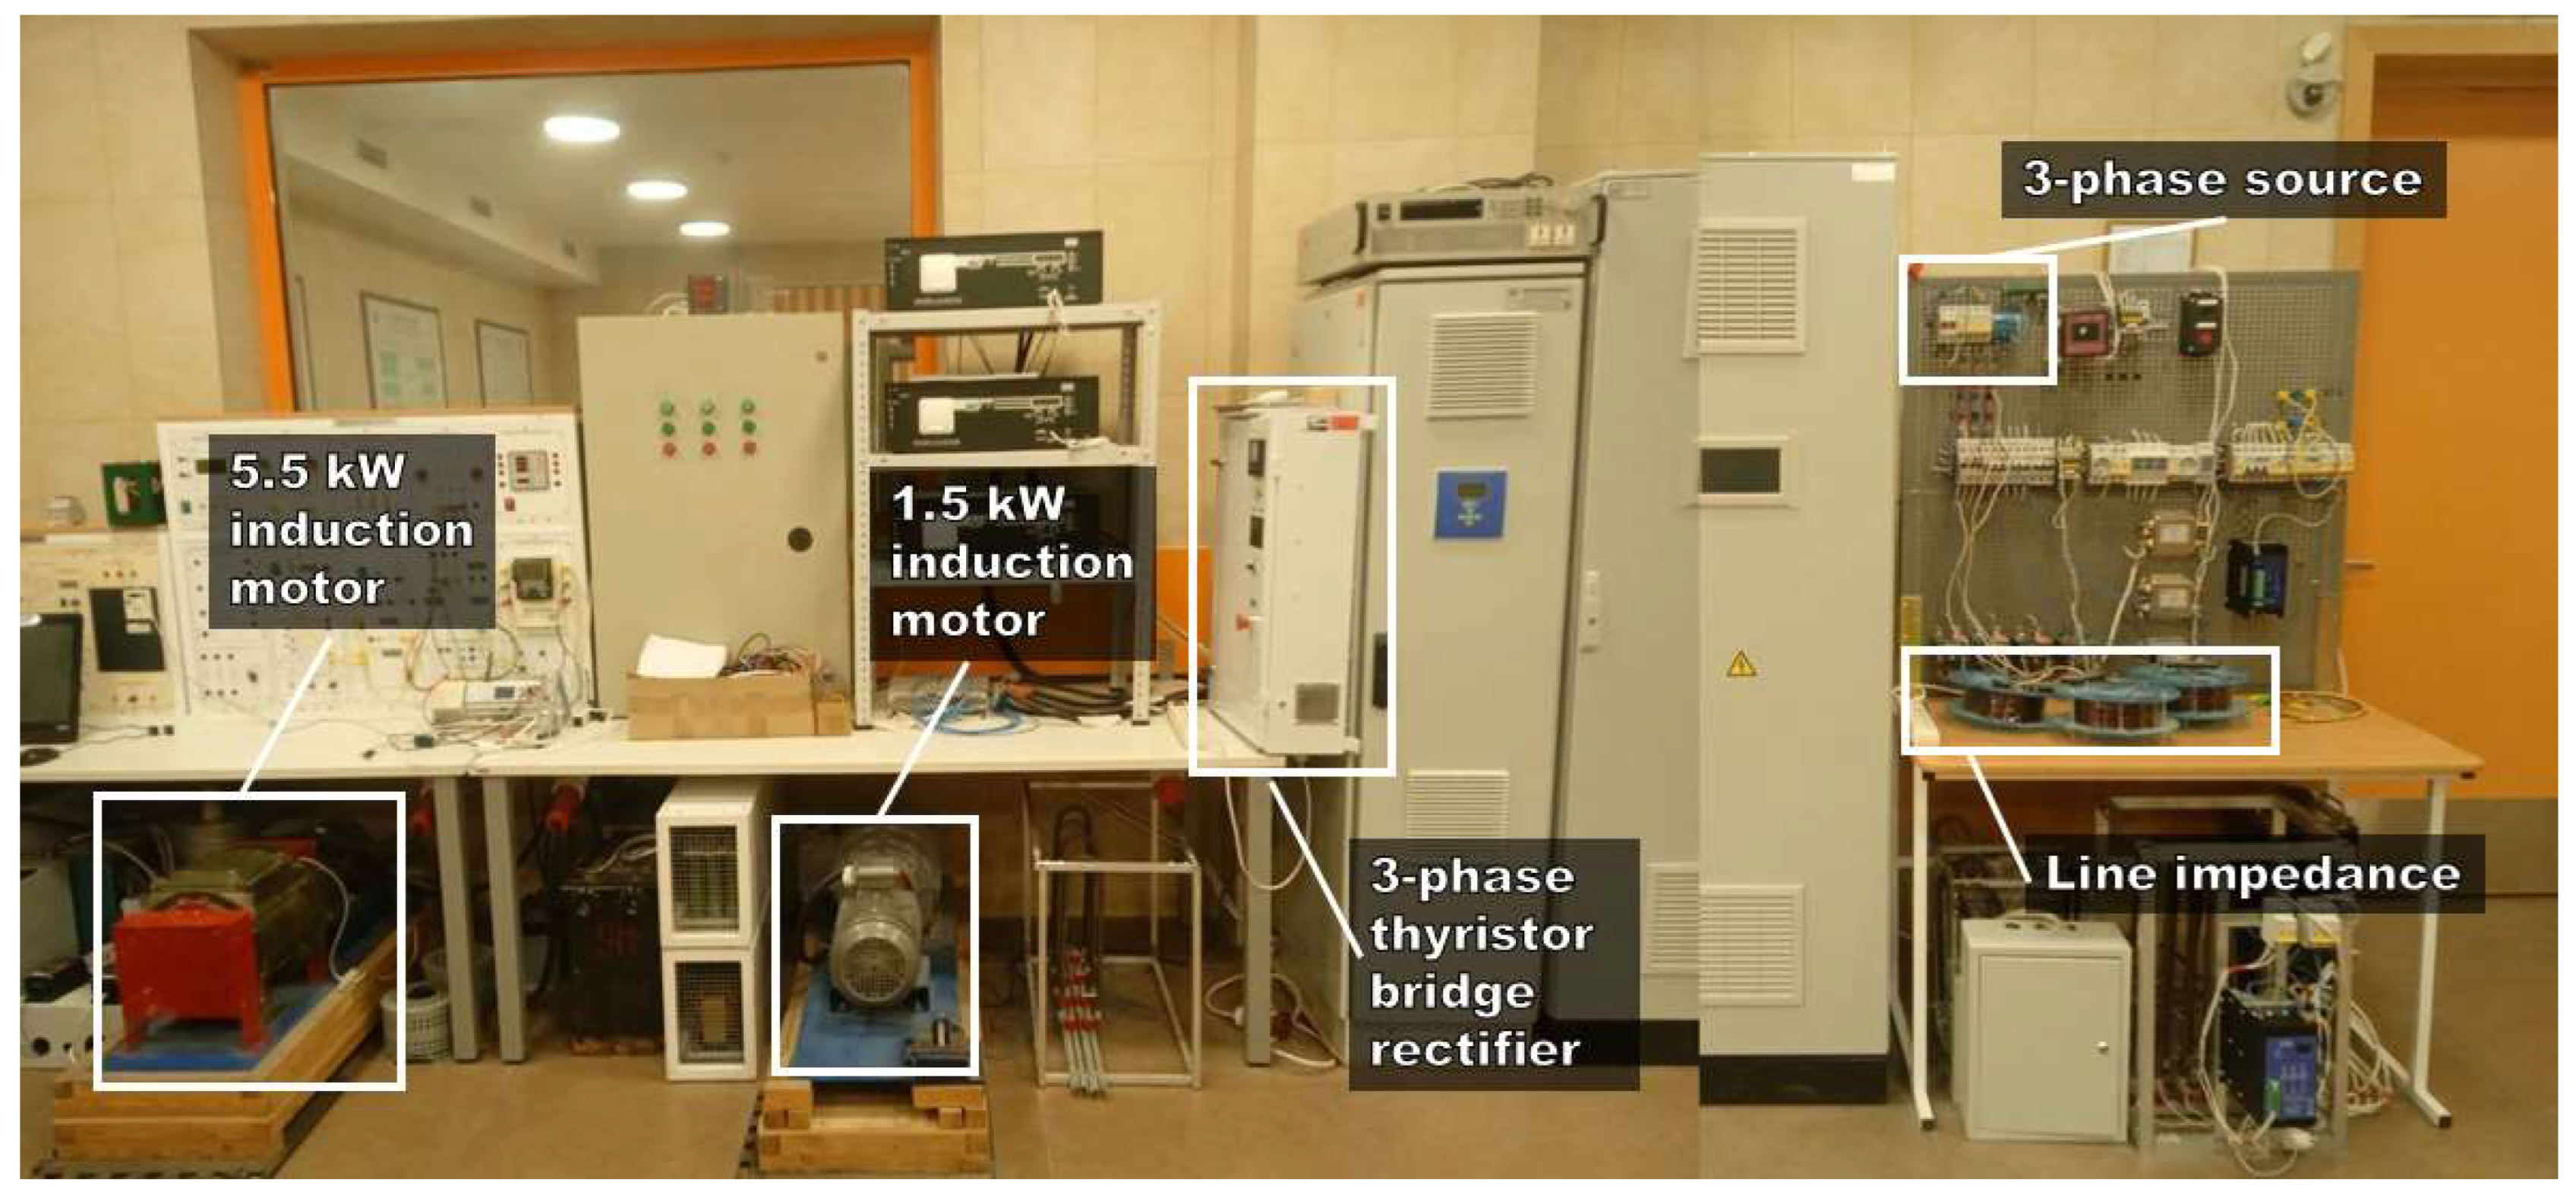
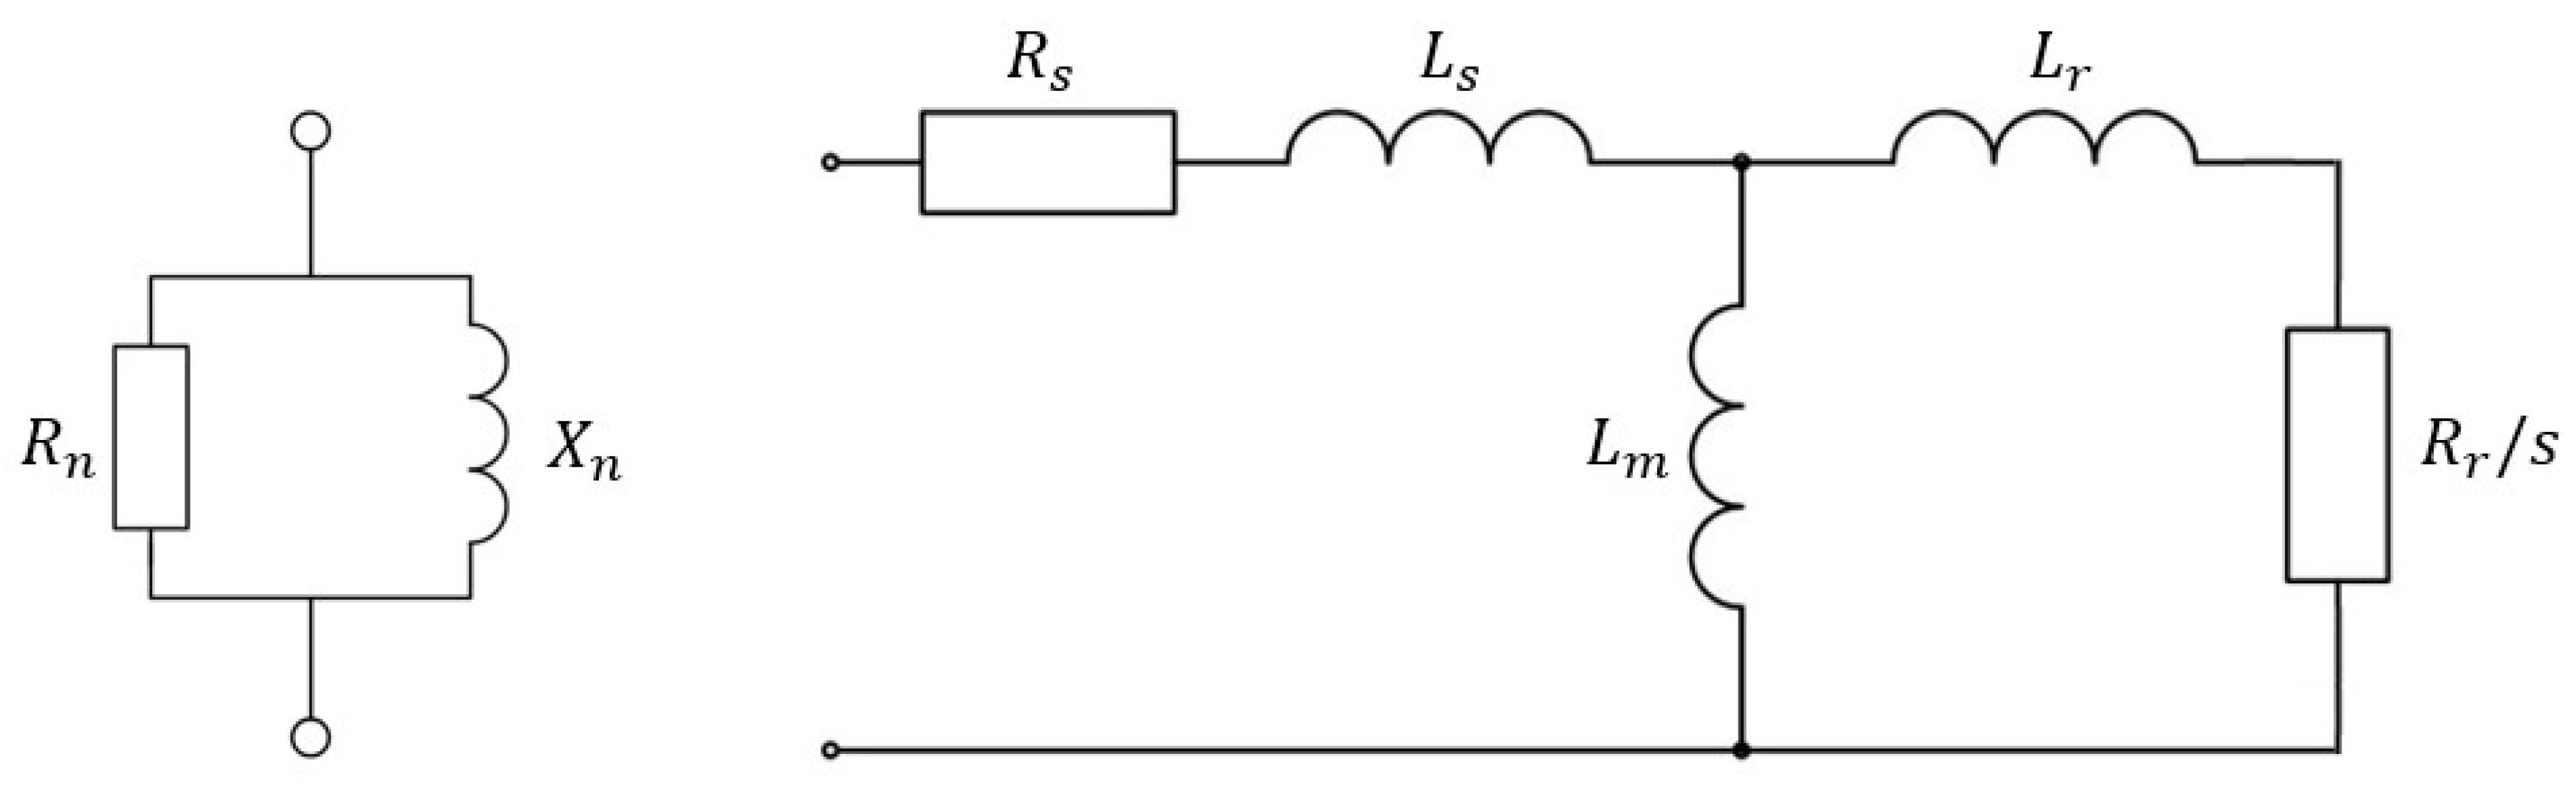
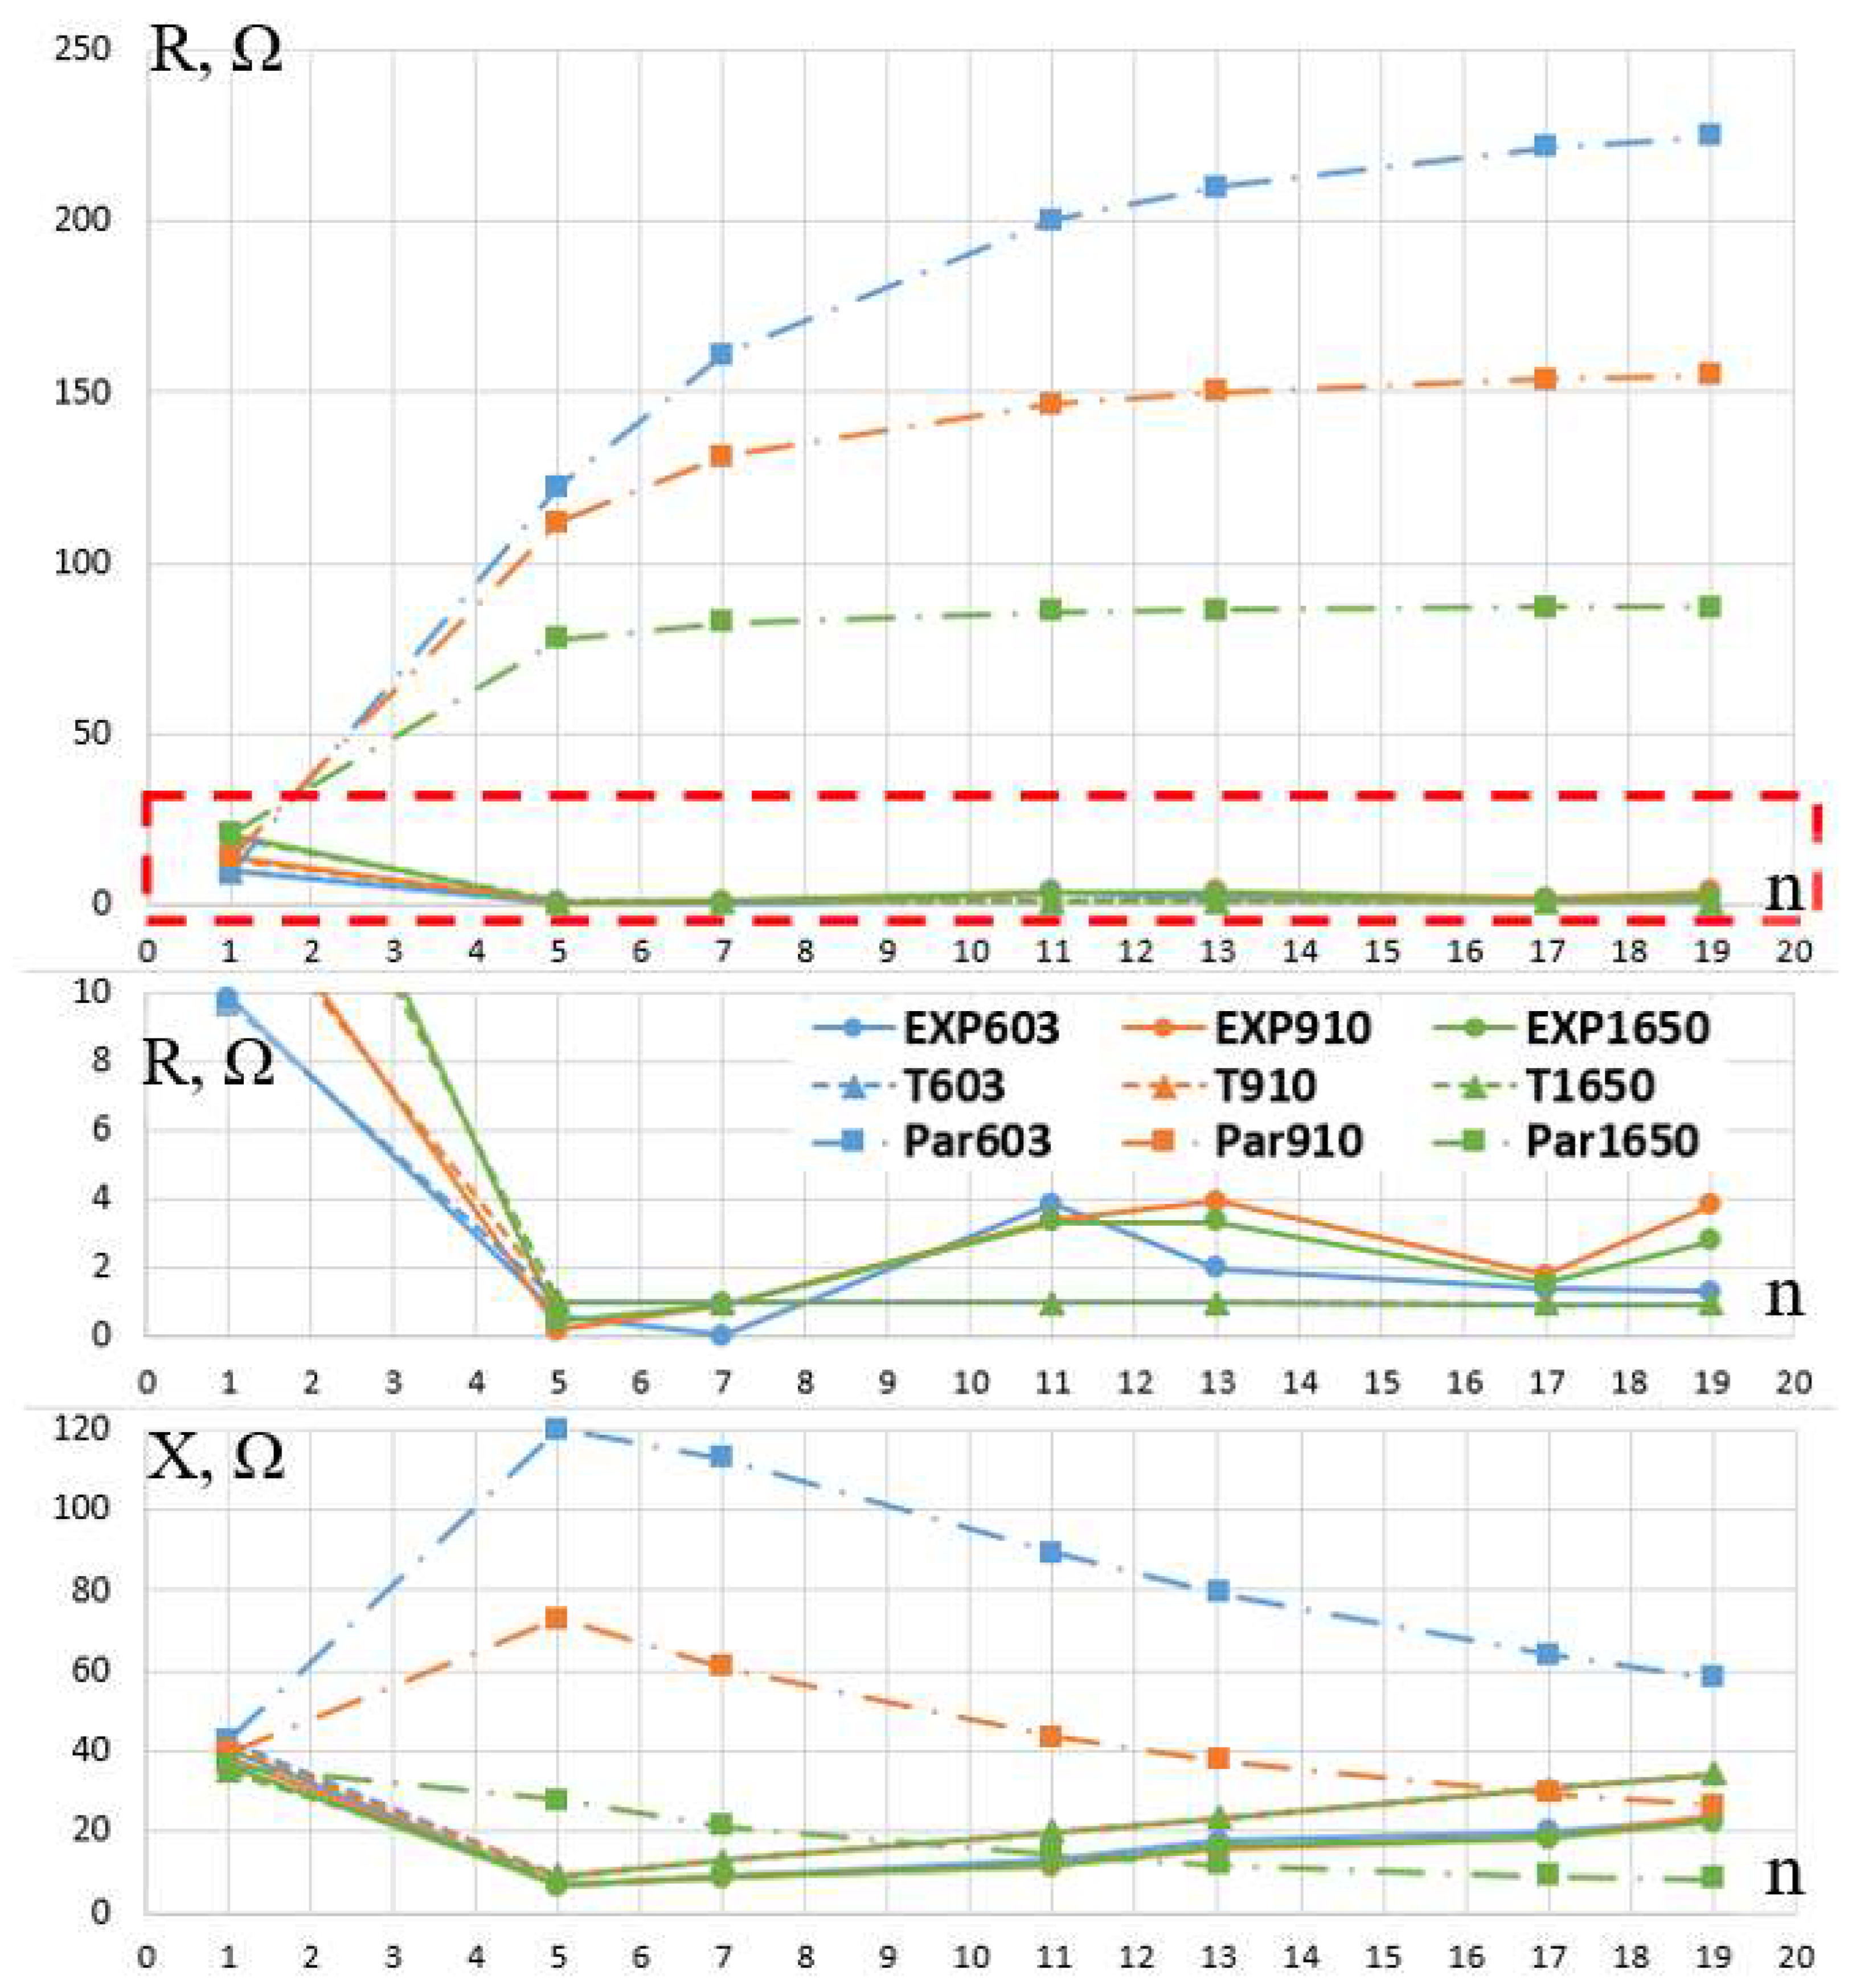
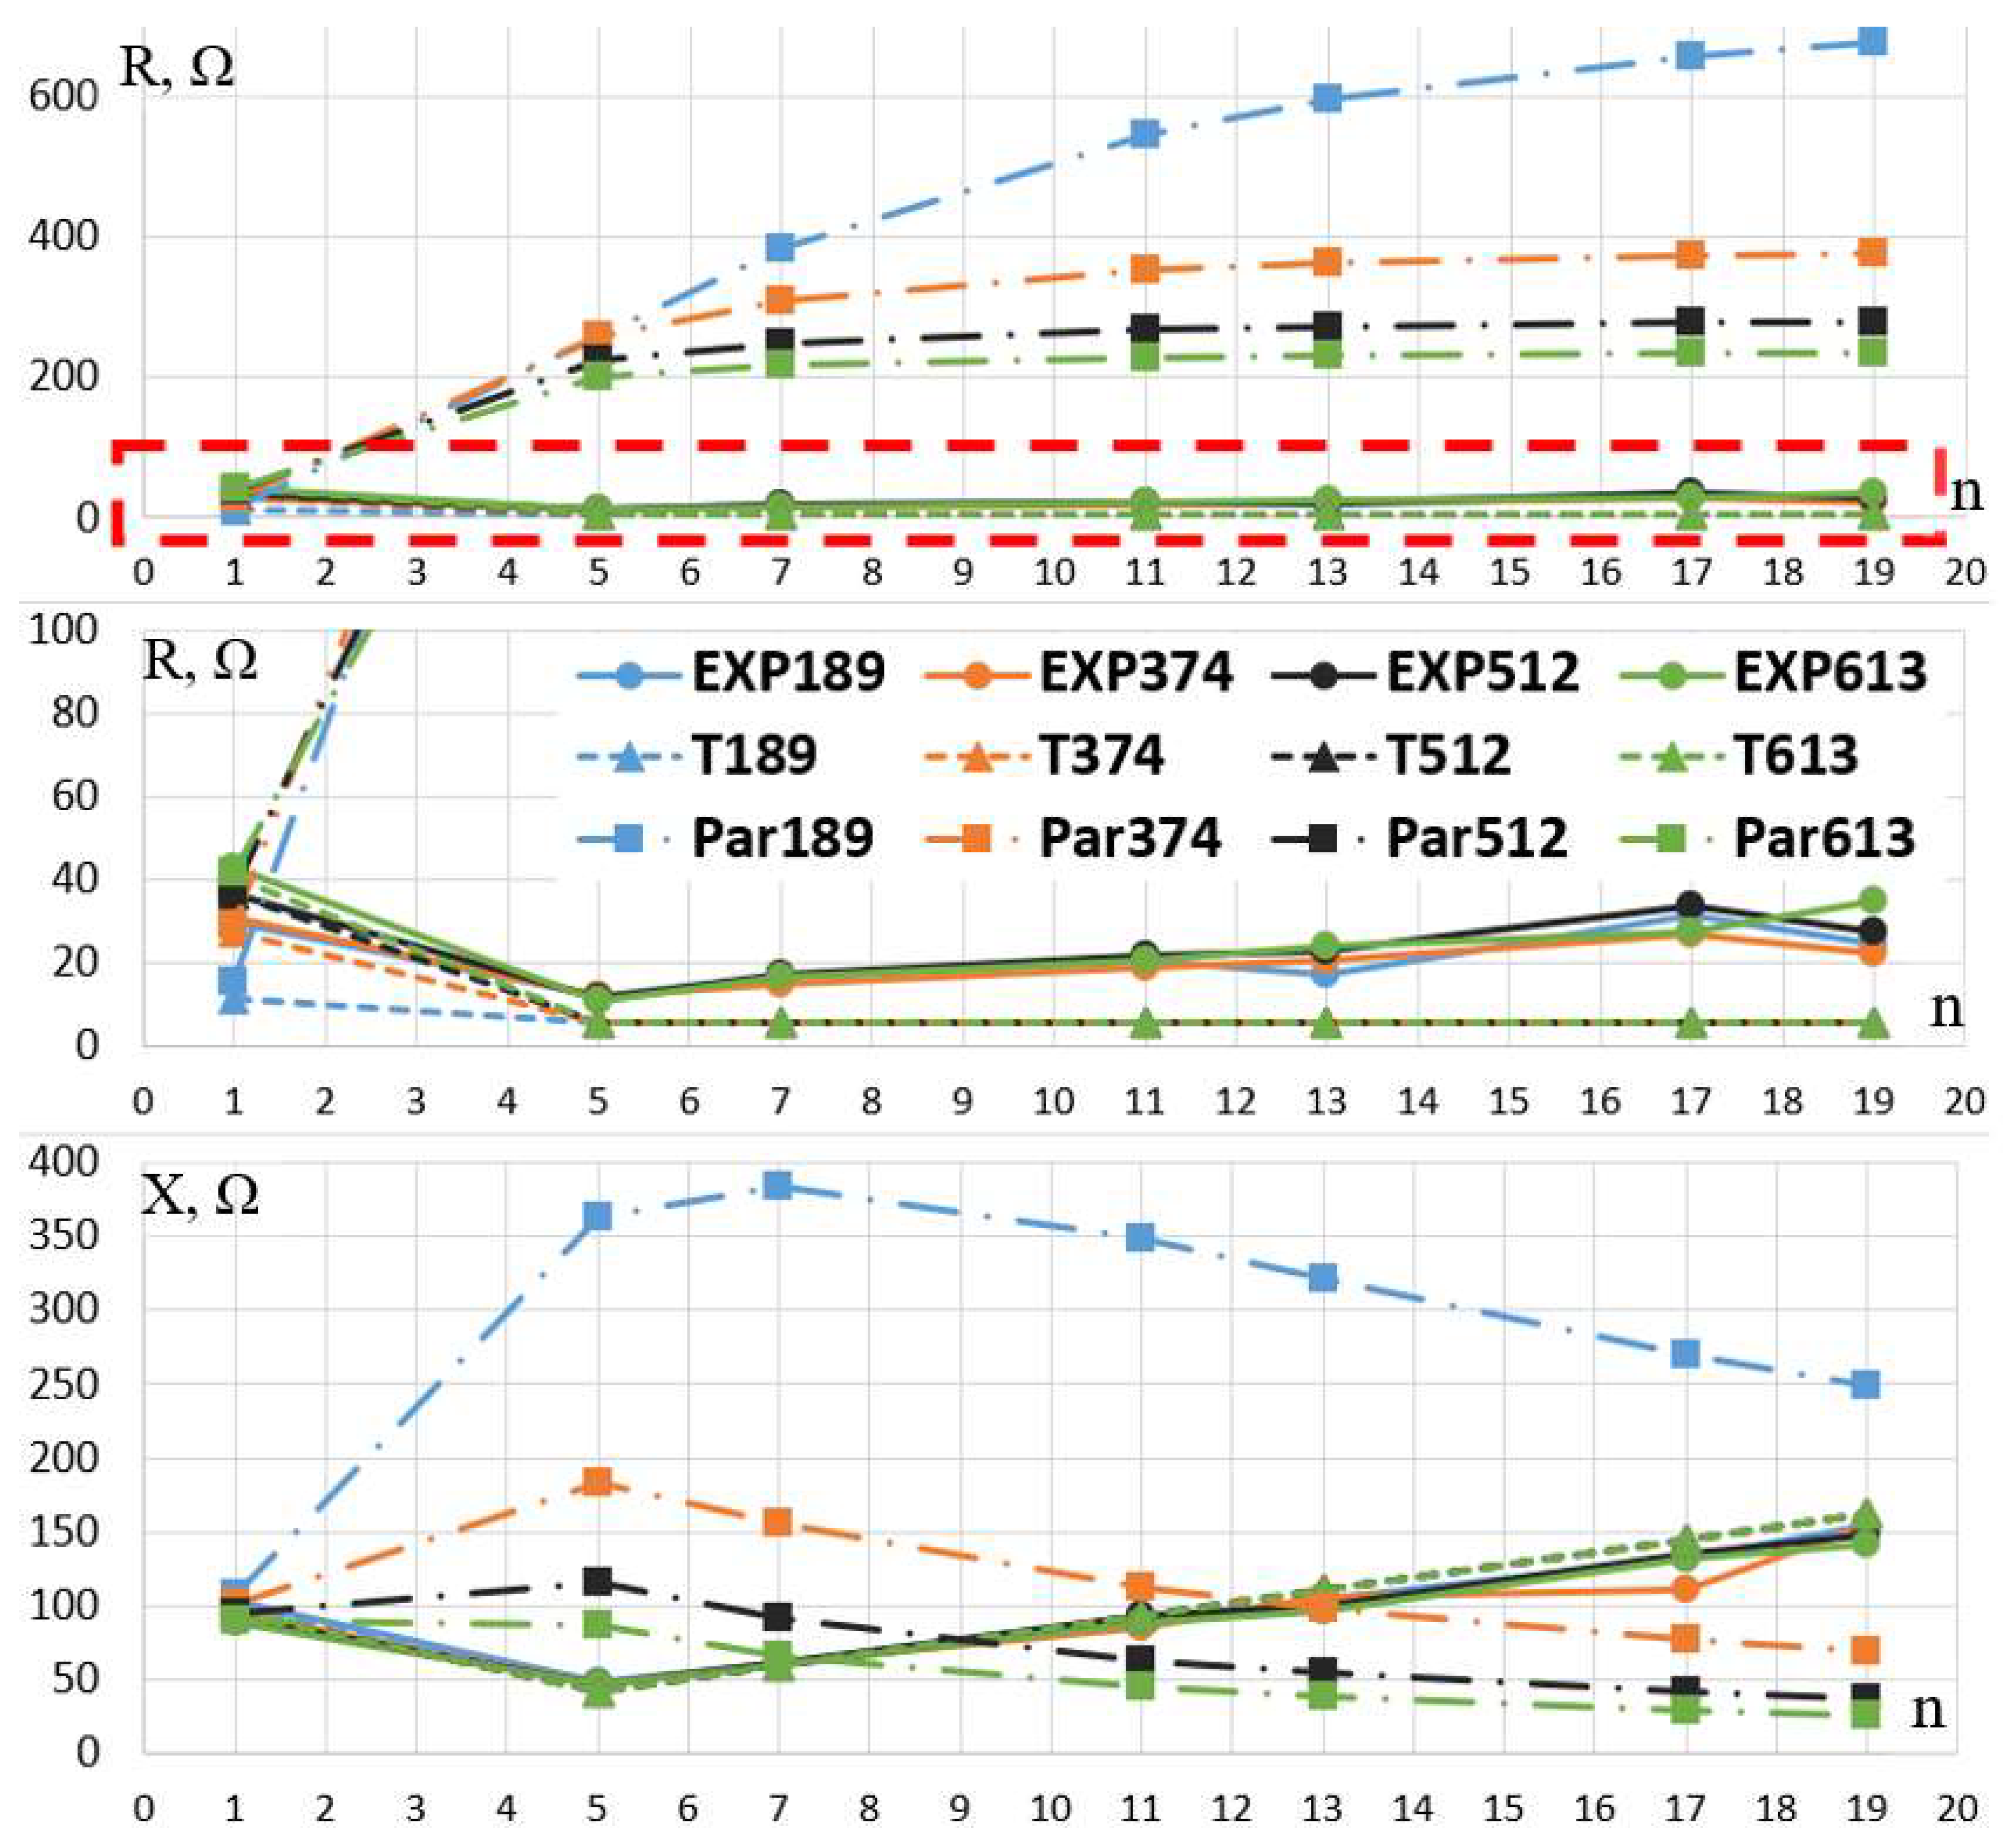
n) were obtained for the 1.5 kW and 5.5 kW induction motors. The results calculated using the T-type equivalent circuit and the parallel equivalent circuit were compared with the experimental data. The corresponding characteristics are shown in
Figure 9 and
Figure 10. The numerical data used to plot the graphs are given in
Appendix B.
In
Figure 9 and
Figure 10, the colors identify the corresponding shaft-power levels, whereas the marker shapes and line styles identify the method used to obtain the impedance characteristics. Circular markers connected by solid lines represent the experimental data (EXP), triangular markers connected by dashed lines represent the results calculated using the T-type equivalent circuit (T), and square markers connected by dash-dot lines represent the results calculated using the parallel equivalent circuit (Par). The numerical value following each designation indicates the corresponding shaft power in watts. For example, EXP603, T603, and Par603 denote the experimental, T-type equivalent-circuit, and parallel equivalent-circuit characteristics, respectively, for a shaft power of 603 W.
Based on the characteristics presented in
Figure 9 and
Figure 10, the following properties of the experimentally obtained complex impedance characteristics can be identified:
For both investigated motors, the R(n) values obtained from the experimental data and calculated using the T-type equivalent circuit remain within the same order of magnitude. This indicates a similar qualitative behavior of these dependences. In contrast, the parallel equivalent circuit gives significantly higher R(n) values at higher harmonics and demonstrates a sharp increase in the active component of impedance, especially at low load levels.
For both motors, the X(n) values at higher harmonics generally increase with harmonic order; however, they cannot be obtained by a simple proportional recalculation of X(1). The obtained form of this dependence is qualitatively consistent with the T-type equivalent circuit.
The experimental complex impedance characteristics at higher harmonics have the same qualitative behavior for all considered load levels. When the mechanical load changes, the form of the R(n) and X(n) dependences does not change significantly. The same property is observed for the T-type equivalent circuit.
Based on Equations (8)–(11), the deviations between the calculated and experimental impedance characteristics were evaluated quantitatively. The MAE, RMSE, and maximum absolute deviation were calculated separately for
R(
n) and
X(
n), for each investigated shaft-power level and for both equivalent-circuit models. The results for the 1.5 kW IM are presented in
Table 7 and
Table 8 and for the 5.5 kW IM in
Table 9 and
Table 10.
The quantitative error indicators presented in
Table 7,
Table 8,
Table 9 and
Table 10 consistently demonstrate closer agreement between the T-type equivalent circuit and the experimental data. For both investigated motors, at every considered shaft-power level, the T-EC yields lower MAE, RMSE, and maximum absolute deviation values than the parallel equivalent circuit for both
R(
n) and
X(
n).
In addition to the quantitative differences, the two equivalent circuits demonstrate fundamentally different behavior at higher harmonics. In the parallel equivalent circuit, a change in shaft load leads to a significant variation in the calculated values of R(n) and X(n). The calculated R(n) values obtained using the parallel equivalent circuit substantially exceed the experimental values and demonstrate load-dependent behavior that is not observed in the experimental data. In contrast, the T-type equivalent circuit reproduces the main qualitative properties identified experimentally: the impedance characteristics at higher harmonics do not show a pronounced dependence on load, and the reactance X(n) increases with harmonic order. Although exact quantitative agreement between the experimental and calculated values was not obtained, the R(n) and X(n) values remained within the same order of magnitude, while their functional behavior was consistent with that predicted by the T-type equivalent circuit.
Thus, the laboratory tests carried out for two induction motors of different rated powers and under different shaft loads support the use of the T-type equivalent circuit as a physically justified representation of the induction motor for higher-harmonic impedance analysis. At the same time, the obtained results should be interpreted as an experimental justification of the adopted modeling approach rather than as a complete validation for all squirrel-cage induction motors. The experiments were limited to two low-power motors, since laboratory testing of motors with powers comparable to industrial drives requires a different experimental base. Work in this direction is currently being continued by the authors.
It should also be noted that the T-type equivalent circuit is widely used for the analysis of transient processes, starting modes, and mechanical characteristics of induction motors of different power ratings. This provides an additional argument for using this circuit in the analysis of higher-harmonic impedance characteristics. Therefore, in the following sections, the influence of induction motor-equivalent-circuit selection on calculated power quality indicators is analyzed using the example of a typical industrial power supply system with higher total motor power.
To highlight the practical significance of the obtained results, the qualitative properties identified from the experimental impedance characteristics were further extended to an induction motor of higher rated power. According to the harmonic modeling approach of Pedra et al. [
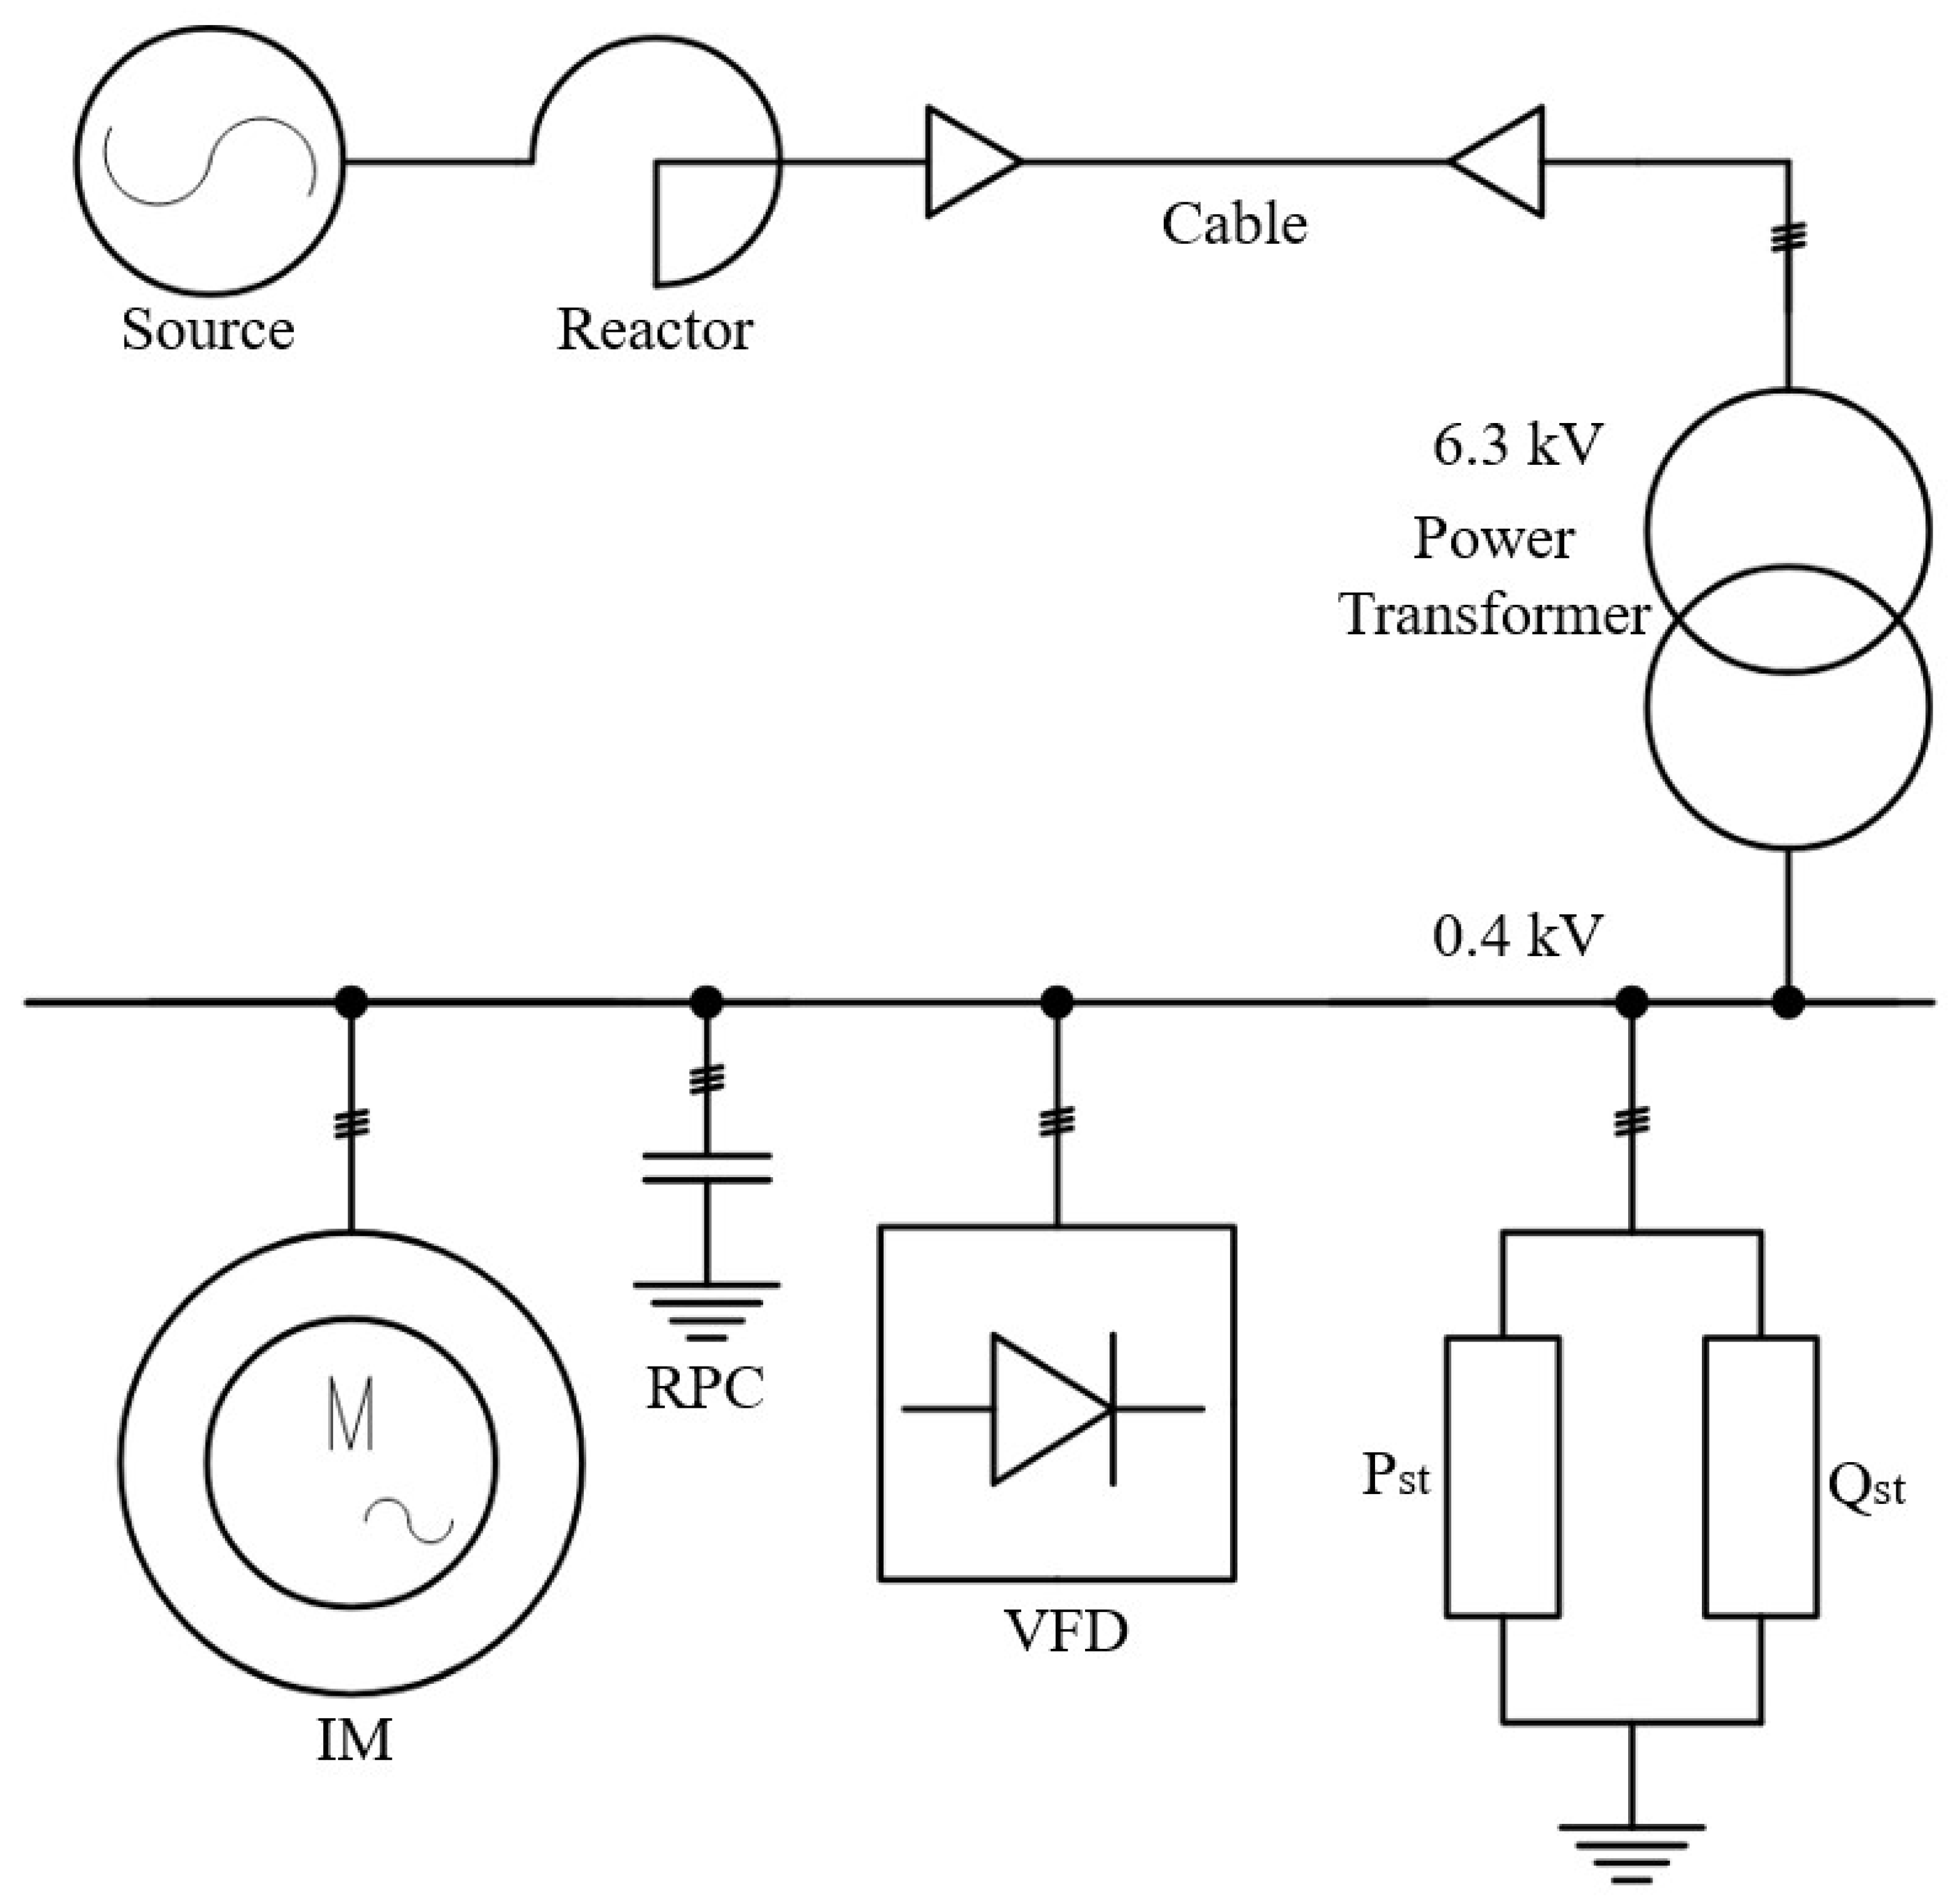
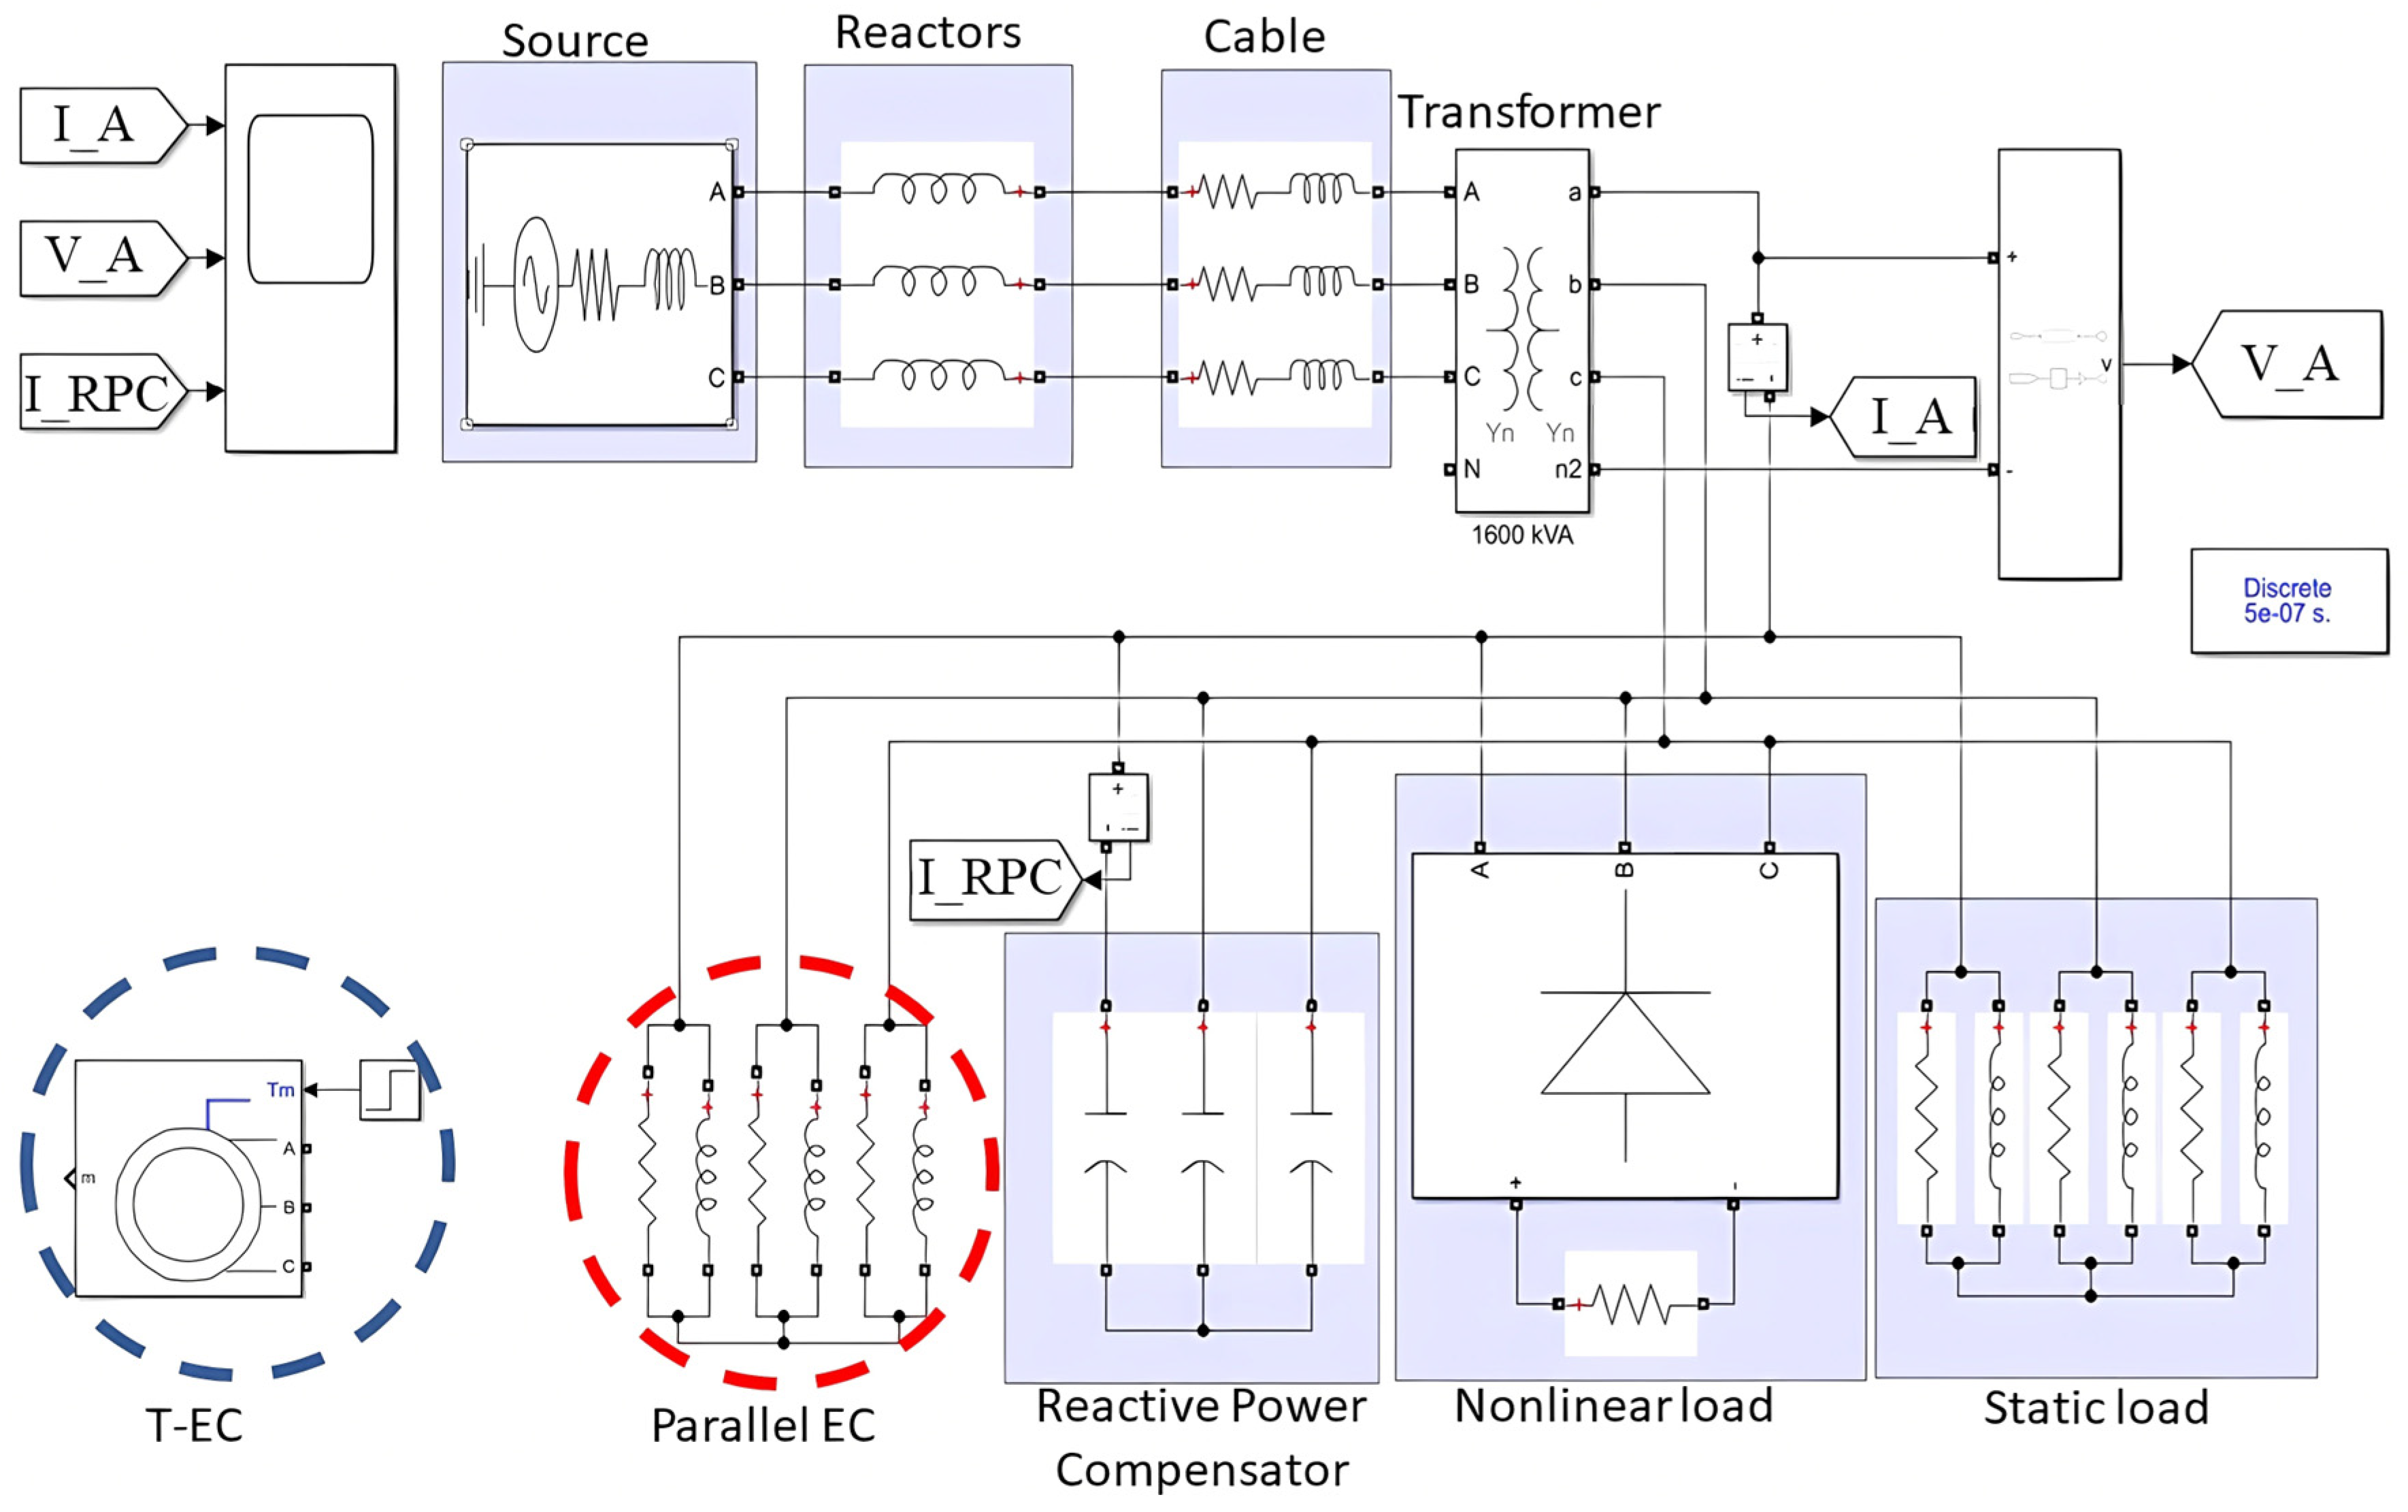
37], motor rated power is not introduced into the harmonic impedance equations as an independent factor; differences between motors of different ratings are represented through their motor-specific equivalent-circuit parameters and harmonic slip. Since direct experimental testing of motors comparable with industrial drives requires a separate experimental base, this extension was adopted as an engineering assumption. To avoid an excessive increase in the scope of the study, only one higher-power motor rating was considered. For this motor, simulation modeling of a typical industrial power supply system was carried out using two equivalent-circuit representations: the T-type equivalent circuit and the parallel equivalent circuit. The obtained simulation results were used to determine how the choice of the induction motor-equivalent circuit affects the calculated power quality indicators.
3.2. Simulation Results: Influence of Equivalent-Circuit Selection on Power Quality Indicators
Based on the simulation results and calculations, the total harmonic distortion coefficients of the network voltage, the incoming current, and the RPC current, as well as their RMS values at the fundamental harmonic, were obtained and are presented in
Table 11. In addition, the coefficients of the odd voltage harmonic components that were not multiples of three (Ku(
n)) were determined and are given in
Table 12. In accordance with EN 50160 [
44] and GOST 32144-2013 [
45], these characteristics are the main indicators used in the analysis of higher-harmonic conditions; therefore, the comparative analysis was based on them. The harmonic-voltage limits of EN 50160 and GOST 32144-2013 were adopted because the considered network has a nominal voltage of 0.4 kV and the analyzed 0.4 kV bus was treated as the common connection (supply) point of the modeled consumers. The standards specify 10 min aggregated harmonic values assessed over a one-week period; however, the present study considers steady-state operating points, so the limits were used only as reference values.
In
Table 11, the first row (1 × 160, 2 × 160, etc.) indicates the number of induction motors connected on the 0.4 kV load side. The columns “Par.” and “T-EC” denote the results obtained when the induction motor is represented by the parallel equivalent circuit and the T-type equivalent circuit, respectively.
THDU and
THDI denote the total harmonic distortion of voltage and current, respectively; U
1RMS and I
1RMS denote the RMS values of the fundamental-frequency voltage and current; and RPC denotes the reactive power compensator. An asterisk (*) indicates that the applicable power quality limit is exceeded.
The analysis of the obtained results with variation in each of the six variables showed the following: when determining the network voltage distortion coefficient, the difference between the values obtained using different equivalent circuits increases as the total power of the induction motors grows. It was also found that the simulation results obtained with the parallel EC remain within the limit specified by EN 50160, namely up to 8% for the 400 V voltage level. When the T-EC is used, the standard limit is exceeded by up to 2.27 percentage points.
The values of the network current distortion coefficient differed by 4.36 to 5.37 percentage points, with the difference increasing as the total power of the IMs increased. The difference in the current distortion coefficient of the reactive power compensator also increased with the total IM power, ranging from 22.10 to 71.42 percentage points. Such a quantitative difference may be critically important when assessing RPC overloading by higher-harmonic currents, which directly affects the reliability of its operation.
The difference in the fundamental-frequency RMS network voltage for all simulation cases is less than 0.2%, which confirms the equivalence of the models at the fundamental frequency. The fundamental-frequency RMS network current, however, shows a larger difference of up to 4%, which may affect the calculation of apparent power and the selection of incoming electrical equipment. The difference in the fundamental-frequency RMS current of the RPC, I1RMSRPC, obtained using the two IM equivalent circuits is less than 0.2%. This value remains almost unchanged because the same RPC capacitance was used in all simulations and the fundamental-frequency network voltage differed by less than 0.2%. In contrast, the different higher-harmonic impedances of the IM models result in different harmonic voltages at the 0.4 kV bus and, consequently, different harmonic currents through the RPC. Since the capacitive reactance decreases with harmonic order, these differences lead to a substantial variation in the RPC current THD despite the nearly identical fundamental-frequency current.
In
Table 12, the first row indicates the IM model used, while the second row indicates the total installed motor power corresponding to the calculated voltage harmonic coefficients. The first column lists the harmonic order
n up to the 49th harmonic. Ku(
n) denotes the coefficient of the
n-th voltage harmonic component, expressed as a percentage; IM denotes the induction motor; Par. denotes the parallel equivalent circuit; and T-EC denotes the T-type equivalent circuit. The notation 1 × 160, 2 × 160, 3 × 160, and 4 × 160 corresponds to total installed IM powers of 160, 320, 480, and 640 kW, respectively. An asterisk (*) indicates that the applicable limit specified by EN 50160 and GOST 32144-2013 is exceeded, whereas unmarked values comply with the corresponding limit. For the considered 0.4 kV network, the adopted limits were 6.0%, 5.0%, 3.5%, 3.0%, 2.0%, and 1.5% for the 5th, 7th, 11th, 13th, 17th, and 19th–25th harmonic orders, respectively. For odd non-triplen harmonics above the 25th order, the adopted limit was 1.5%.
According to the obtained data, when the total IM power is up to 320 kW, both models give qualitatively consistent results: the 11th- and 13th-harmonic voltage coefficients exceed the adopted limits. At 480 kW, the results begin to differ: with the T-EC, both the 11th and 13th harmonics exceed the limits, whereas with the parallel EC only the 11th harmonic remains above the limit. At 640 kW, both the 11th and 13th harmonics exceed the limits for the T-EC, while both remain within the adopted limits for the parallel EC. The observed differences are caused by the different frequency dependence of the motor impedance in the two models. At the 11th and 13th harmonics, the T-EC has a higher predominantly inductive impedance than the parallel EC. Consequently, the motor provides less shunting of these harmonic components, resulting in higher harmonic voltages at the 0.4 kV bus. Since the capacitive reactance of the RPC decreases with harmonic order, the increased 11th- and 13th-harmonic voltages produce substantially higher RPC harmonic currents and, therefore, higher current THD.
As described in
Section 2.4, the transformer rating, cable impedance, nonlinear load level, reactive power compensator size, motor loading conditions, and network short-circuit capacity were kept unchanged in the present study in order to isolate the influence of induction motor-equivalent-circuit selection. Variation in these parameters would change the absolute values of the calculated harmonic indices and the magnitude of the differences between the two motor representations. However, it is expected that the main qualitative conclusion would remain unchanged: owing to the fundamentally different frequency-dependent impedance characteristics of the two equivalent circuits, the discrepancies between the calculated power quality indices would remain significant and would generally become more pronounced as the total installed induction motor power increases. Variation in the capacitor-bank size may produce even larger differences, since it changes the parallel-resonance frequency of the network. A detailed parametric analysis of these effects requires a separate study.
Although harmonic characterization based on FFT-derived indices is essential for steady-state power quality assessment, it may not capture all informative features of distorted waveforms, particularly under nonlinear or fault-related conditions. Recent studies of distribution-system fault assessment have shown that statistical waveform characteristics, such as kurtosis and skewness, can provide additional information beyond individual harmonic components [
46]. In the present study, the analysis is intentionally limited to harmonic spectra, THD, and individual harmonic coefficients because the objective is to evaluate the influence of induction motor-equivalent-circuit selection on harmonic power quality indices. Statistical waveform characterization may be considered as a possible extension of the proposed assessment framework in future studies.
Thus, the considered IM models demonstrate significant quantitative and qualitative differences, which increase with the total IM power. In the study and simulation of industrial enterprise networks under higher harmonic conditions, especially when power quality improvement measures are being developed, such differences in the obtained estimates may have a decisive influence on the adopted technical solutions. As a consequence, incorrect technical decisions may lead to economic losses and premature equipment failure. The experimental results obtained for the 1.5 and 5.5 kW motors show that the T-type equivalent circuit provides closer agreement with the measured harmonic impedance characteristics than the parallel resistive-inductive equivalent circuit, both in terms of qualitative behavior and the calculated MAE, RMSE, and maximum absolute deviation. At the same time, the present simulation results show that equivalent-circuit selection can materially change the calculated PQ indicators. However, the experimental study was limited to two low-power motors and does not provide complete validation of the T-type equivalent circuit for motors of industrial power ratings. Therefore, the application of the obtained conclusions to a 160 kW motor in the simulation of an industrial power supply system should be regarded as an engineering assumption. For this reason, the selection of an induction motor-equivalent circuit for harmonic analysis should ultimately be supported by comparison with experimentally obtained impedance characteristics of real motors. A comprehensive assessment of this correspondence, including different motor ratings, designs, and operating conditions, goes beyond the scope of the present paper and requires a separate extended study.