


Abstract
Direct comparisons of microplastic (MP) contamination between semi-enclosed and open Mediterranean coasts remain scarce. We quantified MP concentration and morphotype composition at ten sandy beaches in Thessaly, Greece (five in the semi-enclosed Pagasitikos Gulf and five on the open NW Aegean coast), sampling supralittoral and active-swash sediments (n = 100): (~800 g composite per 1 m2 quadrat). Particles were extracted by NaCl density separation and screened using Nile Red fluorescence. We recorded 10,506 Nile Red-positive putative MPs (1–1297 items m−2; mean 105.1 ± 175.1; median 53.5 items m−2). Pellets/beads dominated (51.7%), followed by fragments (37.2%) and fibres (10.6%). Mean concentration was higher in the gulf than on the open coast (147.6 ± 226.0 vs. 62.5 ± 73.6 items m−2), but the area effect was non-significant (GLMM, p = 0.110), while among-beach heterogeneity was high (CV = 91.4%). A localized pellet hotspot occurred in the Kala Nera active swash (525.8 pellets m−2), producing a significant pellet-specific Area × Zone interaction (p = 0.033). Pellets contributed 42.9% of between-area dissimilarity (SIMPER, p = 0.013). These results indicate that localized, source-specific inputs may outweigh broad hydrodynamic differences in shaping regional contamination patterns.
1. Introduction
Plastic pollution is a major environmental concern. Global plastic production has increased from approximately 2 million tonnes in the 1950s to more than 400 million tonnes annually, while 19–23 million metric tonnes of plastic waste were estimated to enter aquatic ecosystems in 2016, potentially reaching 53 million tonnes per year by 2030 [1,2]. Environmental degradation fragments plastics into particles < 5 mm, defined as microplastics (MPs) [3,4], which may be primary or secondary in origin [5]. Their persistence and capacity to adsorb hydrophobic organic pollutants and heavy metals further increase their ecological relevance [6,7].
The Mediterranean Sea is among the marine regions most affected by MP contamination [8,9]. Its semi-enclosed configuration, restricted exchange, densely populated coastline, and intense maritime and tourism activities favour plastic accumulation [10,11]. Although Mediterranean MP research has expanded markedly, spatial coverage remains uneven, with the eastern basin less studied than the western Mediterranean [12]. In Greek waters, MPs have been reported in surface waters, seafloor sediments, and biota [13,14,15], whereas beach sediments, particularly along the central and northwestern Aegean coast, remain comparatively understudied.
Beach sediments act as both sinks and secondary sources of MPs [16,17], with their distribution controlled by hydrodynamics, sediment characteristics, wind transport, and anthropogenic inputs [18,19]. Cross-shore depositional zones, including the active swash and supralittoral zones, may therefore differ in MP abundance and composition [20,21]. Hydrodynamic setting may also influence retention: restricted exchange and longer residence times can promote accumulation in semi-enclosed bays and gulfs [22,23], whereas stronger wave action and longshore transport may enhance dispersal along open coasts [24]. Direct comparisons of these settings within the same geographic region remain scarce.
The Pagasitikos Gulf provides an appropriate setting for such a comparison. This shallow, semi-enclosed embayment exchanges water with the Aegean Sea through the narrow Trikeri Channel and has relatively limited water exchange and long residence times [25,26], whereas the adjacent NW Aegean coastline is more exposed to wave action and alongshore transport. Comparing these environments within the same region reduces variation related to regional climate, sampling period, and analytical methodology.
MP morphotype composition can also provide information on likely pollution sources. Fibres are commonly linked to wastewater and atmospheric deposition from synthetic textiles [16,27], fragments to the breakdown of larger plastic items [28], and pellets to losses of industrial raw materials during manufacturing, handling, or transport [29,30]. Consequently, pellet-rich assemblages may indicate industrial or shipping-related inputs, whereas fragment- or fibre-dominated assemblages may reflect more diffuse urban sources [13,31]. Common sediment-processing approaches include NaCl density separation [3,32] and Nile Red fluorescence screening [33,34], typically using blue excitation and orange emission filtering [33,35]; Nile Red-based screening has also been evaluated against FTIR identification [33].
No previous study has directly compared MP contamination in beach sediments between the semi-enclosed Pagasitikos Gulf and the adjacent open NW Aegean coast. To address this gap, we surveyed ten sandy beaches, five in each coastal setting, sampling both the supralittoral and active swash zones. The specific objectives were: (i) to quantify and compare total MP concentrations (items m−2) between the semi-enclosed and open coastal environments; (ii) to assess cross-shore variability in MP abundance and composition between the supralittoral and active swash zones; (iii) to characterize MP morphotype composition (fibres, fragments, films, foams, and pellets/beads) and evaluate differences between coastal settings; and (iv) to provide a spatial overview of MP contamination across the study area. We hypothesized that restricted hydrodynamics would promote greater MP retention within the Pagasitikos Gulf and that differences in morphotype composition would reflect contrasting source contributions, including potential industrial pellet inputs along the gulf shoreline.
2. Materials and Methods
2.1. Study Area
The study was conducted along the coast of Thessaly, central-eastern Greece, encompassing two contrasting coastal environments: the semi-enclosed Pagasitikos Gulf and the open NW Aegean shoreline (Figure 1). The Pagasitikos Gulf is a shallow (maximum depth ~110 m), semi-enclosed embayment in the western Aegean Sea, communicating with the open sea through the narrow Trikeri Channel in its southeastern corner. This restricted connectivity results in limited water exchange and relatively long water residence times, with circulation primarily driven by wind forcing and, secondarily, by tidal exchange [26,36]. The gulf’s coastline is bordered by the city of Volos (population ca. 145,000), an active commercial and fishing port, several coastal settlements, and industrial facilities, all constituting potential sources of plastic pollution. In contrast, the NW Aegean coastline extending north of the Pagasitikos Gulf comprises exposed sandy beaches subject to stronger wave energy, longshore currents, and more efficient hydrodynamic flushing. This coastline is comparatively less urbanized, with scattered coastal villages and seasonal tourism infrastructure.
Figure 1.
Bathymetric map of north Pagasitikos gulf and NW Aegean shoreline (colour scale indicates depth in metres, obtained from the European Marine Observation and Data Network—EMODnet, red square indicates the location of the study area in Greece). The location of each beach site is indicated by a triangle.
2.2. Sampling Design and Field Procedures
Ten sandy beaches were selected for sampling: five located within the Pagasitikos Gulf (Agria, Alikes, Anavros, Kala Nera, and Nea Anchialos) and five along the open NW Aegean coast (Agiokampos, Nea Mesagala, Papakosta, Platamonas, and Velika). Sites were selected to cover a range of urbanization intensities and coastal exposures within each area, while ensuring comparable sediment types (medium to fine sand). The geographic coordinates, sampling dates, and replication per zone for each site are summarized in Table 1.
Table 1.
Sampling sites, geographic coordinates (WGS84), dates, and number of replicate sediment samples per beach zone.
Agria is a narrow coastal strip, generally only a few metres wide, composed of pebbles, shingle, and coarse sand and backed by a paved promenade, seawalls, and the coastal road. The site is sheltered within the inner Pagasitikos Gulf and experiences relatively low wave energy. Potential pollution sources include the AGET Heracles industrial plant approximately 2.5–3 km away, the Port of Volos and urban area approximately 6–7 km away, and local road and stormwater runoff. Human activities include waterfront recreation and dining, swimming, small-craft mooring, and artisanal fishing.
Alikes comprises an approximately 1–1.5 km long beach, generally 10–30 m wide, composed of fine-to-coarse sand with fine pebbles and a shallow, gently sloping seabed. Its sheltered position in the western Pagasitikos Gulf results in relatively low wave exposure. The site lies approximately 4.5–6 km from the Port of Volos and urban centre and 3–4 km from major urban torrent outlets, while also receiving local stormwater inputs. Human activities are dominated by seasonal tourism and recreation, including swimming, beach facilities, waterfront dining, water sports, and recreational boating.
Anavros is an urban beach approximately 400–600 m long and 10–25 m wide, characterized by coarse sand, fine gravel, and pebbles and bordered by a promenade and municipal park. The beach is sheltered within the inner Pagasitikos Gulf and has a gently sloping seabed. It is directly adjacent to the mouth of the Anavros torrent, approximately 1.5–2.5 km from the Port of Volos and central urban drainage areas, and about 4 km from the AGET Heracles industrial plant. Human activities include intensive urban recreation, swimming, sunbathing, walking, waterfront dining, and light recreational paddling.
Kala Nera comprises an approximately 1–1.5 km long beach, generally 8–20 m wide, composed mainly of fine pebbles, shingle, and coarse sand and bordered by mature coastal vegetation. The beach is sheltered along the eastern Pagasitikos Gulf and has relatively calm, gently deepening waters. It is approximately 18–20 km from the main industrial and port areas of Volos, with potential local inputs arising from seasonal stream discharge, village stormwater, domestic wastewater, and small-craft activity. Human activities are dominated by seasonal tourism, swimming, water sports, waterfront dining, and small-scale fishing.
Nea Anchialos consists of an elongated beach system approximately 1.5–2 km long and 10–25 m wide, composed predominantly of fine dark sand with fine gravel and pebbles and backed by the coastal settlement and promenade. The gently sloping shoreline is sheltered along the western Pagasitikos Gulf. The site lies approximately 16–18 km from the major urban, industrial, and port areas of Volos, while potential local inputs include municipal runoff, agricultural drainage, seasonal streams, and activities associated with the nearby small harbour. Human activities include seasonal tourism, swimming, beach recreation, waterfront dining, recreational boating, and angling.
Agiokampos forms part of the continuous Agiokampos–Sotiritsa–Velika coastal strand, which extends for approximately 10–14 km, with beach widths generally ranging from 30 to 60 m. The exposed Aegean shoreline consists of fine sand mixed with smooth pebbles and shingle and has a relatively rapidly deepening seabed. Major industrial areas are located more than approximately 40–50 km away, and potential local inputs are mainly associated with seasonal streams and the nearby small harbour. Human activities are dominated by seasonal tourism, swimming, organized beach recreation, waterfront dining, and small-scale artisanal fishing.
Nea Mesagala lies within a continuous 5–8 km coastal strip and is characterized by a broad beach approximately 40–80 m wide. The shoreline consists predominantly of fine sand with a gently sloping, shallow seabed and is associated with low dunes and coastal wetlands near the Pineios River delta. No major industrial or commercial port facilities occur nearby; the principal potential external input is the Pineios River, approximately 4–5 km to the south, which drains agricultural areas of the Thessalian plain. Human activities are mainly seasonal tourism, holiday accommodation, swimming, beach recreation, and nature-based activities.
Papakosta is a relatively small, semi-secluded beach approximately 200–400 m long and 10–25 m wide. The shoreline consists of coarse sand, shingle, and smooth pebbles, with rocky formations and a relatively rapidly deepening seabed, and is backed by forested coastal slopes. The site is remote from major industrial facilities and commercial ports, with the nearest major industrial centres more than approximately 40–50 km away; potential local inputs are primarily limited to seasonal mountain runoff. Human activities are comparatively low intensity and include swimming, snorkelling, nature-based recreation, and occasional camping.
The Platamonas coastal zone comprises a series of beaches and coves extending approximately 3–4 km, with widths generally ranging from 15 to 35 m. The shoreline consists of fine-to-coarse sand and smooth pebbles, with rocky outcrops and localized coastal protection structures. Major industrial facilities and commercial cargo ports are more than approximately 45–80 km away, while local maritime activity is primarily associated with the Platamonas marina and small fishing vessels. Human activities are dominated by intensive seasonal tourism, swimming, water sports, waterfront dining, recreational boating, and marina activity.
Velika forms part of the continuous Agiokampos–Sotiritsa–Velika coastline, with its main beachfront extending approximately 4–5 km and widths generally ranging from 30 to 50 m. The exposed Aegean shoreline consists of fine-to-coarse sand mixed with small pebbles and shingle and has a relatively rapidly deepening seabed. Major industrial centres are located more than approximately 45–55 km away, while potential local inputs are mainly associated with seasonal mountain streams. Human activities are dominated by seasonal tourism, swimming, organized beach recreation, waterfront dining, camping, and outdoor recreation.
Sampling beaches were selected purposively to provide comparable representation of the two contrasting coastal settings while encompassing within-area variability in shoreline characteristics and anthropogenic influence. Selection criteria included: (i) location within either the semi-enclosed Pagasitikos Gulf or the open NW Aegean coast; (ii) the presence of predominantly sandy to mixed sand–pebble sediments suitable for standardized sediment sampling; (iii) representation of different degrees of wave exposure and coastal morphology; (iv) variation in proximity to potential microplastic sources, including urban areas, ports, industrial facilities, river or torrent outlets, agricultural drainage, and local stormwater inputs; and (v) variation in the intensity of human activities, ranging from relatively low-use beaches to highly frequented urban and tourist beaches. Sites were also geographically distributed within each coastal setting to avoid concentrating sampling within a single locality. The objective was therefore not to select known pollution hotspots, but to obtain a representative range of environmental and anthropogenic conditions within each coastal setting.
At each beach, sediment samples were collected from two distinct cross-shore zones: (i) the supralittoral zone, located above the high-tide strandline and beyond regular wave influence, and (ii) the active swash zone, corresponding to the area of active wave run-up at the time of sampling. This two-zone design enables the assessment of cross-shore variability in microplastic deposition and allows comparison of zones dominated by aeolian transport and stranding (supralittoral) versus those subject to direct wave sorting and deposition (swash). Within each zone, five replicate sediment samples were collected along a line parallel to the waterline at intervals of approximately 5 m to capture within-zone heterogeneity. This yielded a fully nested design of 2 areas × 5 beaches × 2 zones × 5 replicates = 100 samples.
Sampling was conducted during May 2026 under calm weather conditions. The Pagasitikos Gulf beaches were sampled on 1 May 2026 and the NW Aegean beaches on 13 and 15 May 2026. At each sampling point, a 1 × 1 m (1 m2) quadrat was placed on the sediment surface, and each replicate sample was obtained by compositing multiple scoops of surface sediment (top 2–3 cm) collected with a pre-cleaned stainless-steel scoop from randomly distributed points within the quadrat, yielding approximately 800 g of composited sediment per replicate. Each replicate therefore consisted of a fixed nominal mass of approximately 800 g of surface sediment composited from the upper 2–3 cm within a 1 m2 quadrat. The complete 2–3 cm surface layer of a 1 m2 quadrat corresponds to approximately 30–45 kg of sand, so each replicate represents roughly 2–3% of that layer; the entire composite was subsequently processed, with no subsampling in the laboratory. Because quadrat area, sampling depth and composited mass were held constant across all 100 replicates, particle counts are directly comparable among samples, zones, beaches and areas, and are reported as items m−2 of quadrat footprint. This unit denotes the number of particles recovered from a standardized composite collected within a 1 m2 frame; it is an areal index of surface contamination rather than a depth-integrated or mass-integrated density of the entire surface layer, and values are expected to be numerically lower than those from surveys that process the full surface layer of a delimited area. Samples were transferred to individually labelled glass containers, sealed with metal cap to prevent airborne contamination, and transported to the laboratory for processing within 24 h. To minimize contamination during sampling, cotton clothing was worn by all field personnel, and nitrile gloves were changed between samples [37].
2.3. Laboratory Processing and Microplastic Extraction
In the laboratory, each sediment sample was dried in an aluminum tray at 60 °C in a drying oven until constant weight was achieved (typically 48–72 h). The dried sediment was then subjected to density separation for microplastic extraction, following an established protocol based on [3,32]. Each sample was mixed with a saturated sodium chloride (NaCl) solution (approximately 360 g L−1, density ~1.2 g cm−3) and vigorously stirred for 2 min. The mixture was allowed to settle for at least 1 h, during which low-density particles (including microplastics) floated to the surface while mineral sediment settled. The supernatant was carefully decanted, and the density-separation step was repeated three times per sample to improve particle recovery. The combined supernatant was then sieved through a 32 µm stainless-steel mesh to retain the extracted particles and remove dissolved salts. The material retained on the sieve was rinsed with filtered deionized water and transferred onto glass-fibre filters (Whatman GF/C, 47 mm diameter) using vacuum filtration. No oxidative, enzymatic, or other organic-matter digestion or clean-up step was applied prior to Nile Red staining.
No matrix-spike or extraction-recovery validation was performed during the present campaign. Extraction efficiency for the NaCl separation step was therefore not quantified, and no recovery correction was applied. The repeated separation step followed published protocols but should not be interpreted as a measured recovery estimate. Published recovery experiments indicate that density-separation efficiency varies with polymer density, particle size and shape, sediment matrix, and extraction procedure; NaCl generally performs better for low-density polymers than for denser polymers such as PET and PVC [38]. Consequently, the concentrations reported here are operational, uncorrected concentrations rather than recovery-corrected absolute densities.
It should be noted that NaCl density separation (ρ ~ 1.2 g cm−3) efficiently recovers low-density polymers such as polyethylene (PE, ρ = 0.91–0.97 g cm−3), polypropylene (PP, ρ = 0.85–0.92 g cm−3), and polystyrene (PS, ρ = 1.04–1.10 g cm−3), which constitute a substantial proportion of buoyant microplastics in beach sediments [39]. However, denser polymers such as polyvinyl chloride (PVC, ρ = 1.30–1.45 g cm−3) and polyethylene terephthalate (PET, ρ = 1.34–1.39 g cm−3) may be underrepresented [32,40]. A NaCl concentration gradient was not employed because the saturated solution already provides the highest practical density attainable with NaCl for this extraction approach; lower NaCl concentrations would reduce solution density and would therefore not improve recovery of denser polymers. Recovery of such polymers would instead require higher-density separation media, such as NaI or ZnCl2. This limitation should be considered when interpreting the reported total MP concentrations.
2.4. Nile Red Fluorescent Staining and Operational Identification
Microplastic visualization was performed using Nile Red fluorescent staining, following the protocol established by [33] with minor modifications. A Nile Red stock solution was prepared by dissolving the dye in acetone. The stock was then diluted to a working concentration of 10 µg mL−1. The diluted Nile Red solution was applied directly onto the filters containing the extracted particles, and the filters were incubated in covered glass Petri dishes for 30–60 min at room temperature, in accordance with the optimal staining duration identified by [33]. After incubation, filters were gently rinsed with filtered deionized water to remove excess dye.
Stained filters were examined under a stereomicroscope equipped with a blue-light excitation source (wavelength 450–510 nm) and an orange emission filter (529 nm), enabling visualization of fluorescent particles against a dark background. Under these conditions, Nile Red-positive particles exhibit bright yellow-to-orange fluorescence against a dark background, which facilitates visual screening [33,35] (Figure 2). However, Nile Red is a lipophilic rather than polymer-specific dye, and some natural hydrophobic or biogenic materials may also exhibit fluorescence. Consequently, fluorescence alone cannot provide definitive chemical confirmation of plastic identity. Nile Red-positive particles were counted under magnification and operationally classified into six morphotype categories: fibres (elongated, thread-like particles), fragments (irregular, angular pieces), films (thin, flexible, sheet-like particles), foams (porous, spongy particles), pellets/beads (spherical or cylindrical pellet-like particles), and other (particles not fitting the above categories). This morphological classification follows the typology widely adopted in beach microplastic surveys [41,42]. Results were expressed as microplastic concentration in items per square metre (items m−2), referenced to the 1 m2 quadrat footprint as defined in Section 2.2.
Figure 2.
Representative fluorescence stereomicroscope images of Nile Red-stained microplastic particles retained on the filter. Under blue-light excitation (450–510 nm) and an orange emission filter (529 nm), plastic particles fluoresce in bright yellow-to-orange colours, facilitating discrimination from non-fluorescent mineral grains and most organic matter.
Putative microplastics (pMPs) were operationally defined as Nile Red-positive particles that could be consistently resolved and morphologically classified under stereomicroscopy. The 32 µm mesh represented the physical retention cutoff of the extraction apparatus, whereas approximately 300 µm was the smallest particle size that could be consistently discriminated and classified visually. Results therefore represent the approximately ≥300 µm fraction. The counting resolution was 1 item m−2, corresponding to one detected particle within the 1 m2 quadrat. These values are physical and visual detection limits, not a blank-derived concentration-based method detection limit.
2.5. Quality Assurance and Quality Control
Procedural blanks were included during sample processing to monitor laboratory contamination. However, individual per-blank particle counts were not retained in the final auditable data archive, and the analysis dataset contains only the 100 environmental samples. The numerical blank summary included in the original manuscript therefore cannot be reconstructed and has been removed. Consequently, a blank-derived concentration-based method detection limit and a formal blank correction cannot be calculated. The available analytical limits are the 32 µm physical retention cutoff, the approximately 300 µm operational visual-classification limit, and the 1 item m−2 counting resolution. All reported concentrations are raw, uncorrected counts of operationally identified putative microplastics.
Procedural blanks were intended to assess contamination introduced during laboratory processing and did not contain a sediment matrix. They therefore could not assess potential false-positive fluorescence arising from naturally occurring hydrophobic, organic, or biogenic particles present in the sediment samples. Accordingly, procedural blanks should not be interpreted as validation of the specificity of Nile Red staining for plastic particles.
2.6. Data Analysis
All statistical analyses were performed in R version 4.5.2 [43]. The analytical strategy followed the four study objectives in three tiers: (i) univariate models of total MP concentration, testing the hydrodynamic retention hypothesis; (ii) morphotype-specific models, testing whether any aggregate pattern is attributable to a particular particle category and therefore to a particular source; and (iii) multivariate analyses of morphotype composition, testing whether the two coastal settings differ in the mix of particle types independently of their total abundance. The rationale for each method and the outcome it was designed to detect are summarized in Table S1. Statistical significance was set at α = 0.05, and all permutation analyses used 9999 permutations (999 for SIMPER) with a fixed random seed.
Mean, standard deviation, median and coefficient of variation (CV) were calculated for total MP concentration and for each morphotype by area, beach and zone, and are reported as items m−2. The median and CV are reported alongside the mean because MP counts are strongly right-skewed, and because the CV places among-beach spread on the same scale as the between-area contrast the design was built to test.
Effects of Area (semi-enclosed vs. open coast), Zone (supralittoral vs. active swash) and their interaction were evaluated using generalized linear mixed models with a negative binomial distribution and log link, fitted in glmmTMB [44] with Beach as a random intercept nested within Area. The negative binomial specification was verified against a Poisson GLMM by AIC. A random-slope model allowing the Zone effect to vary among beaches, (1 + Zone|Beach), was compared with the random-intercept-only model by likelihood ratio test, and the better-supported model was adopted for inference. Fixed effects were assessed using Type III Wald χ2 tests with sum-to-zero contrasts [45]. Estimated marginal means with Tukey-adjusted pairwise comparisons were obtained using emmeans [46] and back-transformed to items m−2, with contrasts reported as incidence-rate ratios. Simulation-based quantile residuals in DHARMa v0.5.0 [47] were used to test for residual overdispersion and zero inflation.
Morphotype-specific analyses followed the same approach but were tiered by data sparsity under a rule applied uniformly across all six categories and fixed before results were examined: morphotypes with at least 15 non-zero observations were modelled as negative binomial counts, those with 5–14 non-zero observations were reduced to presence/absence and modelled with binomial GLMMs, and rarer morphotypes were summarized descriptively.
The GLMM conclusions were cross-checked with distribution-free tests computed on beach-level summaries, in which each beach contributes a single value: Mann–Whitney U tests on the five beach means per area for Area, paired Wilcoxon signed-rank tests on the two zone means within each beach for Zone, and Kruskal–Wallis tests with Holm-adjusted pairwise Wilcoxon comparisons for among-beach variation.
Morphotype composition was analyzed using Bray–Curtis dissimilarities [48] calculated in vegan [49], and tested with PERMANOVA [50] using marginal (Type III-equivalent) sums of squares. Because Zone varies within beaches whereas Area varies between them, permutations were restricted within beaches for the Zone and Area × Zone terms, whereas the Area effect was evaluated on beach-level centroids. Homogeneity of multivariate dispersion was assessed with PERMDISP [51], non-significance being required before interpreting PERMANOVA as a location effect. Patterns were visualized with non-metric multidimensional scaling (nMDS), with ordination stress reported as an adequacy criterion; the ordination is used for visualization rather than inference. SIMPER [52] was used to attribute compositional differences to individual morphotypes; contributions from categories represented by only a handful of positive samples were not treated as robust signals.
Shannon diversity (H′) was calculated per sample as a supplementary measure of heterogeneity in morphotype composition. The effects of Area, Zone, and their interaction on H′ were tested using linear mixed models with Beach as a random intercept, fitted in lme4 [53]. This analysis was considered secondary to the primary abundance and composition analyses, and its results are reported in the Supplementary Materials.
Sampling locations were mapped using the sf, rnaturalearth, scatterpie and ggspatial packages. Relationships between beach-level MP concentration and latitude were examined with Spearman’s rank correlation, computed separately within each area because latitude is confounded with Area across the ten sites. With five beaches per area these correlations have very low power and are reported as exploratory.
3. Results
3.1. Overall Microplastic Abundance
A total of 10,506 putative MPs were recorded across 100 sediment samples from 10 beaches. Total MP concentration per sample ranged from 1 to 1297 items m−2, with an overall mean (±SD) of 105.1 ± 175.1 items m−2 and a median of 53.5 items m−2. The pronounced difference between mean and median reflects extreme right-skewness driven by a small number of highly contaminated samples, predominantly from the active swash zone of Kala Nera beach within the Pagasitikos Gulf.
Beaches within the Pagasitikos Gulf exhibited higher mean total MP concentrations (147.6 ± 226.0 items m−2) compared to the NW Aegean coast (62.5 ± 73.6 items m−2). Across both areas, the supralittoral zone (91.4 ± 114.0 items m−2) and the active swash zone (118.8 ± 221.4 items m−2) showed comparable overall means, although variance was substantially greater in the swash zone (Table 2).
Table 2.
Descriptive statistics of total microplastic concentration (items m−2) by Area and Zone. SD: standard deviation; CV: coefficient of variation.
Among individual beaches, Kala Nera in the Pagasitikos Gulf recorded the highest mean concentration (341.6 ± 380.4 items m−2), driven by exceptionally high total concentration in the active swash zone (mean 592.8 items m−2, maximum 1297 items m−2). Velika, on the open Aegean coast, exhibited the lowest mean concentration (12.4 ± 8.6 items m−2). The coefficient of variation between beach-level means was 91.4%, indicating substantial among-site heterogeneity that exceeded the between-area contrast (Table S2, Figure 3).
Figure 3.
Map of the 10 sampling sites along the coast of Thessaly, Greece. Graduated symbols indicate mean total microplastic concentration (items m−2) per site, with point size proportional to concentration and colour denoting the coastal setting (orange: Pagasitikos Gulf, semi-enclosed; blue: NW Aegean, open coast).
3.2. Microplastic Morphotype Composition
Six morphotype categories were identified across all samples. Pellets/beads constituted the dominant morphotype, accounting for 51.7% of all particles (5430 items), followed by fragments (37.2%; 3908 items) and fibres (10.6%; 1118 items). The remaining categories were negligible: foams (0.3%; 30 items), films (0.2%; 19 items), and other (<0.1%; 1 item). Pellets occurred in 81% of all samples, fragments in 98%, and fibres in 83%, whereas films, foams, and other were detected in only 9%, 3%, and 1% of samples, respectively (Figure 4, Table 3). The relative composition differed between areas (Figure 5).
Figure 4.
Mean concentration (±SD) of each microplastic morphotype by coastal area. The SD represents among-sample variability within each coastal area and reflects substantial spatial heterogeneity among beaches and zones. Orange bars: Pagasitikos Gulf (semi-enclosed); blue bars: NW Aegean (open coast).
Table 3.
Summary statistics for each microplastic morphotype across all 100 samples. Total: summed items; Occurrence %: percentage of samples with ≥1 item; % of total: percentage contribution to total MP count.
Figure 5.
Relative composition (%) of microplastic morphotypes at each beach and zone combination. Stacked bars sum to 100%.
In the Pagasitikos Gulf, pellets dominated the swash zone (mean 130.9 items m−2), whereas fragment concentrations were highest in the supralittoral (mean 50.0 items m−2). On the NW Aegean coast, fragments and pellets occurred in more balanced proportions, with fragments slightly prevailing in the supralittoral (mean 41.5 items m−2) and pellets contributing more modestly (mean 15.8–18.3 items m−2) across both zones. Fibres showed no clear area or zone pattern, with means of 9.7–12.7 items m−2 across all combinations. Foams were exclusive to the Pagasitikos Gulf (all 30 items from three samples, 26 of which came from a single Alikes swash-zone sample). Films were also concentrated in the Pagasitikos Gulf (17 of 19 items), predominantly in the supralittoral zone (Figure S1).
3.3. Generalized Linear Mixed Models
The negative binomial GLMM substantially outperformed the Poisson GLMM (AIC 1089.3 vs. 8327.8), confirming severe overdispersion in the count data. The random-slope model, which allowed the Zone effect to vary across beaches, was significantly better than the random-intercept-only model (LRT: χ2 = 16.90, df = 2, p = 0.0002; AIC 1076.4 vs. 1089.3) and was therefore adopted as the primary inferential model.
Under the random-slope NB GLMM, none of the fixed effects reached conventional significance: Area (χ2 = 2.55, p = 0.110), Zone (χ2 = 0.11, p = 0.740), and Area × Zone (χ2 = 0.07, p = 0.795). The estimated marginal means indicated that the Pagasitikos Gulf had approximately twice the MP concentration of the NW Aegean (99.1 vs. 48.0 items m−2), but the confidence intervals overlapped broadly due to high among-beach variance. The pairwise contrast between areas was not significant in either zone (Supralittoral: ratio = 1.90, p = 0.163; Active Swash: ratio = 2.24, p = 0.200). No significant zone differences were detected within either area (Pagasitikos: ratio = 1.02, p = 0.960; NW Aegean: ratio = 1.20, p = 0.676).
3.4. Beach-Level Random Effects
The random-effect structure was examined to determine whether the cross-shore contrast is a general property of the coastline or varies among beaches. The random-effect variance components revealed that the beach-level intercept standard deviation was 0.683 (on the log scale), corresponding to a roughly two-fold variation in baseline MP concentration among beaches. The random slope for Zone had a standard deviation of 0.444, indicating that the magnitude and direction of the zone difference varied substantially across beaches. The intercept–slope correlation was −0.38, meaning that beaches with higher overall MP concentrations tended to show smaller or reversed zone contrasts.
The beach-level best linear unbiased predictors (BLUPs) for the Zone slope (Figure S2) revealed two clear outliers. Kala Nera exhibited the most negative Zone slope (−0.80), indicating that its active swash zone accumulated far more microplastics than the supralittoral, a pattern driven by deposition of morphologically identified pellets. Conversely, Anavros showed the most positive slope (+0.88), with higher concentrations in the supralittoral zone, likely reflecting accumulation from aeolian transport and strandline deposition. The remaining eight beaches clustered near zero, suggesting approximately equal MP levels across zones.
3.5. Category-Specific Models
Morphotype-specific models were fitted to determine whether the aggregate pattern is driven by a single, source-diagnostic particle category rather than by a uniform shift across all categories. Separate GLMMs for each morphotype revealed differentiated patterns across the three abundant categories. For fragments, a significant Zone effect was detected (χ2 = 3.88, p = 0.049), with higher concentrations in the supralittoral zone across both areas (mean 45.8 vs. 32.4 items m−2). No Area or interaction effects were significant. For fibres, no significant effects were detected (all p > 0.29), with consistent means of approximately 10–13 items m−2 across all area–zone combinations.
For pellets/beads, the Area × Zone interaction was significant (χ2 = 4.52, p = 0.033), reflecting the disproportionately high pellet concentrations in the Pagasitikos Gulf’s active swash zone (mean 130.9 items m−2), driven primarily by Kala Nera (mean 525.8 items m−2 in the swash zone), compared to relatively low and uniform pellet loads on the open Aegean coast (15.8–18.3 items m−2). The remaining morphotypes were too sparse for count models: films (9 occurrences) were analyzed as presence/absence but produced uninformative estimates due to quasi-complete separation; foams (3 occurrences) and other (1 occurrence) were reported descriptively only.
3.6. Multivariate Composition Analysis
The multivariate analyses test whether the two areas differ in the composition of the microplastic assemblage independently of its total abundance. PERMDISP was run first, since a significant PERMANOVA would otherwise be ambiguous between a shift in group centroids and a difference in within-group dispersion. PERMDISP confirmed homogeneity of multivariate dispersions for both the Area (F = 0.005, p = 0.939) and Zone (F = 0.267, p = 0.586) groupings, validating the assumptions for PERMANOVA interpretation. In the PERMANOVA with permutations restricted within beaches, the Area × Zone interaction was marginally non-significant (F = 1.25, p = 0.067). The between-area PERMANOVA on beach-level centroids (n = 10) showed that Area explained 13.5% of compositional variance but was not significant (F = 1.25, p = 0.263), reflecting high among-beach heterogeneity within each area.
Non-metric multidimensional scaling (nMDS, stress = 0.116, acceptable) revealed considerable overlap between the two areas and two zones in ordination space, although Pagasitikos active-swash samples, particularly from Kala Nera, separated from the main cluster along the axis associated with the pellet biplot vector (Figure 6). Ellipses for the Pagasitikos active swash group were notably larger than those for the NW Aegean, consistent with the higher within-area compositional heterogeneity driven by the pellet hotspot.
Figure 6.
Non-metric multidimensional scaling (nMDS) ordination of microplastic morphotype composition (Bray–Curtis dissimilarity). Points are coloured by coastal area and shaped by zone. 95% confidence ellipses are shown for each group. Biplot vectors indicate the direction and relative magnitude of each morphotype gradient. Stress = 0.116.
SIMPER analysis identified pellets and fragments as the dominant contributors to between-area dissimilarity, accounting for 42.9% and 42.5% of the average Bray–Curtis distance, respectively. The pellet contribution was statistically significant (p = 0.013), whereas the fragment contribution was not (p = 0.686). Foams and the “other” category also yielded significant permutation results (p = 0.003 and p = 0.005, respectively), but their contributions were negligible (0.7% and <0.1%, respectively) and were based on only three and one positive samples. These rare-category results were therefore not interpreted as robust compositional signals. Overall, pellets constituted the only abundant and source-diagnostic morphotype with a significant contribution to between-area dissimilarity.
A supplementary analysis of morphotype diversity detected an Area × Zone interaction for Shannon H′ (F = 4.20, p = 0.043), whereas the Area and Zone main effects were non-significant; full results are provided in Supplementary Results S2.
3.7. Spatial Patterns and Thematic Maps
The composition-pie map (Figure 7) reveals that the highest MP concentrations and the most pellet-dominated compositions occur along the inner Pagasitikos Gulf coastline, particularly at Kala Nera. The pie chart at Kala Nera is visually dominated by the pellet slice and is the largest in the map, whereas the NW Aegean pies are smaller and show a more balanced fragment–pellet–fibre composition. Among the Pagasitikos beaches, Anavros and Alikes also show relatively elevated concentrations, while N. Anchialos, located in the western part of the gulf, has concentrations comparable to the Aegean sites. On the Aegean side, Agiokampos stands out as the highest-concentration open-coast site, potentially reflecting its proximity to seasonal tourism activity.
Figure 7.
Composition-pie map of microplastic morphotype proportions at each sampling site. Pie radius is proportional to the square root of mean total microplastic concentration (items m−2), so that pie area tracks concentration. Colour segments represent each morphotype category. A size legend is provided.
Exploratory Spearman rank correlations were computed within each area, since latitude is confounded with Area across the full set of sites, to test whether variation follows a broad-scale spatial gradient rather than reflecting site-specific inputs. No significant trends were detected in either the Pagasitikos Gulf or the NW Aegean. Similarly, pellet concentration showed no significant latitudinal trend within either area (Pagasitikos: ρ = −0.30, p = 0.683; NW Aegean: ρ = 0.40, p = 0.517). These results suggest that local site-specific factors, rather than large-scale spatial gradients, drive the observed variation in MP contamination.
4. Discussion
4.1. Microplastic Contamination in a Mediterranean Context
Cross-study comparison is constrained by differences in sampling basis, size cut-off, extraction medium and reporting units, which commonly exceed the differences between sites [39]. Within these limits, the concentrations recorded here (105.1 ± 175.1 items m−2) are lower than those reported for beach sediments of the Thermaic Gulf (733.6 ± 136.6 items m−2; [54]) and northern Crete (up to 672 items m−2; [28]), and far below the maximum recorded on beaches of a western Mediterranean marine protected area (up to 13,418 items m−2; [55]). Expressed on a mass basis using the nominal composite mass (Section 2.2), the overall mean corresponds to approximately 131 items kg−1, exceeding the value reported for the shallow subtidal sediments of Samos (37.2 items kg−1; [56]), although the two settings are not equivalent; beach sediments of Salamina Island in the Saronikos Gulf have also been characterized under contrasting land uses [57]. Because our values derive from a standardized fixed-mass composite rather than the complete surface layer of each quadrat, they are conservative relative to full-footprint areal surveys, and the position of this dataset at the lower end of the Mediterranean range is consistent with a semi-urban to rural setting rather than evidence of lower contamination.
The pronounced variability among samples and individual beaches, also reflected by the large standard deviations of several morphotypes in Figure 4, represents substantial spatial heterogeneity rather than analytical uncertainty. This variability was particularly pronounced for pellets in the Pagasitikos Gulf, where localized accumulation at Kala Nera strongly increased both the mean and SD. More generally, the high variability among individual beaches (CV = 91.4%) is a recurring feature in microplastic beach surveys globally [19,20] and underscores the importance of local factors, including proximity to point sources, coastal morphology, wave exposure, and sediment characteristics. In the present study, within-area heterogeneity exceeded the between-area contrast, a finding also reported by [58] for Cretan beaches, where MP concentrations differed by an order of magnitude between adjacent sites separated by only a few kilometres. This dominance of within-area over between-area variance is itself a central finding of the study: it indicates that discrete local inputs, epitomized here by the Kala Nera pellet hotspot, govern contamination patterns more strongly than the broad semi-enclosed-versus-open distinction that motivated the sampling design. This observation reinforces the recommendation that beach microplastic surveys should maximize the number of sites sampled rather than intensifying replication at a small number of locations [41].
4.2. Semi-Enclosed Gulf vs. Open Coast: The Retention Hypothesis
The primary hypothesis of this study was that the restricted hydrodynamic regime of the Pagasitikos Gulf would promote higher microplastic retention than the open NW Aegean coast. The data are consistent with this expectation in direction only: estimated marginal means from the negative binomial GLMM were approximately twice as high in the gulf (99.1 items m−2) as on the open coast (48.0 items m−2), but the difference was not statistically significant (p = 0.110) and, with five beaches per area and pronounced among-beach variance, the comparison is underpowered rather than simply null. A two-fold point estimate resting on this design should be treated as a hypothesis for future testing, not as evidence of a retention effect.
This finding aligns with the emerging understanding that semi-enclosed bays and gulfs function as traps for waterborne pollutants, including microplastics, due to restricted water exchange and longer residence times [22,59]. Hydrodynamic modelling of the Pagasitikos Gulf has demonstrated that circulation is predominantly wind-driven, with limited exchange through the narrow Trikeri Channel [26,36], creating conditions conducive to the retention and onshore deposition of floating debris. Critically, hydrodynamic retention cannot be separated from land-based source proximity in this design. The city and port of Volos, a substantial urban and industrial centre, border the head of the gulf, so any gulf–coast difference confounds longer residence times with closer proximity to terrestrial and industrial inputs. The elevated gulf concentrations are therefore equally consistent with a source-proximity explanation as with a retention explanation, and the present data cannot adjudicate between them. Disentangling these contributions would require paired hydrodynamic modelling and source-apportionment studies that are beyond the scope of the present work.
4.3. The Pellet Hotspot: Evidence for Localized Industrial Input
The clearest and most robust result of this study was the highly localized pellet (nurdle) enrichment in the active swash zone of Kala Nera in the inner Pagasitikos Gulf. In contrast to the equivocal area-level contrast, this pattern is unambiguous: pellets were the sole morphotype with a significant Area × Zone interaction (p = 0.033) and the only significant contributor to between-area compositional dissimilarity (SIMPER, p = 0.013), together identifying a discrete, source-specific input rather than a diffuse hydrodynamic gradient. Pellets/beads constituted 51.7% of all recorded microplastics, and this interaction arises because pellet deposition in the gulf is zone-specific, concentrated in the active swash of particular beaches, whereas pellet loads on the NW Aegean coast are low and approximately uniform between zones. With a mean active-swash total concentration of 592.8 items m−2 (maximum 1297 items m−2), of which pellets accounted for 525.8 items m−2, Kala Nera alone contributed a disproportionate share of the study-wide pellet count.
Industrial pre-production plastic pellets are primary microplastics that enter the environment through losses during manufacturing, handling, or maritime transport [29,30]. Their spherical or cylindrical morphology and uniform size range (typically 2–5 mm) distinguish them from secondary microplastics formed by fragmentation. The port of Volos, located at the head of the Pagasitikos Gulf, handles commercial cargo including plastic raw materials, and the industrial zone surrounding the port includes facilities associated with polymer processing. While the present study did not perform polymer identification to confirm the industrial origin of the recovered pellets, their morphological characteristics and spatial concentration pattern are consistent with a proximal industrial or port-related source. Similar pellet accumulation patterns have been documented near industrial zones and shipping corridors in Malta [30], Lesvos [31], and along the Texas Gulf Coast [60].
Previous studies have similarly identified pre-production pellets as a major or locally dominant component of beach microplastic contamination, particularly near industrial and shipping-related sources [30,31,60]. The predominance of pellets in the present dataset (51.7% of all putative MPs), and particularly their marked enrichment at Kala Nera (525.8 pellets m−2 in the active swash), therefore agrees with the broader evidence that pellet contamination can be highly spatially concentrated rather than uniformly distributed along coastlines. Direct quantitative comparison among studies should nevertheless be made cautiously because sampling designs, particle-size thresholds, and reporting units differ. The restricted hydrodynamics of the Pagasitikos Gulf may further enhance the retention of positively buoyant pellets that would otherwise disperse along an open coastline.
4.4. Cross-Shore Zonation: Variable and Beach-Dependent
No overall significant difference in total MP concentration was detected between the supralittoral and active swash zones (GLMM: p = 0.740; paired Wilcoxon: p = 0.922). This result contrasts with some Mediterranean studies that have reported higher concentrations at the high-tide strandline or supralittoral zone [18,56], but is consistent with others that found no systematic zone differences [19] or reported zone effects that varied depending on site-specific factors [20].
The random-slope model was significantly better than the random-intercept model (LRT: p = 0.0002), confirming that the direction and magnitude of the zone contrast vary across beaches. The beach-level BLUPs identified Kala Nera as the beach with the strongest swash-zone enrichment (slope = −0.80 on the log scale), driven by deposition of morphologically identified pellets in the wave-sorted zone, and Anavros as the beach with the strongest supralittoral enrichment (slope = +0.88), likely reflecting accumulation at the strandline from aeolian transport and high-tide wrack deposition. The negative intercept–slope correlation (r = −0.38) is ecologically informative. Beaches with higher overall contamination tend to show a smaller or even reversed zone contrast, suggesting that heavily impacted sites receive microplastic inputs from multiple depositional pathways that accumulate particles across the entire beach profile. In contrast, less contaminated beaches often exhibit clearer cross-shore zonation, reflecting the predominance of a single depositional mechanism [16,17,61].
These findings have methodological implications for beach MP surveys. A sampling design restricted to a single beach zone would miss the zone-specific pellet signal at Kala Nera or the fragment accumulation at Anavros. The two-zone design employed in this study, combined with the random-slope modelling framework, offers a more complete and statistically appropriate characterization of cross-shore MP variability than designs that pool zones or select only one.
4.5. Morphotype Composition as a Source Indicator
The morphotype composition of microplastics in beach sediments carries valuable diagnostic information about pollution sources and pathways. In this study, fragments (37.2%) were the second most abundant category after pellets and showed a significant Zone effect (p = 0.049), with higher concentrations in the supralittoral. Fragments typically derive from the in situ weathering and breakdown of larger plastic debris deposited at the strandline [16,28] and their supralittoral enrichment is consistent with this secondary fragmentation pathway. The absence of a significant Area effect for fragments suggests that secondary fragmentation is a pervasive process common to both coastal settings.
Fibres, which comprised 10.6% of total MP, showed no significant variation by area or zone, with means of 9.7–12.7 items m−2 across all factor combinations. Fibres are typically associated with wastewater effluent and atmospheric deposition from synthetic textiles [16,27], and their ubiquitous distribution is consistent with a diffuse, non-point-source origin. However, fibres are the morphotype most susceptible to airborne contamination during sampling and laboratory processing [37], and because per-blank counts were not retained, the contribution of such contamination to the reported fibre counts cannot be quantified (Section 4.7). Fibre concentrations should therefore be regarded as upper bounds, although none of the principal conclusions of this study rests on the fibre category.
The SIMPER analysis reinforced the source-diagnostic value of pellets, identifying them as the dominant contributor to between-area dissimilarity (42.9% of the average Bray–Curtis distance, p = 0.013). This result, combined with the significant Area × Zone interaction for pellets in the category-specific GLMM, collectively point to a spatially concentrated, source-specific pellet input in the Pagasitikos Gulf. Confirmation of industrial origin through polymer identification and chemical fingerprinting of adsorbed pollutants would strengthen this interpretation and represent a priority for future work.
4.6. Implications of Storm Daniel for the Pagasitikos Gulf
Storm Daniel caused severe flooding and substantial terrestrial sediment and debris inputs into the Pagasitikos Gulf in September 2023 [62]. Although some of the microplastics detected in May 2026 may represent material deposited or subsequently remobilized following this event, the absence of pre-storm baseline data precludes causal attribution. Repeated temporal monitoring at the same sites will be necessary to determine whether the observed contamination patterns represent persistent local inputs or include a residual post-storm signal.
4.7. Methodological Considerations and Limitations
Several methodological limitations should be considered when interpreting the results. First, saturated NaCl (ρ ~ 1.2 g cm−3) preferentially recovers lower-density polymers and may underrepresent denser plastics such as PVC and PET [32,40]. Moreover, no matrix-specific spike-recovery experiment was conducted; extraction efficiency was therefore not quantified and the reported concentrations were not recovery-corrected. Consequently, the values presented here should be regarded as operational rather than absolute MP concentrations.
Second, particle identification relied on Nile Red fluorescence combined with visual morphological classification under stereomicroscopy. Although this approach provides an efficient means of screening putative microplastics [33,35], Nile Red is not polymer-specific and natural hydrophobic or biogenic material may also fluoresce. In addition, the operational visual-classification limit was approximately 300 µm despite the 32 µm physical retention cutoff, meaning that smaller retained particles could not be consistently identified and are not represented in the reported counts. The pellet category central to the source interpretation was similarly assigned from morphology and size rather than spectroscopic polymer confirmation. The observed pellet enrichment should therefore be interpreted as a pattern of morphologically identified putative pellets pending confirmation by FTIR or Raman spectroscopy.
Third, although procedural blanks were included during laboratory processing, individual blank counts were not retained in the final auditable dataset. A formal blank correction and blank-derived method detection limit could therefore not be calculated, and the magnitude of possible laboratory background contamination cannot be quantified. This limitation is particularly relevant to low-count samples and to fibres, which are susceptible to airborne contamination. Nevertheless, the Kala Nera hotspot was characterized by very high pellet counts (189–1221 pellets among individual active-swash replicates), making it unlikely that a small spatially uniform background alone could account for this pattern; this observation, however, does not substitute for formal blank and recovery validation.
Fourth, concentrations are expressed per 1 m2 quadrat footprint but derive from a fixed-mass composite of the upper 2–3 cm representing only a small fraction of the sediment contained within that footprint. The reported values are therefore standardized, internally comparable indices rather than absolute areal densities. Because quadrat dimensions, sampling depth and composite mass were identical across all samples, this affects the absolute scale of the reported concentrations and their comparability with the wider literature, but not the between-area, between-zone and among-beach contrasts on which the conclusions of this study rest.
The temporal and spatial scope of the study also constrains inference. Sampling was conducted during a single campaign in May 2026 and therefore does not capture seasonal variability associated with changes in tourism, storms, winds, or circulation [13,58]. The approximately two-week difference between sampling of the Pagasitikos Gulf and NW Aegean sites represents an additional temporal limitation, although both campaigns occurred within the same seasonal window and under calm conditions. Furthermore, only five beaches were sampled within each coastal setting. This design limits statistical power for detecting moderate area-level effects and restricts generalization beyond the sampled coastline.
The study did not include contemporaneous nearshore water-column sampling, limiting our ability to directly assess microplastic transport and exchange processes between the semi-enclosed gulf and open coast. Such measurements would help distinguish hydrodynamic retention effects from local source inputs and better explain the observed shoreline contamination patterns.
Finally, replicate samples within each beach zone were collected approximately 5 m apart, and some small-scale spatial dependence cannot be excluded because plastic deposition on sandy beaches may vary over comparable distances [17,63,64]. The random-slope mixed model accounted for beach-specific zone effects, and the principal conclusions were independently corroborated using beach-level non-parametric analyses, for which each beach contributed a single value. Nevertheless, future studies should record replicate positions explicitly and employ nested spatial designs that allow small-scale spatial dependence to be quantified [63].
The analytical framework also included both confirmatory and exploratory components. Tests of Area, Zone, and their interaction for total MP concentration and composition represented the hypothesis-driven core of the study, whereas beach-specific random effects, latitude correlations, and identification of individual hotspot locations were exploratory. Morphotype-specific analyses involved several comparisons without a formal multiplicity correction; therefore, marginal results, particularly the fragment Zone effect (p = 0.049), should be interpreted cautiously and regarded as suggestive rather than definitive.
4.8. Implications and Future Directions
The identification of Kala Nera as a pellet hotspot indicates a need for targeted investigation of potential industrial pellet sources in the greater Volos area, including the commercial port, polymer-processing facilities and associated supply chains. The recent European Union regulation on the prevention of plastic pellet losses [65] provides a regulatory framework for mandatory pellet-handling practices that could be applied to any source so identified. Beach clean-up efforts within the Pagasitikos Gulf should prioritize the active swash zones of inner-gulf beaches, where pellet concentrations are highest and where these particles are available for ingestion by intertidal and shallow-water organisms [5,66].
The high among-beach variability observed in both settings argues for spatially extensive monitoring across many sites rather than intensive sampling of a few sentinel beaches, and future surveys should additionally record replicate positions within a nested spatial design so that small-scale dependence can be estimated rather than assumed [63]. The random-slope GLMM framework used here, which accommodates the nested design and recovers beach-specific zone effects, together with the graduated-symbol and composition-pie mapping used to communicate magnitude and source signature jointly, offers a template for regional monitoring programmes. Future surveys should record the dry mass of each replicate and, where feasible, process the entire surface layer of the quadrat or a measured fraction of it, so that results can be reported simultaneously as areal (items m−2) and mass-based (items kg−1) concentrations.
Three further priorities follow from the limitations set out in Section 4.7. Spectroscopic confirmation of the putative Kala Nera nurdles, matrix-specific recovery experiments and auditable blank records would place the source interpretation on a firmer analytical footing, and repeated seasonal campaigns would establish whether the identified hotspots are persistent or episodic. Beyond beach sediments, coupling shoreline monitoring with nearshore water-column and subtidal sampling, and applying particle-tracking simulations to existing Pagasitikos Gulf circulation models [26,36], would allow dispersal pathways from candidate sources and predicted accumulation zones to be tested directly. Finally, targeted ecotoxicological work at pellet-contaminated sites would translate the spatial patterns documented here into estimates of ecological risk.
5. Conclusions
This study provides the first comparative assessment of microplastic contamination in beach sediments of the semi-enclosed Pagasitikos Gulf and the adjacent open NW Aegean coast. Although mean MP concentrations were higher in the Pagasitikos Gulf, the Area effect was not statistically significant, indicating that the broad semi-enclosed versus open-coast setting alone did not explain the observed contamination pattern. Instead, pronounced among-beach heterogeneity dominated the spatial variation, highlighting the importance of local-scale sources and depositional processes.
The clearest signal was the localized pellet enrichment at Kala Nera, which produced a significant pellet-specific Area × Zone interaction and made pellets the only abundant morphotype contributing significantly to between-area compositional dissimilarity. Cross-shore patterns also varied among beaches rather than following a uniform regional trend. Overall, the results indicate that localized, source-specific inputs may exert a stronger influence on beach microplastic contamination than broad hydrodynamic setting. Beyond documenting regional contamination levels, this study advances previous beach-survey approaches by demonstrating that local source-specific inputs and beach-dependent cross-shore processes can outweigh the broad semi-enclosed–open-coast contrast, highlighting the importance of spatially replicated, zone-resolved sampling for interpreting coastal microplastic patterns. Monitoring strategies should therefore prioritize broad spatial coverage and targeted investigation of identified hotspots, particularly potential pellet sources within the Pagasitikos Gulf.
Supplementary Materials
The following supporting information can be downloaded at https://www.mdpi.com/article/10.3390/eng7090452/s1, Table S1: Overview of the statistical analyses, the rationale for each choice, and the outcome each was designed to detect. Obj. = study objective as listed in the Introduction; Table S2: Descriptive statistics of total microplastic concentration (items m−2) by Beach and Zone; Figure S1: Heatmap of mean microplastic concentration (items m−2) by morphotype, beach, and zone. Darker colours indicate higher concentrations. Values are printed within each cell; Figure S2: Beach-level random slopes (BLUPs) for the Zone effect from the negative binomial GLMM with random slopes. Positive values indicate higher microplastic concentration in the supralittoral zone; negative values indicate higher concentration in the active swash zone. Bars are coloured by coastal area.
Author Contributions
Conceptualization, D.K.; methodology, D.K., P.V., N.L., R.A., P.I.A. and K.V.; software, D.K.; validation, P.V., N.L., R.A., P.I.A. and K.V.; formal analysis, D.K.; investigation, D.K., P.V., N.L., R.A., P.I.A. and K.V.; resources, D.K., R.A., P.I.A. and K.V.; data curation, D.K.; writing—original draft preparation, D.K.; writing—review and editing, D.K., P.V., N.L., R.A., P.I.A. and K.V.; visualization, D.K.; supervision, D.K. and K.V.; project administration, D.K. and K.V. All authors have read and agreed to the published version of the manuscript.
Funding
This research received no external funding.
Institutional Review Board Statement
Not applicable.
Informed Consent Statement
Not applicable.
Data Availability Statement
The raw data supporting the conclusions of this article will be made available by the authors on request.
Conflicts of Interest
The authors declare no conflicts of interest.
References
- Borrelle, S.B.; Ringma, J.; Law, K.L.; Monnahan, C.C.; Lebreton, L.; McGivern, A.; Murphy, E.; Jambeck, J.; Leonard, G.H.; Hilleary, M.A. Predicted Growth in Plastic Waste Exceeds Efforts to Mitigate Plastic Pollution. Science 2020, 369, 1515–1518. [Google Scholar] [CrossRef] [Scilit] [PubMed]
- Geyer, R.; Jambeck, J.R.; Law, K.L. Production, Use, and Fate of All Plastics Ever Made. Sci. Adv. 2017, 3, e1700782. [Google Scholar] [CrossRef] [Scilit] [PubMed]
- Thompson, R.C.; Olsen, Y.; Mitchell, R.P.; Davis, A.; Rowland, S.J.; John, A.W.G.; McGonigle, D.; Russell, A.E. Lost at Sea: Where Is All the Plastic? Science 2004, 304, 838. [Google Scholar] [CrossRef] [Scilit] [PubMed]
- Arthur, C.; Baker, J.E.; Bamford, H.A. Proceedings of the International Research Workshop on the Occurrence, Effects, and Fate of Microplastic Marine Debris, September 9-11, 2008, University of Washington Tacoma, Tacoma, WA, USA; NOAA: Silver Spring, MD, USA, 2009.
- Cole, M.; Lindeque, P.; Halsband, C.; Galloway, T.S. Microplastics as Contaminants in the Marine Environment: A Review. Mar. Pollut. Bull. 2011, 62, 2588–2597. [Google Scholar] [CrossRef] [Scilit] [PubMed]
- Rochman, C.M.; Hoh, E.; Kurobe, T.; Teh, S.J. Ingested Plastic Transfers Hazardous Chemicals to Fish and Induces Hepatic Stress. Sci. Rep. 2013, 3, 3263. [Google Scholar] [CrossRef] [Scilit] [PubMed]
- Andrady, A.L. Microplastics in the Marine Environment. Mar. Pollut. Bull. 2011, 62, 1596–1605. [Google Scholar] [CrossRef] [Scilit] [PubMed]
- Cózar, A.; Sanz-Martín, M.; Martí, E.; González-Gordillo, J.I.; Ubeda, B.; Gálvez, J.Á.; Irigoien, X.; Duarte, C.M. Plastic Accumulation in the Mediterranean Sea. PLoS ONE 2015, 10, e0121762. [Google Scholar] [CrossRef] [Scilit] [PubMed]
- Suaria, G.; Avio, C.G.; Mineo, A.; Lattin, G.L.; Magaldi, M.G.; Belmonte, G.; Moore, C.J.; Regoli, F.; Aliani, S. The Mediterranean Plastic Soup: Synthetic Polymers in Mediterranean Surface Waters. Sci. Rep. 2016, 6, 37551. [Google Scholar] [CrossRef] [Scilit] [PubMed]
- Eriksen, M.; Lebreton, L.C.M.; Carson, H.S.; Thiel, M.; Moore, C.J.; Borerro, J.C.; Galgani, F.; Ryan, P.G.; Reisser, J. Plastic Pollution in the World’s Oceans: More than 5 Trillion Plastic Pieces Weighing over 250,000 Tons Afloat at Sea. PLoS ONE 2014, 9, e111913. [Google Scholar] [CrossRef] [Scilit] [PubMed]
- Cincinelli, A.; Martellini, T.; Guerranti, C.; Scopetani, C.; Chelazzi, D.; Giarrizzo, T. A Potpourri of Microplastics in the Sea Surface and Water Column of the Mediterranean Sea. TrAC Trends Anal. Chem. 2019, 110, 321–326. [Google Scholar] [CrossRef] [Scilit]
- Terzi, Y.; Gündoğdu, S.; Tekman, M.B.; Gedik, K.; Ustaoğlu, D.; Ismail, N.P.; Altinpinar, İ.; Öztürk, R.Ç.; Aydın, İ. How Much Do We Know about the Microplastic Distribution in the Mediterranean Sea: A Comprehensive Review. Mar. Pollut. Bull. 2024, 208, 117049. [Google Scholar] [CrossRef] [Scilit] [PubMed]
- Prevenios, M.; Zeri, C.; Tsangaris, C.; Liubartseva, S.; Fakiris, E.; Papatheodorou, G. Beach Litter Dynamics on Mediterranean Coasts: Distinguishing Sources and Pathways. Mar. Pollut. Bull. 2018, 129, 448–457. [Google Scholar] [CrossRef] [Scilit] [PubMed]
- Kordella, S.; Geraga, M.; Papatheodorou, G.; Fakiris, E.; Mitropoulou, I.M. Litter Composition and Source Contribution for 80 Beaches in Greece, Eastern Mediterranean: A Nationwide Voluntary Clean-up Campaign. Aquat. Ecosyst. Health Manag. 2013, 16, 111–118. [Google Scholar] [CrossRef] [Scilit]
- Digka, N.; Tsangaris, C.; Torre, M.; Anastasopoulou, A.; Zeri, C. Microplastics in Mussels and Fish from the Northern Ionian Sea. Mar. Pollut. Bull. 2018, 135, 30–40. [Google Scholar] [CrossRef] [Scilit] [PubMed]
- Browne, M.A.; Crump, P.; Niven, S.J.; Teuten, E.; Tonkin, A.; Galloway, T.; Thompson, R. Accumulation of Microplastic on Shorelines Woldwide: Sources and Sinks. Environ. Sci. Technol. 2011, 45, 9175–9179. [Google Scholar] [CrossRef] [Scilit] [PubMed]
- Turra, A.; Manzano, A.B.; Dias, R.J.S.; Mahiques, M.M.; Barbosa, L.; Balthazar-Silva, D.; Moreira, F.T. Three-Dimensional Distribution of Plastic Pellets in Sandy Beaches: Shifting Paradigms. Sci. Rep. 2014, 4, 4435. [Google Scholar] [CrossRef] [Scilit] [PubMed]
- Laglbauer, B.J.L.; Franco-Santos, R.M.; Andreu-Cazenave, M.; Brunelli, L.; Papadatou, M.; Palatinus, A.; Grego, M.; Deprez, T. Macrodebris and Microplastics from Beaches in Slovenia. Mar. Pollut. Bull. 2014, 89, 356–366. [Google Scholar] [CrossRef] [Scilit] [PubMed]
- Lots, F.A.E.; Behrens, P.; Vijver, M.G.; Horton, A.A.; Bosker, T. A Large-Scale Investigation of Microplastic Contamination: Abundance and Characteristics of Microplastics in European Beach Sediment. Mar. Pollut. Bull. 2017, 123, 219–226. [Google Scholar] [CrossRef] [Scilit] [PubMed]
- De-la-Torre, G.E.; Dioses-Salinas, D.C.; Castro, J.M.; Antay, R.; Fernández, N.Y.; Espinoza-Morriberón, D.; Saldaña-Serrano, M. Abundance and Distribution of Microplastics on Sandy Beaches of Lima, Peru. Mar. Pollut. Bull. 2020, 151, 110877. [Google Scholar] [CrossRef] [Scilit] [PubMed]
- Constant, M.; Ludwig, W.; Kerhervé, P.; Sola, J.; Charrière, B.; Sanchez-Vidal, A.; Canals, M.; Heussner, S. Microplastic Fluxes in a Large and a Small Mediterranean River Catchments: The Têt and the Rhône, Northwestern Mediterranean Sea. Sci. Total Environ. 2020, 716, 136984. [Google Scholar] [CrossRef] [Scilit] [PubMed]
- Liu, K.; Zhang, Z.; Wu, H.; Wang, J.; Wang, R.; Zhang, T.; Feng, Z.; Li, D. Accumulation of Microplastics in a Downstream Area of a Semi-Enclosed Bay: Implications of Input from Coastal Currents. Sci. Total Environ. 2021, 791, 148280. [Google Scholar] [CrossRef] [Scilit] [PubMed]
- Yabanlı, M.; Yozukmaz, A.; Şener, İ.; Ölmez, Ö.T. Microplastic Pollution at the Intersection of the Aegean and Mediterranean Seas: A Study of the Datça Peninsula (Turkey). Mar. Pollut. Bull. 2019, 145, 47–55. [Google Scholar] [CrossRef] [Scilit] [PubMed]
- Browne, M.A.; Galloway, T.S.; Thompson, R.C. Spatial Patterns of Plastic Debris along Estuarine Shorelines. Environ. Sci. Technol. 2010, 44, 3404–3409. [Google Scholar] [CrossRef] [Scilit] [PubMed]
- Petihakis, G.; Triantafyllou, G.; Korres, G.; Tsiaras, K.; Theodorou, A. Ecosystem Modelling: Towards the Development of a Management Tool for a Marine Coastal System Part-II, Ecosystem Processes and Biogeochemical Fluxes. J. Mar. Syst. 2012, 94, S49–S64. [Google Scholar] [CrossRef] [Scilit]
- Bousbouras, G.; Angelidis, P. Hydrodynamic Simulation of the Pagasitikos Gulf, Greece. Comput. Water Energy Environ. Eng. 2024, 13, 58–85. [Google Scholar] [CrossRef]
- Dris, R.; Gasperi, J.; Saad, M.; Mirande, C.; Tassin, B. Synthetic Fibers in Atmospheric Fallout: A Source of Microplastics in the Environment? Mar. Pollut. Bull. 2016, 104, 290–293. [Google Scholar] [CrossRef] [Scilit] [PubMed]
- Karkanorachaki, K.; Kiparissis, S.; Kalogerakis, G.C.; Yiantzi, E.; Psillakis, E.; Kalogerakis, N. Plastic Pellets, Meso-and Microplastics on the Coastline of Northern Crete: Distribution and Organic Pollution. Mar. Pollut. Bull. 2018, 133, 578–589. [Google Scholar] [CrossRef] [Scilit] [PubMed]
- Karlsson, T.M.; Arneborg, L.; Broström, G.; Almroth, B.C.; Gipperth, L.; Hassellöv, M. The Unaccountability Case of Plastic Pellet Pollution. Mar. Pollut. Bull. 2018, 129, 52–60. [Google Scholar] [CrossRef] [Scilit] [PubMed]
- Turner, A.; Holmes, L. Occurrence, Distribution and Characteristics of Beached Plastic Production Pellets on the Island of Malta (Central Mediterranean). Mar. Pollut. Bull. 2011, 62, 377–381. [Google Scholar] [CrossRef] [Scilit] [PubMed]
- Karapanagioti, H.K.; Klontza, I. Investigating the Properties of Plastic Resin Pellets Found in the Coastal Areas of Lesvos Island. Glob. Nest. Int. J. 2007, 9, 71–76. [Google Scholar]
- Nuelle, M.-T.; Dekiff, J.H.; Remy, D.; Fries, E. A New Analytical Approach for Monitoring Microplastics in Marine Sediments. Environ. Pollut. 2014, 184, 161–169. [Google Scholar] [CrossRef] [Scilit] [PubMed]
- Maes, T.; Jessop, R.; Wellner, N.; Haupt, K.; Mayes, A.G. A Rapid-Screening Approach to Detect and Quantify Microplastics Based on Fluorescent Tagging with Nile Red. Sci. Rep. 2017, 7, 44501. [Google Scholar] [CrossRef] [Scilit] [PubMed]
- Shim, W.J.; Song, Y.K.; Hong, S.H.; Jang, M. Identification and Quantification of Microplastics Using Nile Red Staining. Mar. Pollut. Bull. 2016, 113, 469–476. [Google Scholar] [CrossRef] [Scilit] [PubMed]
- Erni-Cassola, G.; Gibson, M.I.; Thompson, R.C.; Christie-Oleza, J.A. Lost, but Found with Nile Red: A Novel Method for Detecting and Quantifying Small Microplastics (1 Mm to 20 Mm) in Environmental Samples. Environ. Sci. Technol. 2017, 51, 13641–13648. [Google Scholar] [CrossRef] [Scilit] [PubMed]
- Petihakis, G.; Triantafyllou, G.; Korres, G.; Pollani, A.; Theodorou, A. Ecosystem Modeling: Towards the Development of a Management Tool for a Marine Coastal System. Part I: General Circulation, Hydrological and Dynamical Structure. J. Mar. Syst. 2012, 94, S34–S48. [Google Scholar] [CrossRef] [Scilit]
- Lusher, A.L.; Welden, N.A.; Sobral, P.; Cole, M. Sampling, Isolating and Identifying Microplastics Ingested by Fish and Invertebrates. In Analysis of Nanoplastics and Microplastics in Food; CRC Press: Boca Raton, FL, USA, 2020; pp. 119–148. [Google Scholar]
- Quinn, B.; Murphy, F.; Ewins, C. Validation of Density Separation for the Rapid Recovery of Microplastics from Sediment. Anal. Methods 2017, 9, 1491–1498. [Google Scholar] [CrossRef] [Scilit]
- Hidalgo-Ruz, V.; Gutow, L.; Thompson, R.C.; Thiel, M. Microplastics in the Marine Environment: A Review of the Methods Used for Identification and Quantification. Environ. Sci. Technol. 2012, 46, 3060–3075. [Google Scholar] [CrossRef] [Scilit] [PubMed]
- Claessens, M.; Van Cauwenberghe, L.; Vandegehuchte, M.B.; Janssen, C.R. New Techniques for the Detection of Microplastics in Sediments and Field Collected Organisms. Mar. Pollut. Bull. 2013, 70, 227–233. [Google Scholar] [CrossRef] [Scilit] [PubMed]
- GESAMP. Guidelines for the Monitoring and Assessment of Plastic Litter in the Ocean. J. Ser. GESAMP Rep. Stud. 2019, 99, 130. [Google Scholar]
- Hartmann, N.B.; Huffer, T.; Thompson, R.C.; Hassellov, M.; Verschoor, A.; Daugaard, A.E.; Rist, S.; Karlsson, T.; Brennholt, N.; Cole, M. Are We Speaking the Same Language? Recommendations for a Definition and Categorization Framework for Plastic Debris. Environ. Sci. Technol. 2019, 53, 1039–1047. [Google Scholar] [CrossRef] [Scilit] [PubMed]
- R Core Team. A Language and Environment for Statistical Computing; R Foundation for Statistical Computing: Vienna, Austria, 2026. [Google Scholar] [CrossRef] [Scilit]
- Brooks, M.E.; Kristensen, K.; Van Benthem, K.J.; Magnusson, A.; Berg, C.W.; Nielsen, A.; Skaug, H.J.; Mächler, M.; Bolker, B.M. GlmmTMB Balances Speed and Flexibility among Packages for Zero-Inflated Generalized Linear Mixed Modeling. R J. 2017, 9, 378–400. [Google Scholar] [CrossRef] [Scilit]
- Fox, J.; Weisberg, S. An R Companion to Applied Regression, 3rd ed.; SAGE Publications, Inc.: Thousand Oaks, CA, USA, 2018. [Google Scholar]
- Lenth, R. Emmeans: Estimated Marginal Means, Aka Least-Squares Means, version 1.8.5; The R Foundation: Vienna, Austria, 2023. [Google Scholar]
- Hartig, F. DHARMa: Residual Diagnostics for Hierarchical (Multi-Level/Mixed) Regression Models, version 0.1.0; The R Foundation: Vienna, Austria, 2016. [Google Scholar]
- Bray, J.R.; Curtis, J.T. An Ordination of the Upland Forest Communities of Southern Wisconsin. Ecol. Monogr. 1957, 27, 326–349. [Google Scholar] [CrossRef] [Scilit] [PubMed]
- Oksanen, J.; Simpson, G.L.; Blanchet, F.G.; Kindt, R.; Legendre, P.; Minchin, P.R.; O’Hara, R.B.; Solymos, P.; Stevens, M.H.H.; Szoecs, E. Vegan: Community Ecology Package, version 1.0-1; The R Foundation: Vienna, Austria, 2001. [Google Scholar]
- Anderson, M.J. A New Method for Non-Parametric Multivariate Analysis of Variance. Austral Ecol. 2001, 26, 32–46. [Google Scholar] [CrossRef]
- Anderson, M.J. Distance-Based Tests for Homogeneity of Multivariate Dispersions. Biometrics 2006, 62, 245–253. [Google Scholar] [CrossRef] [Scilit] [PubMed]
- Clarke, K.R. Non-parametric Multivariate Analyses of Changes in Community Structure. Aust. J. Ecol. 1993, 18, 117–143. [Google Scholar] [CrossRef] [Scilit]
- Bates, D.; Mächler, M.; Bolker, B.; Walker, S. Fitting Linear Mixed-Effects Models Using Lme4. J. Stat. Softw. 2015, 67, 1–48. [Google Scholar] [CrossRef] [Scilit]
- Kermenidou, M.; Frydas, I.S.; Moschoula, E.; Kousis, D.; Christofilos, D.; Karakitsios, S.; Sarigiannis, D. Quantification and Characterization of Microplastics in the Thermaic Gulf, in the North Aegean Sea. Sci. Total Environ. 2023, 892, 164299. [Google Scholar] [CrossRef] [Scilit] [PubMed]
- Compa, M.; Alomar, C.; Morato, M.; Álvarez, E.; Deudero, S. Spatial Distribution of Macro-and Micro-Litter Items along Rocky and Sandy Beaches of a Marine Protected Area in the Western Mediterranean Sea. Mar. Pollut. Bull. 2022, 178, 113520. [Google Scholar] [CrossRef] [Scilit] [PubMed]
- De Ruijter, V.N.; Milou, A.; Costa, V. Assessment of Microplastics Distribution and Stratification in the Shallow Marine Sediments of Samos Island, Eastern Mediterranean Sea, Greece. Mediterr. Mar. Sci. 2019, 20, 736–744. [Google Scholar] [CrossRef] [Scilit]
- Tziourrou, P.; Megalovasilis, P.; Tsounia, M.; Karapanagioti, H.K. Characteristics of Microplastics on Two Beaches Affected by Different Land Uses in Salamina Island in Saronikos Gulf, East Mediterranean. Mar. Pollut. Bull. 2019, 149, 110531. [Google Scholar] [CrossRef] [Scilit] [PubMed]
- Piperagkas, O.; Papageorgiou, N. Changes in (Micro and Macro) Plastic Pollution in the Sediment of Three Sandy Beaches in the Eastern Mediterranean Sea, in Relation to Seasonality, Beach Use and Granulometry. Mar. Pollut. Bull. 2021, 173, 113014. [Google Scholar] [CrossRef] [Scilit] [PubMed]
- Li, Y.; Lu, Q.; Yang, J.; Xing, Y.; Ling, W.; Liu, K.; Yang, Q.; Ma, H.; Pei, Z.; Wu, T. The Fate of Microplastic Pollution in the Changjiang River Estuary: A Review. J. Clean. Prod. 2023, 425, 138970. [Google Scholar] [CrossRef] [Scilit]
- Tunnell, J.W.; Dunning, K.H.; Scheef, L.P.; Swanson, K.M. Measuring Plastic Pellet (Nurdle) Abundance on Shorelines throughout the Gulf of Mexico Using Citizen Scientists: Establishing a Platform for Policy-Relevant Research. Mar. Pollut. Bull. 2020, 151, 110794. [Google Scholar] [CrossRef] [Scilit] [PubMed]
- Kane, I.A.; Clare, M.A.; Miramontes, E.; Wogelius, R.; Rothwell, J.J.; Garreau, P.; Pohl, F. Seafloor Microplastic Hotspots Controlled by Deep-Sea Circulation. Science 2020, 368, 1140–1145. [Google Scholar] [CrossRef] [Scilit] [PubMed]
- Doumpas, N.; Boot, C.V.K.; Bikiaris, D.N.; Charitou, A.; Fakiris, E.; Kalaronis, D.; Konidari, N.; Lambropoulou, D.; Loughman, I.; Tzioga, I. Microplastic Pollution in Greek Seas: Abundance, Spatio-Temporal Dynamics, Potential Sources and Post-Storm Amplification; SSRN: Rochester, NY, USA, 2025. [Google Scholar] [CrossRef] [Scilit]
- Fisner, M.; Majer, A.P.; Balthazar-Silva, D.; Gorman, D.; Turra, A. Quantifying Microplastic Pollution on Sandy Beaches: The Conundrum of Large Sample Variability and Spatial Heterogeneity. Environ. Sci. Pollut. Res. 2017, 24, 13732–13740. [Google Scholar] [CrossRef] [Scilit] [PubMed]
- Moreira, F.T.; Prantoni, A.L.; Martini, B.; de Abreu, M.A.; Stoiev, S.B.; Turra, A. Small-Scale Temporal and Spatial Variability in the Abundance of Plastic Pellets on Sandy Beaches: Methodological Considerations for Estimating the Input of Microplastics. Mar. Pollut. Bull. 2016, 102, 114–121. [Google Scholar] [CrossRef] [Scilit] [PubMed]
- European Commission. Regulation (EU) 2025/2365 of the European Parliament and of the Council of 12 November 2025 on Preventing Plastic Pellet Losses to Reduce Microplastic Pollution; European Union: Brussels, Belgium, 2025. [Google Scholar]
- Wright, S.L.; Thompson, R.C.; Galloway, T.S. The Physical Impacts of Microplastics on Marine Organisms: A Review. Environ. Pollut. 2013, 178, 483–492. [Google Scholar] [CrossRef] [Scilit] [PubMed]
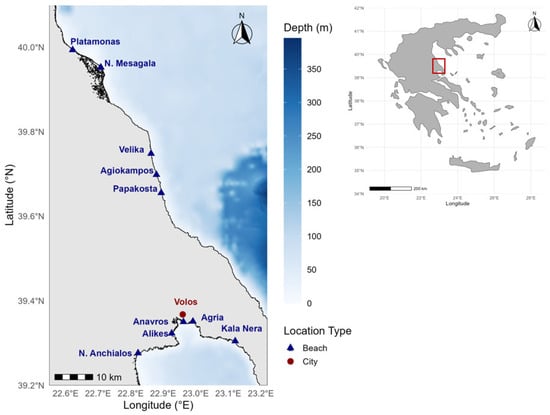
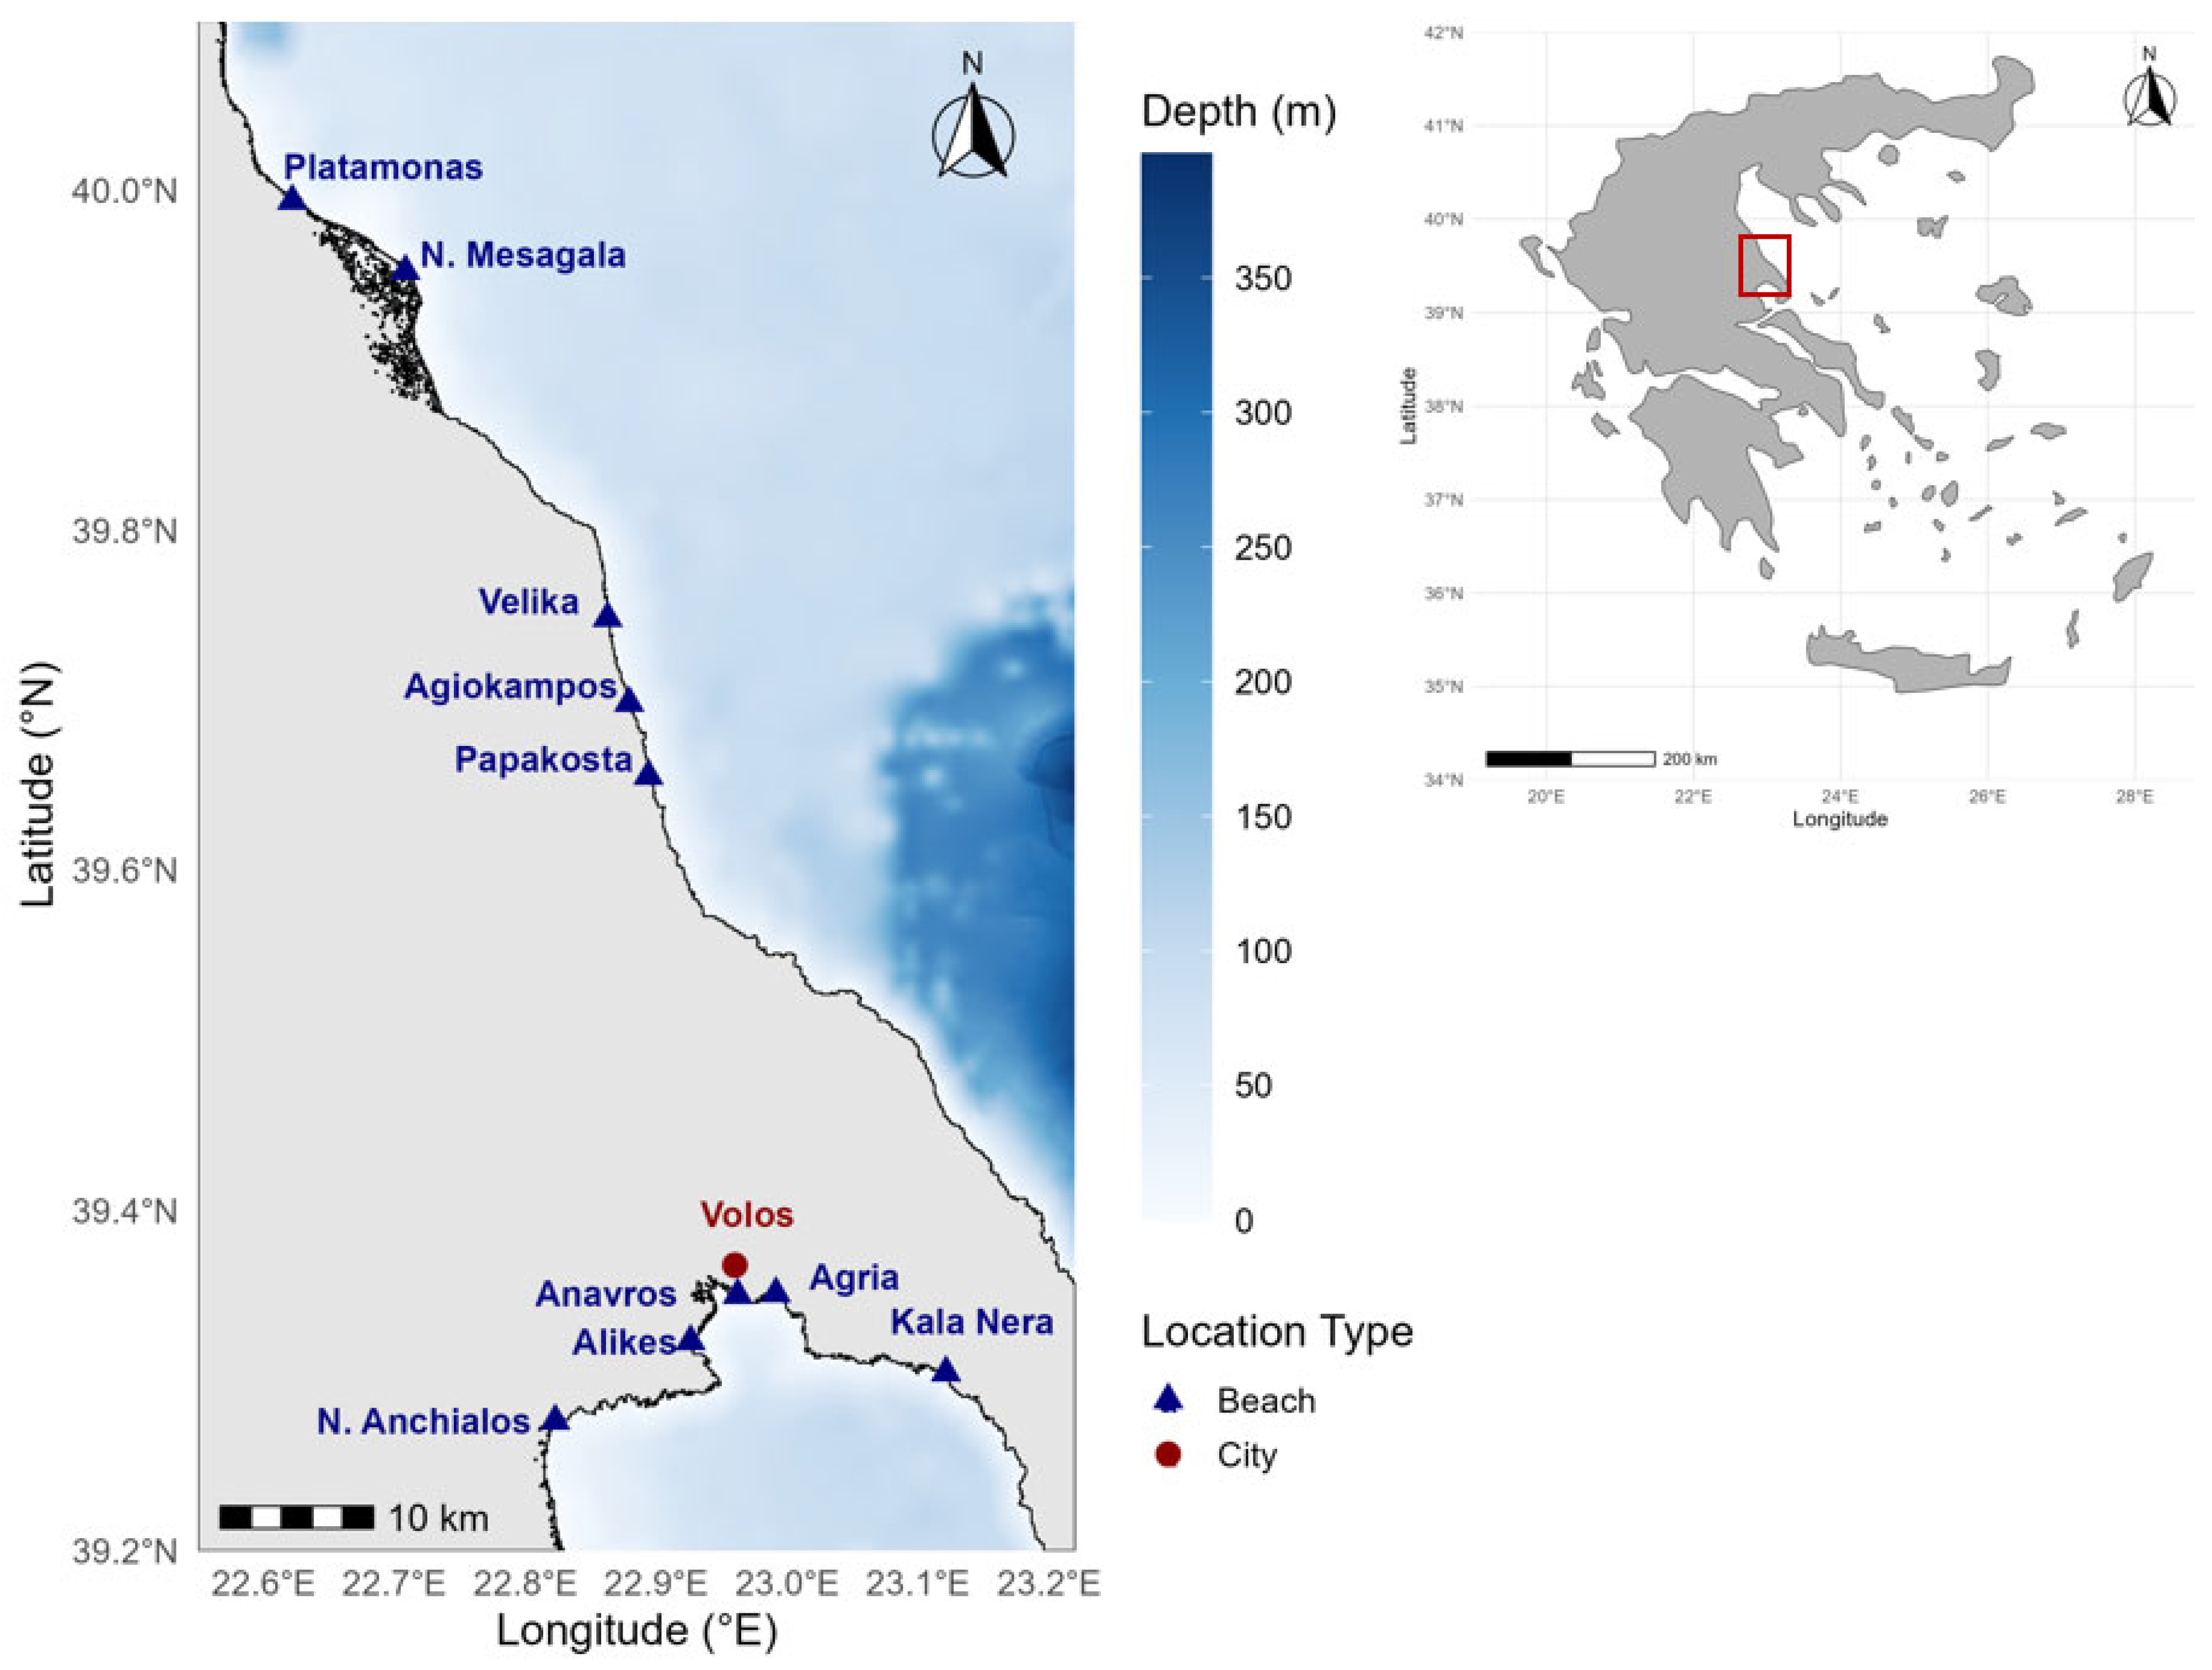
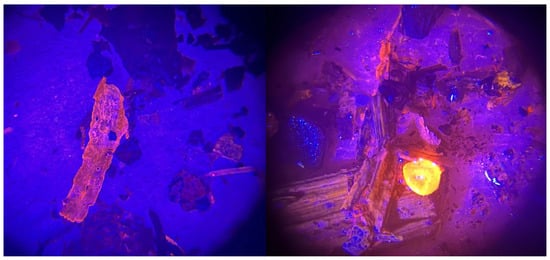
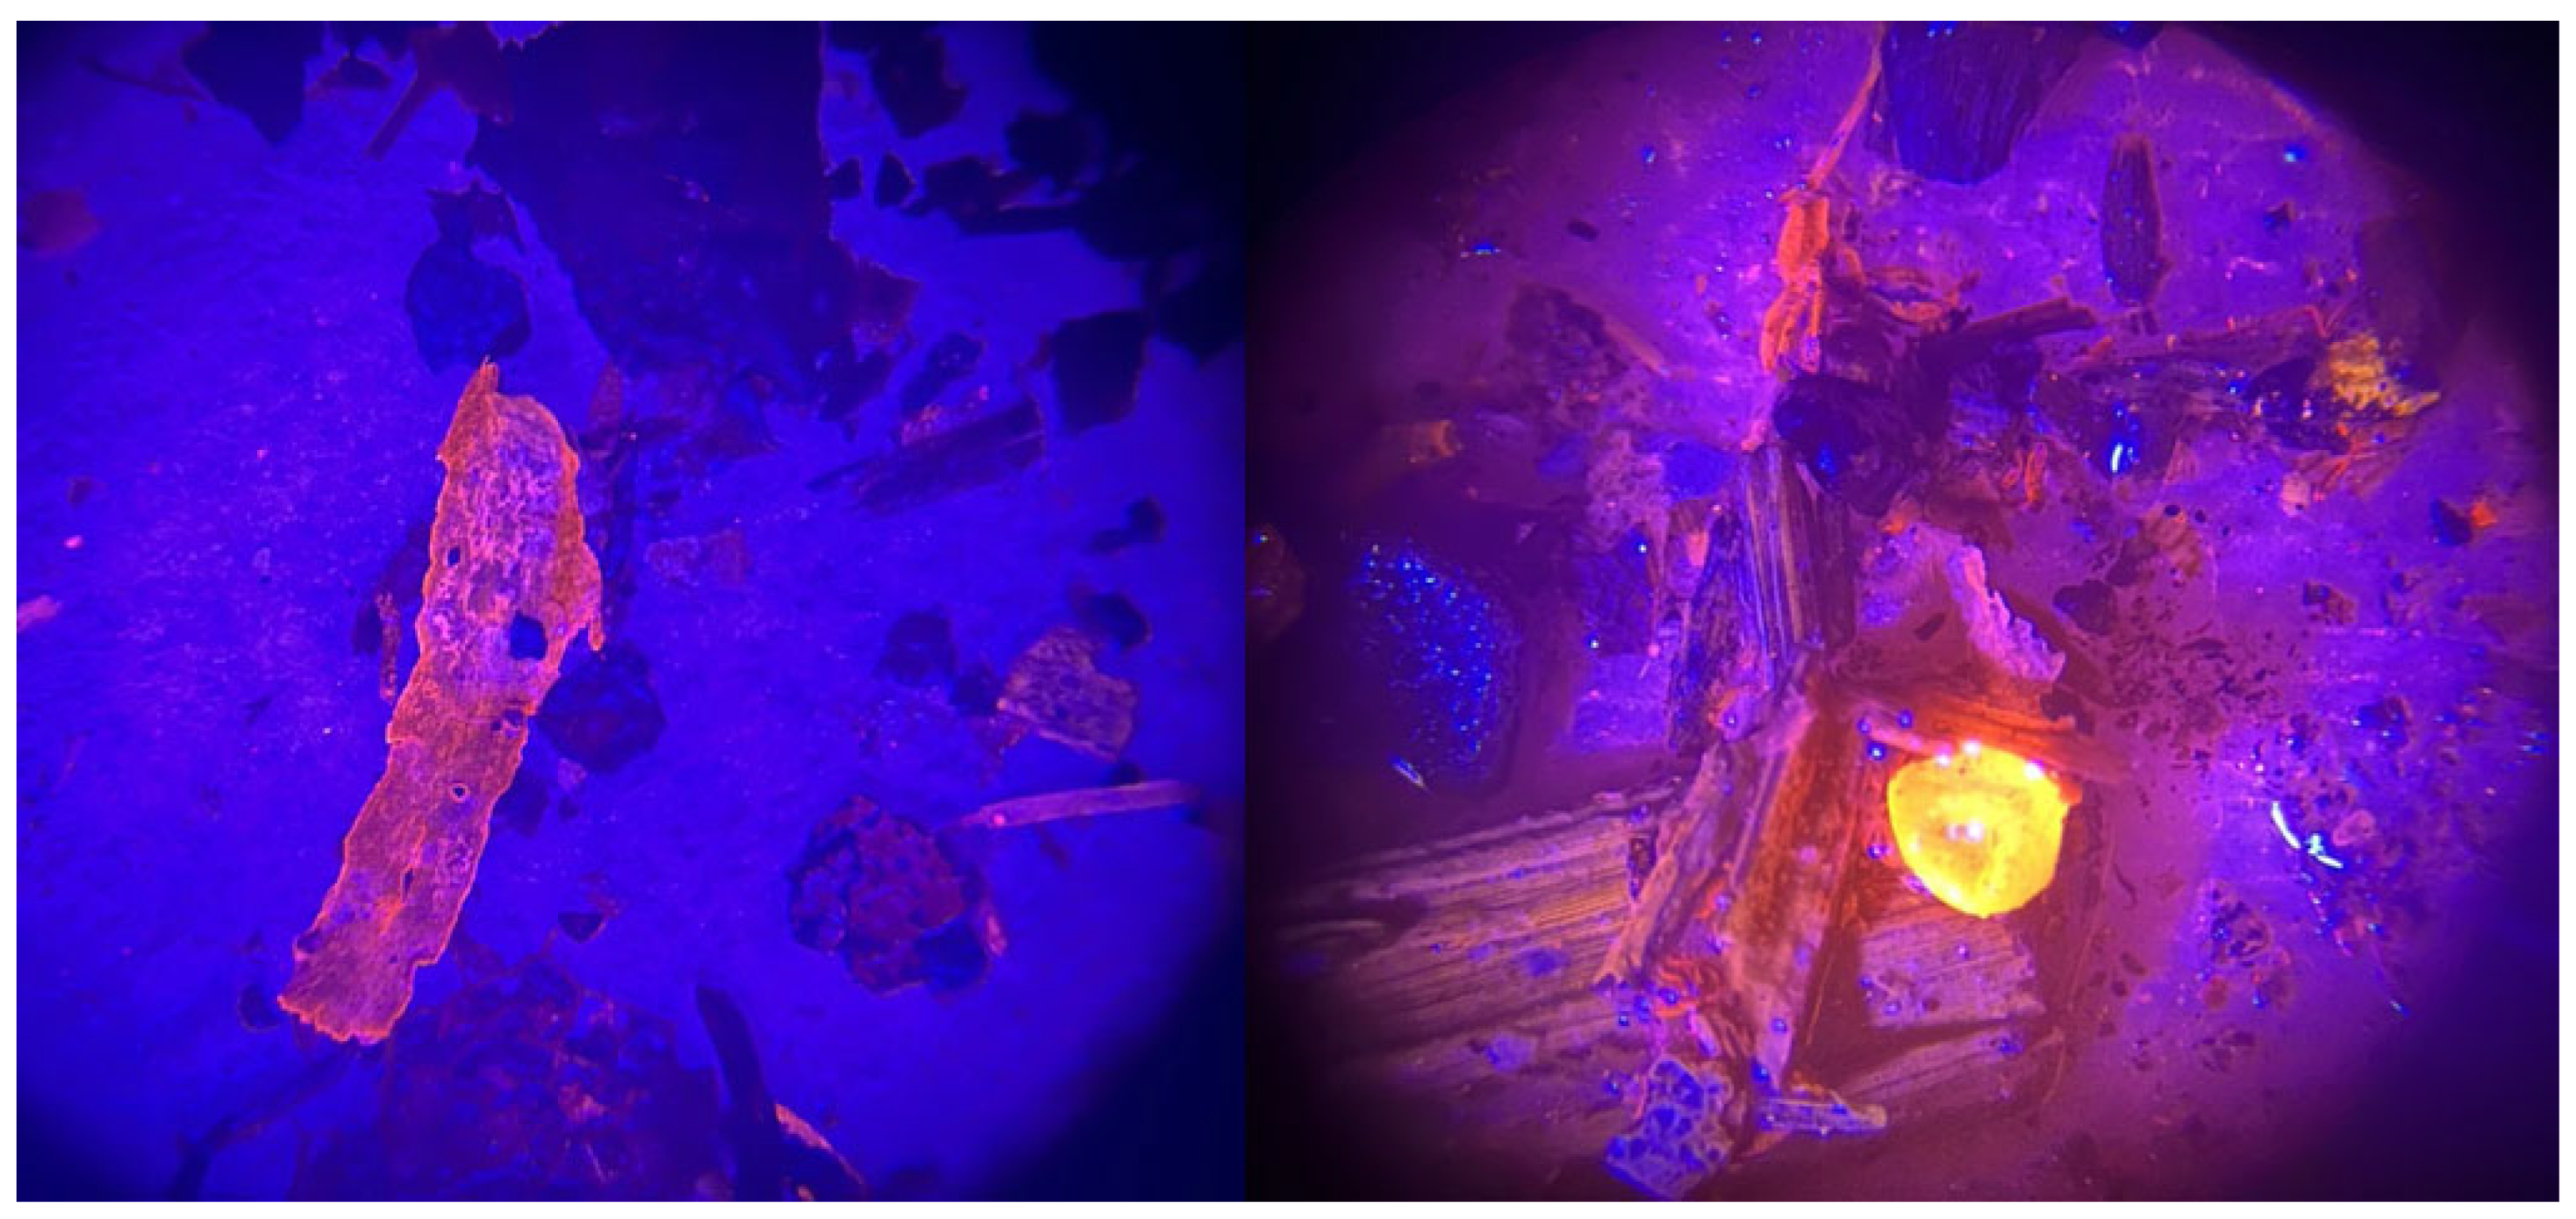
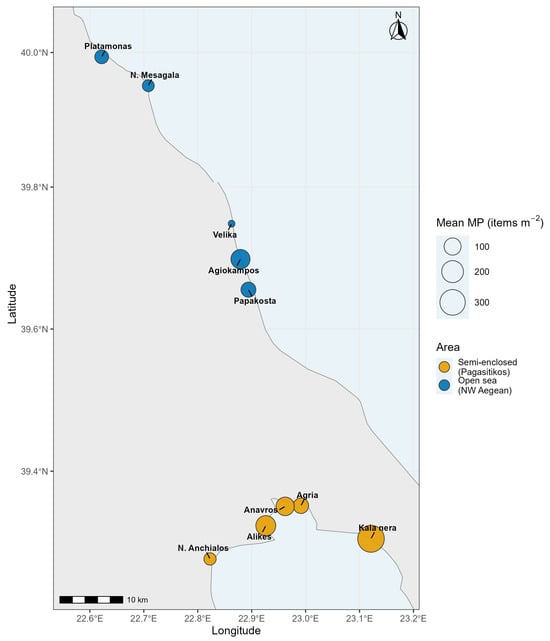
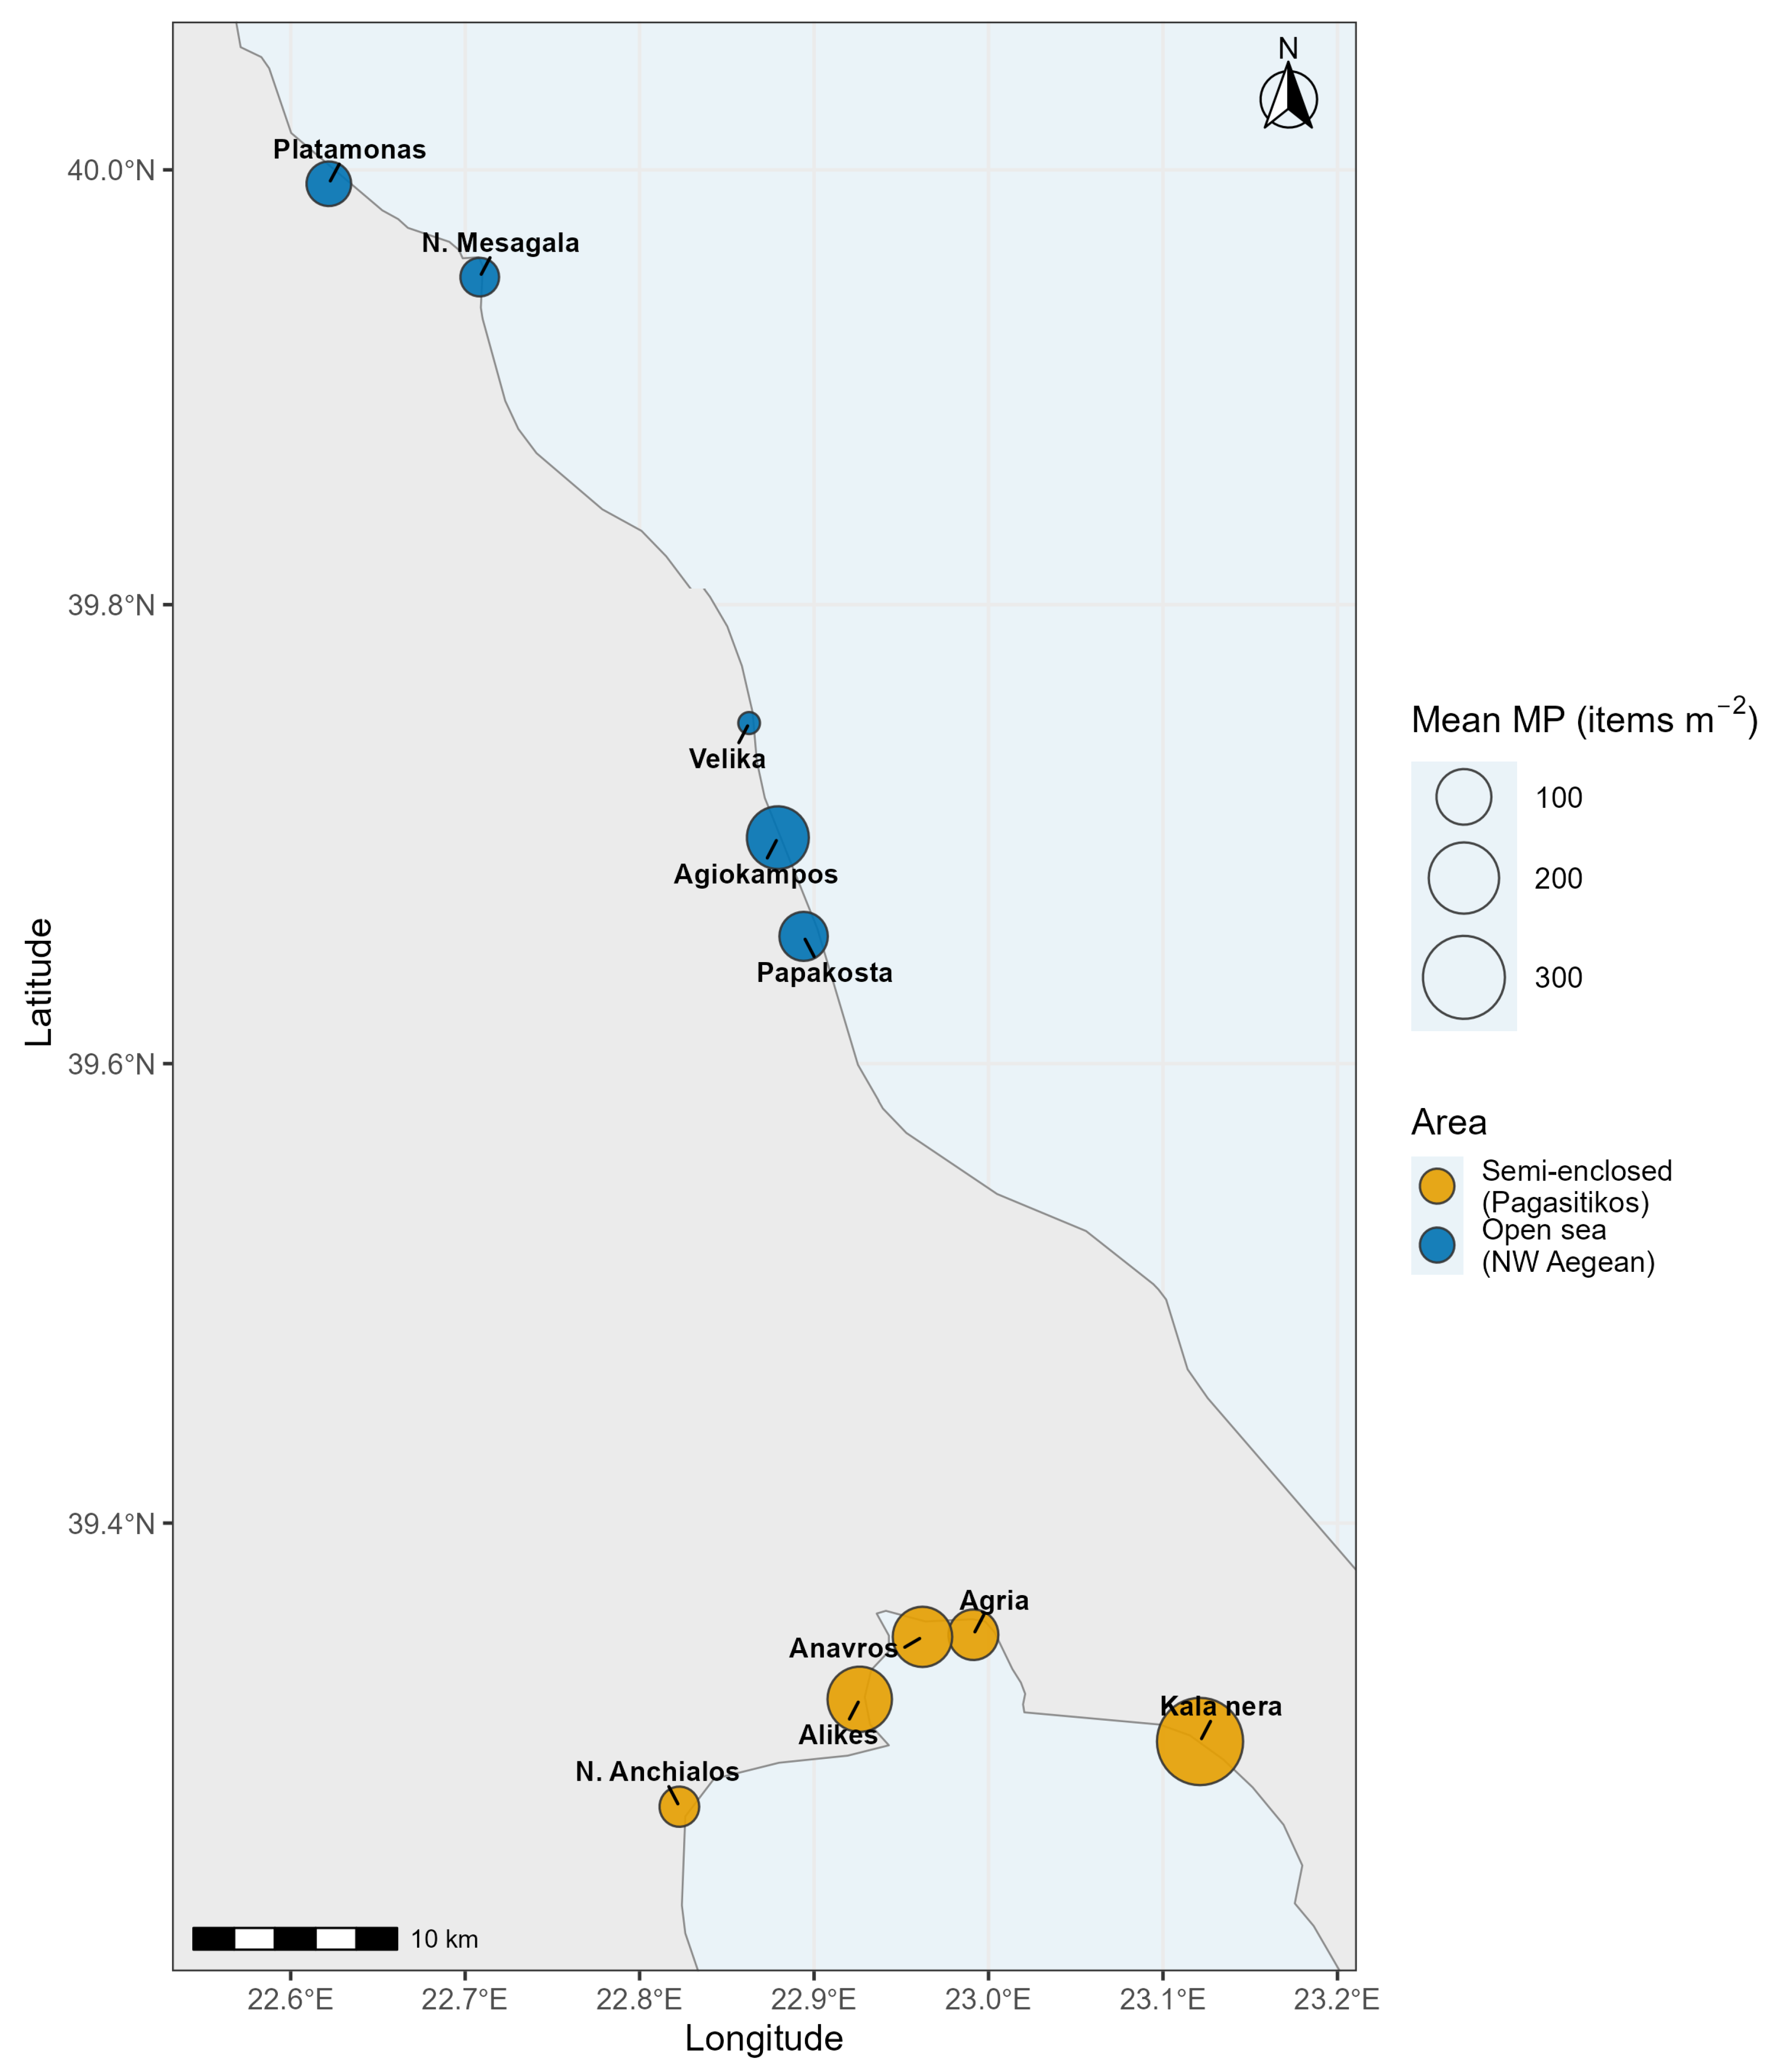
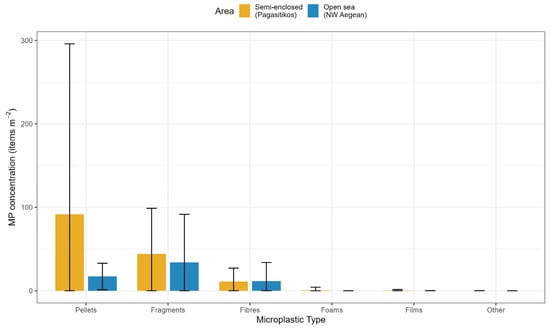
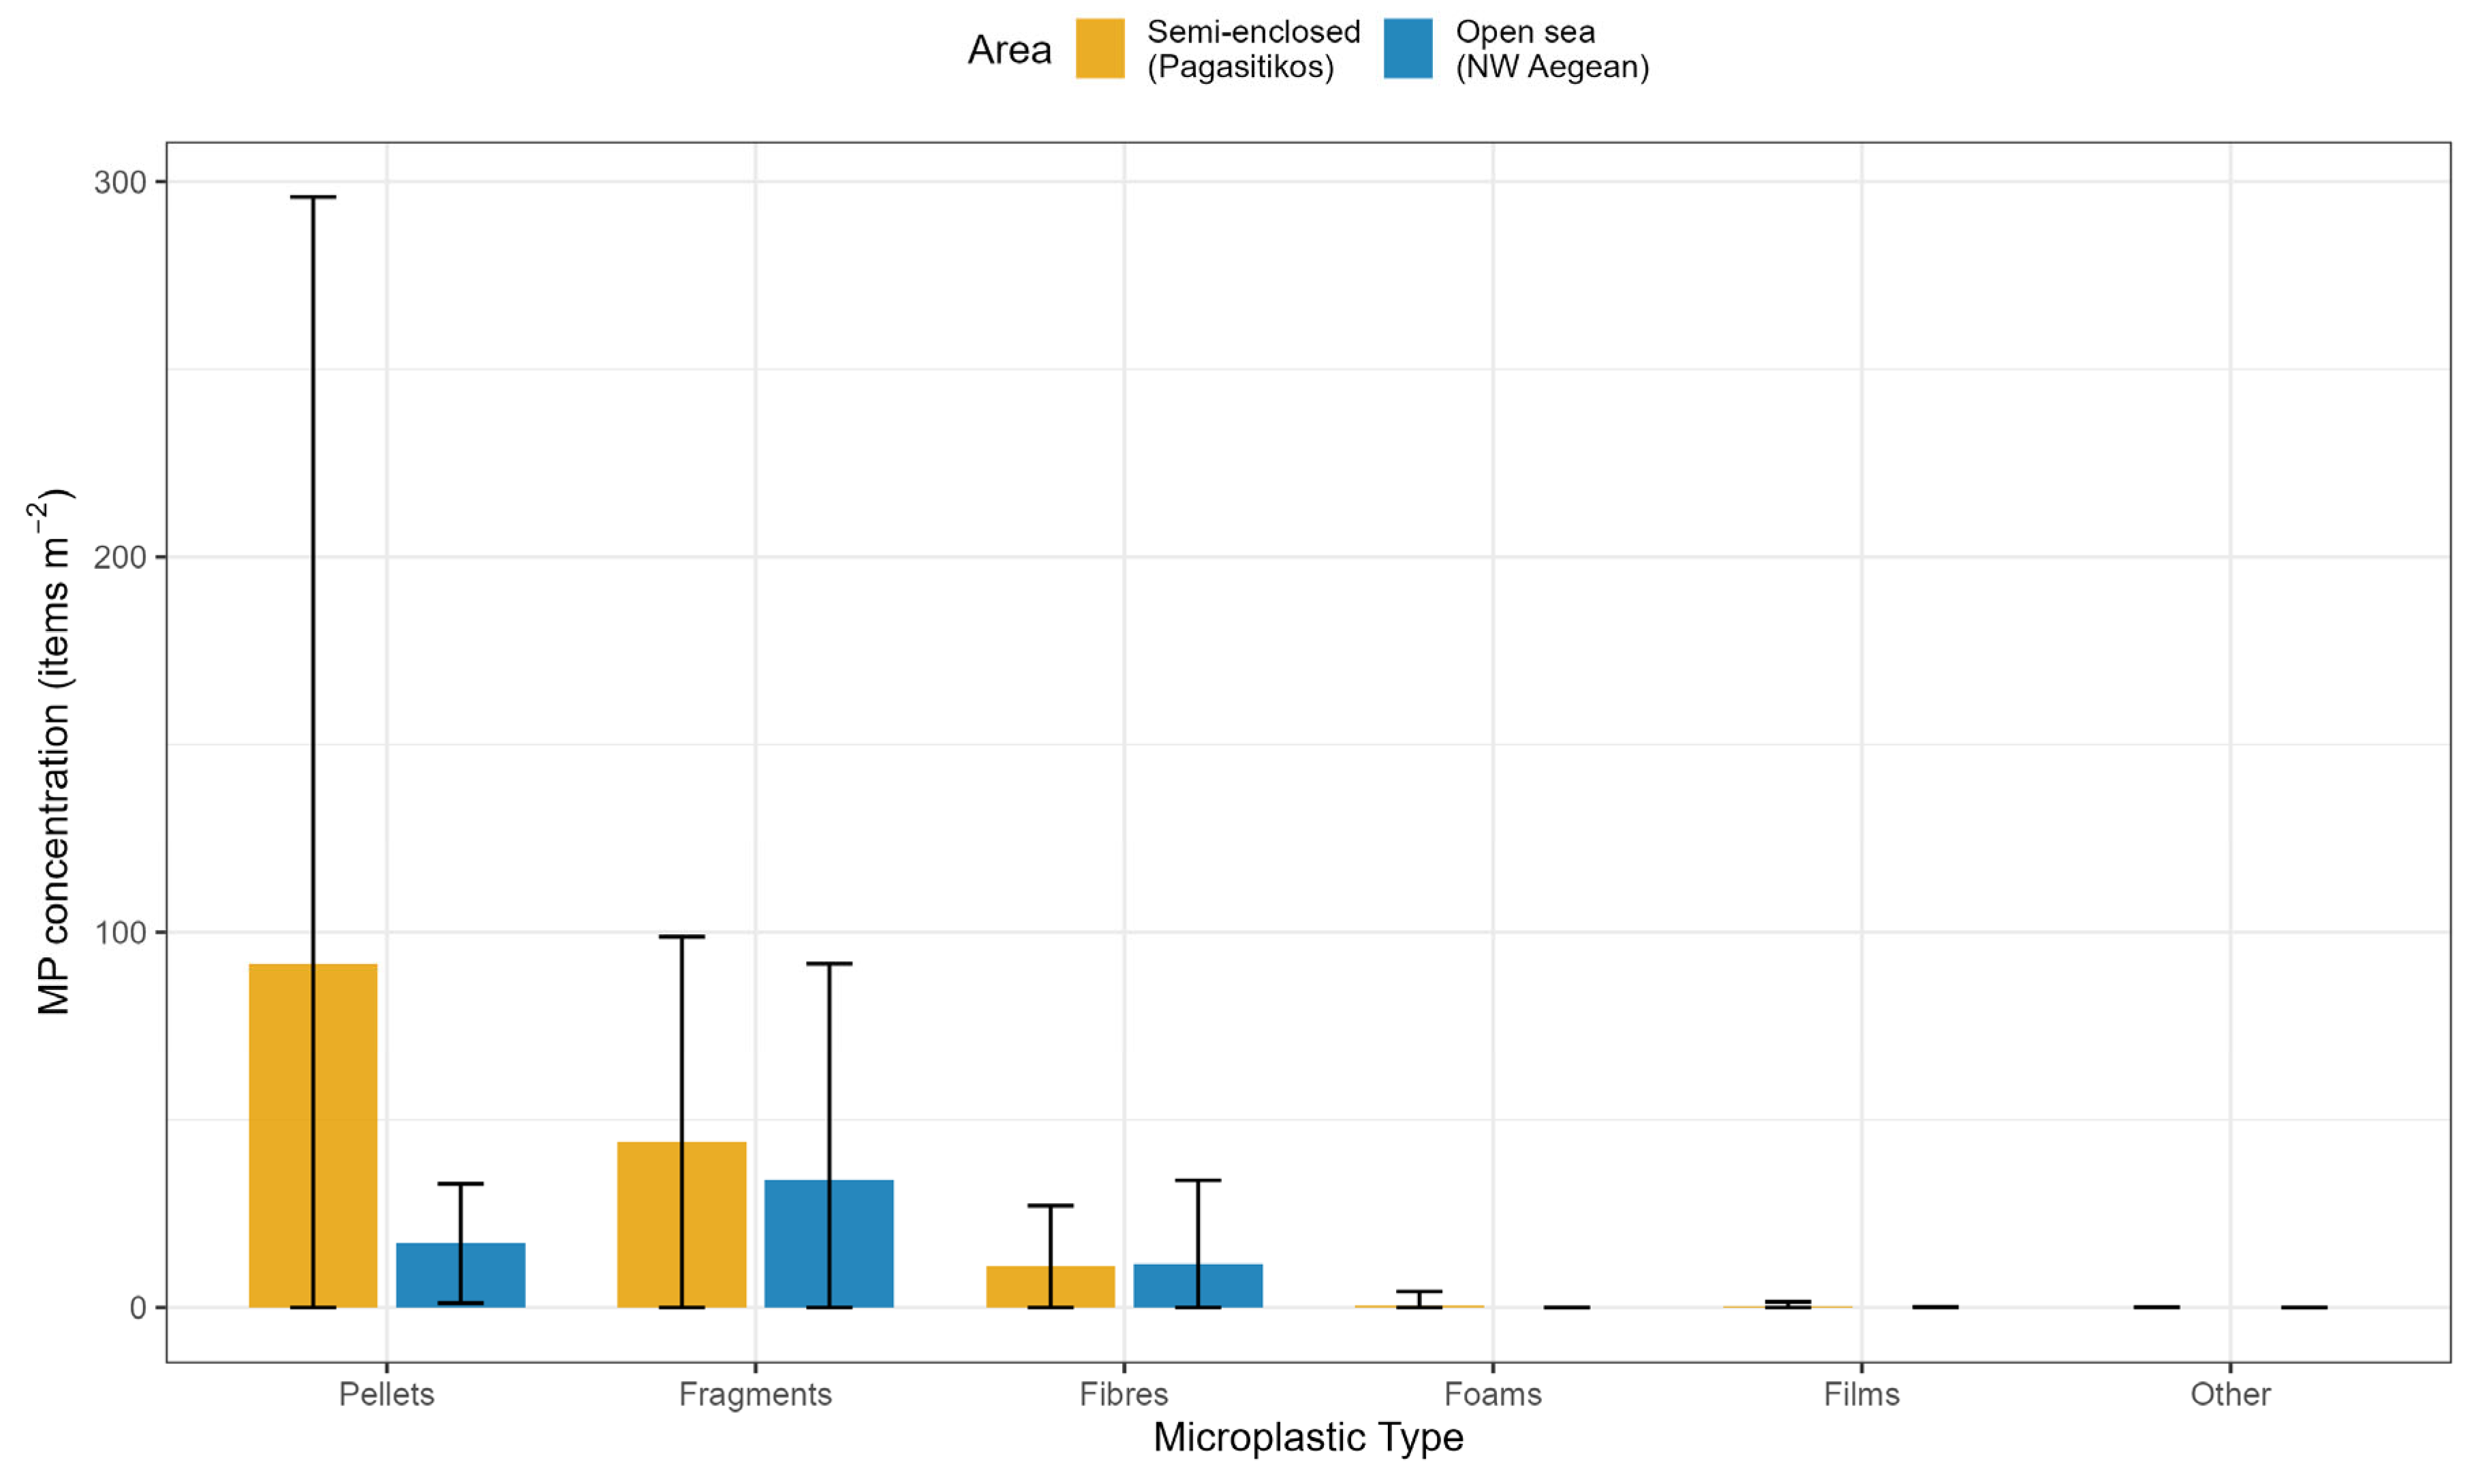
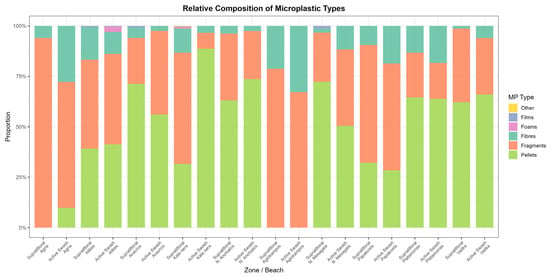
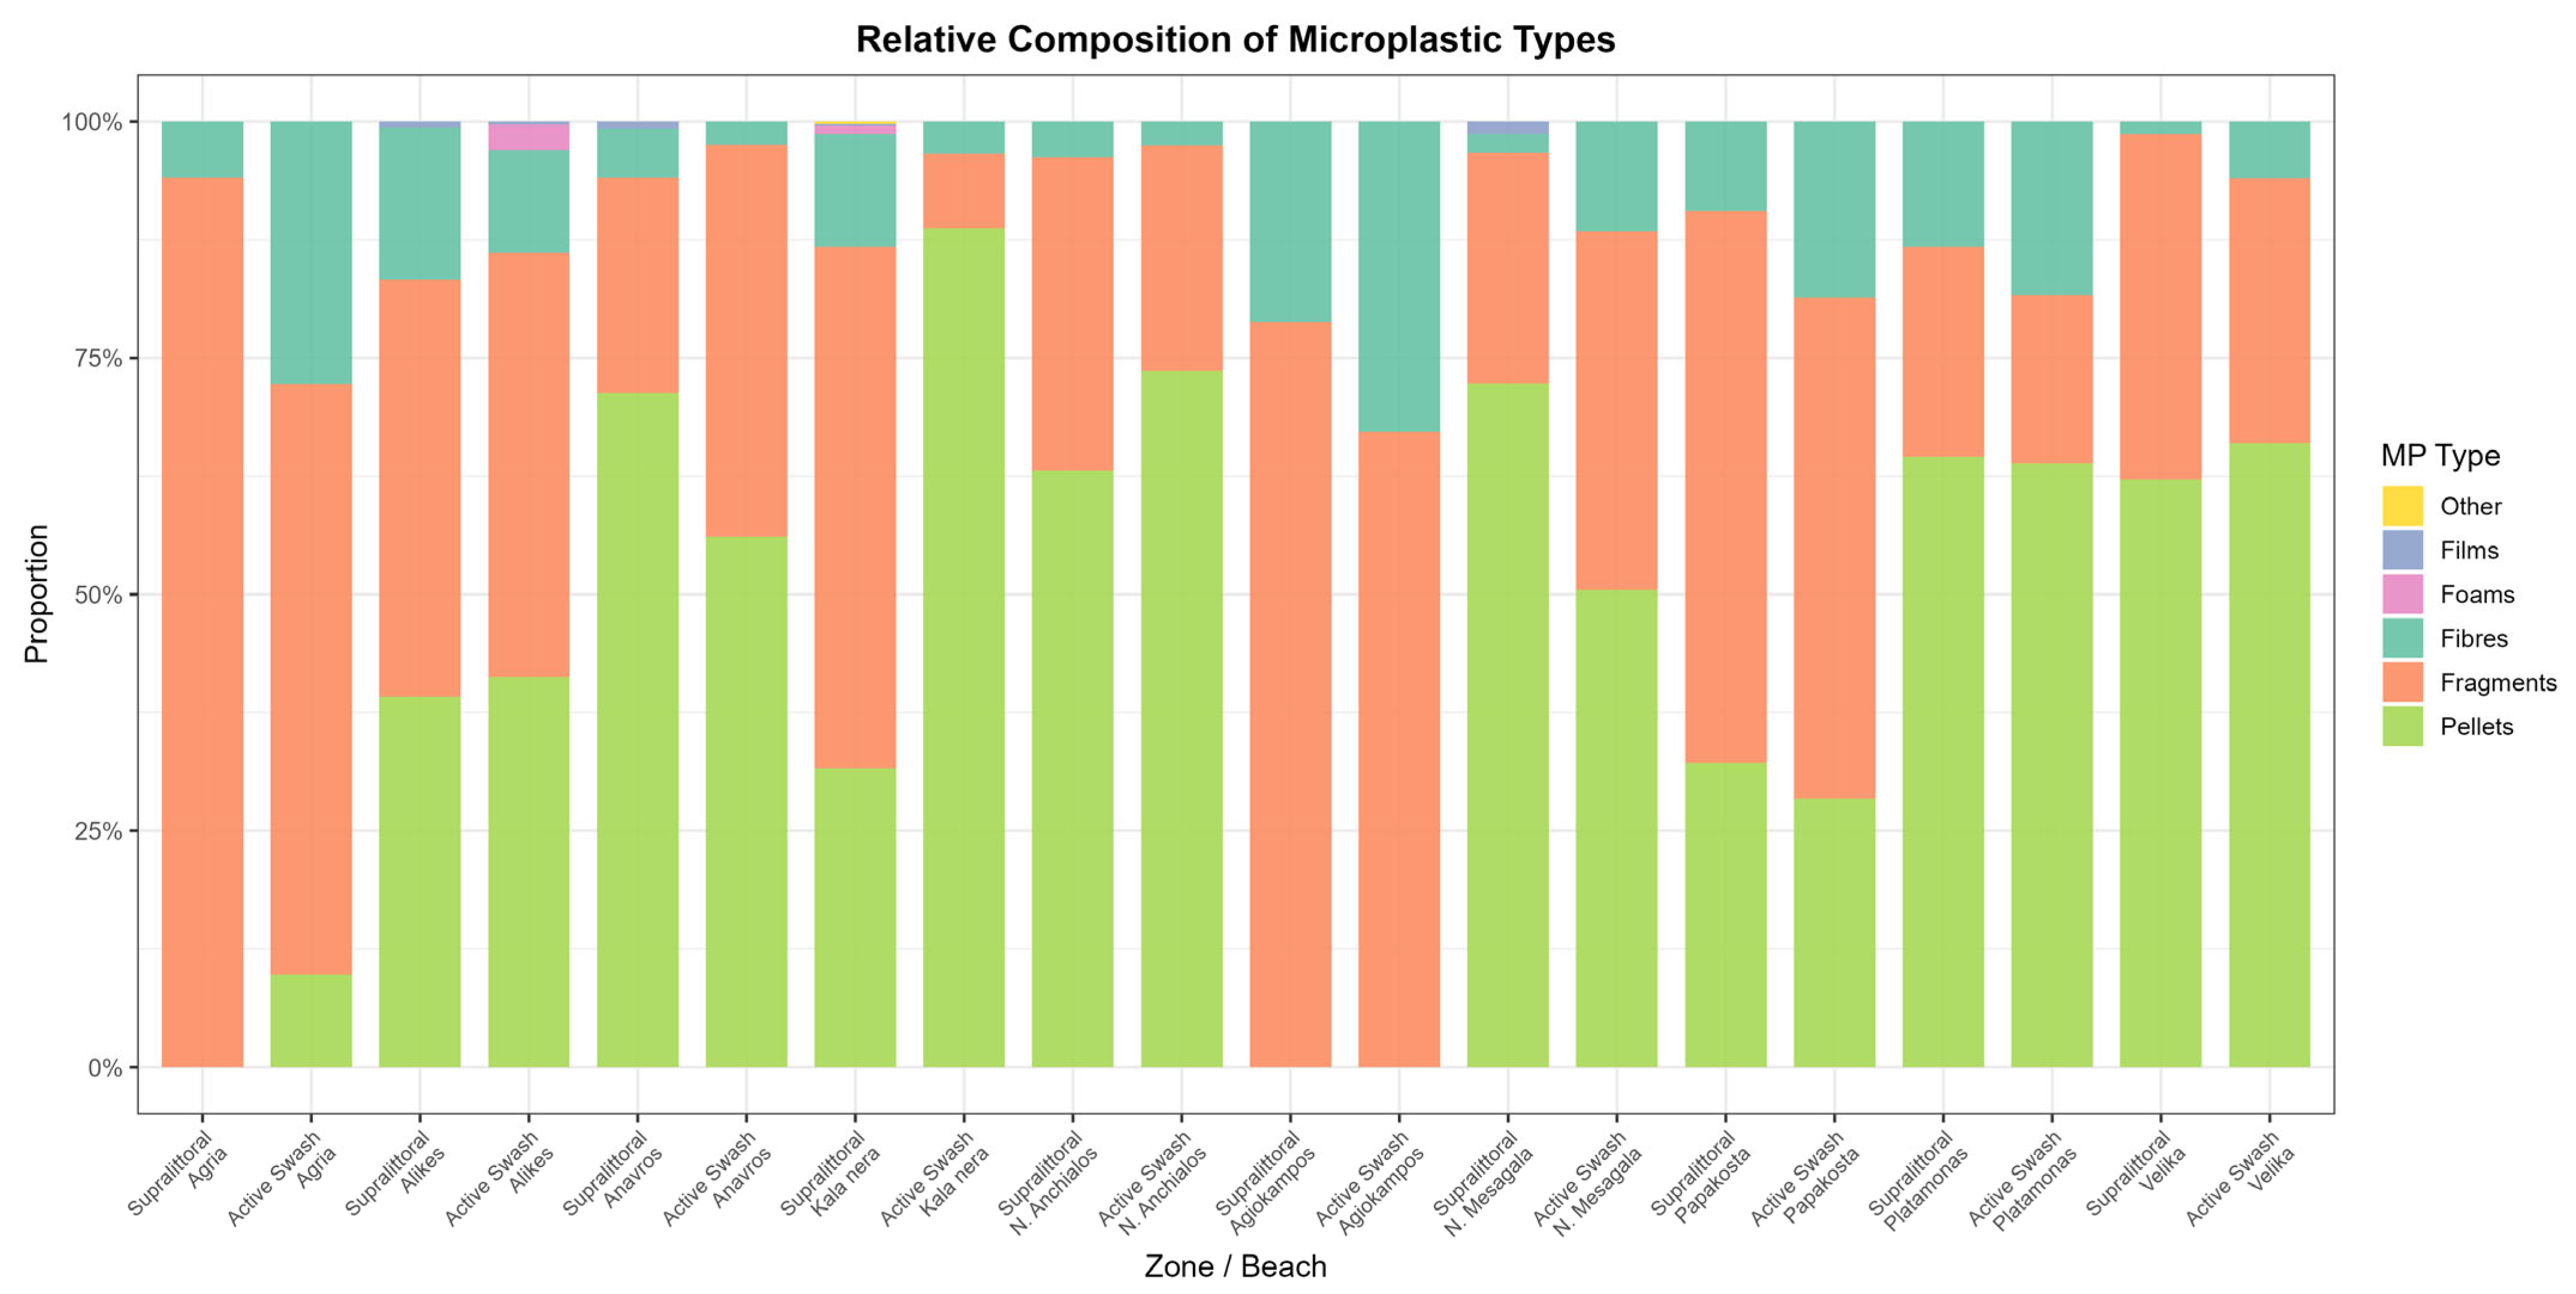
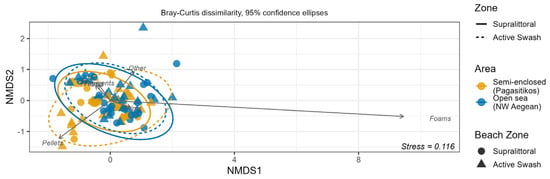
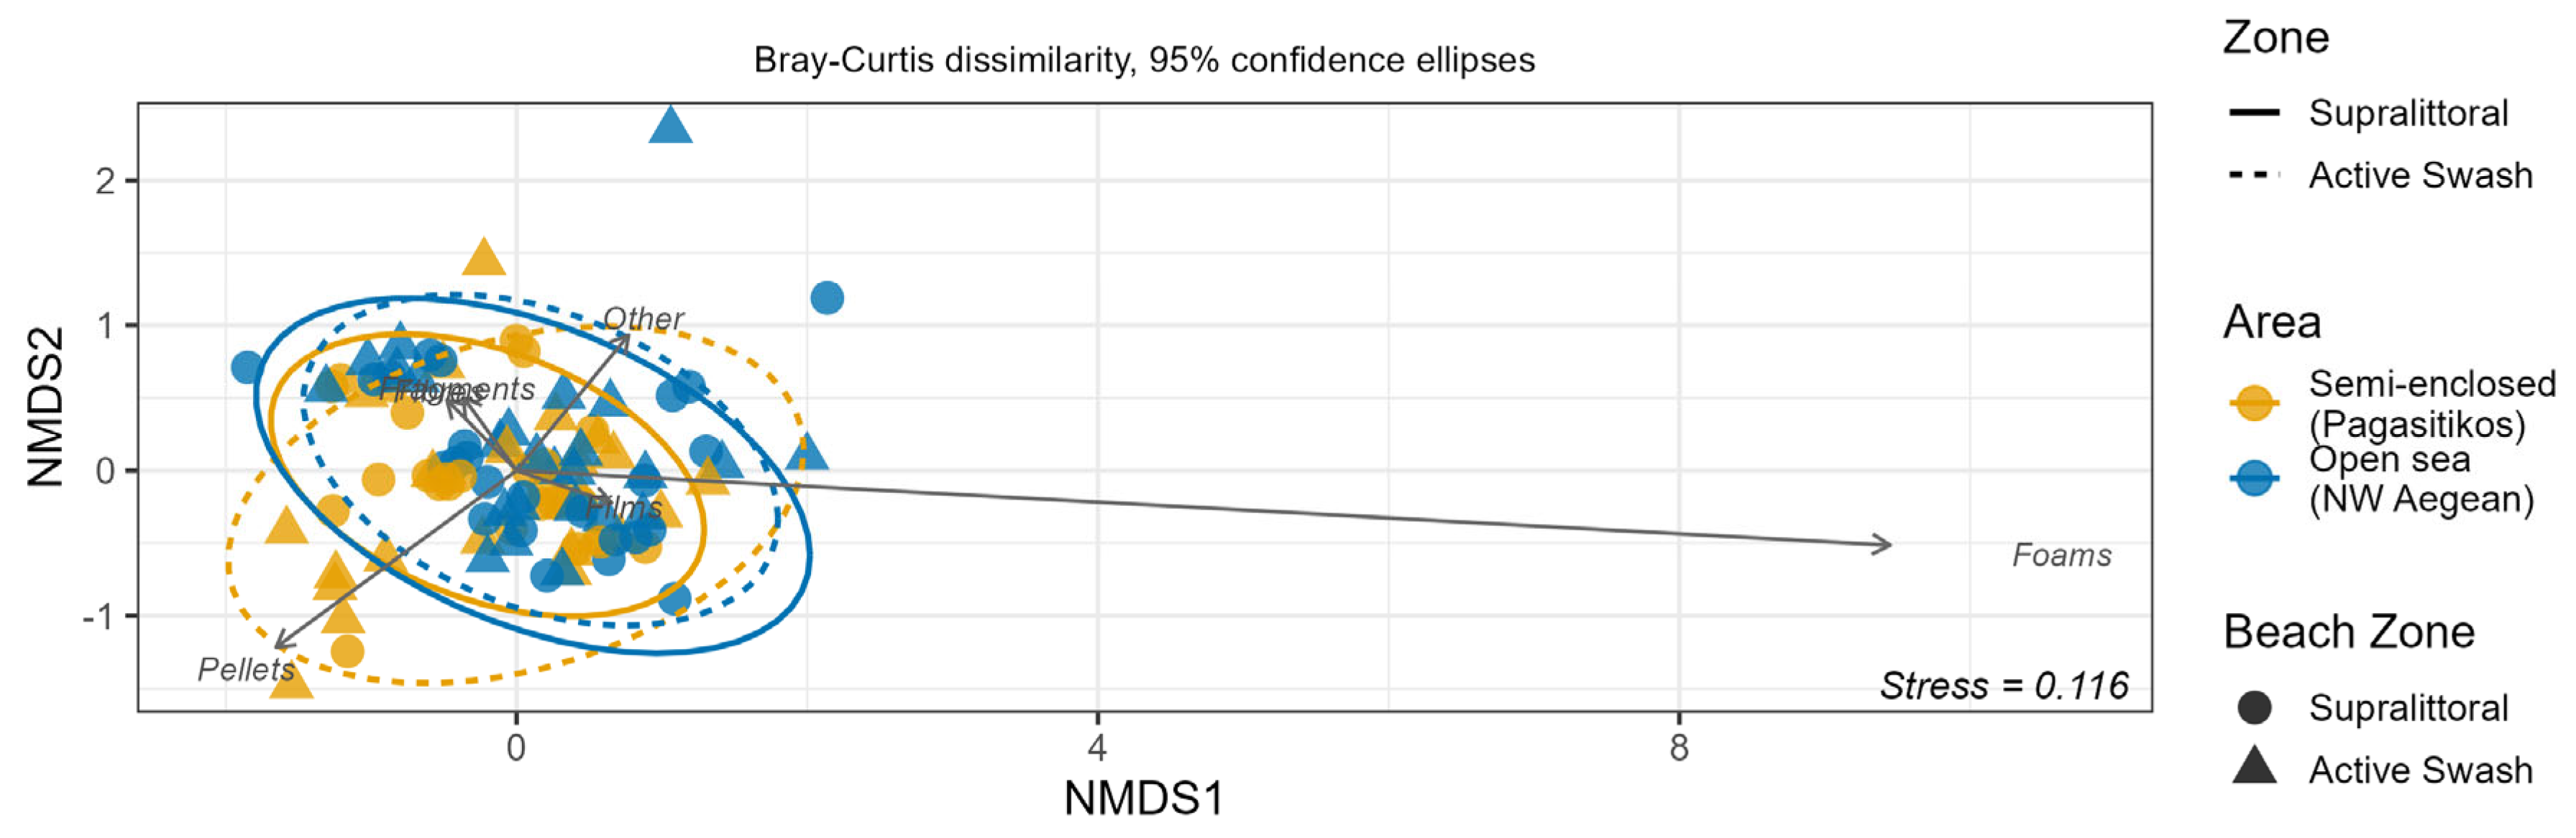
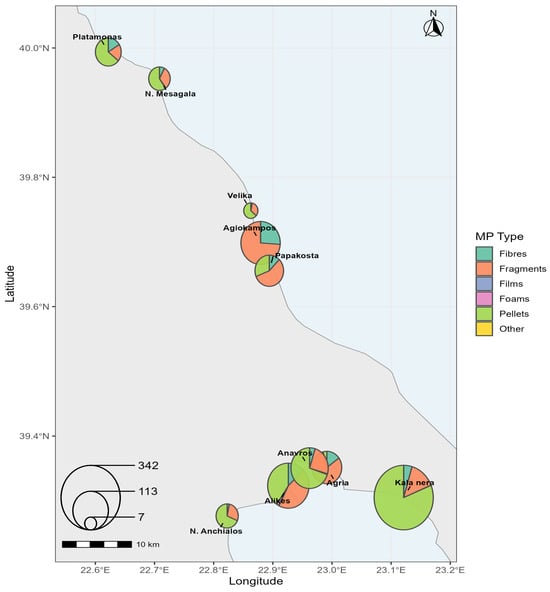
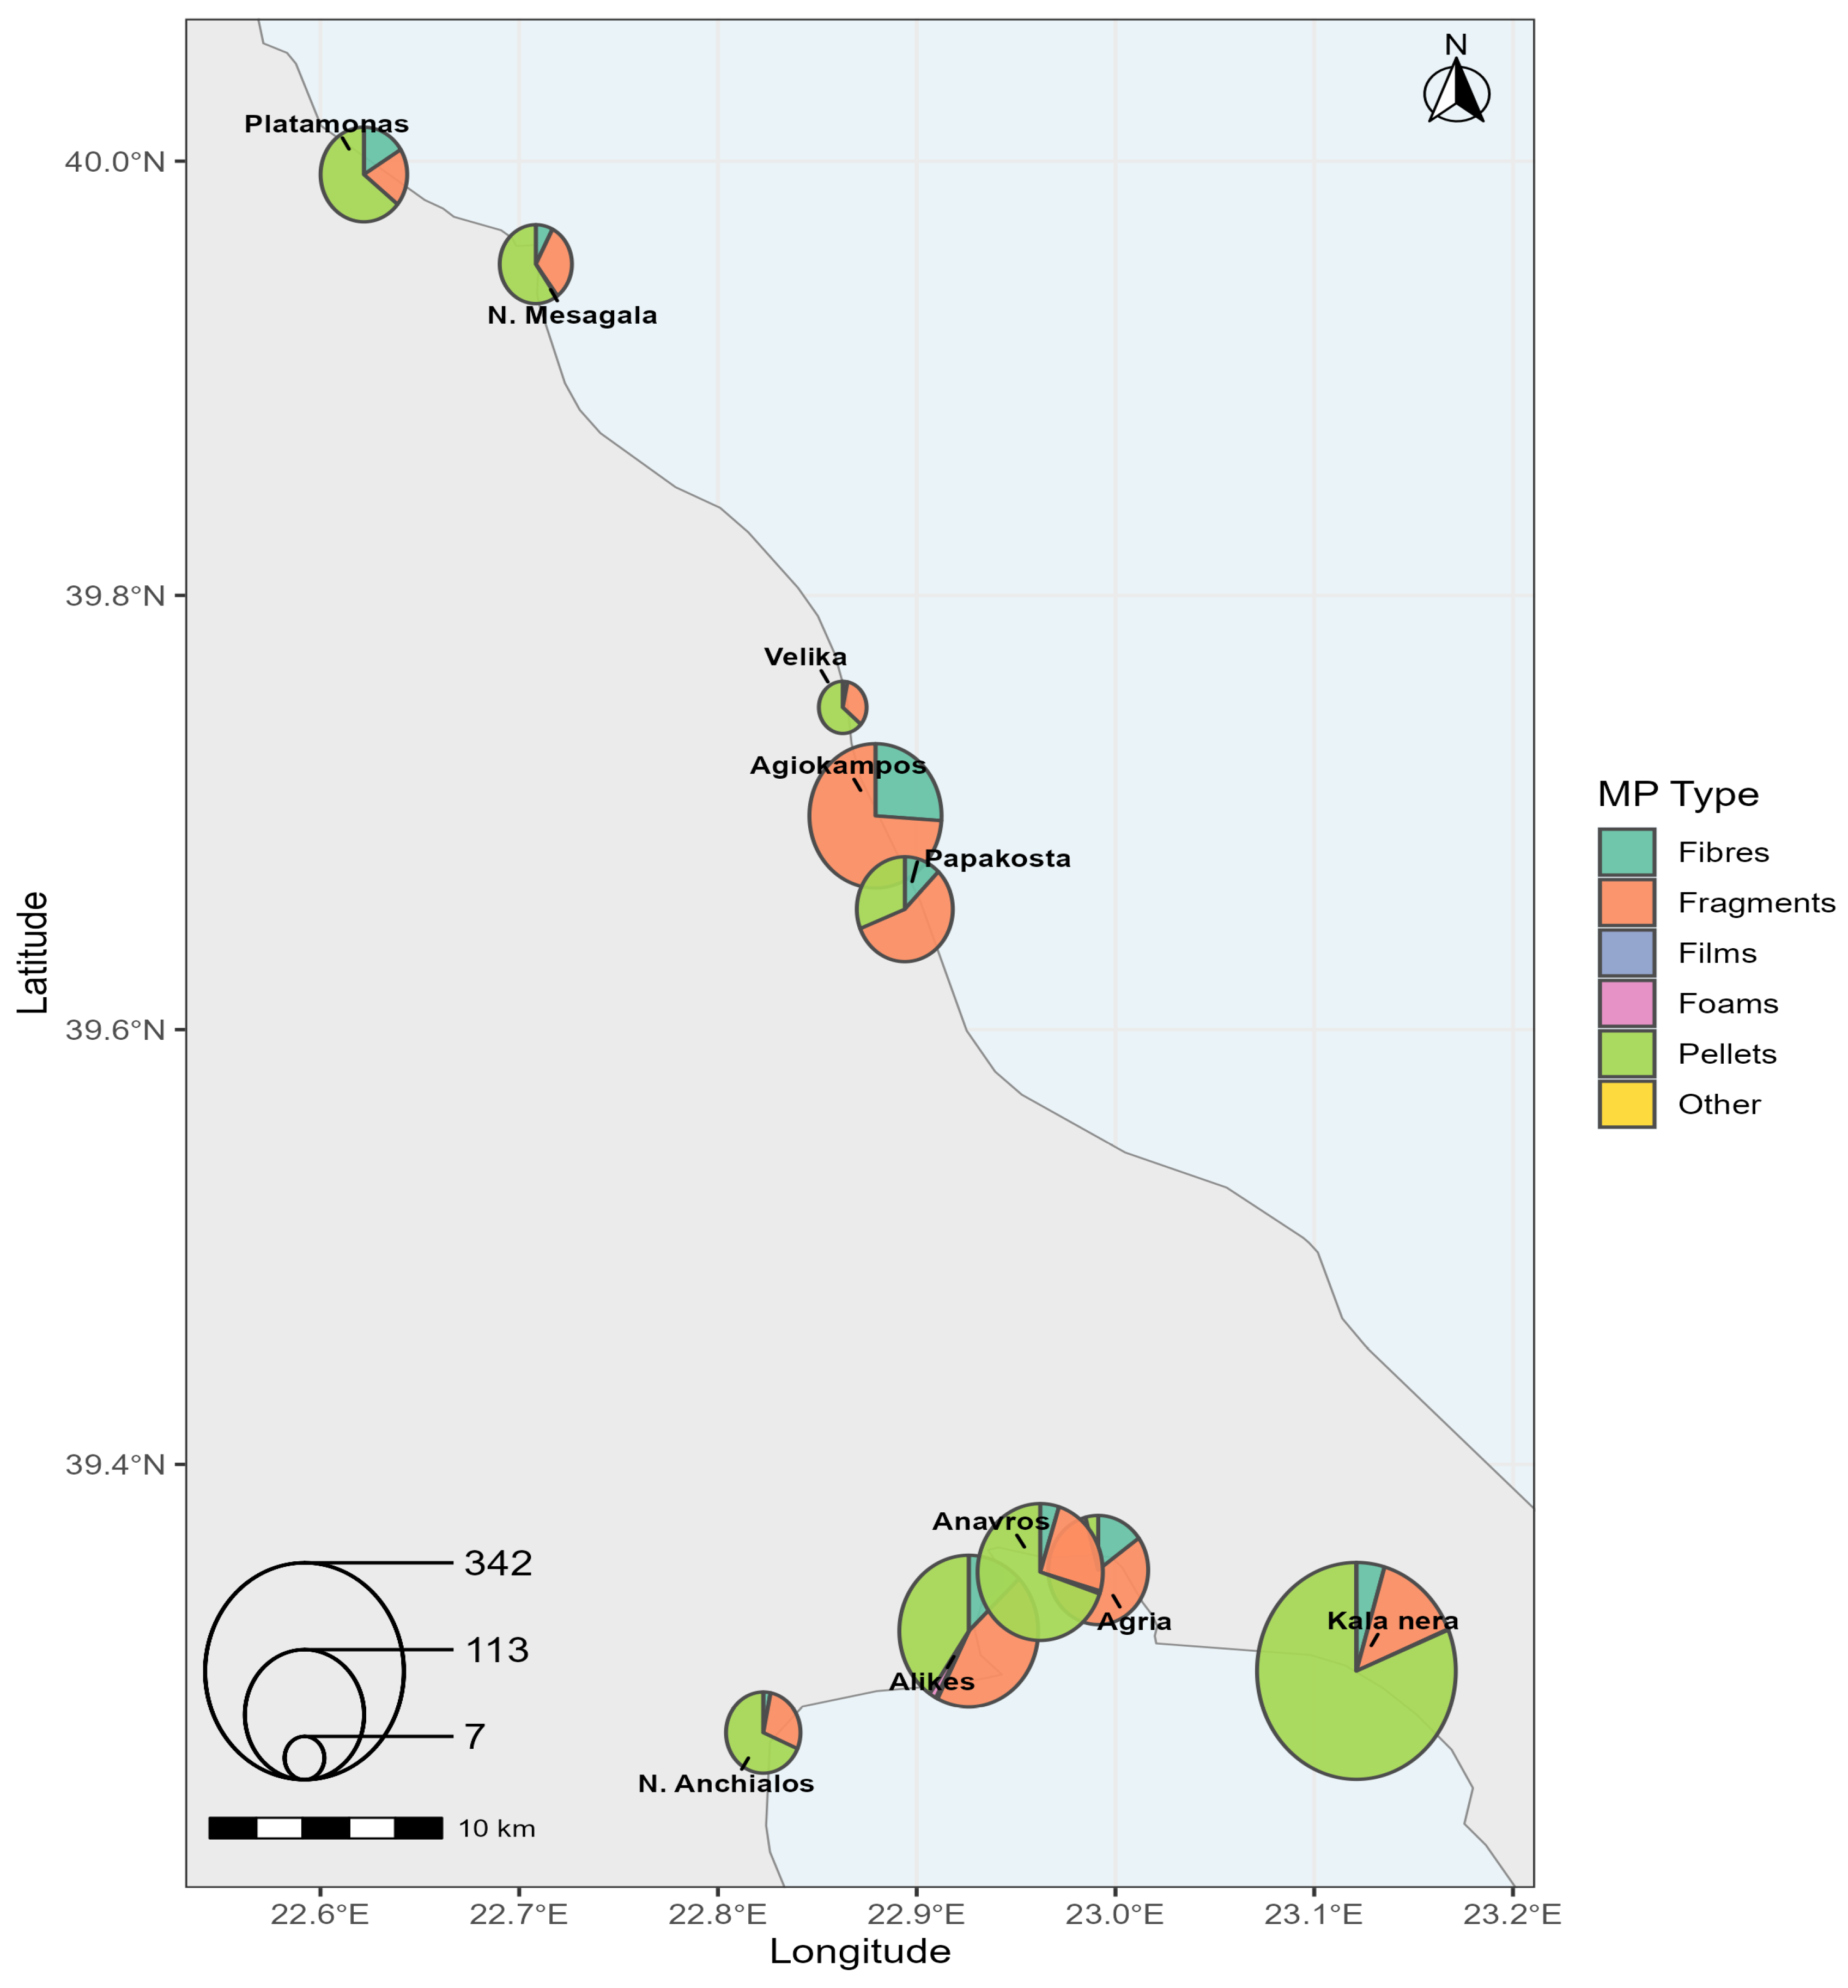

Disclaimer/Publisher’s Note: The statements, opinions and data contained in all publications are solely those of the individual author(s) and contributor(s) and not of MDPI and/or the editor(s). MDPI and/or the editor(s) disclaim responsibility for any injury to people or property resulting from any ideas, methods, instructions or products referred to in the content. |
© 2026 by the authors. Licensee MDPI, Basel, Switzerland. This article is an open access article distributed under the terms and conditions of the Creative Commons Attribution (CC BY) license.