


Abstract
Unsignalized mid-block raised crosswalks are widely used to improve pedestrian safety by prompting drivers to yield. However, on arterial roads they conflict with vehicular continuity, while their environmental effects remain insufficiently understood. This study uses field-informed microscopic simulations to examine these effects across the full range of pedestrian and vehicle influx. The raised crosswalk reduces the maximum traffic current by 42.6%, causing the system to exhibit three phases: quasi-free flow, jamming, and blocking. Quasi-free flow was the most relevant because it combined high throughput with frequent deceleration and re-acceleration under conditions observed during most of the operating day. In this phase, the mean instantaneous CO2 emission rate increased by 23.08%, revealing a spatial asymmetry: emissions decreased by 35.66% upstream but increased by 51.87% downstream. NOx and PMx showed similar downstream patterns, whereas CO reflected upstream stop-and-go dynamics. Exploring a solution to this operational incompatibility, this study evaluated a zebra crossing controlled by a pedestrian-actuated signal. By coordinating pedestrian and vehicular right-of-way, this configuration reduced mean CO2, CO, NOx, and PMx emission rates by 18.3%, 40.61%, 26.75%, and 38.96%, respectively. Overall, these findings highlight emissions as a critical evaluation criterion and provide decision-makers with evidence-based insights for assessing pedestrian infrastructure.
1. Introduction
As cities expand, traffic management becomes more challenging, requiring strategies that reconcile environmental sustainability with social inclusion [1,2,3]. The societal impact of traffic includes problems such as congestion, accidents, and air pollution [4,5]. Among these impacts, vehicular emissions are particularly significant since they represent a primary source of greenhouse gases, motivating transport decarbonization strategies that target emission reductions of 80% to 90% by 2050 [6,7]. Moreover, to create more livable cities, road infrastructure is required to accommodate pedestrians and be accessible to everyone [8,9,10].
Among road users, pedestrians are the most vulnerable and are often compelled to cross roadways at intersections [11,12,13]. To foster inclusion while enhancing pedestrian mobility, regulations have prompted the adoption of raised crosswalks to allow mid-block pedestrian right-of-way and encourage driver compliance [14,15,16]. A particular characteristic of raised crosswalks is that they incorporate a trapezoidal deflection with a plateau and ramps that force vehicles to decelerate even in the absence of pedestrians [17]. This permanent speed disturbance becomes particularly relevant when raised crosswalks are deployed on arterial roads, whose operational role depends on maintaining vehicular continuity over long distances.
Mid-block crosswalks, which are often unsignalized, generate vehicle–pedestrian conflicts that affect traffic operations [18]. Accordingly, existing research has focused primarily on traffic flow [13,19], safety [20,21,22], yielding behavior [23,24,25,26], crossing performance [27,28,29], and pedestrian demographics [30,31,32]. Nevertheless, the environmental effects of vehicle–pedestrian interactions remain underexplored. The limited available evidence indicates that raised mid-block crosswalks increase CO2 emissions, although they produce lower emissions than zebra crossings [33,34]. In this regard, V2X-enabled anticipatory deceleration has shown potential to reduce these emissions by avoiding abrupt braking and re-acceleration [35].
Evidence on the environmental effects of raised crosswalks derives mainly from highly idealized models. These approaches rely on simplifying assumptions about vehicle dynamics and vehicle–pedestrian interactions, while generally lacking calibration and validation against observations from actual crossings. Their ability to reproduce the speed disturbances and acceleration-deceleration patterns observed under real operating conditions is therefore limited. Beyond these modeling limitations, no controlled before-and-after studies have combined traffic observations with instantaneous emission estimates across varying pedestrian and vehicular demand levels.
This limitation is particularly relevant in low- and middle-income countries, where roadway configurations, traffic behavior, and vehicle fleets vary considerably across local contexts. Research on mitigating the environmental effects of mid-block crossings is also scarce, leaving transportation planners with limited empirical evidence to weigh the emission impacts of raised crosswalks against their safety and accessibility benefits [36]. Consequently, their environmental effects remain insufficiently quantified across operating conditions, despite the need to identify and mitigate local emission increases in the transition toward carbon-neutral transportation.
To address this gap, this study presents a microscopic simulation analysis of the environmental effects of an unsignalized raised crosswalk on a high-speed arterial road. The model was developed and calibrated using field data from an actual crossing to capture the main operational features of vehicle–pedestrian interactions. Using the calibrated model, the simulations thoroughly explore the full feasible range of vehicular and pedestrian inflow combinations, extending far beyond those observed under real operating conditions. Across this full range of conditions, CO2, CO, NOx, and PMx emissions are compared between the existing raised-crosswalk configuration and a simulated pre-installation baseline. Results reveal that the raised crosswalk reduces the maximum traffic current by 42.6% and produces three traffic phases: quasi-free flow, jamming, and blocking, each with distinct emission patterns. Quasi-free flow, the predominant phase during daytime operation, combines high throughput with repeated speed changes and produces a marked upstream-downstream emission asymmetry across all four pollutants. For CO2, traffic calming reduces mean instantaneous emissions by 35.66% upstream relative to the baseline, whereas speed recovery increases them by 51.87% downstream.
As an alternative, the study evaluates a pedestrian-actuated signalized zebra crossing that coordinates pedestrian and vehicular right-of-way. Relative to the unsignalized raised crosswalk, this configuration reduces mean operating-day emission rates by 18.3% for CO2, 40.61% for CO, 26.75% for NOx, and 38.96% for PMx. These results support pedestrian-actuated signalization as a promising option for maintaining pedestrian access while mitigating the environmental effects of raised crosswalks on high-speed arterial roads.
Overall, this study provides a field-informed microscopic basis for examining how unsignalized mid-block raised crosswalks affect traffic dynamics and vehicle emissions. The resulting insights can support decision-makers and traffic agencies in assessing their environmental performance and refining traffic management strategies that integrate emissions into the design and evaluation of sustainable mobility systems.
The remainder of this paper is organized as follows. Section 2 reviews the relevant literature on mid-block pedestrian crossings. Section 3 describes the roadway representation, vehicle–pedestrian dynamics, and instantaneous emission model. Section 4 presents and discusses the effects of the unsignalized raised crosswalk on traffic flow, whereas Section 5 examines its effects on vehicle emissions. Section 6 evaluates a zebra crossing controlled by a pedestrian-actuated signal as an alternative for coordinating pedestrian and vehicular right-of-way. Finally, Section 7 summarizes the main conclusions.
2. Literature Review
Unsignalized mid-block crosswalks have gained significant research attention because of their combined effects on pedestrian safety and vehicular traffic performance. Research has primarily examined vehicle delays [27], pedestrian crossing opportunities [28,29], and the safety-efficiency trade-off associated with driver yielding [13,19]. Overall, higher pedestrian and vehicle volumes tend to increase vehicle delays, with greater pedestrian demand also increasing crossing opportunities, whereas higher yielding rates improve pedestrian safety at the expense of traffic efficiency.
Research has also examined vehicle–pedestrian conflicts and yielding decisions at uncontrolled crossings [25,26,37]. These studies show that yielding and conflict severity depend on vehicle speed and distance, reaction times, traffic conditions, as well as pedestrian and driver characteristics [23,24]. Additional evidence indicates that crossing design and social context also shape these interactions [38,39].
Despite extensive research on traffic performance, safety, and pedestrian–vehicle interactions, the environmental effects of traffic-calming interventions have received limited attention, particularly those arising from the deceleration, stopping, and re-acceleration induced by devices such as speed humps and raised crosswalks.
Initial efforts to examine these environmental effects have adopted heterogeneous methods and focused on different outcomes. Pérez et al. [40] combined a modified NaSch cellular automaton with the Panis instantaneous emission model, finding that speed humps increase CO2, NOx, and PM emissions mainly under low-to-moderate traffic densities, with negligible effects under congestion and limited changes in VOC emissions. Raheem et al. [41] estimated CO2 emissions from speed bumps using driver-reported fuel consumption and an aggregate macroscopic conversion model. Butkus et al. [42] used deterministic and stochastic models to assess greenhouse gas emissions from traffic-calming stops on U.S. suburban roads, showing that repeated stopping substantially increases CO2-equivalent emissions, particularly at higher speed limits and under aggressive driving. He and Gao [43] examined pedestrian exposure to particulate matter at crosswalks and intersections, extending the discussion from vehicle emissions to local air-quality impacts.
Studies specifically addressing unsignalized mid-block crosswalks have examined CO2 emissions associated with raised and zebra designs [33,34]. Using cellular automata, they found that raised crosswalks induce upstream traffic calming and generally produce milder effects than zebra crossings, although emissions may increase downstream under low pedestrian demand and undersaturated traffic as vehicles re-accelerate. Alali and Olariu [35] explored a cooperative V2X strategy that replaces late braking and re-acceleration with anticipatory deceleration. Using SUMO-based simulations and a proxy-based emission model, they found that the strategy reduces CO2 emissions relative to sudden stopping.
Fondzenyuy et al. [36] reviewed the emission effects of speed-limit changes and showed that lower mean speeds do not necessarily reduce emissions, which depend more directly on traffic flow and acceleration-deceleration patterns. The review further notes that the available evidence relies predominantly on models and simulations that often fail to capture real-world traffic-calming conditions, while effects vary across CO2, NOx, and PM, vehicle types, and assessment approaches. Hence, the authors call for a dedicated synthesis of the environmental impacts of physical traffic-calming devices, including speed tables such as raised crosswalks.
Overall, the available literature suggests that the environmental effects of traffic calming interventions are shaped primarily by the speed disturbances and acceleration-deceleration patterns they induce. However, studies of raised crosswalks continue to rely predominantly on idealized models that simplify vehicle dynamics and vehicle–pedestrian interactions and are generally neither empirically calibrated nor validated. Controlled before-and-after analyses combining field observations with instantaneous estimates of CO2, CO, NOx, and PMx emissions remain unavailable. This gap is especially pronounced on high-speed arterial roads, in low- and middle-income countries, and across varying pedestrian and vehicular demand conditions. Mitigation strategies have also received limited attention, leaving both the emission effects of raised crosswalks and the performance of alternative control measures insufficiently characterized.
3. Data, Modeling, and Methods
3.1. System Model
To examine the impact of mid-block raised crosswalks on arterial roads, a representative system was selected for this study. The system under consideration is a 486 m long section of a two-way four-lane (two lanes per direction) high-speed road featuring a raised crosswalk positioned close to the midpoint of the segment. This system is based on a road located in the city of Morelia, Mich., Mexico, with coordinates 19°40′54″ N, 101°10′36″ W, that is part of the city’s peripheral ring road (Figure 1). The mid-block raised crosswalk is located 214 m in the west-east direction (264 m in the east-west direction) and has a trapezoidal section with a 3 m plateau and 1.5 m ramps. Figure 2 shows a schematic of the system.
Figure 1.
Photograph of the mid-block raised crosswalk selected as the study site in Morelia, Mexico.
Figure 2.
Schematic representation of the modeled arterial road segment with a mid-block raised crosswalk. Vehicle and pedestrian inflows are controlled by and , respectively, while S1–S4 indicate the field-measurement locations used to characterize vehicle dynamics around the crosswalk.
The case study was modeled from an OSM map, using the Netedit tool provided by the SUMO 1.27.1 software [44]. The model was configured with open boundary conditions for both vehicles and pedestrians. Vehicle entrance is controlled with a probability . Once a vehicle reaches the end of a lane, it can leave the system without any restrictions (i.e., the vehicles’ exit probability is assumed to be 1). In this model, pedestrians are constrained to circulate only through the crosswalk. Pedestrian movements are modeled as unidirectional to isolate pedestrian–vehicle interaction effects from additional interaction mechanisms and facilitate systematic analysis within the same probabilistic boundary framework used for vehicles. Accordingly, the pedestrian influx is controlled with a probability . Pedestrians can also leave the system without restrictions once they reach the sidewalk located at the exit of the crosswalk ().
3.2. Empirical Data Collection
To establish an empirical foundation for the microscopic simulations and to enhance the model’s accuracy in replicating real-world conditions, a comprehensive data collection was conducted at the selected mid-block raised crosswalk over a one-week period. Traffic radar sensors, road tube counters, and video recordings were deployed at four locations along the road segment shown in Figure 2 to characterize vehicle dynamics and pedestrian–vehicle interactions. Instantaneous vehicle speeds were recorded at each location and processed to estimate the 85th-percentile speed as a representative measure of the operating conditions.
The measurement points comprised , located 100 m upstream of the crosswalk to characterize vehicle speeds before drivers reacted to the installation; , positioned 10 m upstream to capture the approaching deceleration; , located at the center of the raised plateau to measure crossing speeds and observe vehicle–pedestrian interactions; and , placed 100 m downstream to characterize post-crosswalk acceleration and the recovery of vehicle speeds.
Points and were located 100 m upstream and downstream of the raised crosswalk, respectively, based on field observations indicating that its influence on vehicle dynamics, including upstream deceleration and downstream acceleration, was largely contained within this range. The selected boundaries, therefore, encompass the roadway area affected by the crosswalk in terms of emissions. Although no formal design guideline defines this extent, the adopted limits are supported by field evidence.
The adopted 100-m boundaries are consistent with field observations and previous research. For instance, Faheem [45] reported that deceleration begins 70–100 m upstream of speed humps and that baseline speeds are recovered within 50–100 m downstream, whereas Ewing [46] found that the strongest speed reductions around traffic calming devices are generally confined to approximately 30 m on either side.
3.2.1. Speed Zone Model
The system under study features transverse bar markings as a traffic-calming measure designed to reduce vehicle speeds before reaching the crosswalk. These markings consist of 13 perpendicular bars spanning a 92-m road segment in both directions (west-east and east-west), as shown in Figure 2. To accurately capture the deceleration effect induced by these markings, measurements from locations and were used to define four discrete speed zones. Consequently, four distinct speed sections were modeled and calibrated based on the 85th percentile of the collected data: m/s (58.6 km/h) at 100 m upstream, m/s (17.8 km/h) at 10 m upstream, m/s (17.4 km/h) at the crosswalk plateau center, and m/s (58.6 km/h) at 100 m downstream.
3.2.2. Vehicle and Pedestrian Volumes
Hourly vehicle and pedestrian volumes were retrieved from the field measurements and used to characterize usual weekday demand. Vehicle flow ranged from 24 to 865 vehicles per hour per lane (veh/h/ln), whereas pedestrian influx ranged from 2 to 76 pedestrians per hour (ped/h). These values corresponded to injection-rate intervals of for vehicles and for pedestrians, defining the field-observed operating range used as the empirical reference for the simulations. Figure 3 summarizes the field-observed weekday demand in terms of both hourly flows and their corresponding vehicle and pedestrian injection rates.
Figure 3.
Field-observed average weekday demand: (a) vehicle flow and corresponding vehicle injection rate, ; (b) pedestrian influx and corresponding pedestrian injection rate, .
Because field measurements primarily characterize usual operating conditions, they do not capture atypical or future demand states that may arise from short-term disruptions or longer-term changes in traffic demand. The calibrated simulation was therefore used to complement the field-observed ranges by exploring a broader spectrum of demand conditions. To provide a physical interpretation of these extended conditions, Table 1 relates the vehicle and pedestrian injection rates, and , to their nominal time headway, h, and equivalent hourly demand, q and . For the vehicle and pedestrian injection rates, these quantities are expressed as s and per hour, and analogously in terms of for pedestrians. Thus, for example, an injection rate of represents a nominal arrival every 10 s, equivalent to 360 vehicles or pedestrians per hour. These values represent the imposed demand associated with the injection parameter rather than the flow necessarily served by the system, since the realized throughput may be constrained by roadway capacity and vehicle–pedestrian interactions.
Table 1.
Relationship between injection rates and their nominal time headway and equivalent hourly demand. The equivalent demand q is expressed in veh/h/ln for vehicle injection rate and in ped/h for pedestrian injection rate . The volume-to-capacity ratio applies only to vehicle demand, using veh/h/ln.
For vehicle traffic, Table 1 additionally reports the volume-to-capacity ratio, , using veh/h/ln as the nominal lane-capacity reference, estimated from the roadway characteristics together with the measured and simulated traffic behavior. This value is also consistent with the capacity range reported for high-capacity urban road facilities in the Mexican roadway-design standard [47]. The full interval therefore represents an equivalent vehicle demand from 0 to 3600 veh/h/ln, corresponding to . The nominal lane capacity is reached at ; therefore, represents undersaturated demand, whereas represents progressively oversaturated demand. At the upper bound, imposes an equivalent demand of 3600 veh/h/ln, or 2.5 times the reference capacity. Exploring this extended range allows the system response to be evaluated from undersaturated conditions through operation near capacity and into strongly oversaturated conditions associated with persistent queue formation.
For pedestrians, the same mapping gives an equivalent demand range of ped/h for , with the upper bound corresponding to one pedestrian arrival per second. Extending beyond the field-observed range allows the system response to progressively increasing pedestrian demand to be examined across the modeled operating range.
Agreement between simulated and observed vehicle volumes was evaluated using the GEH statistic, a widely used goodness-of-fit measure in traffic modeling [48]:
where M and C denote the simulated and counted hourly volumes, respectively. Values below 5 indicate satisfactory agreement. For example, an observed flow of veh/h/ln and a simulated flow of veh/h/ln for produced , supporting the use of the selected injection rates.
Traffic volumes informed the in-situ injection rates for vehicles and pedestrians ( and ), ensuring that a comprehensive range of real-world conditions was represented in the experiments.
3.3. Pedestrian Model
Pedestrian dynamics were simulated using the striping model [49], in which sidewalks and crosswalks are represented as two-dimensional spaces divided into discrete longitudinal stripes. Each pedestrian i is described by coordinates , where denotes the longitudinal position and identifies the occupied stripe. The stripe width was set to 0.65 m, following the HCM recommendation [50].
Pedestrians prioritize forward movement within their current stripe and attempt a lateral displacement, preferably to the right, when their path is obstructed. If no adjacent space is available, they remain stationary. The coordinate updates at each simulation time step are summarized as follows:
- Speed update:
- Collision avoidance:ifReturn to rule 1.
- Forward movement:
where denotes the speed of pedestrian i, denotes the space gap between two pedestrians i and j within the same stripe, is the length of the simulation time step, and f is a random factor to control the lateral movement.
Pedestrians enter the crosswalk only when the nearest vehicle does not obstruct the adjacent lane. Once a pedestrian enters, vehicles approaching the occupied portion of the crosswalk must stop until it is cleared. Vehicles may continue when pedestrians occupy sections that do not intersect their lane.
3.4. Car-Following Model
Vehicle dynamics were simulated using the Wiedemann 99 car-following model (W-99), a psychophysical model in which drivers respond to changes in spacing, speed, and relative speed with respect to the leading vehicle [51,52]. Six thresholds, , , , , , and , define transitions among four driving regimes: free flow, closing, following, and emergency braking. These regimes describe unconstrained motion, adaptation to a slower leader, gap-keeping behavior, and collision-avoidance braking, respectively.
The W-99 thresholds are determined by ten model parameters, from to , described in Table 2. These parameters can be adjusted to calibrate a specific traffic model and replicate local conditions. The six W-99 thresholds are computed using Equations (5)–(10) [53].
where , , and are the standstill, minimum following, and maximum following distances, respectively; , , and are relative-speed thresholds; and are the length and speed of the leading vehicle; is the following-vehicle speed; is the intervehicle gap; and equals 1 when and 0 otherwise.
Table 2.
Wiedemann 99 model parameters and default values.
The parameter set was evaluated against the speed, acceleration, and deceleration profiles derived from the field measurements. This comparison verified that the model reproduced the vehicle responses observed near the raised crosswalk, including deceleration, acceleration, and stop-and-go behavior. The W-99 model has also been applied to similar urban traffic environments [54,55,56].
3.5. Emission Model
Vehicle emissions were estimated using the microscopic model developed by Krajzewicz et al. [57], based on emission factors from the Handbook Emission Factors for Road Transport (HBEFA) [58]. The model expresses the instantaneous emission rate as a continuous function of vehicle speed and acceleration through Equation (11):
where is the emission rate of vehicle i in mg/s, and are its instantaneous speed and acceleration, and to are calibration coefficients whose values are set depending on the emission class and the pollutant. Within HBEFA, emission factors are integrated for both gasoline and diesel vehicles across EURO 0 to EURO 6 emission standards. This study exclusively considers gasoline-powered EURO 4 passenger vehicles. This vehicle class was selected from field observations indicating that more than 85% of the traffic consisted of light-duty gasoline vehicles with estimated model years compatible with EURO 4 technology. This assumption is also consistent with the Mexican fleet composition, where the average vehicle age was 16.2 years, and model years 2016–2025 represent 37.9% of vehicles in operation [59]. Accordingly, a homogeneous fleet was adopted as a site-informed modeling assumption to better isolate the emission effects associated with vehicle–pedestrian interactions under a consistent vehicle class. The calibration coefficients for these vehicles are provided in Table 3.
Table 3.
Calibration coefficients for gasoline-powered EURO 4 passenger vehicles.
4. Effects of the Unsignalized Raised Crosswalk on Traffic Flow
The results presented throughout the remainder of this article were obtained through computational simulations using SUMO [44] as the simulation engine, embedded through the libsumo C++ library for interaction with the running simulation. The simulation scenario was based on the system model described in Section 3.1.
Based on the collected data, the simulation considered only passenger cars, with a vehicle length of 5 m, a minimum gap of 2.5 m, a desired acceleration of 2.6 m/s2, and a desired deceleration of 4.5 m/s2. To reproduce the speed disturbance introduced by the raised crosswalk, vehicle speeds were constrained according to the four speed zones defined in the system model: = 16.3 m/s, = 4.9 m/s, = 4.8 m/s, and = 16.3 m/s. Pedestrian movement was modeled using a constant walking speed of 1.2 m/s, capturing the spectrum of walking speeds stated in the HCM [50,60].
An additional simulation scenario without the crosswalk was considered as a reference baseline, allowing vehicle flow and emissions to be evaluated in the absence of the speed disturbance introduced by the raised crosswalk.
The model parameters are defined by the vehicle and pedestrian injection rates, denoted by and , respectively. Accordingly, these injection rates were varied within the interval , with each combination () treated as an independent configuration. All simulations were performed using a fixed time step of 0.1 s. For each configuration, the simulation was executed for 12,000 time steps, and steady-state results were obtained by averaging the last 9000 steps. To ensure statistical reliability, each configuration was subjected to 100 independent executions.
The analysis first identifies the traffic phases exhibited by the system under the influence of the unsignalized raised crosswalk. The distinct microscopic dynamics underlying each phase are subsequently characterized, providing the basis for interpreting the spatial distribution and magnitude of vehicle emissions.
4.1. Microscopic Characterization of Traffic Phases
Traffic current (J) is first examined in the baseline system without the crosswalk, varying the vehicle injection rate across the entire spectrum (). Under this baseline scenario, traffic current reaches its highest levels when (traffic flow approximately) as can be observed in the plot of Figure 4a. With an unrestricted extraction rate () and no other disruptions, the system remains in free flow for , as the increasing vehicle demand is accommodated without persistent queue formation. This is confirmed in the space–time diagram (Figure 4b), where each line represents the trajectory of a single vehicle and wide inter-vehicle gaps are observed. As increases beyond 0.68, the space–time diagrams reveal high-density conditions, with inter-vehicle gaps becoming markedly constrained (see Figure 4c).
Figure 4.
(a) Traffic current as a function of vehicle injection rate (), comparing system performance with and without crosswalk; (b) space–time diagram depicting traffic current for ; (c) space–time diagram depicting traffic current for .
To analyze how traffic current interplays with the number of pedestrians and vehicles entering the system, traffic current was plotted as a function of both pedestrian entrance () and vehicle injection () rates, as depicted in Figure 5a. This parameter space encompasses both the field-observed demand range and progressively higher demand conditions used to characterize the broader system response.
Figure 5.
(a) Traffic current (J) as a function of pedestrian () and vehicle () injection rates; (b) corresponding phase diagram on the plane, using J as the order parameter.
From the 3-D surface of Figure 5a, it is observed that traffic current reaches its highest levels when and no pedestrians are entering the system (). It should be noted that the value corresponds to the nominal lane-capacity reference of approximately 1440 veh/h/ln introduced in Section 3.2.2. As increases, traffic current is progressively reduced over a broad range of , evidencing the bottleneck induced by the crosswalk. Once the pedestrian entrance rate exceeds the critical value , current becomes almost null. These observations are consistent with previous studies [19,33,34,61], which concluded that unsignalized mid-block crosswalks experience slower and denser traffic current as pedestrian volume increases.
This preliminary analysis indicates that the presence of the crosswalk exerts an immediate effect, reducing the maximum achievable traffic current by up to 42.6% relative to the baseline system without the crosswalk (see Figure 4a).
To conduct a comprehensive examination of the bottleneck effect, a system’s phase diagram was constructed on the plane (), taking traffic current (J) as the order parameter (see Figure 5b). Three distinct phases were identified: the quasi-free-flow (QFF) phase, confined to and ; the jamming phase, which occupies most of the phase diagram; and the blocking phase, which appears for regardless of the value of . The continuous variation in J across the phase boundaries is consistent with second-order phase transitions. A detailed characterization of the identified phases is presented in the following sections.
4.1.1. Quasi-Free-Flow Phase
The quasi-free-flow phase is distinguished by the prevalence of free flow conditions, where vehicles generally travel at the maximum permitted speed along most of the lanes. Disruptions occur only near the crosswalk, where some vehicles are forced to decelerate or even come to a halt. The raised plateau compels drivers to decelerate even in the absence of pedestrians, while pedestrian interference can further lead to complete stops. These dynamics are captured in the space–time diagrams of Figure 6a,b, where disruptions appear as steeper trajectories near the crosswalk, and vertical traces indicate stationary vehicles. The QFF phase can also be examined through the speed profiles of Figure 6c, which compare scenarios with and without pedestrian presence. The profiles confirm that vehicles maintain free-flow speeds upstream but experience marked decelerations approaching the crosswalk, with sharper drops and frequent halts when pedestrians are present.
Figure 6.
Space–time diagrams of vehicle trajectories in the quasi-free flow phase with : (a) without pedestrians (), (b) with pedestrian interference at ; (c) speed profiles as a function of the lane site under quasi-free flow, comparing scenarios with ( and ) and without pedestrian interference.
The plot in Figure 6c shows two cases with pedestrian interference: one representing the average conditions observed in the case study (), and a hypothetical case in which increases to 0.1. More generally, the entire field-observed demand range lies within the QFF region, indicating that this phase encompasses the usual operating conditions at the study site. The comparison between these two cases further shows that vehicle speed decreases as the pedestrian injection rate increases.
4.1.2. Jamming Phase
The jamming phase emerges when the volume of vehicles reaches the road’s capacity, a condition exacerbated by the flow constriction imposed by the crosswalk. Unlike the QFF phase, this regime occurs beyond the field-observed demand range and represents the system response under progressively higher demand conditions. The flow constriction imposed by the crosswalk then forms an upstream reservoir of vehicles, producing long queues and a marked slowdown. Even without pedestrians, the crosswalk acts as a traffic-calming device, generating extended queues of slow vehicles in the first half of the lane (Figure 7a). With greater pedestrian influx and longer crosswalk occupancy, upstream accumulation intensifies, as shown in Figure 7b, where the lane is densely crowded before the crosswalk while wide gaps predominate downstream. Because the bottleneck does not fully block the flow, some vehicles manage to cross, triggering stop-and-go interactions that thicken upstream queues and sharpen the contrast with the free-flow conditions downstream. This pattern is reflected in the speed profiles (Figure 7c), where upstream velocities fall to nearly one-third of the maximum without pedestrians and to one-sixth under pedestrian interference. The increased heterogeneity near the crosswalk reflects the predominance of stop-and-go dynamics during this phase.
Figure 7.
Space–time diagrams depicting the jamming phase with : (a) without pedestrians (), (b) with pedestrian interference at ; (c) speed profiles as a function of the lane site during the jamming phase, comparing scenarios with and without pedestrian interference.
4.1.3. Blocking Phase
The blocking phase emerges as the bottleneck inhibits traffic flow. This regime arises when the pedestrian entrance rate exceeds the critical value (), at which point the crosswalk drastically reduces vehicle flow until it becomes almost null. In terms of equivalent pedestrian demand, corresponds to approximately 2664 ped/h, placing this phase well beyond the field-observed range and toward the high-demand end of the modeled operating spectrum. The main outcome is the formation of extensive queues of standstill vehicles tightly packed in the upstream half of each lane, contrasted with the wide empty spaces downstream (Figure 8a). Owing to this severe constriction, the average speed in the first half of the lane approaches zero (Figure 8b). Vehicles remain immobilized for long intervals, advancing only when one occasionally manages to cross. These sporadic displacements trigger backward rearrangements of the queues, generating speed fluctuations throughout the upstream section.
Figure 8.
(a) Space–time diagram depicting the blocking phase with and ; (b) speed profile as a function of the lane site during the blocking phase.
5. Effects of the Unsignalized Raised Crosswalk on Vehicle Emissions
The subsequent discussions entail a thorough examination of the impact of the mid-block crosswalk on emissions, allowing for a clearer assessment of the impacts. Carbon dioxide (CO2), carbon monoxide (CO), nitrogen oxides (NOx), and particulate matter (PMx) emissions were examined.
To assess the impact of the crosswalk, heat maps were generated for each emission type under both the baseline scenario without the crosswalk and the scenario with pedestrian interference. For both scenarios, the plotted values were obtained by averaging the instantaneous emissions generated by vehicles along their trajectories over the entire roadway. In the baseline scenario, the averaged emissions were represented as a function of the vehicle injection rate, , whereas in the crosswalk scenario, they were represented over the plane.
These plots provide a quantitative and qualitative basis for comparing the two scenarios and reveal the close correspondence between overall emission variations and the phases identified in the traffic current.
5.1. Effects on CO2 Emission
Overall, CO2 emissions are driven by vehicle acceleration, a process predominantly influenced by vehicle weight and engine efficiency [62,63]. Since acceleration consumes a significant amount of fuel, repeated speed recovery after deceleration increases CO2 emissions [64,65]. This mechanism is relevant in the crosswalk scenario, where vehicle–pedestrian interactions induce additional deceleration-acceleration cycles.
The heatmaps in Figure 9 show that instantaneous CO2 emissions in the crosswalk system are markedly higher than in the baseline scenario within the quasi-free-flow phase. Here, the mean instantaneous emission increases from 2438.70 mg/s in the baseline system to 3001.58 mg/s with the crosswalk. This increase is particularly relevant because the nominal operating conditions of the case study fall within the QFF phase. In contrast, emissions during most of the jamming and blocking phases remain comparable to those observed in the baseline system.
Figure 9.
Mean instantaneous CO2 emission rate averaged over the entire roadway: (a) baseline scenario without the crosswalk, as a function of the vehicle injection rate ; and (b) crosswalk scenario, as a function of and .
To identify the spatial origin of the emission increase observed in the crosswalk scenario, the roadway is examined separately upstream and downstream of the crossing. As discussed above, the crosswalk acts as a bottleneck, creating a vehicle reservoir in the upstream section and regulating the vehicle injection rate for the downstream section. In this sense, the heatmaps in Figure 10 reveal a remarkable spatial asymmetry in the mean instantaneous CO2 emissions. The highest levels are consistently registered downstream of the crosswalk, where vehicles accelerate to recover speed after passing through the bottleneck. Moreover, pedestrian influx has contrasting effects on the two sections: upstream emissions increase with , whereas downstream emissions tend to decrease as rises.
Figure 10.
Mean instantaneous CO2 emission rate as a function of and : (a) upstream of the crosswalk; (b) downstream of the crosswalk.
5.1.1. Spatial Distribution of CO2 Emissions During the Quasi-Free-Flow Phase
A more detailed comparison with the baseline system shows how the crosswalk redistributes CO2 emissions along the roadway during the QFF phase. Upstream of the crosswalk, the mean instantaneous emission decreases from the baseline value of 2438.70 mg/s to 1569.07 mg/s, representing a 35.66% reduction. This drop is attributed to the speed reduction induced by the speed-limit zone implemented on the approach to the crosswalk and by the crosswalk itself, both of which calm upstream traffic and reduce the duration and intensity of acceleration periods.
In stark contrast, the downstream section exhibits a reversed pattern. The mean instantaneous CO2 emission rises to 3703.54 mg/s, corresponding to a 51.87% increase relative to the baseline system. These elevated levels reflect the combined effect of repeated acceleration events as vehicles regain speed after passing the pedestrian zone.
Figure 11 further illustrates the spatial distribution of instantaneous CO2 emissions along the roadway. In both traffic directions, high emissions are concentrated within the crosswalk influence zone, reflecting the acceleration required for vehicles to recover speed. Conversely, the darker upstream region reflects the traffic-calming effect induced by the crosswalk configuration. This snapshot is particularly relevant since it captures the CO2 emission profile characteristic of the traffic regime observed in the case study during a typical daytime operating period.
Figure 11.
Spatial distribution of instantaneous CO2 emissions along the roadway during the QFF phase (, ).
5.1.2. Spatial Distribution of CO2 Emissions During the Jamming Phase
The contrasting spatial pattern persists during the jamming phase. Upstream of the crosswalk, the mean instantaneous CO2 emission remains comparable to the baseline value, decreasing to 2223.76 mg/s, a reduction of approximately 8.81%. This variation suggests a compensation between prolonged idle periods and sudden acceleration events due to stop-and-go traffic.
Downstream of the crosswalk, the emission pattern becomes more heterogeneous. At low pedestrian influx (), CO2 emissions reach a maximum of 4736.51 mg/s, approximately 94.54% above the baseline mean. As increases and conditions approach the blocking phase, emissions drop to 603.66 mg/s. This variability indicates that vehicles passing through the bottleneck undergo pronounced acceleration to recover their cruising speed, thereby intensifying peak emissions, whereas increasing pedestrian interference progressively restricts vehicle access to the downstream section.
Figure 12 depicts the spatial distribution of CO2 emissions along the roadway during the jamming phase. This profile highlights the asymmetry induced by the bottleneck. Upstream of the crosswalk, the stop-and-go dynamics of queued vehicles result in moderate, persistent emissions, whereas the downstream section exhibits higher emissions immediately after the crosswalk and the lowest levels throughout most of the second half of each lane, where free-flow conditions prevail.
Figure 12.
Spatial distribution of instantaneous CO2 emissions along the roadway during the jamming phase (, ).
5.1.3. Spatial Distribution of CO2 Emissions During the Blocking Phase
During the blocking phase, continuous pedestrian interruptions keep most upstream vehicles idling and make acceleration events sporadic. Accordingly, the maximum upstream emission reaches 2608.49 mg/s, a value comparable to the instantaneous emission rate of an idling vehicle estimated from Equation (11). Conversely, since vehicles rarely pass through the bottleneck, the downstream mean instantaneous emission reaches a minimum of 292.03 mg/s. These spatial patterns are captured in Figure 13, where discontinuous upstream emission traces correspond to idling vehicles, whereas the darker downstream region reflects a persistently empty section.
Figure 13.
Spatial distribution of instantaneous CO2 emissions along the roadway during the blocking phase (, ).
5.2. Effects on CO Emission
CO emissions typically surge during cold starts and periods of intense acceleration or high engine load [66,67]. Sharp acceleration and frequent stop-and-go patterns significantly elevate CO emissions by requiring a richer fuel mixture to meet power demands and increasing both fuel injection and engine load [68,69]. Consistent with these mechanisms, Figure 14 shows that, within a limited region of the QFF phase, the mean instantaneous CO emission in the crosswalk system reaches 55.69 mg/s, 555.18% above the baseline value of 8.50 mg/s, despite remaining relatively low. This region spans approximately and extends up to , narrowing as increases. However, CO emissions increase sharply outside such a region, continuing to rise throughout the jamming phase and reaching their highest levels during the blocking phase.
Figure 14.
Mean instantaneous CO emission rate averaged over the entire roadway: (a) baseline scenario without the crosswalk, as a function of the vehicle injection rate , and (b) crosswalk scenario, as a function of and .
The spatial distribution of CO emissions upstream and downstream of the crosswalk provides further insight into these effects (see Figure 15).
Figure 15.
Mean instantaneous CO emission rate as a function of and ; (a) upstream of the crosswalk; (b) downstream of the crosswalk.
5.2.1. Spatial Distribution of CO Emissions During the Quasi-Free-Flow Phase
During most of the QFF phase, upstream instantaneous CO emissions average 30.94 mg/s. However, near the QFF-jamming phase transition, emissions peak at 137.24 mg/s as pedestrian crossings induce intermittent decelerations due to emerging stop-and-go dynamics. Conversely, downstream emissions remain moderate throughout the QFF phase, averaging 37.27 mg/s, as vehicles encounter free-flow conditions upon passing the crosswalk.
5.2.2. Spatial Distribution of CO Emissions During the Jamming Phase
During the jamming phase, high vehicle influx combined with crosswalk interference intensifies stop-and-go dynamics upstream. Upstream mean instantaneous CO emissions increase with from 37.41 mg/s to 129.02 mg/s, representing increases ranging from 340.12% to 1417.88% relative to the baseline value. In contrast, in the downstream zone, mean CO emissions decrease with from 48.60 mg/s to 5.22 mg/s, ranging from 471.76% above to 38.59% below the baseline value.
5.2.3. Spatial Distribution of CO Emissions During the Blocking Phase
During the blocking phase, the bottleneck forces most vehicles to remain idling. Accordingly, the upstream mean instantaneous CO emission rate reaches 161.69 mg/s, close to the theoretical idling rate estimated from Equation (11), with only small deviations due to intermittent queue reorganization as vehicles occasionally pass through the crosswalk. In contrast, since the downstream section is largely empty, its mean instantaneous CO emission rate is 2.70 mg/s.
5.3. Effects on NOx Emission
Within a standard driving cycle, NOx emissions typically peak during rapid acceleration due to high engine loads and elevated combustion temperatures [68]. These conditions are particularly reflected during the QFF phase in the crosswalk system, as vehicles accelerate rapidly after passing through the crosswalk. As depicted in Figure 16, the mean instantaneous NOx emission during the QFF phase reaches 1.14 mg/s, 50% above the baseline mean of 0.76 mg/s. Across the jamming and blocking phases, instantaneous NOx emissions increase with from 0.95 mg/s to 1.20 mg/s, remaining above the baseline level.
Figure 16.
Mean instantaneous NOx emission rate averaged over the entire roadway: (a) baseline scenario without the crosswalk, as a function of the vehicle injection rate , and (b) crosswalk scenario, as a function of and .
5.3.1. Spatial Distribution of NOx Emissions During the Quasi-Free-Flow Phase
Due to low pedestrian interference during the QFF phase, upstream instantaneous NOx emissions range from 0.28 mg/s to 1.03 mg/s, averaging 0.56 mg/s, which is 26.32% below the baseline mean (see Figure 17). However, downstream emissions range from 0.35 mg/s to 1.79 mg/s, averaging 1.40 mg/s, suggesting that, despite the generally smoother flow, intense re-acceleration after passing through the crosswalk produces substantial emission peaks.
Figure 17.
Mean instantaneous NOx emission rate as a function of and ; (a) upstream of the crosswalk; (b) downstream of the crosswalk.
5.3.2. Spatial Distribution of NOx Emissions During the Jamming Phase
During the jamming phase, intensified stop-and-go traffic produces contrasting effects upstream and downstream of the crosswalk. Upstream NOx emissions increase with from 0.53 mg/s to 1.18 mg/s. Conversely, downstream emissions decrease from 1.79 mg/s to 0.22 mg/s as increases. These trends reflect the progressive restriction of vehicle movement as pedestrian interference intensifies, causing traffic to accumulate in the upstream half of the system while leaving the downstream section largely empty.
5.3.3. Spatial Distribution of NOx Emissions During the Blocking Phase
Intensified pedestrian interference leads to long queues of idling vehicles upstream of the crosswalk, while traffic flow in the downstream half becomes almost null. Consequently, during the blocking phase, upstream instantaneous NOx emissions average 1.18 mg/s. In contrast, downstream emissions decrease to 0.1 mg/s.
5.4. Effects on PMx Emission
During a typical driving cycle, PMx emissions tend to increase under high engine loads, particularly during rapid acceleration, because these conditions promote particle formation. Since the crosswalk induces deceleration-acceleration cycles even in the absence of pedestrians, instantaneous PMx emissions are generally higher than in the baseline system.
As shown in Figure 18a, baseline emissions remain low under free-flow conditions (), ranging from 0.013 to 0.031 mg/s. At higher traffic densities, emissions vary within a range of 0.031 to 0.033 mg/s. In contrast, Figure 18b shows that even the lowest values obtained for the crosswalk system, observed during the QFF phase and at the onset of jamming, remain above the baseline range. Instantaneous PMx emissions vary from 0.039 to 0.060 mg/s during the QFF phase and reach values of up to 0.065 mg/s during the jamming and blocking phases.
Figure 18.
Mean instantaneous PMx emission rate averaged over the entire roadway: (a) baseline scenario without the crosswalk, as a function of the vehicle injection rate , and (b) crosswalk scenario, as a function of and .
As shown in Figure 19, the spatial distribution of PMx emissions follows trends analogous to those observed for NOx.
Figure 19.
Mean instantaneous PMx emission rate as a function of and ; (a) upstream of the crosswalk; (b) downstream of the crosswalk.
5.4.1. Spatial Distribution of PMx Emissions During the Quasi-Free-Flow Phase
During the QFF phase, instantaneous PMx emissions upstream of the crosswalk range from 0.007 mg/s to 0.056 mg/s, averaging 0.021 mg/s. In contrast, downstream emissions range from 0.014 mg/s to 0.074 mg/s, averaging 0.058 mg/s. This pattern further indicates that the crosswalk effect is primarily driven by the pronounced re-acceleration of vehicles downstream.
5.4.2. Spatial Distribution of PMx Emissions During the Jamming Phase
During the jamming phase, increasing pedestrian interference redistributes PMx emissions across the crosswalk. As rises, upstream emissions increase from 0.021 mg/s to 0.065 mg/s, while downstream emissions decrease from 0.075 mg/s to 0.009 mg/s, reflecting progressive traffic accumulation upstream and reduced traffic flow downstream.
5.4.3. Spatial Distribution of PMx Emissions During the Blocking Phase
During the blocking phase, instantaneous PMx emissions reach 0.066 mg/s upstream and fall to 0.003 mg/s downstream, reflecting the formation of long queues of idling vehicles before the crosswalk and almost null traffic flow downstream.
5.5. Environmental Implications of the Unsignalized Raised Crosswalk
Although the unsignalized raised crosswalk imposes a localized disturbance on vehicle motion, its environmental effects extend across the entire system and vary with the microscopic driving conditions of each traffic phase. This produces a marked upstream-downstream asymmetry in emissions. Upstream of the crosswalk, traffic calming reduces CO2 and PMx emissions by limiting vehicle speed and acceleration, while repeated deceleration increases CO and NOx emissions. Downstream, the acceleration required to regain cruising speed increases the emission rates of CO2, CO, NOx, and PMx. Therefore, the raised crosswalk redistributes the underlying emission mechanisms from speed reduction and intermittent stopping upstream to acceleration downstream. Accordingly, the environmental burden reflects both the magnitude of individual emission peaks and the number of vehicles repeatedly exposed to these disturbances.
An important implication is that the quasi-free-flow phase is central to the environmental analysis since it combines high vehicle throughput with recurrent speed disturbances, highlighting that the crosswalk itself affects vehicle dynamics even in the absence of pedestrian interference. This phase also characterizes traffic conditions in the case study throughout the observed operating day, and its relevance is further reinforced by the arterial setting of the crosswalk. The site is located on a primary arterial road intended to support continuous longitudinal movement, while the crosswalk accommodates local pedestrian connectivity across the corridor. The resulting conflict should not be interpreted as an argument against pedestrian accessibility or against raised crosswalks in general. Rather, it reveals the environmental consequences of introducing an unsignalized interruption into a road whose operation depends on traffic continuity. Hence, under the conditions examined here, the design challenge is to manage vehicle–pedestrian interactions to reduce abrupt re-acceleration and speed heterogeneity while preserving pedestrian access.
The broader applicability of these findings depends on consideration of site-specific roadway and pedestrian conditions, as well as the adopted modeling framework. Although key model inputs were informed or evaluated using field observations, some uncertainty remains associated with simplifying assumptions regarding pedestrian behavior and vehicle fleet representation. The emission estimates were derived from simulated vehicle trajectories using HBEFA and a vehicle class representative of the predominant category observed at the study site. A natural extension is to examine more heterogeneous fleet compositions and to compare simulation-derived emission estimates with field emission measurements. Such analyses, combined with applications to other roadway configurations and pedestrian conditions, would provide a stronger basis for evaluating the transferability of the emission estimates across traffic environments.
6. Pedestrian-Actuated Signalization as a Mitigation Strategy
Pedestrian-actuated signalization was evaluated as a potential strategy for managing vehicle–pedestrian interactions and mitigating the increase in vehicular emissions associated with the crossing. As part of this intervention, the raised crosswalk was replaced with a zebra crossing, and the associated speed-limit zone was removed. The modified configuration allows vehicles to pass through the crossing without interruption in the absence of pedestrian requests, thereby reducing the frequency of abrupt re-acceleration events and speed heterogeneity while preserving pedestrian access.
The pedestrian-actuated signal was implemented to preserve vehicular right-of-way and is activated only after a pedestrian has waited for at least 5 s. Once a request is registered, the signal first provides a vehicular clearance interval of 3 s and then activates a pedestrian crossing phase of 18 s. If pedestrians remain within the crossing near the end of this phase, the pedestrian interval is extended in increments of 5 s, up to a maximum additional duration of 20 s. A supplementary extension of 10 s is also provided for pedestrians who have not completed the final section of the crossing.
This control strategy was evaluated using the 24 hourly pairs of vehicle and pedestrian injection rates derived from the operational data. The resulting profiles, shown in Figure 20, compare the hourly emissions of CO2, CO, NOx, and PMx across three configurations: the baseline system without a crosswalk, the system with the unsignalized raised crosswalk, and the system with the zebra crossing controlled by the pedestrian-actuated signal.
Figure 20.
Hourly profiles of the mean instantaneous emission rates throughout the observed operating day for the baseline, unsignalized crosswalk, and signalized crosswalk scenarios: (a) CO2, (b) CO, (c) NOx, and (d) PMx.
Across the 24 hourly operating conditions, the pedestrian-actuated signalized zebra crossing reduced the mean CO2, CO, NOx, and PMx emission rates by 18.3%, 40.61%, 26.75%, and 38.96%, respectively, relative to the unsignalized raised crosswalk. Since the baseline does not accommodate pedestrian crossings and allows uninterrupted vehicular operation, it defines a lower-bound environmental reference. Relative to this reference, the signal-controlled configuration eliminated 99.18% of the additional CO2 emissions associated with the raised crosswalk, together with 44.41%, 81.37%, and 71.01% of the corresponding increases in CO, NOx, and PMx, respectively. These results show that a pedestrian-actuated signal allows pedestrians to cross while substantially reducing the emission effects associated with the existing raised crosswalk.
To complement the emissions analysis with a pedestrian-service indicator, mean pedestrian waiting time was also quantified for the pedestrian-actuated configuration under the 24 field-observed hourly demand conditions. Across the 24 conditions, the mean pedestrian waiting time was 6.53 s, with hourly mean values ranging from 5.43 to 7.97 s. Waiting times were generally higher during periods of lower pedestrian demand and decreased as pedestrian demand increased, a pattern consistent with the actuated nature of the control. These values provide a direct measure of the waiting imposed on pedestrians by the actuated control and allow the environmental benefits reported below to be interpreted together with their pedestrian-service implications.
The operating-day results indicate that the pedestrian-actuated signalized zebra crossing substantially reduces the emission effects associated with the unsignalized raised crosswalk across all four pollutants. Under the conditions examined, this configuration represents a promising and feasible alternative for improving the environmental performance of the existing crossing while maintaining pedestrian access. Additional calibration and testing of the pedestrian-actuated control strategy across a broader range of roadway settings and demand levels would help assess the robustness and generalizability of these findings.
7. Conclusions
This study has presented a comprehensive microscopic analysis of the environmental effects associated with an unsignalized mid-block raised crosswalk deployed on a high-speed arterial road using computational simulations. The underlying model was developed and calibrated using extensive field data collected at a real-world site to capture the main operational complexities of vehicle–pedestrian interactions. The resulting model was then used to examine the full range of vehicle and pedestrian injection rates.
Simulation results revealed that the environmental effects arise from the permanent speed disturbance imposed by the raised crosswalk and are further compounded by pedestrian interference. Hence, the crosswalk acts as a persistent bottleneck, reducing the maximum traffic current by 42.6% and giving rise to three distinct traffic phases: quasi-free flow, jamming, and blocking. These phases determine both the magnitude and the spatial distribution of emissions along the roadway.
The quasi-free-flow phase was identified as the most environmentally relevant because it combines high vehicle throughput with frequent deceleration and re-acceleration and encompasses the conditions observed during most of the operating day at the study site. In this phase, the raised crosswalk increases the mean instantaneous CO2 emission rate by 23.08% and produces a spatial asymmetry: upstream traffic calming reduces CO2 emissions by 35.66%, whereas downstream speed recovery increases them by 51.87%. Similar downstream increases occur for NOx and PMx, while CO was particularly sensitive to upstream stop-and-go dynamics. During the jamming and blocking phases, pedestrian interference shifts emissions upstream, where vehicle accumulation is dominated by queueing and idling, whereas downstream emissions decrease as the section becomes nearly empty.
The spatial asymmetry reveals an operational incompatibility between the permanent speed disturbance imposed by the raised crosswalk and the continuity of vehicular flow expected on arterial roads. This finding exposes the difficulty of accommodating pedestrian access while preserving the operational continuity required by high-capacity, long-distance corridors. Moreover, this operational incompatibility highlights the challenge of managing vehicle–pedestrian interactions in a way that reduces abrupt re-acceleration and speed heterogeneity while preserving pedestrian access.
To explore an alternative for addressing this challenge, a zebra crosswalk controlled by a pedestrian-actuated signal was evaluated. By coordinating pedestrian and vehicular right-of-way, this configuration reduced the mean operating-day emission rates by 18.3% for CO2, 40.61% for CO, 26.75% for NOx, and 38.96% for PMx relative to the unsignalized raised crosswalk. Therefore, under the high-speed arterial conditions considered in this study, pedestrian-actuated signalization provides an alternative means of coordinating pedestrian and vehicular right-of-way while reducing abrupt vehicle re-acceleration and the environmental burden associated with the existing unsignalized raised crosswalk.
Rather than prescribing a universal crossing solution, this study establishes a field-informed microscopic framework for examining how pedestrian infrastructure reshapes traffic dynamics and vehicle emissions. In this way, the simulation results provide a quantitative basis for refining vehicle–pedestrian interaction strategies by incorporating emissions as an essential criterion in the design and evaluation of sustainable mobility systems.
Future research should extend this framework by examining alternative crossing layouts and control strategies, as well as more heterogeneous vehicle fleets and pedestrian dynamics, including bidirectional flows.
A complementary line of research could couple vehicle-emission estimates with pollutant dispersion models and cumulative-exposure models. Such an extension would enable a more comprehensive evaluation of the trade-offs among traffic performance, environmental impact, and pedestrian access.
Author Contributions
Conceptualization, J.R.P.-C. and A.H.-B.; methodology, J.R.P.-C., A.H.-B., N.L. and R.M.; software, J.R.P.-C. and A.H.-B.; validation, J.R.P.-C., A.H.-B., N.L. and R.M.; formal analysis, J.R.P.-C., A.H.-B., N.L. and R.M.; investigation, J.R.P.-C. and A.H.-B.; resources, J.R.P.-C. and A.H.-B.; data curation, J.R.P.-C. and A.H.-B.; writing—original draft preparation, J.R.P.-C., A.H.-B., N.L. and R.M.; writing—review and editing, J.R.P.-C., A.H.-B., N.L. and R.M.; visualization, J.R.P.-C., A.H.-B., N.L. and R.M.; supervision, J.R.P.-C. All authors have read and agreed to the published version of the manuscript.
Funding
This research received no external funding.
Institutional Review Board Statement
Not applicable.
Data Availability Statement
Data are contained within the article; additional datasets are available from the authors upon request.
Acknowledgments
The authors gratefully acknowledge the Instituto Nacional de Astrofísica, Óptica y Electrónica (INAOE), particularly the National Supercomputing Laboratory and the General Computing Administration, for providing the high-performance computing resources essential to this research. They also thank the Universidad Michoacana de San Nicolás de Hidalgo for providing complementary technical equipment used in this study and the Centro Universitario del Norte–Universidad de Guadalajara for its valuable institutional support.
Conflicts of Interest
The authors declare no conflicts of interest.
References
- Litman, T.M. Evaluating Transportation Equity: Guidance for Incorporating Distributional Impacts in Transport Planning; Victoria Transport Policy Institute: Victoria, BC, Canada, 2024. [Google Scholar]
- Harrison, K.; Börütecene, A.; Löwgren, J.; Enlund, D.; Ringdahl, R.; Angelakis, V. Sustainability Means Inclusivity: Engaging Citizens in Early-Stage Smart City Development. IEEE Technol. Soc. Mag. 2021, 40, 60–65. [Google Scholar] [CrossRef] [Scilit]
- Gössling, S.; Choi, A.; Dekker, K.; Metzler, D. The Social Cost of Automobility, Cycling and Walking in the European Union. Ecol. Econ. 2019, 158, 65–74. [Google Scholar] [CrossRef] [Scilit]
- Khreis, H.; Nieuwenhuijsen, M.J.; Zietsman, J.; Ramani, T. Chapter 25—Traffic-related air pollution: Emissions, human exposures, and health—The way forward. In Traffic-Related Air Pollution; Khreis, H., Nieuwenhuijsen, M., Zietsman, J., Ramani, T., Eds.; Elsevier: Amsterdam, The Netherlands, 2020; pp. 597–620. [Google Scholar] [CrossRef] [Scilit]
- Khreis, H.; Nieuwenhuijsen, M.J.; Zietsman, J.; Ramani, T. Chapter 1—Traffic-related air pollution: Emissions, human exposures, and health: An introduction. In Traffic-Related Air Pollution; Khreis, H., Nieuwenhuijsen, M., Zietsman, J., Ramani, T., Eds.; Elsevier: Amsterdam, The Netherlands, 2020; pp. 1–21. [Google Scholar] [CrossRef] [Scilit]
- Ryghaug, M.; Subotički, I.; Smeds, E.; von Wirth, T.; Scherrer, A.; Foulds, C.; Robison, R.; Bertolini, L.; Beyazit İnce, E.; Brand, R.; et al. A Social Sciences and Humanities research agenda for transport and mobility in Europe: Key themes and 100 research questions. Transp. Rev. 2023, 43, 755–779. [Google Scholar] [CrossRef] [Scilit]
- Neves, S.A.; Marques, A.C.; Patrício, M. Determinants of CO2 emissions in European Union countries: Does environmental regulation reduce environmental pollution? Econ. Anal. Policy 2020, 68, 114–125. [Google Scholar] [CrossRef] [Scilit]
- Londoño, G.; Lozano, A. Universal accessibility and multimodal calm traffic on secondary streets to reduce pedestrian and vehicular conflicts. Transp. Res. Procedia 2023, 71, 195–202. [Google Scholar] [CrossRef] [Scilit]
- Saltarin-Molino, M.A.; Moros-Daza, A.; Camacho-Sanchez, C. Taking steps forward: Innovative evaluation of pedestrian infrastructure through a multivariate analysis. Case Stud. Transp. Policy 2023, 14, 101091. [Google Scholar] [CrossRef] [Scilit]
- Jabbari, M.; Fonseca, F.; Smith, G.; Conticelli, E.; Tondelli, S.; Ribeiro, P.; Ahmadi, Z.; Papageorgiou, G.; Ramos, R. The Pedestrian Network Concept: A Systematic Literature Review. J. Urban Mobil. 2023, 3, 100051. [Google Scholar] [CrossRef] [Scilit]
- Harkin, K.A.; Harkin, A.M.; Gögel, C.; Schade, J.; Petzoldt, T. How do vulnerable road users evaluate automated vehicles in urban traffic? A focus group study with pedestrians, cyclists, e-scooter riders, older adults, and people with walking disabilities. Transp. Res. Part F Traffic Psychol. Behav. 2024, 104, 59–71. [Google Scholar] [CrossRef] [Scilit]
- Hulse, L.M. Pedestrians’ perceived vulnerability and observed behaviours relating to crossing and passing interactions with autonomous vehicles. Transp. Res. Part F Traffic Psychol. Behav. 2023, 93, 34–54. [Google Scholar] [CrossRef] [Scilit]
- Li, C.; Liu, S.; Cen, X. Safety and efficiency impact of pedestrian–vehicle conflicts at non signalized midblock crosswalks based on fuzzy cellular automata. Phys. A Stat. Mech. Its Appl. 2021, 572, 125871. [Google Scholar] [CrossRef] [Scilit]
- Kruszyna, M.; Matczuk-Pisarek, M. The Effectiveness of Selected Devices to Reduce the Speed of Vehicles on Pedestrian Crossings. Sustainability 2021, 13, 9678. [Google Scholar] [CrossRef] [Scilit]
- Mohammadipour, A.; Mohammadipour, A.; Alavi, S.H. Statistical analysis of geometric characteristics and speed reductions for raised pedestrian crosswalks (RPC). J. Transp. Saf. Secur. 2020, 12, 380–399. [Google Scholar] [CrossRef] [Scilit]
- Pérez-Acebo, H.; Ziółkowski, R.; Linares-Unamunzaga, A.; Gonzalo-Orden, H. A Series of Vertical Deflections, a Promising Traffic Calming Measure: Analysis and Recommendations for Spacing. Appl. Sci. 2020, 10, 3368. [Google Scholar] [CrossRef] [Scilit]
- Officials, N.; Initiative, G. Global Street Design Guide; Island Press: Washington, DC, USA, 2016. [Google Scholar]
- Forde, A.; Daniel, J. Pedestrian walking speed at un-signalized midblock crosswalk and its impact on urban street segment performance. J. Traffic Transp. Eng. (Engl. Ed.) 2021, 8, 57–69. [Google Scholar] [CrossRef] [Scilit]
- Zhao, J.; Malenje, J.O.; Wu, J.; Ma, R. Modeling the interaction between vehicle yielding and pedestrian crossing behavior at unsignalized midblock crosswalks. Transp. Res. Part F Traffic Psychol. Behav. 2020, 73, 222–235. [Google Scholar] [CrossRef] [Scilit]
- Sakib, N.; Paul, T.; Ahmed, M.T.; Momin, K.A.; Barua, S. Investigating factors influencing pedestrian crosswalk usage behavior in Dhaka city using supervised machine learning techniques. Multimodal Transp. 2024, 3, 100108. [Google Scholar] [CrossRef] [Scilit]
- Hussain, M.S.; Bahrha, G.; Goswami, A.K. An integrated VISSIM-SSAM approach to predicting and mitigating pedestrian crashes and severity along urban crossings. Case Stud. Transp. Policy 2024, 15, 101153. [Google Scholar] [CrossRef] [Scilit]
- Yeo, J.; Lee, J.; Cho, J.; Kim, D.K.; Jang, K. Effects of speed humps on vehicle speed and pedestrian crashes in South Korea. J. Saf. Res. 2020, 75, 78–86. [Google Scholar] [CrossRef] [Scilit] [PubMed]
- Sogbe, E. An investigation into drivers’ yielding behaviour at marked uncontrolled pedestrian crossings in Ghana. IATSS Res. 2024, 48, 100–107. [Google Scholar] [CrossRef] [Scilit]
- Sarker, M.S.; Carsten, O.; Huang, Y.; Hajiseyedjavadi, F. Promoting pedestrian safety in Bangladesh: Identifying factors for drivers’ yielding behavior at designated crossings using behavior change theories. Traffic Inj. Prev. 2024, 25, 976–985. [Google Scholar] [CrossRef] [Scilit] [PubMed]
- Wang, Y.; Zhou, Z.; Chen, W.; Wang, T.; Wang, L. Modelling yielding dilemma zone for drivers at non-signalised crosswalks. Transp. Res. Part F Traffic Psychol. Behav. 2024, 102, 213–232. [Google Scholar] [CrossRef] [Scilit]
- Wang, Y.; Su, Q.; Wang, C.; Prato, C.G. Investigating yielding behavior of heterogeneous vehicles at a semi-controlled crosswalk. Accid. Anal. Prev. 2021, 161, 106381. [Google Scholar] [CrossRef] [Scilit] [PubMed]
- Zhang, Y.; Qiao, Y.; Fricker, J.D. Investigating pedestrian waiting time at semi-controlled crossing locations: Application of multi-state models for recurrent events analysis. Accid. Anal. Prev. 2020, 137, 105437. [Google Scholar] [CrossRef] [Scilit] [PubMed]
- Danaf, M.; Sabri, A.; Abou-Zeid, M.; Kaysi, I. Pedestrian–vehicular interactions in a mixed street environment. Transp. Lett. 2020, 12, 87–99. [Google Scholar] [CrossRef] [Scilit]
- Angioi, F.; Bassani, M. The implications of situation and route familiarity for driver-pedestrian interaction at uncontrolled mid-block crosswalks. Transp. Res. Part F Traffic Psychol. Behav. 2022, 90, 287–299. [Google Scholar] [CrossRef] [Scilit]
- Kadali, B.R.; Vedagiri, P. Evaluation of pedestrian crossing speed change patterns at unprotected mid-block crosswalks in India. J. Traffic Transp. Eng. (Engl. Ed.) 2020, 7, 832–842. [Google Scholar] [CrossRef] [Scilit]
- Raghuram Kadali, D.B.; Vedagiri, D.P. Role of number of traffic lanes on pedestrian gap acceptance and risk taking behaviour at uncontrolled crosswalk locations. J. Transp. Health 2020, 19, 100950. [Google Scholar] [CrossRef] [Scilit]
- Šurdonja, S.; Otković, I.I.; Deluka-Tibljaš, A.; Campisi, T. Simplified model of children-pedestrian crossing speed at signalized crosswalks. Transp. Res. Procedia 2023, 69, 560–567. [Google Scholar] [CrossRef] [Scilit]
- Pérez Cruz, J.R.; Lakouari, N.; Marzoug, R.; Pérez Sansalvador, J.C. Pedestrian–vehicle interactions at unsignalized mid-block crosswalks: Effects on traffic flow, CO2 emissions, and energy dissipation. Phys. A Stat. Mech. Its Appl. 2023, 630, 129265. [Google Scholar] [CrossRef] [Scilit]
- Pérez Cruz, J.R.; Lakouari, N.; Pérez Sansalvador, J.C.; Zapotecatl López, J.L. Effect of Interactions between Vehicles and Mid-Block Crosswalks on Traffic Flow and CO2 Emission. Appl. Sci. 2021, 11, 1794. [Google Scholar] [CrossRef] [Scilit]
- Alali, A.; Olariu, S. Reducing the Environmental Impact of Midblock Crossing. Transp. Res. Procedia 2025, 84, 65–72. [Google Scholar] [CrossRef] [Scilit]
- Fondzenyuy, S.K.; Turner, B.M.; Burlacu, A.F.; Jurewicz, C.; Usami, D.S.; Feudjio, S.L.T.; Persia, L. The Impact of Speed Limit Change on Emissions: A Systematic Review of Literature. Sustainability 2024, 16, 7712. [Google Scholar] [CrossRef] [Scilit]
- Chen, W.; Wang, T.; Wang, Y.; Li, Q.; Xu, Y.; Niu, Y. Lane-based Distance-Velocity model for evaluating pedestrian-vehicle interaction at non-signalized locations. Accid. Anal. Prev. 2022, 176, 106810. [Google Scholar] [CrossRef] [Scilit] [PubMed]
- Guan, F.; Whitley, T.; Xu, H.; Wang, Z.; Chen, Z.; Hui, T.; Tian, Y. Vehicle-pedestrian interaction analysis for evaluating pedestrian crossing safety at uncontrolled crosswalks—A geospatial approach using multimodal all-traffic trajectories. J. Saf. Res. 2024, 91, 326–341. [Google Scholar] [CrossRef] [Scilit]
- Dam, A.; Oberoi, P.; Pierson, J.; Jeon, M.; Patrick, R.N. Technological and social distractions at unsignalized and signalized campus crosswalks: A multi-stage naturalistic observation study. Transp. Res. Part F Traffic Psychol. Behav. 2023, 97, 246–267. [Google Scholar] [CrossRef] [Scilit]
- Pérez-Sansalvador, J.C.; Lakouari, N.; Garcia-Diaz, J.; Hernández, S.E.P. The Effect of Speed Humps on Instantaneous Traffic Emissions. Appl. Sci. 2020, 10, 1592. [Google Scholar] [CrossRef] [Scilit]
- Raheem, I.; Burari, F.W.; Salihu, A.; Abdulkareem, M.; Aremu, B.G.; Rabiu, J.A. Assessment of CO2 emission due to speed bumps on selected highways in Bauchi state. FUDMA J. Sci. 2024, 8, 91–98. [Google Scholar] [CrossRef] [Scilit]
- Butkus, M.A.; Owens, N.T.; Dacunto, P.J.; Pfluger, A.R. An Estimate of Greenhouse Gas Emissions from Light Duty Vehicles Resulting from Traffic Calming Stops in the U.S. Suburbs. Environ. Eng. Sci. 2025, 42, 467–475. [Google Scholar] [CrossRef] [Scilit]
- di He, H.; Gao, H.O. Particulate matter exposure at a densely populated urban traffic intersection and crosswalk. Environ. Pollut. 2021, 268, 115931. [Google Scholar] [CrossRef] [Scilit] [PubMed]
- Alvarez Lopez, P.; Behrisch, M.; Bieker-Walz, L.; Erdmann, J.; Flötteröd, Y.P.; Hilbrich, R.; Lücken, L.; Rummel, J.; Wagner, P.; Wiessner, E. Microscopic Traffic Simulation using SUMO. In Proceedings of the 2018 21st International Conference on Intelligent Transportation Systems (ITSC), Maui, HI, USA, 4–7 November 2018; pp. 2575–2582. [Google Scholar] [CrossRef] [Scilit]
- Faheem, H. Suitability of Existing Traffic Calming Measures for Use on Some Highways in Egypt. In Proceedings of the 9th International Conference on Civil and Architecture Engineering (ICCAE), Cairo, Egypt, 29–31 May 2012; pp. 1–13. [Google Scholar]
- Ewing, R. Impacts of Traffic Calming. In Proceedings of the Transportation Research E-Circular; Number E-C019; Transportation Research Board: Washington, DC, USA, 2001; pp. I-1–I-14. [Google Scholar]
- Secretaría de Desarrollo Agrario, Territorial y Urbano. NOM-004-SEDATU-2023, Estructura y Diseño para Vías Urbanas. Especificaciones y Aplicación; Diario Oficial de la Federación: Ciudad de México, Mexico, 2024.
- Oikonomou, M.G.; Yannis, G. Validating traffic simulation for crash risk assessment using field crash data. J. Saf. Res. 2025, 94, 24–34. [Google Scholar] [CrossRef] [Scilit]
- Erdmann, J.; Krajzewicz, D. Modelling Pedestrian Dynamics in SUMO. In SUMO 2015-Intermodal Simulation for Intermodal Transport; Deutsches Zentrum für Luft- und Raumfahrt e.V.: Berlin, Germany, 2015. [Google Scholar]
- Engineering National Academies of Sciences (and Medicine) and Transportation Research Board. Highway Capacity Manual 7th Edition: A Guide for Multimodal Mobility Analysis; The National Academies Press: Washington, DC, USA, 2022. [Google Scholar] [CrossRef] [Scilit] [PubMed]
- Liu, G. W99 Car Following Model-How It Works; W99demo.com: Arlington, VA, USA, 2016. [Google Scholar]
- Wiedemann, R. Simulation des Strassenverkehrsflusses. In Schriftenreihe des Instituts für Verkehrswesen der Universität Karlsruhe; Heft 8; Institut für Verkehrswesen der Universität Karlsruhe: Karlsruhe, Germany, 1974. [Google Scholar]
- Aghabayk, K.; Sarvi, M.; Young, W.; Kautzsch, L. A novel methodology for evolutionary calibration of Vissim by multi-threading. In Proceedings of the Australasian Transport Research Forum, Brisbane, Australia, 2–4 October 2013; Volume 36, pp. 1–15. [Google Scholar]
- Chaudhari, A.A.; Srinivasan, K.K.; Chilukuri, B.R.; Treiber, M.; Okhrin, O. Calibrating Wiedemann-99 Model Parameters to Trajectory Data of Mixed Vehicular Traffic. Transp. Res. Rec. 2022, 2676, 718–735. [Google Scholar] [CrossRef] [Scilit]
- Schrader, M.; Karnik, A.; Hainen, A.; Bittle, J. Calibrating Car-Following Models Using SUMO-in-the-Loop and Vehicle Trajectories From Roadside Radar: Calibrating CF Model Parameters. SUMO Conf. Proc. 2024, 5, 209–233. [Google Scholar] [CrossRef] [Scilit]
- Kaths, H.; Keler, A.; Bogenberger, K. Calibrating the Wiedemann 99 Car-Following Model for Bicycle Traffic. Sustainability 2021, 13, 3487. [Google Scholar] [CrossRef] [Scilit]
- Krajzewicz, D.; Behrisch, M.; Wagner, P.; Luz, R.; Krumnow, M. Second generation of pollutant emission models for SUMO. In Proceedings of the Modeling Mobility with Open Data: 2nd SUMO Conference 2014, Berlin, Germany, 15–16 May 2014; Springer: Cham, Switzerland, 2015; pp. 203–221. [Google Scholar] [CrossRef] [Scilit]
- Notter, B.; Keller, M.; Cox, B. Handbook Emission Factors for Road Transport 4.1; Quick Reference: Berne, Germany, 2019; Volume 28. [Google Scholar]
- Integrate Data Facts (IDF). Mexico’s Vehicles in Operation Reach Record 36.1 Million at Year-End 2025; Reports IDF; Integrate Data Facts (IDF): Rochester Hills, MI, USA, 2026. [Google Scholar]
- Wan, B.; Rouphail, N.M. Using Arena for Simulation of Pedestrian Crossing in Roundabout Areas. Transp. Res. Rec. 2004, 1878, 58–65. [Google Scholar] [CrossRef] [Scilit]
- Zhao, H.T.; Yang, S.; Chen, X.X. Cellular automata model for urban road traffic flow considering pedestrian crossing street. Phys. A Stat. Mech. Its Appl. 2016, 462, 1301–1313. [Google Scholar] [CrossRef] [Scilit]
- Adamidis, F.K.; Mantouka, E.G.; Vlahogianni, E.I. Effects of controlling aggressive driving behavior on network-wide traffic flow and emissions. Int. J. Transp. Sci. Technol. 2020, 9, 263–276. [Google Scholar] [CrossRef] [Scilit]
- Ferreira, H.; Rodrigues, C.M.; Pinho, C. Impact of Road Geometry on Vehicle Energy Consumption and CO2 Emissions: An Energy-Efficiency Rating Methodology. Energies 2020, 13, 119. [Google Scholar] [CrossRef] [Scilit]
- Shahariar, G.H.; Bodisco, T.A.; Zare, A.; Sajjad, M.; Jahirul, M.; Chu Van, T.; Bartlett, H.; Ristovski, Z.; Brown, R.J. Impact of driving style and traffic condition on emissions and fuel consumption during real-world transient operation. Fuel 2022, 319, 123874. [Google Scholar] [CrossRef] [Scilit]
- Obregón-Biosca, S.A. Speed humps and speed tables: Externalities on vehicle speed, pollutant emissions and fuel consumption. Results Eng. 2020, 5, 100089. [Google Scholar] [CrossRef] [Scilit]
- Yusuf, A.A.; Inambao, F.L. Effect of cold start emissions from gasoline-fueled engines of light-duty vehicles at low and high ambient temperatures: Recent trends. Case Stud. Therm. Eng. 2019, 14, 100417. [Google Scholar] [CrossRef] [Scilit]
- Chu Van, T.; Zare, A.; Jafari, M.; Bodisco, T.A.; Surawski, N.; Verma, P.; Suara, K.; Ristovski, Z.; Rainey, T.; Stevanovic, S.; et al. Effect of cold start on engine performance and emissions from diesel engines using IMO-Compliant distillate fuels. Environ. Pollut. 2019, 255, 113260. [Google Scholar] [CrossRef] [Scilit] [PubMed]
- Jiang, C.; Li, Z.; Qian, Y.; Wang, X.; Zhang, Y.; Lu, X. Experimental studies on the co-effects of engine operating parameters and fuel functional groups on the performance and emissions of a GDI engine. Appl. Therm. Eng. 2018, 140, 707–715. [Google Scholar] [CrossRef] [Scilit]
- Choudhary, A.; Gokhale, S. Urban real-world driving traffic emissions during interruption and congestion. Transp. Res. Part D Transp. Environ. 2016, 43, 59–70. [Google Scholar] [CrossRef] [Scilit]
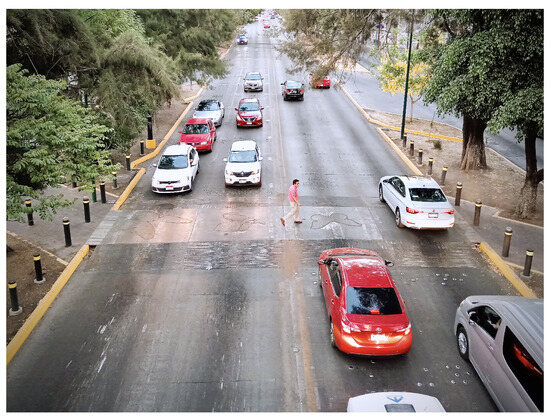
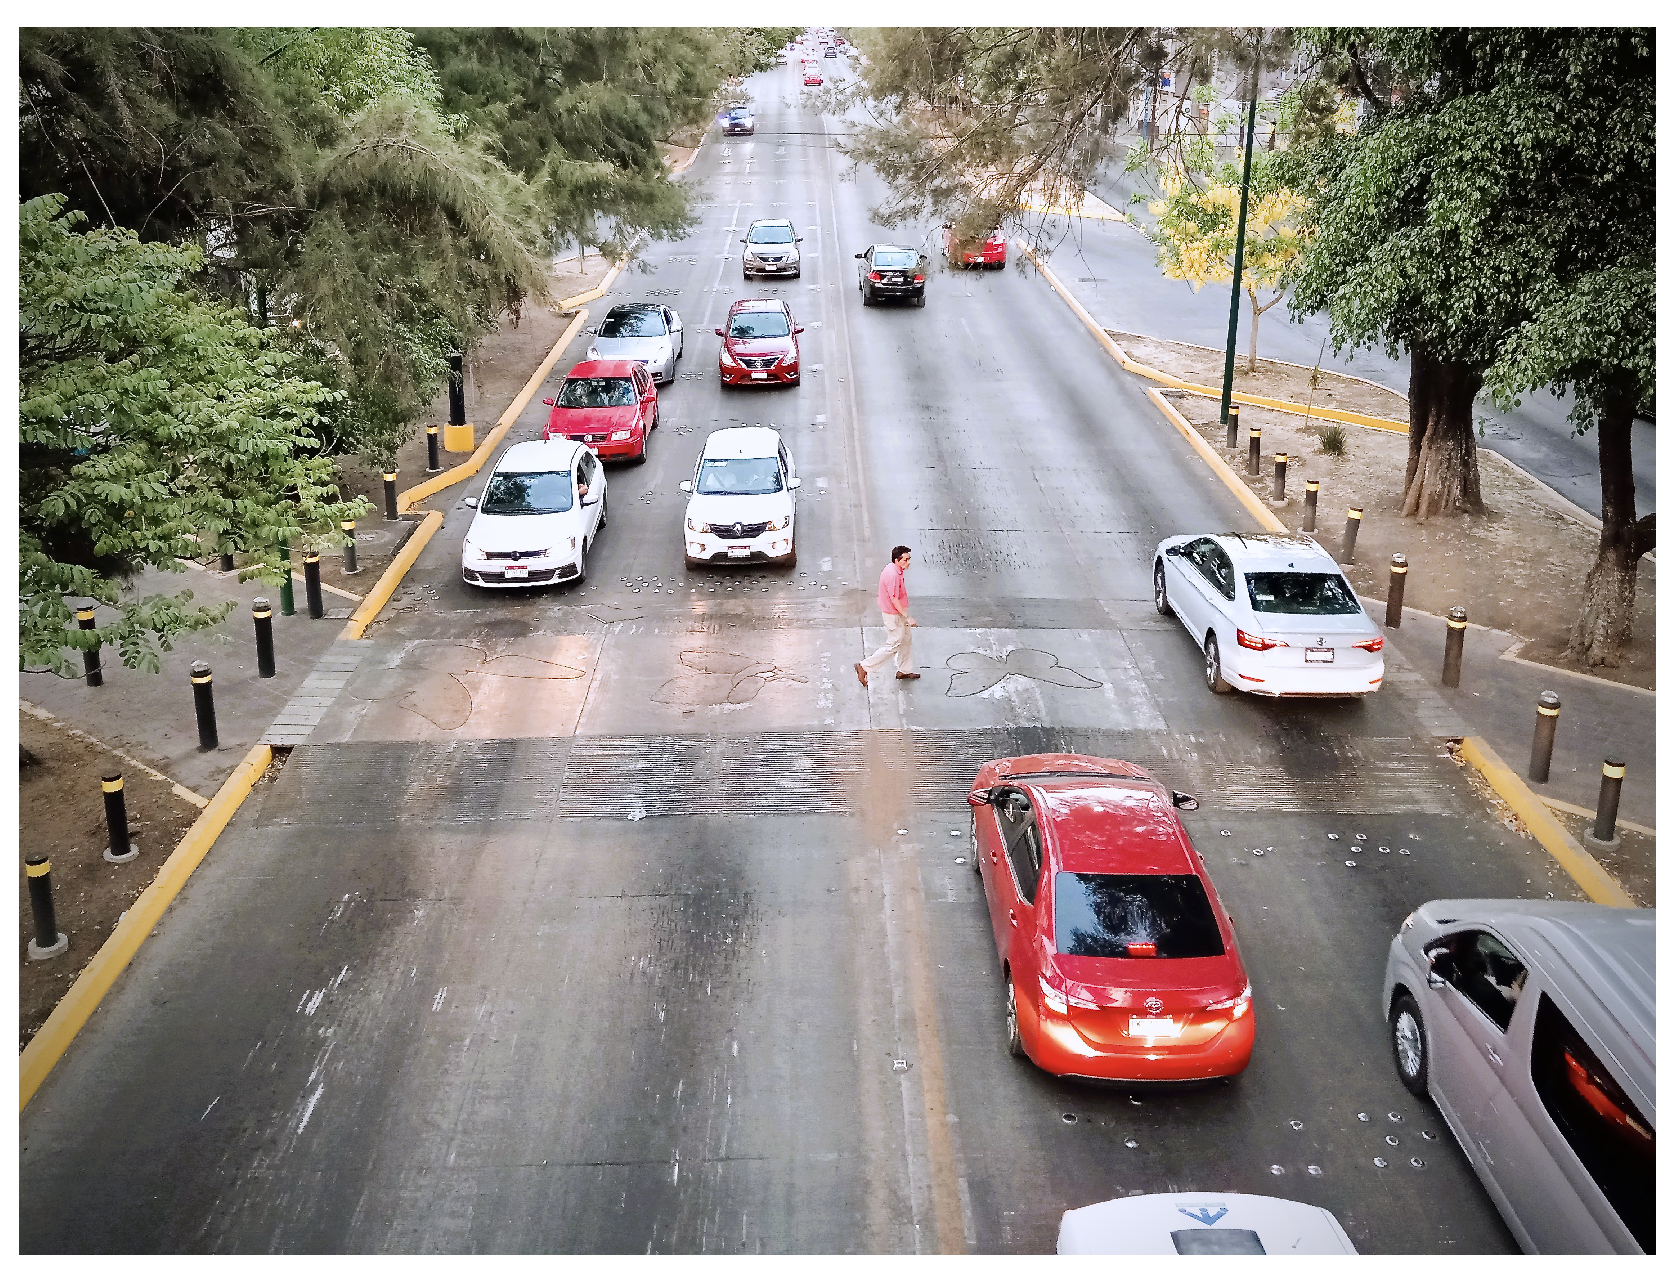
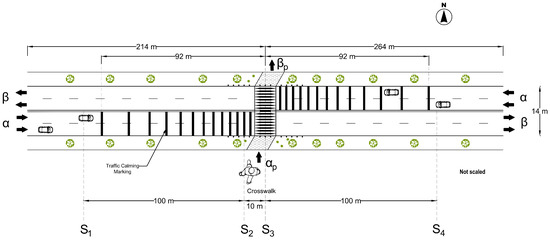
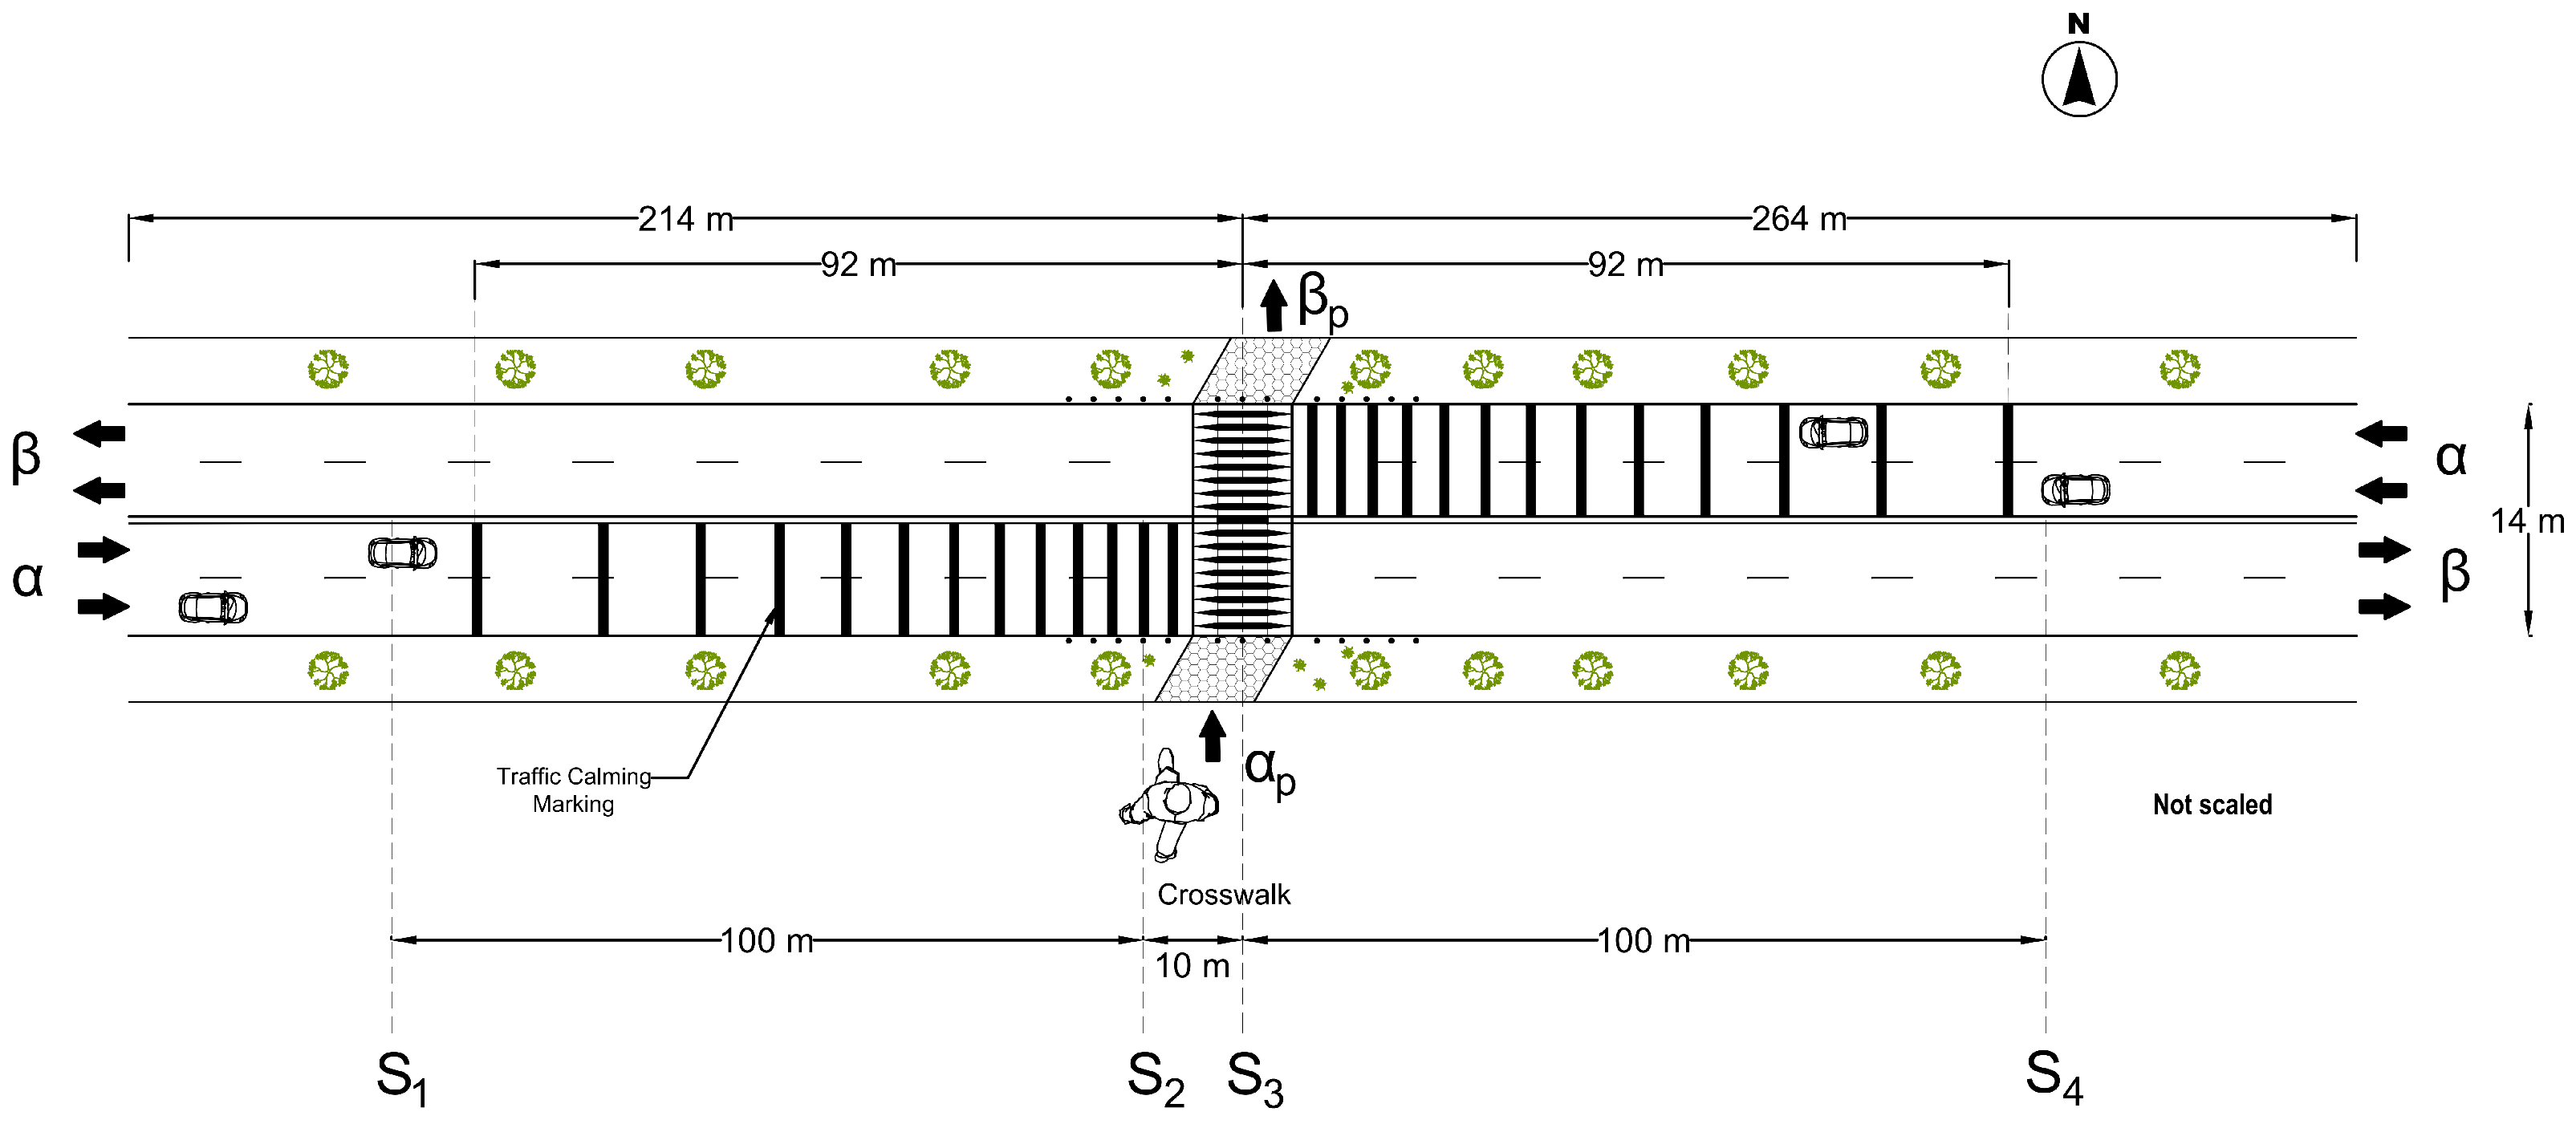
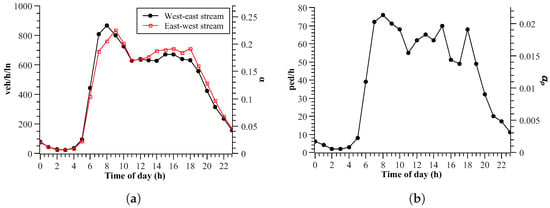
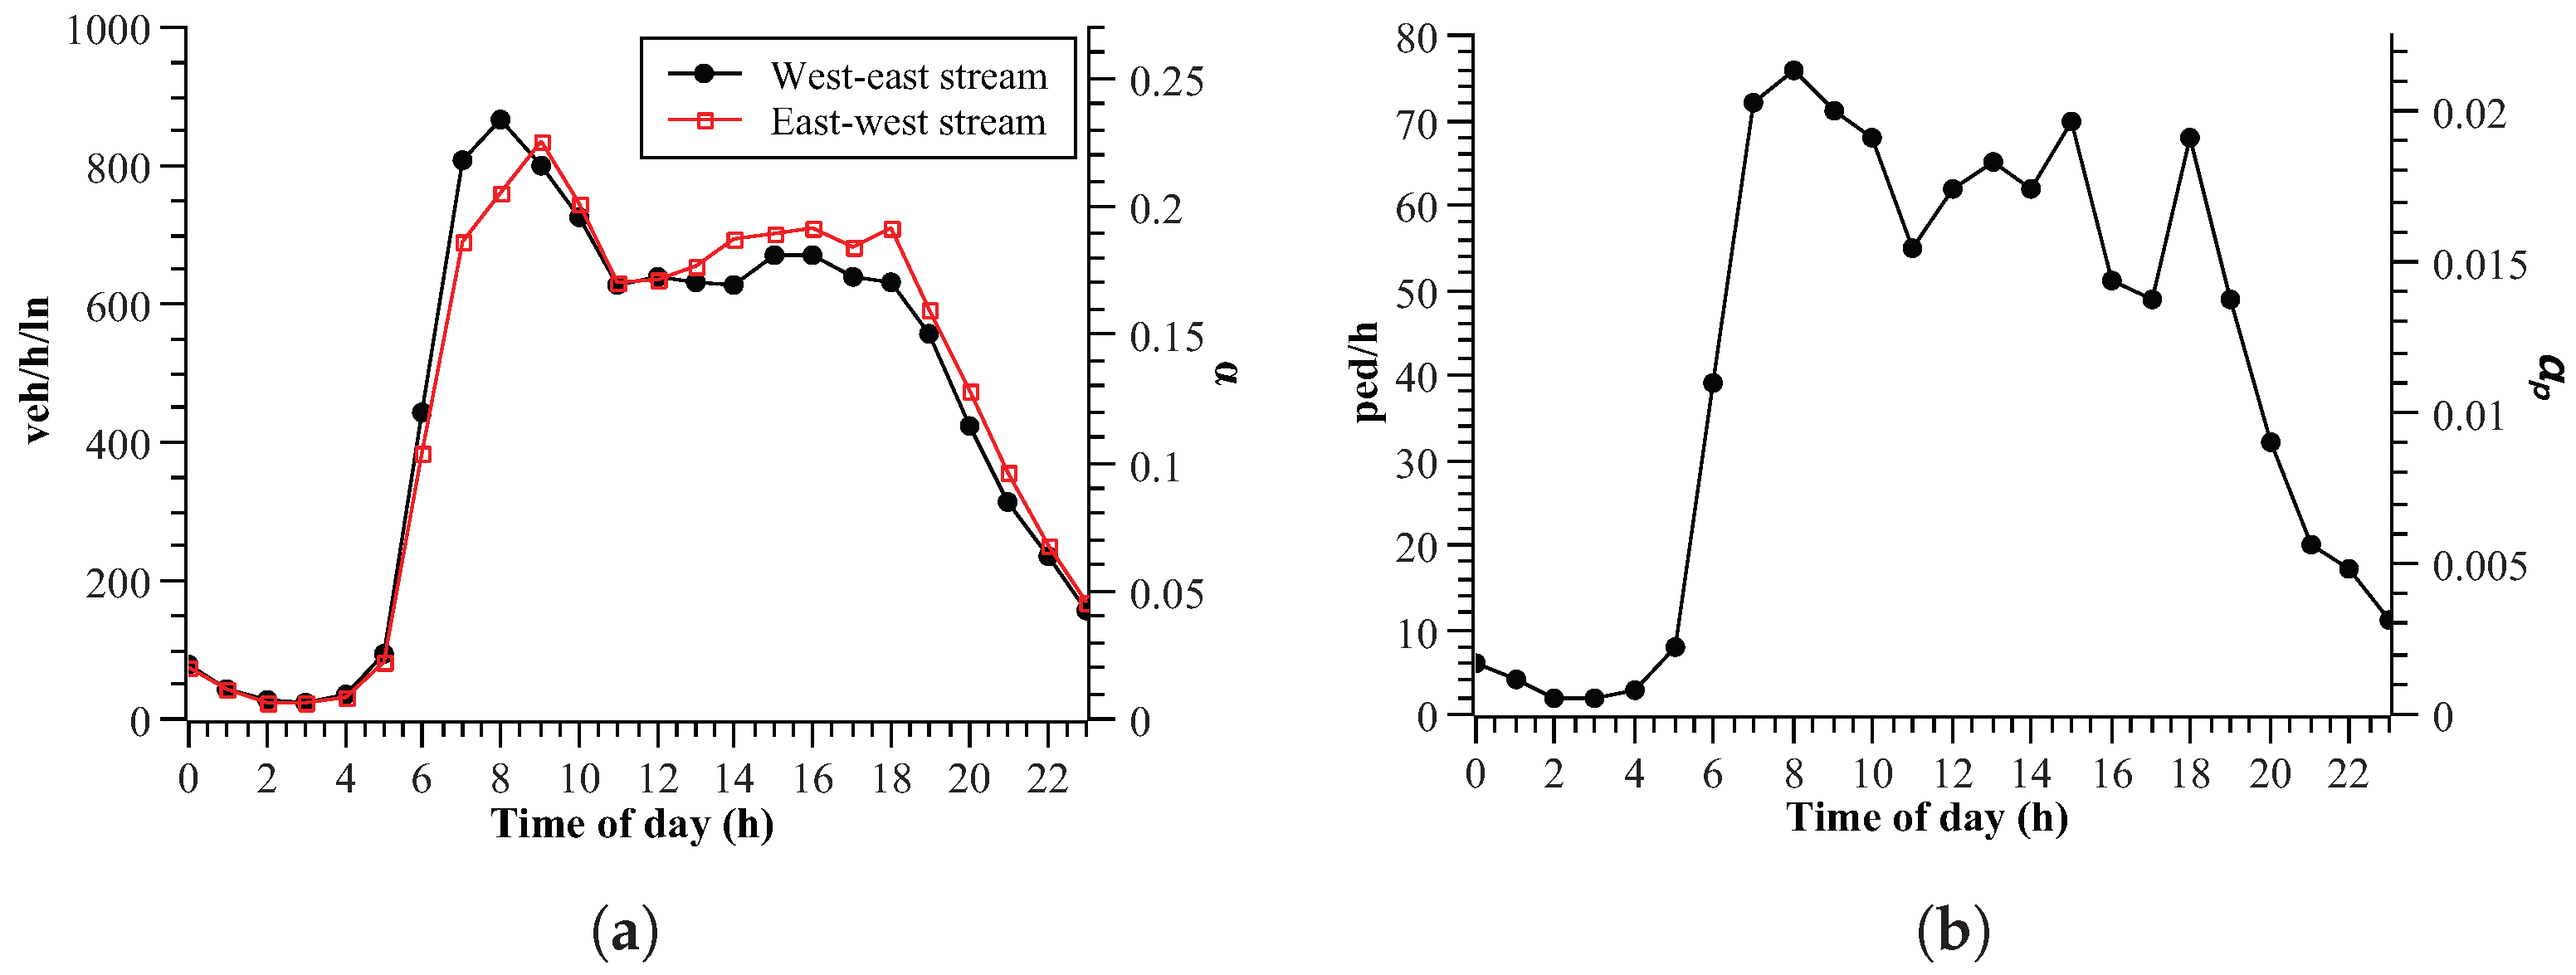
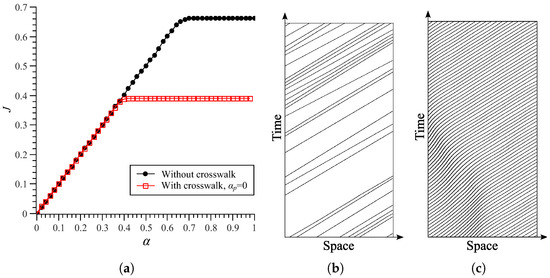
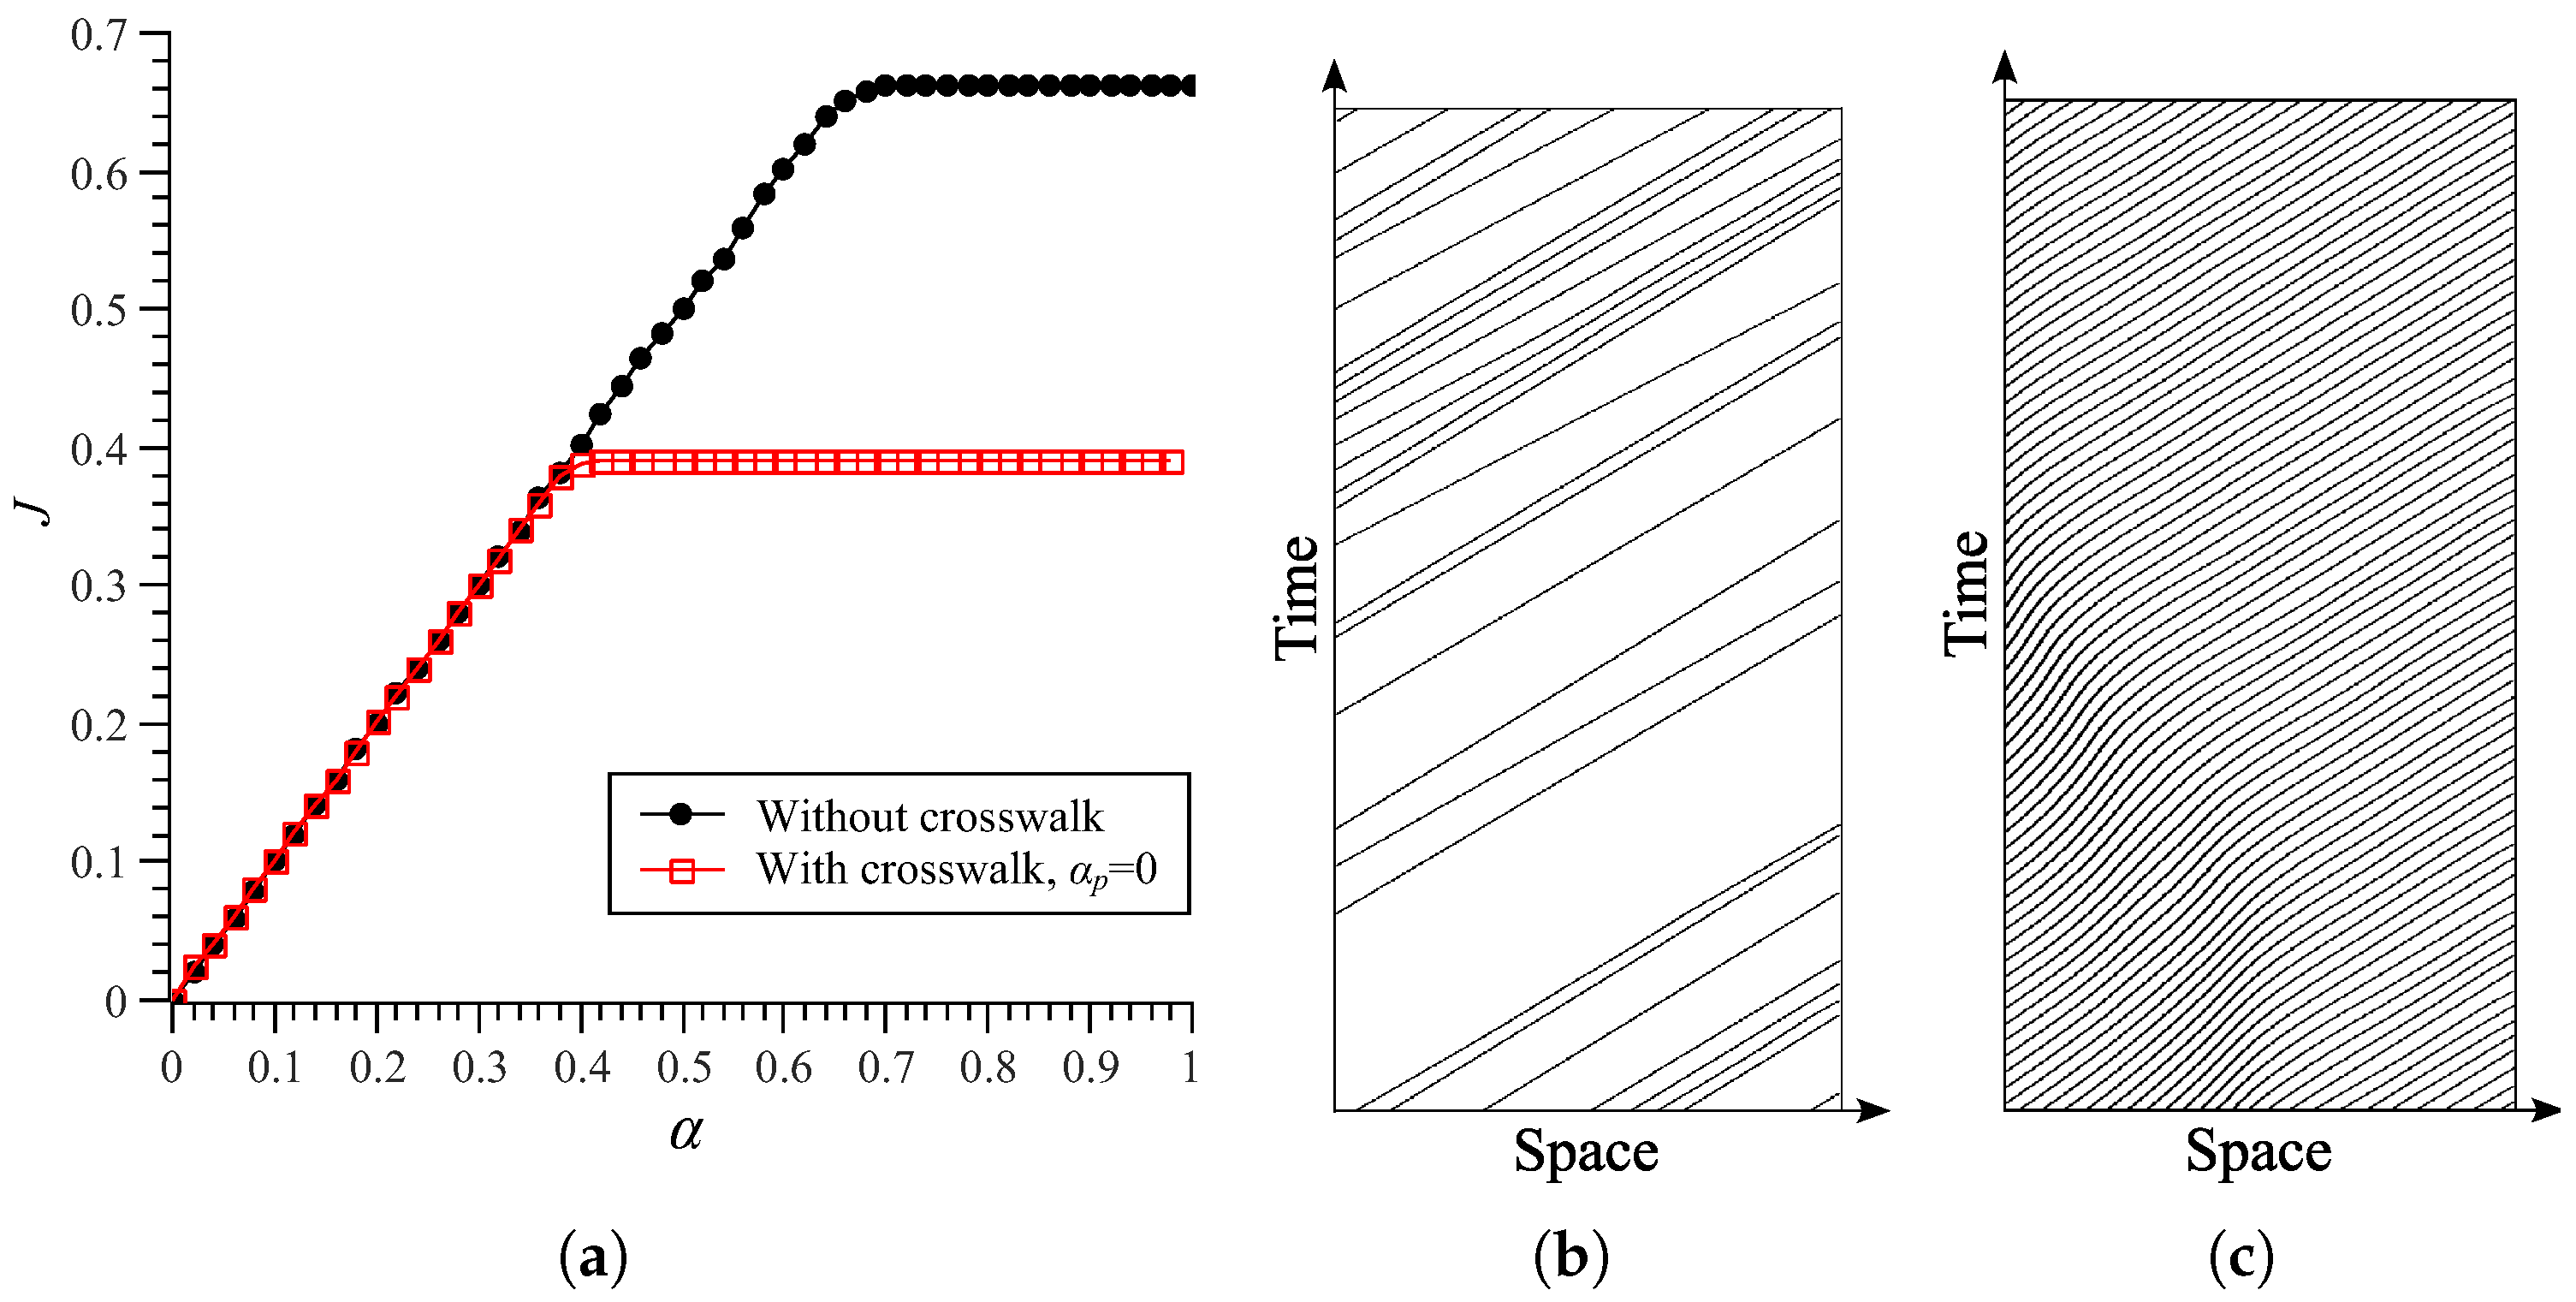
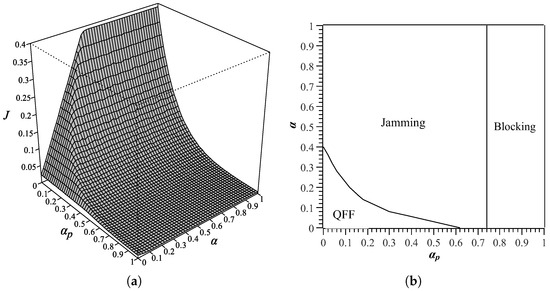
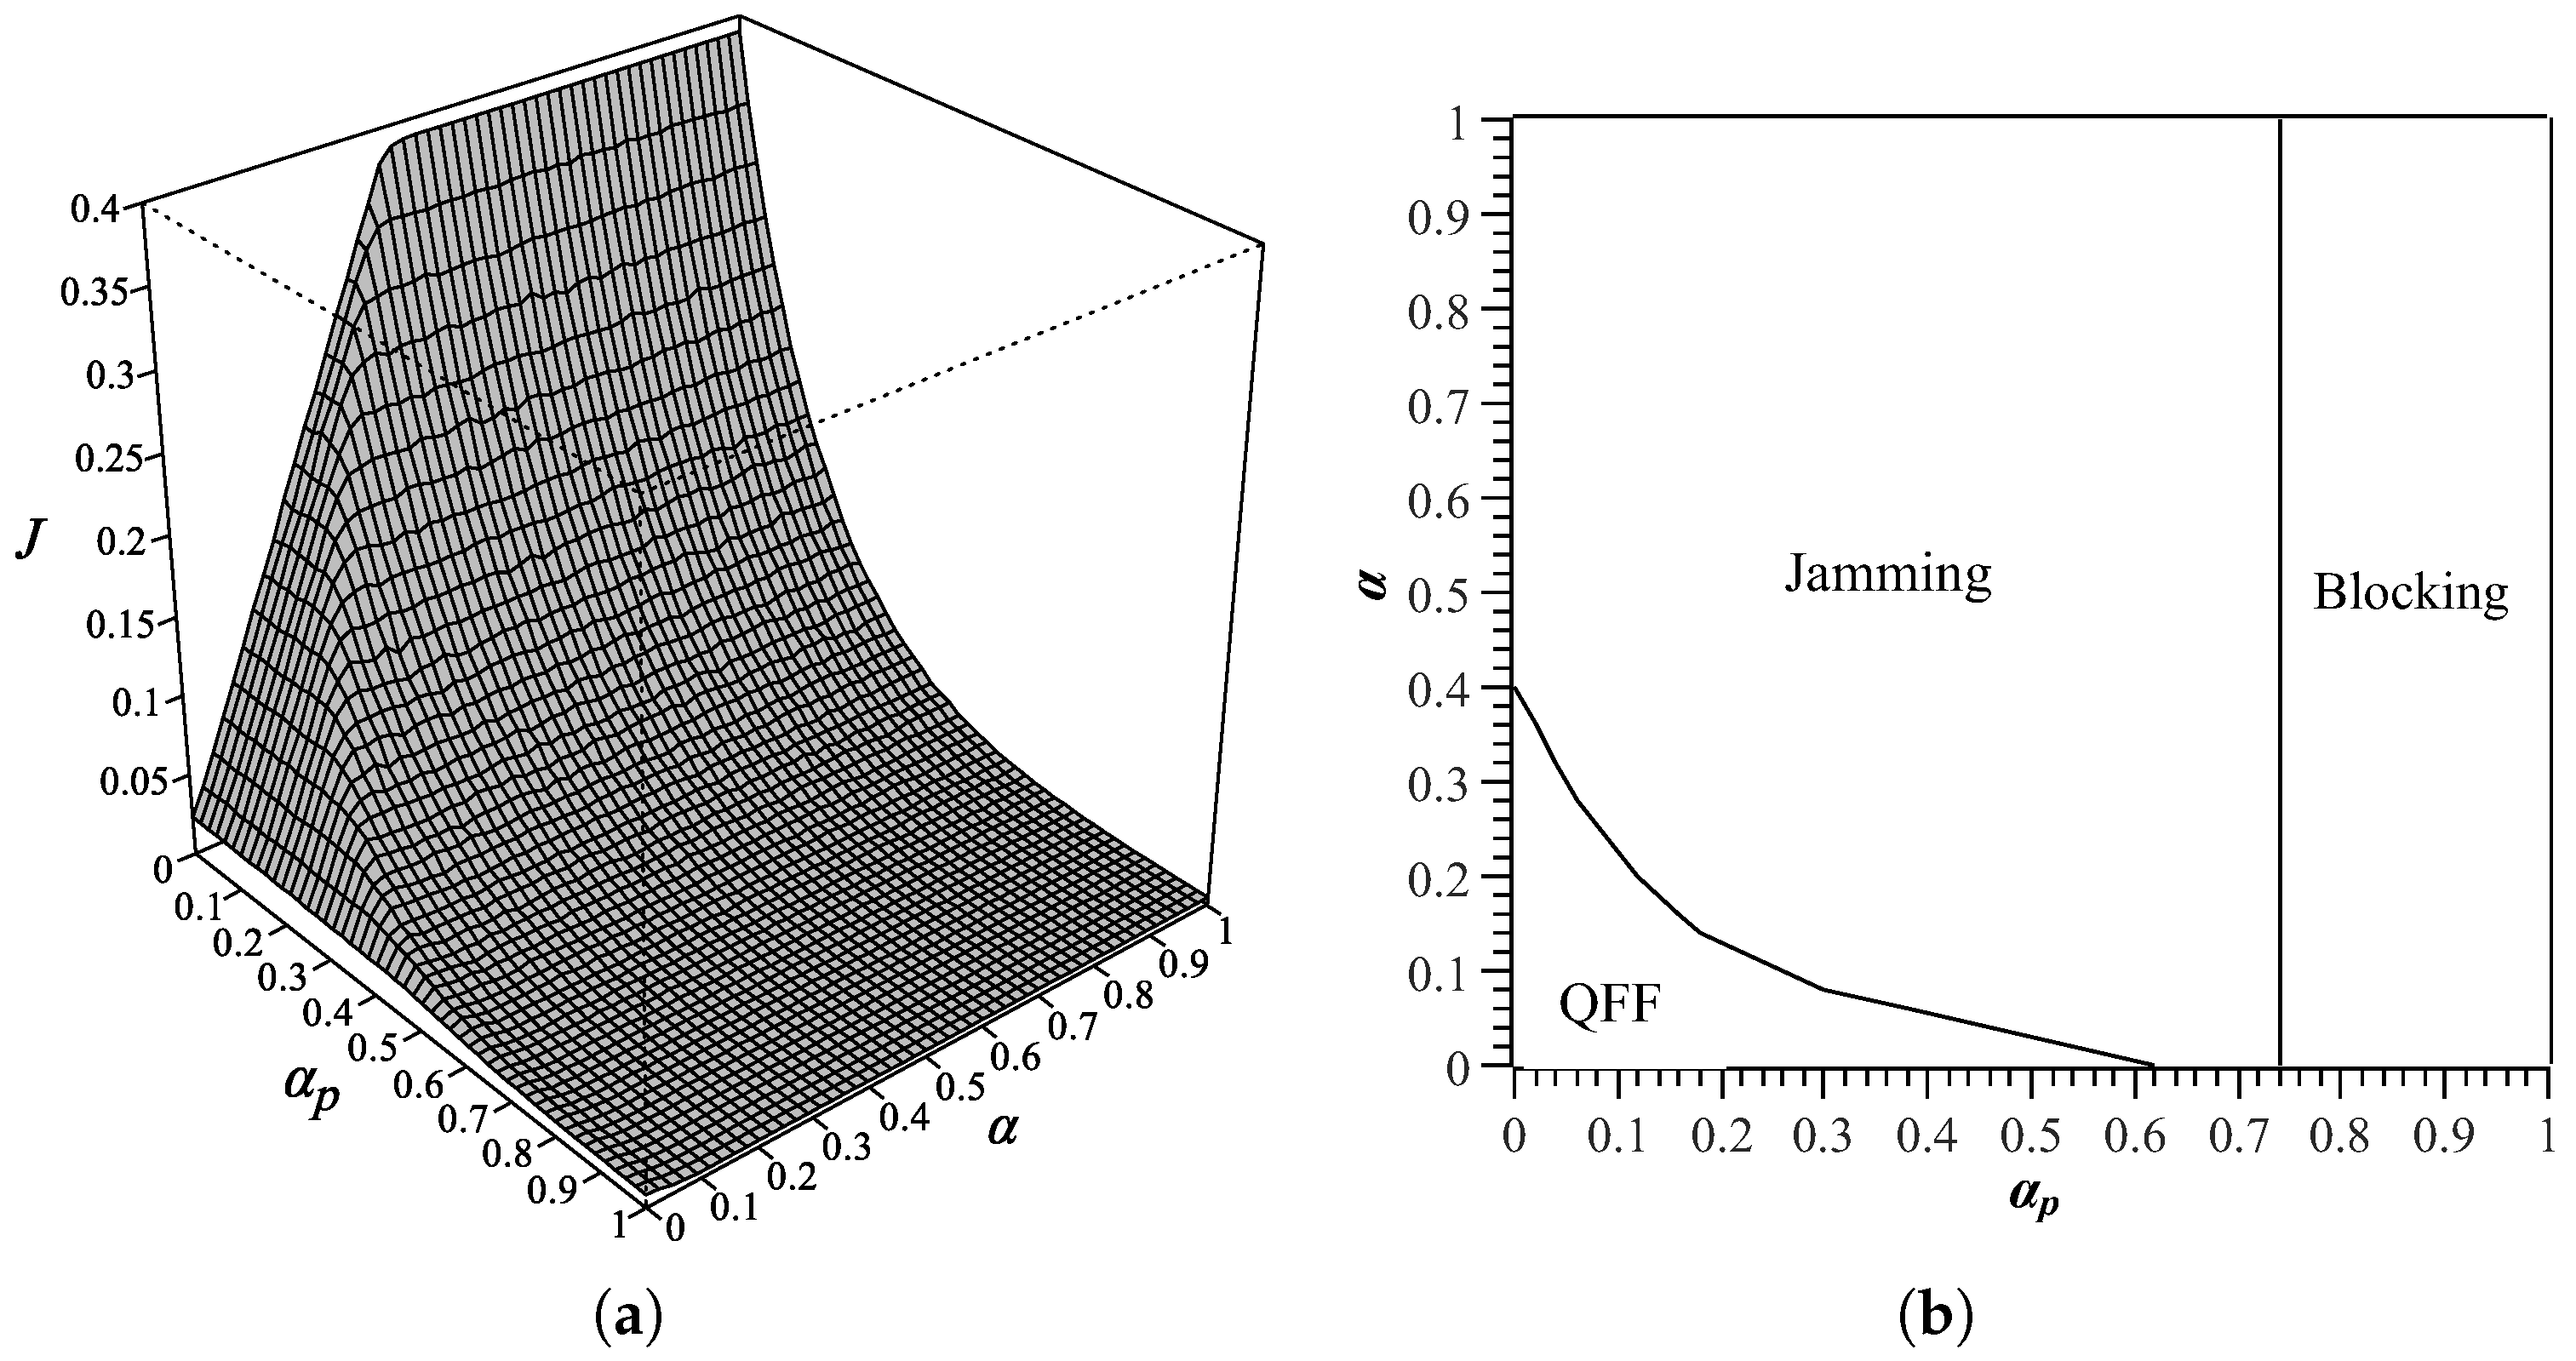
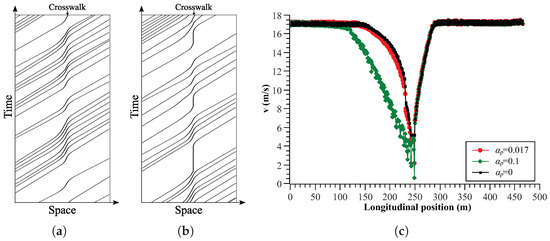
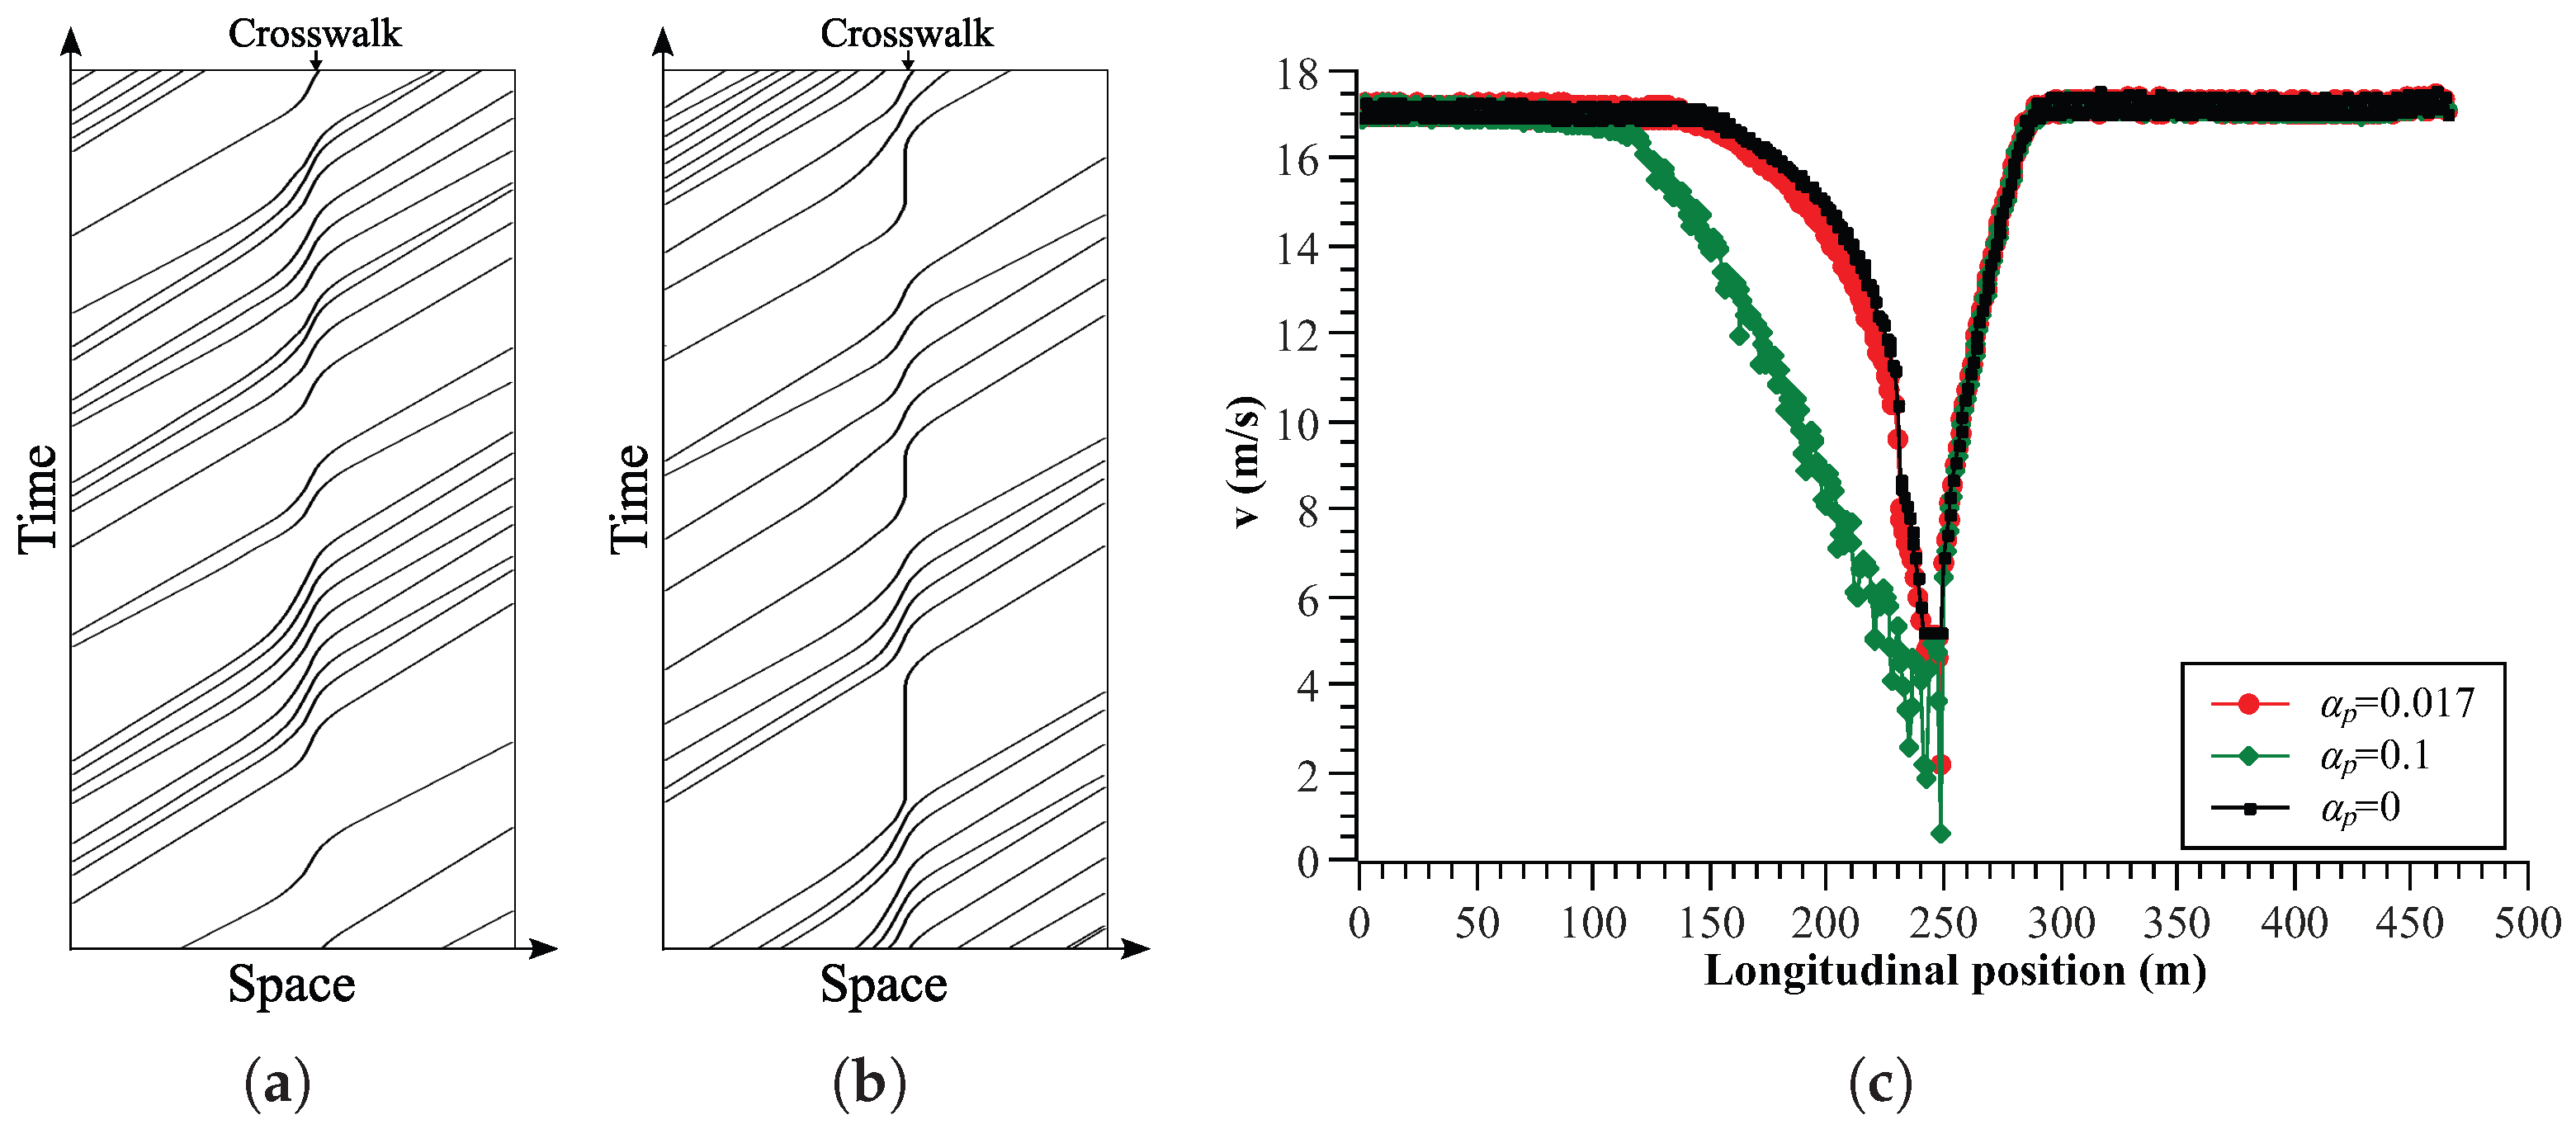
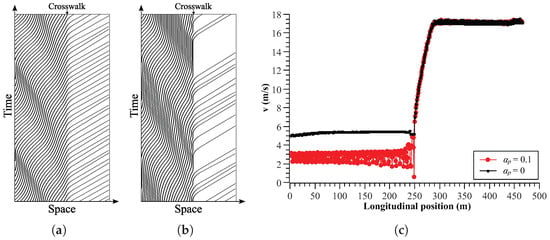
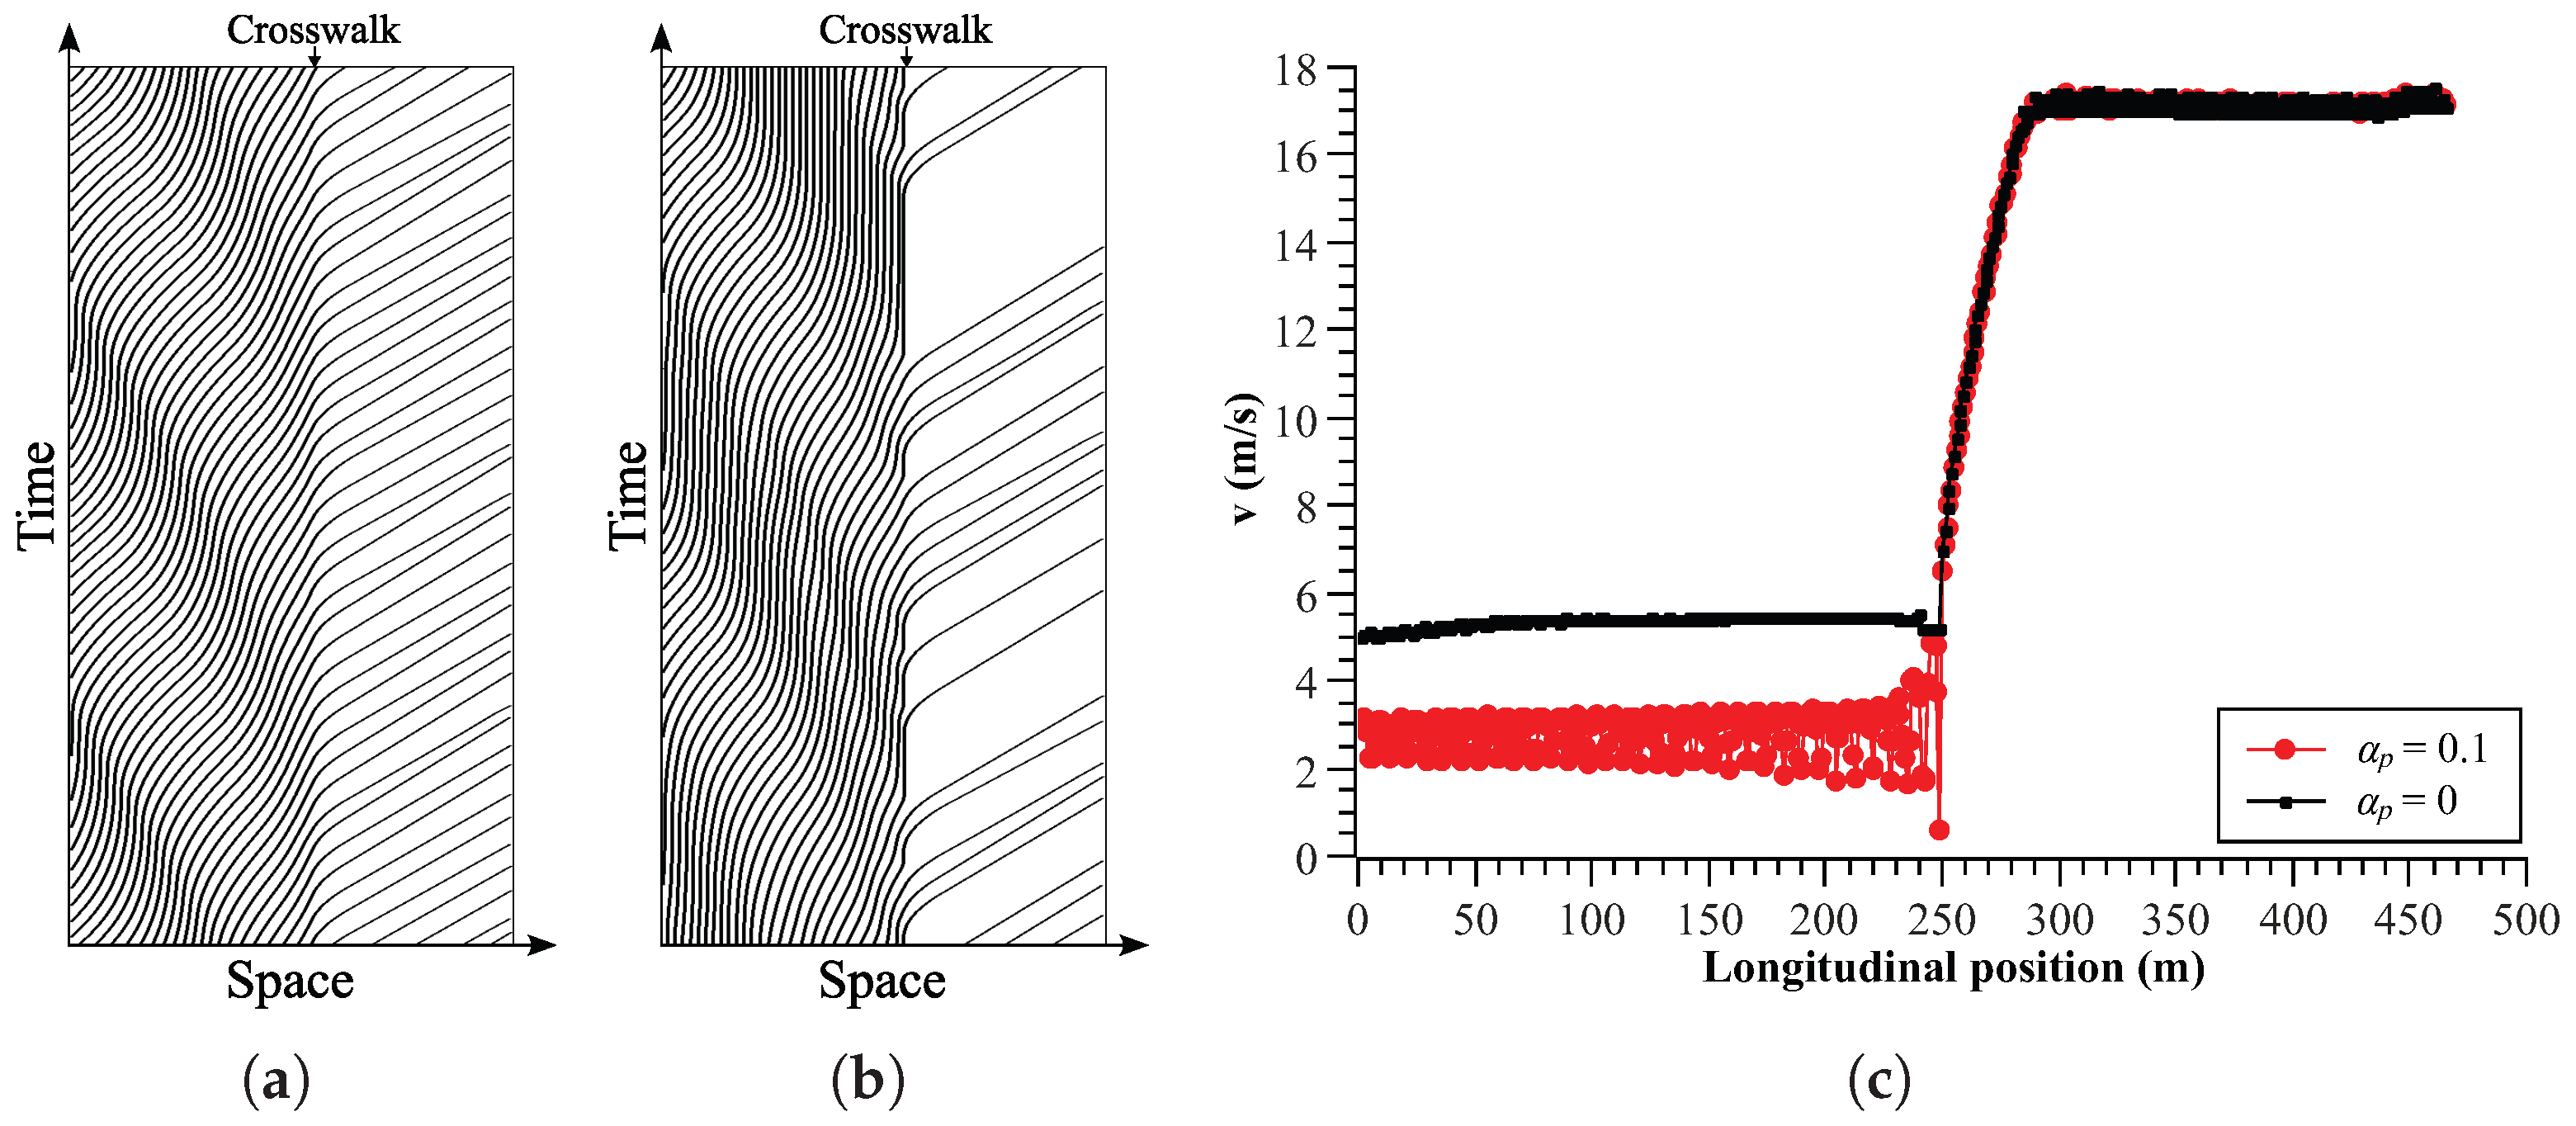
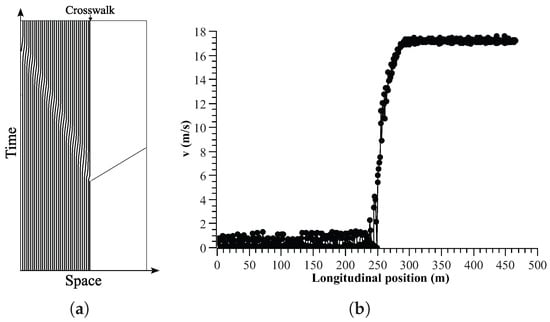
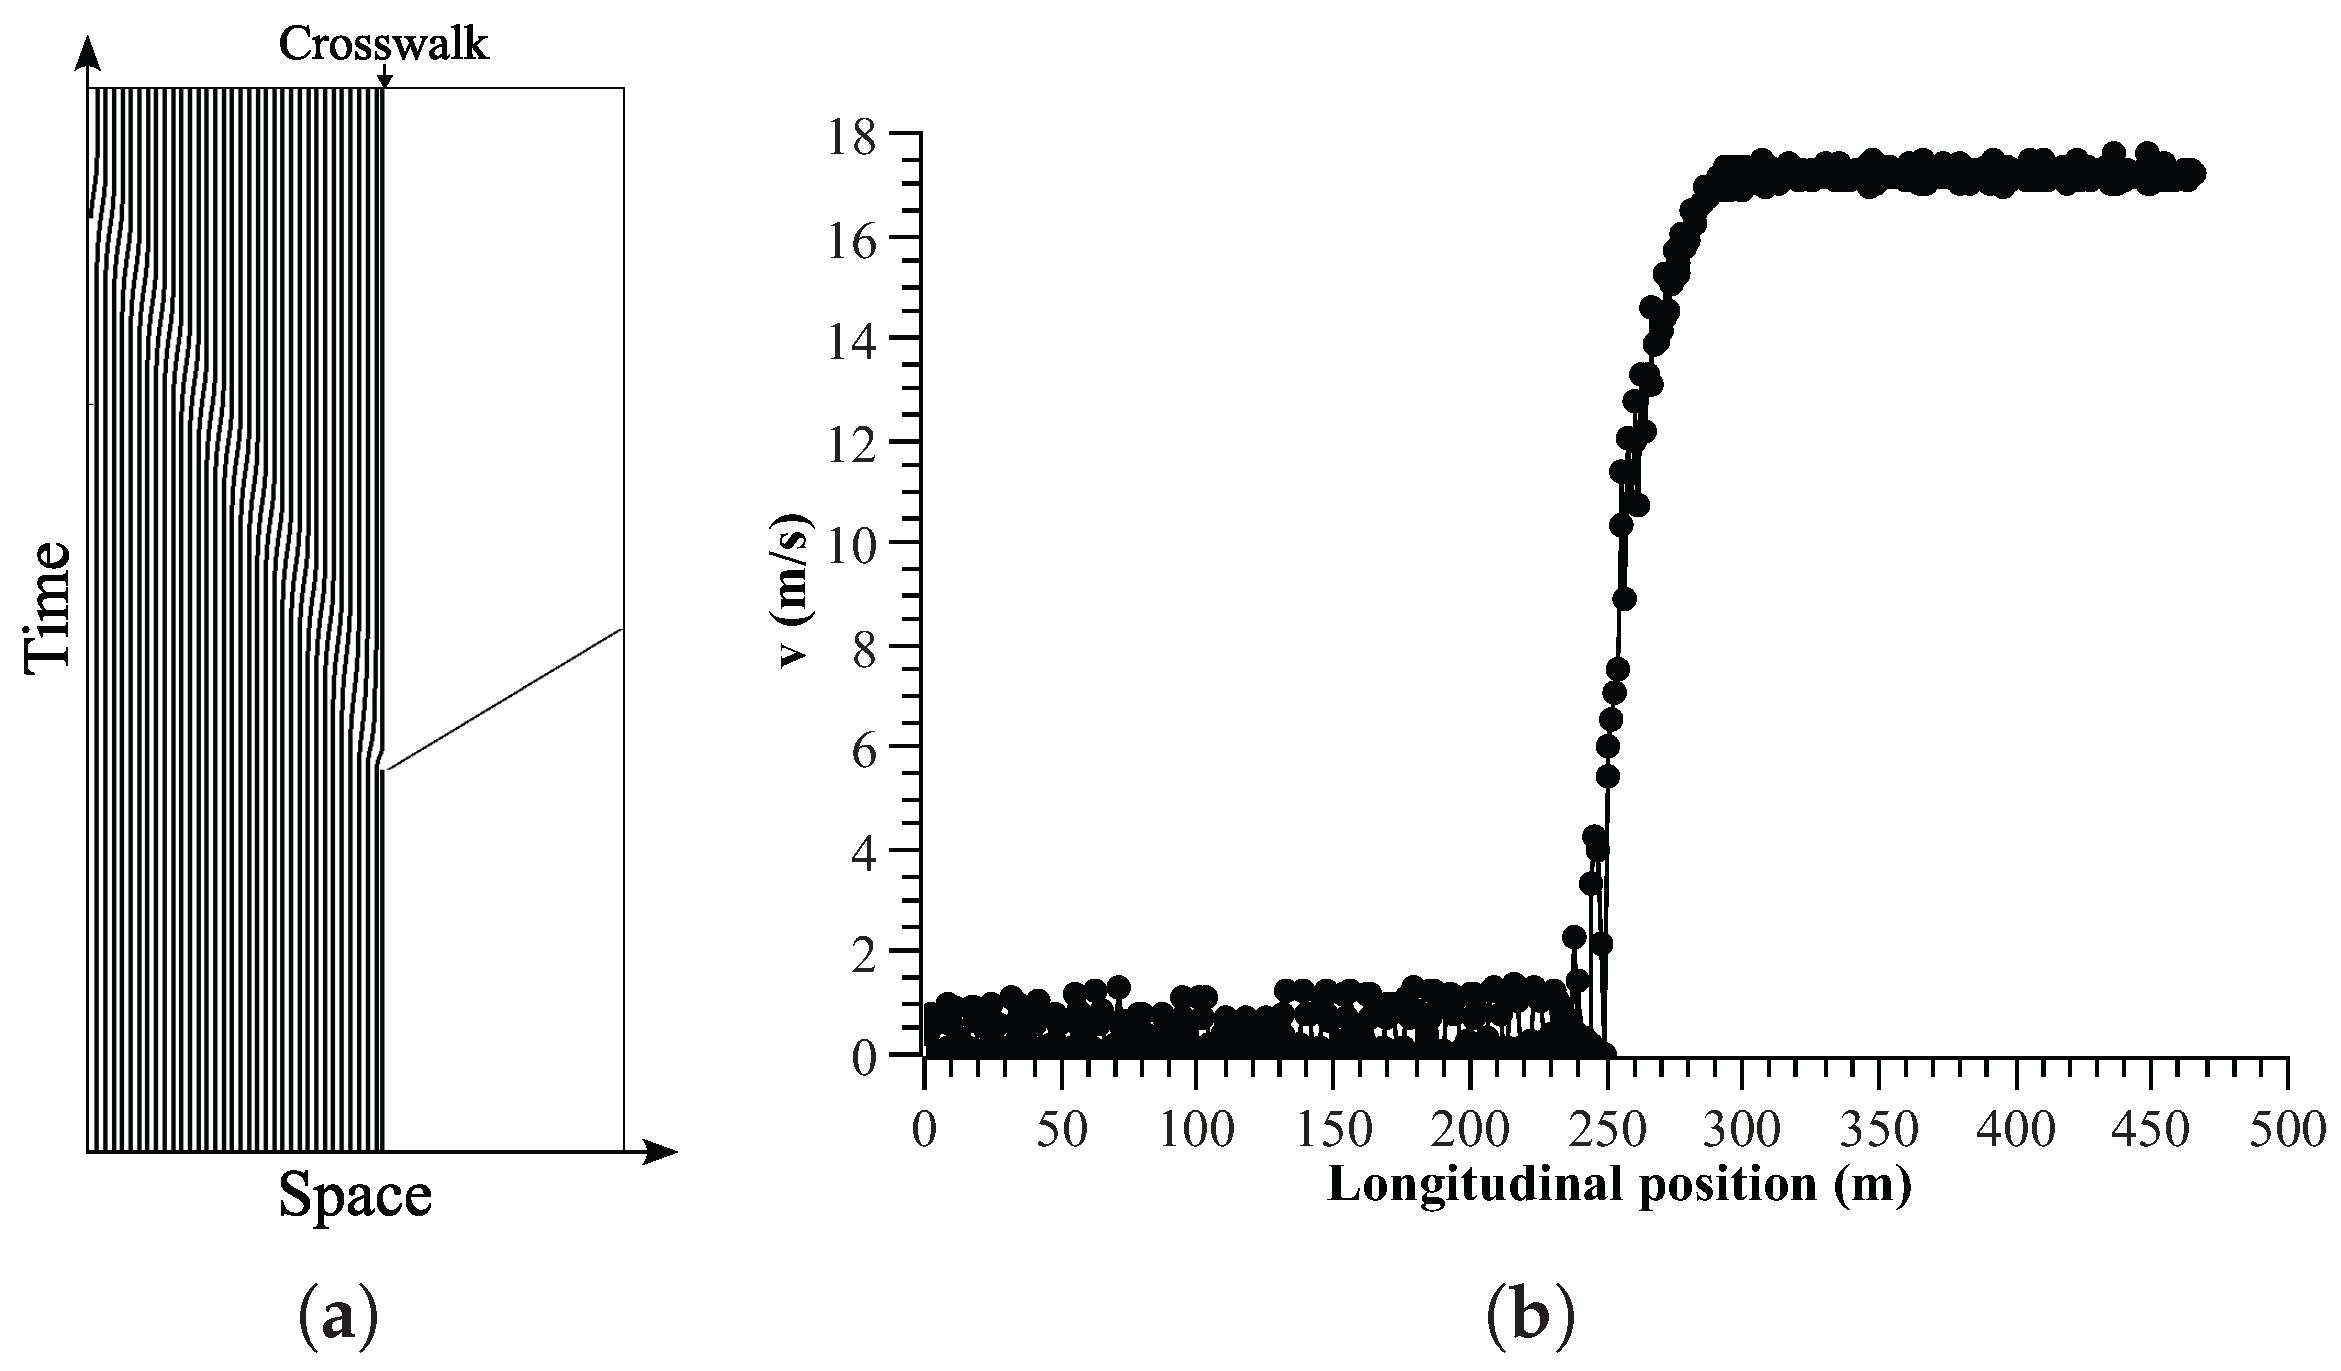
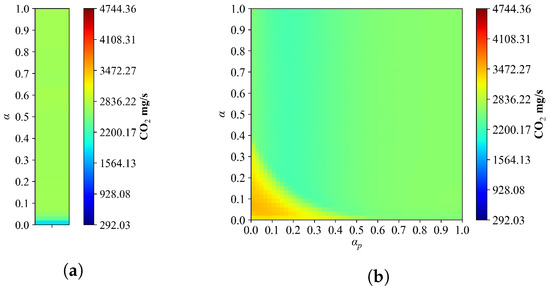
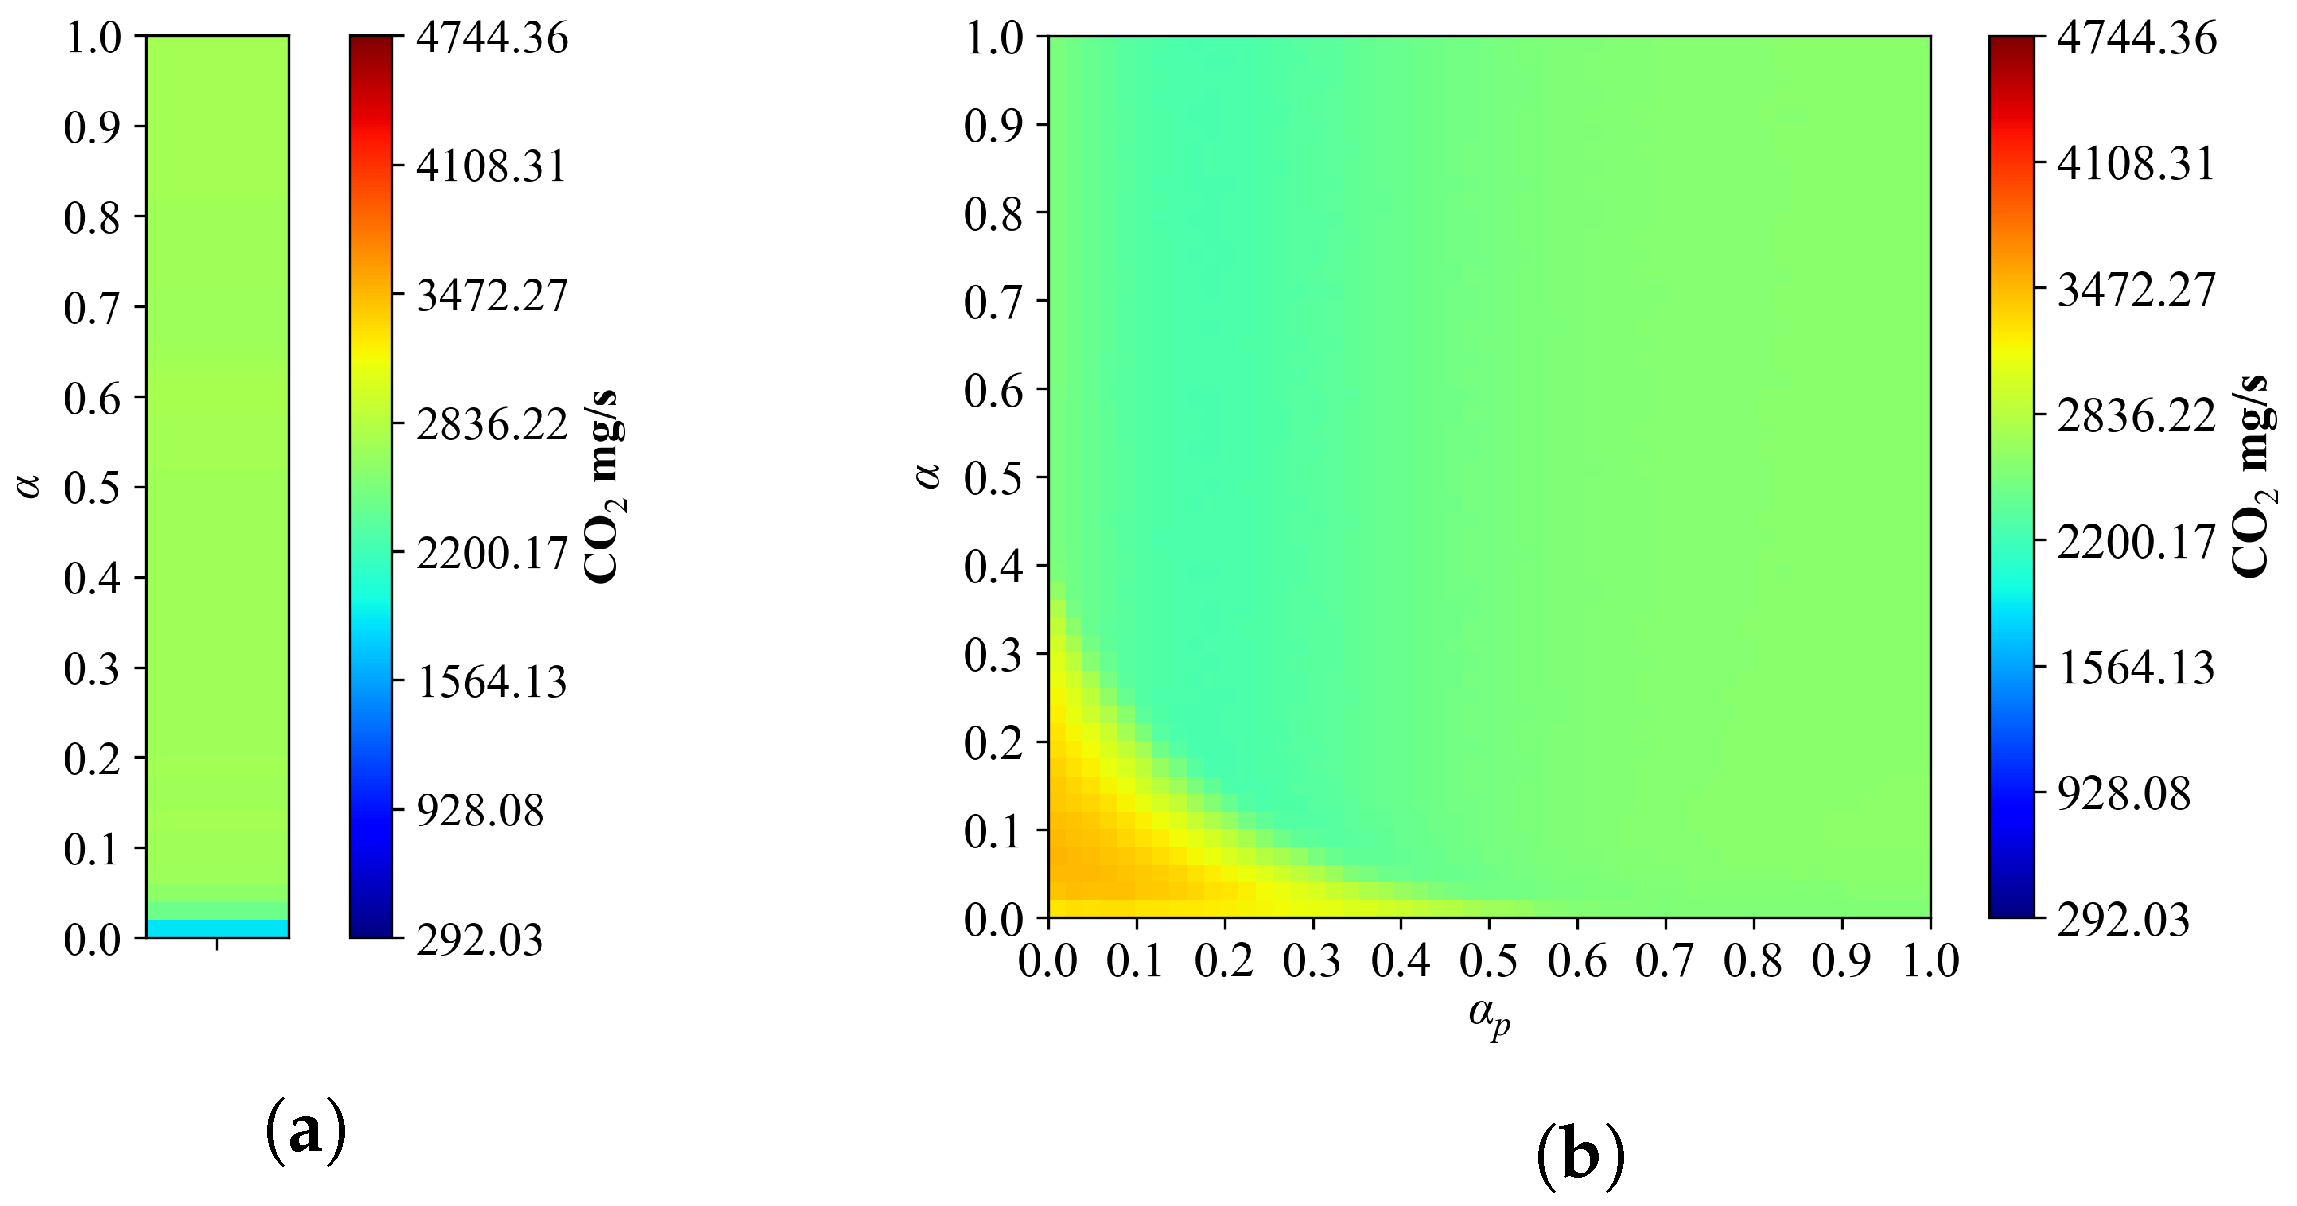
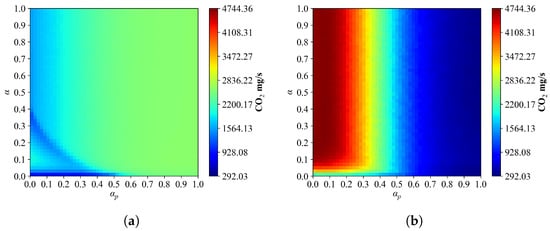
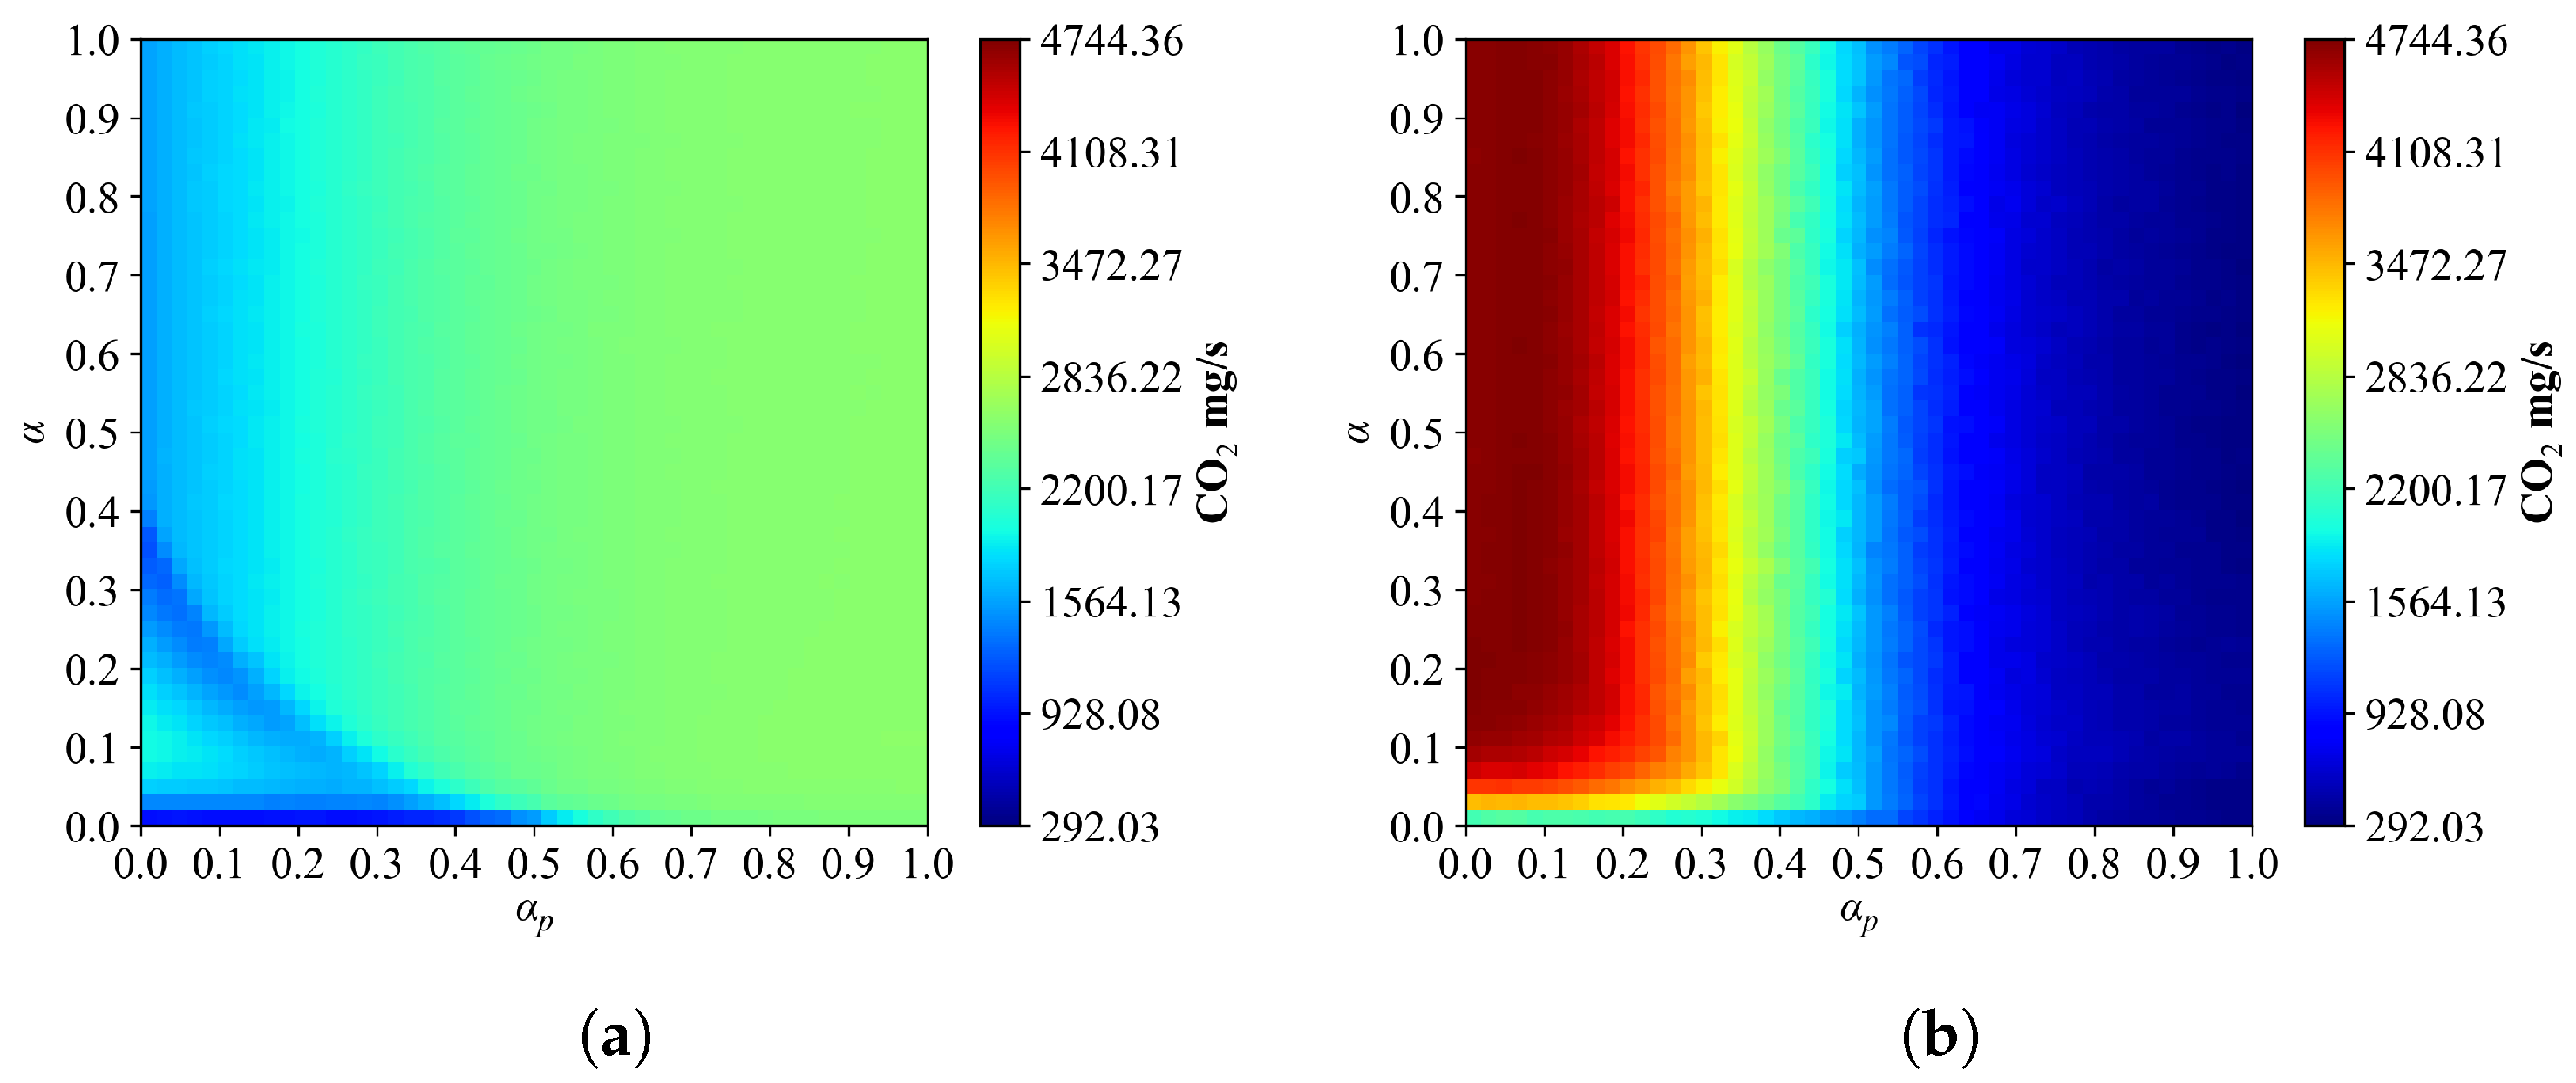
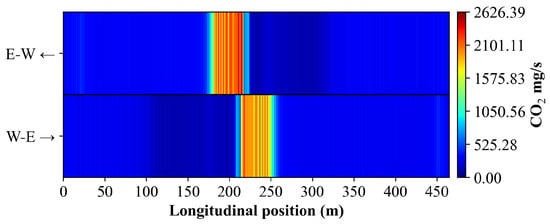
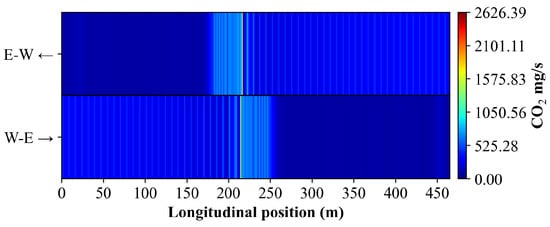
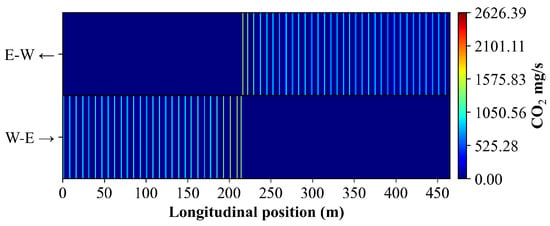
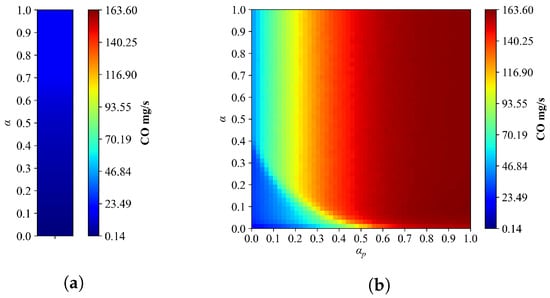
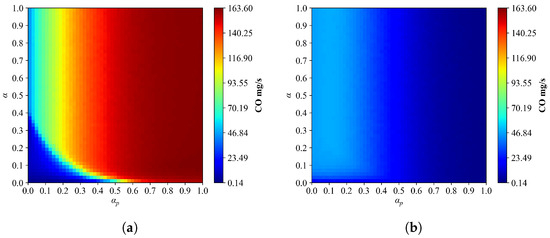
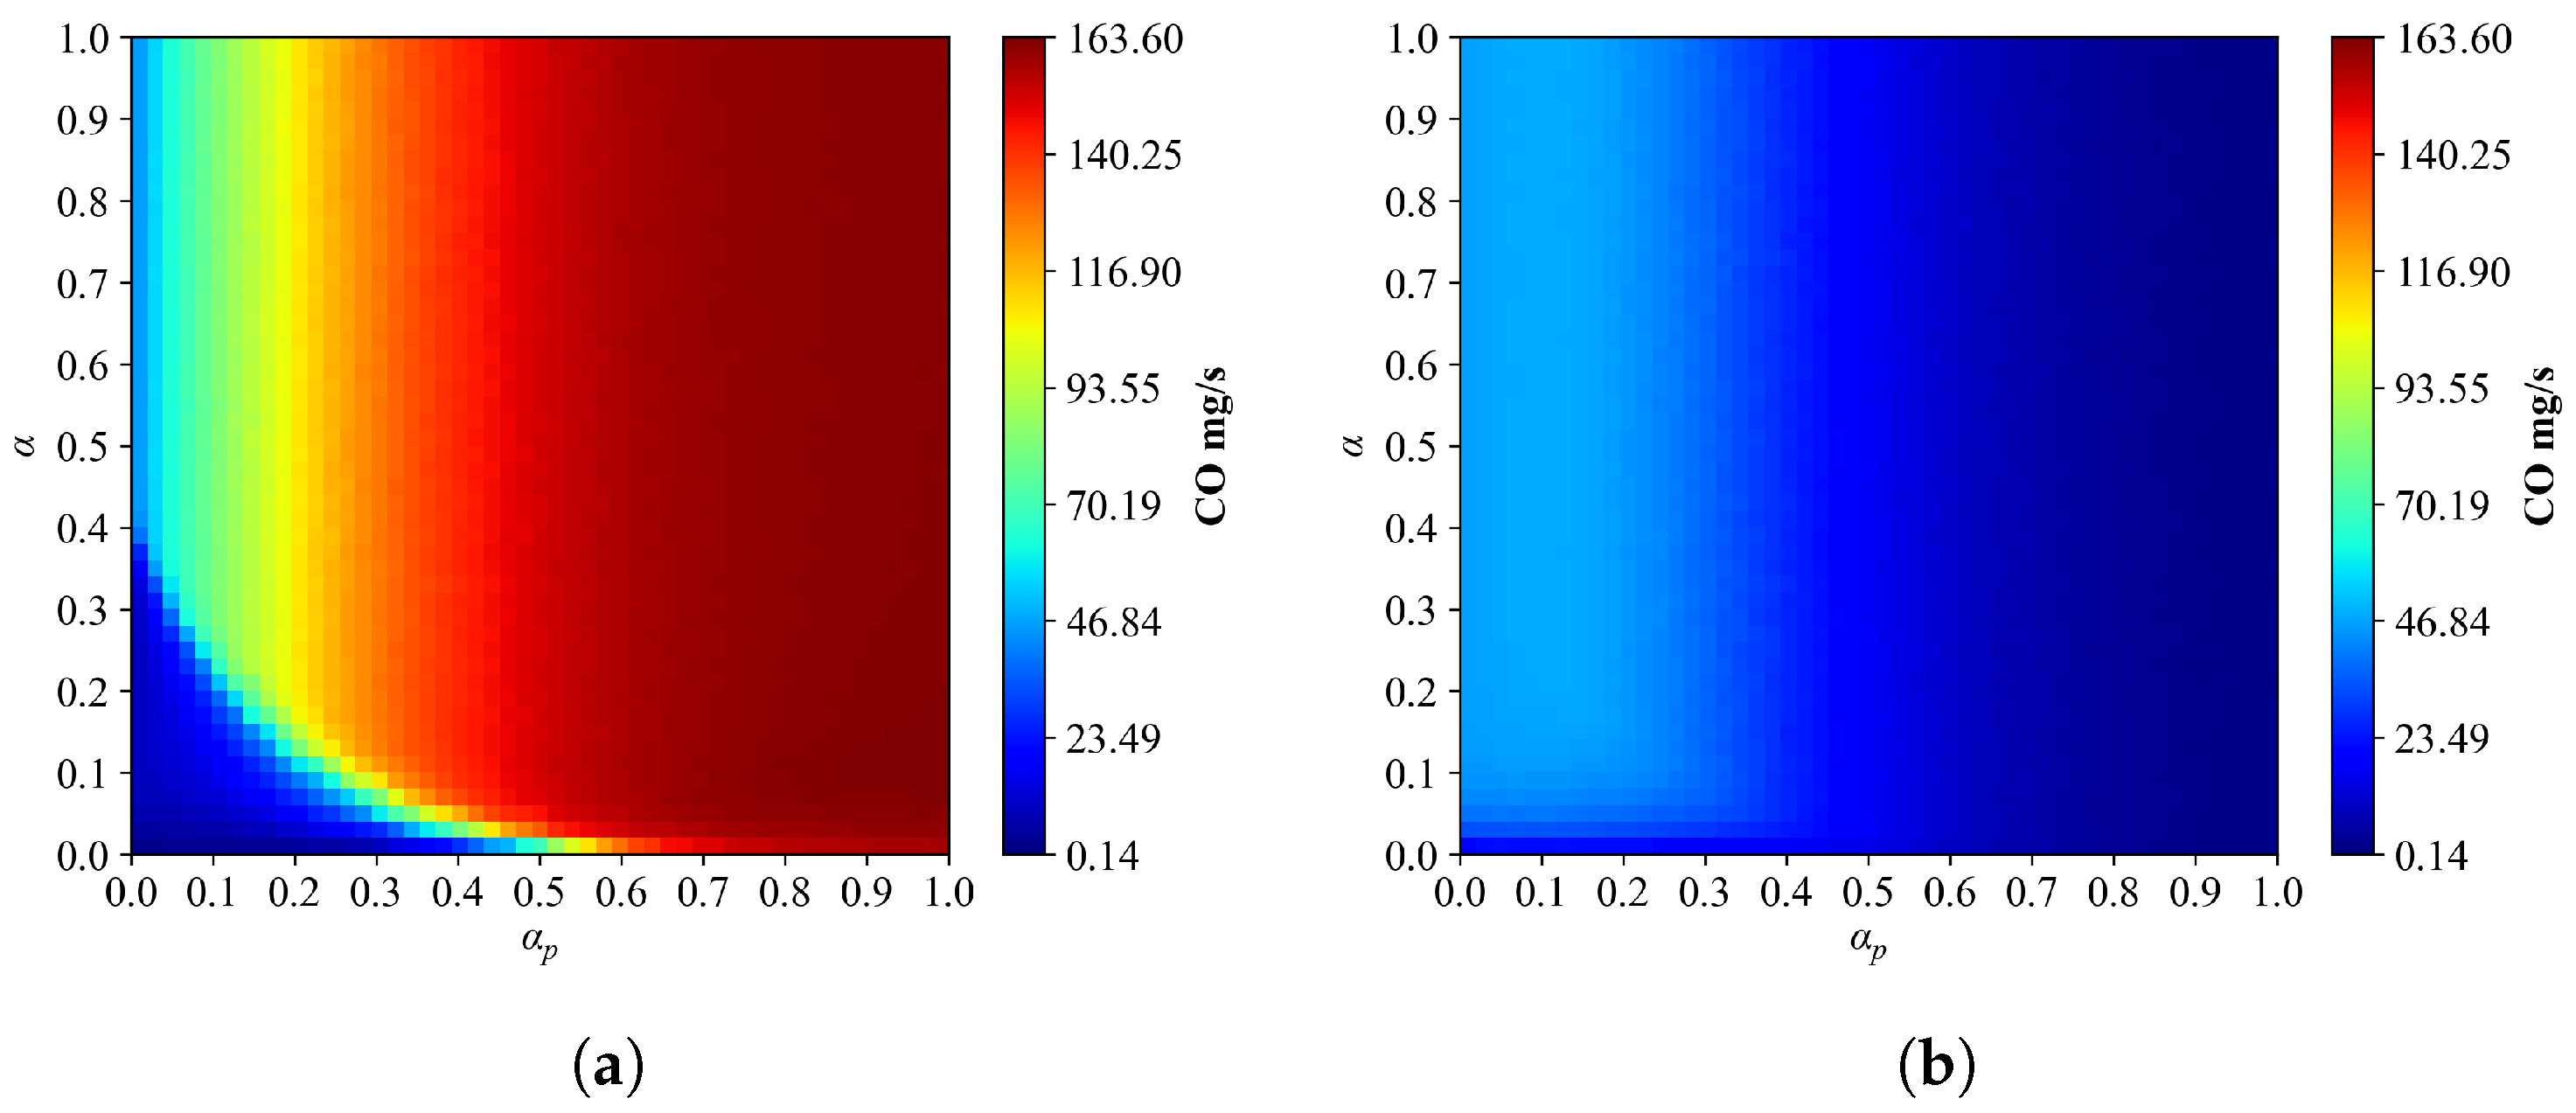
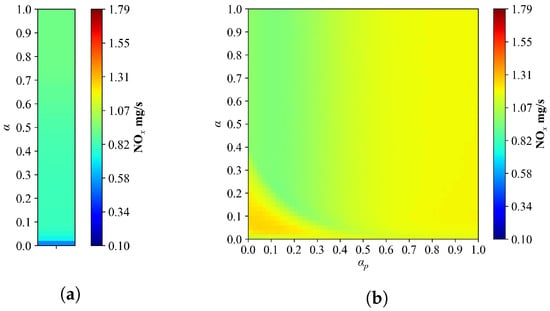
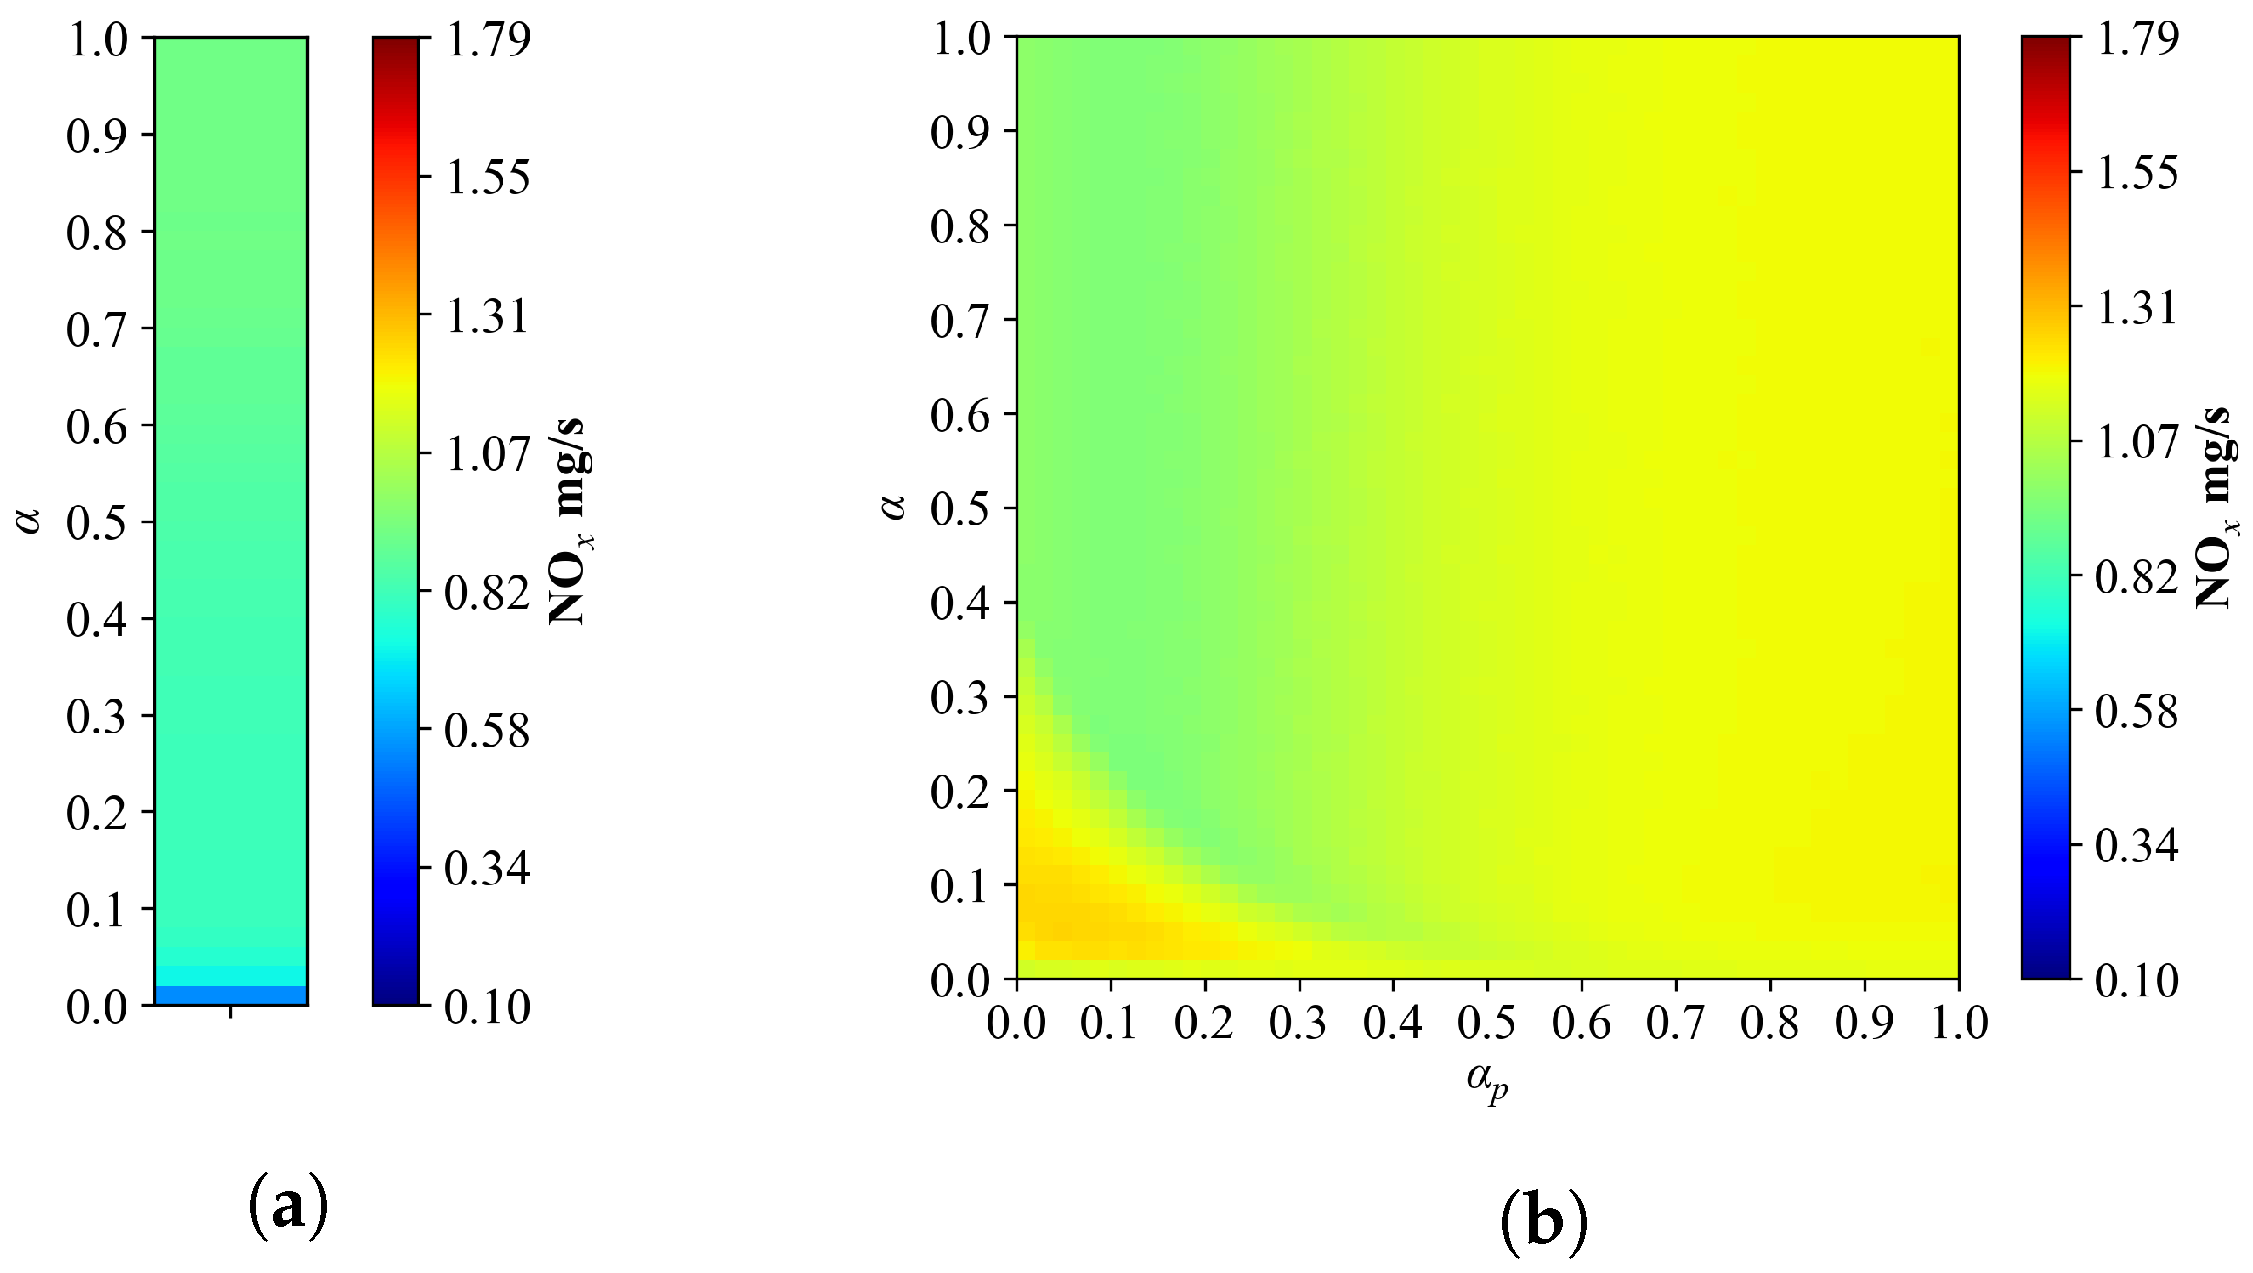
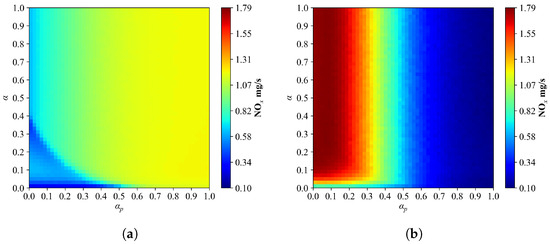
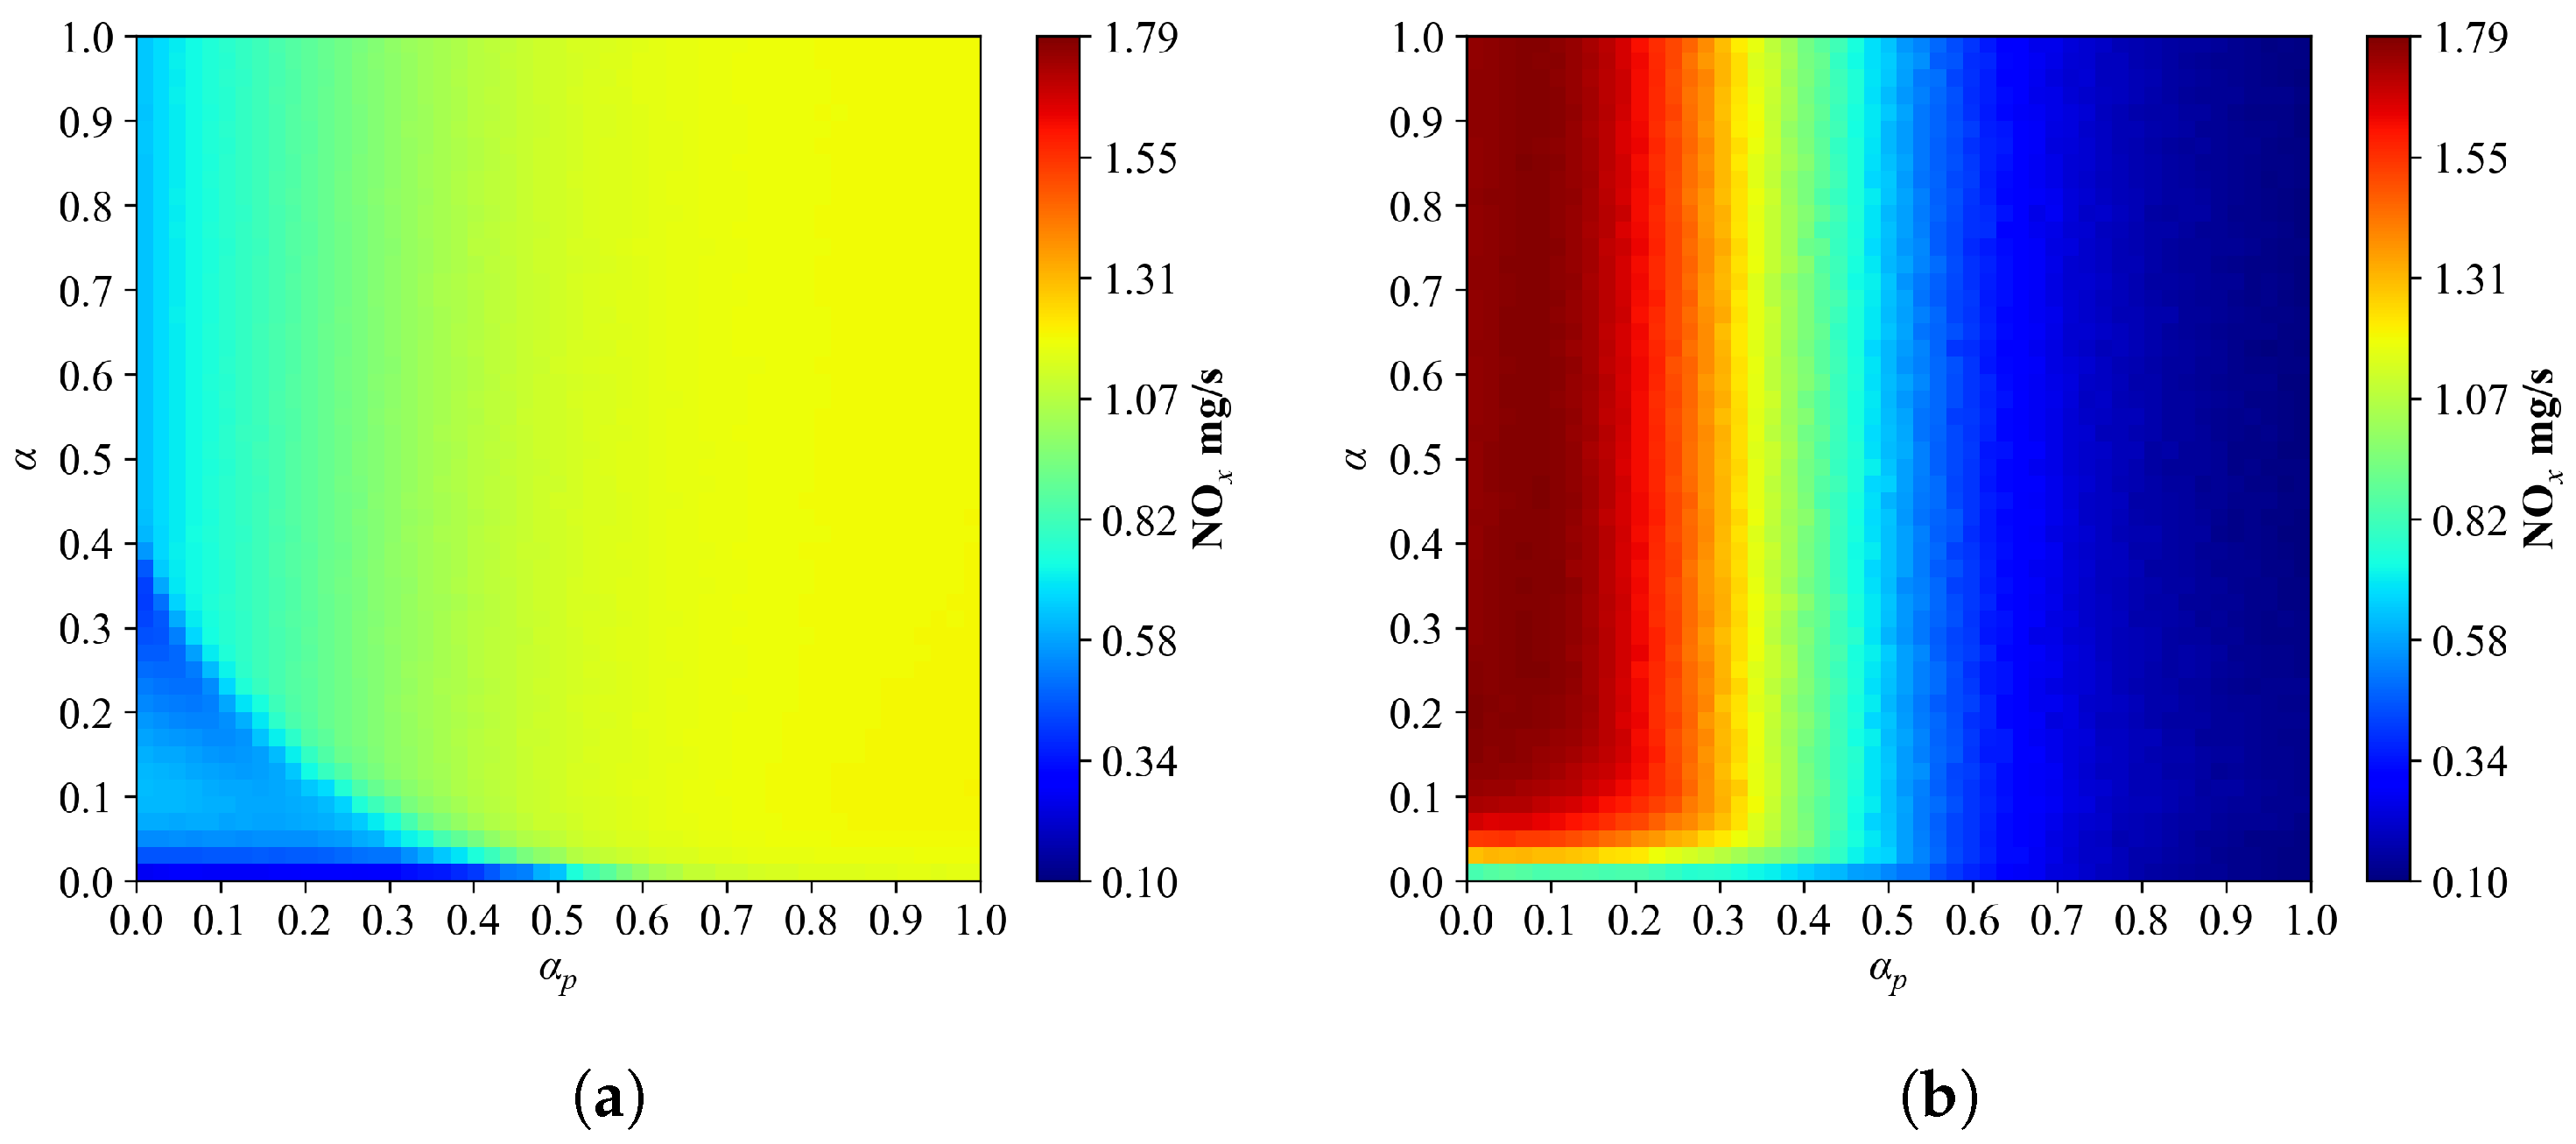
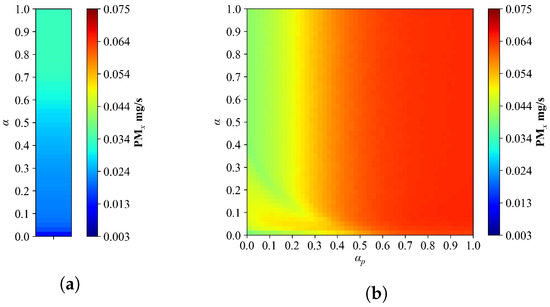
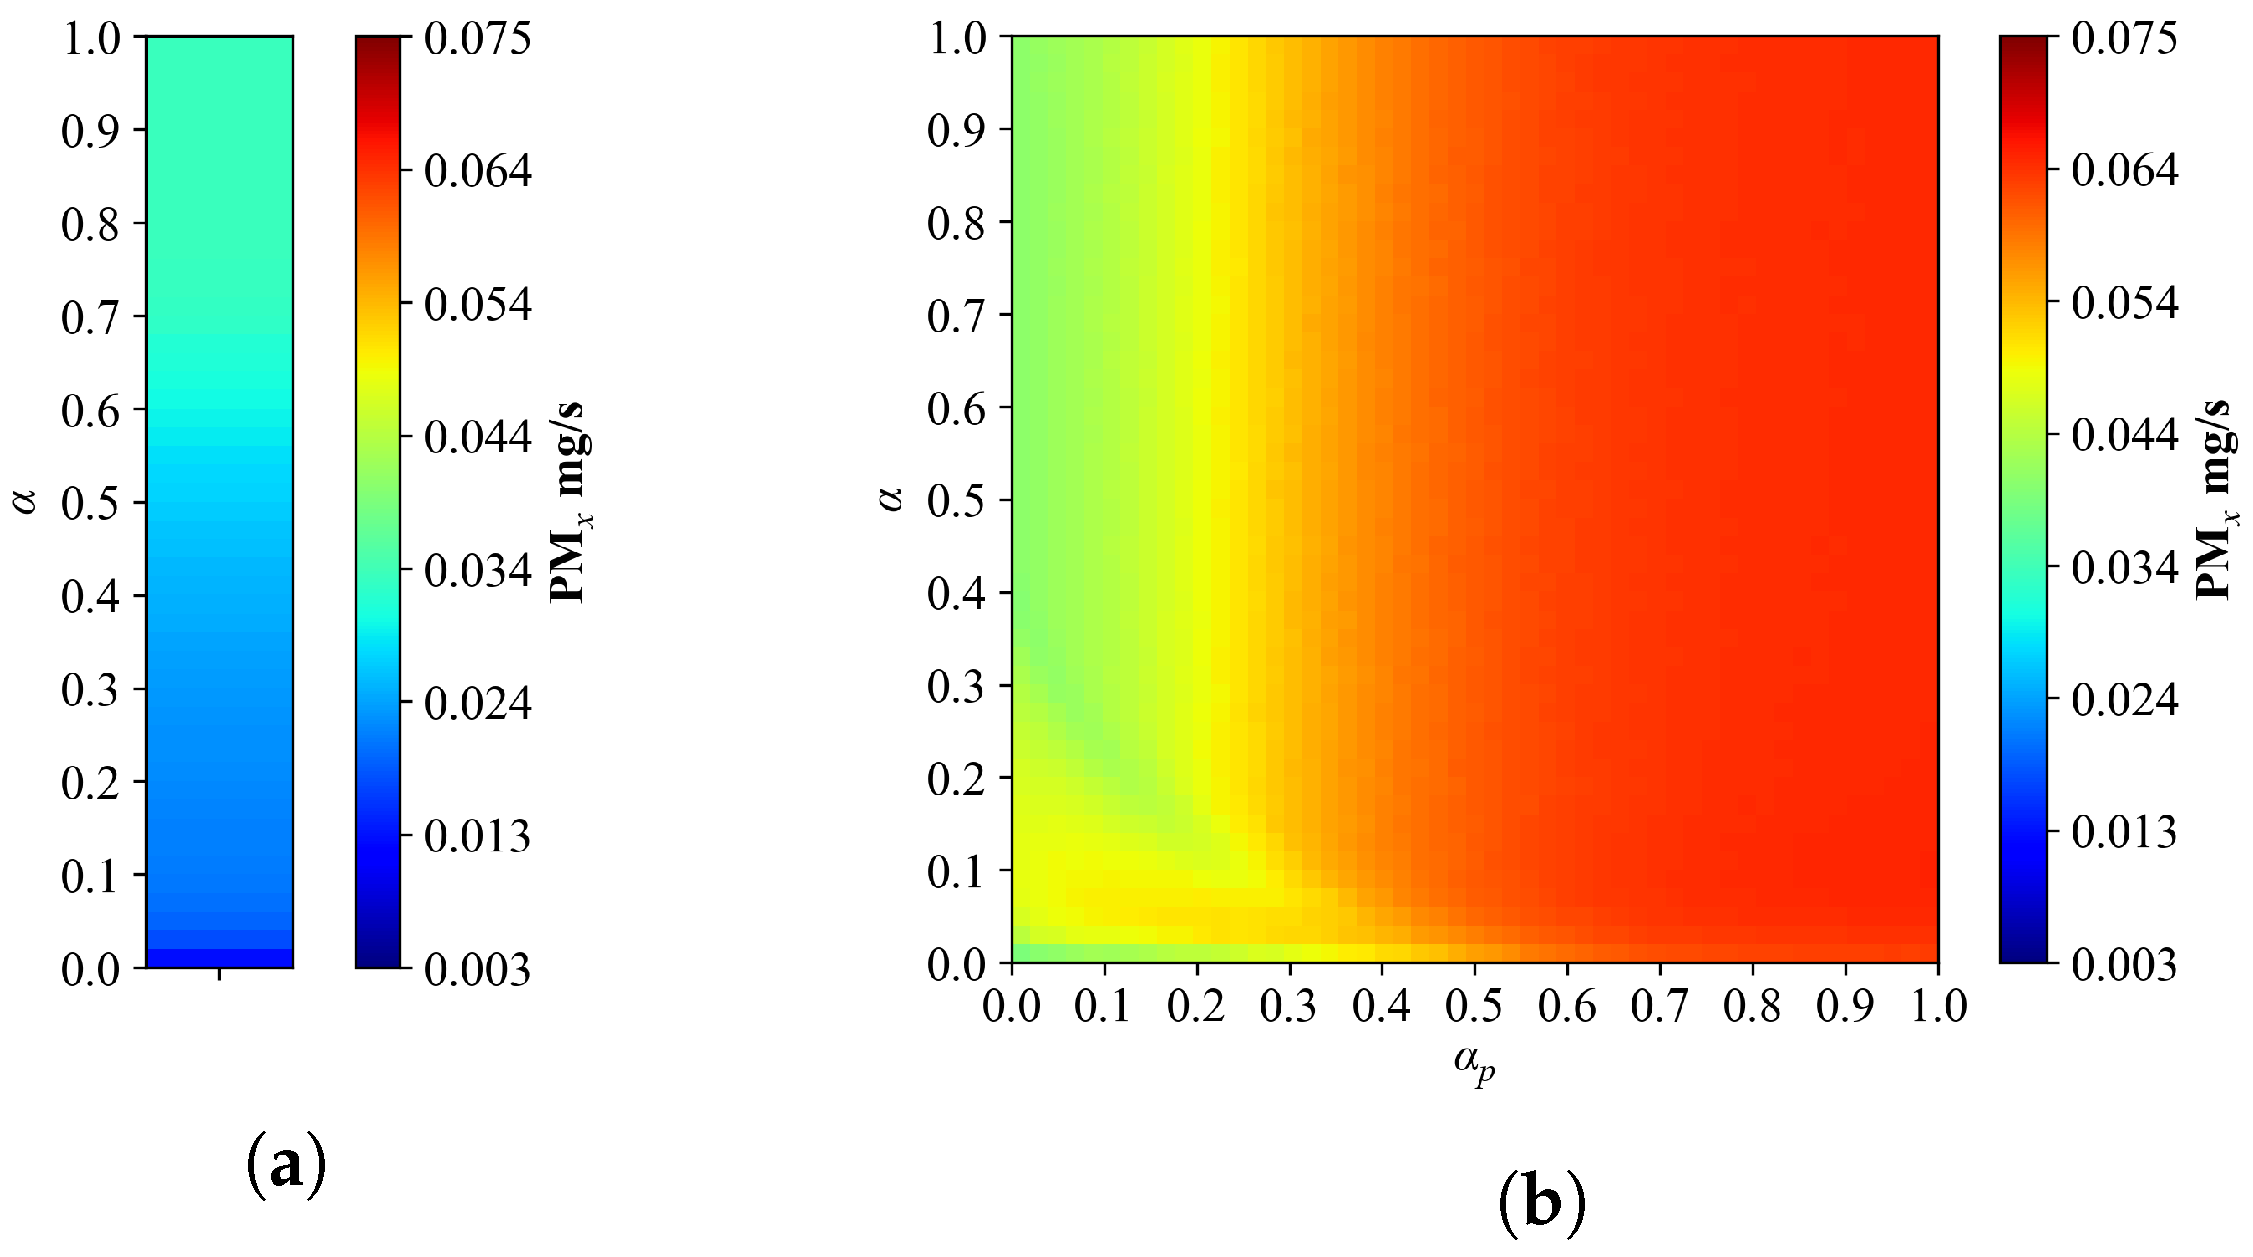
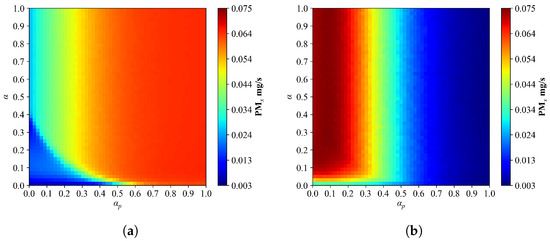
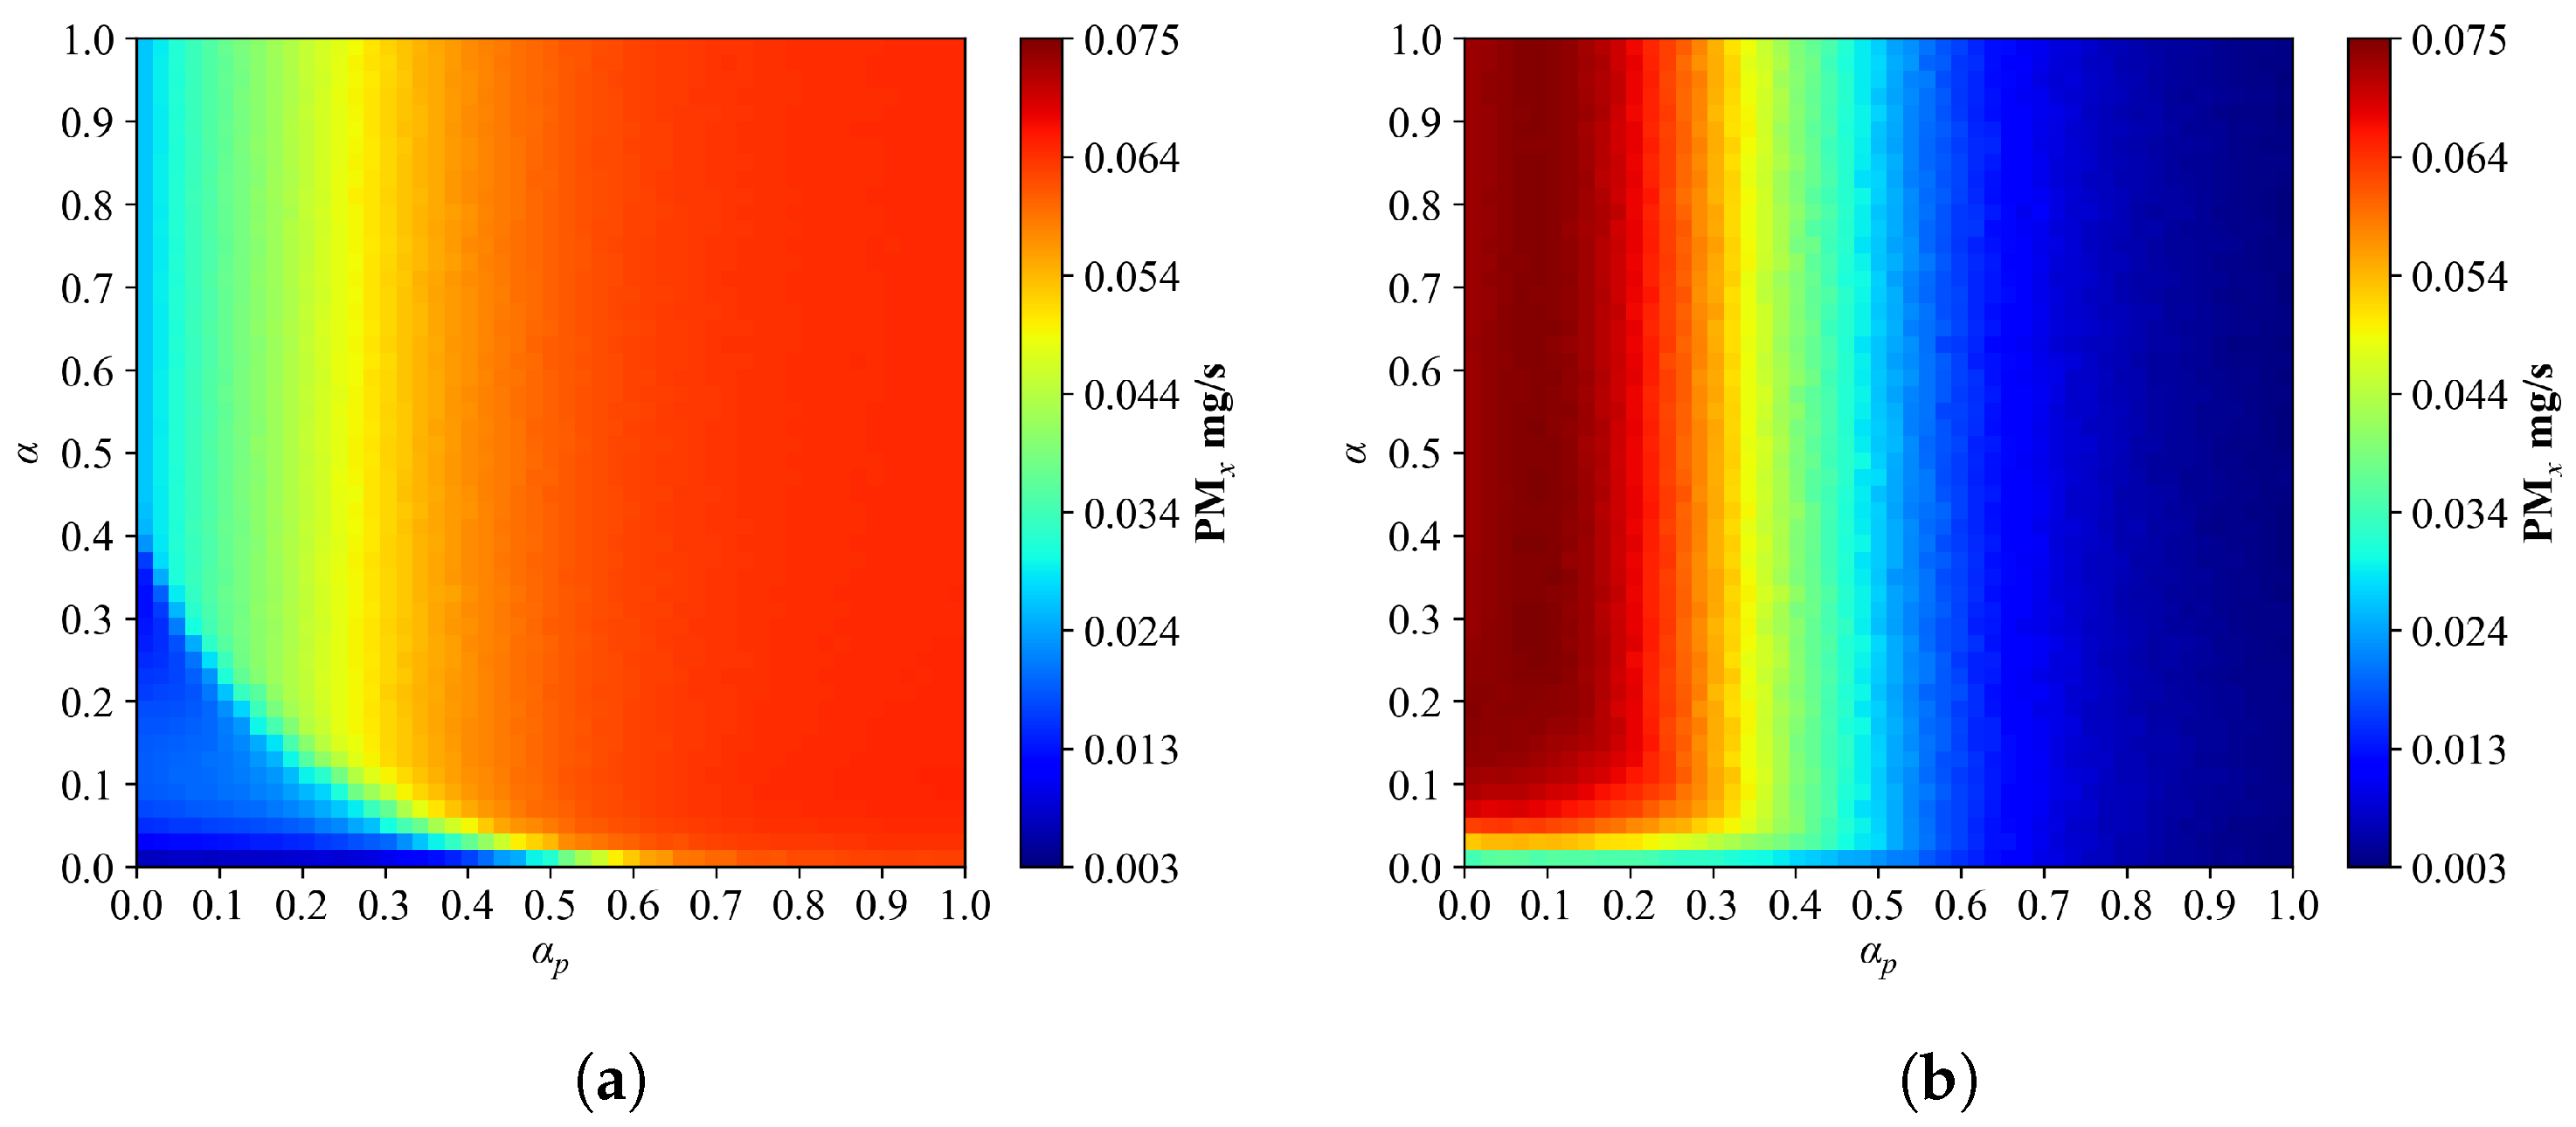
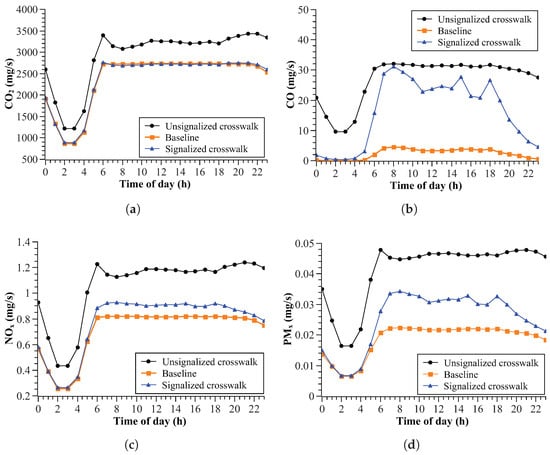
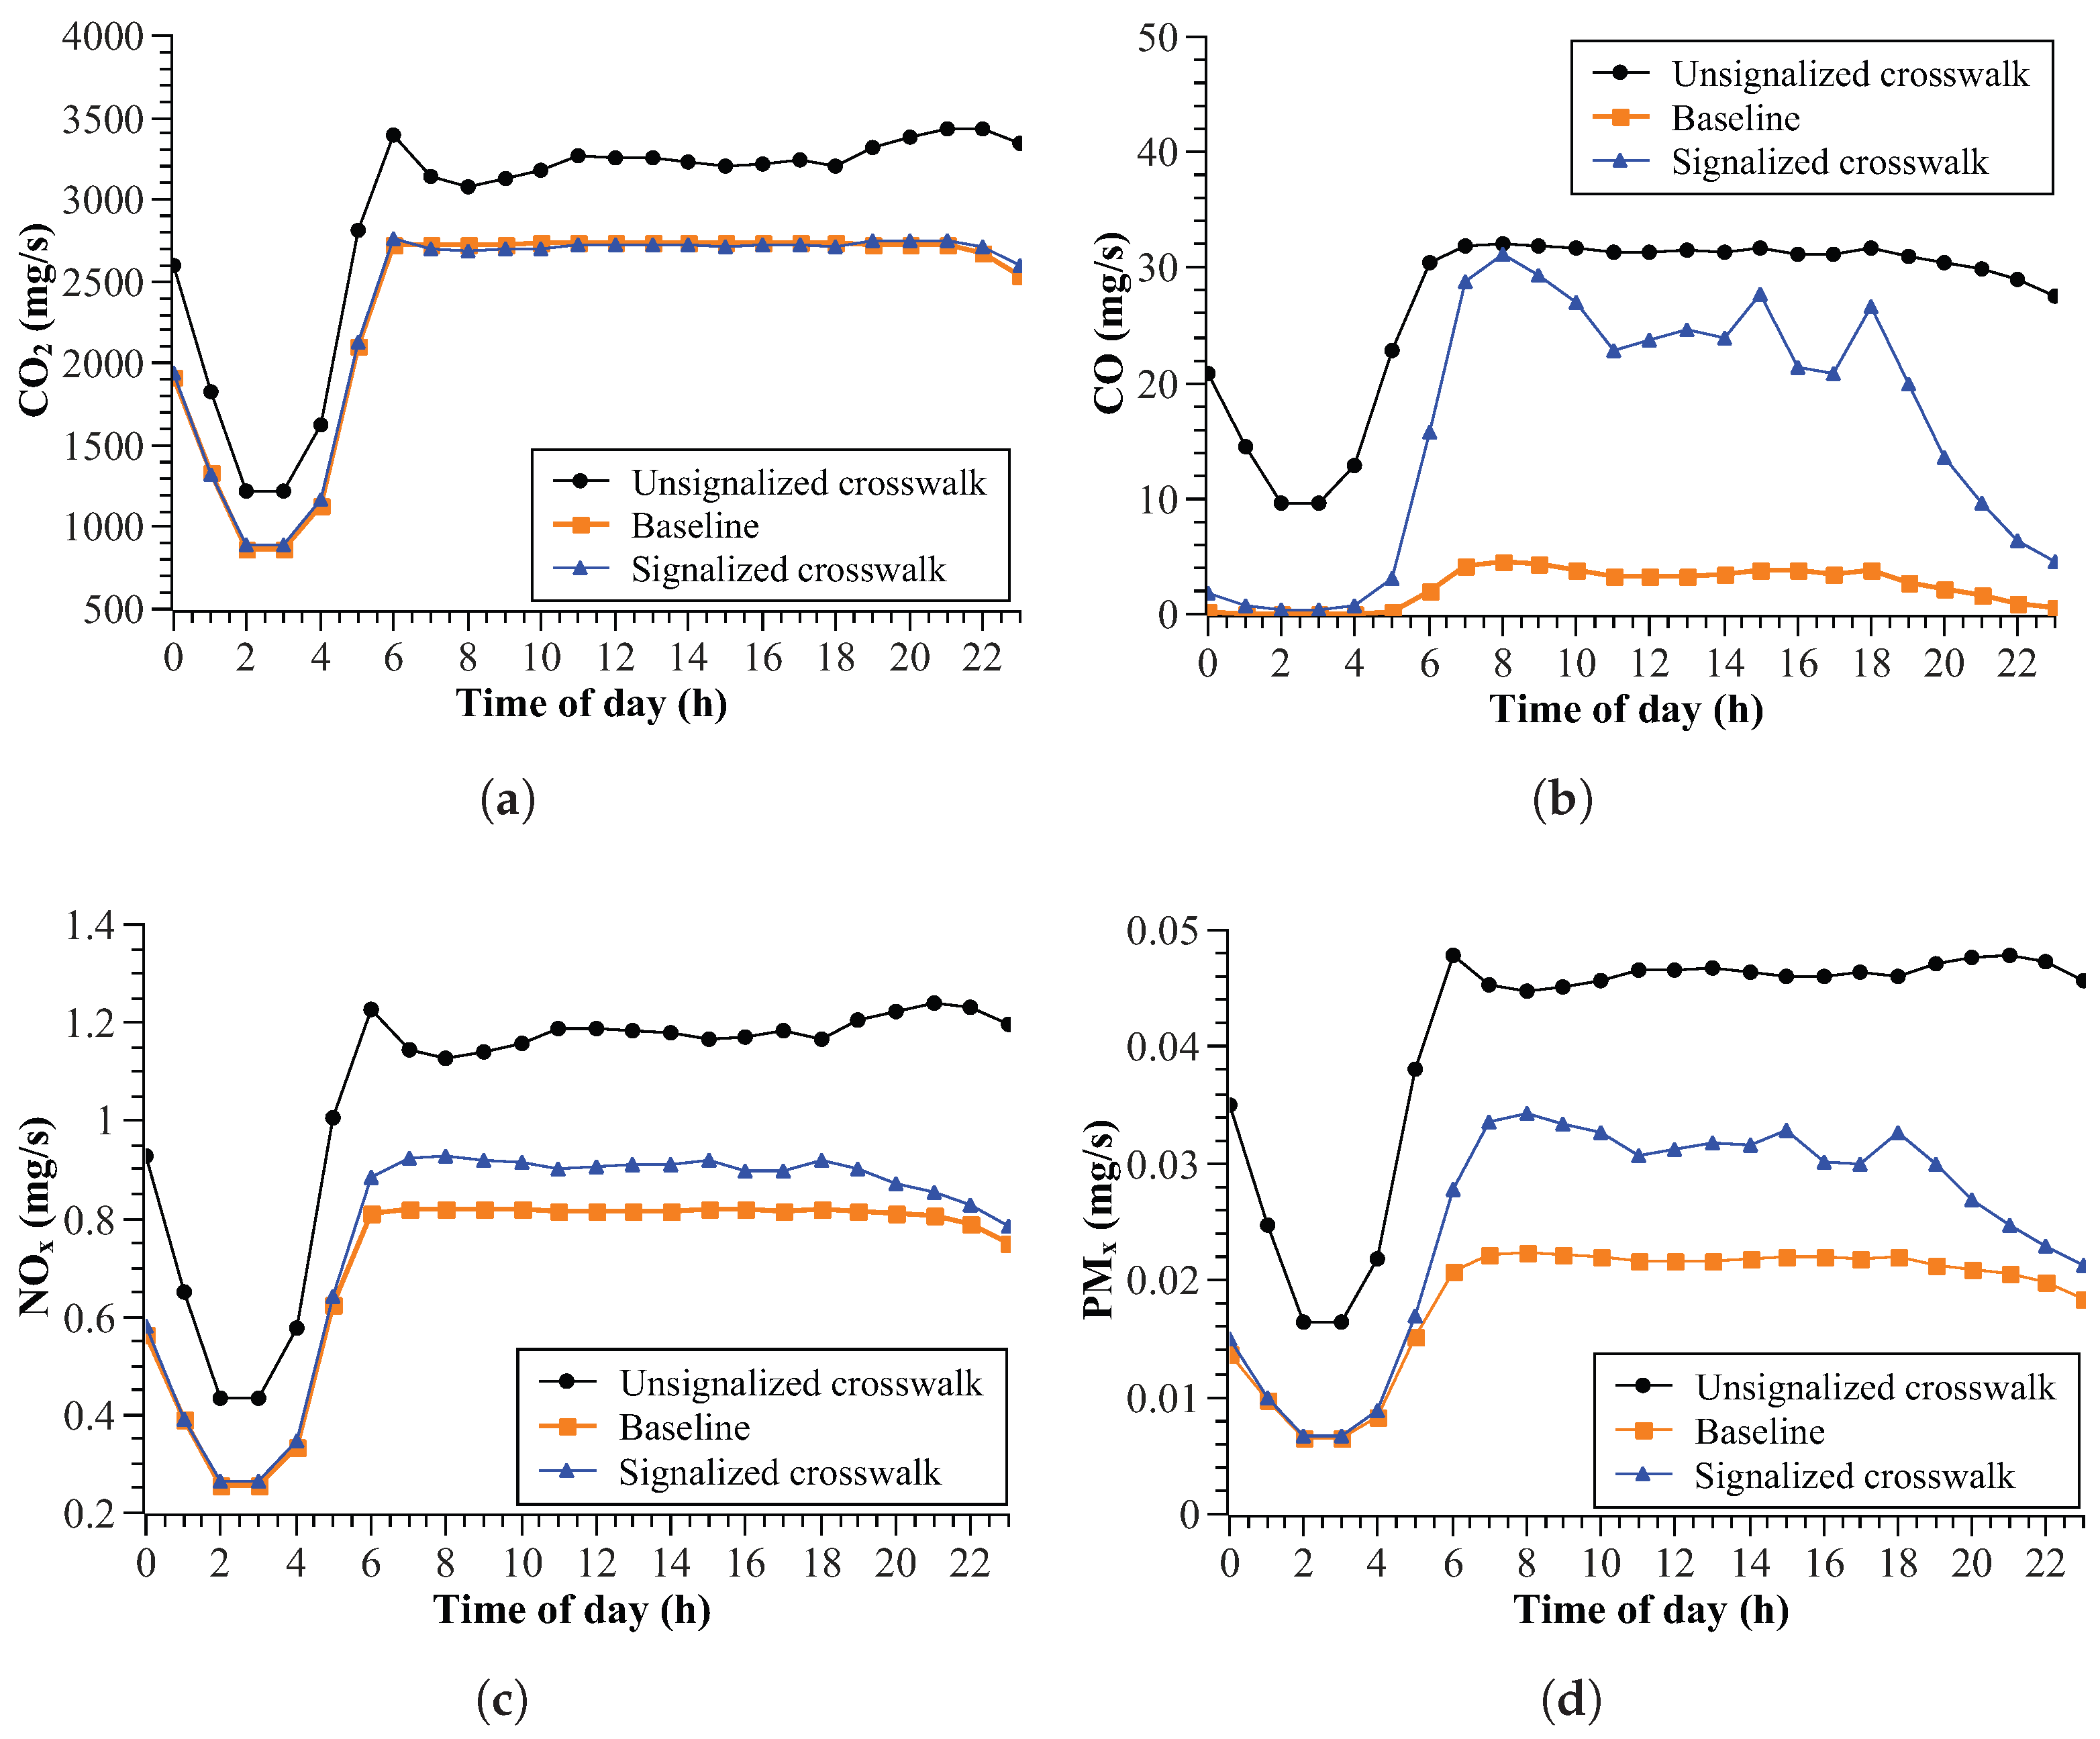

Disclaimer/Publisher’s Note: The statements, opinions and data contained in all publications are solely those of the individual author(s) and contributor(s) and not of MDPI and/or the editor(s). MDPI and/or the editor(s) disclaim responsibility for any injury to people or property resulting from any ideas, methods, instructions or products referred to in the content. |
© 2026 by the authors. Licensee MDPI, Basel, Switzerland. This article is an open access article distributed under the terms and conditions of the Creative Commons Attribution (CC BY) license.