


Abstract
Hydrogen leakage detection and mapping are essential in hydrogen-rich environments to ensure safe utilization in industrial and commercial applications. In this study, a wireless IoT-enabled hydrogen leak-mapping system was developed using machine learning and a LoRa-coupled wireless sensor network. A miniature model of a hydrogen production system was used, featuring a functioning electrolyzer that generates pure hydrogen by splitting water. To perform efficient leakage mapping, the leak location and watch time were varied, and six readings from commercial hydrogen gas sensors were recorded for better analysis. The relative sensor responses recorded by the six hydrogen sensors were used as input features for the machine learning models. The model accuracy was approximately 88.13%. LoRa communication technology was also used to demonstrate its use in harsh conditions, along with the IoT protocol, to deliver data over the Internet for better accessibility and monitoring. The developed localization technology enables safe monitoring of hazardous, highly flammable hydrogen gas, and machine learning can help prevent fatal accidents.
1. Introduction
Energy needs are rising daily due to rapid development and modern infrastructure. We have relied on non-renewable sources like fossil fuels, which harm the environment. Fossil fuels cause problems such as the greenhouse effect, acid rain, ozone depletion, and air pollution, all of which can seriously affect human health. To address these problems, renewable, efficient, readily available, and clean energy sources are needed. Hydrogen is a leading alternative because it is abundant and produces only water as a byproduct. Hydrogen is non-toxic, non-polluting, renewable, and increasingly attracting attention from researchers and industry [1]. However, hydrogen is highly flammable above its lower threshold limit (1–3%) and can be dangerous [2]. Therefore, detecting hydrogen at minimal concentrations (ppm or ppb) is crucial for safety in fields including medical, chemical, autonomous, space, and power industries. Hydrogen detection at low concentrations is widely recognized as an important requirement for many industrial and safety applications. In the present work, however, the emphasis is placed on hydrogen leak detection and localization using the relative response of commercially available hydrogen sensors rather than on quantitative concentration measurements.
Hydrogen produces three times as much energy as conventional fuels such as fossil-fuel gasoline. The ignition energy of hydrogen is quite low, at approximately 0.02 MJ. It is flammable over a wide range (4–75 vol%), which is higher than that of other gases, such as methane. Hydrogen also has a higher diffusivity, approximately 3.8 times faster, and a spreading speed almost six times faster than that of natural gas.
Hydrogen’s very small molecular size, high diffusion rate, and high flammability require careful infrastructure design. It is odorless, colorless, and tasteless. Because of this, no human can detect a leak on their own. Therefore, a robust, reliable sensing infrastructure is needed to detect hydrogen leaks and enable continuous, real-time monitoring. This is critical to avoid mishaps that could lead to calamity.
Elementary methods of hydrogen sensing include bubble testing, catalytic combustion, mass spectrometry, gas chromatography, ultrasonic leak detection, and glow plugs. However, these techniques are not practical for direct implementation in the industry. To overcome these issues, more practical detection methods have been introduced. Examples include electrochemical sensors, Pd films and Pd-alloy films, metal oxide sensors, and optical devices [3,4,5]. With the advent of the Internet of Things (IoT), these sensors can be connected to power-efficient microcontrollers such as ESP32, STM32, Arduino, and Raspberry Pi. Real-time data can be stored in the cloud and accessed from anywhere in the world. Researchers have used machine learning approaches to improve decision-making reliability using various algorithms [6,7,8,9,10]. These technologies eliminate the problem of hydrogen detection in the quickest and most timely manner. Thereafter, appropriate steps can be taken. LoRa technology has also emerged as promising alongside IoT, enabling reliable, real-time detection. Although several studies have investigated hydrogen sensing and IoT-enabled monitoring, only a limited number have explored the integration of long-range LoRa communication with IoT and machine learning for hydrogen leak detection and localization. This study presents work that combines LoRa with other wireless technologies.
LoRa is a spread-spectrum modulation technique based on chirp spread spectrum (CSS) [11]. LoRa modulation operates under the unlicensed industrial, scientific, and medical (ISM) band. The unlicensed frequency band varies by region: 868 MHz in Europe and 915 MHz in America, Australia, and New Zealand. The 920–928 MHz band is used in Asia, and 433 MHz is used in certain regions [12,13,14]. LoRa technology is a low-power wide-area network (LPWAN) technology. It is integrated with the IoT infrastructure and can be used for real-time field monitoring across smart agriculture, gas detection, smart homes/cities, and transportation.
It has some limitations, including increased packet loss in non-line-of-sight conditions. In densely populated areas with many high-rise buildings, trees can reduce the number of data packets transmitted. This also reduces the total transmission range. Some research groups have conducted indoor range tests under various environmental conditions, including temperature, humidity, CO2 concentration, and PM2.5. They found that variations in these parameters, along with changes in indoor amenities, can alter signal attenuation by up to 10.58 dB [15]. Unlike NB-IoT, LoRaWAN/LoRa does not require any cellular network subscription.
The key points about LoRa-based communication are as follows. (i) A narrower bandwidth provides longer-distance coverage; a wider bandwidth provides shorter-distance coverage. For longer transmissions, select a narrower bandwidth. (ii) The RSSI indicates the strength of the received signal and is independent of the spreading factor (SF). (iii) The spreading factor is proportional to coverage range but inversely proportional to data rate. A higher SF provides higher coverage and a lower data rate. (iv) A higher SF allows for a lower signal-to-noise ratio (SNR). This means LoRa can read signals as low as −20 dB [16,17,18]. It should be noted that the primary purpose of employing LoRa in the proposed framework is to provide long-range, low-power wireless connectivity for distributed hydrogen sensing nodes. The localization accuracy is determined by the sensor measurements and the machine learning algorithms rather than by the wireless communication technology itself. LoRa enables practical deployment over geographically distributed monitoring environments where wired or short-range wireless solutions may be less suitable.
In addition to wireless technology choices, selecting an appropriate Internet protocol is crucial. MQTT connects the system to the Internet for real-time data access. Protocols such as HTTP, CoAP, XMPP, and AMQP are available, and in IoT 4.0, OPC-UA and Modbus are also available. MQTT stands out for its scalability, security, reliability, real-time control, and ease of data logging [19,20,21].
Related Works
Currently, only a few researchers have explored the use of IoT and LoRa for hydrogen safety and monitoring. Jianxiong et al. developed a thin, flexible, wearable hydrogen gas sensor based on a graphene sheet. They applied machine learning but did not incorporate much IoT in their work [22]. Similarly, Zhang et al. developed a machine learning model with a dual-gas sensor; however, they did not integrate IoT or LoRa technology into their work [6]. Mingbin et al. presented a hydrogen detection method for parking garages, but they used helium instead of hydrogen in their tests and did not use IoT or LoRa technology [8]. Other researchers have used IoT to detect leaks in hydrogen-compressed natural gas (HCNG), while others have used hydrogen sensors to simulate leak safety at refueling stations with or without IoT protocols [23,24,25,26]. In one of the studies, Long Li et al. have demonstrated a PdAu-In2O3 sensor array-based hydrogen leak localization system where they have employed a machine learning algorithm and IoT protocol to predict the leakage as a form of electronic nose [27]. Shilu Wang et al. have applied an extensive deep learning approach to detect the leakage of hydrogen gas in the hydrogen refueling station [28]. Table 1 lists the published work, and key parameters are highlighted for easier comparison. Similarly, various studies have been performed for hydrogen-based leak detection and localization [29,30,31,32,33,34,35].
Table 1.
Critical comparison of recent hydrogen monitoring and localization systems.
Our hydrogen detection system addresses the limits of short-range communication technologies like ZigBee, Bluetooth, and Wi-Fi, as well as the drawbacks of wired systems used in most current setups. It also avoids extra subscription costs found in cellular-based systems such as GSM, GPRS, 3G, LTE, and NB-IoT. We use a sensor network with LoRa and IoT technology to send data worldwide. Machine learning helps the system predict leak locations more accurately by using a self-learning model. This system brings together all the main technologies for better performance compared to the most recent works.
2. Materials and Methods
2.1. Methodological Framework
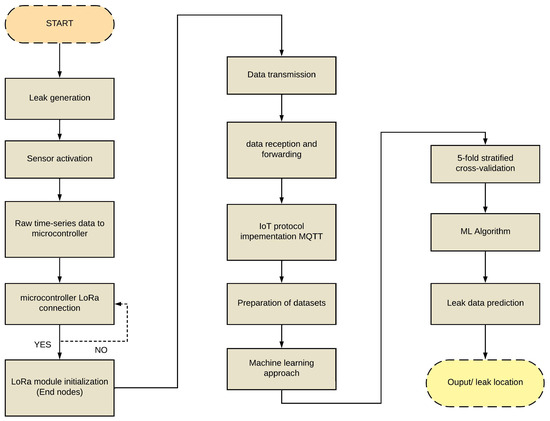
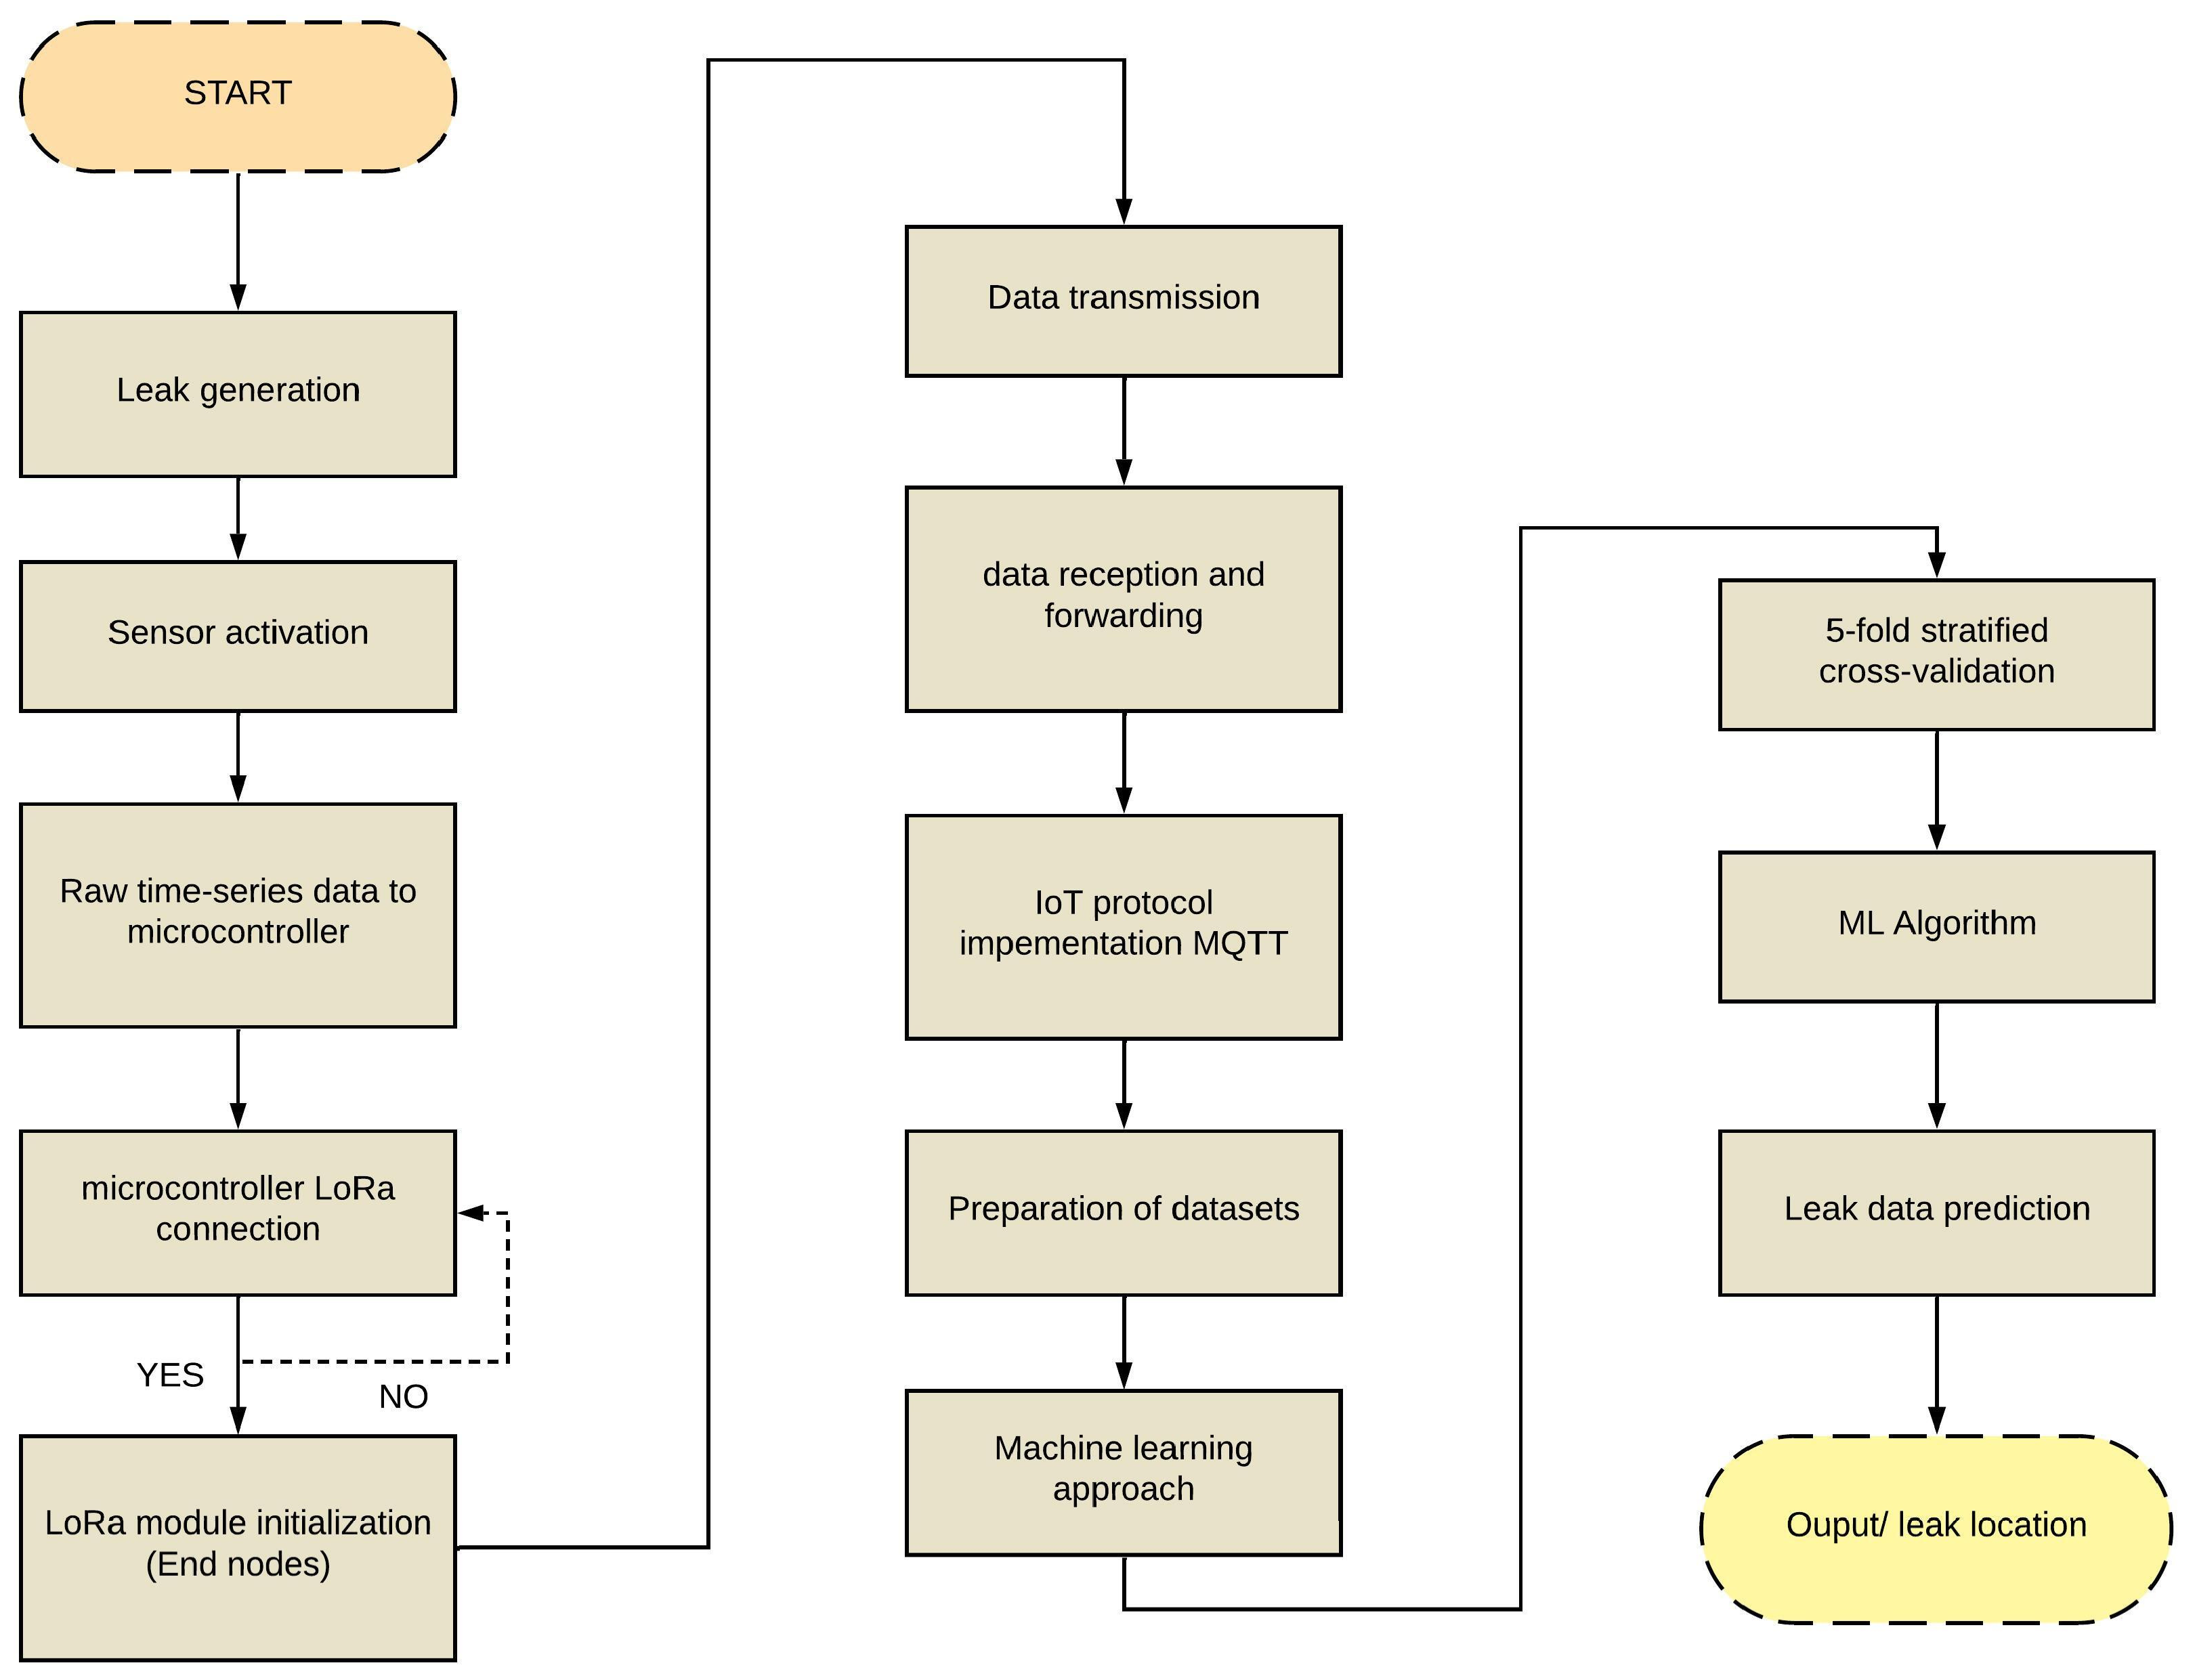
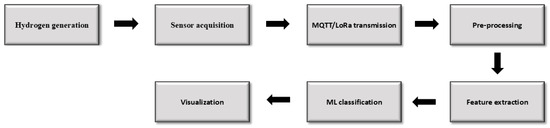
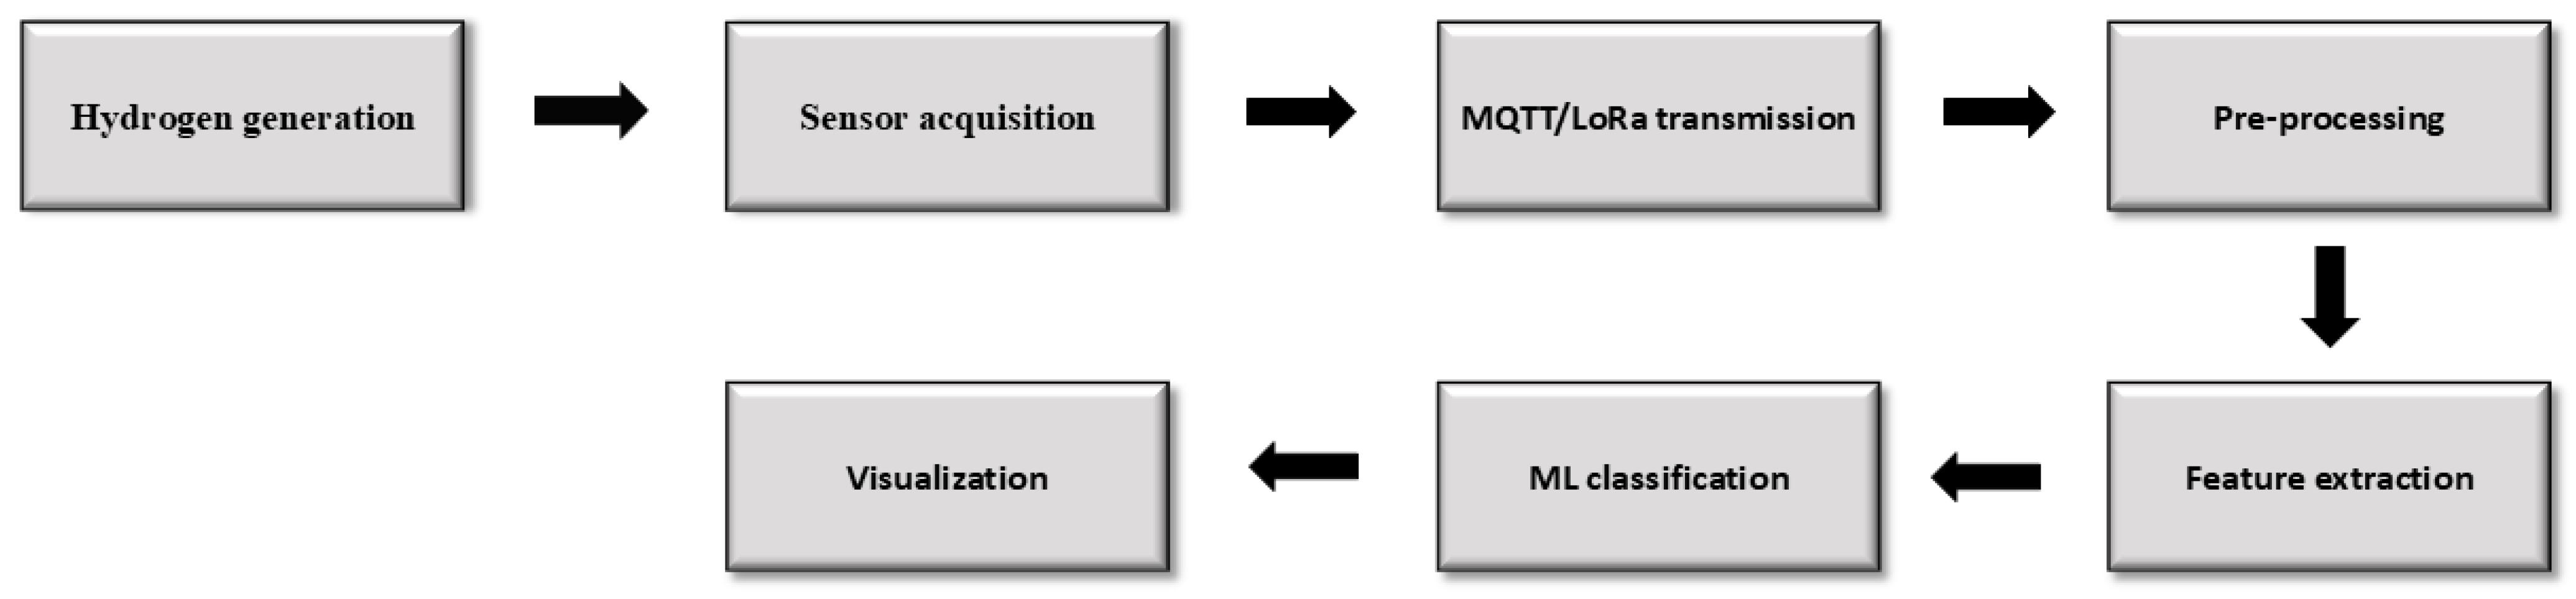
As shown in Figure 1, the framework’s design leverages wireless sensing, IoT communication, and ML techniques to enable real-time hydrogen leak detection and localization. To begin, sensors are placed in the monitoring environment. Then, random hydrogen gas leaks occur in the experimental setting within the predefined sensor locations to mimic actual industrial conditions. The sensors are used to record relative hydrogen sensor responses as time-series data.
Figure 1.
Flowchart of the research methodology.
Once the sensors acquire data, it is transmitted to an MCU for initial signal acquisition and formatting. For reliable wireless communication, the LoRa protocol is used to transmit data. Furthermore, the LoRa connection is confirmed before initializing the end-node modules for real-time operations.
Afterward, the acquired data are transmitted through LoRa to the end node for packet reception, verification, and forwarding. To facilitate IoT communication, the MQTT protocol is used for real-time data exchange between the sensor network and the analytical platform.
Next, the gathered data are processed to form structured datasets that are normalized, noise-reduced, and feature-extracted. Thereafter, different machine learning methods will be employed to detect the relationship between the response and the leak characteristics. The learning process aims to predict leaks and locate their locations.
In summary, this study proposes a hydrogen safety monitoring system that leverages wireless sensors, IoT, and machine learning to efficiently detect leaks in industrial and smart energy systems.
2.2. IoT Implementation and System Description
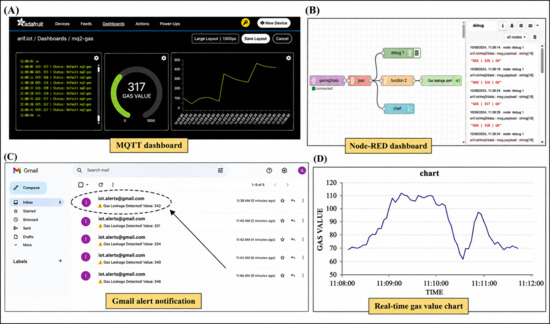
The figure below displays the Adafruit IO dashboard, which logs data from the connected sensor. It features various widgets that display outputs from multiple sensors. Adafruit IO is a cloud service for Internet of Things projects. It enables live data streaming, real-time dashboards, no-code operation, integration and automation, strong security, and the ability to store, export, and plot data using Python or MS Office. During system operation, sensor measurements were transmitted through the LoRa communication link at approximately 1 s intervals. Cloud monitoring was implemented using the free version of Adafruit IO, which provides a dashboard refresh interval of approximately 5 s. Consequently, the end-to-end response time of the prototype is primarily constrained by the cloud service update interval rather than the wireless communication link.
During each experiment, the ESP32 microcontroller (Espressif Systems, Shanghai, China) sampled the six MQ-8 sensors at 1 s intervals, reading all sensor outputs sequentially within the same acquisition loop. Approximately 50 synchronized sensor measurements were collected for each predefined leakage location under stable hydrogen exposure conditions. Hydrogen was generated using the electrolyzer and delivered to the selected leakage location through a movable tubing arrangement, enabling repeated measurements at different predefined leak positions using the same experimental setup. The acquired sensor responses were subsequently used to construct the machine learning dataset for hydrogen leak localization.
The dashboard contains multiple windows for observing real-time data with timestamps, along with a real-time plot. Using Adafruit IO requires sensors embedded in a Wi-Fi-enabled microcontroller, such as ESP32 or ESP8266. Once sensors are connected to the Internet, sensor data must be sent securely to the cloud and stored appropriately. Data transfer uses the MQTT protocol with subscriber and client feed names, and user-specific API keys are generated for privacy and security.
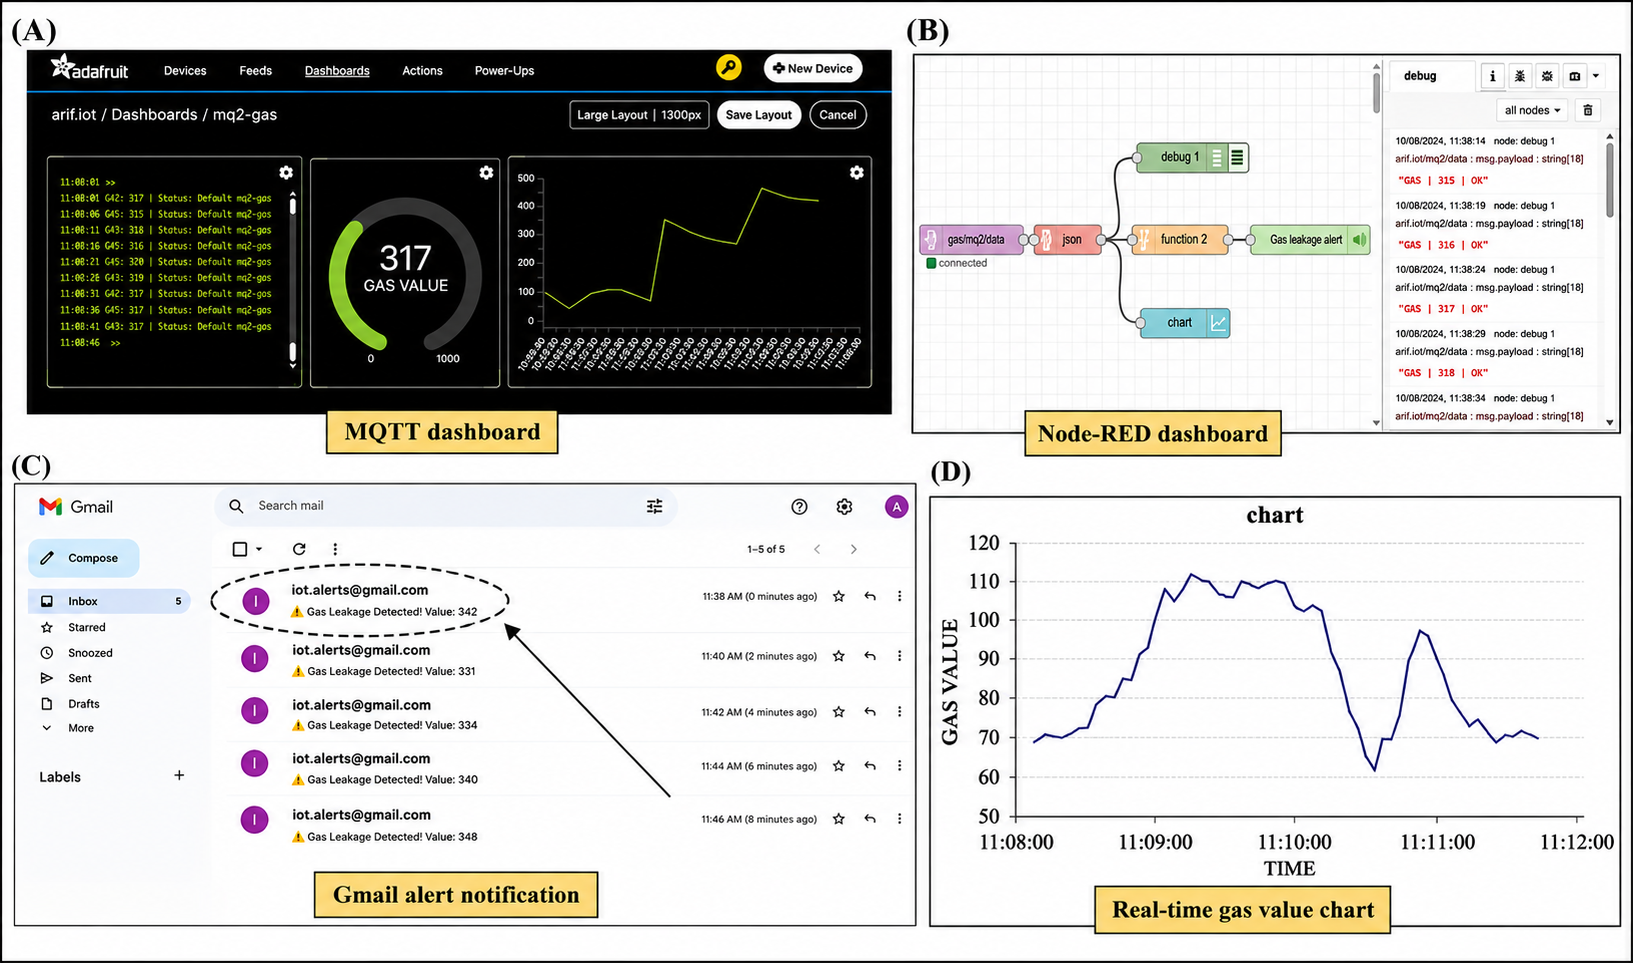
Figure 2 shows the Node-Red implementation for automation. Node-Red is a graphical, flow-based IoT development tool that connects sensor nodes via the MQTT protocol and provides interactive dashboards, such as graphs and plots. Node-Red also enables easy implementation of IFTTT protocols for actions such as email or SMS alerts during emergencies. The figure below shows graphs and emails triggered when specified conditions are met. Node-Red helps create a reliable detection and alert system. For successful communication, the following inputs were used: Details of the MQTT Node: (i) Server: IO.ADAFRUIT.COM:1883 (ii) Quality of service: 2. Details of the Email Node: (i) Server: SMTP.GMAIL.COM (ii) Port: 587.
Figure 2.
(A) Adafruit MQTT implementation with real-time dashboard monitoring. (B) Node-RED dashboard for automated IFTTT via email. (C) Email notification for every hydrogen leak detection. (D) Node-RED-based real-time graph.
2.3. Hardware Configuration
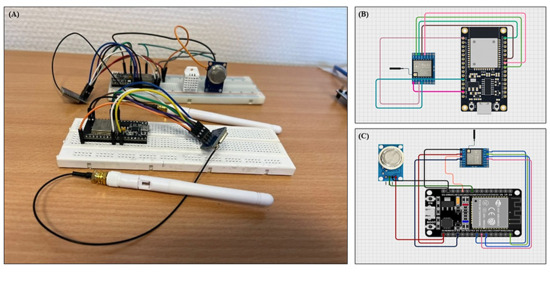
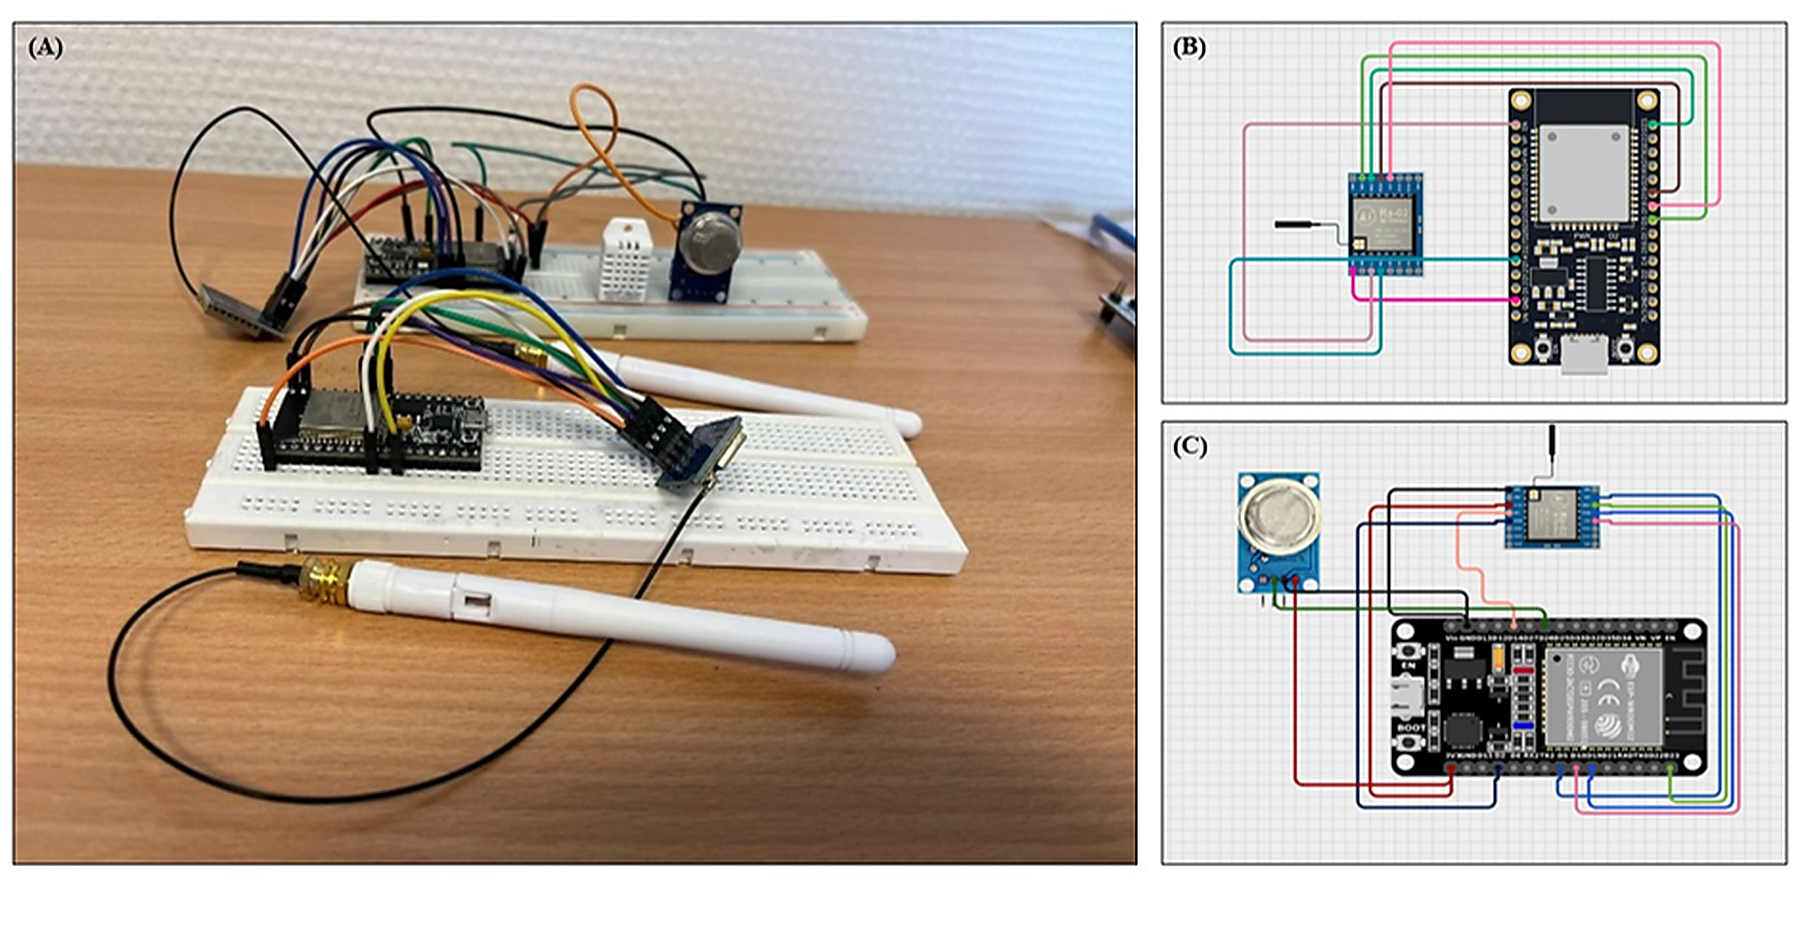
Figure 3 shows the LoRa receiver and transmitter sections. The connection between the LoRa module and the microcontroller is shown. The sensor modules were connected to the transmitter side of the LoRa module, since that side is responsible for transmitting sensor data to the receiver. The next figure shows a schematic representation of the sensor transmitter and receiver.
Figure 3.
Hardware setup for primarily MQTT-based IoT connection buildup. (A) assembled prototype, (B) LoRa module–ESP32 circuit, and (C) gas sensor–ESP32 interface.
2.4. System Architecture and Operation Mechanism
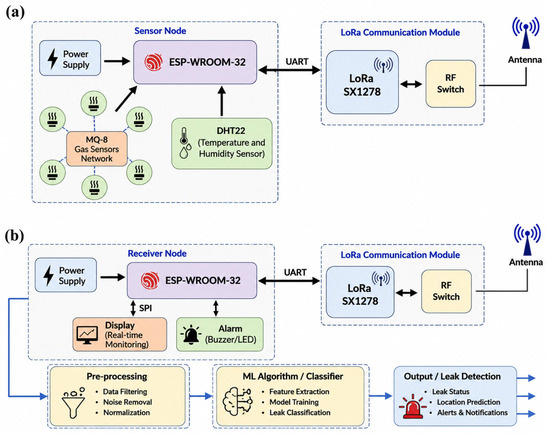
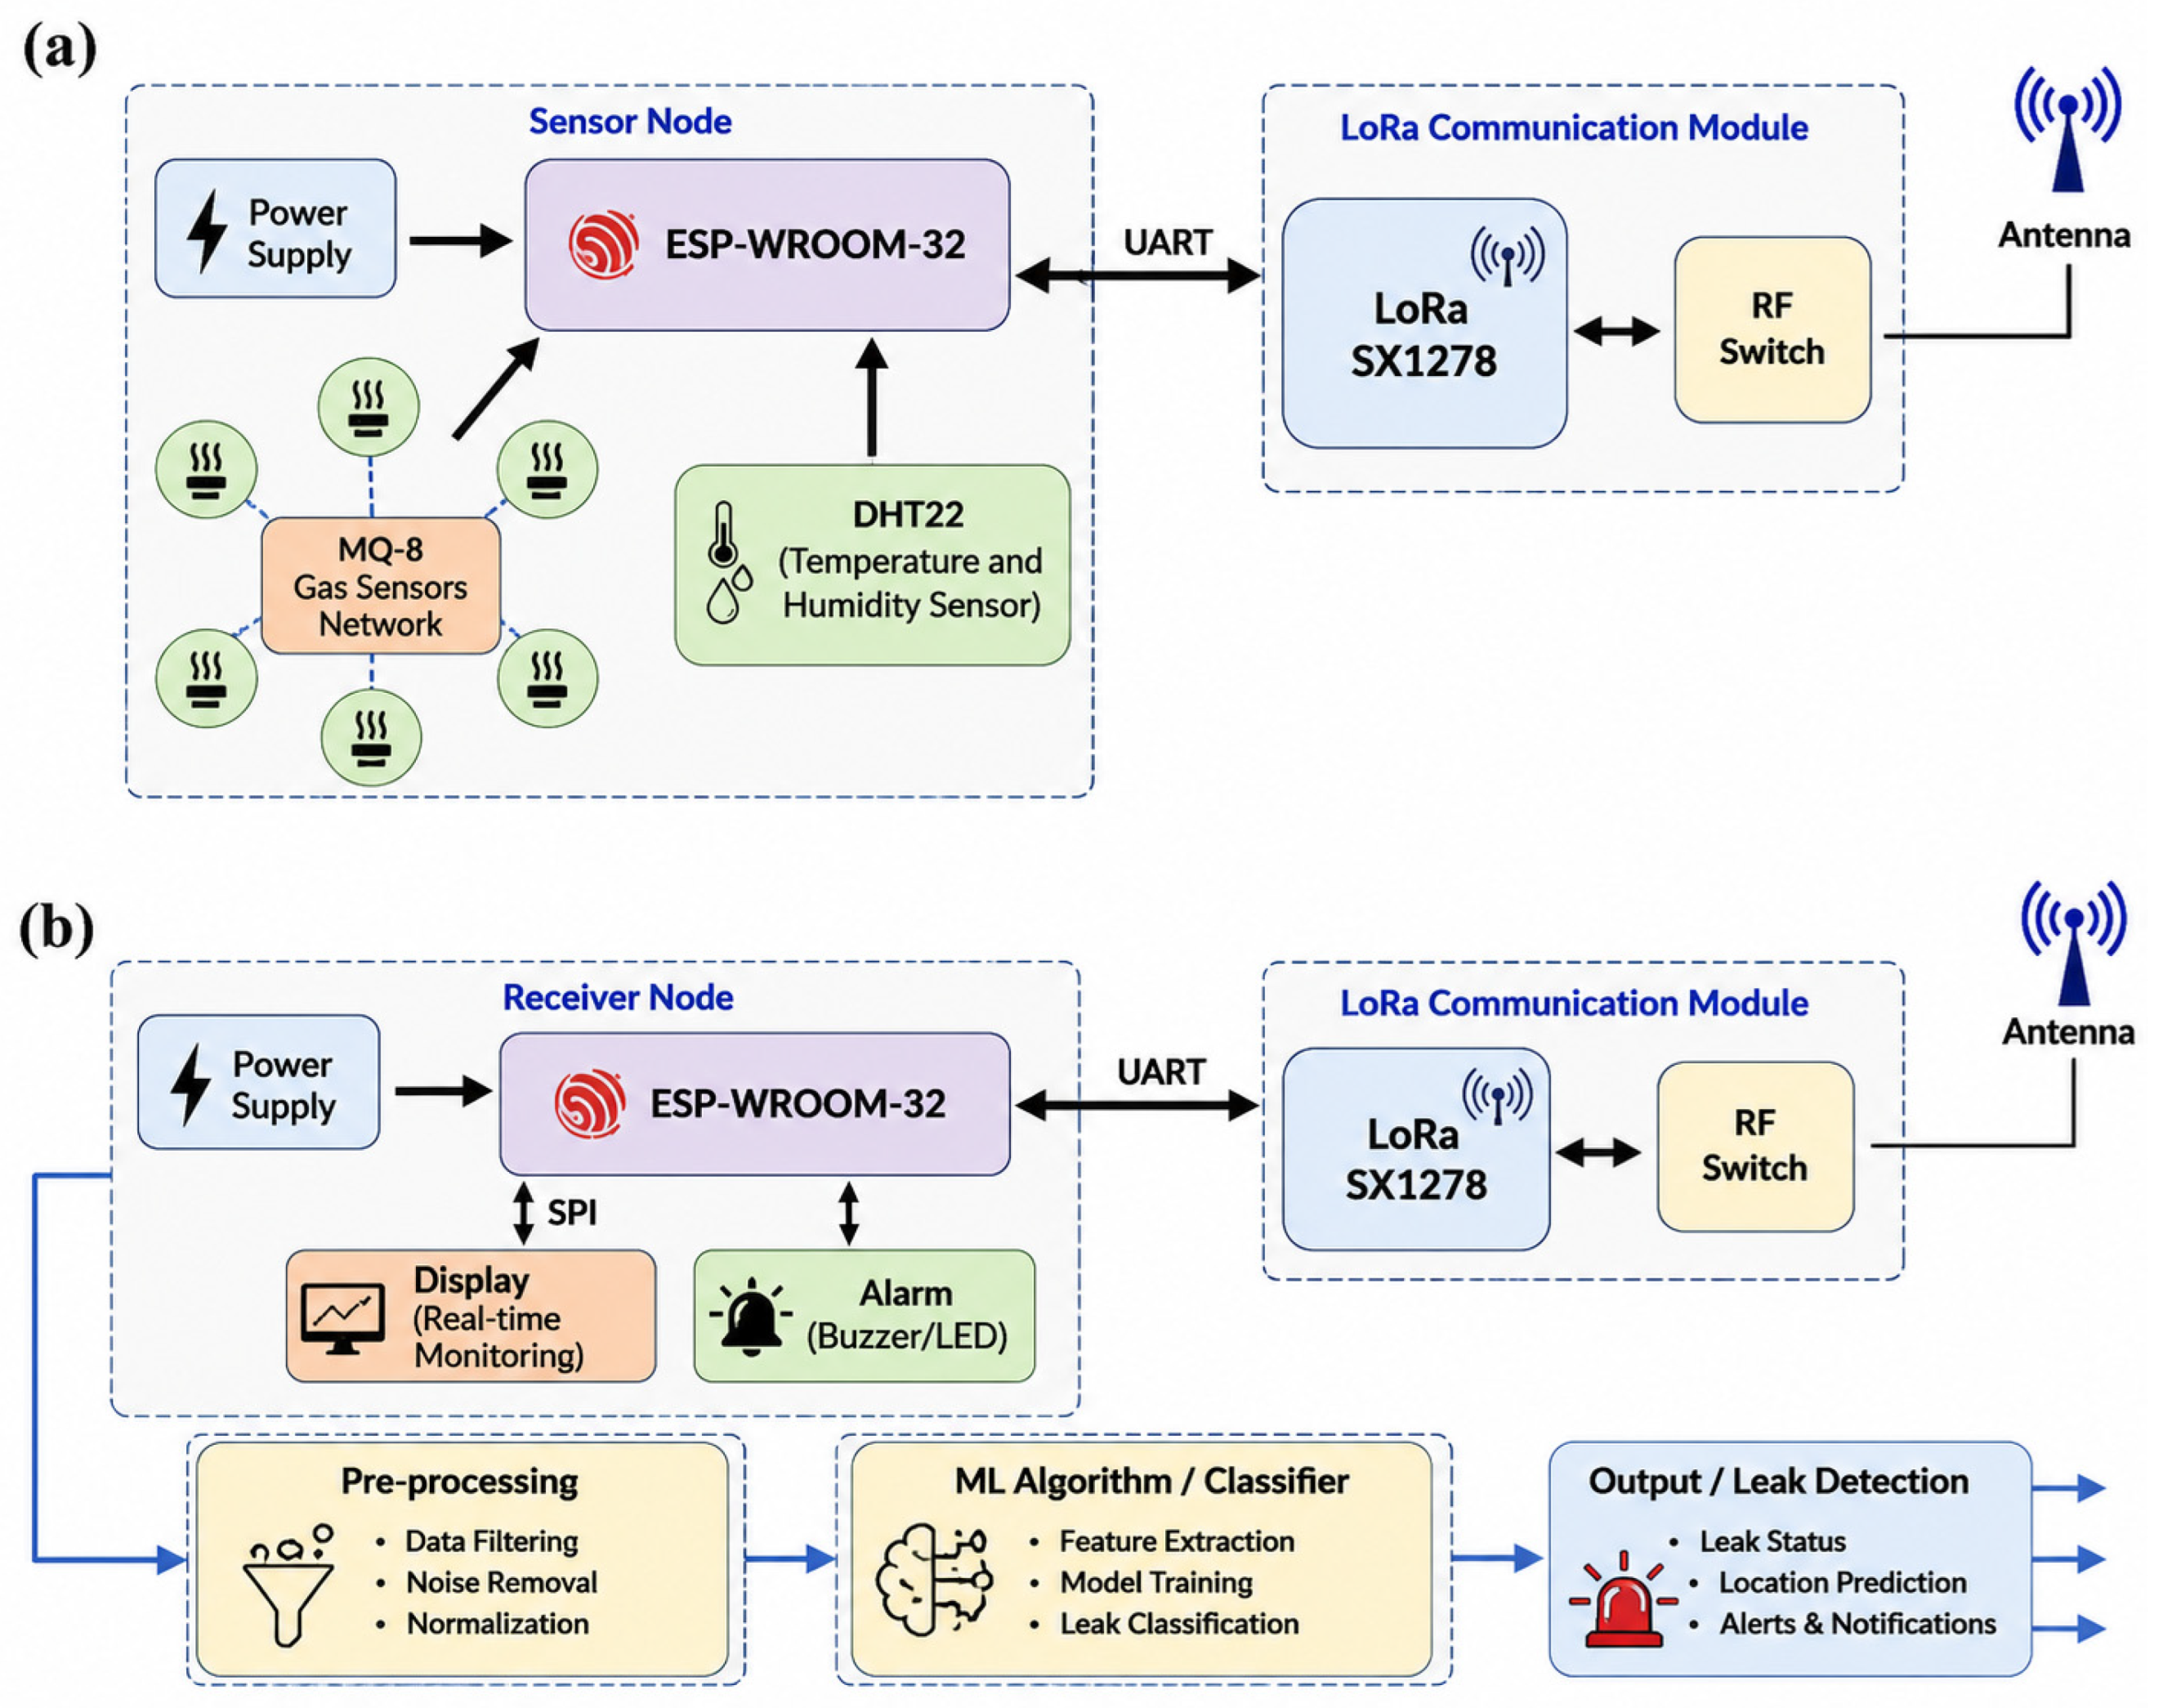
Figure 4a,b below show the transmitter and receiver sides of LoRa communication. Figure 4a represents the transmitter side of the LoRa-based communication. Here, we can see that the esp-wroom-32 microcontroller was used for the system. The sensors, including the DHT22 humidity sensor, were connected to the microcontroller’s GPIO pins. A power supply was attached to the controller to ensure smooth operation. The LoRa SX1278 communication module was connected to the controller’s GPIO pin via dedicated SPI pins. The LoRa was powered via the microcontroller pins and sent sensor data remotely via wireless technology. The antenna was used to transmit data from one end of the transmitter to the other end (receiver). The antenna has a 2 dBi gain and is connected to the LoRa module using an SMA connector.
Figure 4.
(a) Transmitter module (b) Receiver module for the gas localization-based system.
Figure 4b shows the receiver side of the system, which has the same LoRa module and microcontroller for data fetching. On the receiver side, to view the data, a display was connected for visualization. In addition to this alarm, a buzzer can also be connected to provide an instant alert in case of any mishap. Table 2 shows the parameters used during the experiment, which consist of the module name, frequency, bandwidth range, spreading factor range, etc.
Table 2.
LoRa protocol table used in this study.
The communication platform developed in this work employs commercially available SX1278 LoRa transceiver modules configured for point-to-point wireless communication between the sensing node and the receiver. The objective of this study was to evaluate the feasibility of long-range LoRa-based communication for hydrogen monitoring rather than to implement the complete LoRaWAN network architecture involving gateways, network servers, and MAC-layer management. A formal RF link-budget calculation was not performed in the present proof-of-concept study; instead, SF7, SF9, and SF12 and BW values of 125 and 250 kHz were experimentally compared to characterize the practical trade-off between communication range, sensitivity, and transmission time.
3. Results and Discussion
This section will cover the multi-stage experimental protocol we developed. This protocol includes hydrogen generation, sensor calibration, wireless communication testing, data collection, feature extraction, and machine learning for leak localization.
The following Figure 5 shows the overall methodology, which starts with sensor calibration and then collects sensor data after each leakage interval. The sensors are connected to the ESP32 microcontroller, which receives data from the sensors and wirelessly forwards it via a LoRa module from the transmitter to the receiver. On the receiver side, the same process happens again: LoRa receives the transmitted data, the microcontroller reads it, and the data is displayed. After receiving the data, a machine learning approach was used to detect the location of the leakage and predict its occurrence.
Figure 5.
Flowchart of leak localization and machine learning implementation.
3.1. LoRa Communication Testing in Indoor Conditions
3.1.1. RSSI Performance Analysis
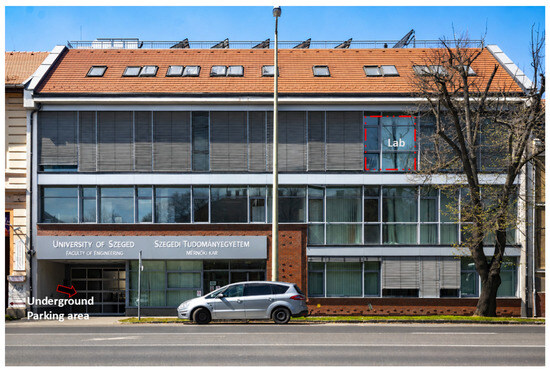
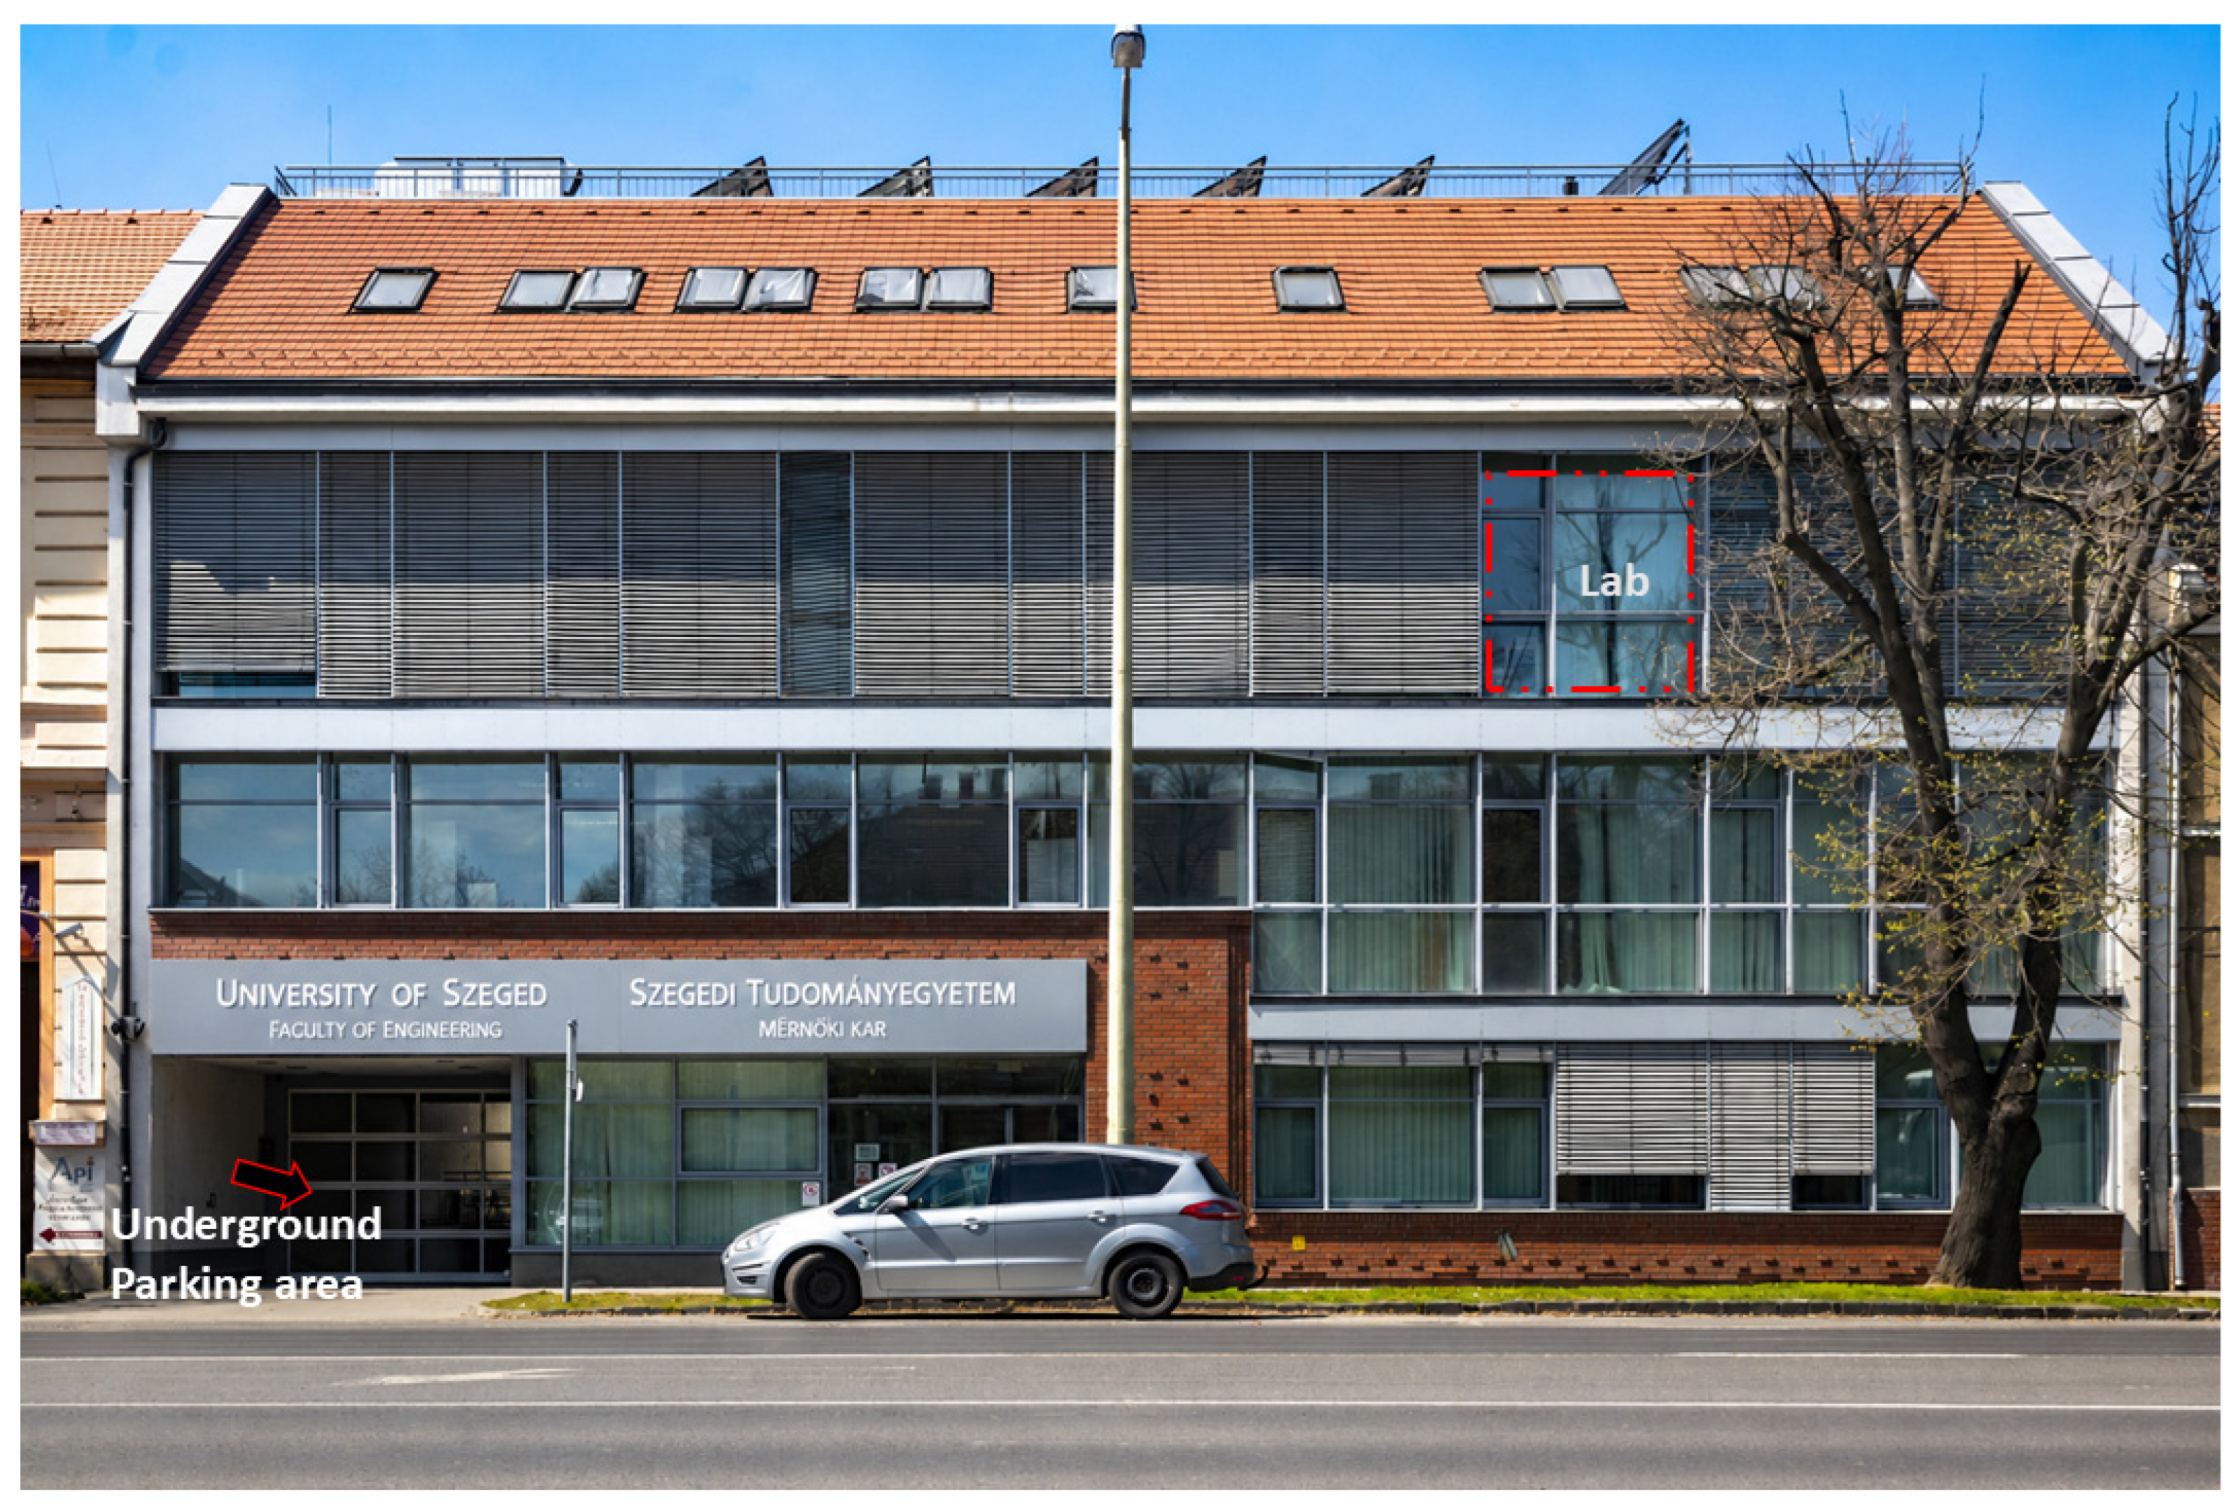
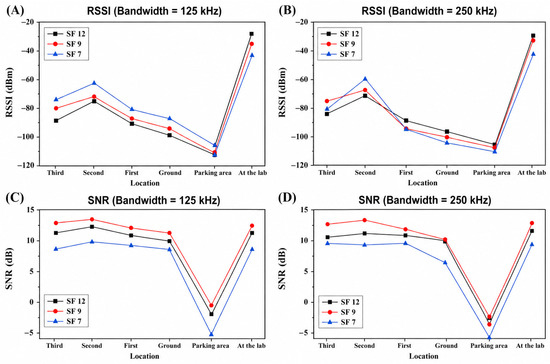
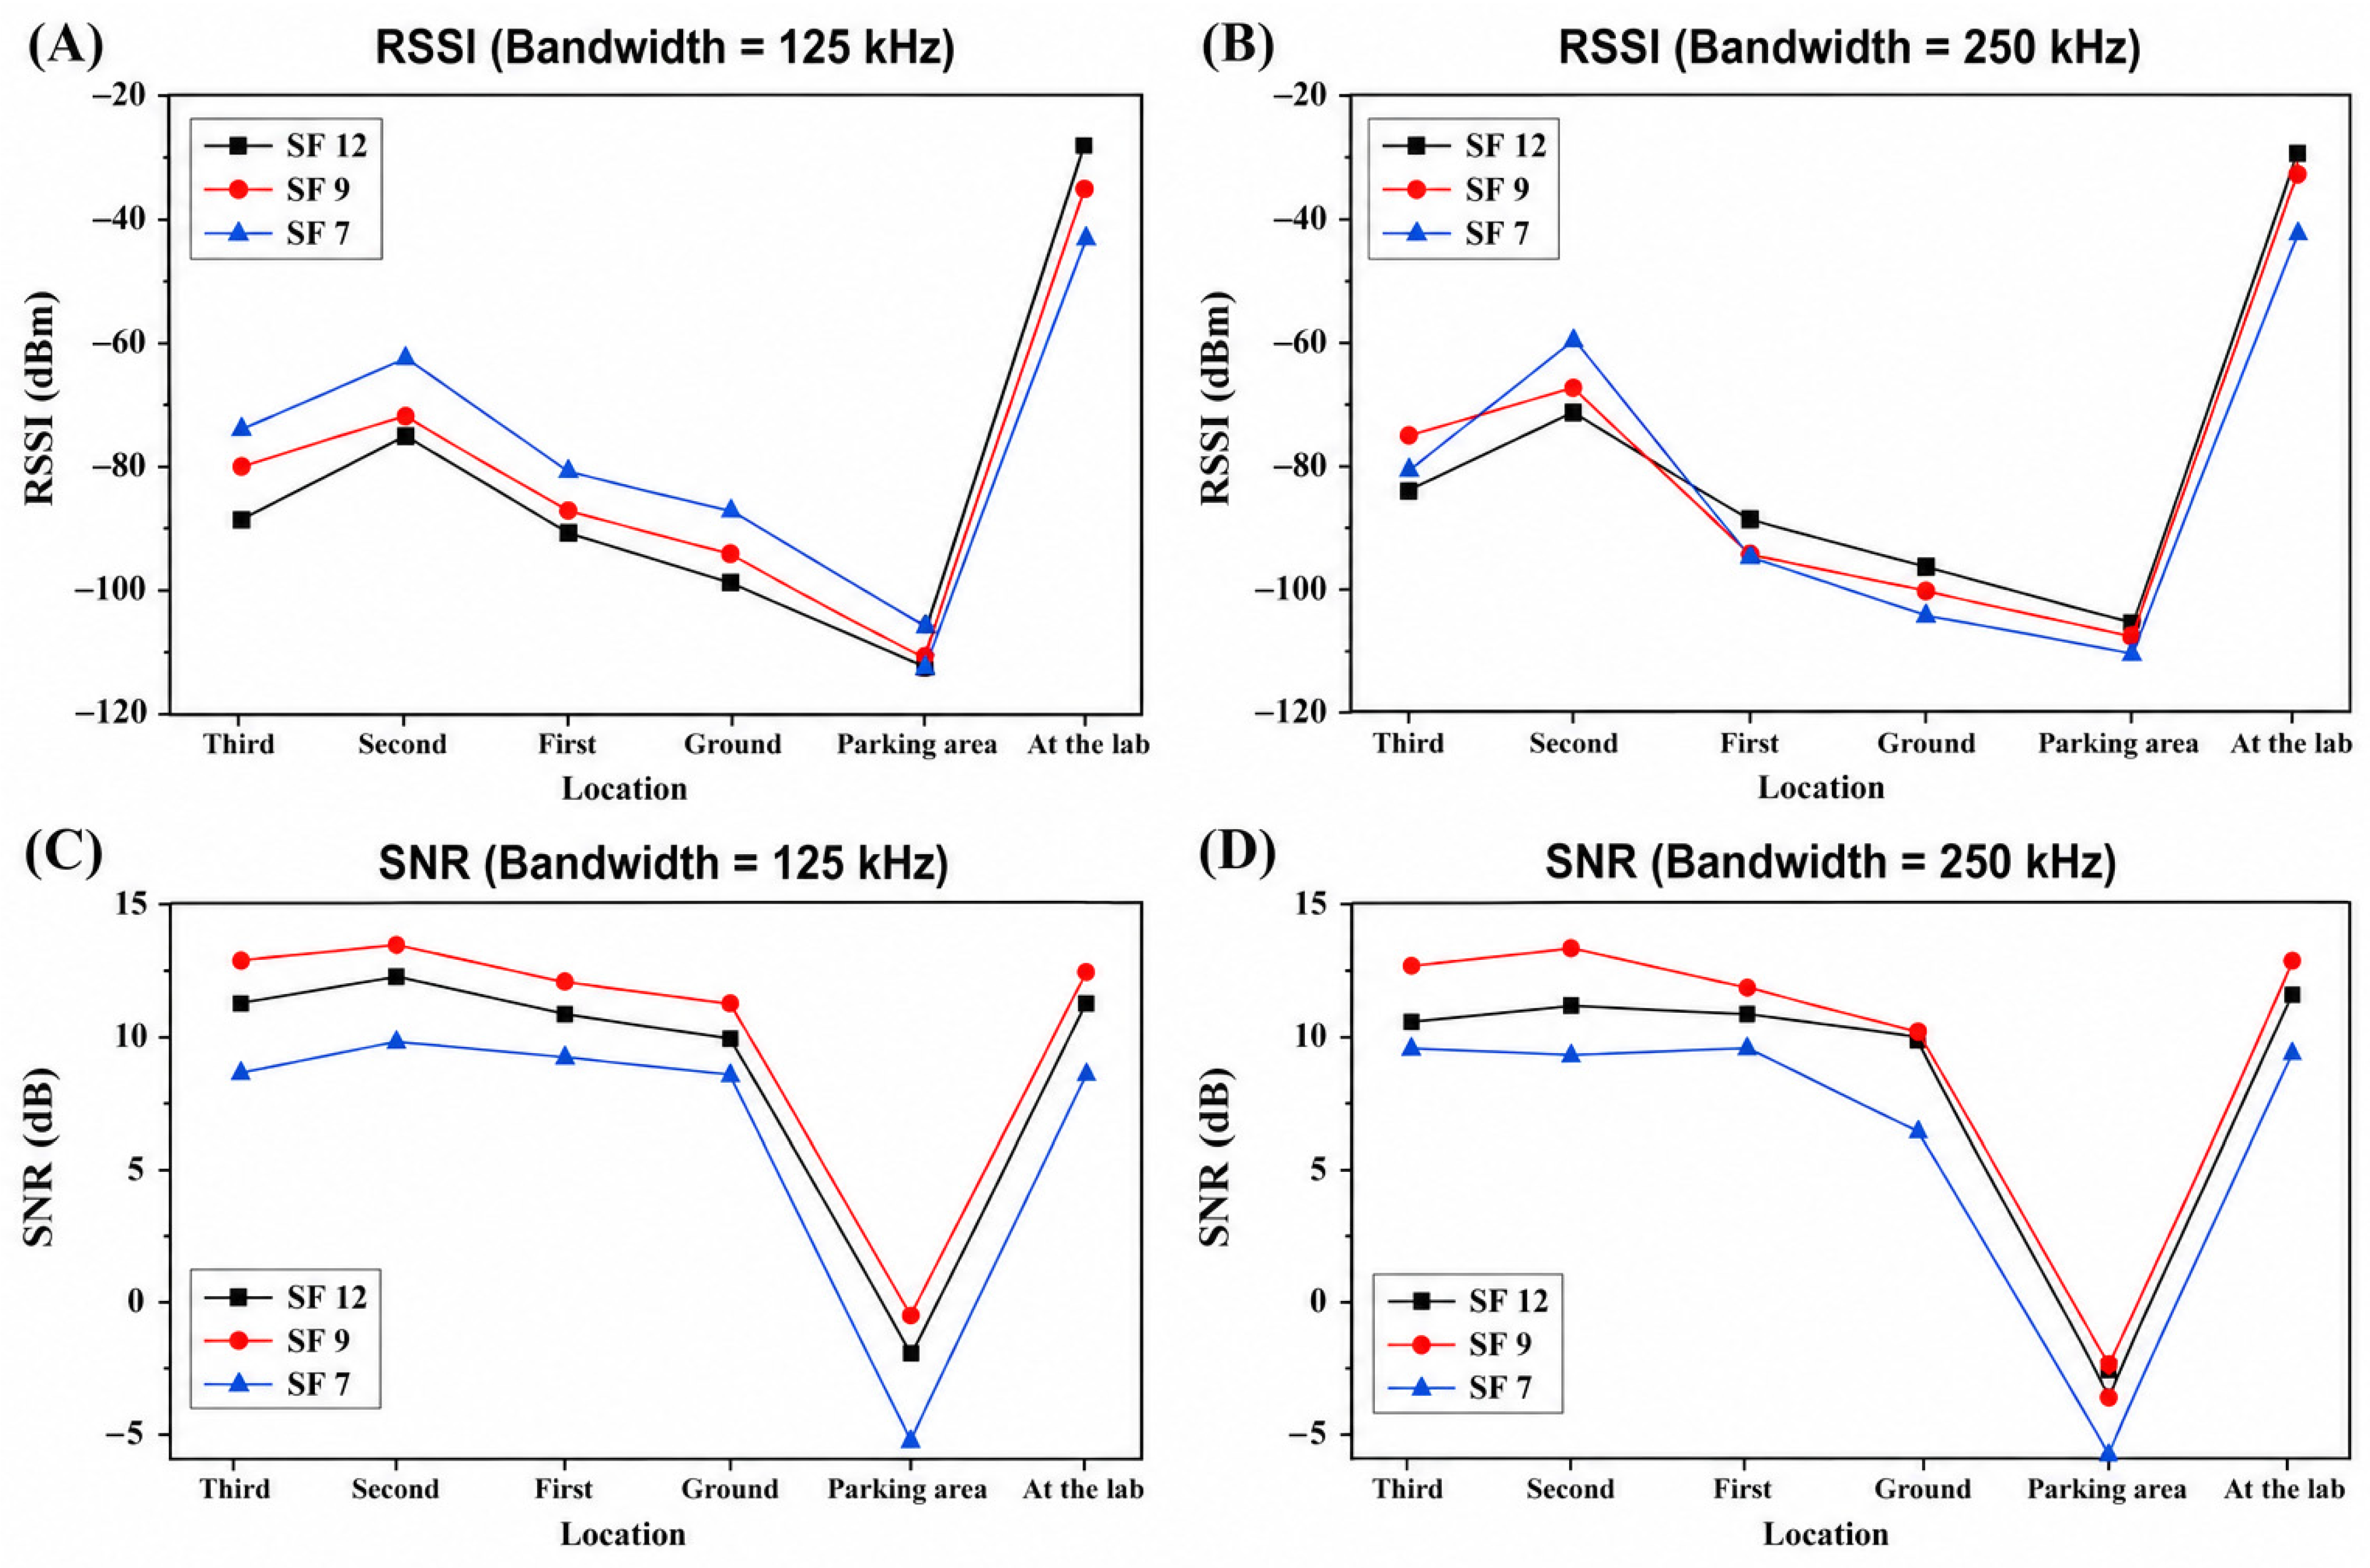
LoRa module testing was performed indoors at the Department of Mechatronics and Automation campus, Faculty of Engineering, University of Szeged, and various parameters were evaluated. The departmental building with a lab and underground parking area is shown in Figure 6. RSSI, as one of the most important parameters for examining signal strength under various conditions, was studied and shown in Figure 7 and Figure 8. The RSSI value demonstrates strong dependence on factors such as indoor location, spreading factor (SF), and Bandwidth (BW). As expected in the different scenarios, the highest RSSI value was recorded in the laboratory environment, where the transmitter and receiver modules had a clear line of sight and the distance between the nodes was short. However, the lowest RSSI was observed in the parking area, where the distance between the nodes was greatest and structural attenuation was largest. The selected spreading factors such as SF7, SF9, and SF12 represent low-, medium-, and high-sensitivity operating modes of LoRa communication and were selected to experimentally investigate the trade-off between communication range, receiver sensitivity, and transmission time for hydrogen monitoring applications.
Figure 6.
Building where an indoor LoRa communication study was performed (Department of Mechatronics and Automation, Faculty of Engineering, University of Szeged).
Figure 7.
Comparison of Received Signal Strength Indicator (RSSI) and Signal-to-Noise Ratio (SNR) measured at different locations (Third, Second, First, Ground, Parking area, and Laboratory) for spreading factors SF7, SF9, and SF12 under different communication bandwidths. (A,B) shows the variation in RSSI (dBm) at bandwidths of 125 kHz and 250 kHz, while the (C,D) presents the corresponding SNR (dB) performance at 125 kHz and 250 kHz, illustrating the influence of spreading factor, bandwidth, and measurement location on LoRa communication performance.
Figure 8.
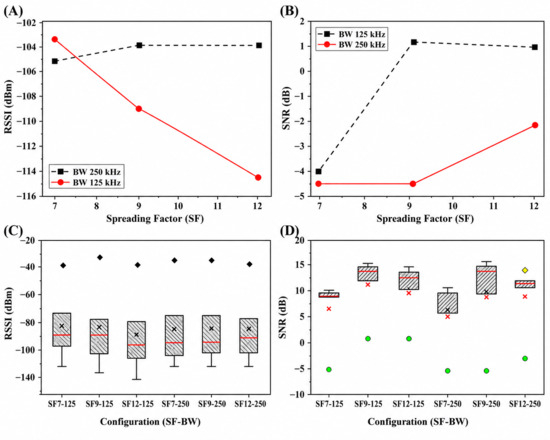
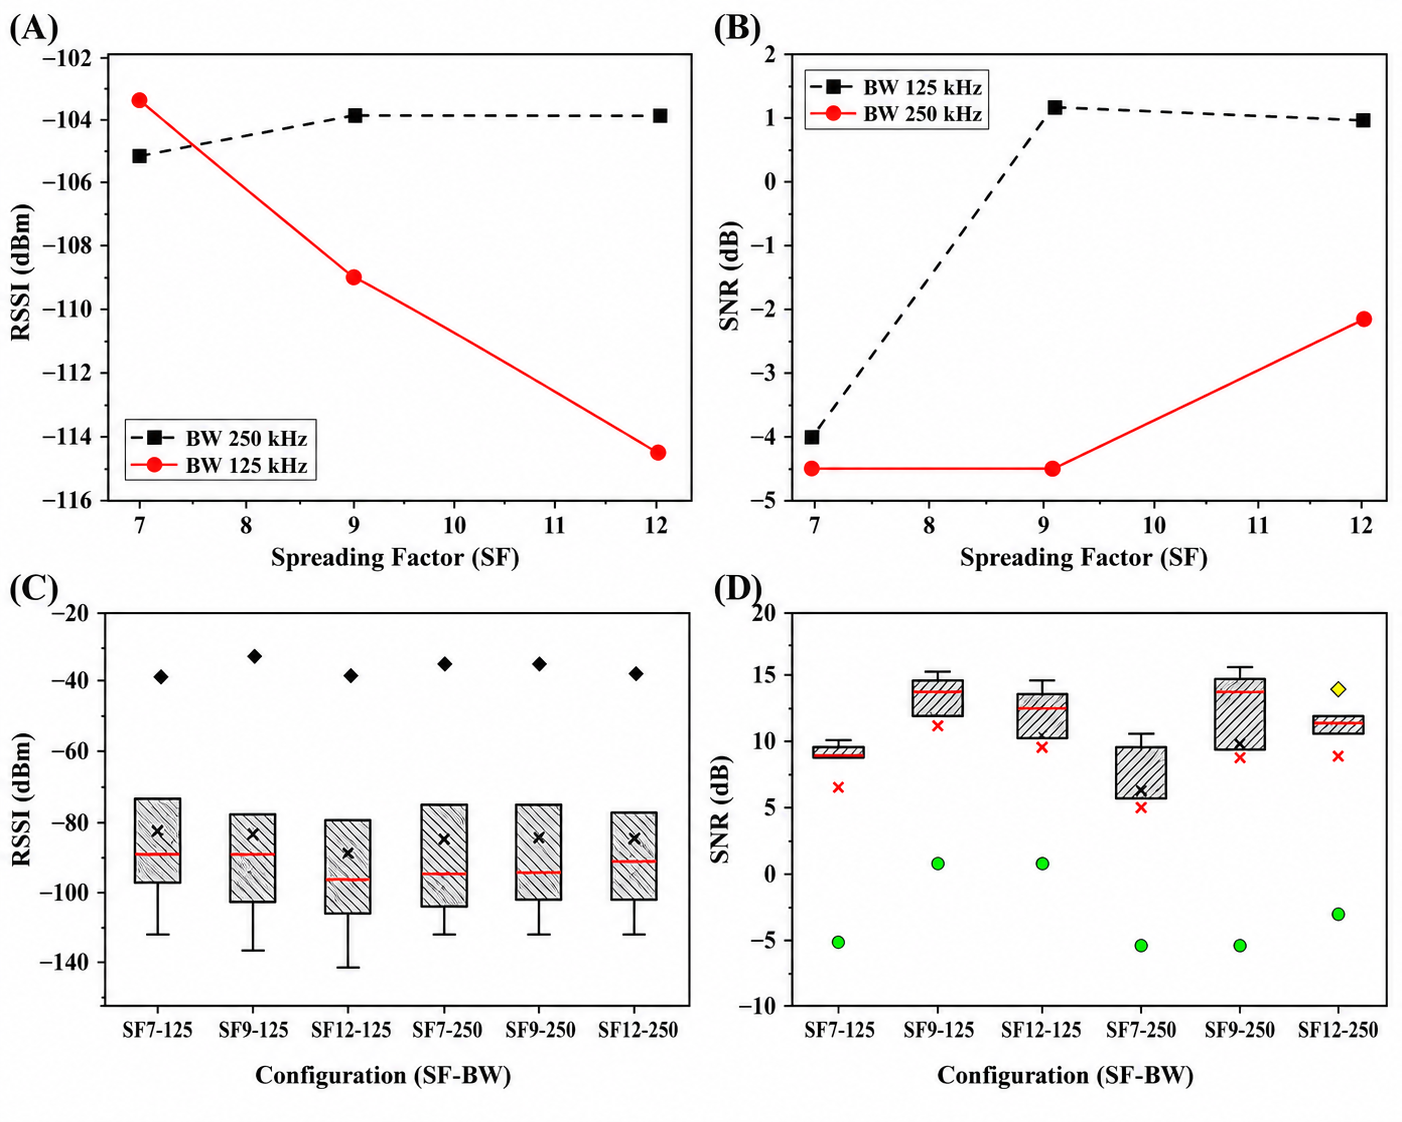
Statistical analysis of LoRa communication performance for different spreading factors (SF7, SF9, and SF12) and bandwidth settings (125 kHz and 250 kHz). (A) Variation in RSSI (dBm) with spreading factor for both bandwidths. (B) Corresponding SNR (dB) variation as a function of spreading factor. (C) Boxplot representation of RSSI distribution for all SF–bandwidth combinations, illustrating median, spread, and outliers. (D) Boxplot analysis of SNR distribution for the corresponding configurations, highlighting the statistical variation and comparative communication performance under different LoRa transmission parameters.
For different values of BW and SF, we still observed that the RSSI degradation is prominent as the distance between nodes increases and as the number of obstacles between them increases. The parking area consistently showed a poor RSSI value below −100 dBm, confirming signal loss during propagation due to the reinforced concrete structure. Higher SF marginally improved the RSSI value; however, environmental conditions and structural attenuation were found to dominate over parameter selection.
3.1.2. SNR Analysis
Signal-to-noise ratio (SNR) measurements provide deeper insight into link reliability, and their study is shown in Figure 8 and Figure 9. For a BW of 125 kHz, both SF 9 and SF 12 showed positive SNR values in almost all indoor areas, including the parking area. However, SF 7 exhibits a slightly negative SNR (−4.1 dB) at the parking area, indicating that the lower SF is struggling a bit under such deep indoor conditions with a higher barrier on the path.
Figure 9.
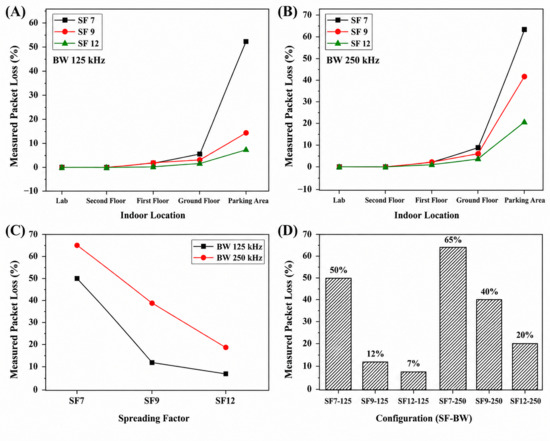
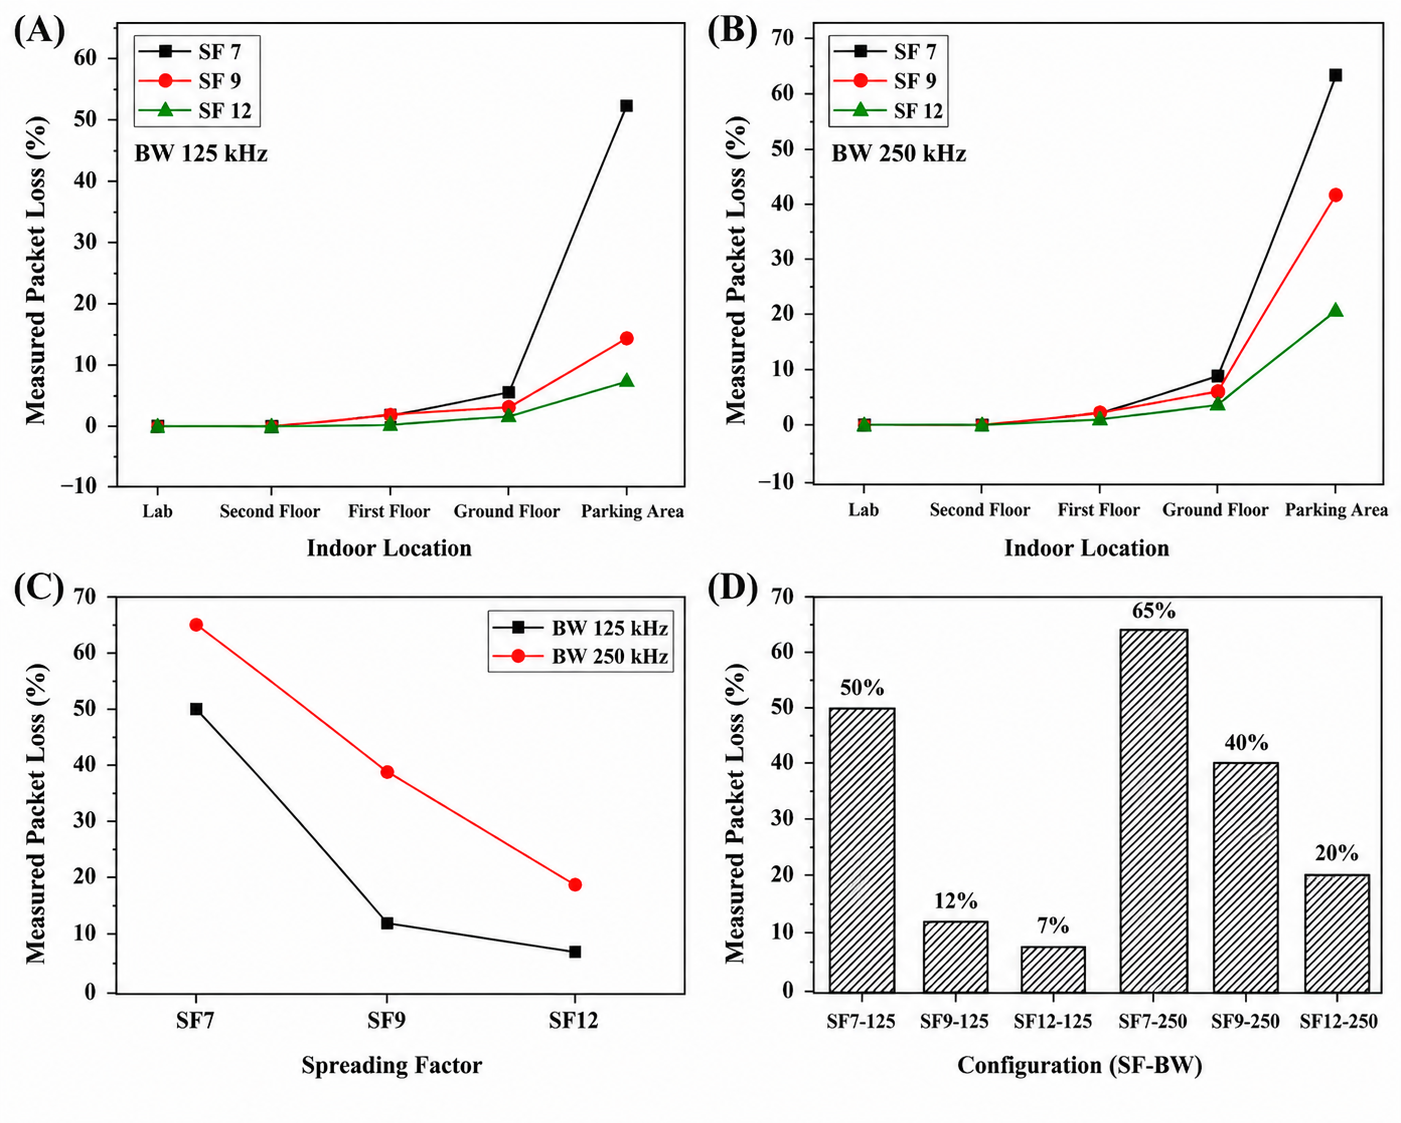
Analysis of measured packet loss (%) in LoRa communication under different spreading factors (SF7, SF9, and SF12) and bandwidth configurations (125 kHz and 250 kHz) across multiple indoor locations. (A) Variation in measured packet loss at 125 kHz bandwidth from the laboratory to the parking area for different spreading factors. (B) Corresponding packet loss behavior at 250 kHz bandwidth. (C) Comparative effect of spreading factor on packet loss for both bandwidths, highlighting the reduction in packet loss with increasing spreading factor. (D) Bar chart summarizing the overall measured packet loss for all SF–bandwidth combinations, providing a comparative assessment of communication reliability under different transmission settings.
Furthermore, at a higher BW of 250 kHz, a noticeable reduction in SNR was observed across all SF values. At higher BW, in the parking area, all SF values showed a negative SNR value. This shows a decrease in the LoRa module’s sensitivity at higher bandwidth values. In conclusion, SF 12 showed better performance in terms of SNR, confirming its suitability for dense, harsh indoor conditions.
3.1.3. Measured Packet Loss Performance
Packet loss was directly measured by transmitting packets containing an incremental sequence number and comparing the expected sequence numbers with those successfully received at the receiver, and is shown in Figure 9. Missing sequence numbers were counted as lost packets. RSSI and SNR were recorded independently and were not used to calculate packet loss. The results indicate very low packet loss (<5%) in most indoor environments at BW = 125 kHz, specifically for SF9 and SF12. However, in the parking area, recorded packet loss was significantly higher. For BW = 125 kHz, the recorded packet loss was approximately 40%, while for SF9 and SF12, it was around 15–20%.
At a higher bandwidth value (BW = 250 kHz), the packet loss increases rapidly for SF = 7 and SF = 9, whereas the packet loss for SF = 12 remains almost similar. These results show the trade-off between bandwidth efficiency and reliability in the indoor operation of LoRa modules. It should be noted that the packet loss values are measured values to provide a comparative assessment of link performance under different experimental conditions. They represent directly measured packet delivery ratios obtained from packet transmission statistics.
3.1.4. Impact of Spreading Factor and Bandwidth Trade-Offs
The experimental results confirm that increasing the spreading factor (SF) improves communication reliability in harsh, dense indoor conditions, at the expense of data rate and time-in-air.
On the contrary, bandwidth improves data throughput but reduces receiver sensitivity, leading to higher packet loss in non-line-of-sight communication. From a wireless system perspective, SF-7 delivers good performance for near-end node or line-of-sight communication. However, SF 9 offers balanced performance. SF 12 is better for harsh or dense indoor conditions.
3.1.5. Practical Implications for Indoor LoRa Communication Deployment
Adjustment of the spreading factor and bandwidth can significantly reduce packet loss and optimize network capacity. For deep indoor locations, operating at BW = 125 kHz with higher spreading factors is best to ensure reliable communication.
3.2. LoRa Communication Outdoor Testing
3.2.1. Outdoor RSSI and SNR Behavior Across Directions
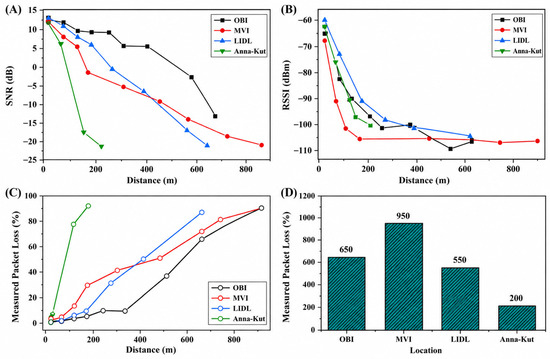
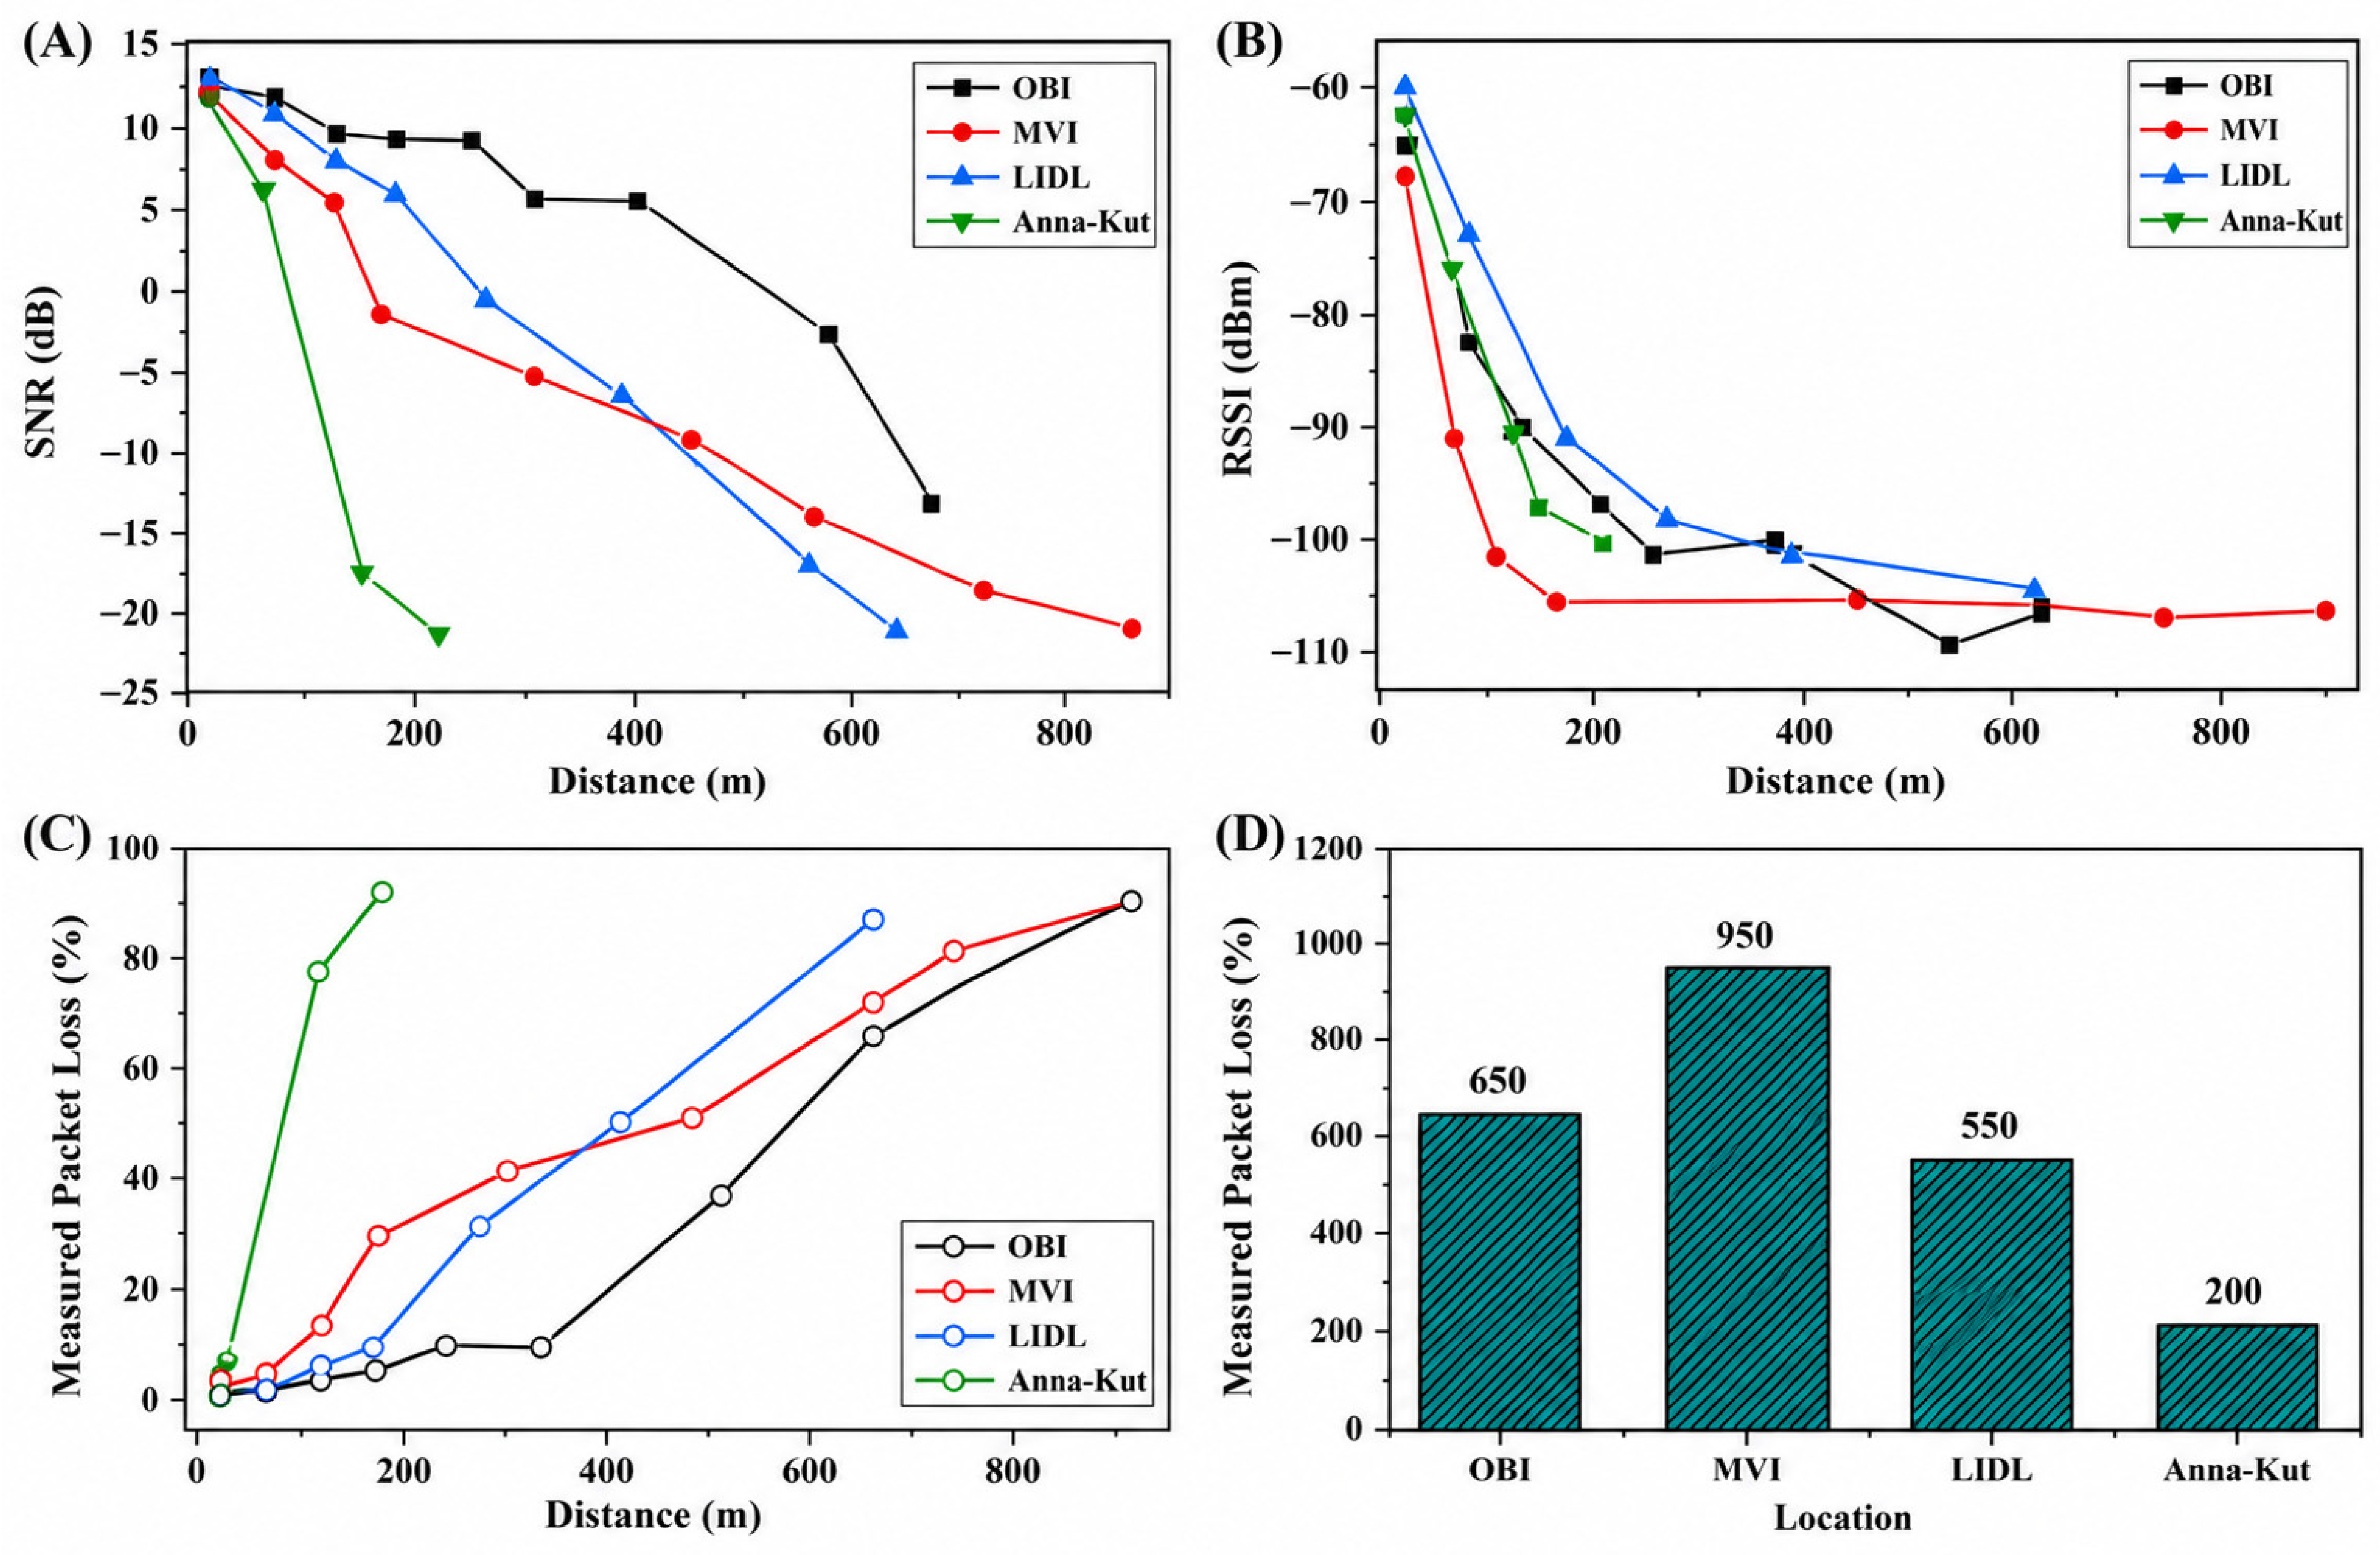
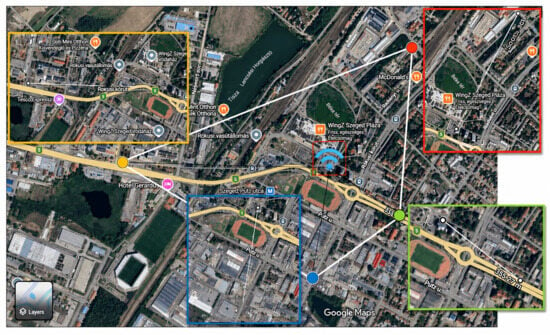
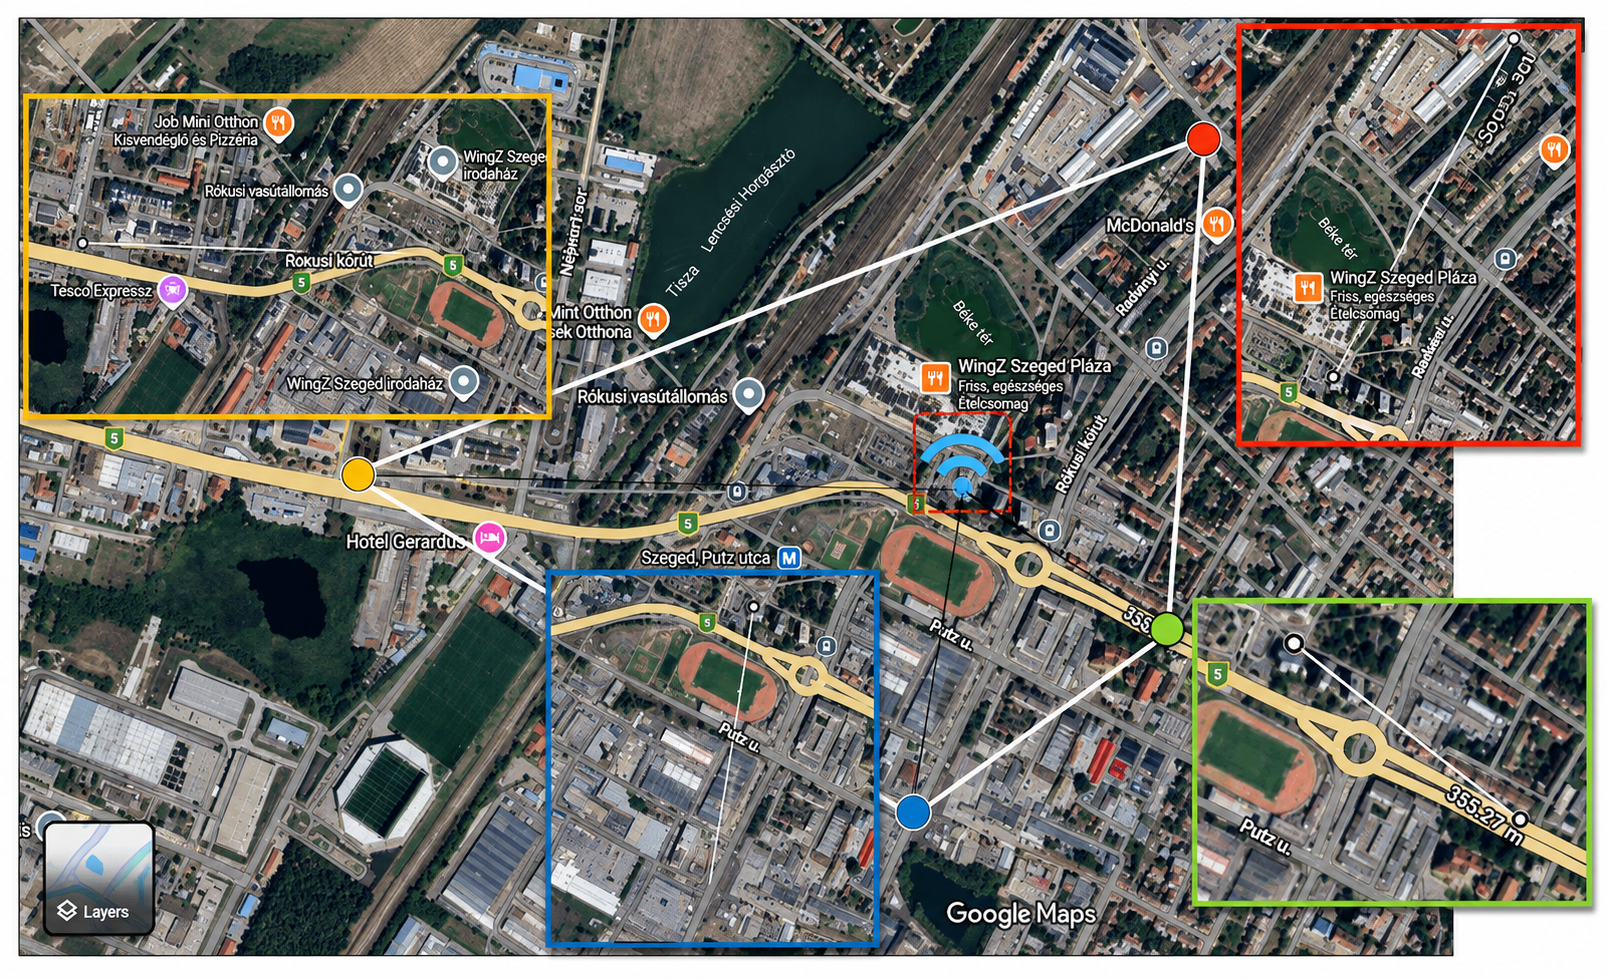
The outdoor LoRa communication range measurement revealed strong terrain dependency. The findings are shown in Figure 10. At the same transmission settings, such as SF 12 and BW 125 kHz, noticeable variations in parameters, such as RSSI, SNR, Packet loss, and range, were recorded for all measured readings, corresponding to all different directions denoted by their nearby landmarks, namely OBI, MVI gas station, LIDL, and Anna-Kut. Amongst all the directions, the direction towards MVI achieved the longest range of communication. Figure 11 shows the more detailed Google map view of the area along with different terrains such as vegetation, buildings, roads, etc. The packets were successfully decoded up to approximately 950 m from the end node, which was placed on the seventh-floor balcony of a ten-story residential building. In contrast, the Anna-Kut side showed poor signal reception; the signal was lost, and the reliable communication distance was measured at 250 m. The possible reason for this could be the two 10-story buildings facing the building where the end node was placed. This measurement indicates that the outdoor LoRa communication range is anisotropic and highly dependent on environmental morphology, including building density, street orientation, vegetation, and other nearby wireless communication devices.
Figure 10.
Performance evaluation of long-range LoRa communication at different measurement routes (OBI, MVI, LIDL, and Anna-Kut) as a function of transmission distance. (A) Variation in signal-to-noise ratio (SNR, dB) with increasing distance. (B) Corresponding received signal strength indicator (RSSI, dBm) measured over distance. (C) Measured packet loss (%) as a function of transmission distance for different routes, illustrating communication reliability under varying propagation conditions. (D) Maximum achievable communication distance for each measurement route, highlighting the coverage performance of the LoRa system in different outdoor environments.
Figure 11.
Map pointing out the area in Szeged, Hungary, covered by this study. MVI (yellow), LIDL (blue), OBI (red), and Anna-kut (green). Source: Google Maps, adapted by the authors.
SNR, along with RSSI data, helps study link stability over the range. The RSSI alone suggests a loss of signal strength with distance; however, SNR provides more information to predict the range behavior more accurately. SNR’s negative value was recorded even after a 150–250 m range in some directions (towards Anna-Kut). Yet, packet reception remained possible because of LoRa’s strong chirp spread spectrum (CSS) modulation scheme. However, at very low SNR values below its threshold, packet reception reliability degraded rapidly, leading to packet loss.
3.2.2. Outdoor Packet Loss Estimation and Reliability Zones
Packet loss was experimentally evaluated using packet sequence numbers transmitted over the LoRa communication link. A single sensor reading together with an incremental packet number was transmitted every 1 s for approximately 30 min. The receiver continuously monitored the received packet sequence numbers, RSSI, and SNR. Packet loss was determined from the number of missing sequence numbers relative to the expected packet sequence. Each experiment was repeated three to four times, and the reported packet-loss values represent the average communication performance observed under the tested conditions. Towards the OBI direction, the packet loss was recorded as less than 5% up to 350 m, indicating stable communication and reliable data transmission and reception. Beyond this range, packet loss increased rapidly, and at about 650 m, it exceeded 70%, indicating the reliable coverage boundary. After expanding the range, data transmission becomes impractical due to data reception instability. The possible reason for this packet loss is the surrounding environment, including dense vegetation and a parking area with multiple cars.
As measured, the MVI direction has the largest range, up to 950 m; reliable packet delivery was observed within this range. Packet loss of less than 10% was observed in some instances for short durations, which could be due to interface issues, a moving vehicle, or a high-traffic train line nearby. Similar patterns were observed in the LIDL direction, where packet loss exceeded 25% beyond 250 m. The Anna-Kut direction showed the harshest communication environment, where packet loss exceeded 70% at a distance of only 150 m, which shows strong dependency on signal interference.
The outcome clearly depicts the relation between the maximum achievable range and reliable coverage with the least packet loss. To achieve a better, longer-range practical approach to pacing, the modules must be considered.
3.2.3. Directional Path Loss and Environmental Impact
The observed RSSI trends deviate from free-space path loss models, indicating the presence of significant shadowing and multipath effects. The smooth decrement in the RSSI towards the OBI direction suggests a semi-LoS environment, which is true. Whereas the sudden decay in the RSSI value towards the Anna-Kut direction shows strong obstruction, signal blockage, and a non-LoS communication path. The following outdoor study depicts that the signal strength is highly anisotropic in nature, and direction-aware measurements are essential to accurately capture real-world coverage behavior. The outdoor measurements presented in this study are intended to evaluate practical route-level communication performance under representative urban deployment conditions. The observed differences among the four measurement routes reflect the combined influence of the surrounding propagation environment, including building density, vegetation, street orientation, and other environmental features. The present work does not attempt to isolate or quantify the attenuation introduced by individual obstacles, as such an analysis would require dedicated propagation measurements and environmental modeling beyond the scope of this study.
3.3. Effect of Temperature and Humidity on LoRa Communication Reliability
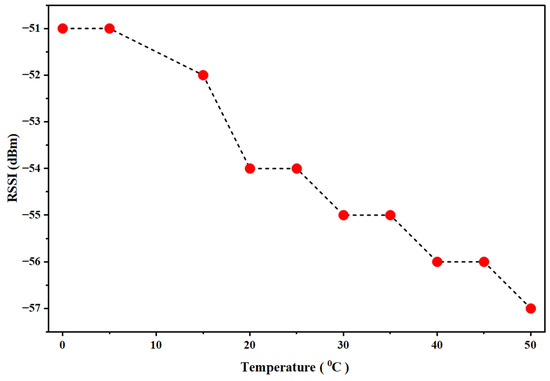
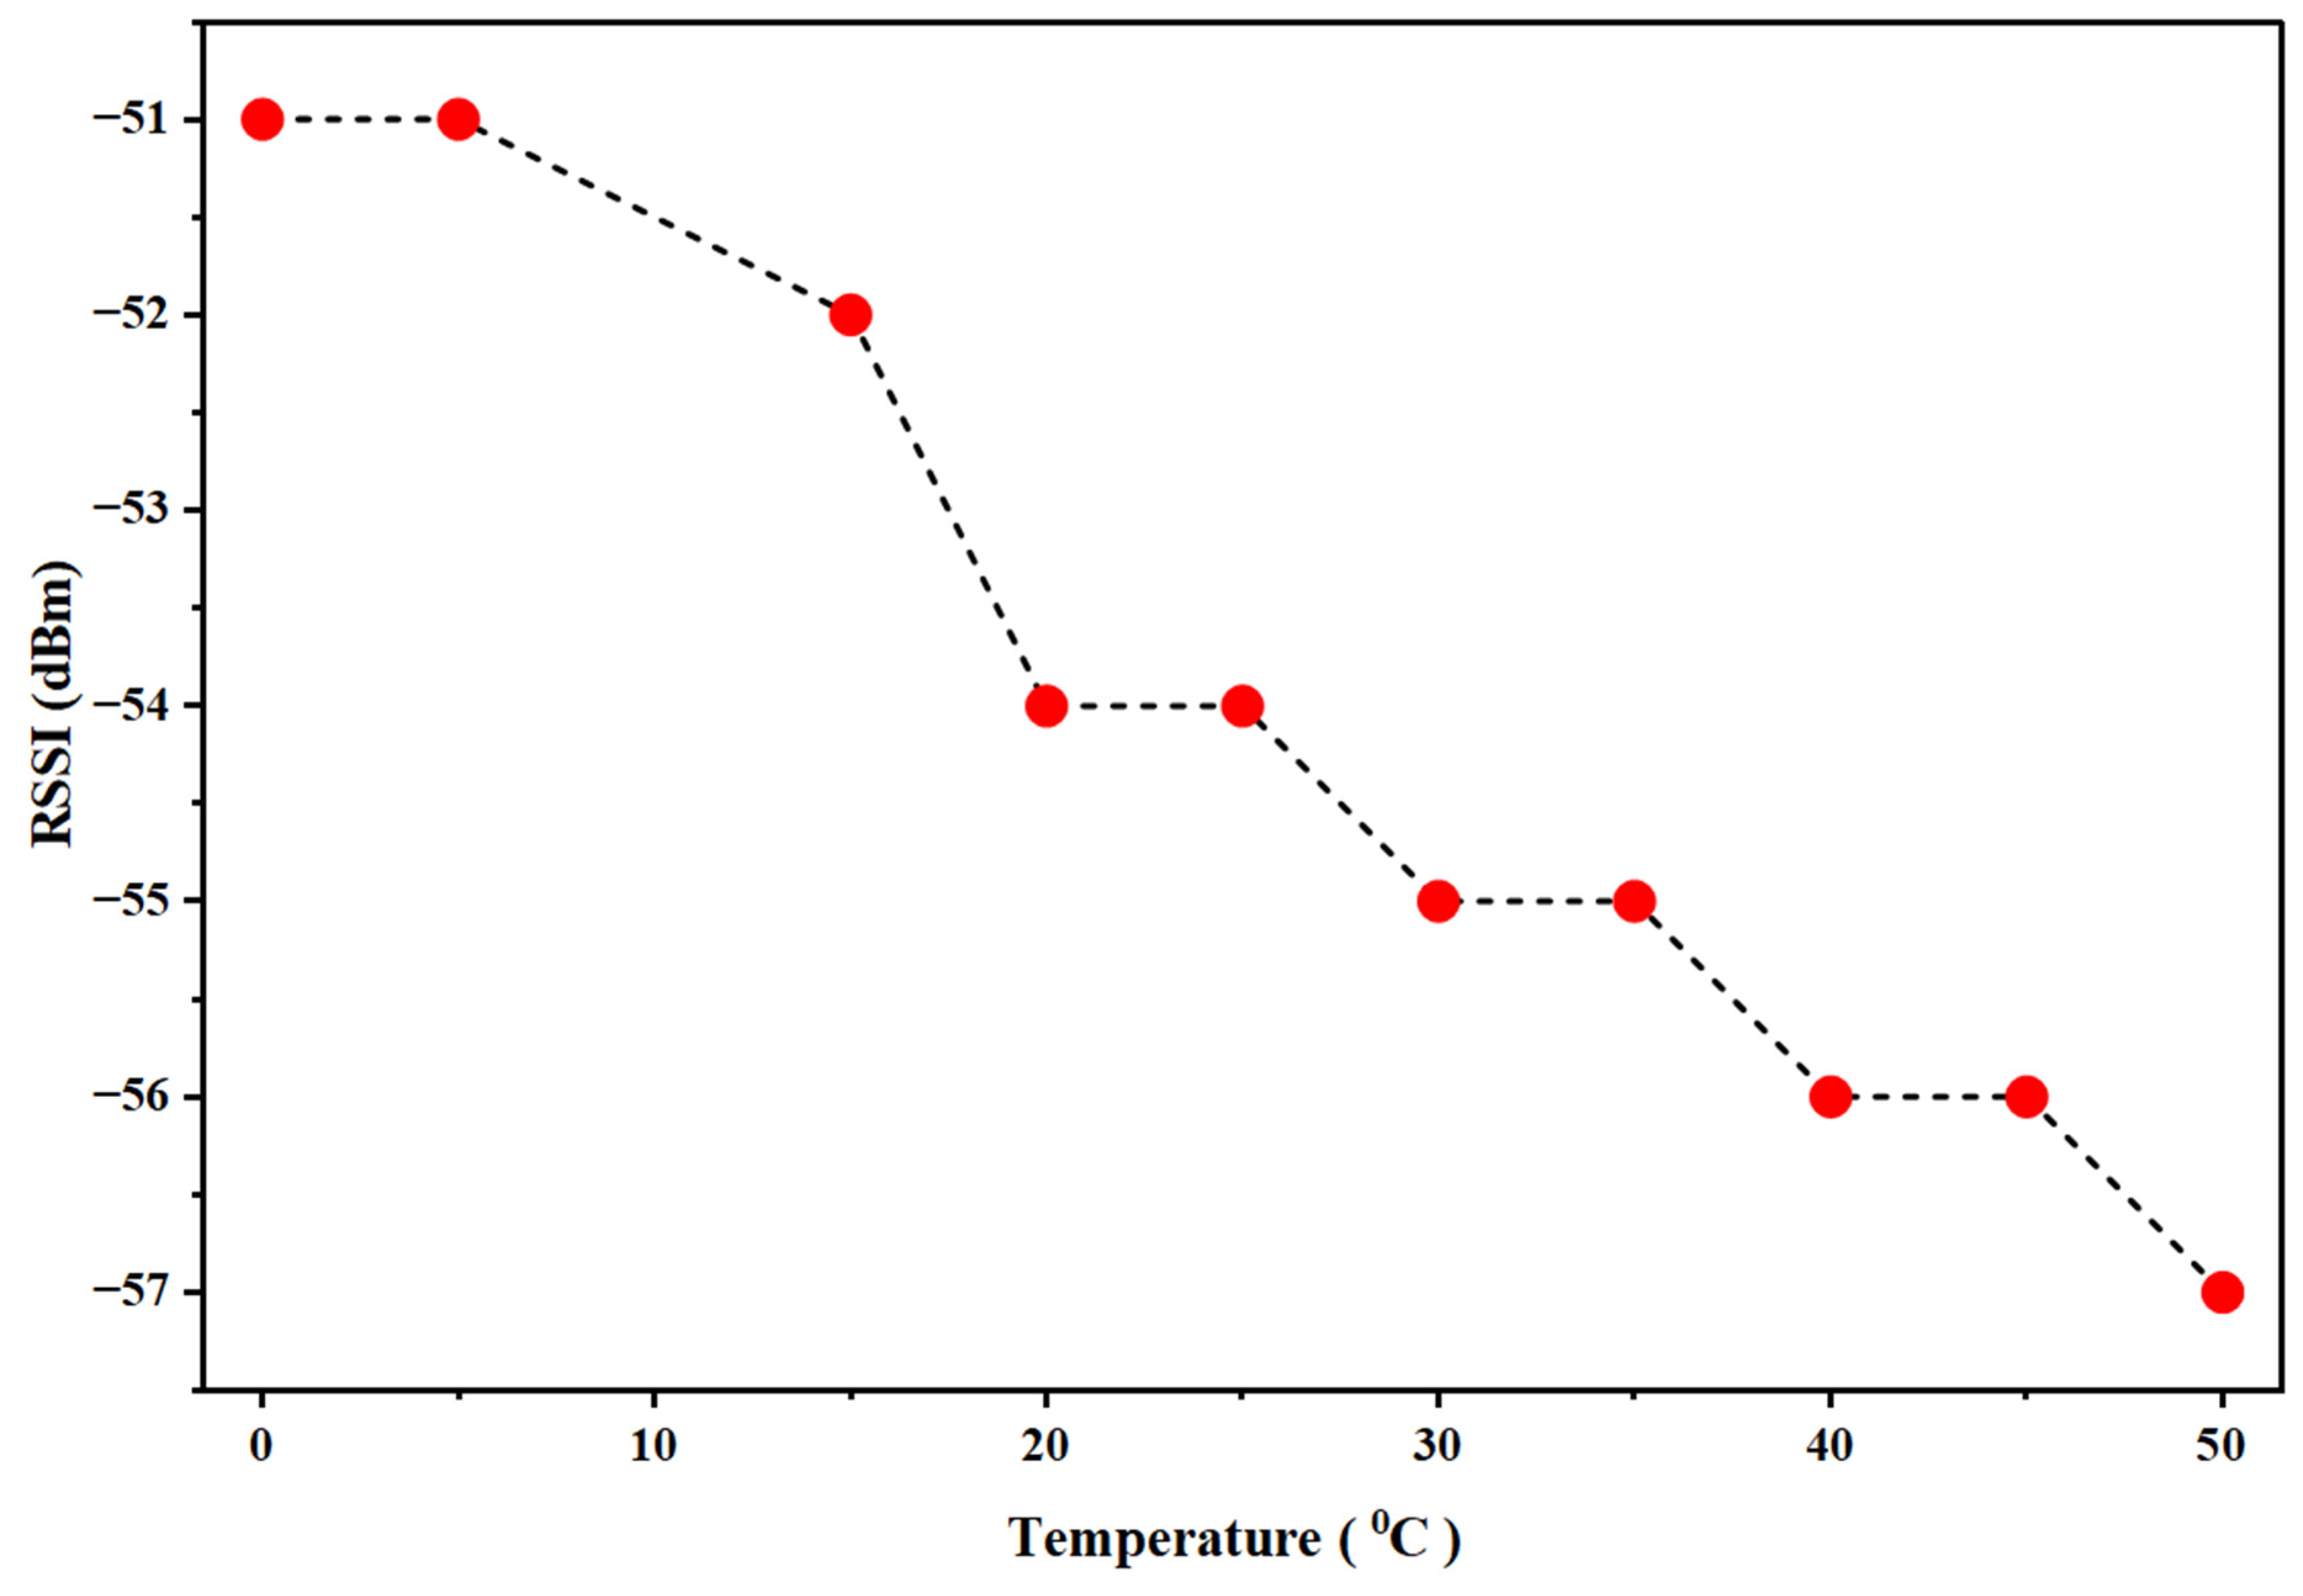
LoRa communication was tested for different temperatures, and the relative change in the RSSI was recorded and shown in Figure 12. Temperature variations are known to affect the performance of wireless sensor networks and have been studied by researchers [26]. The preliminary measurements suggest measurements were performed over a temperature range from 0 to 50 degrees C. The temperature change was achieved by placing the LoRa transceiver module first into the cold atmosphere for about 30 min when it reached the value below zero degree after than LoRa transceiver was kept inside the close setup on top of the heater which can slowly increase the temperature near LoRa module up to 50 degree C and corresponding value of RSSI has been recorded which shows that there is small increment in the RSSI, i.e., the RSSI reduces as we increase the temperature however the increment is not so significant and can be taken care of by putting the sensor at the place which is approximately 10–20% lower than its maximum RSSI limit to avoid any data loss. Humidity variation was also tested; however, we did not observe any significant change in the RSSI value. There might be only a 1% change when the DHT sensor value progresses from 0% to 100% RH. The preliminary measurements indicate a gradual trend in RSSI variation with temperature under the laboratory conditions employed in this study. However, comprehensive characterization under controlled environmental conditions with repeated measurements is required before general conclusions regarding temperature and humidity effects can be drawn.
Figure 12.
Variation in Received Signal Strength Indicator (RSSI) with temperature over the range of 0–50 °C. The results show a gradual decrease in RSSI from −51 dBm to −57 dBm with increasing temperature, indicating the influence of thermal conditions on wireless signal propagation and communication link performance.
3.4. Experimental Investigation of LoRa Communication Without External Antennas
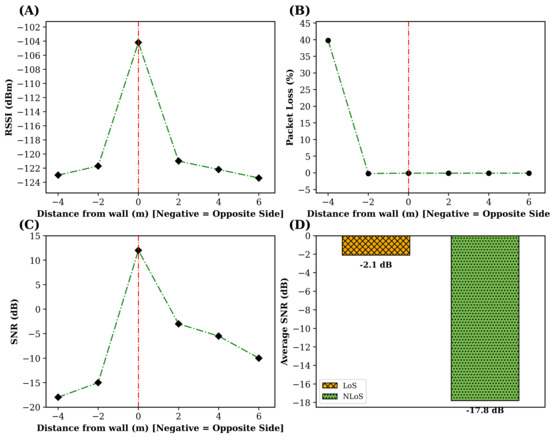
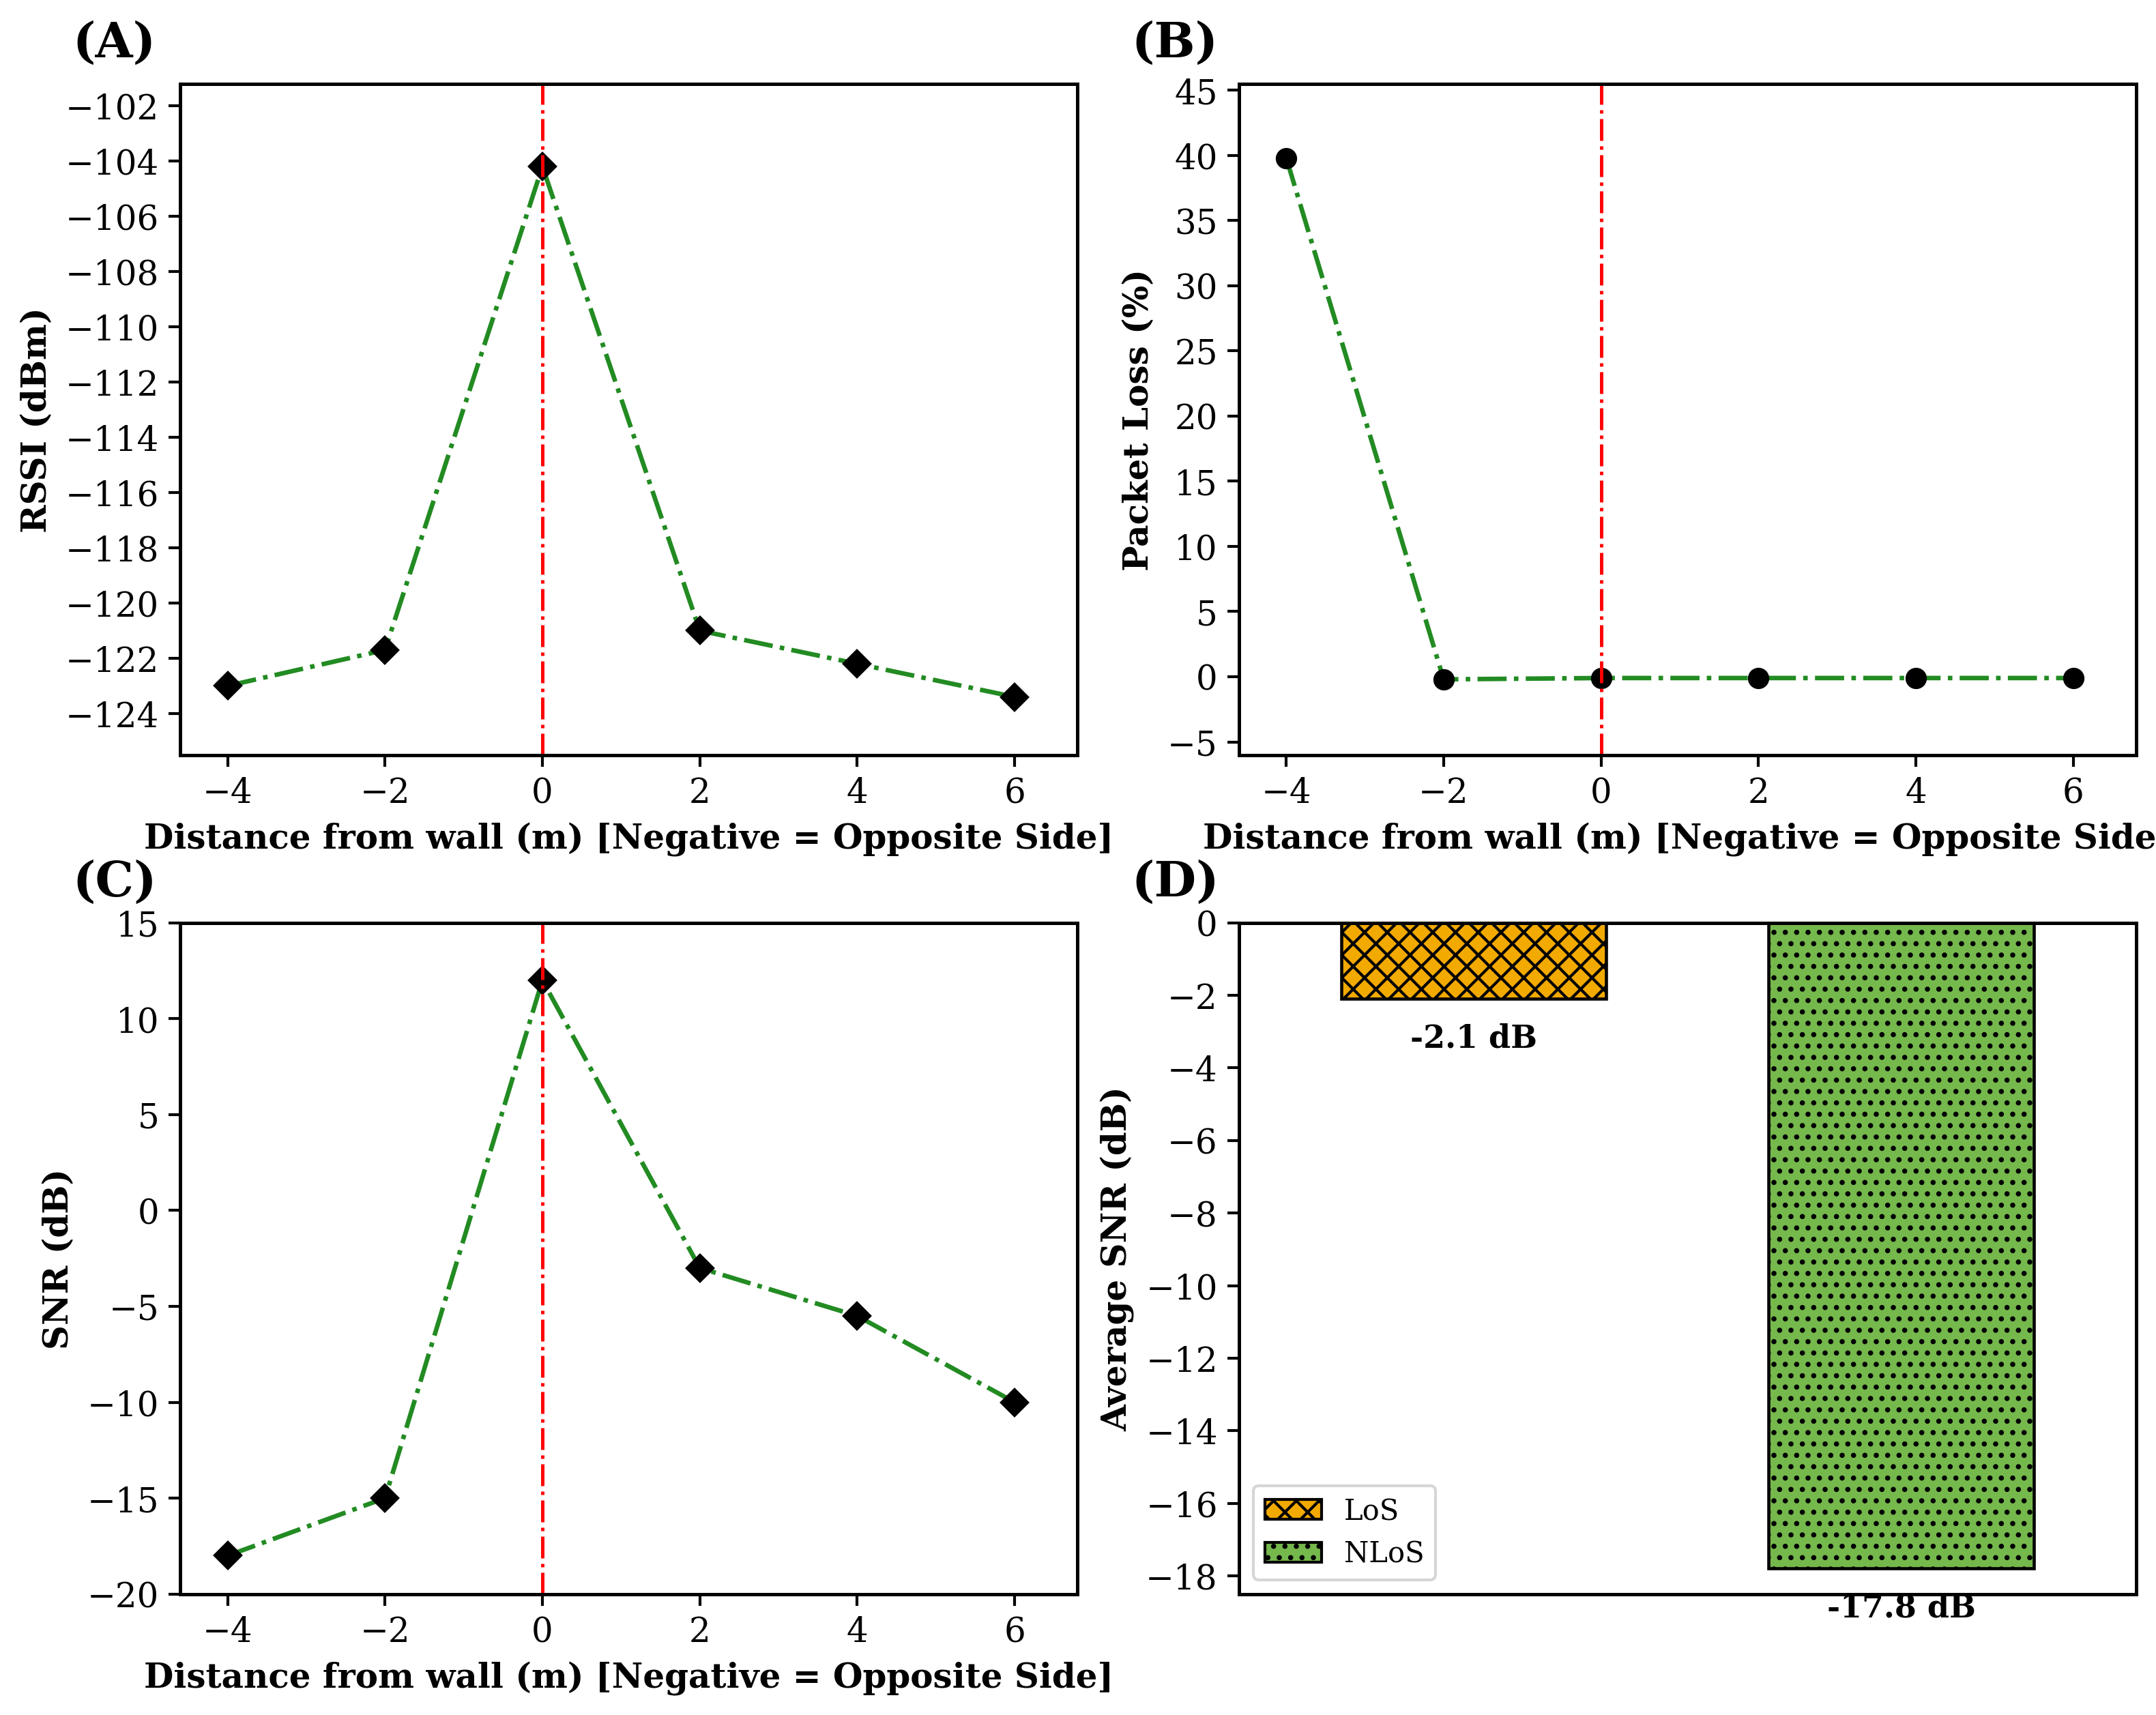
LoRa communication without an external antenna under both line-of-sight and wall obstructed condition were investigated. Even with the antenna, packet reception was observed at all the positions inside the same room. The RSSI value inside the room at different distances was recorded in the range −105 dBm to −122 dBm. Similarly, the SNR values were recorded in the range −11.25 dB. These results show a high link budget and processing gain of the LoRa modulation.
When the transmitter LoRa module was moved to the other side of the wall, attenuation in the received signal was recorded. However, successful data reception was observed at a distance of 2 m with zero packet loss. At a distance of around 4 m behind the wall, SNR approached the sensitivity threshold of approximately −20 dB, resulting in a packet loss of 20–40%. This sharp decline in performance confirms the non-linear reliability of LoRa near the threshold limit.
The following result is shown in Figure 13, demonstrating that the RSSI alone is not enough to predict the link reliability, as packet reception remained unobstructed even at lower RSSI levels, i.e., −120 dBm. However, SNR dominated the data reception by governing packet loss at a higher value. These findings emphasize LoRa communication’s robustness in severely constrained RF conditions and suggest potential applicability in emergency, embedded, or antenna-limited deployments.
Figure 13.
Analysis of LoRa signal propagation across a wall obstruction, where negative distances represent measurements taken on the opposite side of the wall. (A) Variation in RSSI (dBm) with distance from the wall, showing the attenuation caused by wall penetration. (B) Corresponding measured packet loss (%) as a function of distance, indicating link degradation under non-line-of-sight (NLoS) conditions. (C) Variation in SNR (dB) with distance from the wall, highlighting the impact of obstruction on signal quality. (D) Comparison of average SNR under Line-of-Sight (LoS) and Non-Line-of-Sight (NLoS) conditions, demonstrating the significant reduction in communication performance due to wall-induced attenuation.
4. Hydrogen Gas Sensing Setup and Calibration
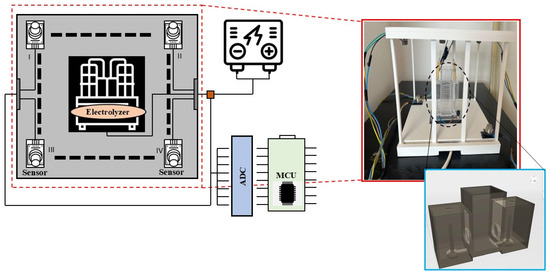
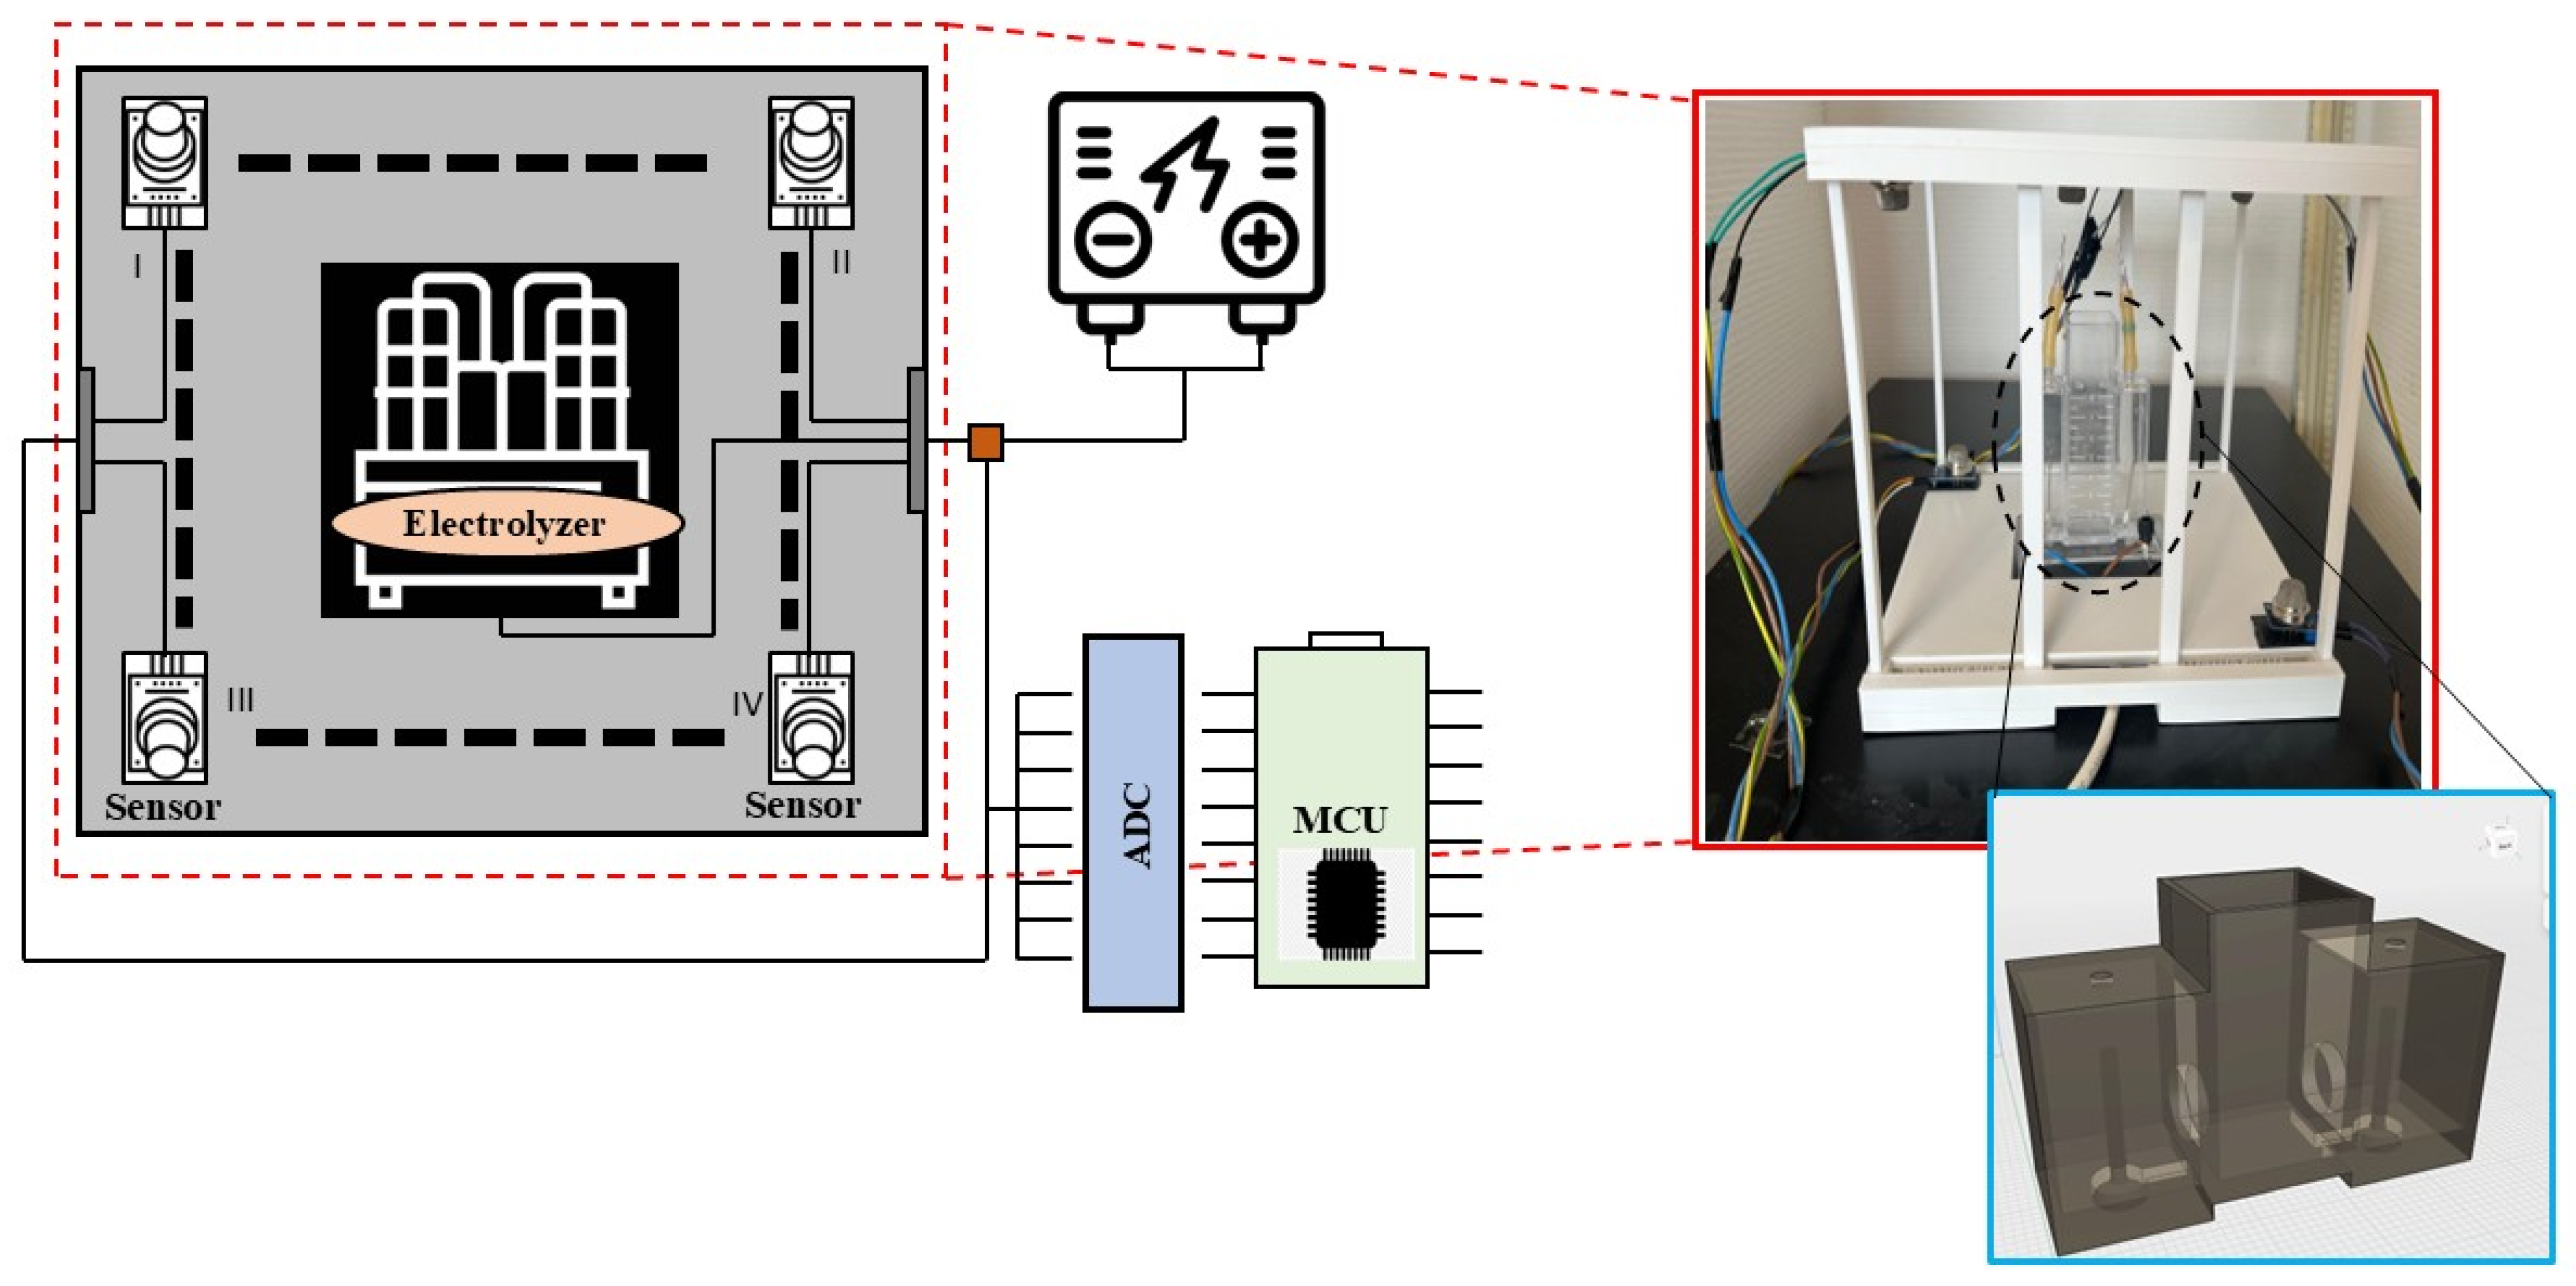
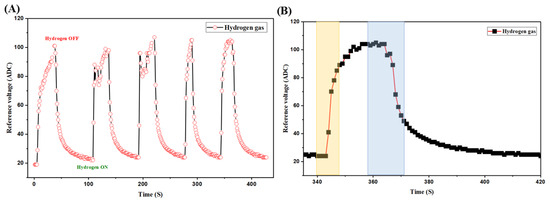
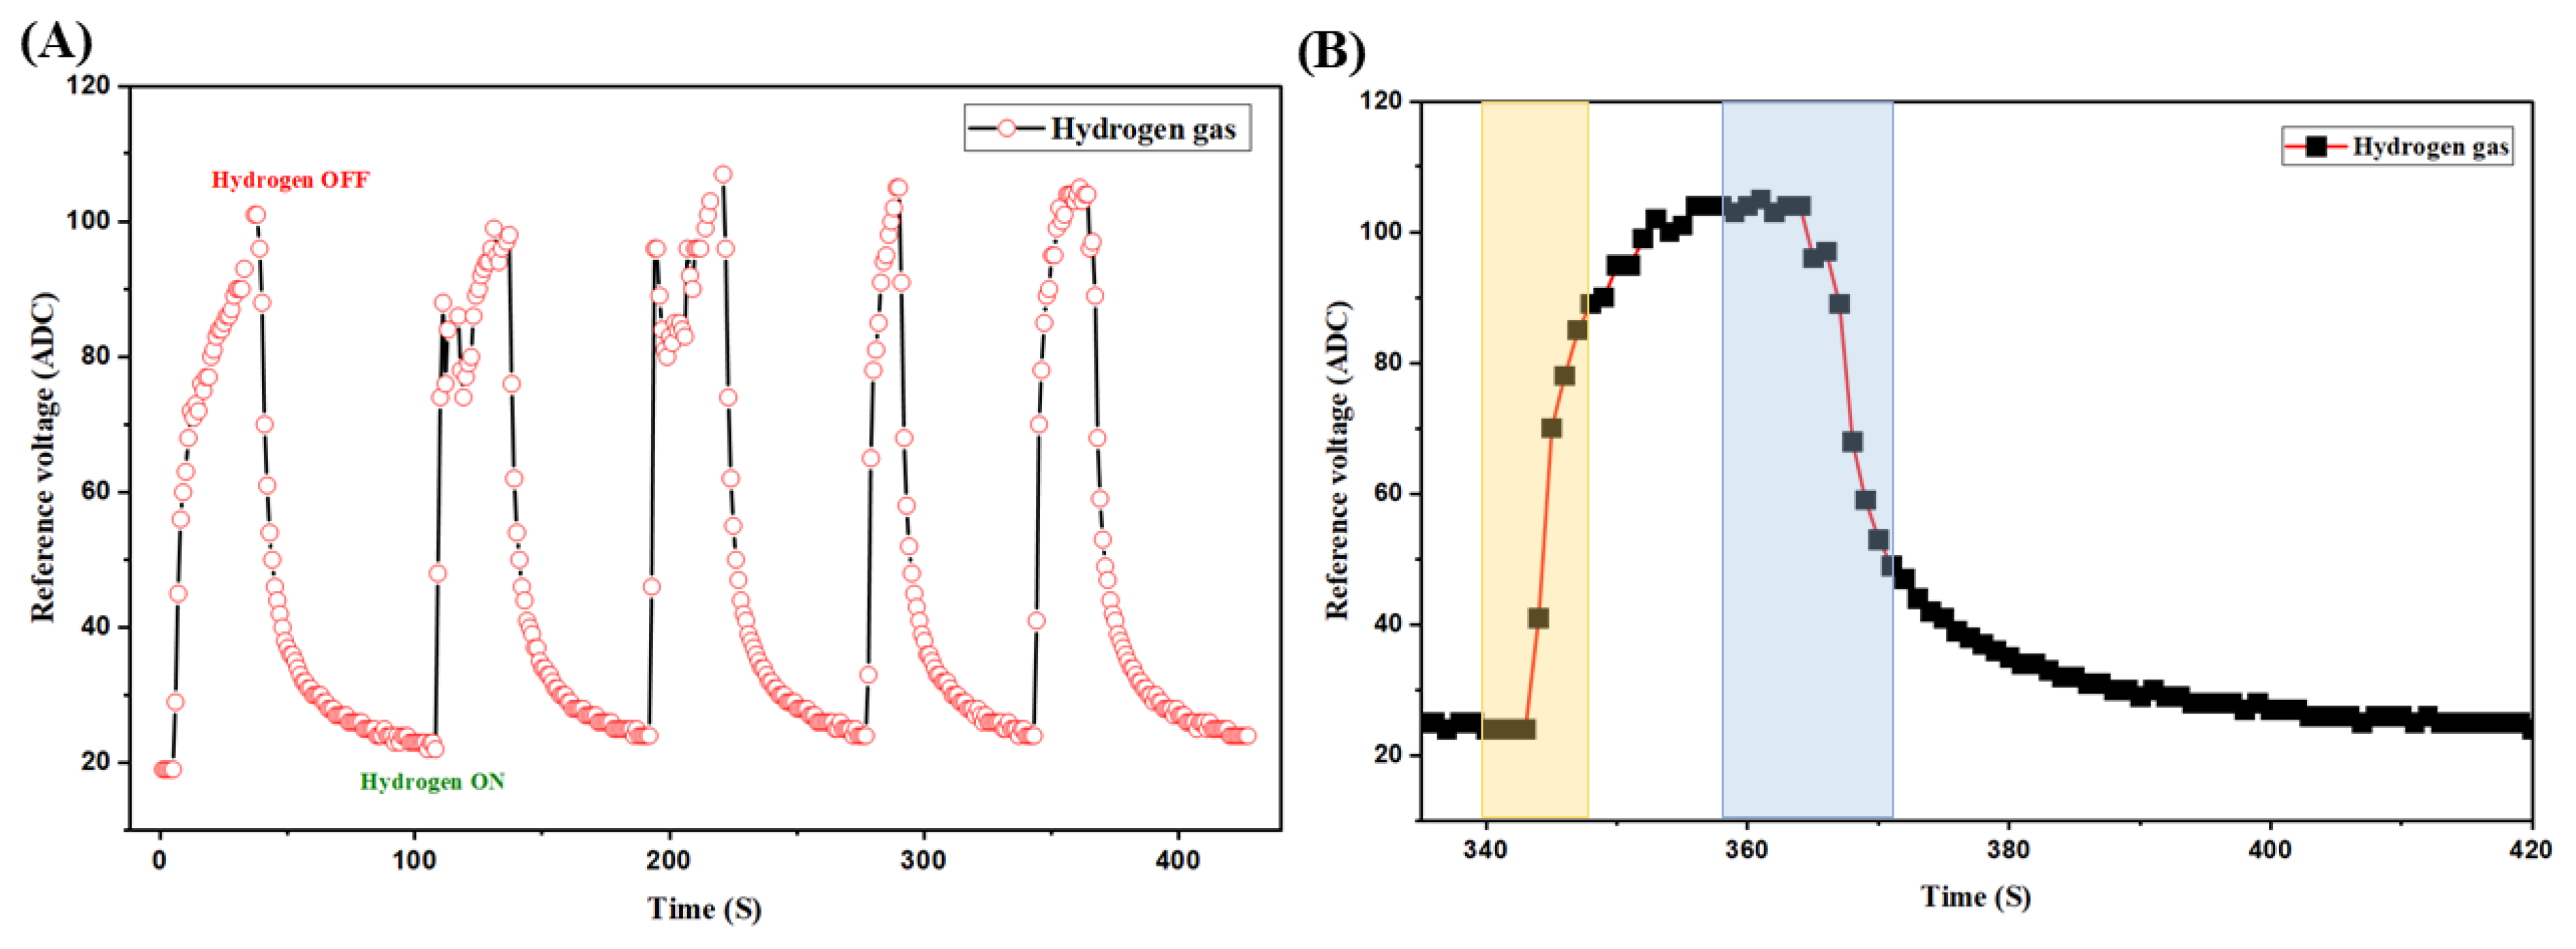
The gas sensor modules were calibrated using the electrolysis setup as shown in Figure 14. The gas sensor was kept in the ON position for almost 24 h. Before starting the test, as recommended by the datasheet and also in the literature. The gas sensor value was first recorded without hydrogen gas as baseline data. After that, hydrogen gas was produced using an electrolysis system, and the nozzle was kept open near the sensor head while data were recorded multiple times. Gas sensor responses in the presence and absence of hydrogen gas across multiple cycles are shown in the figure. From the figure, it is evident that the sensor output value changes drastically, making it susceptible to leakage. The base value changed from roughly 20 to 105 during the hydrogen leakage. The value regains its base value as we remove the leakage. The same cycle was repeated multiple times to assess the sensor’s reproducibility in a hydrogen atmosphere. Based on the graph, the response and recovery time, relative sensor response, and repeatability were calculated. Table 3 represents the performance parameters and their measured values.
Figure 14.
The hydrogen leakage mapping setup consists of an electrolyzer positioned at the center, with the 3D-printed electrolyzer chamber shown in the blue-boxed inset.
Table 3.
Dynamic sensing characteristics and performance metrics of the developed hydrogen gas sensor under cyclic hydrogen exposure.
The following figure shows the schematic representation of the sensor localization setup. The figure clearly shows that the experimental chamber consisted of six MQ-8 sensors, distributed across the 3D-printed chamber support at different, random coordinate positions [S1(25, 0, 0), S2(0, 25, 0), S3(0, 0, 25), S4(25, 25, 20), S5(12.5, 12.5, 20), S6(0, 25, 20)] around the electrolyzer, which was placed in the center of the overall setup. Hydrogen leakage experiments were conducted at six predefined leak positions and one no-leak condition. The sensors are connected to the microcontroller via the appropriate wiring, and power is supplied by the 5 V, 2 A charger. The center of the chamber houses a miniaturized electrolyzer system that uses water and NaOH as a catalyst, enabling faster water splitting. The electrolyzer was powered by a 12 V, 1 A power supply. As a result of water splitting, hydrogen and oxygen were generated. The hydrogen terminal was extended using a hollow pipe connected near the sensor point, allowing systematic leakage to be simulated and the sensor response to be recorded. The silica gel pack was also used in the gas line to absorb moisture in the generated hydrogen gas. The microcontroller was connected to the laptop power supply for data visualization; in addition, a separate power supply has been provided for a standalone application of the system.
Hydrogen Gas Sensor Calibration
Sensor calibration was performed for all sensors used in this work. The MQ-8 sensors were calibrated to establish a stable baseline and repeatable response under hydrogen exposure. The measured ADC values were used as relative sensor responses for machine learning-based localization and were not converted into absolute hydrogen concentrations (ppm or ppb), as quantitative gas concentration calibration was beyond the scope of this study. The sensors were exposed to the generated hydrogen gas using an in-house-designed electrolyzer system. The generated hydrogen gas can be controlled via a switch. Subsequently, sensors were exposed to the pure hydrogen gas produced, and the response and recovery times were recorded for all sensors. The recorded data for a single sensor were plotted and shown in Figure 15. From the given graph, the response and recovery times were calculated to be approximately 10–12 s and 20 s, respectively. Based on the plotted data, the sensor’s relative sensor response was determined as shown in Equation (1).
Figure 15.
Dynamic response characteristics of the hydrogen gas sensor under cyclic hydrogen exposure. (A) Real-time variation in the sensor reference voltage (ADC) during repeated hydrogen ON/OFF switching cycles, demonstrating the repeatability, stability, and reversibility of the sensing response over multiple measurement cycles. (B) Enlarged view of a single sensing cycle, highlighting the response and recovery behavior of the sensor, where the shaded regions represent the hydrogen exposure and recovery phases, respectively, illustrating the transient sensing characteristics and response dynamics of the developed hydrogen sensing system.
The relative sensor response of the sensor is defined as [1,2],
where
= baseline ADC measured in ambient air,
= sensor ADC value measured during hydrogen exposure.
5. Machine Learning Approach
The sensor at no hydrogen shows a constant ADC range of 19–20; however, upon localized hydrogen exposure, the baseline ADC value changes from a lower value to a sharp increase to 105–110. In this situation, other sensors showed a small change in the sensor value around 25–35, which is due to hydrogen gas diffusion. The performance of the system was evaluated using three distinct datasets: ideal, noisy, and a challenging overlapping dataset. The final machine learning study was performed on the overlapping dataset, which resembles the real-world hydrogen leakage behavior with possible diffusion across the nearby sensor networks. To evaluate the performance, three models were used, namely Artificial Neural Network (ANN), Support Vector Machine (SVM), and Random Forest (RF).
5.1. Machine Learning Model Development
The proposed hydrogen leakage localization problem was formulated as a multi-class classification task using the responses of six MQ-8 hydrogen sensors as the input features. Before model training, the sensor readings were standardized using the StandardScaler, which transforms each feature to have zero mean and unit variance. Feature standardization was applied to the Artificial Neural Network (ANN) and Support Vector Machine (SVM) models, whereas the Random Forest (RF) classifier was trained on the original sensor values, as tree-based algorithms are insensitive to feature scaling.
In order to carry out a thorough and fair assessment, 5-fold stratified cross-validation was used. The entire dataset was split into five subsets of approximately equal size, with care being taken to maintain the class distribution. In each iteration, four of the folds (80%) were employed for training and one fold (20%) for testing. The procedure was carried out five times, and the final result was given as the mean ± standard deviation for all the validation folds.
The artificial neural network (ANN) model included six input neurons corresponding to MQ-8 sensor readings, a single hidden layer with 10 neurons utilizing the rectified linear unit (ReLU) activation function, and an output layer applying the SoftMax activation function for multi-class classification. The network was optimized using the Adam optimizer, with a maximum of 2000 training iterations and a fixed random seed of 42 to ensure reproducibility.
The support vector machine (SVM) classifier utilized a radial basis function (RBF) kernel with a regularization parameter of C = 1.0 and a kernel coefficient of γ = scale. The random forest classifier comprised 300 decision trees and applied the Gini impurity criterion with bootstrap sampling enabled. All machine learning models were initialized with a random seed of 42 to ensure consistency and reproducibility. Unless otherwise specified, default hyperparameter settings from the scikit-learn library were used, with only the parameters explicitly reported in this study being modified.
The performance of the proposed models was evaluated using accuracy, precision, recall, and F1-score, providing a comprehensive assessment of the hydrogen leakage localization capability under various leakage conditions.
Because multiple observations were collected sequentially during individual experimental runs, temporal correlation between consecutive observations cannot be completely excluded. Experimental-run-level grouping was not implemented in the present study; therefore, the reported results should be interpreted within the adopted sample-level 5-fold cross-validation framework.
All three models were evaluated based on their accuracy and prediction. Among the three models, the ANN achieved the highest classification performance, with an average accuracy of 88.13 ± 2.43%, followed by the SVM (85.00 ± 3.70%) and the Random Forest (84.38 ± 3.23%). The higher precision, recall, and F1-score achieved by the ANN indicate its superior ability to learn nonlinear spatial relationships among the six MQ-8 sensor responses under overlapping hydrogen leakage conditions. The relatively small standard deviations across the five folds demonstrate that the proposed models exhibit stable and consistent performance. The overall performance obtained is shown in Table 4.
Table 4.
Summary of the classification performance of the ANN, RF, and SVM models based on the 5-fold stratified cross-validation results.
5.2. Confusion Matrix Analysis
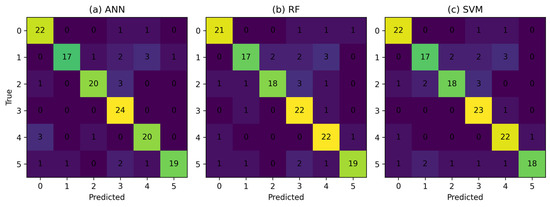
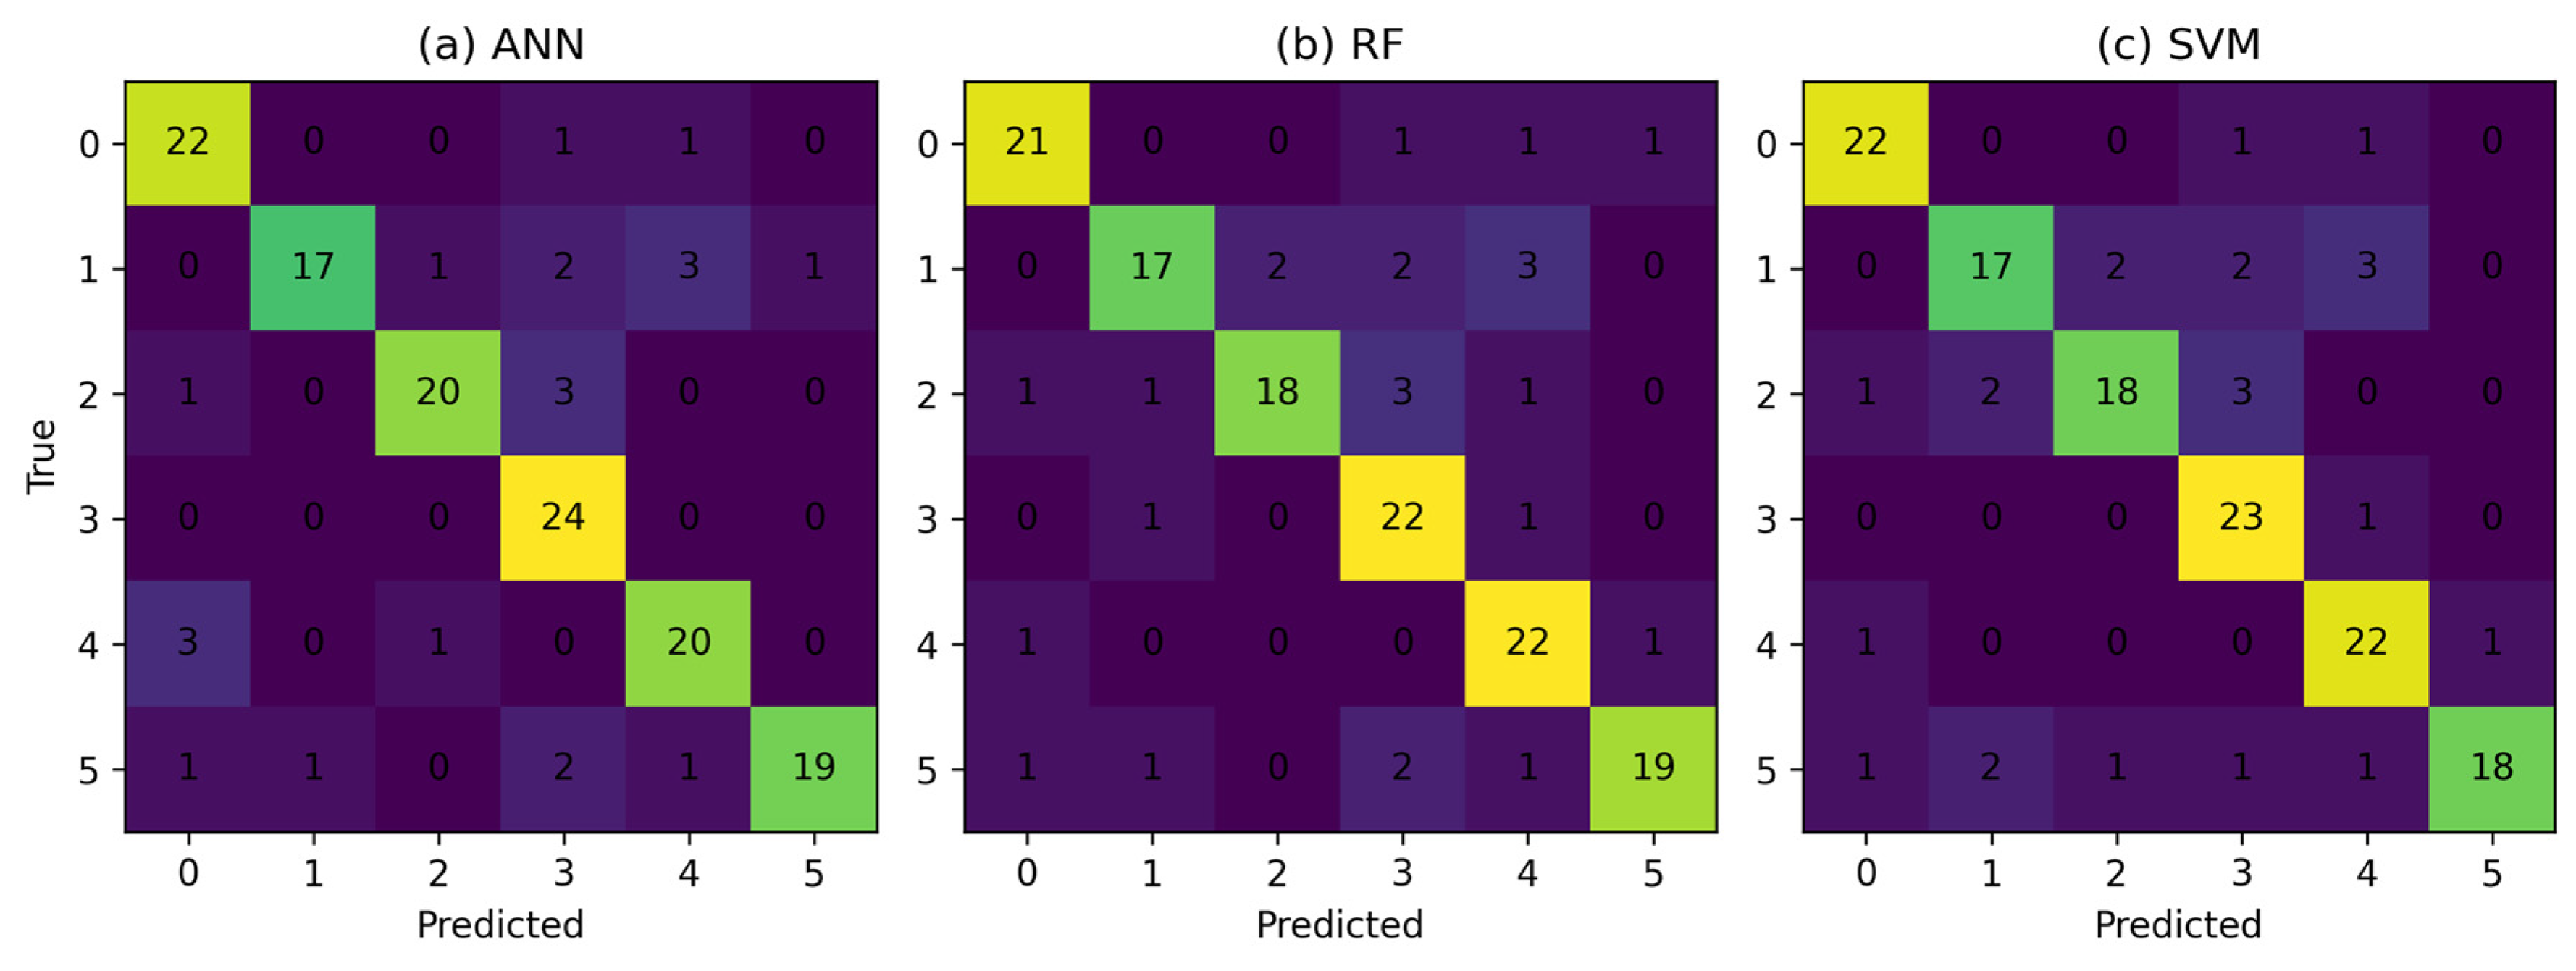
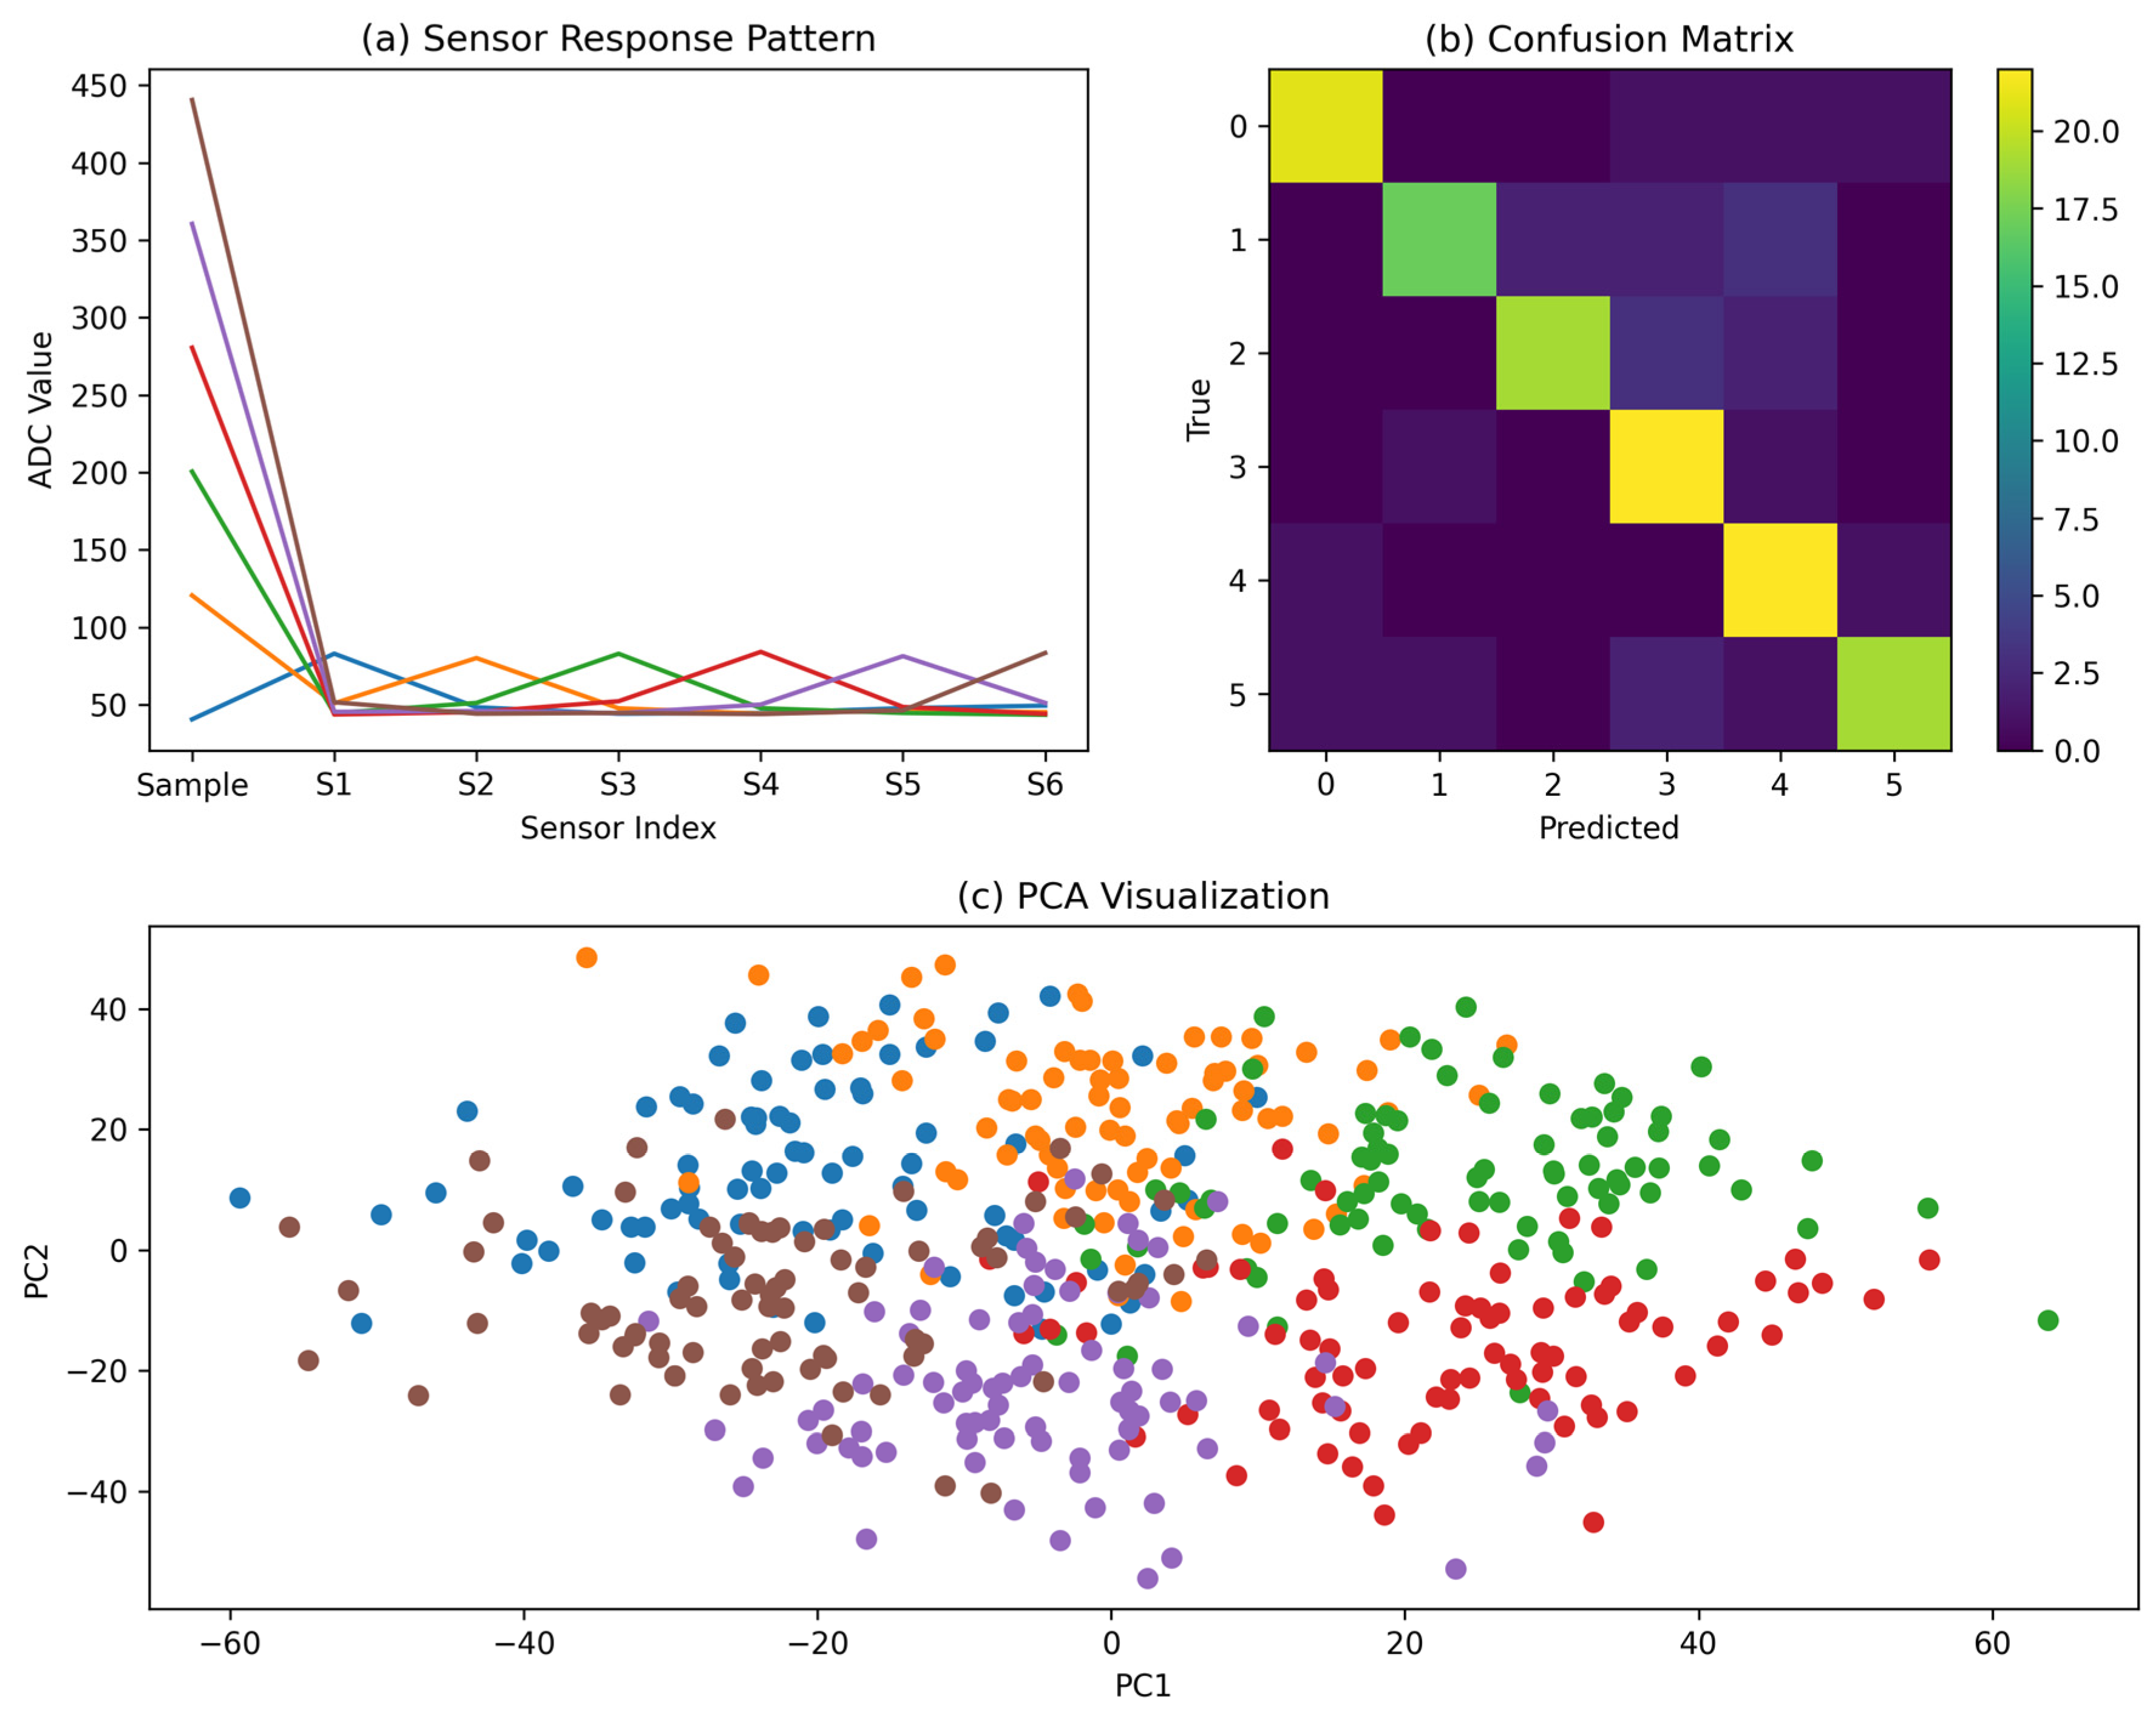
The confusion matrix analysis was performed to evaluate the accuracy of prediction. The confusion matrix reveals that the maximum misclassifications were recorded for the adjacent leak location, considering that the locations are close enough. Because of the less separation, hydrogen diffusion caused similar response patterns. Figure 16 shows the confusion matrix analysis for all three models, namely ANN, RF, and SVM. The present study aimed to compare representative machine learning algorithms under identical experimental conditions rather than perform extensive hyperparameter optimization. Although Random Forest is generally robust to noisy datasets, the hydrogen leakage dataset exhibited overlapping sensor response patterns caused by hydrogen diffusion between adjacent leak locations. The Artificial Neural Network was better able to model these nonlinear relationships, resulting in a modest improvement in localization accuracy (approximately 2%) over Random Forest. This suggests that nonlinear learning approaches are advantageous for the proposed multi-sensor hydrogen localization problem, although all three evaluated classifiers demonstrated comparable overall performance. The machine learning model performs hydrogen leak localization rather than leak detection. The presence of hydrogen is first identified by the sensing system using a predefined sensor-response threshold. Once hydrogen leakage is confirmed, the machine learning model classifies the leakage into one of the six predefined leak locations. Consequently, only the six leakage locations are considered as target classes for machine learning classification, and the no-leak condition is not included in the confusion matrix analysis.
Figure 16.
Confusion matrix comparison (ANN, RF, SVM).
5.3. Feature Space Analysis
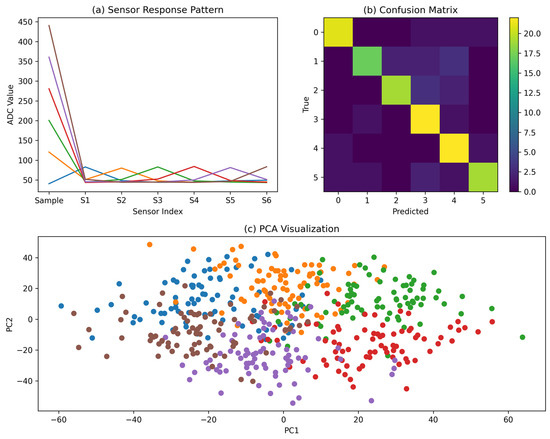
Principal Component Analysis (PCA) shown in Figure 17 represents overlapping clusters, confirming the complexity of the classification problem. This justifies the use of advanced machine learning techniques.
Figure 17.
Combined analysis including sensor response, confusion matrix, and PCA.
The results demonstrate that while simple threshold-based methods may fail under overlapping conditions, machine learning models can effectively classify leakage locations. ANN showed the highest classification performance in the present laboratory-scale proof-of-concept evaluation.
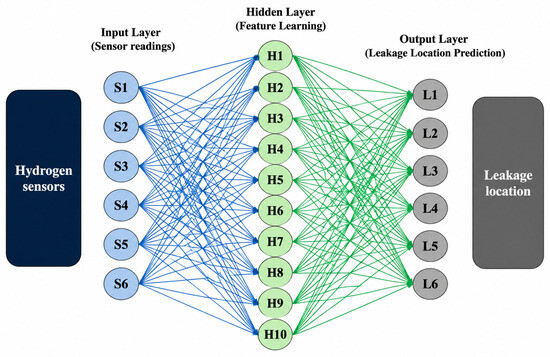
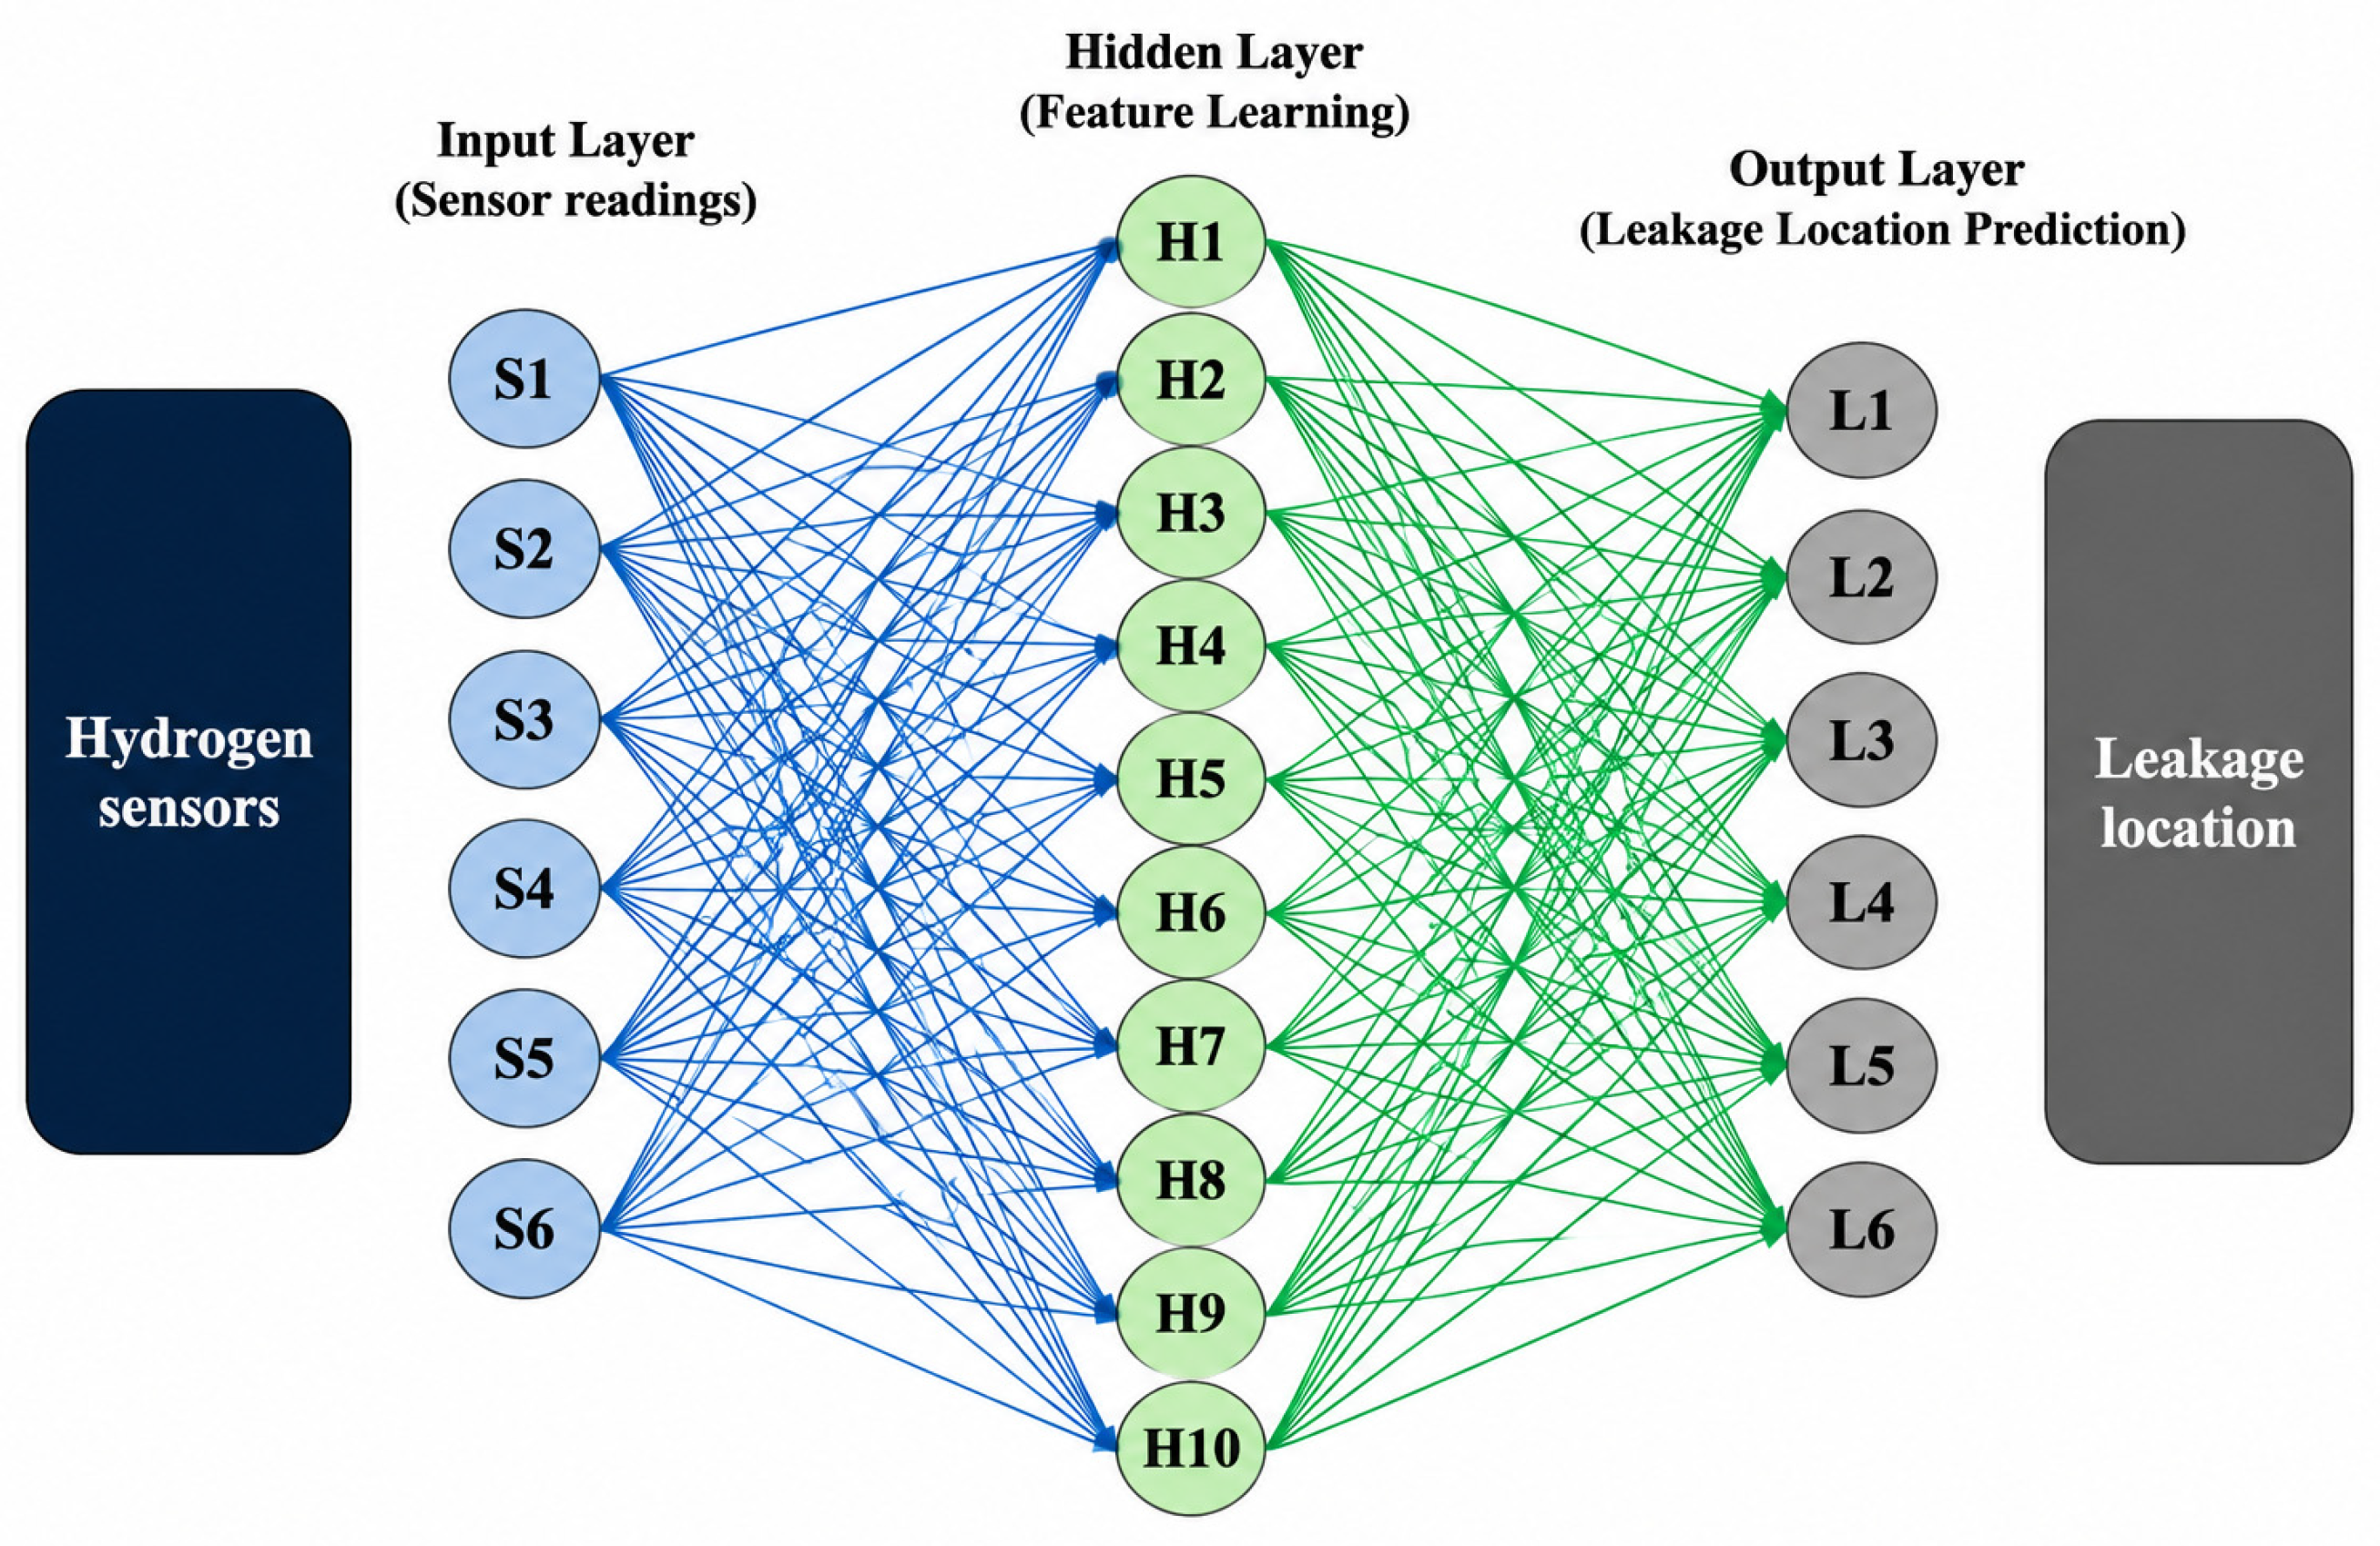
As shown in Figure 18, the artificial neural network consists of six input neurons corresponding to MQ-8 sensor readings, a hidden layer for feature extraction using ReLU activation, and an output layer employing SoftMax activation for multi-class leakage localization. The hidden layer captures nonlinear spatial relationships among sensor responses, enabling accurate classification under overlapping and noisy conditions. The present study focuses on demonstrating the feasibility of an integrated hydrogen monitoring platform. The influence of communication impairments, including packet loss, latency, multipath fading, and missing data, on machine learning localization accuracy was not investigated. Likewise, retransmission protocols, forward error correction, and missing-data recovery mechanisms were beyond the scope of this work. These aspects will be considered in future industrial-scale implementations.
Figure 18.
Schematic representation of the Artificial Neural Network (ANN) architecture developed for hydrogen leakage localization. The network consists of an input layer comprising six hydrogen sensor readings (S1–S6), a hidden layer with ten neurons (H1–H10) for feature extraction and nonlinear pattern learning, and an output layer representing possible leakage locations (L1–L6). The fully connected architecture enables the model to learn the relationship between multi-sensor response patterns and corresponding hydrogen leak locations for accurate real-time leakage prediction.
6. Conclusions
It should be noted that the current research presents the development and successful implementation of a LoRa-based IoT-enabled hydrogen leak localization system equipped with machine learning algorithms. The offered solution involves low-cost hydrogen sensors, long-distance wireless transmission, Internet of Things monitoring in the cloud, and machine learning-driven data analysis, thereby solving major challenges in the hydrogen handling environment. The experiments have proven that LoRa allows reliable transmission of information in both indoor and outdoor scenarios if proper transmission parameters are applied. Increased spreading factors and reduced bandwidth values increased the stability of communication in dense indoor spaces, while outdoor tests revealed that environment morphology and directional obstructions significantly affect the coverage distance.
It is possible to state that the hydrogen sensing platform showed stable and repeatable responses to hydrogen leaks, with a response time of about 9–12 s, a recovery time of 20–22 s, and relative sensor response up to 70–80%. These values proved the feasibility of using the described sensors for hydrogen leakage detection. Using multiple sensors allowed for obtaining the spatial distribution of hydrogen concentration levels. The present study employed commercially available MQ-8 hydrogen sensors to demonstrate the feasibility of the proposed monitoring framework under controlled laboratory conditions. Although MQ-8 sensors provide a low-cost solution for hydrogen detection, they are known to exhibit cross-sensitivity to certain reducing gases and baseline drift during long-term operation. These aspects were not evaluated in the present work because the experiments were conducted using controlled hydrogen generation from an electrolyzer. Future work will investigate in-house synthesis of a nanocomposite hydrogen gas sensor, along with its properties such as selectivity, long-term stability, drift compensation, and performance under realistic industrial environments containing multiple interfering gases.
For leakage localization, the proposed six-sensor configuration was evaluated using 5-fold stratified cross-validation with ANN, RF, and SVM classifiers. ANN provided the highest classification performance, achieving an accuracy of 88.13 ± 2.43%, compared with 84.38 ± 3.23% for RF and 85.00 ± 3.70% for SVM. These results demonstrate the feasibility of using spatially distributed MQ-8 sensor responses combined with machine learning to distinguish six predefined leakage locations under the experimental conditions considered.
In summary, the main contribution of this work is the experimental integration of a six-sensor MQ-8 array, ESP32-based data acquisition, point-to-point LoRa communication, IoT/cloud monitoring, and machine-learning-based localization of predefined hydrogen leakage positions within a single monitoring platform. The communication subsystem was evaluated using SF7, SF9, and SF12 with 125 and 250 kHz bandwidths under indoor and outdoor conditions, demonstrating the practical influence of spreading factor, bandwidth, and propagation environment on communication performance. The proposed framework provides a scalable, affordable, and intelligent platform for detecting leaks of hydrogen in laboratories, manufacturing units, warehouses, fuel cell sites, and intelligent energy grids. The inclusion of IoT connectivity, LoRa transmission, and machine learning represents a practical approach to building secure hydrogen environments. Further research might consider more extensive deployment systems, the use of sophisticated gas sensors, optimization of LoRa, concentration determination, and leak location based on deep learning.
Although the proposed system successfully demonstrates the feasibility of IoT-enabled hydrogen leak detection and localization, several aspects remain for future investigation. These include comprehensive power consumption analysis, low-power operation using sleep-mode strategies, battery lifetime estimation, and integration with energy-harvesting solutions such as in-house developed thin-film solar cells. In addition, long-term field deployment under realistic industrial environments, including evaluation of RF stability, co-channel interference, and communication reliability over extended periods, will be investigated in future work.
Author Contributions
Conceptualization, A.I. and J.S.; methodology, A.I.; software, A.I.; validation, A.I. and J.S.; formal analysis, A.I.; investigation, A.I.; resources, J.S.; data curation, A.I.; writing—original draft preparation, A.I.; writing—review and editing, A.I.; visualization, A.I.; supervision, J.S.; project administration, J.S.; funding acquisition, J.S. All authors have read and agreed to the published version of the manuscript.
Funding
This research received no external funding.
Institutional Review Board Statement
Not applicable.
Informed Consent Statement
Not applicable.
Data Availability Statement
Data may be provided upon request. The data are not publicly available due to ongoing further study in the existing data.
Acknowledgments
The authors would like to express their sincere appreciation to the faculty of engineering, University of Szeged, Hungary, for their valuable support in this work. They also extend their gratitude to all team members for their contributions and assistance throughout the study.
Conflicts of Interest
The authors declare no conflicts of interest.
Abbreviations
The following abbreviations are used in this manuscript:
| LoRaWAN | Long Range Wireless Area Network |
| LoRa | Long Range |
| SF | Spreading Factor |
| SNR | Signal to Noise Ratio |
| RSSI | Received Signal Strength Index |
| IoT | Internet of Things |
References
- Ibrahim, A.; Memon, U.B.; Duttagupta, S.; Mahesh, I.; Raman, R.S.; Sarkar, A.; Pendharkar, G.; Tatiparti, S.S.V. Nano-structured palladium impregnate graphitic carbon nitride composite for efficient hydrogen gas sensing. Int. J. Hydrogen Energy 2020, 45, 10623–10636. [Google Scholar] [CrossRef] [Scilit]
- Ibrahim, A.; Memon, U.B.; Duttagupta, S.; Raman, R.S.; Sarkar, A.; Pendharkar, G.; Tatiparti, S.S.V. Hydrogen gas sensing of nano-confined Pt/g-C3N4 composite at room temperature. Int. J. Hydrogen Energy 2021, 46, 23962–23973. [Google Scholar] [CrossRef] [Scilit]
- Pathak, A.K.; Verma, S.; Sakda, N.; Viphavakit, C.; Chitaree, R.; Rahman, B.A. Recent advances in optical hydrogen sensor including use of metal and metal alloys: A review. Photonics 2023, 10, 122. [Google Scholar] [CrossRef] [Scilit]
- Ranasinghe, S.; Yavari, A.; Thathsara, T.; Harrison, C.J.; Shafiei, M. Machine learning applications in semiconductor metal oxide chemiresistive hydrogen sensing: A review. Int. J. Hydrogen Energy 2026, 235, 155132. [Google Scholar] [CrossRef] [Scilit]
- Chauhan, S.; Bhattacharya, S. Hydrogen gas sensing methods, materials, and approach to achieve parts per billion level detection: A review. Int. J. Hydrogen Energy 2019, 44, 26076–26099. [Google Scholar] [CrossRef] [Scilit]
- Zhang, A.; Zhang, Y.; Cheng, W.; Li, X.; Chen, K.; Li, F.; Yang, D. Dual-gas sensing via SnO2-TiO2 heterojunction on MXene: Machine learning-enhanced selectivity and sensitivity for hydrogen and ammonia detection. Sens. Actuators B Chem. 2025, 429, 137340. [Google Scholar] [CrossRef] [Scilit]
- Behzad, V.; Dehbashi, M.; Khandakar, A.; Ayari, M.A.; Amini, S. Development of a stacked machine learning model to compute the capability of ZnO-based sensors for hydrogen detection. Sustain. Mater. Technol. 2024, 39, e00863. [Google Scholar] [CrossRef] [Scilit]
- Zhao, M.; Huang, T.; Liu, C.; Chen, M.; Ji, S.; Christopher, D.M.; Li, X. Leak localization using distributed sensors and machine learning for hydrogen releases from a fuel cell vehicle in a parking garage. Int. J. Hydrogen Energy 2021, 46, 1420–1433. [Google Scholar] [CrossRef] [Scilit]
- Huang, S.; Croy, A.; Panes-Ruiz, L.A.; Khavrus, V.; Bezugly, V.; Ibarlucea, B.; Cuniberti, G. Machine learning-enabled smart gas sensing platform for identification of industrial gases. Adv. Intell. Syst. 2022, 4, 2200016. [Google Scholar] [CrossRef] [Scilit]
- Han, J.; Li, H.; Cheng, J.; Ma, X.; Fu, Y. Advances in metal oxide semiconductor gas sensor arrays based on machine learning algorithms. J. Mater. Chem. C 2025, 13, 4285–4303. [Google Scholar] [CrossRef] [Scilit]
- Bonilla, V.; Campoverde, B.; Yoo, S.G. A systematic literature review of lorawan: Sensors and applications. Sensors 2023, 23, 8440. [Google Scholar] [CrossRef] [Scilit] [PubMed]
- Ghaderi, M.R.; Amiri, N. LoRaWAN sensor: Energy analysis and modeling. Wirel. Netw. 2024, 30, 1013–1036. [Google Scholar] [CrossRef] [Scilit]
- Al-Sammak, K.A.; Al-Gburi, S.H.; Marghescu, I.; Drăgulinescu, A.M.C.; Marghescu, C.; Martian, A.; Alduais, N.A.; Al-Sammak, N.A.H. Optimizing LoRaWAN Gateway Placement in Urban Environments: A Hybrid PSO-DE Algorithm Validated via HTZ Simulations. Technologies 2025, 13, 256. [Google Scholar] [CrossRef] [Scilit]
- Lavdas, S.; Bakas, N.; Vavousis, K.; El Hajj, W.; Zinonos, Z. Evaluating lorawan network performance in smart city environments using machine learning. IEEE Internet Things J. 2025, 12, 27060–27074. [Google Scholar] [CrossRef] [Scilit]
- Obiri, N.M.; Van Laerhoven, K. A comprehensive data description for lorawan path loss measurements in an indoor office setting: Effects of environmental factors. IEEE Access 2025, 13, 83148–83170. [Google Scholar] [CrossRef] [Scilit]
- Zourmand, A.; Hing, A.L.K.; Hung, C.W.; AbdulRehman, M. Internet of things (IoT) using LoRa technology. In 2019 IEEE International Conference on Automatic Control and Intelligent Systems (I2CACIS); IEEE: New York, NY, USA, 2019; pp. 324–330. [Google Scholar]
- Porselvi, T.; Ganesh, S. IoT based coal mine safety and health monitoring system using LoRaWAN. In 2021 3rd International Conference on Signal Processing and Communication (ICPSC); IEEE: New York, NY, USA, 2021; pp. 49–53. [Google Scholar]
- Klein, L.J.; Van Kessel, T.; Nair, D.; Muralidhar, R.; Hinds, N.; Hamann, H.; Sosa, N. Distributed wireless sensing for fugitive methane leak detection. In 2017 IEEE International Conference on Big Data (Big Data); IEEE: New York, NY, USA, 2017; pp. 4583–4591. [Google Scholar]
- Astrain, J.J.; Falcone, F.; Lopez-Martin, A.J.; Sanchis; Villadangos, J.; Matias, I.R. Monitoring of electric buses within an urban smart city environment. IEEE Sens. J. 2021, 22, 11364–11372. [Google Scholar] [CrossRef] [Scilit]
- Petrariu, A.I.; Lavric, A.; Coca, E. Renewable energy powered LoRa-based IoT multi sensor node. In 2019 IEEE 25th International Symposium for Design and Technology in Electronic Packaging (SIITME); IEEE: New York, NY, USA, 2019; pp. 94–97. [Google Scholar]
- Jabbar, W.A.; Subramaniam, T.; Ong, A.E.; Shu’Ib, M.I.; Wu, W.; De Oliveira, M.A. LoRaWAN-based IoT system implementation for long-range outdoor air quality monitoring. Internet Things 2022, 19, 100540. [Google Scholar] [CrossRef] [Scilit]
- Zhu, J.; Cho, M.; Li, Y.; He, T.; Ahn, J.; Park, J.; Ren, T.-L.; Lee, C.; Park, I. Machine learning-enabled textile-based graphene gas sensing with energy harvesting-assisted IoT application. Nano Energy 2021, 86, 106035. [Google Scholar] [CrossRef] [Scilit]
- Maity, T.; Giri; Sasmal, R.; Biswas, N.; Das, S.; Maity, R.K.; Saha; Samanta, J. Design of Smart IoT-Based Gas Leakage Detection and Prevention Devices for Hydrogen Station. In Proceedings of the 4th International Conference on Communication, Devices and Computing; Springer: Berlin/Heidelberg, Germany, 2023; pp. 531–546. [Google Scholar] [CrossRef] [Scilit]
- Wang, W.; Niu. A LoRa-based safety monitoring system for hydrogen compressed natural gas (HCNG). J. Phys. Conf. Ser. 2024, 2826, 12001. [Google Scholar] [CrossRef] [Scilit]
- Hwang, H.-J.; Hwang, S.-H. Developing an internet of things system for hydrogen leak detection at hydrogen refueling stations integrating LoRa and global positioning system. Edelweiss Appl. Sci. Technol. 2024, 8, 1582–1593. [Google Scholar] [CrossRef] [Scilit]
- Boano, C.A.; Cattani, M.; Römer, K. Impact of temperature variations on the reliability of LoRa. In Proceedings of the 7th International Conference on Sensor Networks SENSORNETS; SciTePress: Setúbal, Portugal; pp. 39–50.
- Li, L.; Zhou, L.; Chen, Y.; Chen, X.; Guo, L.; Zhang, W.; Deng, Y.; Li, T.; Chen, B.; Liu, H.; et al. Precision hydrogen detection in mixed atmospheres using temperature-modulated PdAu-In2O3 sensor arrays and machine learning algorithms. Chem. Eng. J. 2025, 520, 165633. [Google Scholar] [CrossRef] [Scilit]
- Wang, S.; Bi, Y.; Shi, J.; Wu, Q.; Zhang, C.; Huang, S.; Gao, W.; Bi, M. Deep learning-based hydrogen leakage localization prediction considering sensor layout optimization in hydrogen refueling stations. Process Saf. Environ. Prot. 2024, 189, 549–560. [Google Scholar] [CrossRef] [Scilit]
- Yang, G.; Kong, D.; He, X.; Yu, X.; Jiang, K. Prediction of hydrogen leakage location and intensity in hydrogen refueling stations based on deep learning. Int. J. Hydrogen Energy 2024, 68, 209–220. [Google Scholar] [CrossRef] [Scilit]
- Lu, Y.; Zhang, X.; Wang, J.; Zhang, X. Causative factors and risk prediction model of hydrogen leakage accidents: Machine learning based on case evidence. Int. J. Hydrogen Energy 2024, 63, 294–307. [Google Scholar] [CrossRef] [Scilit]
- Suzuki, Y.; Nakayama, J.; Suzuki, T.; Soma, T.; Izato, Y.I.; Miyake, A. Consequence analysis of a small-scale hydrogen leakage from the overhead hydrogen piping based on machine learning and physical modeling. J. Loss Prev. Process Ind. 2024, 90, 105328. [Google Scholar] [CrossRef] [Scilit]
- Zhang, L.; Wu, Q.; Liu, M.; Chen, H.; Wang, D.; Li, X.; Ba, Q. Hydrogen leakage location prediction in a fuel cell system of skid-mounted hydrogen refueling stations. Energies 2025, 18, 228. [Google Scholar] [CrossRef] [Scilit]
- Wang, J.; Wang, L.; Wang, D.; Yu, X. Hydrogen leakage localization technology in hydrogen refueling stations combining RL and hidden Markov models. Sustain. Energy Res. 2025, 12, 38. [Google Scholar] [CrossRef] [Scilit]
- Deng, X.; Sun, J.; Yang, F.; Ouyang, M. Design of long-life wireless near-field hydrogen gas sensor. Sensors 2024, 24, 1332. [Google Scholar] [CrossRef] [Scilit] [PubMed]
- Liu, S.; He, R. Low-error localization method for hydrogen leakage from hydrogen supply system of fuel cell truck based on the parameter-optimized machine learning model. Int. J. Hydrogen Energy 2025, 185, 151792. [Google Scholar] [CrossRef] [Scilit]

Disclaimer/Publisher’s Note: The statements, opinions and data contained in all publications are solely those of the individual author(s) and contributor(s) and not of MDPI and/or the editor(s). MDPI and/or the editor(s) disclaim responsibility for any injury to people or property resulting from any ideas, methods, instructions or products referred to in the content. |
© 2026 by the authors. Licensee MDPI, Basel, Switzerland. This article is an open access article distributed under the terms and conditions of the Creative Commons Attribution (CC BY) license.