


Abstract
This study used Computational Fluid Dynamics (CFD) with the Reynolds-Averaged Navier–Stokes (RANS) k-ω Shear Stress Transport (SST) model to evaluate how crop presence and evapotranspiration affect airflow and thermal stratification in a naturally ventilated tropical tomato greenhouse. Three configurations were simulated: SP-SC-R (No Plants—No crop thermal load—Radiation), CP-SC-R (Crop Present—No crop thermal load—Radiation), and CP-CC-R (Crop Present—Crop thermal load (233.68 W·m−2)—Radiation). Mesh independence analysis yielded numerical uncertainties of 1.58% (velocity) and 1 × 10⁻⁶ (temperature). Vegetation reduced canopy air velocity by 55% (from 4 m·s−1 to values below 2 m·s−1). Evapotranspiration enhanced buoyancy-driven mixing, decreasing temperature gradients by up to 1.5 °C, but thermal stratification persisted above 4.5 m in all cases (vertical gradients 0.31–0.42 °C·m−1; maximum roof temperature 37.95 °C). Extreme wind speeds (greater than 20 m·s−1) occurred in the leeward span but above the main foliage. Natural ventilation alone is insufficient for tomato cultivation under tropical conditions. Practical recommendations include increasing roof vent area, installing windbreak baffles, and adopting hybrid ventilation. Future work should use unsteady, RANS/large-eddy simulation (LES), porous media models based on leaf area density (LAI), and field validation. This study demonstrates that coupling crop geometry and evapotranspiration is essential for realistic greenhouse CFD modelling in warm climates.
1. Introduction
Protected agriculture in greenhouses is widely used globally, with structural configurations varying according to climate, materials, and technological level [1]. In Colombia, greenhouse cultivation has expanded in regions such as the Sabana de Bogotá and Rionegro; however, in tropical and semi-arid areas, excessive daytime temperatures present a major challenge [2]. Most national greenhouse structures were originally designed for cool climates, with the objective of conserving heat under low wind speed conditions, and do not adequately address the high thermal loads typical of warm environments [3]; adapted designs have restricted ventilation areas with roof openings smaller than 3%, which prevent the achievement of the minimum air exchange rate of 0.04 m3·s−1·m−2, resulting in internal temperature peaks that are harmful to the development of crops such as tomato [4]. Naturally ventilated greenhouses therefore require optimised airflow to mitigate extreme temperature, solar radiation, and humidity while maintaining suitable conditions for crop growth [5]. Computational Fluid Dynamics (CFD) has become a key tool for analysing greenhouse microclimates and guiding structural optimisation.
Previous studies modelled crop canopies either as porous media or simplified geometries to estimate drag and its effect on ventilation [6,7]. These approaches enabled the development of validated 3D models across various greenhouse types [8,9]. Recent advances include coupling CFD with crop physiology—e.g., transpiration and photosynthesis—through User-Defined Functions (UDFs) to improve predictive accuracy [10,11], and using CFD for design optimisation [12]. Despite this progress, most existing studies present two key limitations. First, crop representation is often simplified, and its aerodynamic influence is sometimes underestimated, potentially overpredicting airflow uniformity. Second, many CFD studies omit evapotranspiration-induced heat flux, even though it is a dominant component of the energy balance in warm climates and significantly affects buoyant convection within the canopy. Physically, evapotranspiration represents the combined process of water vapourisation from soil surfaces (evaporation) and plant tissues (transpiration). This process acts as a crucial thermal regulator by partitioning the net solar radiation into sensible heat (H) and latent heat (λE). In tropical environments, the latent heat exchange can account for 60–80% of the energy balance [13]. Omitting this phase-change energy sink in CFD simulations would lead to a significant overestimation of air temperatures. It would fail to capture the humidity-driven density variations that influence buoyant convection and airflow patterns. Therefore, including the evapotranspiration heat flux is essential for realistically simulating the greenhouse microclimate under warm conditions. As highlighted by recent reviews [14], incorporating crop geometry and physiological behaviour is essential for obtaining realistic diagnostics and avoiding misleading conclusions about ventilation efficiency.
In this context, the present study aims to fill this methodological gap by analysing how both the aerodynamic obstruction of a tomato canopy and the thermal load generated by evapotranspiration modify ventilation patterns and thermal stratification under critical tropical conditions. Specifically, we: (i) evaluate airflow and temperature fields using CFD; (ii) quantify the impact of crop presence; and (iii) assess the contribution of evapotranspiration-driven heat flux. The main novelty of this CFD approach lies in the simultaneous incorporation of both the crop’s geometric drag and its evapotranspiration-driven heat flux, an aspect rarely addressed simultaneously in tropical greenhouse studies. In this study, the open-source CFD platform OpenFOAM was used with the buoyantSimpleFoam solver, which couples heat and fluid flow for buoyancy-driven problems. This allows the crop’s evapotranspiration load to be introduced as a volumetric heat source that interacts directly with the k-ω Shear Stress Transport (SST) turbulence model [7,8,12]. Previous CFD studies on greenhouses have used OpenFOAM to model drag, crop aerodynamic drag or sensible heat [5,8,15,16], but few have combined both under tropical conditions. The present approach thus captures how the crop’s thermal contribution modifies ventilation and thermal stratification.
2. Materials and Methods
2.1. Study Area and Climatic Characterisation
The greenhouse is located at the Experimental Farm of Universidad Surcolombiana, in the municipality of Palermo, Huila Department, Colombia (coordinates: 2°53′9.44″ N, 75°18′28.20″ W; altitude: 464 m.a.s.l.). Minimum and maximum temperature data were obtained from the El Juncal climatological station, managed by the Institute of Hydrology, Meteorology and Environmental Studies (IDEAM). Since this station does not record wind speed, these data were acquired from the Benito Salas Airport station in Neiva. Records spanning from 2010 to 2021 were used to determine the critical values introduced into the computational model. The maximum temperature was taken as the highest monthly mean value from the period analysed (36.23 °C). The minimum annual average wind speed recorded over the same period was 4.6 m·s−1. The maximum instantaneous irradiance reached 5000 W·m−2. These conditions were selected to represent the most critical climatic scenario for greenhouse design. It is important to note that this combination of maximum solar radiation, average maximum temperature, and minimum wind speed does not correspond to a single historically recorded synchronous extreme event, but rather constitutes a conservative design scenario intended to evaluate the greenhouse’s performance under conditions of maximum thermal stress.
The heat flux generated by the crop was determined from the reference evapotranspiration (ETo) using the Thornthwaite method. A crop coefficient (Kc) of 1.2 was adopted for tomato plants at mid-growth stage [17]. The crop evapotranspiration (ETc) was converted to thermal load in W·m−2. The most critical month, corresponding to the highest evapotranspiration rate, was September, with ETo = 6.871 mm·day−1 and ETc = 8.246 mm·day−1, equivalent to a crop thermal load of 233.68 W·m−2.
2.2. Greenhouse Design and CAD Modelling
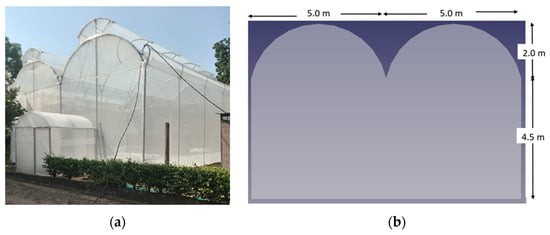
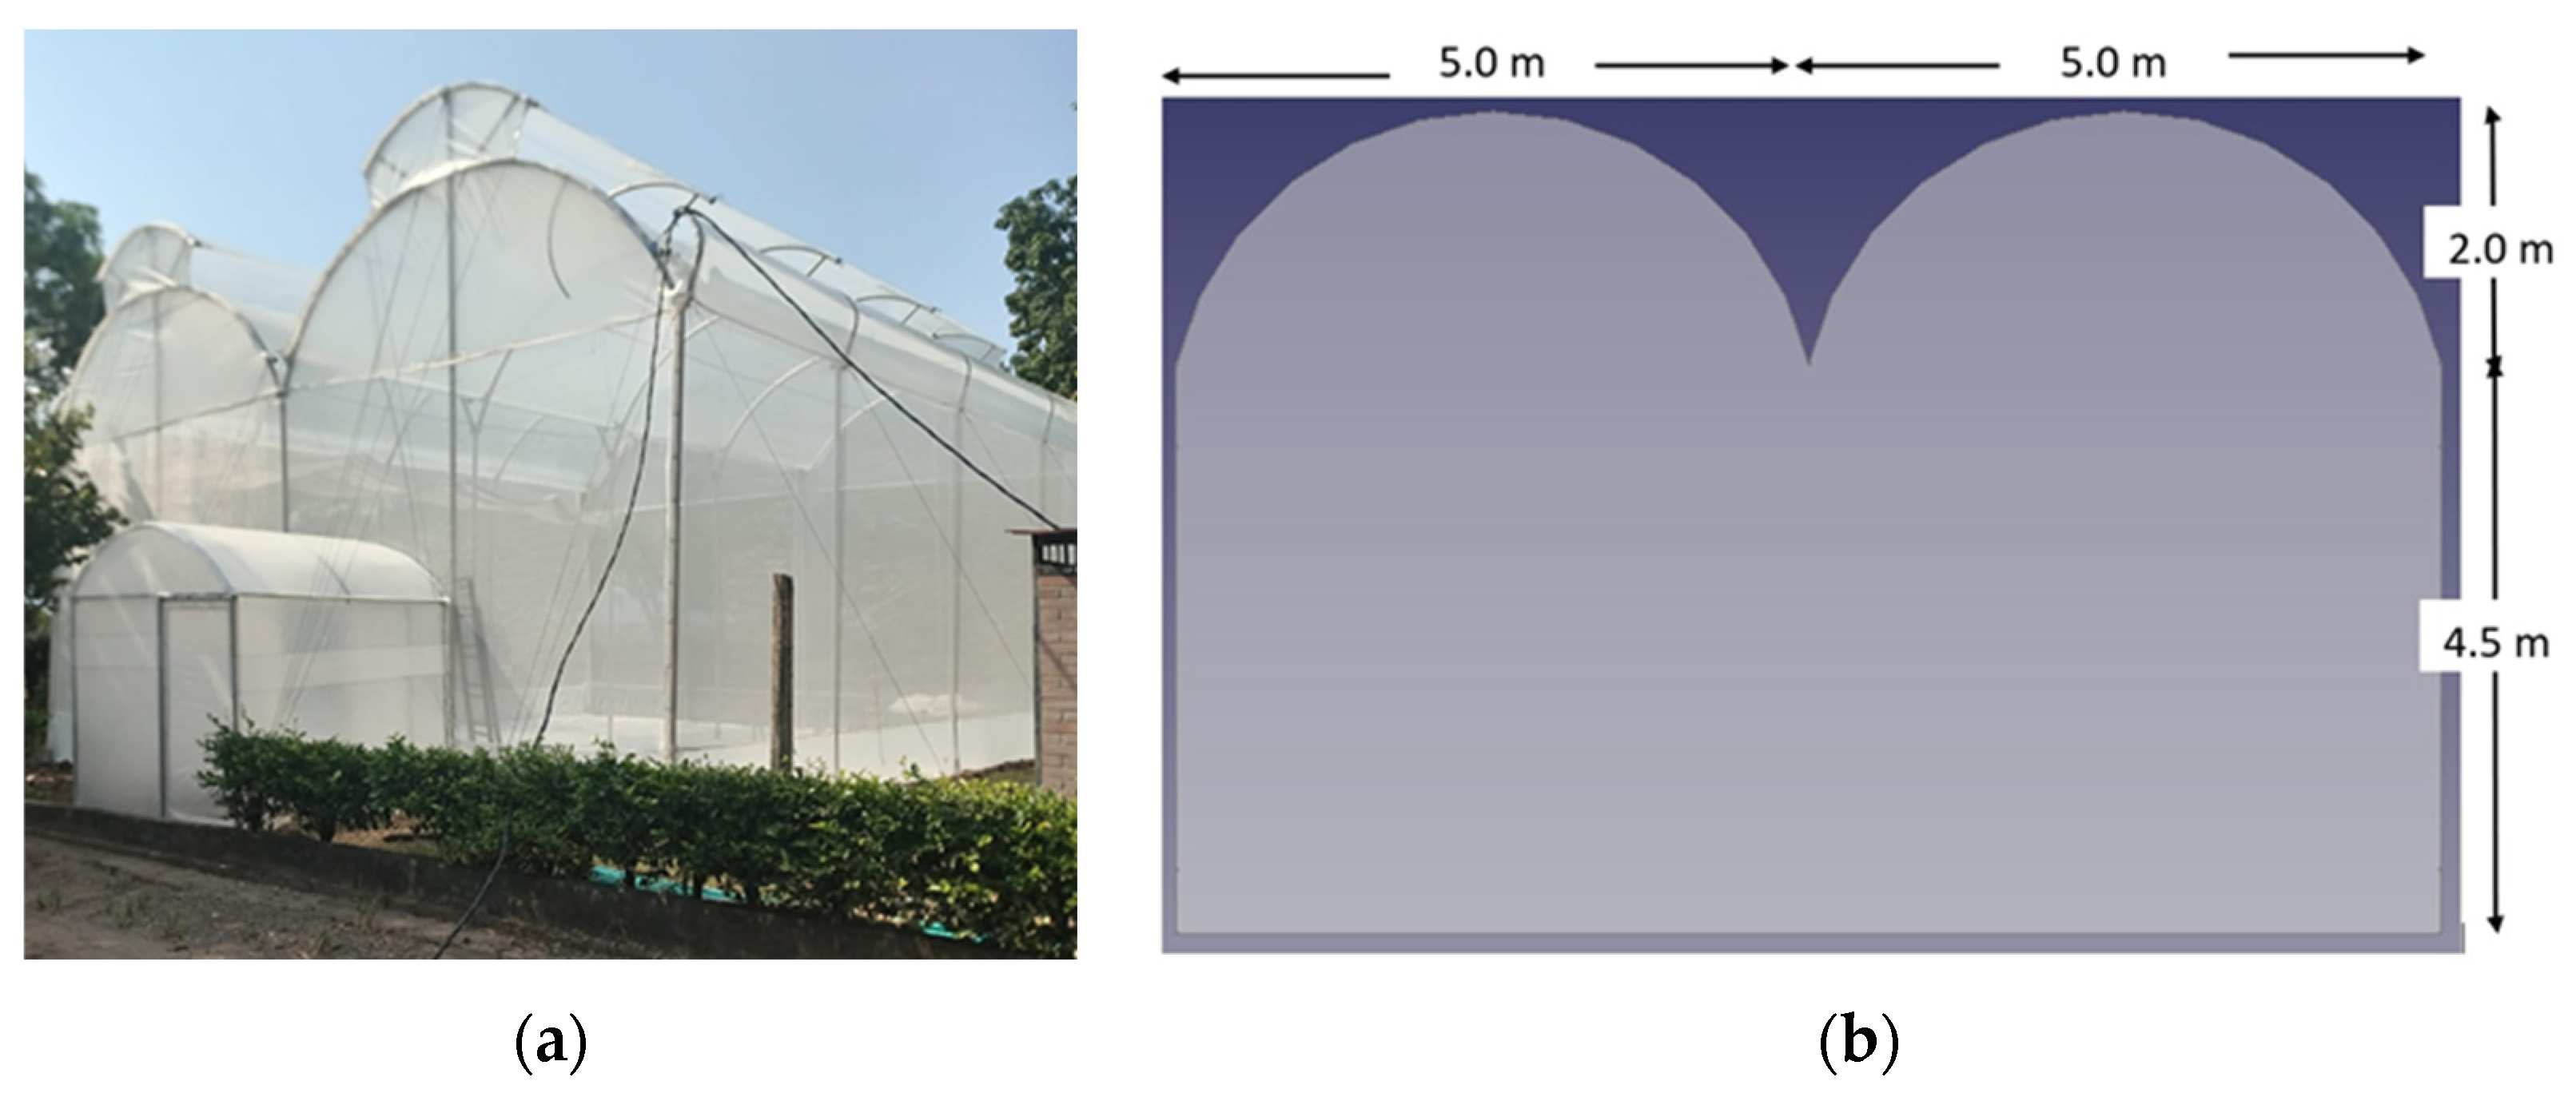
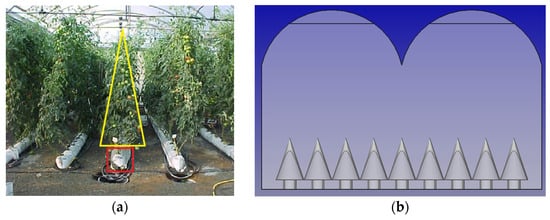
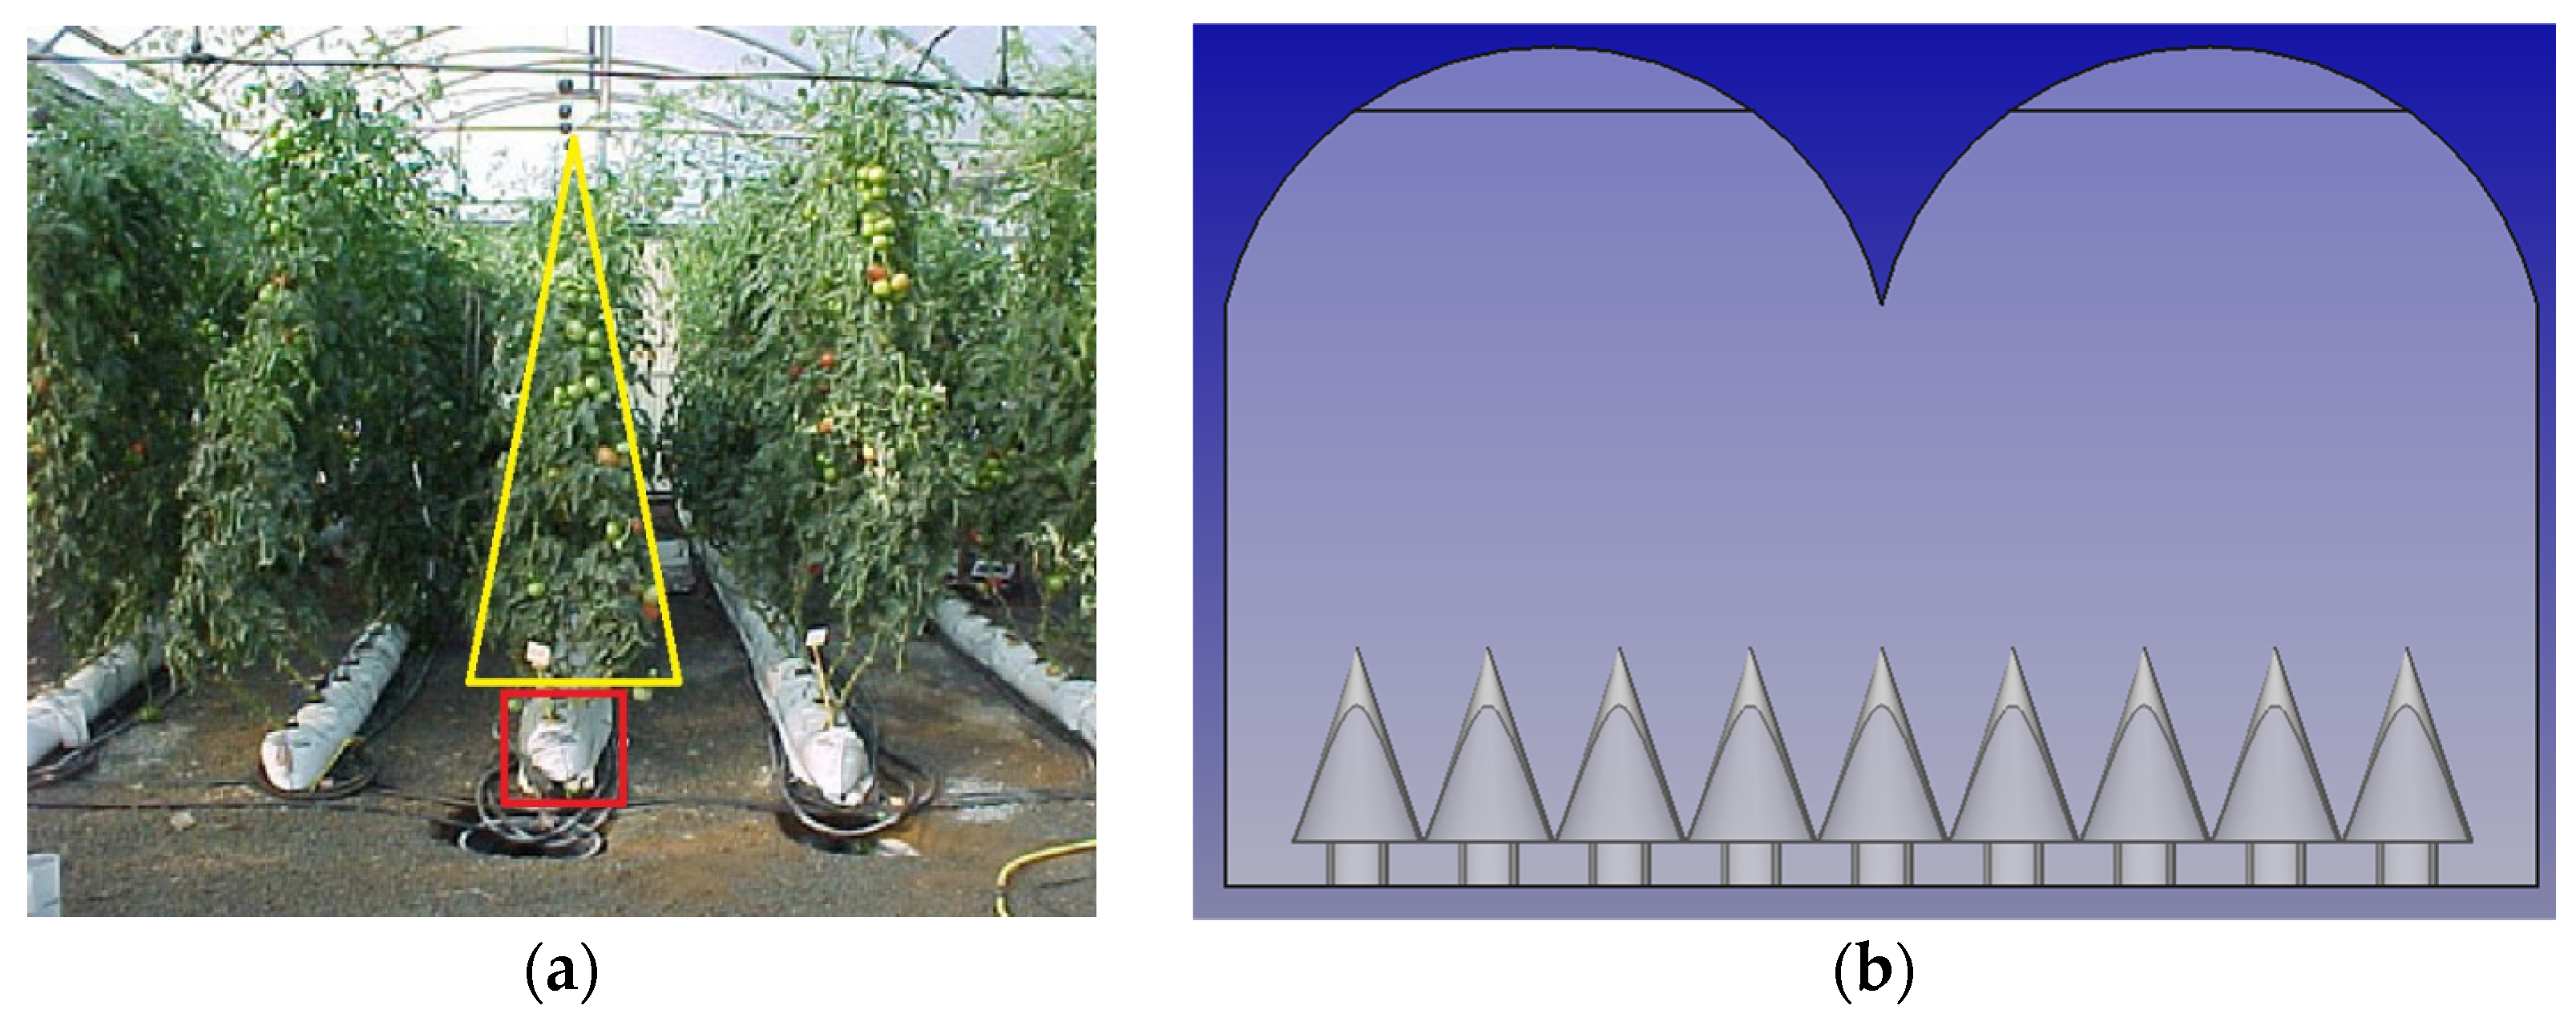
The proposed greenhouse consists of two spans, each 10 m wide and 12 m long, providing a total area of 120 m2, a maximum height of 4.5 m, and a semi-circular roof 2 m in height. Each span includes a roof vent of 1.25 m height (Figure 1a). The structure is equipped with an automated ventilation system composed of two rotary fans and a 24-inch extractor. The total greenhouse volume is 780 m3. For the numerical study, two Computer-Aided Design (CAD) models were created using FreeCAD, an open-source parametric 3D modeller capable of handling finite volume domains. One model represented the greenhouse without plants (empty greenhouse (Figure 1b)), while the second incorporated tomato plants at the productive stage (with plants (Figure 2b)).
Figure 1.
(a) Constructed greenhouse and (b) dimensions of the CAD model.
Figure 2.
(a) Approximation of plant geometry and (b) CAD model used for the plants.
2.3. Crop Modelling
To reduce computational cost, the tomato plants were represented using simplified geometric shapes such as cones and cylinders (see Figure 2b). This approach is commonly adopted in the literature; for instance, Hou et al. [18] suggested that simplified shapes can reproduce the same drag coefficient (CD) as the actual crop structure. Accordingly, a conical geometry was used to represent the plant canopy (CD = 0.26), consistent with the experimental value of 0.25 ± 0.05 reported by Molina et al. [6] for tomato crops.
Plastic bags containing the growing substrate (15 L) were represented as cylinders (Table 1). According to the literature, the height of tomato plants ranges from 0.5 m in early growth to more than 2.0 m in the production stage [19]. A mean height of 1.5 m was used in this study. The cultivation area covered 91.8 m2, containing 306 plants arranged at 0.3 m between plants and 1.0 m between rows, corresponding to a density of 3.3 plants·m−2 (Figure 2b).
Table 1.
Simplified geometric dimensions used for crop representation.
2.4. Estimation of Ventilation Flow Rate and Vent Area
The required ventilation flow rate (Qv) was calculated assuming one air renewal per minute, corresponding to 780 m3·min−1. According to Castilla [20], during summer, the air exchange rate in greenhouses should range from 30 to 60 air changes per hour, equivalent to 0.5–1.0 renewals per minute. For cross ventilation, the American Society of Heating, Refrigerating and Air-Conditioning Engineers (ASHRAE) [21] recommends estimating the ventilation rate as:
where Q is the ventilation rate (m3·s−1), Cv is the effectiveness coefficient of the opening (0.5–0.6 for perpendicular wind and 0.25–0.35 for diagonal wind), Av is the free area of the inlet (m2), and V is the wind speed (m·s−1).
Given the climatic conditions of the study site, a critical wind speed of 4.6 m·s−1 and a window effectiveness of 0.25 were adopted, yielding a theoretical vent area of 11.3 m2. However, to ensure adequate air renewal under design conditions, a larger total effective vent area of 40.25 m2 was evaluated. This configuration consisted of side vents measuring 3.0 m × 10.0 m and roof vents of 1.25 m × 10.0 m. The selection of this larger area is justified by the requirement in tropical regions to achieve a ventilation surface-to-ground area ratio between 25% and 30%, as recommended by Villagran and Bojacá [4]. This design ensures an air renewal rate of approximately 3.5 changes per minute, significantly exceeding the minimum threshold of one renewal per minute required to mitigate high thermal loads and prevent hazardous heat accumulation.
2.5. CFD Configuration and Boundary Conditions
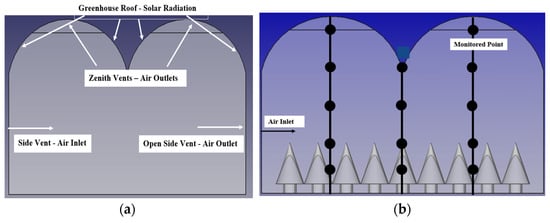
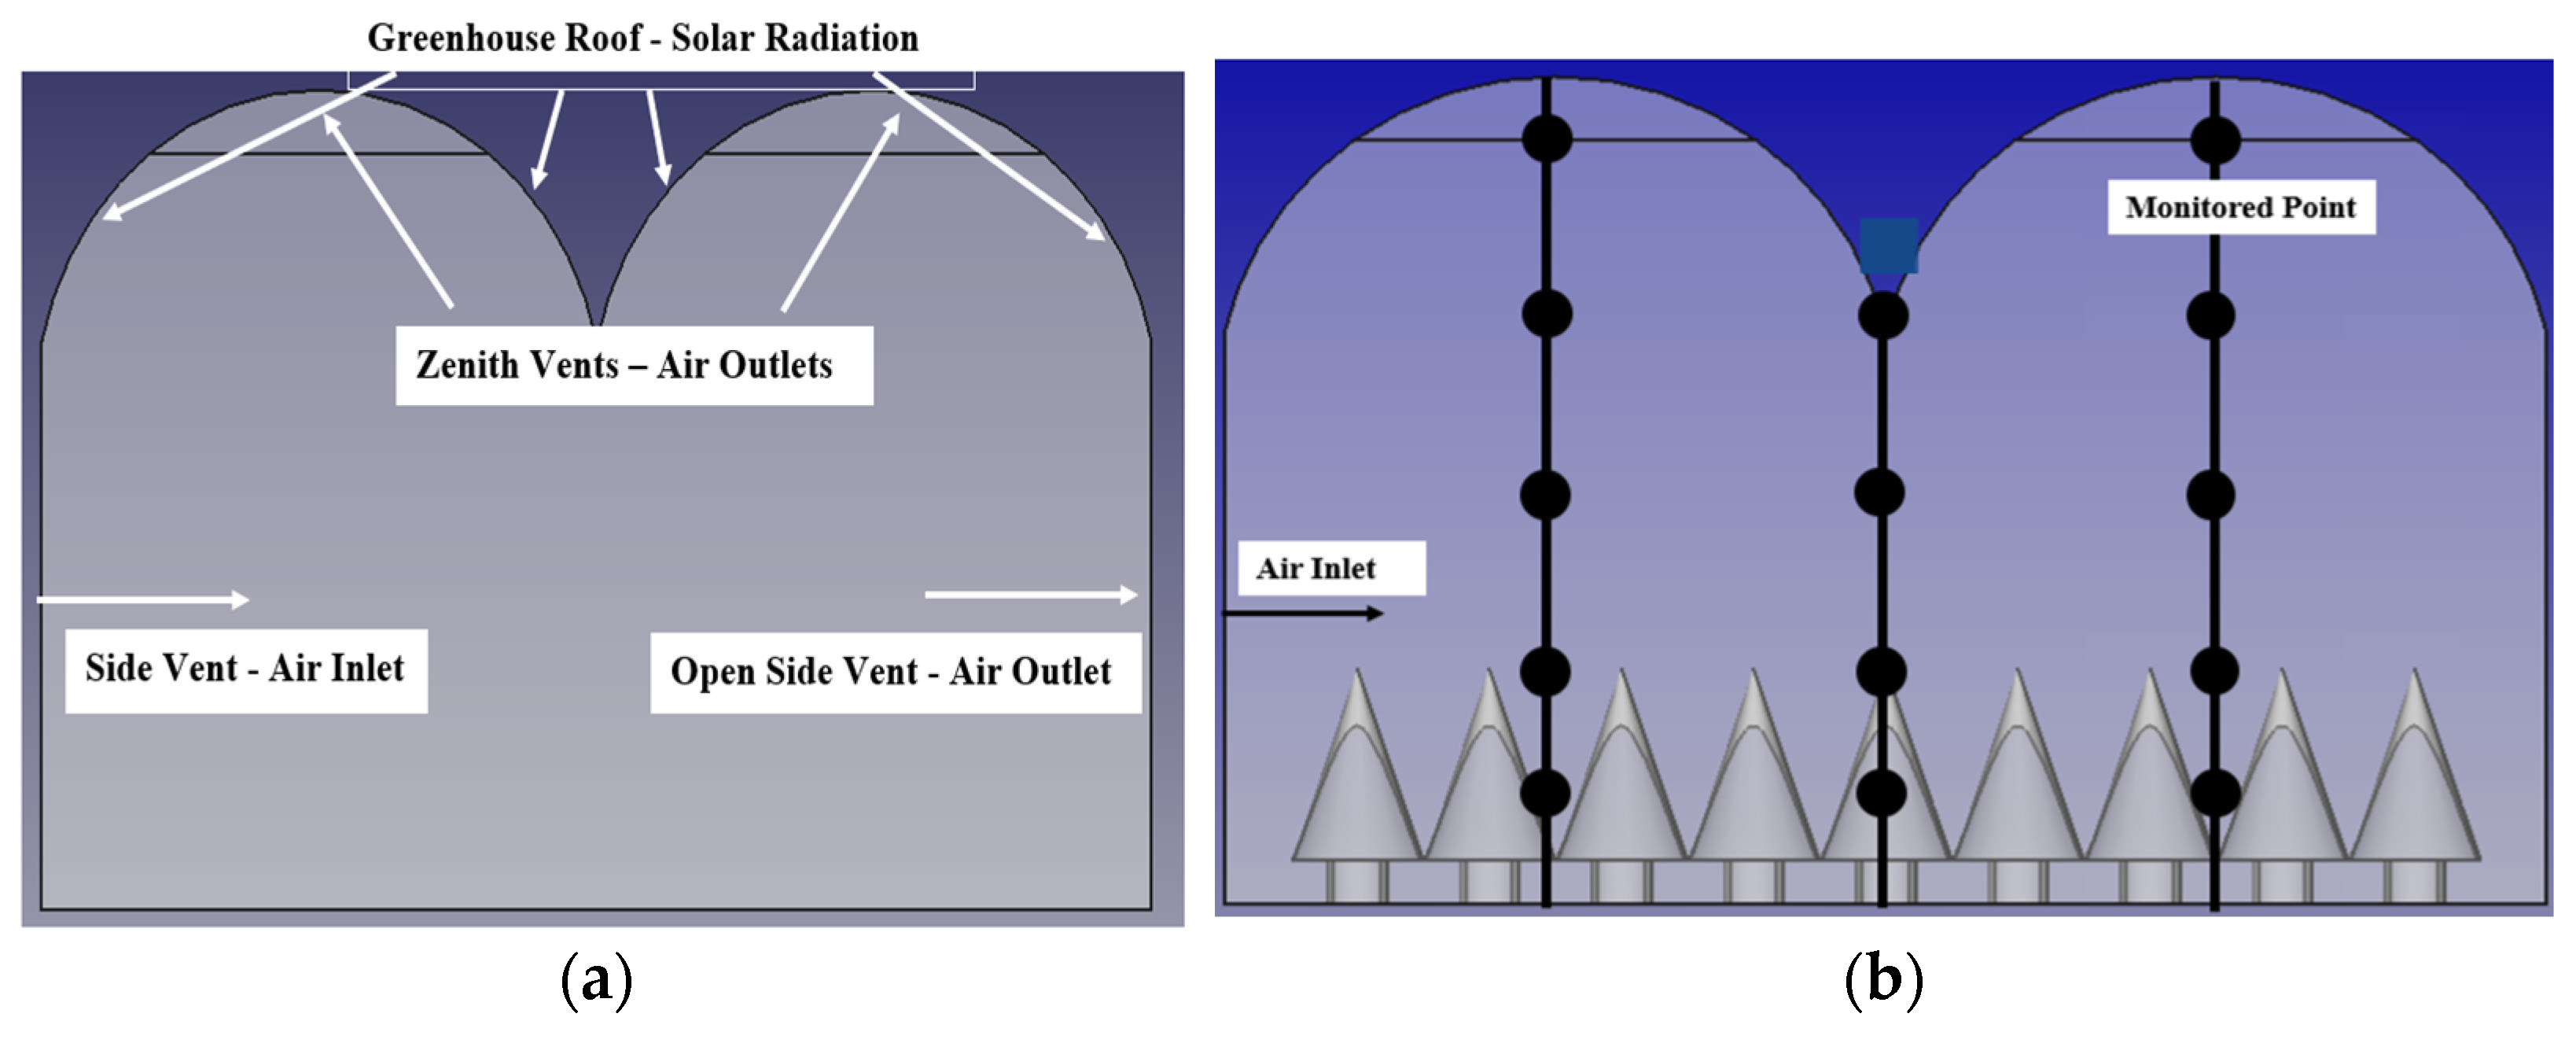
The CFD model was developed in FreeCAD V1.0 using the Cfdof add-on. This workbench integrates OpenFOAM V2212 solvers and employs ParaView V5.10.1 for post-processing, following an approach comparable to that of Ardila et al. [15]. Figure 3a shows the boundary conditions defined for the model. The wind entered through the windward side window with perpendicular velocity. The leeward window was modelled as an outlet opening. The roof vents were modelled as pressure outlets. The greenhouse roof was defined as a heat source due to solar radiation, while the plants were treated as an additional heat source corresponding to the evapotranspiration load. The remaining walls were modelled as no-slip, adiabatic boundaries with constant temperature.
Figure 3.
(a) A 2D view of the model and boundary conditions defined for the CFD model and (b) evaluation points for the sensitivity analysis.
Three configurations were simulated:
- C1—No Plants—No crop thermal load—Radiation (SP-SC-R): Empty greenhouse with solar radiation and natural ventilation.
- C2—Crop Present—No crop thermal load—Radiation (CP-SC-R): Greenhouse with plants, solar radiation, and natural ventilation (no crop heat load).
- C3—Crop Present—Crop thermal load—Radiation (CP-CC-R): Greenhouse with plants, solar radiation, crop heat load, and natural ventilation.
In all cases, the following boundary conditions were applied: inlet velocity = 4.6 m·s−1, initial temperature = 36.23 °C, solar radiation on the roof = 5000 W·m−2. In OpenFOAM, the roof thermal load was implemented as a prescribed surface heat flux using externalWallHeatFluxTemperature (flux mode) with a net value derived from climatic data. The crop evapotranspiration load was introduced as an explicit volumetric source term in the energy equation via scalarSemiImplicitSource within fvOptions, reflecting its distributed nature throughout the canopy. A wall boundary condition would be physically inappropriate for the plants. This approach ensures thermodynamic consistency with the buoyantSimpleFoam solver, and the crop evapotranspiration load (233.68 W·m−2) was implemented as a uniform surface heat flux boundary condition on the conical surfaces representing the plants. The total heat power derived from the cultivation area was evenly distributed over the total external surface area of all cones, yielding a constant heat flux (W·m−2) applied to each cone. Thus, the energy enters the domain through the plant surfaces rather than as a volumetric source.
2.6. Physical and Turbulence Models
The simulations were conducted in steady state using buoyantSimpleFoam with a single-phase compressible air model. The Reynolds-Averaged Navier–Stokes (RANS) k-ω SST turbulence model was chosen owing to its established performance in buoyancy-driven indoor and agricultural applications [7,10]. Momentum convection employed a second-order discretisation, whereas turbulence quantities and enthalpy were treated with bounded first-order schemes. Gradients were evaluated using cell-limited linear methods, and Laplacian terms were stabilised through limited Gauss operators to address local mesh non-orthogonality.
A steady-state approach was adopted because greenhouse airflow typically evolves towards quasi-steady conditions during daytime operation, in the absence of rapid changes in solar input, vent motion or wind forcing. The characteristic flow timescale (1–10 s) is significantly shorter than the thermal response time of the crop canopy, making transient resolution unnecessary. Prior CFD studies of naturally ventilated greenhouses report that steady-state RANS modelling adequately captures mean airflow patterns, ventilation rates, and thermal gradients [5,7,8,22,23]. Although the flow is low-Mach, the compressible formulation was retained because buoyancy arises from density variations predicted by the energy equation. The Mach number remained below 0.02 throughout the domain, confirming that no compressibility artefacts were introduced.
2.7. Numerical Methods, Mesh Sensitivity, and Convergence Analysis
The steady-state simulations were performed using the buoyantSimpleFoam solver. The numerical setup, including discretisation schemes, solution algorithms, and convergence criteria, is summarised in Table 2. Mesh quality was verified, with a maximum aspect ratio of 6.435, average non-orthogonality of 0.984, and maximum skewness of 1.061, all within acceptable limits for CFD analysis [16,24,25].
Table 2.
Summary of numerical setup and parameters.
A mesh independence study was conducted using six characteristic element sizes: 500 mm, 100 mm, 80 mm, 70 mm, 65 mm, and 50 mm. A final mesh of approximately 2.0 million cells (corresponding to the 70 mm resolution) was selected, balancing accuracy and computational cost. Mesh convergence was quantified using the Grid Convergence Index (GCI) method [25] on three successively refined meshes. For velocity, the GCI on the fine mesh (70 mm) was 1.58%, which we report as the representative numerical uncertainty. For temperature, the GCI on the fine mesh was below 1 × 10⁻⁶, indicating asymptotic convergence.
The GCI analysis was performed on two refinement sequences. For the thermal variable, the sequence 70 mm–65 mm–50 mm (coarse–medium–fine) produced refinement ratios r21 = 1.296 and r32 = 1.073, with an observed GCI on the fine mesh below 1 × 10⁻⁶, indicating asymptotic saturation of the temperature field. For velocity, the best-behaved sequence among the tested configurations was 100 mm–70 mm–50 mm (coarse–medium–fine), with refinement ratios r21 = 1.391 and r32 = 1.430, and a GCI on the fine mesh of 1.58%. Based on this velocity-driven criterion, the 70 mm mesh (about 2.0 million cells) was selected as the computational grid for all simulations.
Convergence of the steady-state simulations was confirmed by monitoring the scaled residuals of all solved variables (p, U, h, k, ω) falling below 1 × 10⁻³, as well as by tracking the evolution of key physical quantities (e.g., average temperature and velocity at selected monitoring points) until they reached stable values.
2.8. Numerical Configurations and Evaluation Planes
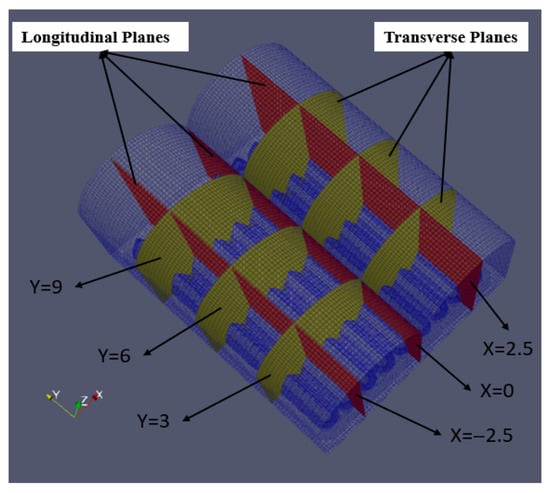
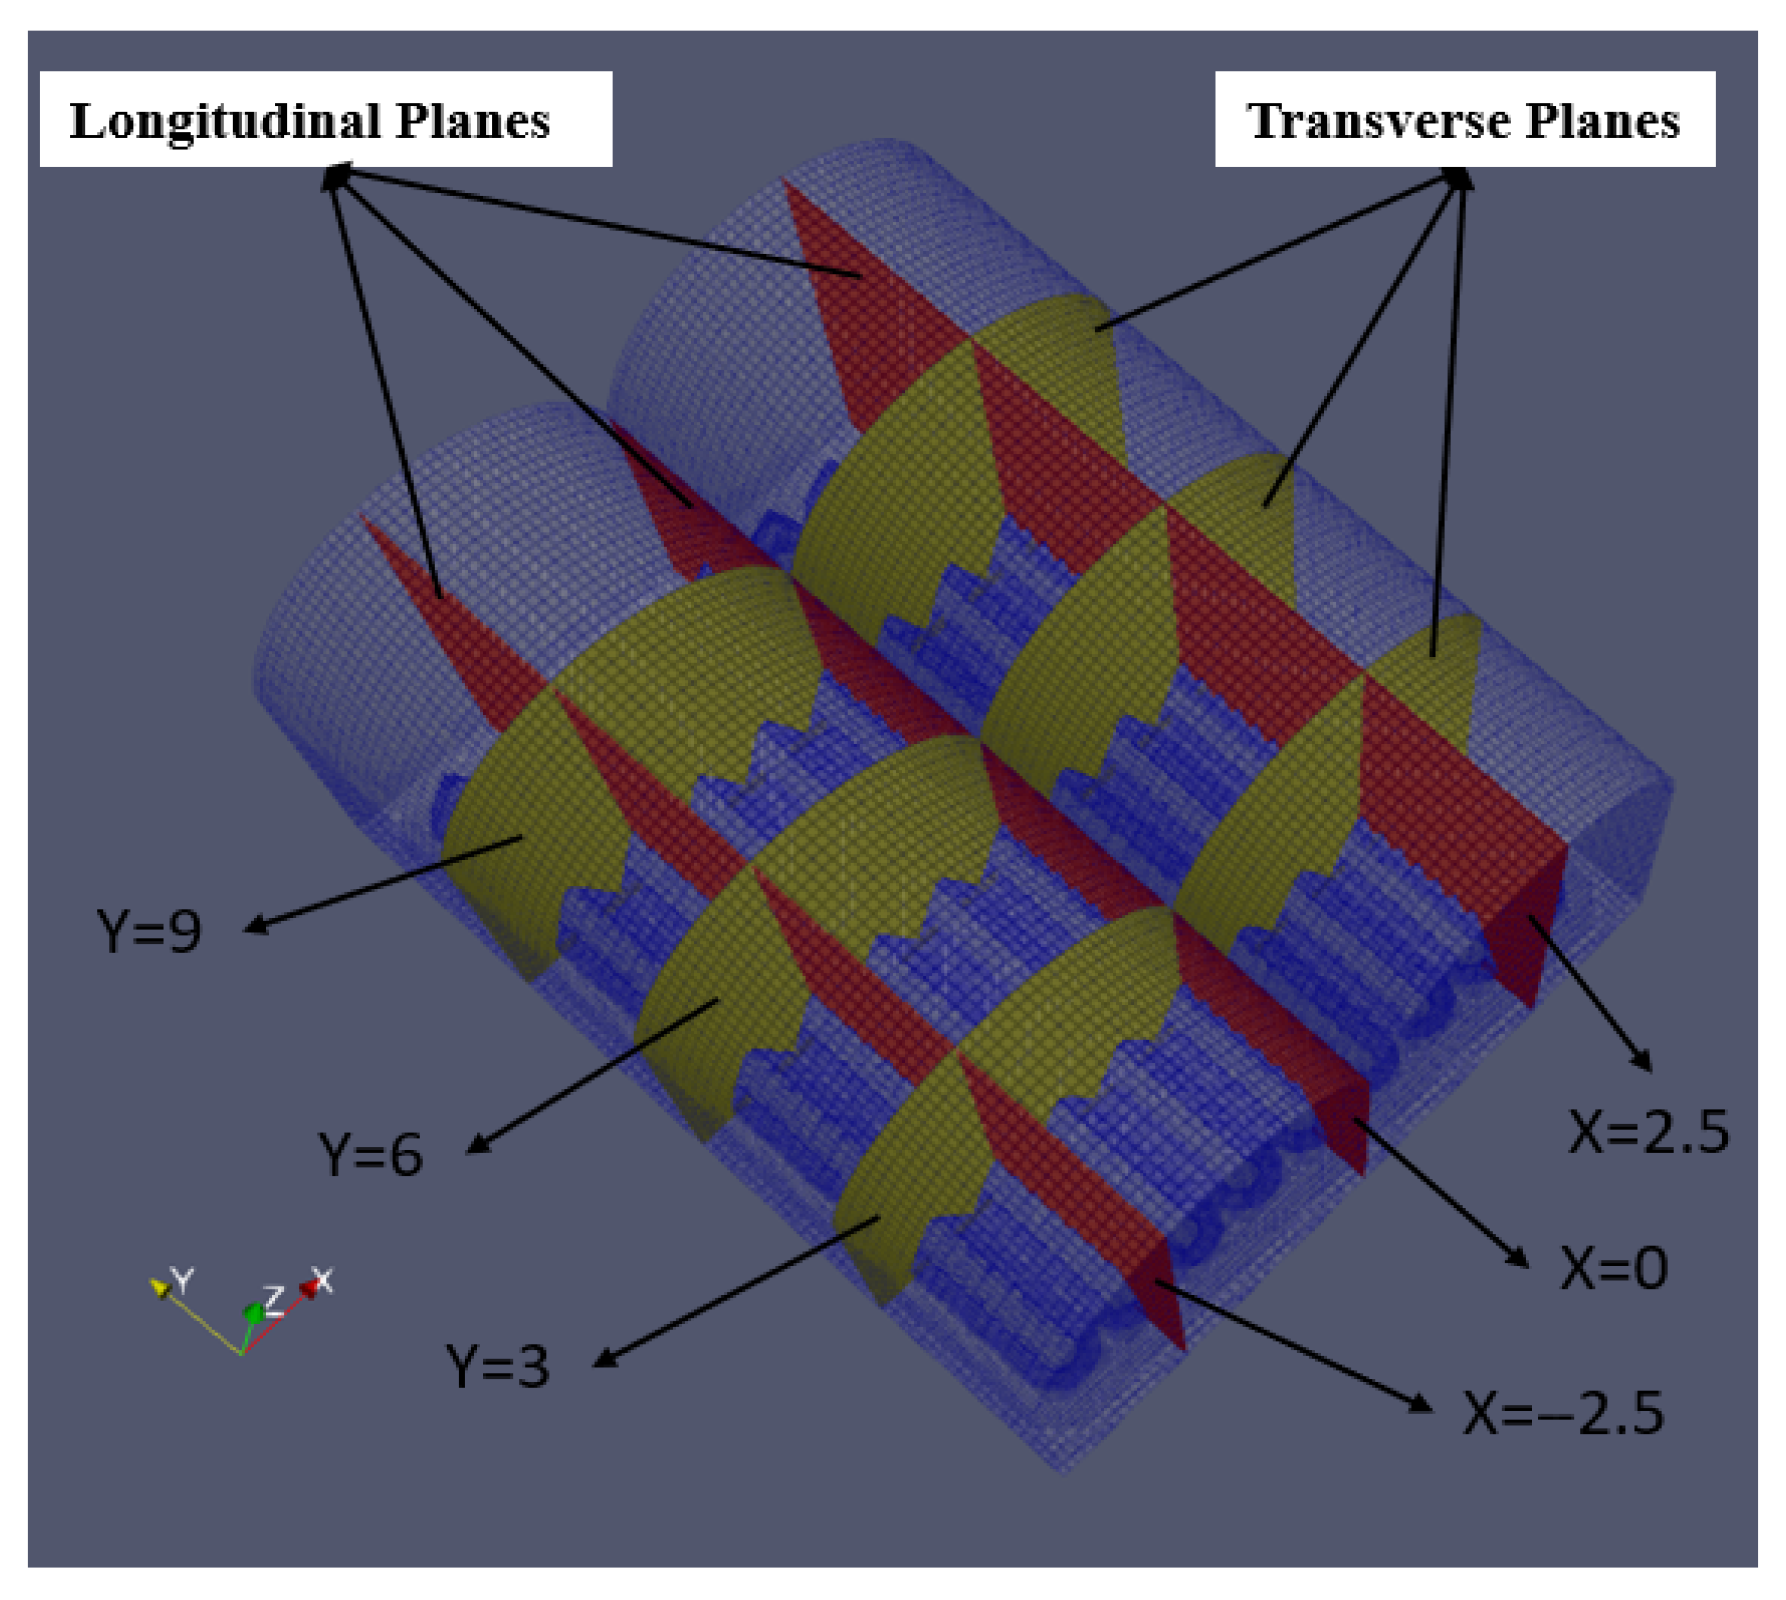
Three main computational setups corresponding to the configurations C1, C2, and C3 were executed. Velocity and temperature results were extracted from several planes strategically located within the greenhouse. Longitudinal planes were positioned at X = −2.5 m, X = 0 m, and X = 2.5 m, while transverse planes were placed at Y = 3 m, Y = 6 m, and Y = 9 m (Figure 4). The intersections of these planes provided nine evaluation locations used for quantitative comparison among the three scenarios.
Figure 4.
Planes and locations for numerical data sampling.
3. Results
3.1. Qualitative Analysis of Airflow and Temperature Distribution
To address this study’s broad objectives of evaluating the microclimate and identifying the role of biological factors, this section provides a qualitative comparison of the airflow and temperature fields (Objective i) while illustrating the visual differences introduced by crop presence (Objective ii) and evapotranspiration (Objective iii).
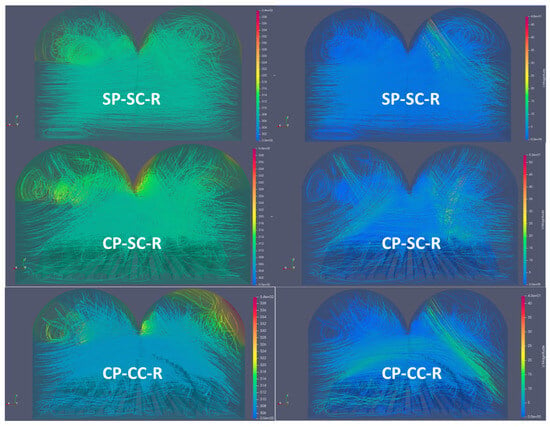
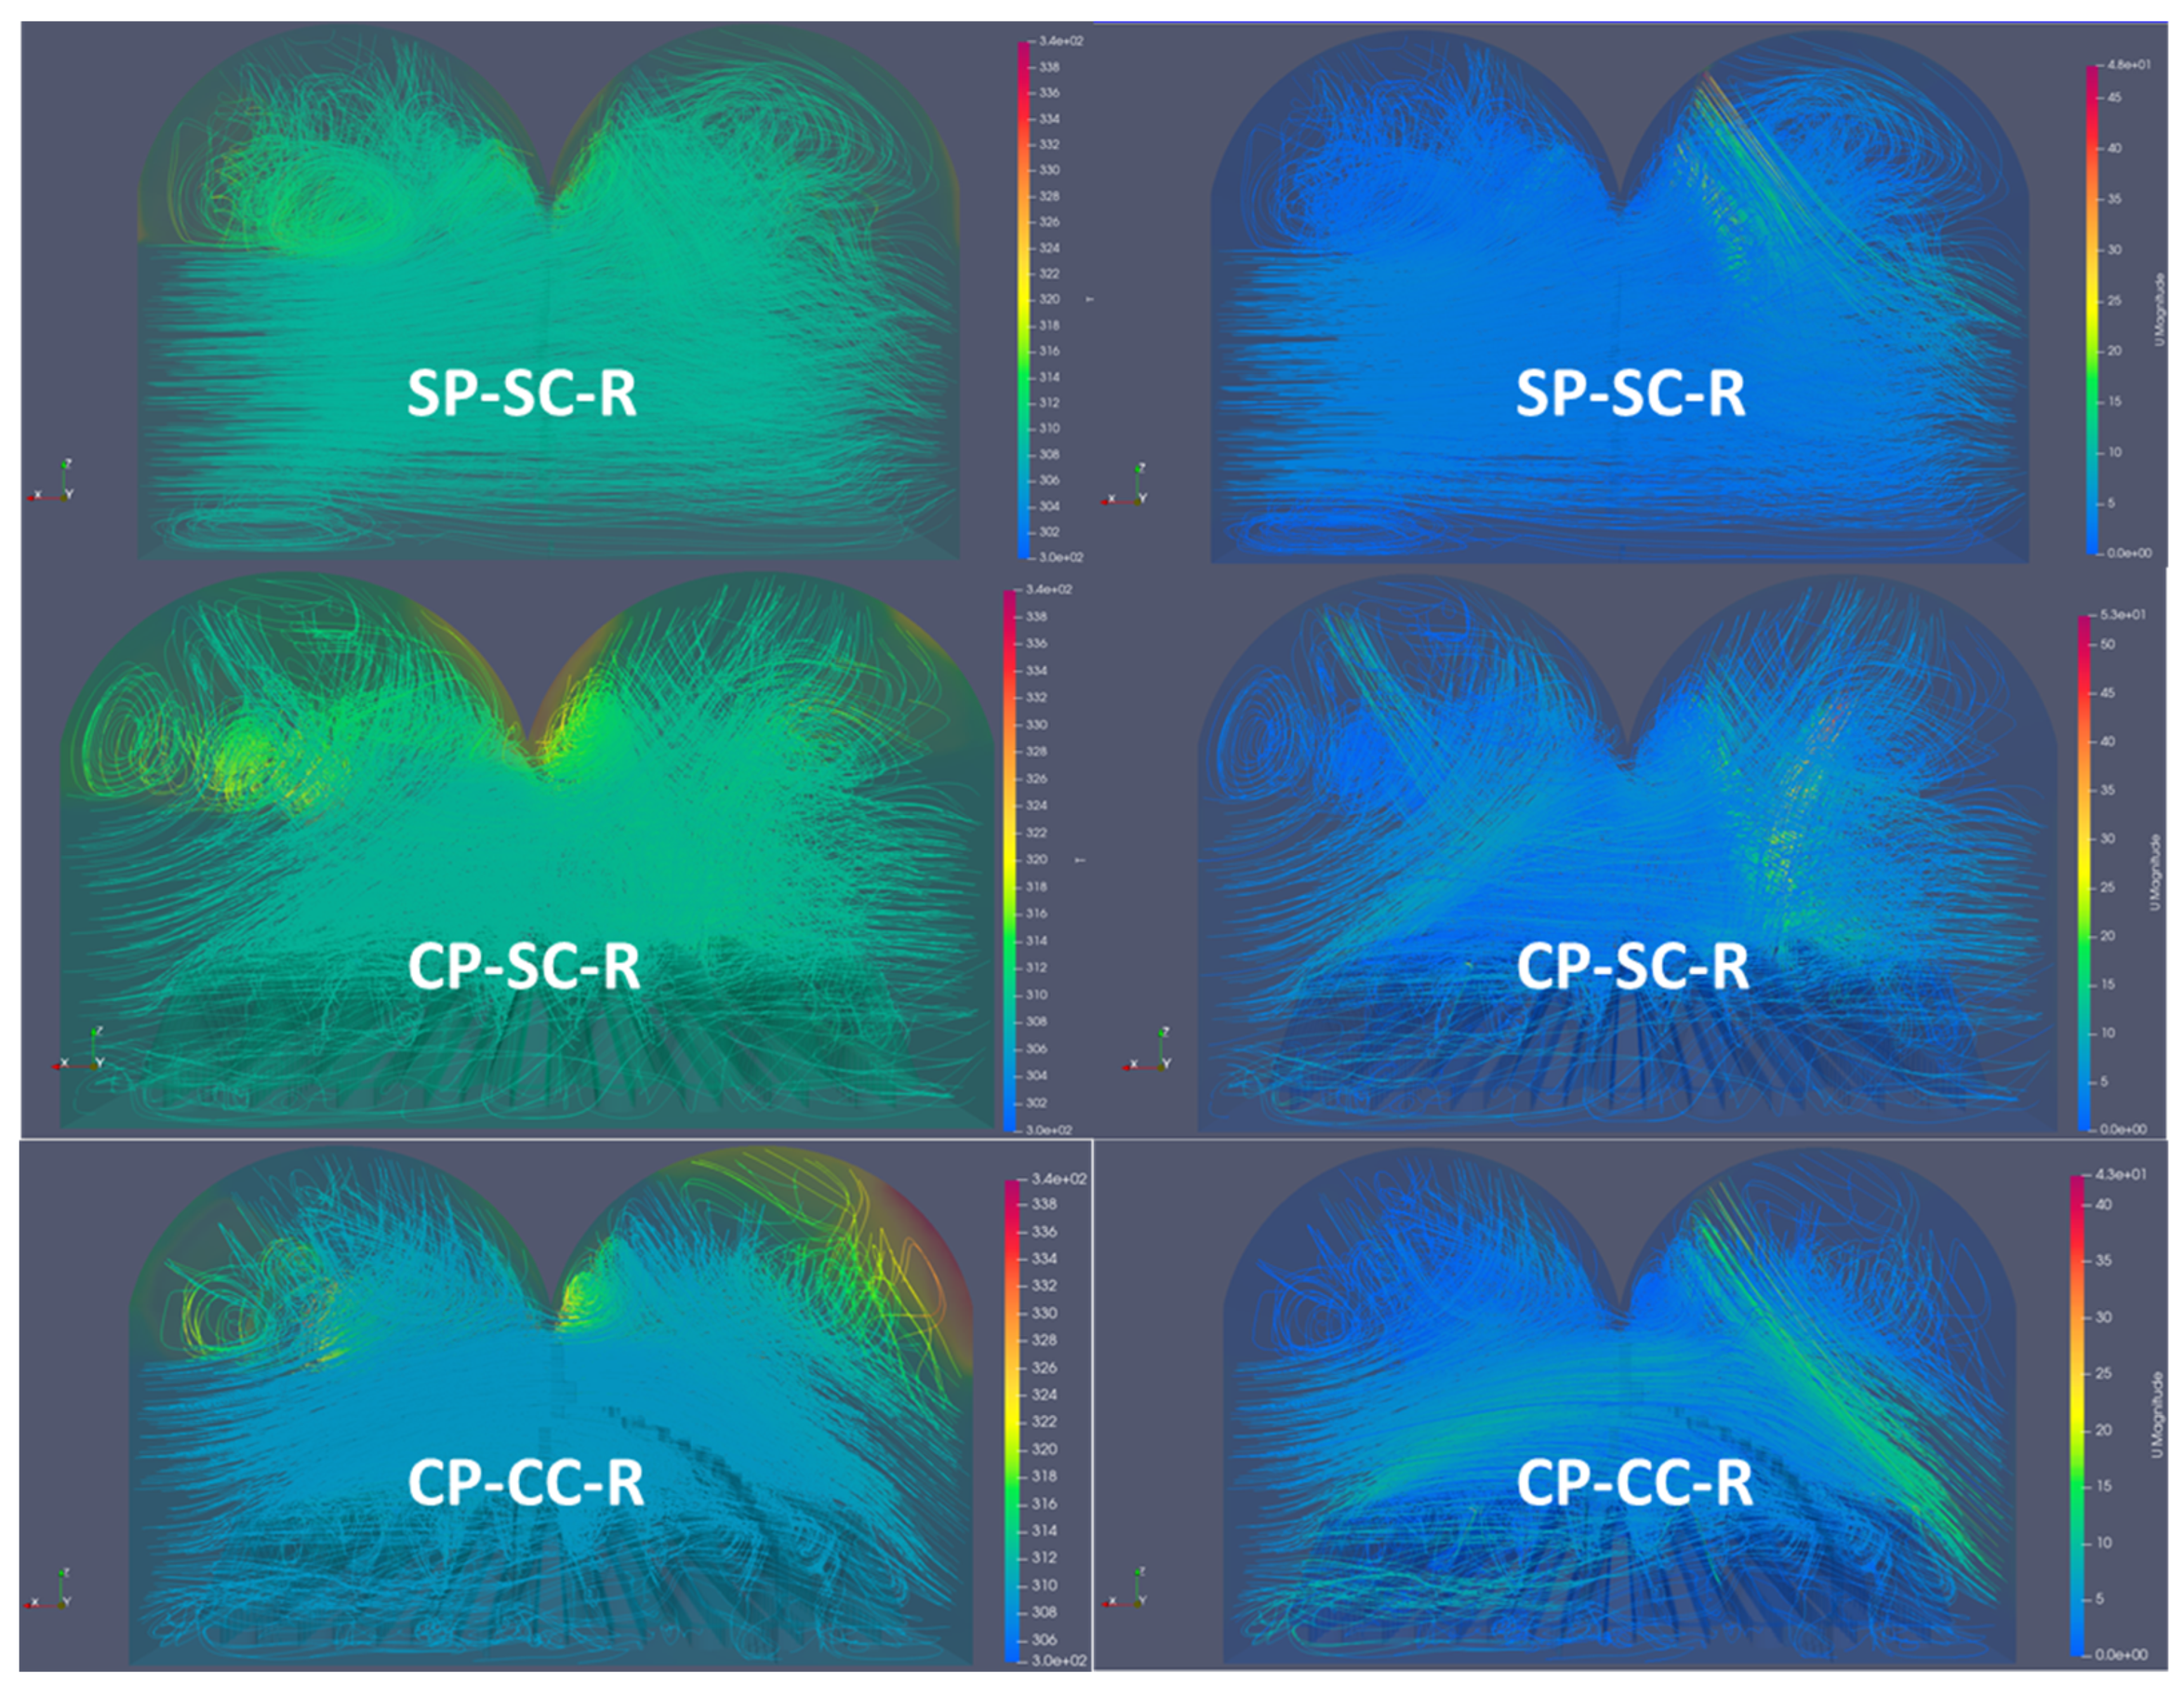
Figure 5 illustrates the overall simulation results for the three configurations. On the left-hand side, temperature distributions and streamlines are presented, while the right-hand side shows airflow patterns and wind speed magnitudes. From top to bottom, the figure displays the SP-SC-R, CP-SC-R, and CP-CC-R simulations, respectively.
Figure 5.
Streamlines of temperature and air velocity within the greenhouse for the three proposed models. From top to bottom: SP-SC-R, CP-SC-R, and CP-CC-R simulations. Temperature results on the left and wind velocity on the right.
The inclusion of plants in the computational domain significantly affected the airflow distribution. In the SP-SC-R configuration, the flow pattern was nearly laminar, with a uniform temperature distribution throughout most of the volume. Only mild turbulence and localised temperature increases were observed near the roof due to solar radiation absorption. In the CP-SC-R configuration, the introduction of the plant canopy generated more realistic airflow behaviour. The air streamlines were deflected by the plants, producing enhanced turbulence in the upper zone, which promoted temperature homogenisation and prevented stagnant air pockets. The roof zone exhibited higher temperatures, as radiation was redistributed across the two spans rather than concentrated at the roof apex as in the SP-SC-R case. Another notable difference was that both roof vents became active in the CP-SC-R simulation, whereas in SP-SC-R the left-hand vent showed negligible outflow. When the crop’s thermal load was included (CP-CC-R configuration), the overall temperature within the canopy remained similar, but a localised increase occurred in the upper region (above 4.5 m). This effect can be attributed to buoyant air rising quickly from the heated plants, which enhances convective motion and prevents overheating at crop level. The airflow streamlines between CP-SC-R and CP-CC-R configurations were qualitatively similar, confirming that evapotranspiration primarily affects the thermal, rather than dynamic, characteristics of the flow. Overall, these visual results indicate that vegetation acts as a porous medium, altering airflow structure, generating additional turbulence, and promoting vertical convective exchange.
3.2. Quantitative Analysis of Temperature Profiles
In alignment with objectives (ii) and (iii), which focus on quantifying the specific impacts of vegetation and its heat flux, this section presents a vertical analysis of temperature profiles to determine how crop presence and evapotranspiration-driven buoyancy modify the thermal environment.
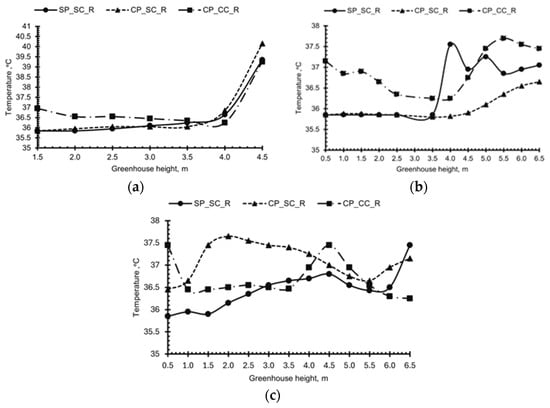
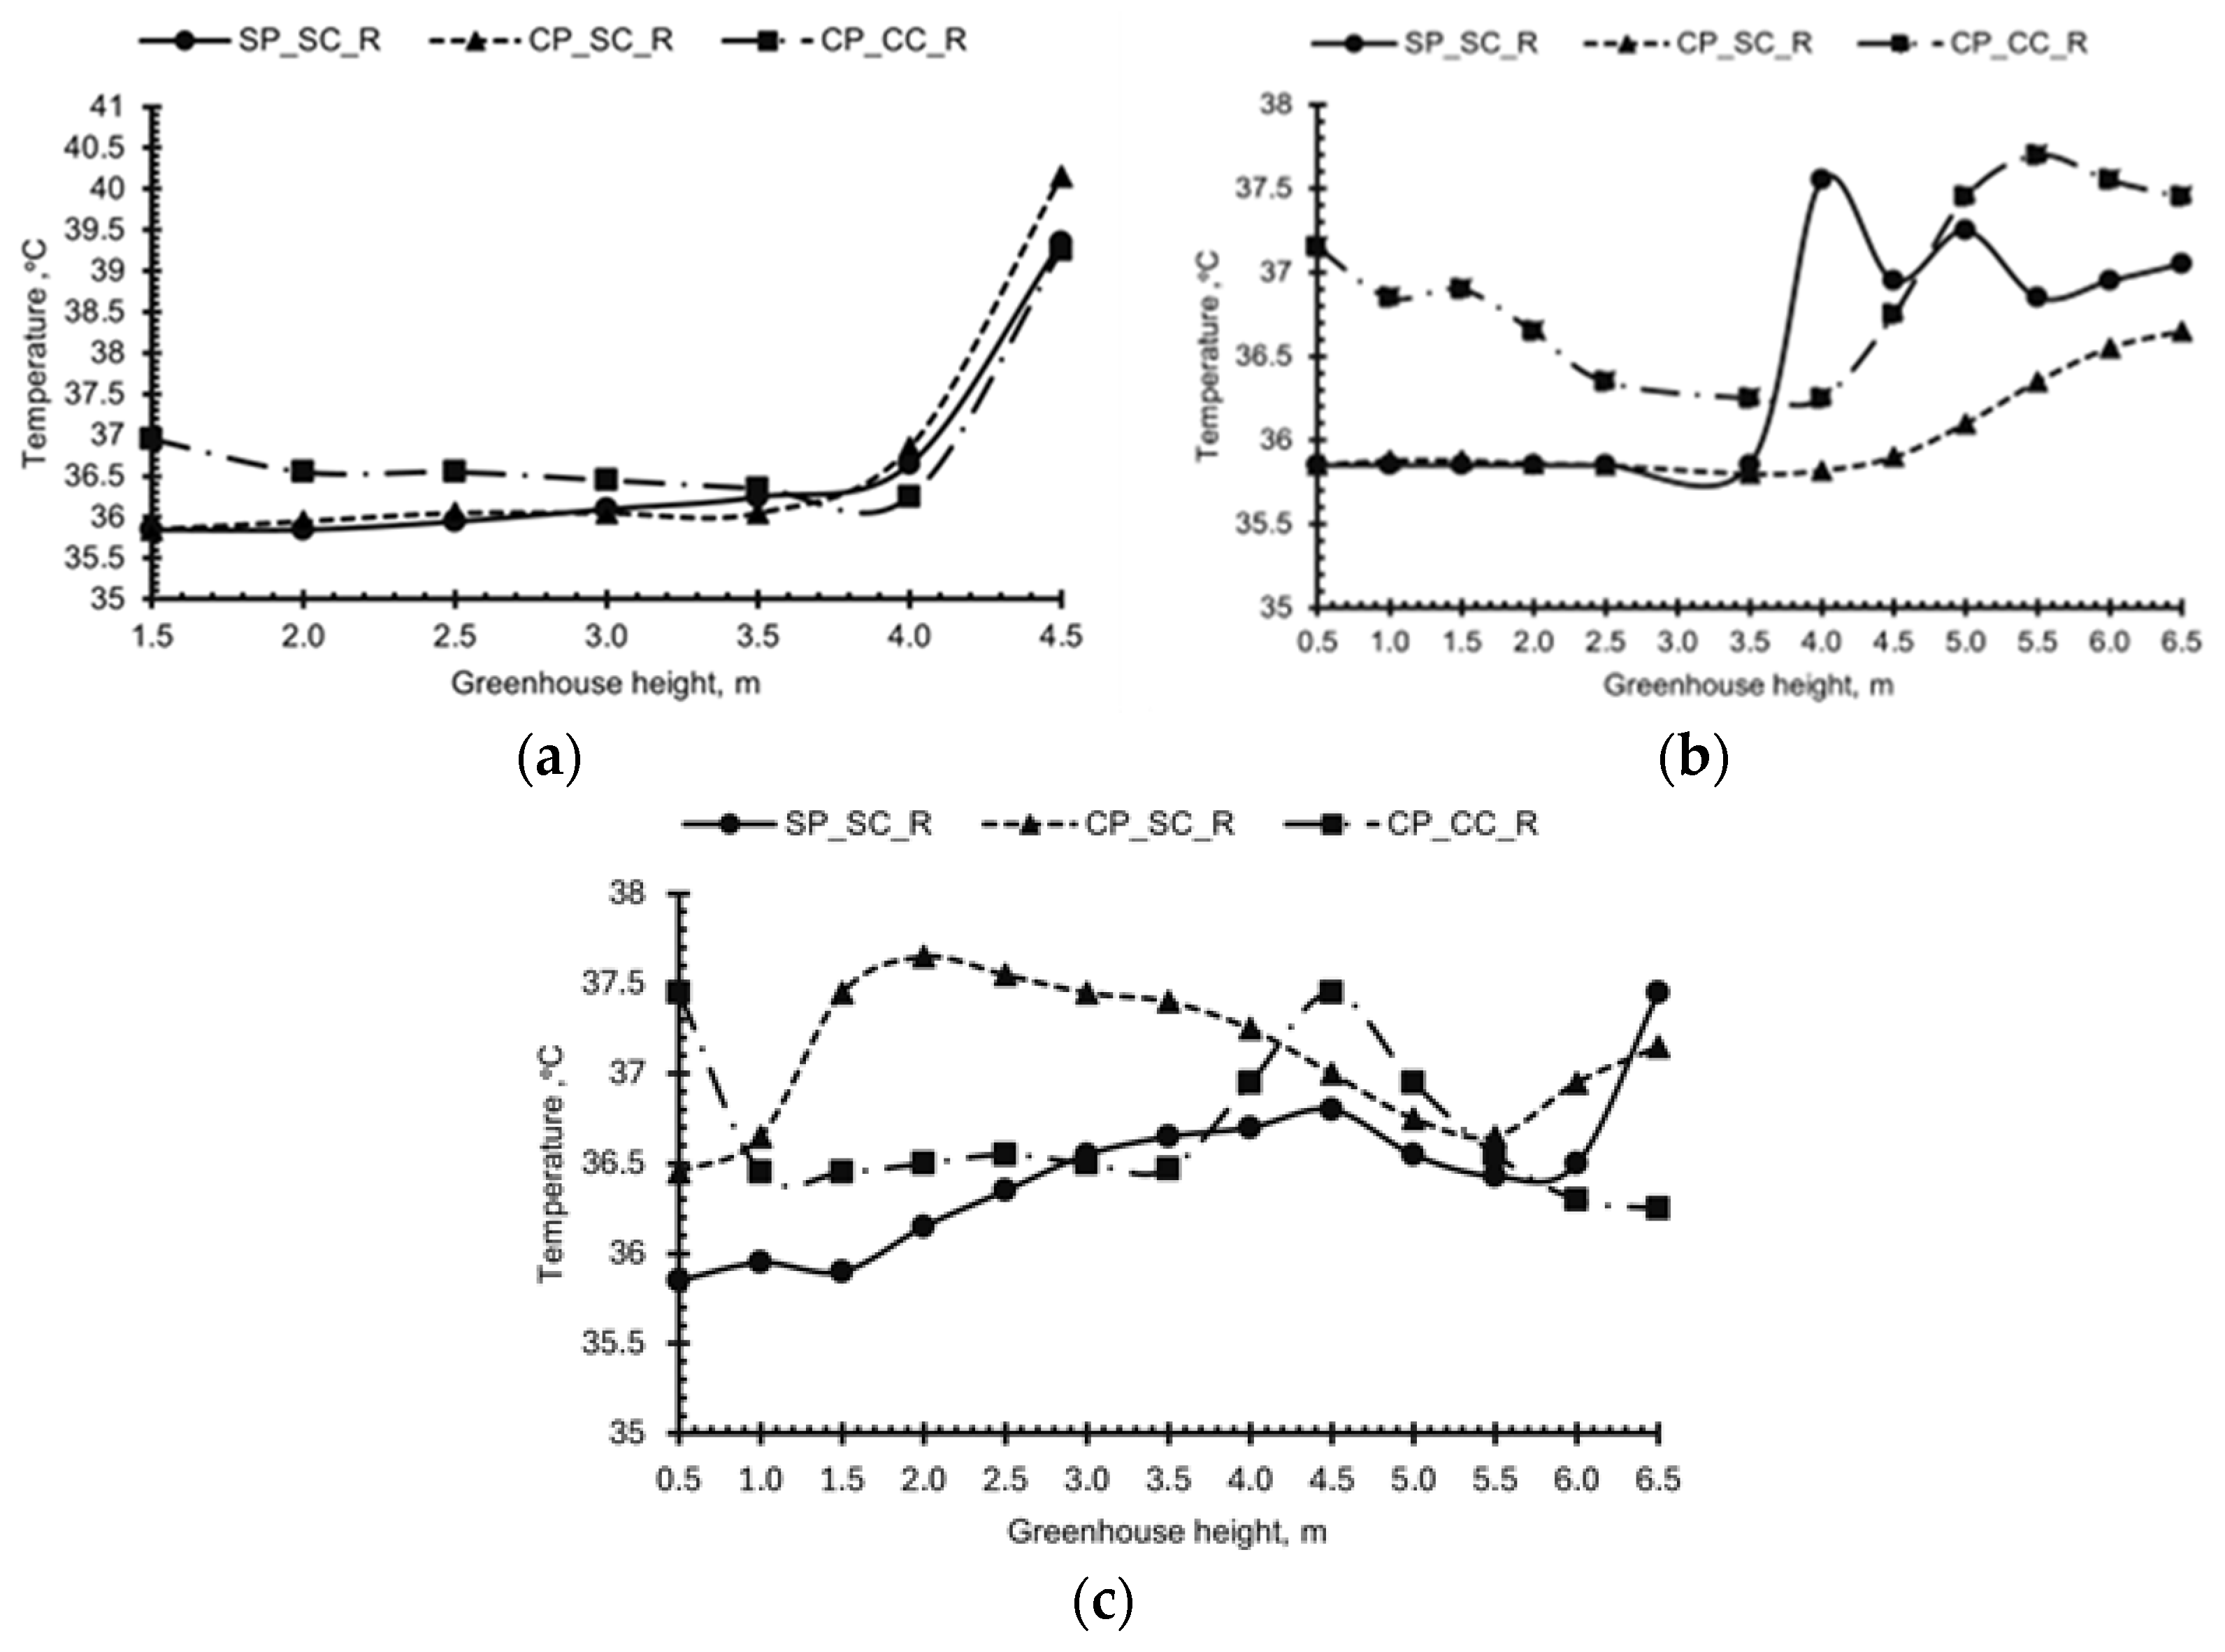
Temperature profiles were evaluated along nine spatial locations corresponding to the intersections of three longitudinal (X = −2.5, 0, 2.5 m) and three transverse (Y = 3, 6, 9 m) planes (Figure 4). Figure 6 shows the vertical temperature variation from the floor to the roof for the three configurations.
Figure 6.
Comparison of temperature profiles as a function of height inside the greenhouse for the transverse plane Y = 6 m intersecting three longitudinal planes: (a) X = 0 m; (b) X = 2.5 m; (c) X = −2.5 m.
At the central longitudinal plane (X = 0 m), the temperature exhibited clear stratification. In the SP-SC-R and CP-SC-R cases, the vertical distributions were almost identical, remaining slightly below the CP-CC-R profile up to 4 m. Above this height, a steep temperature increase occurred due to reduced air circulation, leading to heat accumulation near the roof. In the CP-CC-R configuration, the evapotranspiration load slightly increased canopy temperature but simultaneously enhanced upward convection, reducing stratification intensity. At the right-hand plane (X = 2.5 m), CP-CC-R showed higher temperatures in the crop zone (0.5–2 m height) than the other two cases, with differences up to 1.5 °C. Above 4 m, temperature increased sharply in SP-SC-R and CP-CC-R due to stagnant zones and rising warm air, respectively. Conversely, at X = −2.5 m, the CP-SC-R case displayed higher temperatures within the canopy, suggesting that evapotranspiration acted as a thermal stabiliser in the second span of the greenhouse. Across all planes, thermal stratification was evident above 4.5 m, confirming that natural convection alone could not effectively remove heat from the upper region.
Finally, the spatial analysis of thermal distribution revealed that the inclusion of evapotranspiration heat flux induced increases in canopy temperature. Specifically, at the X = 2.5 m plane, an average increase of 0.93 °C was observed, with a maximum differential of 1.3 °C compared to the configuration without thermal load (CP-SC-R). In the central section (X = 0 m), the mean increment was 0.81 °C with a maximum value of 1.0 °C, while at the leeward plane (X = −2.5 m), the average thermal elevation was 0.64 °C with a peak of 1.1 °C. These quantitative results underscore that the crop’s metabolic heat is a determining factor in the microclimate’s predictive accuracy, as its omission leads to an underestimation of the actual thermal load in tropical greenhouses.
3.3. Quantitative Analysis of Velocity Profiles
To further fulfil objective (ii) regarding the aerodynamic influence of the canopy and objective (iii) concerning the dynamic shifts caused by thermal regulation, the following analysis quantifies wind velocity variations and the drag effect across different sections of the greenhouse.
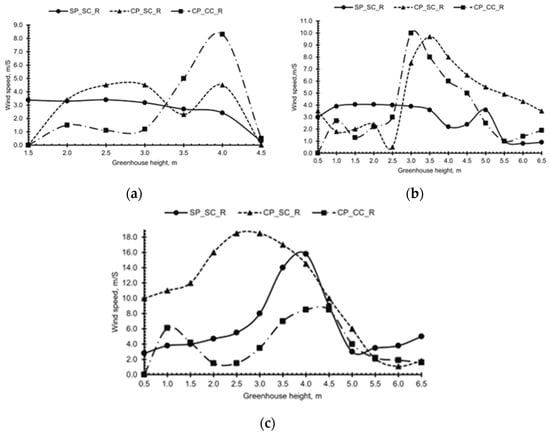
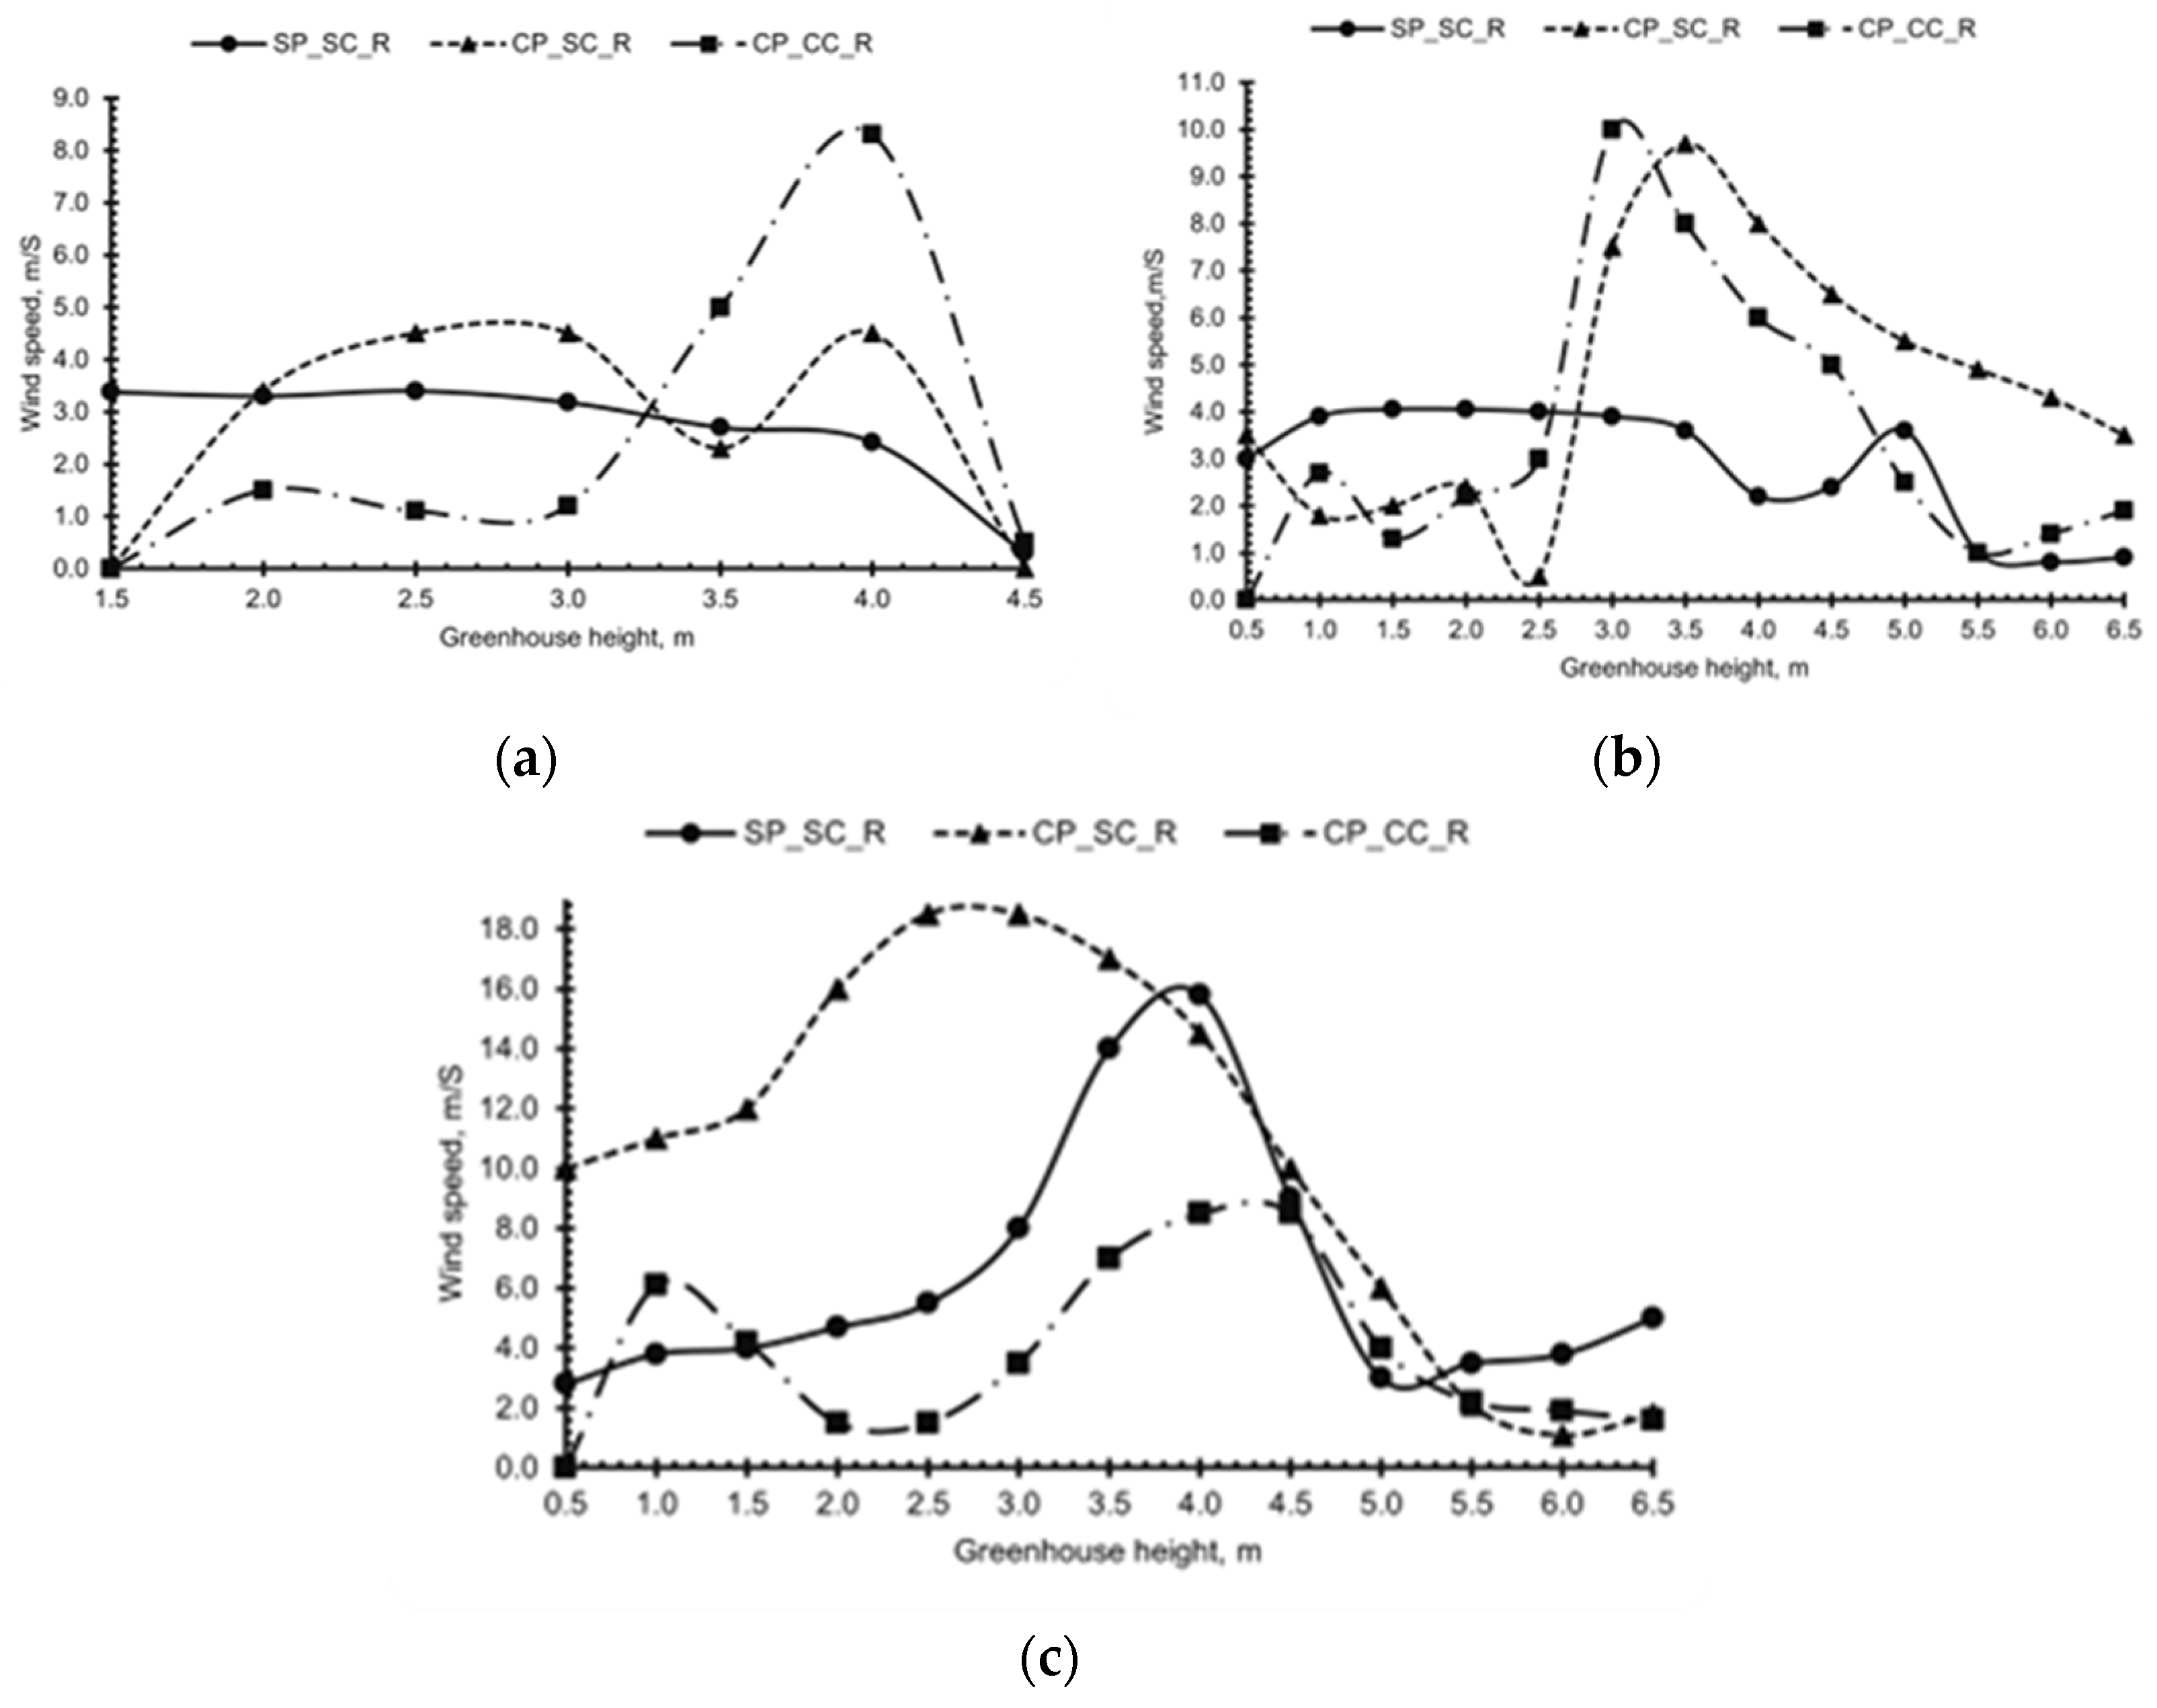
Figure 7 presents the vertical velocity profiles along the same nine spatial locations. The presence of plants substantially modified air movement. In the SP-SC-R model, velocities within the crop zone (0.5–2 m) reached approximately 4 m·s−1, whereas in CP-SC-R and CP-CC-R they dropped below 2 m·s−1, consistent with the drag effect of the vegetation canopy.
Figure 7.
Comparison of wind velocity profiles as a function of height inside the greenhouse for the transverse plane Y = 6 m intersecting three longitudinal planes: (a) X = 0 m; (b) X = 2.5 m; (c) X = −2.5 m.
In the central longitudinal plane (X = 0 m), SP-SC-R displayed the highest near-ground velocities (about 4 m·s−1). In contrast, the CP-SC-R and CP-CC-R cases showed reduced magnitudes due to flow obstruction by the canopy. Between 2 and 3.5 m, the CP-SC-R configuration exhibited higher mean velocities than CP-CC-R, which we attribute to the redistribution of mean flow energy by the buoyancy term in the momentum equation (activated by the crop’s evapotranspiration heat source). It should be noted, however, that steady-state RANS provides the time-averaged buoyancy effect and does not resolve instantaneous fluctuations; the observed trend indicates a consistent modification of the mean field under the prescribed constant thermal load. At the right-hand plane (X = 2.5 m), CP-SC-R and CP-CC-R displayed enhanced velocities between 2.5 and 5 m due to the reduced flow area caused by the crop. CP-SC-R produced slightly higher values, attributed to the absence of buoyant heat flux. At heights above 5 m (near the roof outlets), the CP-SC-R model showed the most uniform flow, favouring hot-air extraction through the roof vents. At the leeward plane (X = −2.5 m), located at the outlet section, SP-SC-R and CP-CC-R reached moderate exit velocities (about 4 m·s−1), while CP-SC-R produced higher peaks (up to 14 m·s−1) due to channelled flow and limited buoyant release. Beyond 5 m, velocity differences among configurations became negligible. Furthermore, comparing the velocity profiles between the models with and without the crop revealed an average reduction of 55% in flow magnitudes within the zone occupied by the plant canopy (0.5–2.0 m). This velocity attenuation was particularly pronounced in the leeward plane (X = −2.5 m), where the aerodynamic resistance of the vegetation significantly limited the air’s kinetic energy before its exit. These results indicate that the inclusion of the crop promotes turbulent mixing but may also generate local acceleration zones, particularly at the vent outlets.
3.4. Spatial Distribution of Temperature
Addressing the requirement to evaluate temperature fields (Objective i) and assess the contribution of the latent heat flux (Objective iii), this section examines the spatial distribution of heat to identify how the integrated approach captures localised stratification and cooling zones.
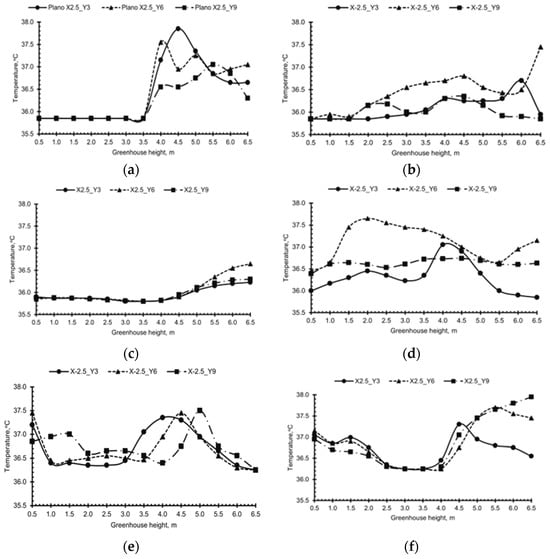
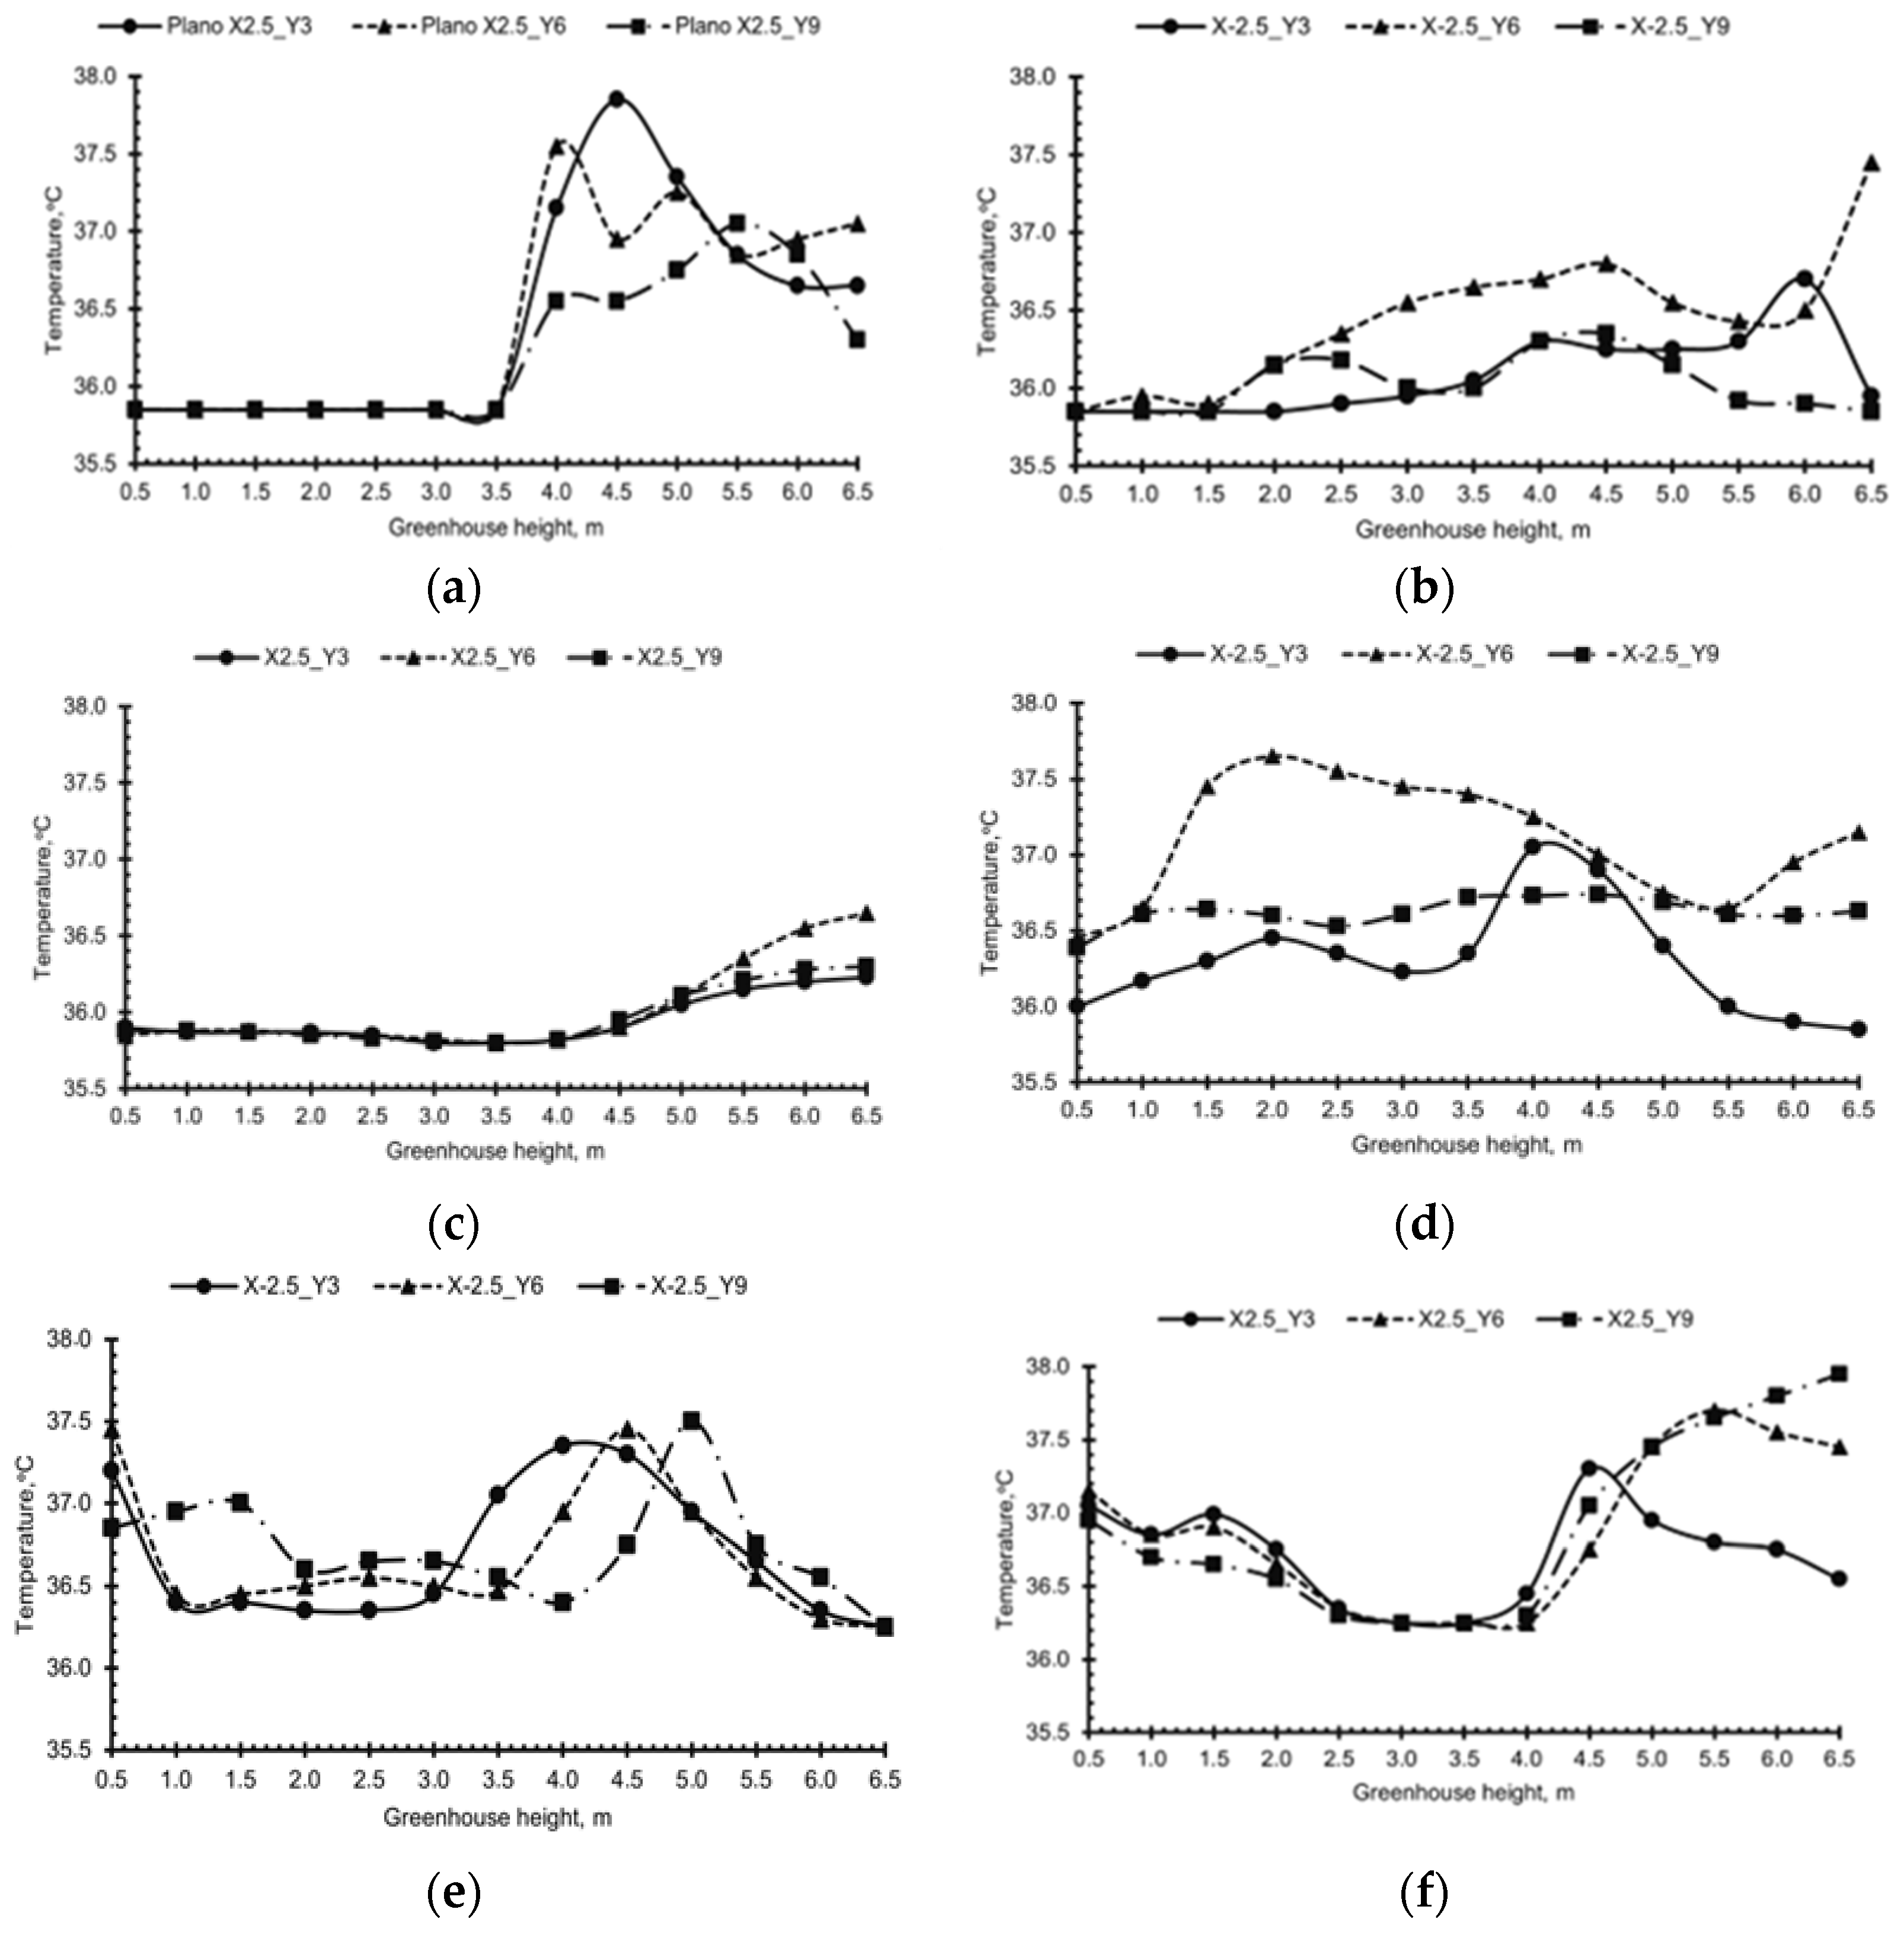
Figure 8 compares the spatial temperature distributions for the three configurations. In SP-SC-R, both greenhouse spans exhibited markedly different temperature patterns. In the inlet span, temperature remained nearly constant up to 3.5 m, followed by pronounced stratification, reaching maxima of 37.85 °C near the roof. In the outlet span, temperature increased more gradually, reaching 36.8 °C at 4.5 m. This behaviour reflects weak vertical mixing and heat accumulation near the ceiling. In CP-SC-R, vegetation reduced thermal stratification considerably. The left-hand span (X = 2.5 m) maintained nearly uniform temperatures (35.8 °C to 36.3 °C), as the plant canopy promoted upward mixing. The right-hand span (X = −2.5 m) displayed a more heterogeneous distribution, with higher temperatures in the central plane (Y = 6 m), indicating localised stagnant zones. The CP-CC-R configuration exhibited the most balanced thermal behaviour. Near the base (0.5–1.5 m), temperatures remained around 36.9 °C due to the combined effects of absorbed radiation and crop heat emission. In the middle region (2 m to 4 m), temperature decreased slightly owing to active convection induced by evapotranspiration. Above 4.5 m, however, temperatures increased again, reaching maxima of 37.95 °C, confirming the persistence of upper-layer heat accumulation.
Figure 8.
Comparison of the temperature profiles as a function of height for the three evaluated models at transverse planes Y = 0 m, Y = 6 m, and Y = 9 m and longitudinal positions X = 2.5 m and X = −2.5 m. Subfigures represent: (a,b) SP-SC-R; (c,d) CP-SC-R; and (e,f) CP-CC-R.
Thermal Stratification Intensity (TSI) and vertical temperature gradients provide quantitative measures of the observed patterns. In the model without plants (SP-SC-R), the average TSI was 1.42 °C (maximum 3.17 °C), and the vertical gradient between 4.5 m and 5.5 m in the central plane (X = 0) was 0.42 °C·m−1. The inclusion of the plant canopy without evapotranspiration (CP-SC-R) increased the average TSI to 1.63 °C (peak 4.4 °C) and reduced the gradient slightly to 0.38 °C·m−1, indicating that aerodynamic obstruction traps heat in the upper zone. When evapotranspiration was added (CP-CC-R), the average TSI dropped markedly to 0.49 °C (maximum 2.78 °C), and the gradient further decreased to 0.31 °C·m−1, confirming that buoyancy-driven mixing alleviates stratification. Across all measurement planes, vertical gradients in the 4.5–5.5 m layer ranged from −1.00 to 2.50 °C·m−1 in SP-SC-R, from −0.90 to 4.30 °C·m−1 in CP-SC-R, and from −0.90 to 1.50 °C·m−1 in CP-CC-R. Although evapotranspiration consistently reduces the intensity and spatial variability of thermal stratification, positive gradients persist in all configurations, demonstrating that natural ventilation alone cannot fully eliminate heat accumulation under the evaluated tropical design conditions.
These findings highlight the influence of greenhouse geometry, orientation, and ventilation area on heat distribution and emphasise the need for complementary ventilation mechanisms to prevent localised overheating.
3.5. Spatial Distribution of Velocity
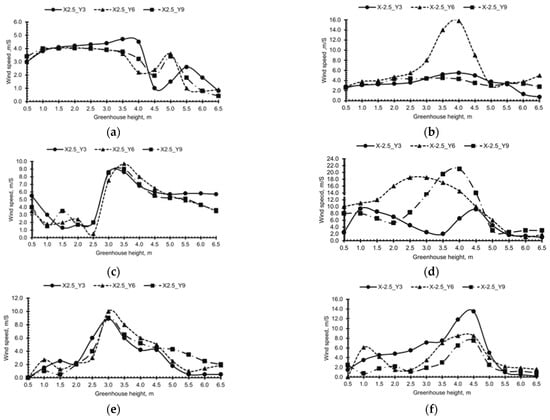
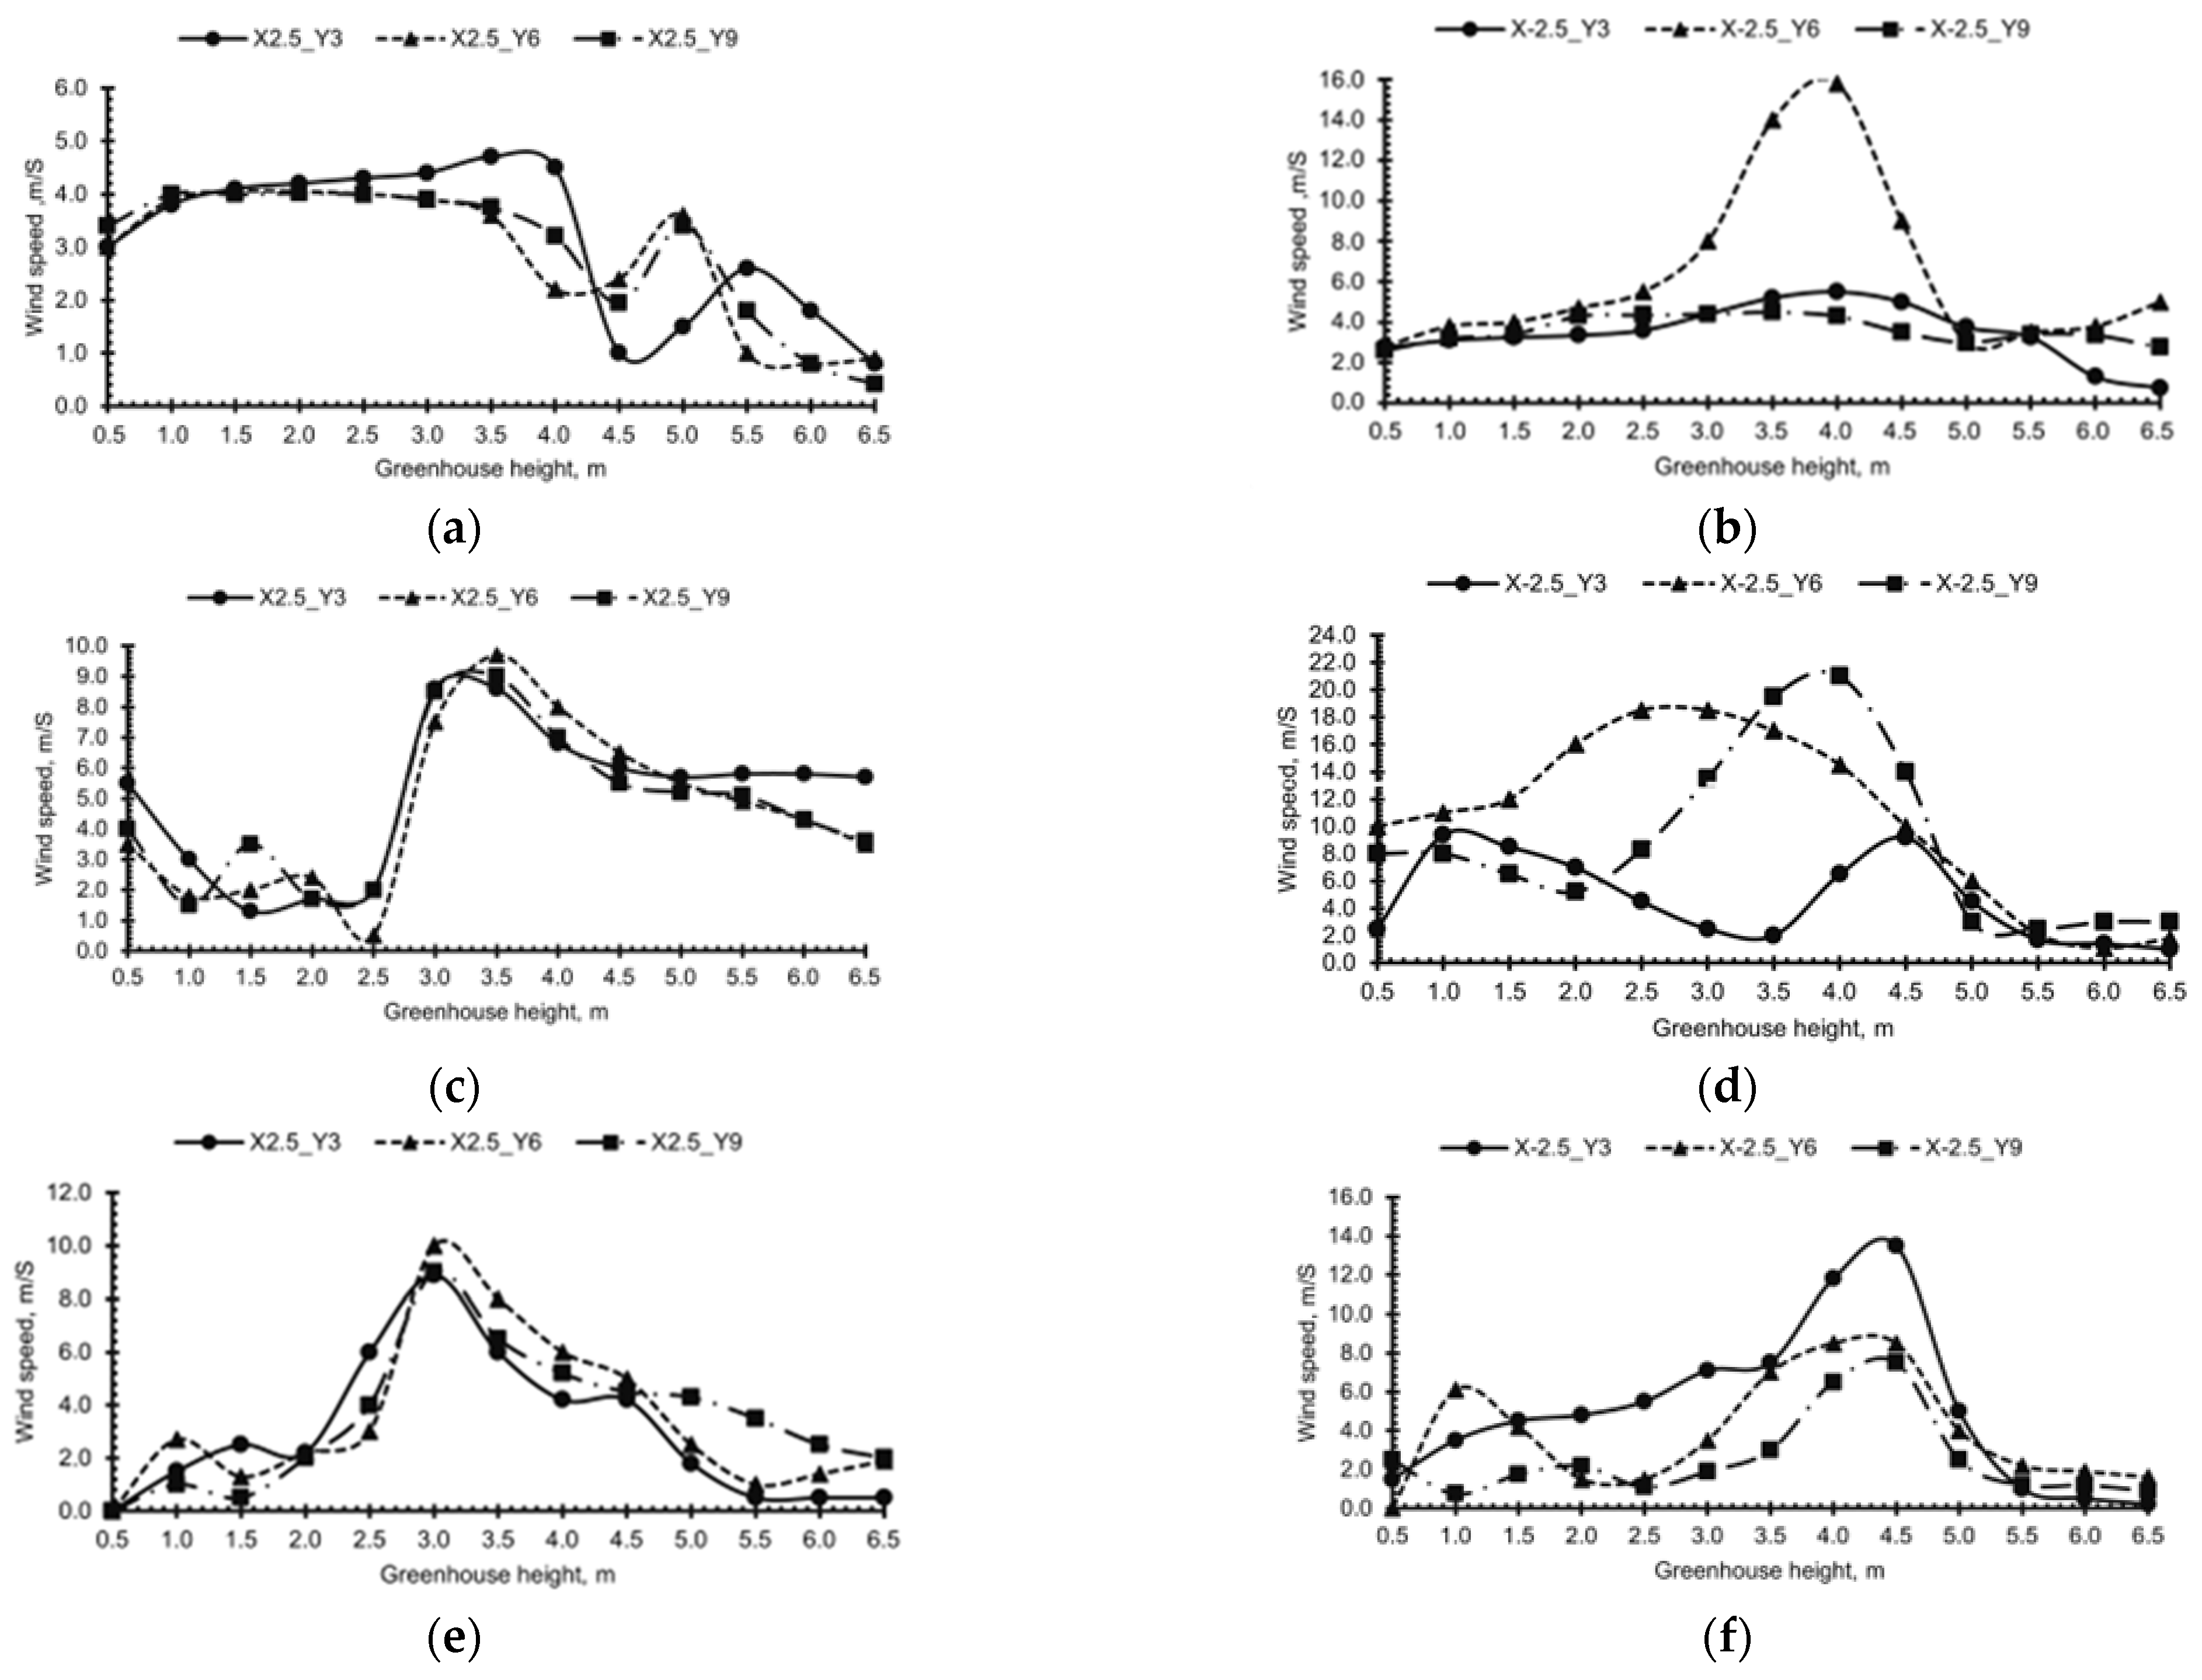
Concluding the evaluation of airflow fields (Objective i) and the quantification of crop impact (Objective ii), this final section analyses the spatial velocity distribution to identify channelling effects and the overall influence of the tomato canopy on ventilation patterns under critical conditions. Figure 9 shows the vertical velocity profiles across the greenhouse for all configurations.
Figure 9.
Comparison of wind velocity profiles with height for the three evaluated models at transverse planes Y = 3 m, Y = 6 m, and Y = 9 m, intersecting the longitudinal positions X = 2.5 m and X = −2.5 m. Subfigures represent: (a,b) SP-SC-R; (c,d) CP-SC-R; and (e,f) CP-CC-R.
In SP-SC-R, velocities were low and stable in both spans, ranging from 3.0 to 4.4 m·s−1 up to 3.5 m height, then sharply declining near the roof (less than 1.0 m·s−1). In CP-SC-R, the presence of vegetation induced irregular velocity gradients, with local peaks up to 9.7 m·s−1 and intensified turbulence between 3.0 and 3.5 m. The right-hand span (X = −2.5 m) exhibited maximum speeds up to 18.5 m·s−1 in the central section (Y = 6 m), revealing strong vertical acceleration due to channelling effects. In CP-CC-R, airflow was more uniform and moderate, with velocities ranging from 3 to 10 m·s−1, slightly increasing in the mid-height region and decreasing near the roof. The velocity peaks (up to 13.5 m·s−1) were lower than those of CP-SC-R, suggesting that buoyancy-driven convection mitigated excessive shear. The formation of stable convective cells improved overall ventilation efficiency and reduced stagnation zones. In all models, the central transverse plane (Y = 6 m) exhibited the highest velocities, likely due to internal geometric constraints that channelled the flow. However, some simulated velocities exceeded 20 m·s−1, which may be excessive for certain crops and could cause mechanical stress on the plants.
4. Discussion
This study was designed with three main objectives: (i) to evaluate airflow and temperature fields using CFD under tropical conditions; (ii) to quantify the impact of crop presence (aerodynamic drag); and (iii) to assess the contribution of evapotranspiration-driven heat flux. The following discussion summarises the findings in relation to each objective and then addresses the physical mechanisms, practical implications, and limitations.
The simulations show that the empty greenhouse (SP-SC-R) produces an unrealistically uniform temperature distribution and a nearly laminar flow pattern, with velocities in the crop zone reaching 4 m·s−1. Once the crop geometry is included (CP-SC-R), the mean velocity in the canopy (0.5–2.0 m) drops by 55% (from 4 m·s−1 to below 2 m·s−1), confirming that vegetation acts as a porous obstacle that reorganises the internal flow. The inclusion of evapotranspiration (CP-CC-R) does not further modify the mean velocity field significantly but alters the thermal distribution, reducing vertical temperature gradients.
The crop’s aerodynamic drag not only reduces wind speed but also increases turbulence intensity, as evidenced by the higher velocity fluctuations (not directly measured, but inferred from the k-ω SST model’s turbulent kinetic energy field). The most striking effect is the change in thermal stratification: the average Thermal Stratification Intensity (TSI) increased from 1.42 °C in SP-SC-R to 1.63 °C in CP-SC-R, with a maximum TSI of 4.4 °C. This counter-intuitive increase is explained by the physical barrier effect: the canopy restricts vertical mixing, causing heat to accumulate in the upper zone (above 4.5 m). The vertical temperature gradient in the central plane (X = 0, 4.5–5.5 m) changed from 0.42 °C·m−1 (SP-SC-R) to 0.38 °C·m−1 (CP-SC-R), a modest reduction that does not compensate for the higher peak TSI.
When the crop’s thermal load (233.68 W·m−2) is activated, a new mechanism appears: buoyancy-driven convection. The average TSI drops markedly to 0.49 °C (maximum 2.78 °C), and the vertical gradient further decreases to 0.31 °C·m−1. However, temperatures within the canopy increase by 0.6–1.3 °C on average (maximum difference 1.5 °C), because the latent heat flux adds sensible heat to the air. This confirms that evapotranspiration improves thermal mixing but does not eliminate the need for adequate ventilation.
Stratification arises from the competition between buoyant forces (warm air rising) and forced convective mixing. In the empty greenhouse, the roof receives 5000 W·m−2 of solar radiation, heating the air near the ceiling and creating a stable gradient. The presence of plants adds aerodynamic resistance, reducing mixing and allowing the warm roof layer to persist. When evapotranspiration is included, the crop itself becomes a heat source, generating upward buoyant plumes that enhance vertical exchange. Nevertheless, the roof geometry (semi-circular with limited vent area) and the low wind speed (4.6 m·s−1) cannot overcome the buoyancy production, so a residual gradient remains.
Tomato plants are sensitive to both high temperatures and excessive air movement. The observed canopy temperatures (36–37.5 °C) exceed the optimal range for photosynthesis (25–30 °C) and can reduce fruit set and quality [9,19]. The vertical gradient (0.3–0.45 °C·m−1) implies that the upper part of the canopy (2.5 m) may be 1–1.5 °C warmer than the lower part, potentially causing uneven ripening. Moreover, the high velocity peaks near 2.5 m (6–10 m·s−1) can induce stomatal closure and water stress, further reducing productivity. Therefore, the combination of thermal and mechanical stress calls for active mitigation.
Based on the findings, we propose the following specific measures for tropical greenhouse design:
- (1)
- Increase roof vent area to at least 30% of the ground area to reduce exit velocities and enhance heat extraction, as already suggested by [4].
- (2)
- Install windbreak screens or perforated baffles on the leeward side to dissipate high-speed jets without blocking overall ventilation.
- (3)
- Consider hybrid ventilation (e.g., low-speed fans or extractors) to provide background mixing during periods of low wind or extreme radiation.
Three main limitations must be acknowledged:
- Steady-state RANS: it cannot capture instantaneous fluctuations due to gusts or intermittent thermal plumes. Consequently, ventilation efficiency under real fluctuating wind conditions may be overestimated. Future work should employ unsteady RANS or large-eddy simulation (LES) to verify the transient response.
- Simplified crop geometry: the cone-cylinder representation reproduces the overall drag coefficient (CD = 0.26) but does not resolve leaf-scale turbulence generation. A porous medium model based on leaf area density (LAI) distribution could provide more accurate heat and moisture exchange predictions.
- Lack of experimental validation: while the mesh-independence study ensures numerical convergence, absolute accuracy remains unconfirmed. Field measurements of temperature and velocity inside the same greenhouse under similar climatic conditions are needed to calibrate and validate the model. We plan to conduct such monitoring in a future study.
The discussion demonstrates that realistic CFD modelling of tropical greenhouses must include both aerodynamic drag and evapotranspiration-induced buoyancy. Natural ventilation alone is insufficient to maintain optimal temperatures for tomato cultivation; hybrid or mechanical ventilation is required. The specific design recommendations provided here offer practical guidance for engineers and growers in warm climates.
5. Conclusions
This study applied Computational Fluid Dynamics (CFD) to evaluate the effect of crop presence and evapotranspiration on natural ventilation and thermal stratification in a tomato greenhouse under tropical conditions. Three configurations were simulated to progressively incorporate the aerodynamic and thermal effects of vegetation: SP-SC-R (greenhouse without plants), CP-SC-R (with plants, aerodynamic drag only), and CP-CC-R (with plants and evapotranspiration heat load). The following conclusions are drawn in direct response to the three research objectives:
- Airflow modification by crop presence: The inclusion of plants reduced the mean air velocity in the canopy region (0.5–2 m) from approximately 4 m·s−1 to below 2 m·s−1 (a 55% reduction), confirming the crop’s role as a porous medium that increases turbulence and reorganises the flow field. Extreme wind speeds exceeding 20 m·s−1 were observed in the leeward span (X = −2.5 m, Y = 6 m), but these peaks occur predominantly above 2.5 m height, i.e., the main foliage.
- Thermal stratification: Thermal stratification persisted above 4.5 m in all configurations. The vertical temperature gradient (4.5–5.5 m) decreased from 0.42 °C·m−1 (SP-SC-R) to 0.38 °C·m−1 (CP-SC-R) and further to 0.31 °C·m−1 (CP-CC-R). The average Thermal Stratification Intensity (TSI) was 1.42 °C (SP-SC-R), 1.63 °C (CP-SC-R), and 0.49 °C (CP-CC-R). Maximum air temperatures reached 37.95 °C near the roof, exceeding the optimal range for tomato physiology (25–30 °C).
- Role of evapotranspiration: Incorporating the crop’s thermal load (233.68 W·m−2) generated buoyancy-driven convective motion, which enhanced vertical mixing and reduced temperature gradients within the canopy by up to 1.5 °C. However, it did not eliminate the persistent stratification above 4.5 m, indicating that evapotranspiration redistributes heat locally but cannot compensate for structural ventilation constraints.
- Practical design recommendations: Based on the findings, the following engineering measures are recommended for tropical greenhouses: (a) increase the roof vent area to at least 30% of the ground area to reduce exit velocities; (b) install windbreak screens or perforated baffles on the leeward side to dissipate high-speed jets; (c) adopt hybrid ventilation (natural plus low-speed fans) to provide background mixing during low-wind or extreme radiation periods.
- Future directions linked to limitations: To overcome the limitations of this study, future research should: (i) employ unsteady RANS or large-eddy simulation to capture transient gusts and thermal plumes (addressing the steady-state assumption); (ii) use porous medium models based on leaf area density (LAI) distribution instead of simplified cones to better represent leaf-scale turbulence; and (iii) conduct field measurements of temperature and velocity inside the same greenhouse to calibrate and validate the CFD model. Integrating IoT-based sensors and AI-driven control systems could further enhance predictive accuracy and practical applicability.
In summary, natural ventilation alone is insufficient under critical tropical conditions; hybrid systems are necessary. CFD modelling must include both crop geometry and evapotranspiration to provide realistic diagnostics. The design recommendations and future research lines offered here provide a roadmap for improving greenhouse climate management in warm regions.
Author Contributions
Conceptualisation, L.H.M.P. and N.B.S.M.; methodology, L.H.M.P. and N.B.S.M.; investigation, N.B.S.M. and M.B.C.; formal analysis, L.H.M.P., N.B.S.M., and M.A.G.C.; writing—original draft preparation, L.H.M.P. and P.A.C.V.; writing—review and editing, L.H.M.P., N.B.S.M., M.B.C., M.A.G.C. and P.A.C.V. All authors have read and agreed to the published version of the manuscript.
Funding
This research received no external funding.
Institutional Review Board Statement
Not applicable.
Informed Consent Statement
Informed consent was obtained from all subjects involved in this study.
Data Availability Statement
The data presented in this study are available upon request from the corresponding author.
Acknowledgments
The authors express their gratitude to the Universidad Surcolombiana, Universidad Industrial de Santander and Universidad Simon Bolivar for providing the facilities and computational resources required for this research.
Conflicts of Interest
The authors declare no conflicts of interest.
Abbreviations
The following abbreviations are used in this manuscript:
| ASHRAE | American Society of Heating, Refrigerating and Air-Conditioning Engineers |
| CAD | Computer-Aided Design |
| CD | Drag Coefficient |
| CFD | Computational Fluid Dynamics |
| CP-CC-R | Crop Present—Crop Thermal Load—Radiation |
| CP-SC-R | Crop Present—No Crop Thermal Load—Radiation |
| ETc | Crop Evapotranspiration |
| ETo | Reference Evapotranspiration |
| GCI | Grid Convergence Index |
| H | Sensible Heat |
| IDEAM | Institute of Hydrology, Meteorology and Environmental Studies (Colombia) |
| Kc | Crop Coefficient |
| LES | Large-Eddy Simulation |
| Qv | Ventilation Flow Rate |
| LAI | Leaf Area Density |
| RANS | Reynolds-Averaged Navier–Stokes |
| SP-SC-R | No Plants—No Crop Thermal load—Radiation |
| SST | Shear Stress Transport |
| TSI | Thermal Stratification Intensity |
| UDF | User-Defined Function |
| λE | Latent Heat |
References
- Aguilar Rodriguez, C.E.; Flores Velazquez, J. CFD Simulation of Heat and Mass Transfer for Climate Control in Greenhouses. In Heat and Mass Transfer—Advances in Science and Technology Applications; IntechOpen: London, UK, 2019. [Google Scholar] [CrossRef] [Scilit]
- Rath, J.R.; Ghosal, M.K. Studies on environmental control of greenhouse for crop production. Int. J. Chem. Stud. 2020, 8, 674–676. [Google Scholar] [CrossRef] [Scilit]
- Kumar, K.S.; Tiwari, K.N.; Jha, M.K. Design and technology for greenhouse cooling in tropical and subtropical regions: A review. Energy Build. 2009, 41, 1269–1275. [Google Scholar] [CrossRef] [Scilit]
- Villagran Munar, E.A.; Bojacá Aldana, C.R. CFD Simulation of the Increase of the Roof Ventilation Area in a Traditional Colombian Greenhouse: Effect on Air Flow Patterns and Thermal Behavior. Int. J. Heat Technol. 2019, 37, 881–892. [Google Scholar] [CrossRef] [Scilit]
- Villagrán, E.; Flores-Velazquez, J.; Akrami, M.; Bojacá, C. Influence of the Height in a Colombian Multi-Tunnel Greenhouse on Natural Ventilation and Thermal Behavior: Modeling Approach. Sustainability 2021, 13, 13631. [Google Scholar] [CrossRef] [Scilit]
- Molina-Aiz, F.D.; Valera, D.L.; Álvarez, A.J.; Madueño, A. A Wind Tunnel Study of Airflow through Horticultural Crops: Determination of the Drag Coefficient. Biosyst. Eng. 2006, 93, 447–457. [Google Scholar] [CrossRef] [Scilit]
- Tigampo, S.; Kooli, S.; Salah, N.B.; Foudhil, W.; Errais, R.; Sambou, V.; Jabrallah, S.B. CFD modelling of the microclimate of a cultivated greenhouse: A validation study between experimental and numerical results. J. Ther. Eng. 2023, 9, 1115–1129. [Google Scholar] [CrossRef] [Scilit]
- Kibwika, A.K.; Seo, H.-J.; Seo, I.-H. CFD Model Verification and Aerodynamic Analysis in Large-Scaled Venlo Greenhouse for Tomato Cultivation. AgriEngineering 2023, 5, 1395–1414. [Google Scholar] [CrossRef] [Scilit]
- Aguilar-Rodríguez, C.E.; Flores-Velázquez, J.; Rojano-Aguilar, F.; Ojeda-Bustamante, W.; Iñiguez-Covarrubias, M. Estimación del ciclo de cultivo de tomate (Solanum lycopersicum L.) en invernadero, con base en grados días calor (GDC) simulados con CFD. Tecnol. Cienc. Agua 2020, 11, 27–57. [Google Scholar] [CrossRef] [Scilit]
- Fatnassi, H.; Bournet, P.E.; Boulard, T.; Roy, J.C.; Molina-Aiz, F.D.; Zaaboul, R. Use of computational fluid dynamic tools to model the coupling of plant canopy activity and climate in greenhouses and closed plant growth systems: A review. Biosyst. Eng. 2023, 230, 388–408. [Google Scholar] [CrossRef] [Scilit]
- Gu, X.; Goto, E. Computational Fluid Dynamics Model with Realistic Plant Structures to Study Airflow in and around a Plant Canopy on a Cultivation Shelf in a Plant Factory with Artificial Light. Agriculture 2024, 14, 1199. [Google Scholar] [CrossRef] [Scilit]
- He, F.; Si, C.; Ding, X.; Gao, Z.; Gong, B.; Qi, F.; Yin, Y.; Feng, Q. Optimization of Chinese solar greenhouse building parameters based on CFD simulation and entropy weight method. Int. J. Agric. Biol. Eng. 2023, 16, 48–56. [Google Scholar] [CrossRef] [Scilit]
- Ghiat, I.; Mackey, H.R.; Al-Ansari, T. A review of evapotranspiration measurement models, techniques and methods for open and closed agricultural field applications. Water 2021, 13, 2523. [Google Scholar] [CrossRef] [Scilit]
- Bournet, P.-E.; Rojano, F. Advances of Computational Fluid Dynamics (CFD) applications in agricultural building modelling: Research, applications and challenges. Comput. Electron. Agric. 2022, 201, 107277. [Google Scholar] [CrossRef] [Scilit]
- Ardila Cerquera, M.S.; Ávila Parada, M.M.; Martínez Palmeth, L.H.; Ardila Marín, J.G.; Acosta Vargas, J.C. Evaluation of the influence of the number of blades on a Michell Banki turbine on the power generated under given flow and head conditions. EUREKA Phys. Eng. 2025, 3, 27–35. [Google Scholar] [CrossRef] [Scilit]
- Moukalled, F.; Mangani, L.; Darwish, M. The Finite Volume Method in Computational Fluid Dynamics: An Advanced Introduction with OpenFOAM and Matlab; Springer: Berlin/Heidelberg, Germany, 2016. [Google Scholar]
- Allen, R.G.; Pereira, L.S.; Raes, D.; Smith, M. Crop Evapotranspiration—Guidelines for Computing Crop Water Requirements—FAO Irrigation and Drainage Paper 56; FAO—Food and Agriculture Organization of the United Nations: Roma, Italy, 1998. [Google Scholar]
- Hou, M.; Xu, D.; Wang, Z.; Meng, L.; Wang, L.; Ma, Y.; Zhu, J.; Lv, C. Computational Fluid Dynamics Simulation and Quantification of Solar Greenhouse Temperature Based on Real Canopy Structure. Agronomy 2025, 15, 586. [Google Scholar] [CrossRef] [Scilit]
- Aguilar-Rodríguez, C.E.; Flores-Velázquez, J.; Rojano-Aguilar, F.; Ojeda-Bustamante, W.; Iñiguez-Covarrubias, M. Conjunto Tecnológico para la Producción de Tomate de Ensalada; Instituto Mexicano de Tecnología del Agua: Jiutepec, Mexico, 2020; Available online: https://hdl.handle.net/20.500.11801/2968.
- Castilla, N. Greenhouse Technology and Management, 2nd ed.; CABI Publishing: Wallingford, UK; Boston, MA, USA, 2012. [Google Scholar]
- American Society of Heating; Refrigerating and Air-Conditioning Engineers (ASHRAE). 2025 ASHRAE Handbook—Fundamentals; ASHRAE: Atlanta, GA, USA, 2025. [Google Scholar]
- Mu, Z.; Zhao, Z.; Wang, J.; Shu, S.; Tan, Z. Study on the summer ventilation effect of the multi-span solar energy greenhouse. SSRN 2024. [Google Scholar] [CrossRef] [Scilit]
- Mao, Q.; Li, H. Comparison and optimization of ventilation schemes in multi-span greenhouse under natural ventilation. Int. J. Vent. 2025, 24, 353–376. [Google Scholar] [CrossRef] [Scilit]
- Celik, I.B.; Ghia, U.; Roache, P.J.; Freitas, C.J. Procedure for estimation and reporting of uncertainty due to discretisation in CFD applications. J. Fluids Eng. 2008, 130, 078001. [Google Scholar] [CrossRef] [Scilit]
- Roache, P.J. Verification and Validation in Computational Science and Engineering; Hermosa Publishers: Albuquerque, NM, USA, 1998. [Google Scholar]

Disclaimer/Publisher’s Note: The statements, opinions and data contained in all publications are solely those of the individual author(s) and contributor(s) and not of MDPI and/or the editor(s). MDPI and/or the editor(s) disclaim responsibility for any injury to people or property resulting from any ideas, methods, instructions or products referred to in the content. |
© 2026 by the authors. Licensee MDPI, Basel, Switzerland. This article is an open access article distributed under the terms and conditions of the Creative Commons Attribution (CC BY) license.