


Abstract
The growing number of electricity consumers and unstable generation by renewable energy sources (RESs) decrease the efficiency of traditional techniques for modeling large power systems. The diakoptics method is based on structuring a system into subsystems and enables reducing the amount of computation by 2.9 times. However, its classical implementations require successive (iterative) expansion of a scheme, which increases computational time for scaling. This method decomposes a complex system into interacting subsystems with different generation and load characteristics. Generalized parameters are independently calculated for each subsystem and then integrated into the total solution. This significantly reduces the amount of computation, simplifies simulation, optimizes control with allowance for local characteristics, and analyzes intersystem connections to minimize losses and improve stability. This paper suggests not just another Kron calculation but a modification of the diakoptics method, which enables avoiding multiple step-by-step redesigns of a grid by generating generalized parameters based on the complete graph of a system, which significantly reduces computational costs when analyzing large power systems. The method simultaneously considers the entire grid topology. This eliminates successive iterations: if a classical approach requires 13 iterations for a network with 11 nodes and 21 branches, the suggested method performs computation in a single computational cycle. The results show high computational efficiency and practical applicability of the method for large power systems. The suggested approach opens up possibilities for reliability analysis, including redundancy assessment and identification of vulnerable elements, which contributes to an increase in the power system stability under conditions of RES integration.
1. Introduction
The current global transformation of the electric power sector [1,2] through integration of renewable energy sources (RESs) [3,4], characterized by unstable generation, and the development of micro- and smart grids [5], increases the complexity of topology and uncertainty in the operation of power systems. This makes traditional iterative analysis techniques insufficiently effective for large grids with hundreds of nodes [6,7].
A technique that simultaneously considers all branches enables efficient modeling of distributed RES-based systems, while traditional approaches require multiple recalculations of parameters upon changes in operating modes of solar and wind power plants. Structuring a system into subsystems makes it possible to separately analyze the effect of each energy generation type on the total stability.
The suggested modification of the diakoptics method meets key challenges of the modern electric power industry associated with integration of RESs, development of microgrids, and the need to ensure the stability of large power systems under conditions of generation uncertainty and increasing loads [8,9].
The tasks of monitoring and data collection in modern power systems with RESs, which are associated with the need for accurate knowledge of system parameters [10], are essential for solving power supply system parameter problems. Despite significant progress in the field of monitoring and analysis, all the cited studies rely on knowledge of the generalized parameters of power systems but do not propose effective methods for their calculation for large-scale networks [11,12]. This creates a gap between the development of data collection technologies and the capabilities of their mathematical processing, which the present work aims to fill.
Therefore, diakoptics is a relevant and theoretically substantiated tool for analyzing complex electric power systems [13]. It is based on the decomposition principle, which suggests decomposition of an original system into several interconnected but independently analyzed subsystems. This approach enables the development of simulation models for individual regions, nodes, or microgrids with different generation and load parameters, including zones with a high share of unstable RES, followed by synthesis of a global solution.
The diakoptics method ensures some essential advantages:
- –
- Significantly reduced computational complexity and enhanced scalability of models, which is especially important for real-time calculations and scenario analysis;
- –
- Improved flexibility and adaptability of control due to a possibility of independent optimization of operation of individual subsystems with allowance for their local engineering and regulatory limitations;
- –
- Simplified analysis of intersystem connections, including coordination of power flows, stability assessment, and minimization of losses in compliance with current standards and regulations.
The authors of work [14] suggest a diakoptics method as a generalized form of the Thevenin’s theorem, which provides a generalized representation of grid parameters and can be used for accurate assessment of power system components. In particular, this approach enables calculating equivalent parameters of sources and loads under different operating modes of power systems. Nevertheless, the method is limited by the Thevenin’s theorem and does not provide a general approach to calculation of the full matrix of generalized parameters (Z matrix) for the entire system.
Work [15] suggests a topological graph convolutional network for analyzing complex grids, and work [16] discusses a method for identifying topologies based on characteristic currents. These studies confirm the importance of graph methods for modern electric power engineering, which is consistent with the method we suggested in this work based on the graph theory and incidence matrices.
Generalized correntropy methods [17] consider and compensate for errors caused by uncertainties in system parameters, which makes them important for determining generalized power system parameters. The development of such methods is directly related to the tasks that are solved within the diakoptics method, since accurate estimation of system parameters requires consideration of many factors. Use of methods in [17] helps to improve the accuracy and stability of power systems, especially under unstable loads.
The topology-aware iterative method suggested in [18] ensures more accurate estimation of system parameters and interactions between power system components, which forms the basis for the diakoptics method in the analysis of large electric grids. Models in [19] consider different system components, which is important for estimation of parameters of networks and their components in large power systems; they can be used to optimize compensation and control systems.
The method in [20] for estimating generalized Weibull distribution parameters determines the probability density functions of different parameters of complex systems. This approach makes possible precise computation of parameters, which can be useful when working with large energy networks, where calculation accuracy is critical for efficient operation. The technique in [21] helps identify key points in interactions between system components and takes them into account in a model. The use of such techniques in the analysis of large power systems with high electronics ensures effective estimation and adjustment of parameters for stable system operation.
Though the above works significantly contributed to the development of the diakoptics method [18,19,20], all of them either solved particular problems or, like in the case of diakoptics [17], were not rendered as practically implementable algorithms for calculating full Z matrices of large grids.
Diakoptics theoretically grounds the transition from centralized and monolithic calculations to modular and hierarchical models, which is fully consistent with current trends in the development of the electric power industry. This work examines the diakoptics principles, describes the results of its testing on test models, and discusses the prospects of this method in the analysis and optimal control of energy systems under the conditions of a high share of renewable energy sources and a high degree of digitization of the industry [22,23,24,25,26,27,28,29,30,31,32,33].
All classical and most modern applications of diakoptics for calculating generalized parameters are based on sequential (iterative) network expansion, which leads to high computational costs. Although some works focus on large-scale systems [28,32], they do not concentrate on the efficient calculation of the generalized Z-matrix itself. Table 1 provides an analysis of existing studies.
Table 1.
Analysis of existing studies.
Aims and hypotheses of the study. The literature analysis reveals that, despite the long history of diakoptics, most existing works focus on medium-size power systems (up to several dozen nodes). Classical approaches [22,27] and their modern modifications [25,28,29,30,31] show efficiency for test systems; however, scaling them to large systems with thousands of nodes entails high computation efforts for successive iterations. Based on the identified gap, the following aims of the study have been formulated:
- -
- To modify the diakoptics method for calculating generalized parameters (Z matrices) with simultaneous consideration of all power system branches without successive iterations.
- -
- To implement the suggested method in the form of an algorithm and a software code [32].
- -
- To verify the method by comparing with a classical approach for a test grid 11 × 21.
To assess the computation efficiency of the suggested approach in comparison with the iterative method.
The number of works where the diakoptics method is directly used for the analysis of large power systems with integrated RESs is limited. Current trends in the development of the electric power industry require consideration of unstable generation and increasingly complex topology, making this problem particularly relevant.
Thus, this study fills the gap by expanding the diakoptics method for calculation of generalized parameters to large-scale grids with decreasing computational costs and improving reliability.
2. Calculation Method
To overcome the computational limitations of traditional approaches to the analysis of large power systems (more than 1000 nodes), we use the diakoptics method. It is based on the approach by G. Kron [22], modified and developed in works [30]. In contrast to the method used by O.T. Geraskin in [31], the suggested method considers full network topology, thus eliminating accumulation of errors and difficulties associated with its step-by-step expansion.
The method sequentially solves the following tasks:
- –
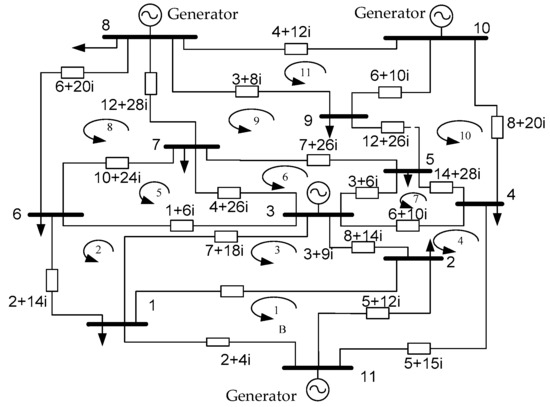
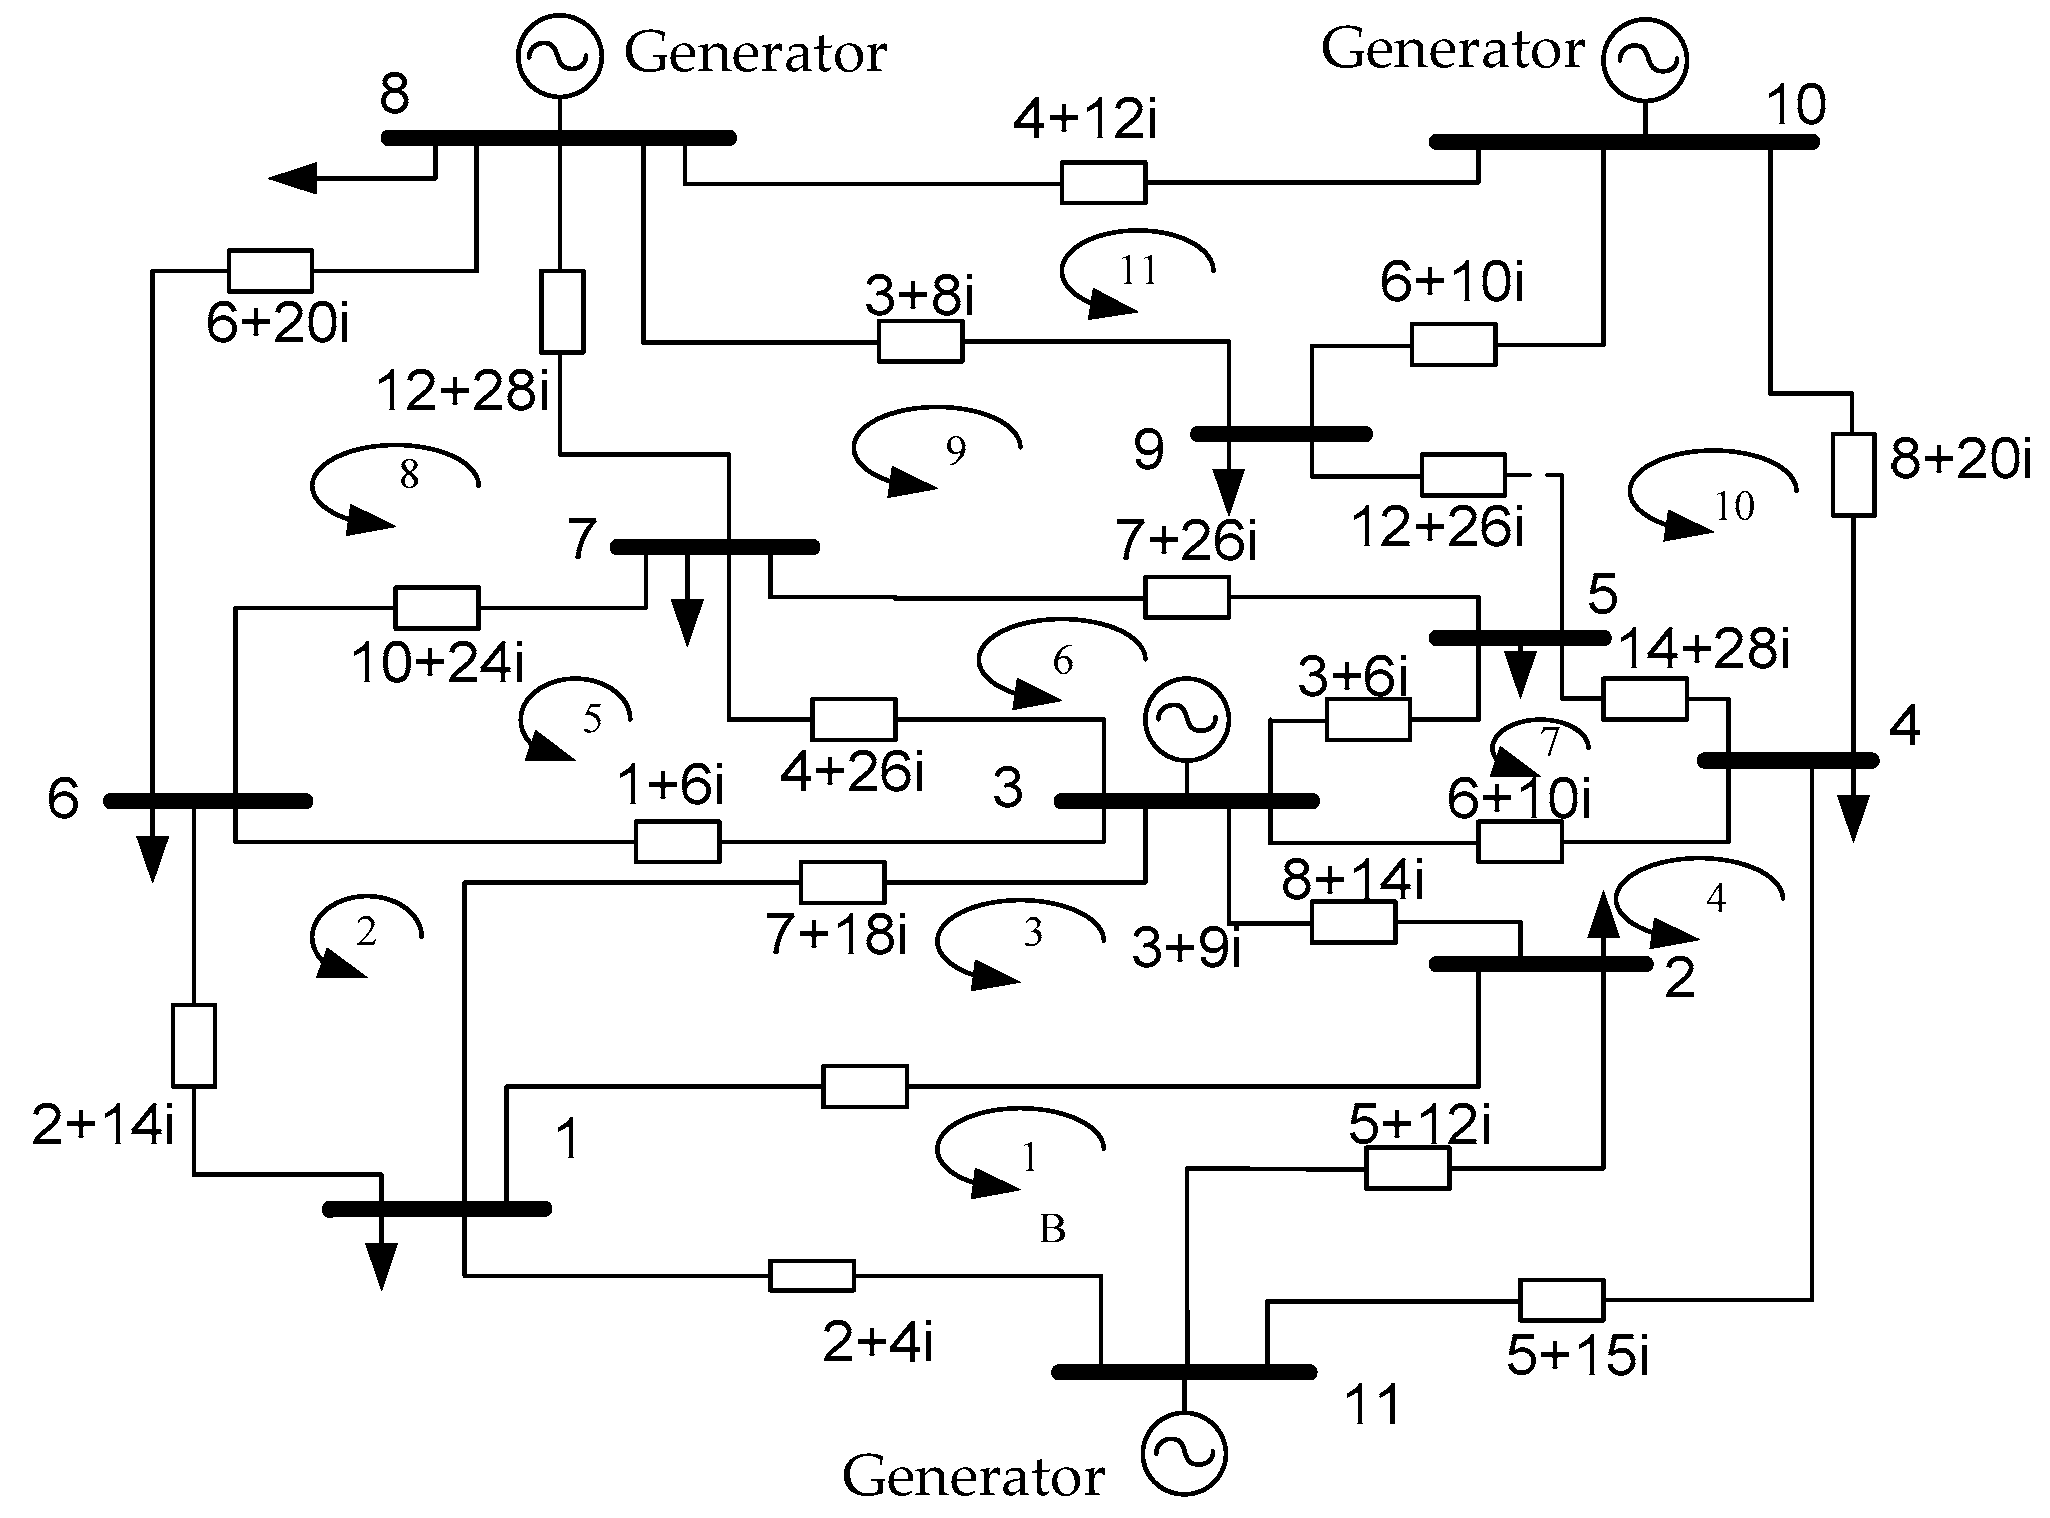
- Topological modeling of a system. Based on the power system diagram shown in Figure 1, its graph is built by graph theory methods [24,30,31], the incidence matrix is specified, and the system is decomposed into connected subsystems.Figure 1. Schematic diagram of a power system.
- –
- Calculation of subsystem parameters. A matrix of generalized parameters (Z matrix) is independently calculated for each selected subsystem.
- –
- Consideration of connections between subsystems. An infeed coefficient matrix is generated, which mathematically describes the interactions at the decomposition boundaries (multiway branches).
- –
- Synthesis of generalized parameters. A complete matrix of generalized parameters (Z matrix) is compiled for the entire power system based on the subsystem matrices and the infeed coefficient matrix.
The suggested method is aimed at an essential (by several orders of magnitude) decrease in the amount of computation required for the analysis of operating conditions, power flow optimization, and assessment of stability of large power systems preserving the required calculation accuracy. The reliability and efficiency of the developed method have been confirmed by testing it within conference [30].
The power system diagram shown in Figure 1 was used as the basis for comparing the results. The use of the graph theory for studying the network topology yielded important information about the structure and functional features of a complex power facility. The graph theory mathematics enabled effective modeling of interconnection in the system, which improved our understanding of its dynamics and significantly simplified solutions to optimization and control problems.
To analyze the energy system structure, we used the graph theory, which represents a system as a complex of two elements: nodes (vertices) and branches (edges) connecting them. In this model, nodes represent generators, transformers, and consumption centers, and branches represent the transmission lines that interconnect them.
When developing the method, the following assumptions have been made:
- -
- A power system is linear, which is true in stable modes and for calculation of SC currents.
- -
- Branch parameters (resistance, conductance) are constant and independent of the operation mode.
- -
- All system nodes remain during decomposition (graph completeness).
- -
- Multiway branches are chosen so as to keep subsystems connected.
- -
- Incidence matrices are generated for a directed graph with arbitrarily chosen branch directions.
The topology of a system should be known, since partly specified graphs require preliminary reconstruction of connections.
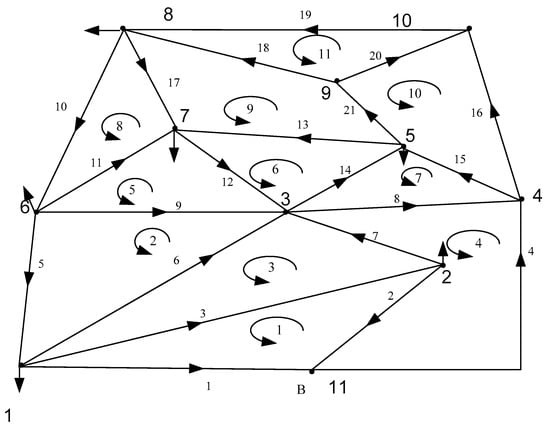
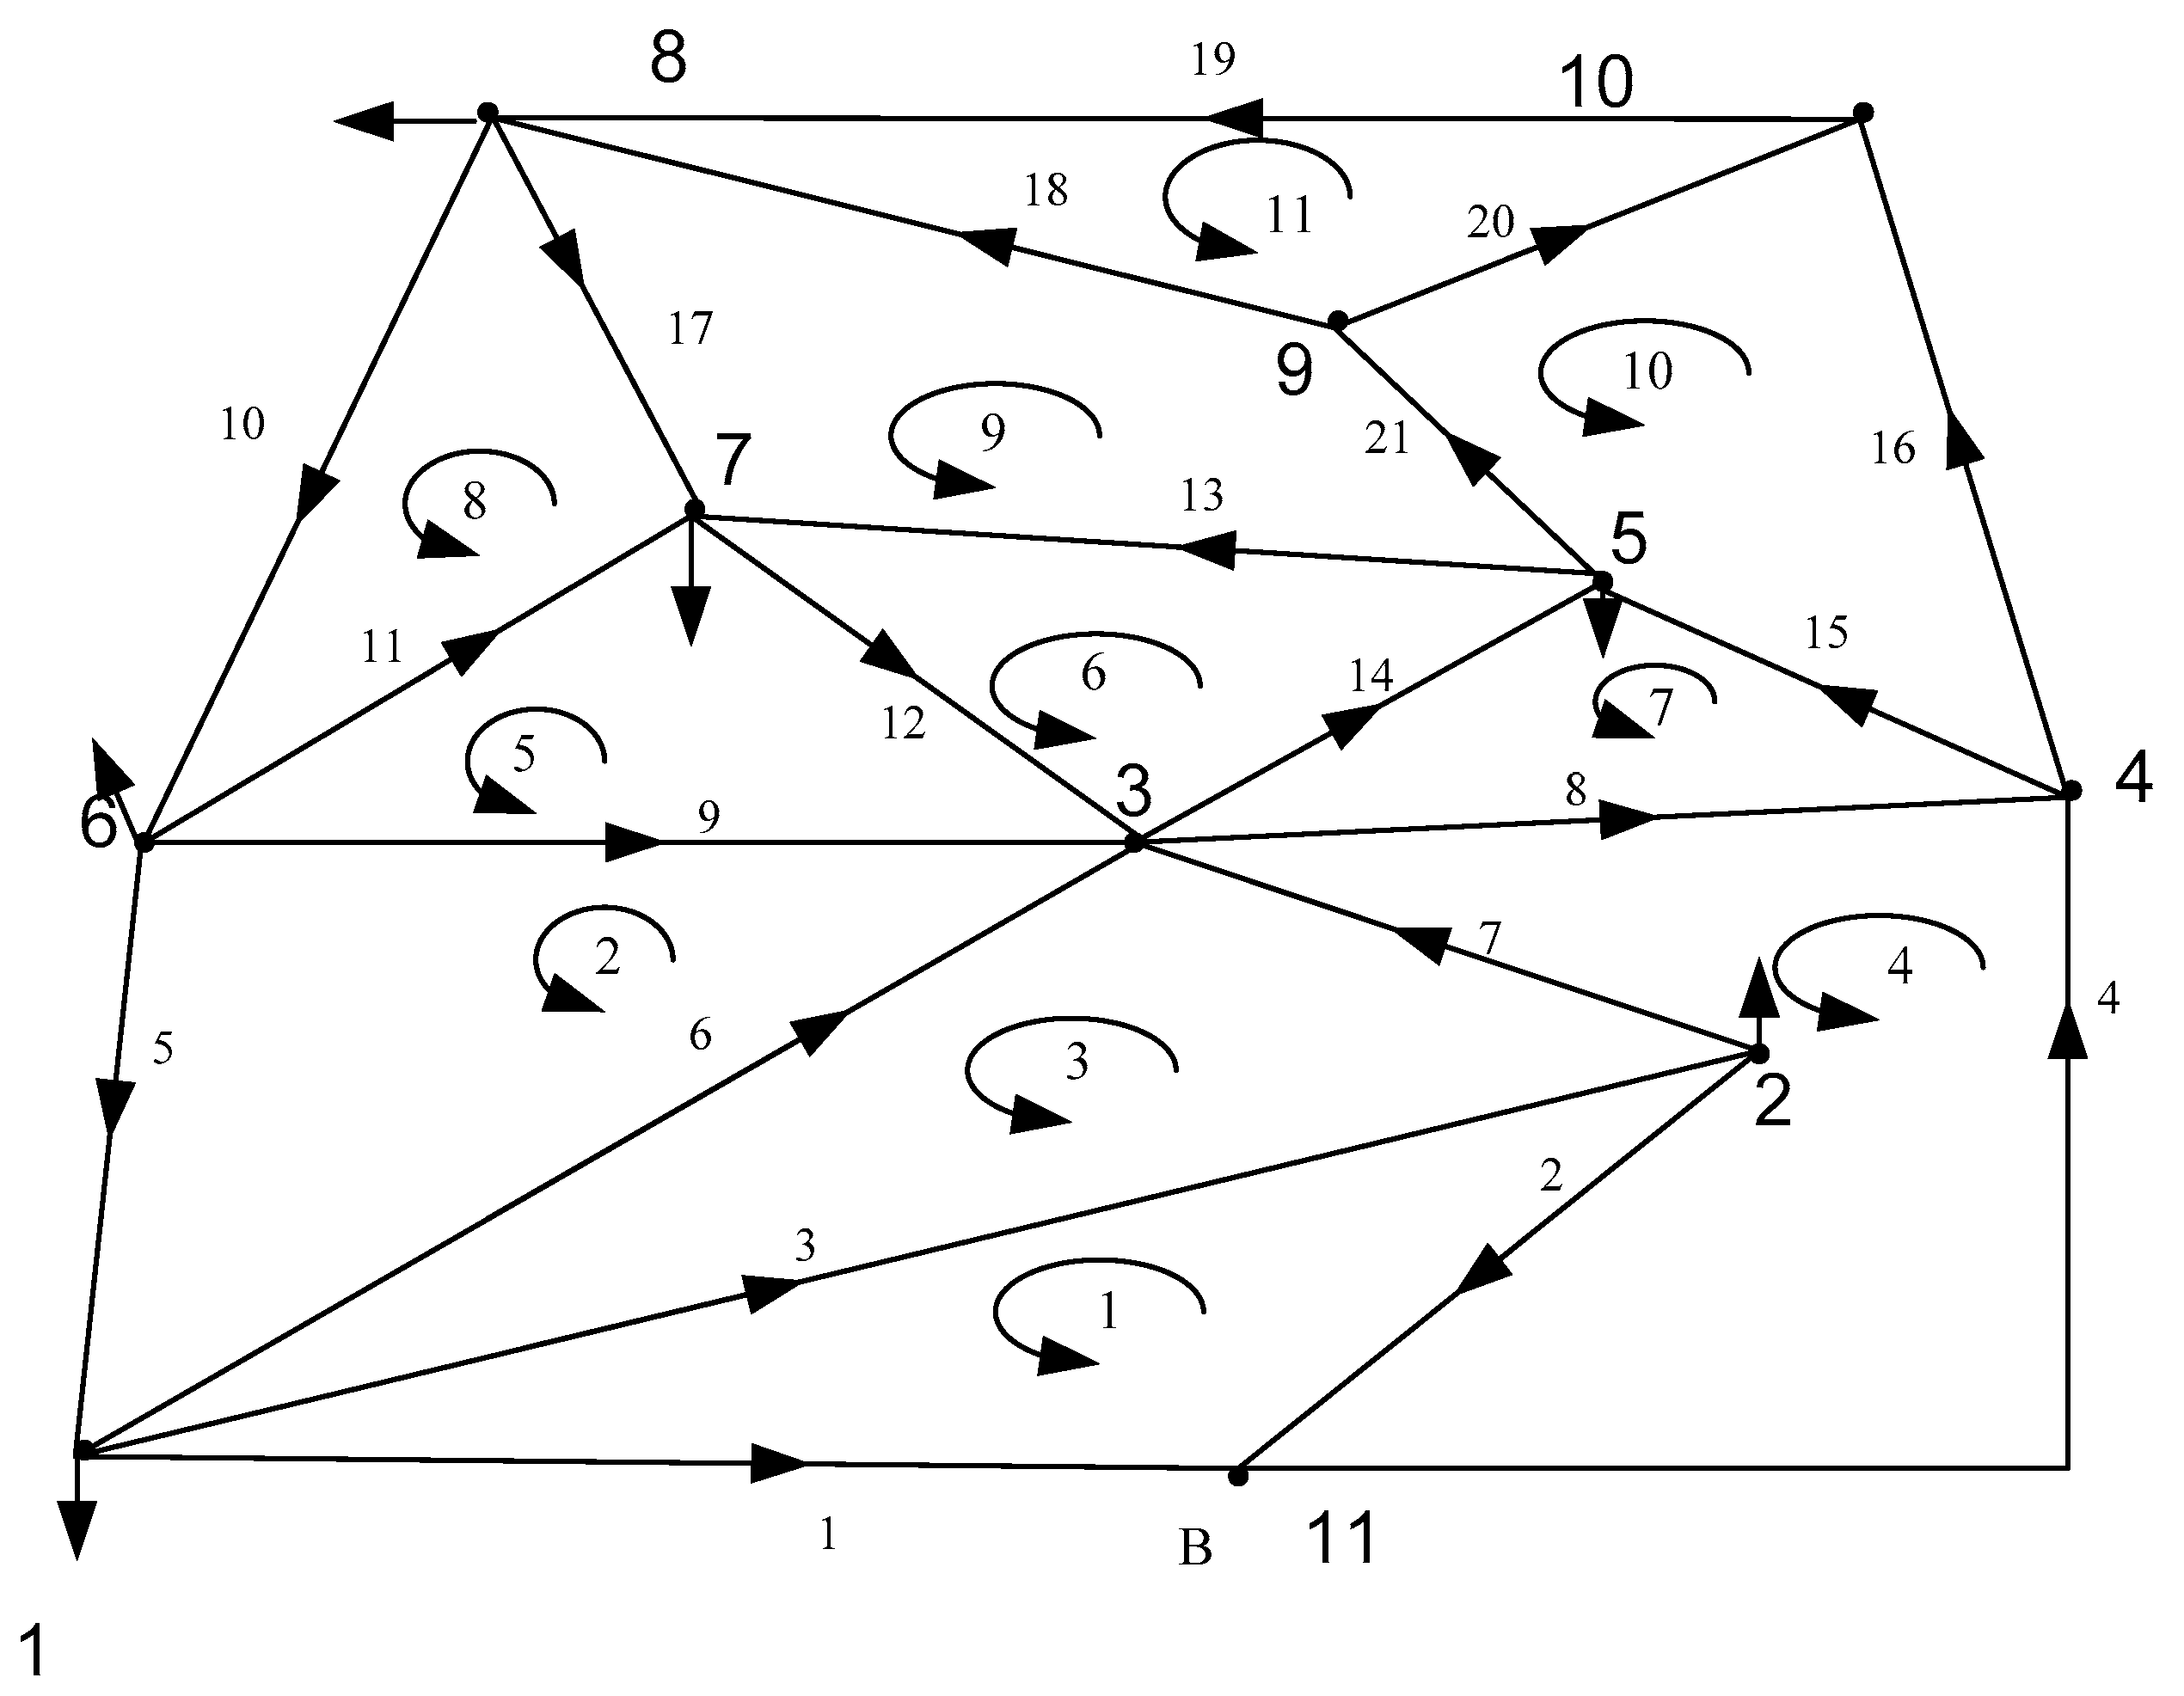
Figure 2 shows the graphical representation of this model: the original diagram and the corresponding directed graph, where each node and branch is individually numbered.
Figure 2.
Graph diagram of the power system.
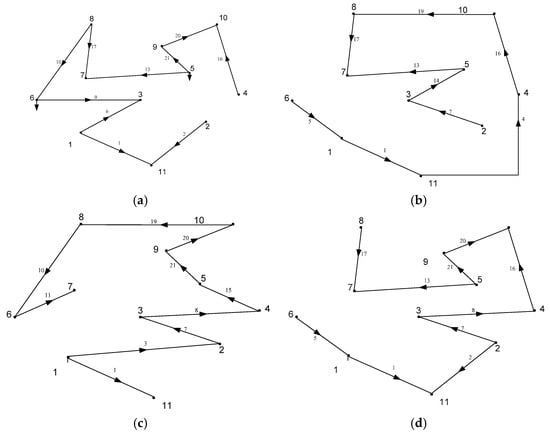
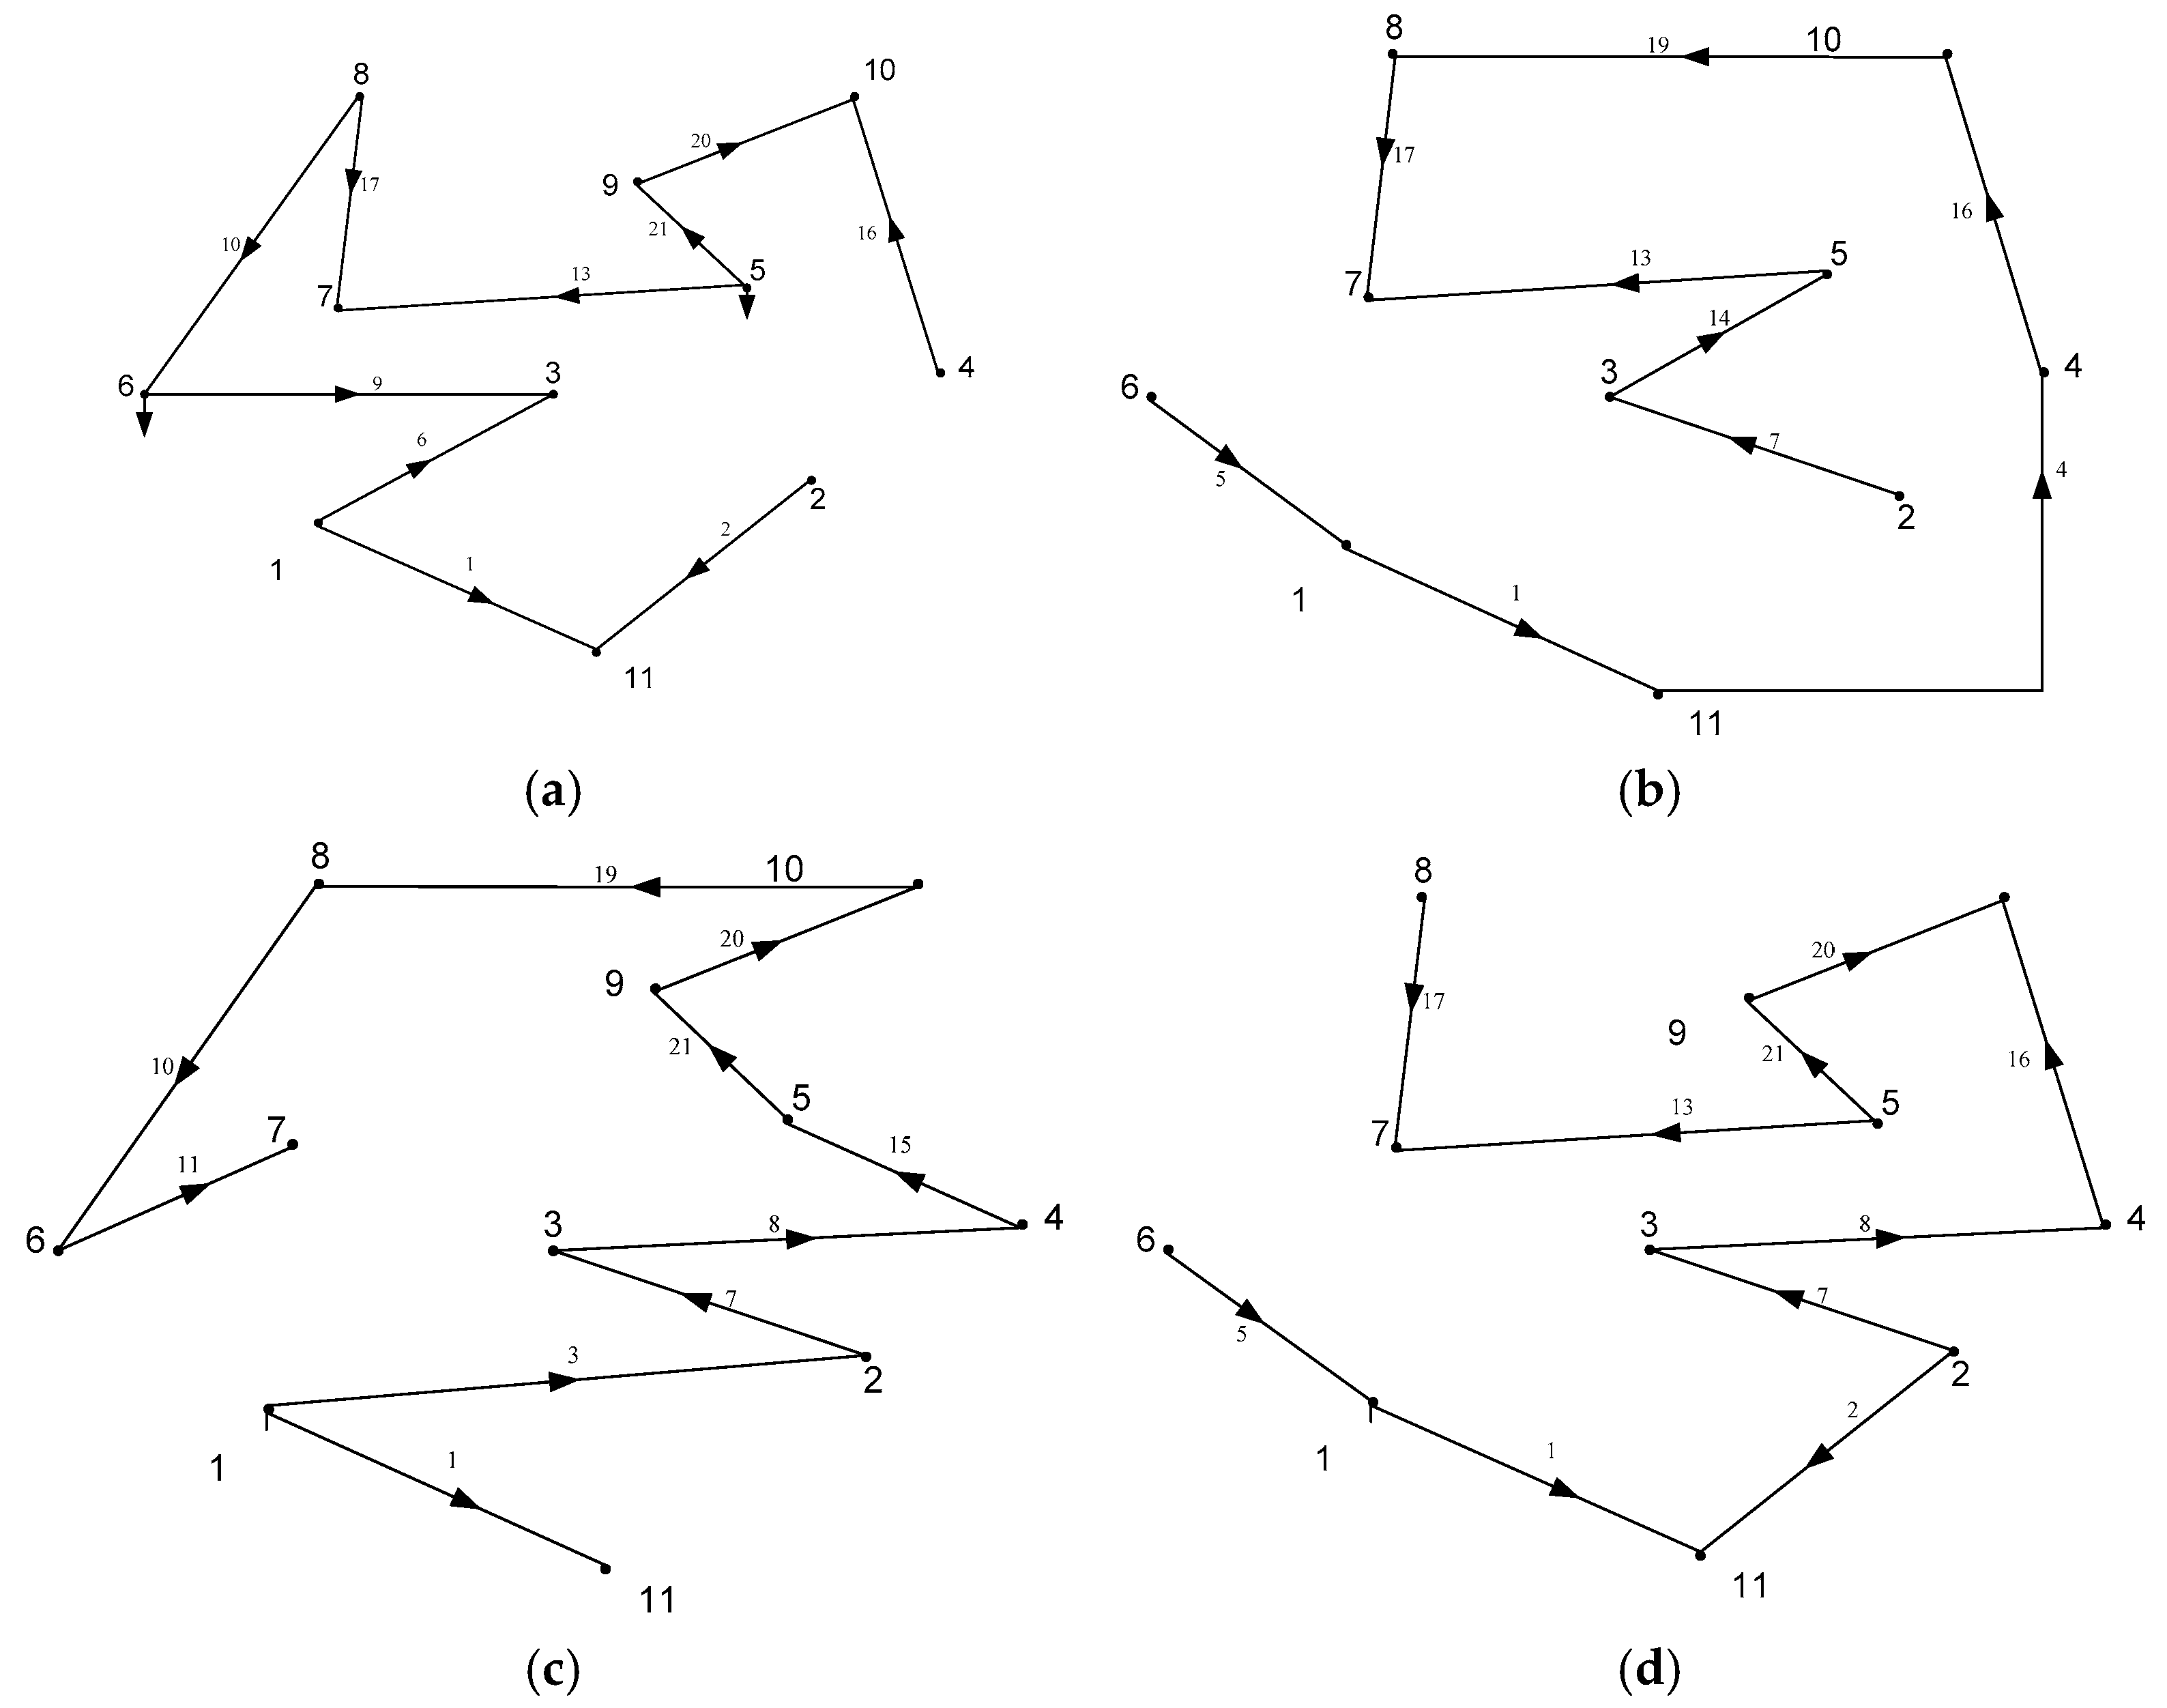
A power system is represented as a directed graph G(V, E), where V is the set of nodes (|V| = n) and E is the set of branches (|E| = m). For the system under study, n = 11 and m = 21, i.e., the power system includes 11 nodes and 21 branches. To break all loops in the graph and leave all nodes, it is necessary to remove the smallest possible number of connections. This operation yields graph trees. Figure 3 and Figure 4 show possible graph trees for the power system.
Figure 3.
Graph trees for the power system: (a) graph tree starting in node 2, (b) graph tree starting in node 6, (c) graph tree starting in node 7, (d) graph tree starting in node 8.
Figure 4.
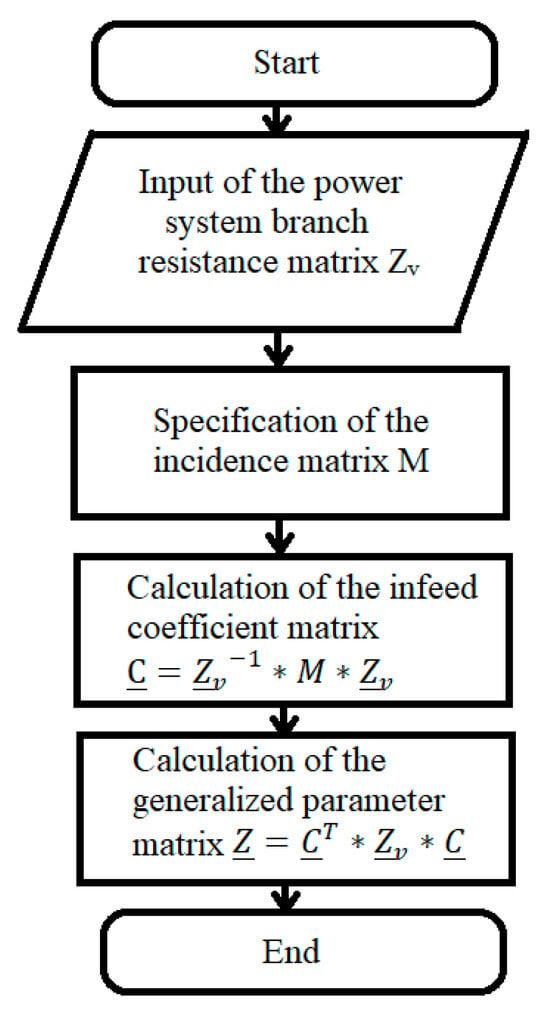
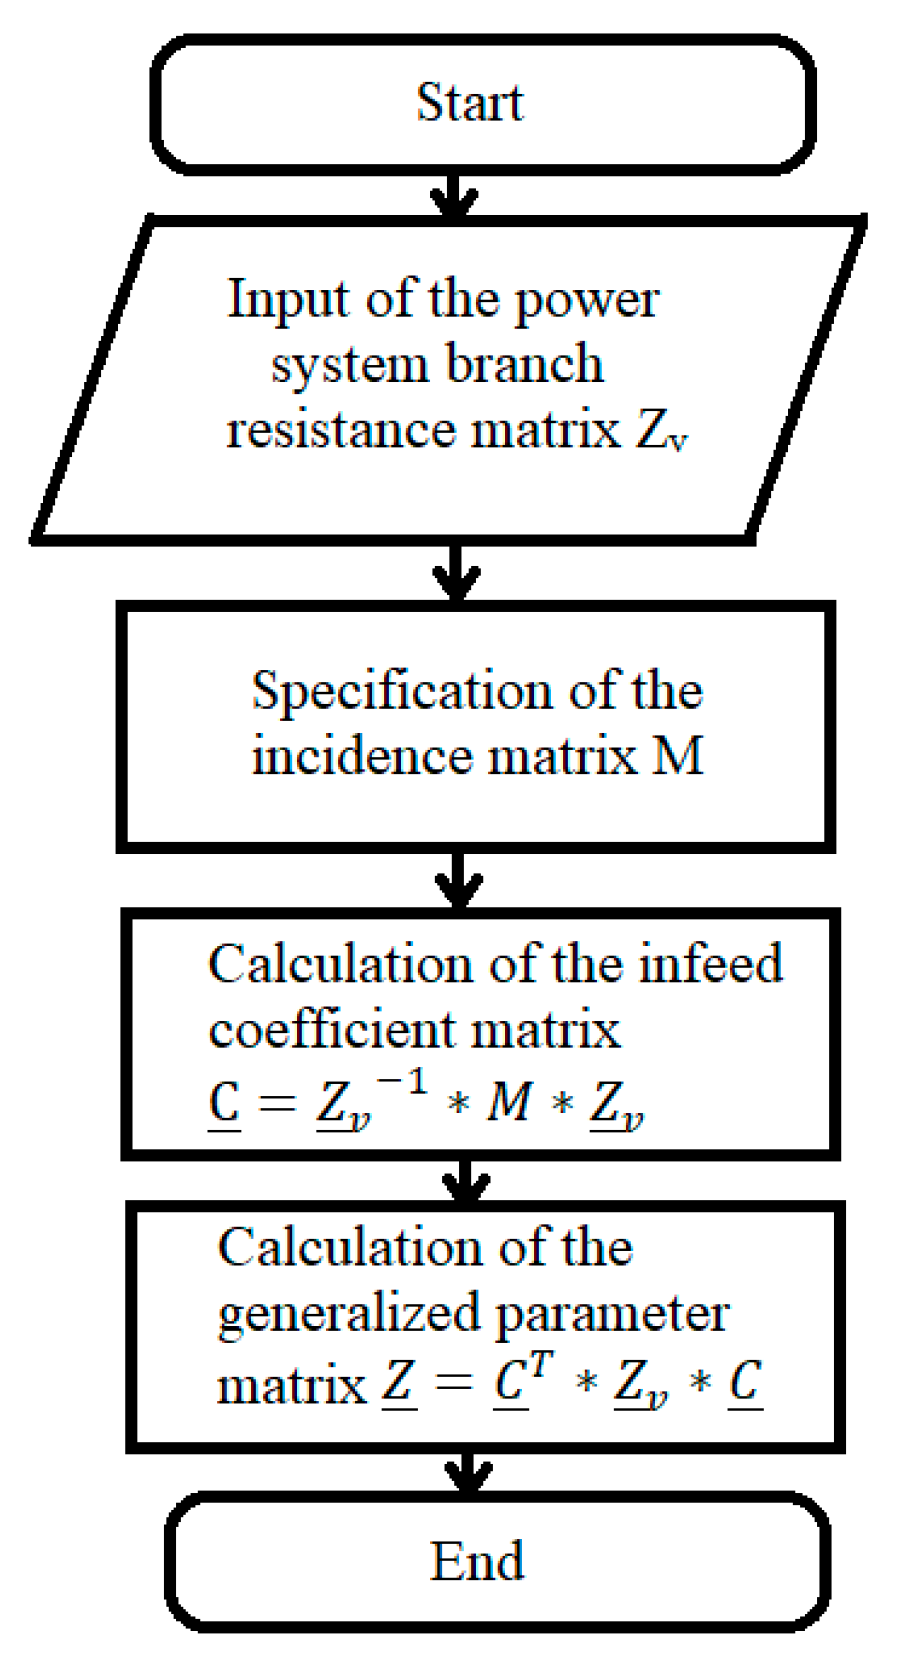
Computation algorithm.
The branches removed during tree construction are called graph chords. Their sequential addition to the original tree structure closes loops. Hence, the number of independent loops in an electrical circuit strictly corresponds to the number of chords. The total number of possible trees is 44,564 for the system under study.
The analytical description of the power system can be based on any of the set of possible graph trees, since the tree shape does not affect the number of equations that describe the system. For illustration purposes, Figure 3 shows four versions of such trees.
Within the traditional approach, generalized parameters should be calculated for each subsystem; then, they are combined into a single matrix with allowance for the connecting branches. This process takes 13 iterations for the diagram shown in Figure 1. This is a labor-intensive procedure that requires a significant amount of computation.
3. Analytical Description of the Power System
In contrast to the traditional method, we suggest an approach that eliminates the need for step-by-step system expansion. The suggested algorithm simultaneously considers all network branches, thus significantly reducing computational costs and increasing overall calculation efficiency. This approach is implemented in software [32], where the infeed coefficient matrix C and the matrix of generalized parameters Z are generated following the algorithm shown in Figure 4.
A diagonal matrix of m × m in size is generated, where the diagonal elements are equal to the resistances of the corresponding branches. The input data of the software are branch resistances , found from the diagram in Figure 1. These resistances form a diagonal matrix of complex numbers:
ZV = diag{2 + 4i, 5 + 12i, 3 + 9i, 5 + 15i, 2 + 14i, 7 + 18i, 8 + 14i, 6 + 10i, 1 + 6i, 6 + 20i, 10 + 24i, 4 + 26i, 7 + 26i, 3 + 6i, 14 + 28i, 8 + 20i, 12 + 28i, 3 + 8i, 4 + 12i, 6 + 10i, 12 + 26i}
The topology of the power system is described by the incidence matrix M (Table 1), which establishes the correspondence between nodes and branches, thus reflecting the structure of the system connections. The matrix consists of 11 rows of nodes and 21 columns of branches. The matrix is filled according to the directed graph shown in Figure 2 by the following rule: element mij = +1 if the jth branch originates from the ith node, −1 if the branch enters the node, and 0 if there is no connection between the node and branch (Table 2).
Table 2.
Incidence matrix M.
Table 1 shows that the incidence matrix reflects the network topology: +1 indicates a branch that starts from a node; –1 indicates a branch that enters a node; 0 means the absence of connection. Developing a full incidence matrix is a key step, since just this matrix makes possible subsequent simultaneous consideration of all branches without sequential expansion of the network. The suggested approach simplifies calculations due to simultaneous consideration of all network branches. The use of the incidence matrices M and the infeed coefficient matrices C (Table 3) ensures an accurate description of the connections in the system, which is important for its analysis and optimization.
Table 3.
Infeed coefficient matrix C.
The infeed coefficient matrix C is defined by the equation (Table 2).
where is the total value of all possible trees of the graph; and
is the algebraic sum of the values of the specific trees of the i branch.
The specific trees of the i branch for the j node are formed among possible trees as follows: if the direction of the i branch coincides with the direction of traversal from the j node to the basic node, then the value of the tree is multiplied by +1; otherwise, by –1. If the i branch is absent, then the value of the tree is multiplied by 0. These algorithms can easily be implemented numerically.
Table 4.
Matrix of generalized parameters Z.
The currents and voltages in the electric system can be calculated by the equations
where is the column matrix of operation currents.
4. Results and Discussion
Diakoptics enables the comprehensive analysis of power system reliability, including estimation of the redundancy and fault tolerance, and of the availability of backup capacities at nodes, the estimation of the transmission line reliability and capability and the readiness of the system to redistribute loads in the event of failure of individual components. Work [33] has shown that diakoptics methods can be implemented based on automated commercial electricity metering systems. The main problem is to adapt the method to the needs of real-time applications. Operational power system management requires minimal computation time at a required accuracy. In this context, the following is planned:
- -
- Compute core optimization for working in SCADA systems;
- -
- Study of a possibility of using this method for near-real-time on-line state estimation.
Equation (3) enables us to determine the total energy
and alternative energy transmission routes in the case of failure of mains, as well as to estimate the energy power loss.
To verify the suggested method, we have calculated the Z matrix of generalized parameters for a grid with 11 nodes (Figure 1) by the classical iterative diakoptics method [31], which requires 13 iterations and results in Geraskin matrix 5 of generalized parameters (Table 5).
Table 5.
Matrix 5 of generalized parameters calculated by the classical diakoptics method.
- –
- To decrease the volume of simultaneously processed information;
- –
- To minimize the effect of human factors when working with bulk data.
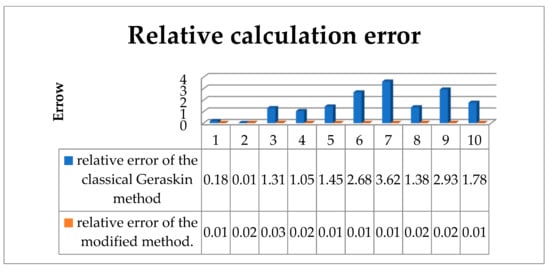
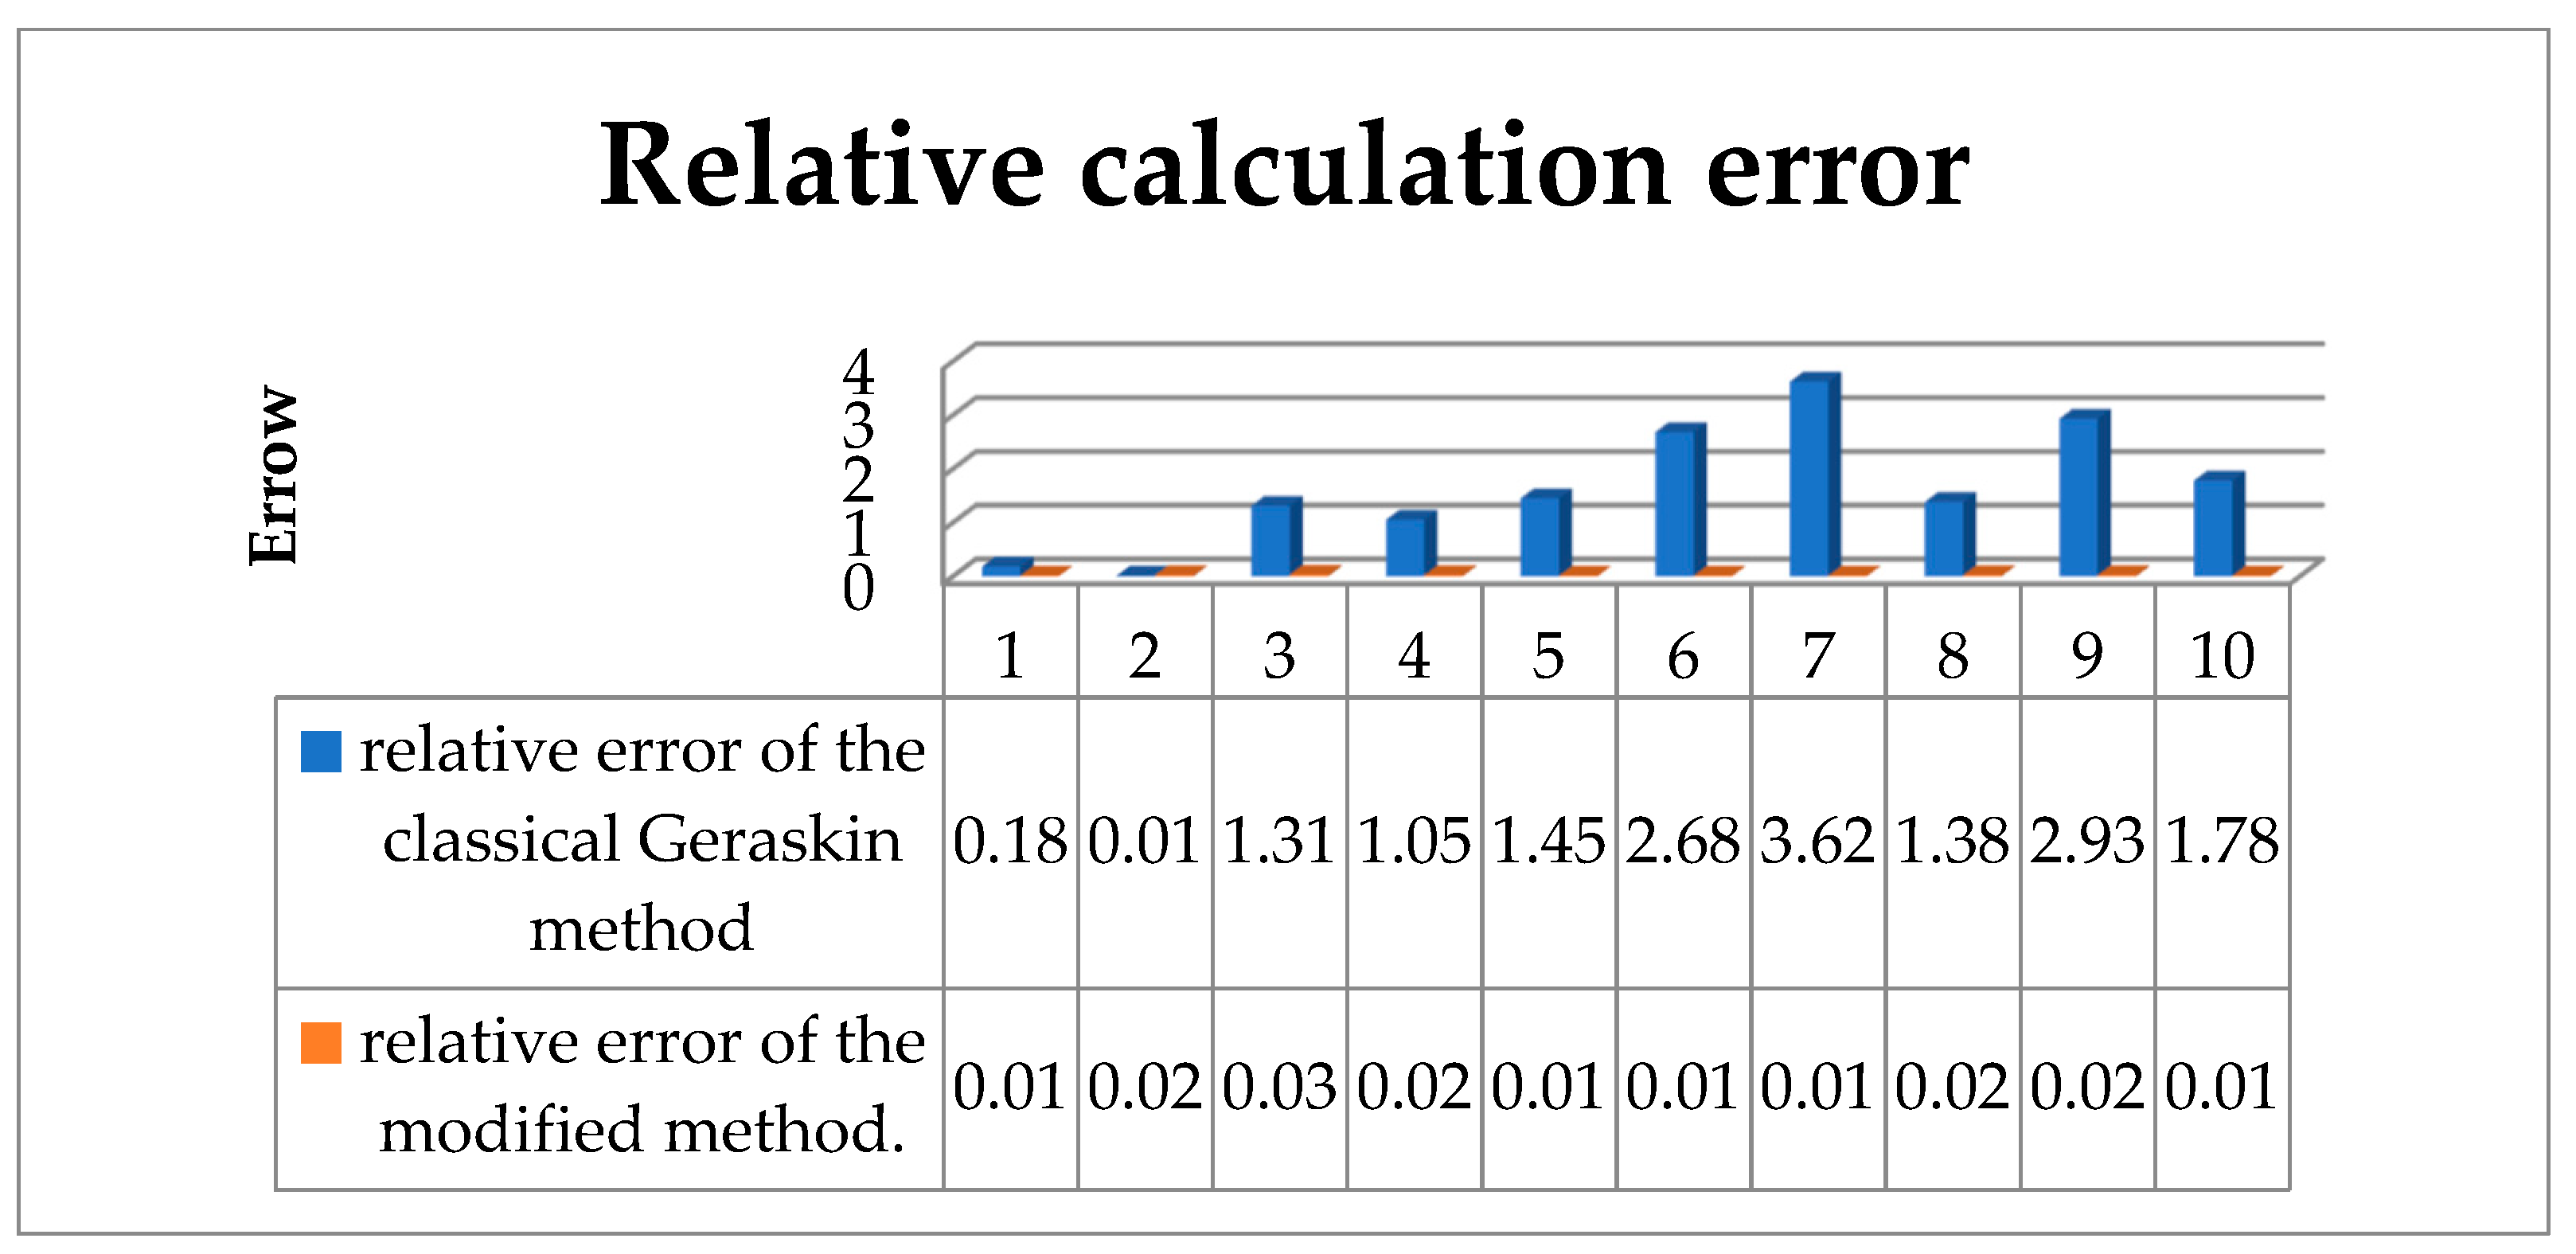
Figure 5 enables one to compare the two methods. The analysis shows that the suggested modified diakoptics method has both advantages and limitations [32]. Its key advantage is the absence of error accumulation, which is typical of the classical diakoptics method upon dividing a system into multiple subsystems (Figure 5 confirms the error accumulation). However, this high accuracy requires more computation time compared to the classical decomposition into subsystems, which is compensated by a decrease in the number of iterations to 1, i.e., a 13 times reduction of the computation time for the system under study.
Figure 5.
Calculation errors of the classical diakoptics method.
The classical method inverts a matrix of k × k in size at each of 13 iterations, and k increases at each iteration. The total number of operations is estimated as O(n3m), where n is the number of nodes and m is the number of iterations.
The method we suggest (Table 6), the matrix is inverted once for the entire system, which reduces the computation complexity to O(n3), or by 13 times (in the case under study). For systems with thousands of nodes, the gain is more significant.
Table 6.
Comparison of computation efforts.
The time of Z matrix computation for the grid 11 × 21 is 15.3 s for the classical method (13 iterations) against 5.2 s for the suggested method (1 step). The 2.9-time acceleration suggests the method’s performance.
When scaling to systems with 1000+ nodes, the expected gain increases proportionally to the number of nodes, since the classical method requires multiple recalculations of matrices at each iteration.
Optimization. To eliminate this shortcoming, we suggest a hybrid approach: decomposition of a large power system into functional subsystems and their independent calculation. This decomposition makes the following possible:
The results can be integrated into automated commercial electricity metering systems.
As an example, subsystem 1 (bypass 1) was distinguished in Figure 1. A matrix of generalized parameters was calculated for it, as follows:
Matrix of generalized parameters of subsystem 2:
Matrix of generalized parameters of subsystem 3:
Thus, despite the undeniable advantages of calculating a single large system (high accuracy, no error accumulation), the possibility and feasibility of working with subsystems cannot be completely excluded, especially in tasks where computation speed and ease of data processing are essential. The optimal choice of a method depends on the specific requirements for accuracy and speed.
5. Conclusions
This paper proposes a modification of the diakoptics method for calculating generalized parameters (Z-matrices) of power systems. An algorithm based on the simultaneous consideration of all network branches has been developed, which eliminates the sequential iterations characteristic of the classical approach [31]. For the test scheme with 11 nodes and 21 branches, the number of iterations is reduced from 13 to 1. Software implementation of the method and its verification were performed by comparing it with the classical method [31] and direct calculation. The coincidence of results with an accuracy of 0.03 confirms the correctness of the proposed approach.
A quantitative assessment of computational efficiency was carried out: for the test scheme, the calculation time was reduced by a factor of 2.9, and the asymptotic computational complexity was reduced from O(k·n3) to O(n3). Using the 11 × 21 scheme as an example, the possibility of applying the method for conceptual reliability analysis was demonstrated, including the assessment of node redundancy and the identification of potentially vulnerable elements based on graph models. The presented results were obtained on a test scheme of small dimension (11 nodes).
Future work includes testing the method on large benchmark schemes (IEEE 118, 300) to confirm scalability and assess the real performance gain, as well as adapting the method to account for unstable RES generation, including the development of probabilistic models of generalized parameters.
Thus, the proposed modification of the diakoptics method demonstrates the promise of an approach based on the simultaneous consideration of all branches. The results obtained on the test scheme (reduction in iterations, decreased computational complexity, confirmed accuracy) provide a foundation for further research aimed at scaling the method and adapting it to the tasks of analyzing modern power systems with a high share of RESs.
Author Contributions
Conceptualization, A.Z. and D.A.; methodology, A.Z. and D.A.; software, L.Y. and M.Y.; validation, L.Y. and M.Y.; formal analysis, L.Y. and M.Y.; investigation, B.I. and Z.I.; resources, B.I. and Z.I.; data curation, B.I. and Z.I.; writing—original draft preparation, A.Z. and D.A.; writing—review and editing, A.Z. and D.A.; visualization, B.I. and Z.I.; supervision, A.Z.; project administration, A.Z.; funding acquisition, Z.I. All authors have read and agreed to the published version of the manuscript.
Funding
This research was funded by the Committee of Science of the Ministry of Science and Higher Education of the Republic of Kazakhstan (grant No. AP23486411).
Institutional Review Board Statement
Not applicable.
Informed Consent Statement
Not applicable.
Data Availability Statement
The raw data supporting the conclusions of this article will be made available by the authors on request.
Acknowledgments
The authors have reviewed and edited the output and take full responsibility for the content of this publication.
Conflicts of Interest
The authors declare no conflicts of interest.
Nomenclature
| RES | Renewable Energy Source |
| SG | Smart Grid |
| SCADA | Supervisory Control and Data Acquisition |
| IoT | Internet of Things |
| G | Graph of the power system |
| V | Set of nodes (vertices) |
| E | Set of branches (edges) |
| n | Number of nodes |
| m | Number of branches |
| A | Incidence matrix (n × m) |
| Y | Diagonal matrix of branch admittances (m × m) |
| C | Current distribution matrix (m × n) |
| Z | Generalized parameters matrix (n × n) |
| k | Number of iterations (chords of the graph) |
| O | Computational complexity notation |
| U | Node voltage vector |
| I | Branch current vector |
| J | Node injection current vector |
References
- He, S.; Foley, A.; Chen, N.; Jia, T.; Wang, S. Cooperative electric energy transmission between Central Asia and Pakistan. Energy Strategy Rev. 2021, 38, 100756. [Google Scholar] [CrossRef] [Scilit]
- Assembayeva, M.; Egerer, J.; Mendelevitch, R.; Zhakiyev, N. A spatial electricity market model for the power system: The Kazakhstan case study. Energy 2018, 149, 762–778. [Google Scholar] [CrossRef] [Scilit]
- Mouraviev, N. Renewable energy in Kazakhstan: Challenges to policy and governance. Energy Policy 2021, 149, 112051. [Google Scholar] [CrossRef] [Scilit]
- Raihan, A.; Tuspekova, A. Role of economic growth, renewable energy, and technological innovation to achieve environmental sustainability in Kazakhstan. Curr. Res. Environ. Sustain. 2022, 4, 100165. [Google Scholar] [CrossRef] [Scilit]
- Labrador Rivas, A.E.; Abrão, T. Faults in smart grid systems: Monitoring, detection and classification. Electr. Power Syst. Res. 2020, 189, 106602. [Google Scholar] [CrossRef] [Scilit]
- Ali, A.O.; Elmarghany, M.R.; Abdelsalam, M.M.; Sabry, M.N.; Hamed, A.M. Closed-loop home energy management system with renewable energy sources in a smart grid: A comprehensive review. J. Energy Storage 2022, 50, 104609. [Google Scholar] [CrossRef] [Scilit]
- Hasankhani, A.; Mehdi Hakimi, S.; Bisheh-Niasar, M.; Shafie-khah, M.; Asadolahi, H. Blockchain technology in the future smart grids: A comprehensive review and frameworks. Int. J. Electr. Power Energy Syst. 2021, 129, 106811. [Google Scholar] [CrossRef] [Scilit]
- Akimzhanov, T.; Sarsikeyev, Y.; Zhantlessova, A.; Zhumazhanov, S.; Baydulla, Z.; Issabekova, B.; Issabekov, Z.; Mekhtiyev, A.; Neshina, Y. Identifying the influence of the system and mode characteristics on the power loss mode based in 110 kV power grids. East.-Eur. J. Enterp. Technol. 2023, 6, 6–14. [Google Scholar] [CrossRef] [Scilit]
- Zhantlessova, A.; Zhumazhanov, S.; Akimzhanov, T.; Issabekova, B.; Issabekov, Z.; Mekhtiyev, A.D.; Neshina, Y.G. Instrumental Research on the Voltage Harmonic Distortion Coefficient in the Modern 110 kV Urban Electric Network. Int. J. Energy Convers. (IRECON) 2023, 11, 56. [Google Scholar] [CrossRef] [Scilit]
- Qays, M.O.; Ahmed, M.M.; Parvez Mahmud, M.A.; Abu-Siada, A.; Muyeen, S.M.; Hossain, M.L.; Yasmin, F.; Rahman, M.M. Monitoring of renewable energy systems by IoT-aided SCADA system. Energy Sci. Eng. 2022, 10, 1874–1885. [Google Scholar] [CrossRef] [Scilit]
- Banjoko, A.O.; Melodi, A.O.; Adu, M.R. A Compact Review on the Impacts of Integration of Large-Scale Renewable Energy Sources into Grid-Connected Power Systems. Appl. Mech. Mater. 2026, 932, 125–138. [Google Scholar] [CrossRef] [Scilit]
- Ferlito, S.; Ippolito, S.; Santagata, C.; Schiattarella, P.; Di Francia, G. A Study on an IoT-Based SCADA System for Photovoltaic Utility Plants. Electronics 2024, 13, 2065. [Google Scholar] [CrossRef] [Scilit]
- Raihan, A.; Tuspekova, A. Dynamic impacts of economic growth, energy use, urbanization, agricultural productivity, and forested area on carbon emissions: New insights from Kazakhstan. World Dev. Sustain. 2022, 1, 100019. [Google Scholar] [CrossRef] [Scilit]
- Matousek, D.; Brtnik, B. Diakoptic Method as a Generalized Form of the Thevenin’ s Theorem. In Proceedings of the 2022 32nd International Conference Radioelektronika (RADIOELEKTRONIKA), Kosice, Slovakia, 21–22 April 2022; pp. 01–04. [Google Scholar] [CrossRef] [Scilit]
- Gao, H.; Yu, X.; Sui, Y.; Shao, F.; Sun, R. Topological Graph Convolutional Network Based on Complex Network Characteristics. IEEE Access 2022, 10, 64465–64472. [Google Scholar] [CrossRef] [Scilit]
- Lai, X.; Cao, M.; Liu, S.; Sun, C. Low-voltage distribution network topology identification method based on characteristic current. In Proceedings of the 2021 6th Asia Conference on Power and Electrical Engineering (ACPEE), Chongqing, China, 8–11 April 2021; pp. 1233–1238. [Google Scholar] [CrossRef] [Scilit]
- Pesteh, S.; Moayyed, H.; Miranda, V. Favorable properties of Interior Point Method and Generalized Correntropy in power system State Estimation. Electr. Power Syst. Res. 2020, 178, 106035. [Google Scholar] [CrossRef] [Scilit]
- Xu, H.; Zhao, Z.; Shi, B.; Zeng, Y.; Zheng, J.; Liu, W.; Mou, D.; Wang, H. Topology-aware Iterative Method for Large-scale Power Electronic Systems with Stray Parameters. In Proceedings of the 2023 IEEE 14th International Symposium on Power Electronics for Distributed Generation Systems (PEDG), Shanghai, China, 9–12 June 2023; pp. 1040–1044. [Google Scholar] [CrossRef] [Scilit]
- Singh, M.; Samanta, S.; Das, S.P. A Generalized Method of Determining Coil and Compensation Circuit Parameters of Basic WPT Topologies. In Proceedings of the 2021 National Power Electronics Conference (NPEC), Bhubaneswar, India, 15–17 December 2021; pp. 1–6. [Google Scholar] [CrossRef] [Scilit]
- Maswadah, M. Numerical Estimation Method for the Generalized Weibull Distribution Parameters. Int. J. Appl. Math. Comput. Sci. Syst. Eng. 2023, 5, 1–17. [Google Scholar] [CrossRef] [Scilit]
- Yang, D.; Sun, Y. Generalized Impedance-Based Stability Analysis for System- Level Small-Signal Stability Assessment of Large-Scale Power Electronics-Dominated Power Systems. In Proceedings of the 2021 IEEE 12th Energy Conversion Congress & Exposition—Asia (ECCE-Asia), Singapore, 24–27 May 2021; pp. 2069–2074. [Google Scholar] [CrossRef] [Scilit]
- Kron, G. Tensor analysis of rotating machinery. Electr. Eng. 1933, 52, 51. [Google Scholar] [CrossRef]
- Qays, M.O.; Kumar, R.; Ahmed, M.; Lachowicz, S.; Amin, U. Empowering Optimal Operations with Renewable Energy Solutions for Grid Connected Merredin WA Mining Sector. Appl. Sci. 2025, 15, 5516. [Google Scholar] [CrossRef] [Scilit]
- Hartmann, C.; Zhang, J.; Calaza, C.D.G.; Pesch, T.; Michielsen, K.; Benigni, A. Quantum Annealing Based Power Grid Partitioning for Parallel Simulation. IEEE Trans. Power Syst. 2025, 40, 4958–4970. [Google Scholar] [CrossRef] [Scilit]
- Zhao, H.; Sinkar, A.; Gole, A.M.; Zhang, Y. Accuracy Quantification of Multi-Rate Electromagnetic Transients Simulation. IEEE Trans. Power Deliv. 2024, 39, 1051–1062. [Google Scholar] [CrossRef] [Scilit]
- Galván-Sánchez, V.A.; Gutiérrez-Robles, J.A.; Bañuelos-Cabral, E.S.; López de Alba, C.A. Simulation of power grids using multirate methods. Rev. Simul. Comput. 2024, 8, e2081913. [Google Scholar] [CrossRef] [Scilit]
- Vistnes, M.; Vadlamudi, V.V.; Jakobsen, S.H.; Gjerde, O. Solving Security-Constrained Optimal Power Flow Using Analytical Benders’ Cuts. In Proceedings of the 2023 International Conference on Smart Energy Systems and Technologies (SEST), Mugla, Türkiye, 4–6 September 2023; pp. 1–6. [Google Scholar] [CrossRef] [Scilit]
- Akhmetbaev, D.S.; Jandigulov, A.R.; Akhmetbaev, A.D. Improving Algorithms for Searching for Trees of Directed Graphs of Electrical Power Systems. Power Technol. Eng. 2024, 58, 349–355. [Google Scholar] [CrossRef] [Scilit]
- Sheng, H.; Wang, G.; Chen, G.; Wang, Z.; Liu, Q. A Network Partitioning Method for Real-Time Simulation of Power System Based on State-Space and Branch Cutting. Int. J. Circuit Theory Appl. 2025, 53, 6103–6117. [Google Scholar] [CrossRef] [Scilit]
- Zhantlessova, A.; Akhmetbayev, D.; Issabekova, B. Determination of Generalised Parameters of Large Power Systems By the Diacoptics Method. In Proceedings of the 2024 International Ural Conference on Electrical Power Engineering (UralCon), Magnitogorsk, Russia, 27–29 September 2024; pp. 443–447. [Google Scholar] [CrossRef] [Scilit]
- Geraskin, O.T.; Grigoriev, V.A. Determination of generalized parameters of large power systems by the diacoptic method. Elektrichestvo 1981, 10–14. Available online: https://www.booksite.ru/elektr/1981/1981_11.pdf (accessed on 1 March 2026). (In Russian)
- Dzhandigulov, A.R.; Akhmetbaev, D.S. Finding All Spanning Graphs of a Given Graph: Software Program. Software Copyright Certificate No. 1551, 31 January 2019. Available online: https://copyright.kazpatent.kz (accessed on 1 March 2026). (In Russian)
- Montenegro, D.; Ramos, G.A.; Bacha, S. A-Diakoptics for the Multicore Sequential-Time Simulation of Microgrids Within Large Distribution Systems. IEEE Trans. Smart Grid 2017, 8, 1211–1219. [Google Scholar] [CrossRef] [Scilit]

Disclaimer/Publisher’s Note: The statements, opinions and data contained in all publications are solely those of the individual author(s) and contributor(s) and not of MDPI and/or the editor(s). MDPI and/or the editor(s) disclaim responsibility for any injury to people or property resulting from any ideas, methods, instructions or products referred to in the content. |
© 2026 by the authors. Licensee MDPI, Basel, Switzerland. This article is an open access article distributed under the terms and conditions of the Creative Commons Attribution (CC BY) license.