1. Introduction
Road traffic safety on highways is directly determined by the combination of factors within the “driver–vehicle–road–environment” system [
1]. In this context, it is the parameters governing the interaction between the tire and the road surface that define the physical limits of vehicle controllability during braking and maneuvering. Under winter operating conditions, the skid resistance of the pavement becomes a decisive factor, since snow and ice deposits, as well as a water film, sharply reduce the friction coefficient and may cause loss of vehicle stability even when drivers comply with standard driving regimes [
2].
However, accident analysis and winter maintenance practice often rely on averaged friction values and rarely account for the spatial distribution of friction across the carriageway width [
3,
4,
5,
6]. This omission is critical, as abrupt lateral contrasts in skid resistance may create unstable vehicle dynamics during lane changes or emergency braking. The present study addresses this overlooked aspect by quantifying across-width friction heterogeneity under winter operating conditions.
Although several studies report seasonal increases in skid resistance during winter months due to rainfall-induced cleaning and re-exposure of surface aggregates [
7,
8], this effect reflects texture recovery under wet conditions rather than the presence of freezing. A reduction in effective skid resistance is primarily associated with snow and ice formation on the pavement surface. Therefore, in the present study, the observed decrease in friction is linked specifically to icy conditions and non-uniform winter maintenance, rather than to winter as a general seasonal phenomenon.
International experience [
9,
10,
11,
12,
13,
14,
15] confirms that the risk of road traffic accidents increases significantly when the friction coefficient falls below threshold levels, while pronounced friction heterogeneity across the carriageway width (for example, the combination of a cleared wheel track and icy edge lanes [
9]) represents one of the most hazardous operating scenarios. In international research and road asset management practices in the EU, Canada, and the Scandinavian countries, skid resistance is treated as a measurable safety indicator that must be comparable over time and across road sections. Accordingly, parallel assessments are performed of (i) the friction coefficient/friction indicators, (ii) pavement texture parameters governing drainage and resistance to polishing, and (iii) their consequences in terms of braking distance variation at a given driving speed [
10,
11,
12,
13,
14,
15]. International reviews emphasize that it is the combined effect of macrotexture degradation and friction reduction under the influence of moisture, contamination, and winter-related factors that leads to a sharp increase in braking distance and accident rates. Therefore, monitoring systems should capture not only the average level of skid resistance but also its spatial variability across the traffic lane [
11,
12,
13,
14].
In countries with well-developed road networks (Germany [
10], the Scandinavian states [
11], Canada [
10,
12], the United States [
10,
12], and Japan [
10,
12]), regular instrumental monitoring of skid resistance and pavement texture is implemented [
13], along with standardized procedures for measurement and interpretation of results [
14,
15] and the integration of friction indicators into maintenance and rehabilitation decision-making. This includes winter maintenance regulations, prioritization of snow and ice removal, anti-icing treatments, and localized cleaning of edge lanes, areas adjacent to barriers, and expansion joints [
14,
15]. To ensure data comparability, approaches regulated by international guidelines and standards are applied, including PIARC reports on the harmonization of skid resistance and texture measurements [
16], locked-wheel friction measurement methodologies established in AASHTO/ASTM practice [
17], and ISO standards for assessing texture profile parameters (MPD) and their relationship with pavement performance characteristics [
18]. This framework enables comparison of friction and texture ranges across different road sections and seasons and their translation into engineering-interpretable indicators, including calculated braking distances at fixed travel speeds. Practical experience demonstrates that the most effective strategies are based not only on the application of deicing agents and mechanical snow removal, but also on structural design solutions that ensure durable macrotexture and the ability of the surface to rapidly drain water and disrupt ice films, as well as on managing friction heterogeneity across the lane width as an independent risk factor [
11,
12,
13,
14,
15]. Attention is given to high-speed roads and pavements sensitive to moisture variations and polishing, where the required operational levels of skid resistance must be provided with an adequate safety margin.
For Kazakhstan, the relevance of the problem under consideration is further intensified by the specific climatic and operational conditions. The continental climate, sharp temperature fluctuations, frequent transitions through 0 °C, blizzard events, and localized icing create complex regimes of snow and ice formation on road surfaces [
19]. On high-speed road sections, these processes lead to conditions of sudden deterioration in skid resistance, particularly when snow–ice compaction forms on edge lanes. The road sector in Kazakhstan has been experiencing an alarming increase in traffic accidents, especially during the winter period. Accident analyses indicate that one of the key contributing factors is the condition of road pavements in combination with climatic influences. According to available sources, during the first four months of 2025, 9.2 thousand road traffic accidents were recorded in Kazakhstan, representing a 51.5% increase compared to the same period in 2024 [
19,
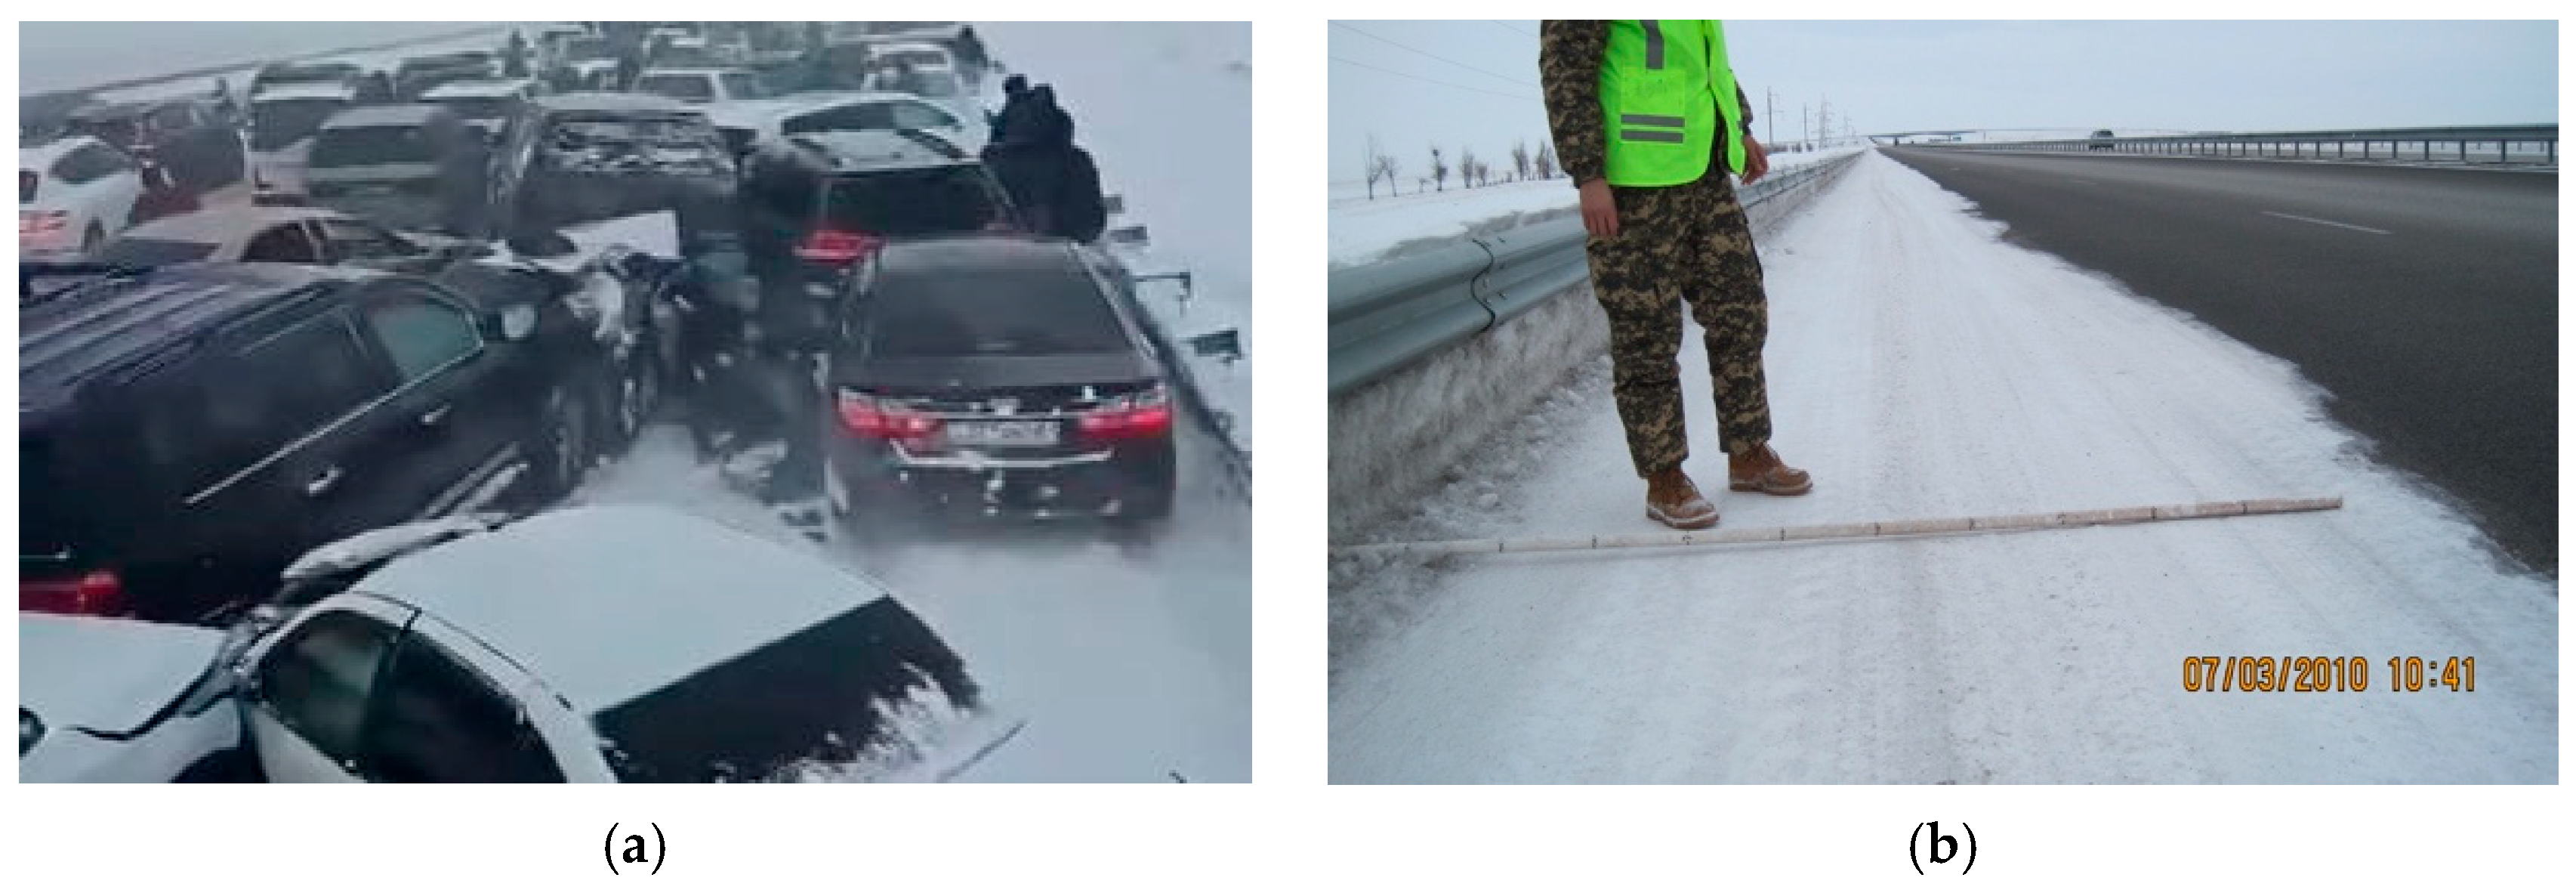
20]. A high-profile incident was the mass collision of 95 vehicles on 3 January 2025 at the 104 km mark of the Astana–Shchuchinsk highway, which resulted in a prolonged traffic shutdown (
Figure 1) [
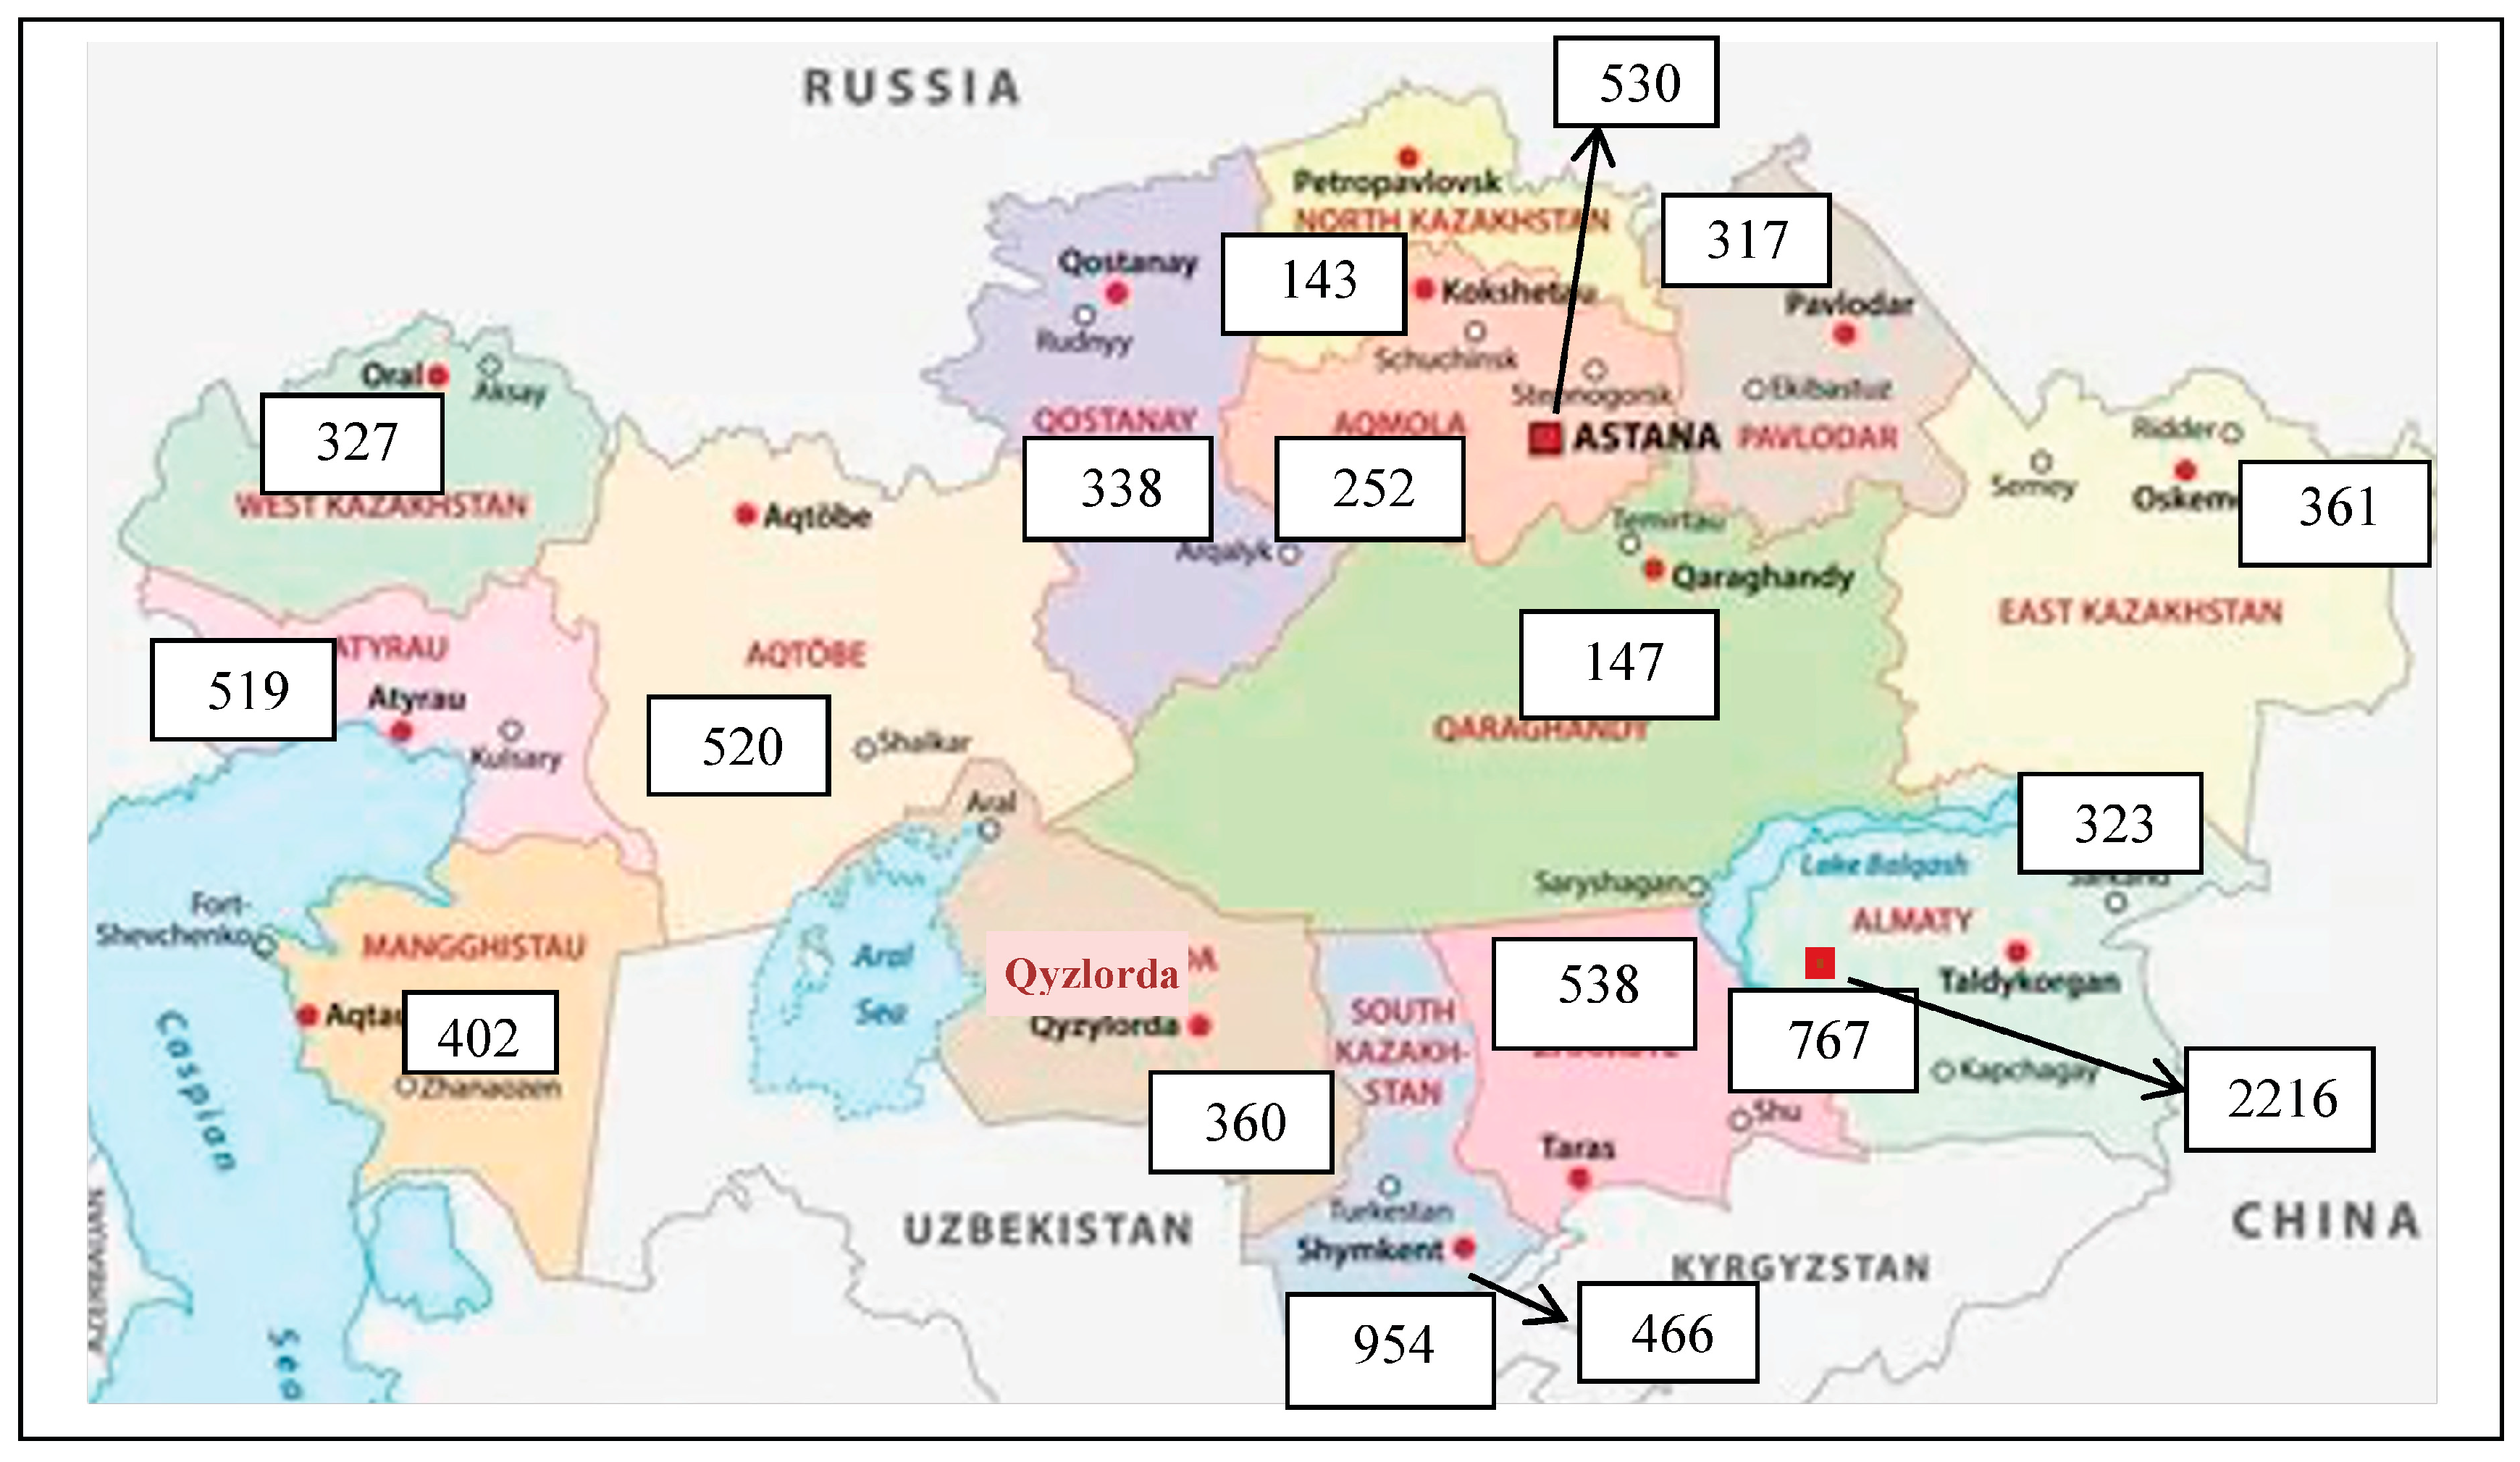
21]. Although driver error was formally cited as the cause, the actual conditions indicated inadequate winter maintenance: edge lanes remained partially uncleared of snow, snow–ice compaction developed, and the friction coefficient decreased to values on the order of 0.1 or lower. Under current regulations, such sections are classified as accident-prone. The year 2025 was characterized by prolonged freezing periods and repeated snow–ice events, leading to increased operational challenges for winter maintenance. Traffic intensity remained within the typical range observed over the monitoring period; therefore, the elevated friction heterogeneity observed in 2025 is primarily associated with adverse meteorological conditions rather than structural changes in traffic demand (
Figure 2) [
22].
Preliminary analysis of the incident indicates that traffic lanes were unevenly cleared, with relatively stable wheel tracks formed in the central portion of the carriageway, while compacted snow–ice deposits remained near the edge zones adjacent to barrier guardrails. Such spatial friction contrasts may produce sudden lateral instability when vehicles deviate from the central track, particularly at high speeds. This mechanism directly relates to the heterogeneity phenomenon investigated in the present study.
From an engineering perspective, the primary cause of winter road traffic accidents is insufficient skid resistance of road pavements and their heterogeneity across the carriageway width. This problem is particularly pronounced on high-speed highways with cement concrete pavements, where inadequate snow removal is frequently observed during the cold season in areas adjacent to barrier systems. Barrier guardrails act as obstacles to wind-driven snow transport and mechanized snow clearing, promoting snow accumulation and the formation of persistent snowbanks, which, under the action of vehicle wheels, rapidly transform into compacted snow–ice layers [
23]. As a result, the friction coefficient becomes highly non-uniform across the roadway width. Under such conditions, different wheel pairs of the same vehicle may simultaneously encounter zones with markedly different friction levels, leading to abrupt changes in the resultant traction force and triggering skidding and loss of vehicle control during braking or lane-changing maneuvers.
The interaction between vehicle tires and the road surface is one of the decisive factors governing traffic safety. The magnitude of skid resistance is influenced by vehicle speed, traffic intensity, tire condition, air and pavement temperature, the presence of moisture and ice, as well as the structure and condition of the pavement surface. Quantitatively, skid resistance properties are characterized by the friction coefficient φ and by texture roughness parameters [
23,
24]. From a physical standpoint, the friction coefficient represents the coefficient of friction between the rubber tread and the pavement surface and is determined by the combined contribution of adhesive and hysteretic (deformation-related) friction components. Surface texture (macro- and microtexture) describes the surface irregularities that govern the nature of microcontact and the ability of the pavement to disrupt water or ice films and to provide drainage from the tire–pavement contact patch. When texture degrades due to wear, surface polishing by vehicle tires, or the formation of an ice film, the friction coefficient decreases, leading to a substantial increase in braking distance and a reduction in vehicle stability.
Despite the evident engineering significance of this problem, methodological and practical limitations persist in domestic practice to the present day. In many cases, monitoring of skid resistance is episodic and not linked to an assessment of texture degradation over time, while accident analysis is often confined to evaluating driver behavior without considering the spatial distribution of the friction coefficient across traffic lanes and edge zones [
25]. Insufficient attention has been given to how macrotexture degradation—resulting from traffic loading and operational impacts—affects the reduction in skid resistance under winter conditions, as well as to determining which roughness threshold values should be regarded as critical for high-speed roads in the conditions of Kazakhstan [
19,
20]. The practical relationship between traffic intensity and composition, the rate of texture wear, and the formation of accident-prone pavement conditions also requires further clarification.
Based on the foregoing, the objective of the present study is to establish quantitative relationships between the degradation of pavement surface texture, the reduction in the friction coefficient, and the level of traffic safety under winter operating conditions. To achieve this objective, the study addresses the following tasks: (1) analysis of the mechanisms by which friction heterogeneity affects vehicle stability during braking and driving; (2) experimental assessment of friction coefficients on different types of road pavements using field measurements; (3) investigation of the temporal dynamics of macrotexture degradation as a function of traffic intensity and traffic composition; (4) evaluation of the consequences of reduced skid resistance for braking distance and operational traffic safety; and (5) development of practical recommendations for winter road maintenance and pavement texture restoration.
For the first time under the conditions of the Republic of Kazakhstan, the following scientific results have been obtained on the basis of field measurements and long-term monitoring: (1) multi-year (2023–2025) data on macrotexture degradation (macrotexture depth R), collected through repeated measurements at the same survey sections, were obtained and analyzed, enabling a quantitative assessment of pavement surface wear rates under traffic loading; (2) a three- to fivefold variation in the friction coefficient φ across the carriageway width during the winter period (edge zones adjacent to guardrails/shoulders versus central lanes) was experimentally identified and quantitatively substantiated, forming a critical operational scenario associated with loss of vehicle stability during braking and lane-changing maneuvers; (3) a forecast of skid resistance reduction was performed based on extrapolation of macrotexture degradation R and the established R–φ relationship, and the corresponding engineering consequences were demonstrated in the form of increased calculated braking distances at representative travel speeds. The practical significance of the study lies in the applicability of the results for substantiating requirements for winter road maintenance, planning preventive measures for pavement texture restoration, and improving traffic safety on high-speed road sections, including those with cement concrete pavements.
2. Materials and Methods
The study was conducted as an integrated investigation comprising: (1) an analytical justification of the effect of heterogeneous skid resistance across the carriageway width on vehicle deceleration and stability; (2) field measurements of the friction coefficient on different pavement types during summer and winter periods; (3) in situ measurements of macrotexture parameters with repeated surveys at the same road sections over several years to assess temporal texture degradation; and (4) data processing involving the derivation of relationships and predictive assessments of changes in skid resistance properties.
The target indicators included
- −
The longitudinal and transverse friction coefficients are denoted as φl and φt, respectively, where φl represents the longitudinal friction coefficient (along the direction of motion) and φt represents the transverse friction coefficient (perpendicular to the direction of motion);
- −
Macrotexture parameters (macrotexture depth) determined using the sand patch method;
- −
Traffic loading indicators (traffic intensity and traffic composition) as factors governing texture degradation.
2.1. Objects of Study and Measurement Sections
The objects of the study were highways of various technical categories with asphalt concrete and cement concrete pavements operated under continental climate conditions. The selection of measurement sections was based on differences in pavement structural characteristics, traffic regimes, traffic intensity, and features of seasonal operation, which made it possible to comprehensively assess the influence of surface texture and its degradation on skid resistance and traffic safety.
To compare the skid resistance of road pavements under summer conditions, field measurements were carried out on two sections of the high-speed Almaty–Ust-Kamenogorsk highway. The first section, extending from km 22 to km 44, featured a cement concrete pavement, while the second section, from km 288 to km 337, had an asphalt concrete pavement. The selected sections represent major functional segments of the regional highway network, including high-traffic corridors with substantial heavy-vehicle share.
The selected sample includes 71 km of road sections, which represents approximately 14% of the total road network within the study area. This proportion allows the dataset to capture the variability of pavement conditions and traffic exposure, supporting its representativeness for the purposes of this study. The sampling strategy was designed to include sections with varying traffic intensity, structural conditions, and surface characteristics, which are known to influence friction and macrotexture behavior.
At the time of measurements, the pavement surfaces were in a dry and clean condition, ensuring comparability of the obtained data and minimizing the influence of atmospheric moisture on the friction coefficient. The selection of these sections enabled a valid comparison of the skid resistance properties of different pavement types under similar operational and traffic conditions.
To investigate the distribution of skid resistance across the carriageway width under winter conditions, measurements were conducted in January 2025 on high-speed highways with cement concrete pavements. The experimental sections were located on the Astana–Petropavlovsk highway within km 186 + 400–189 + 000 and on the Almaty–Ust-Kamenogorsk highway within km 41 + 200–43 + 800. Both sections belong to Category Ia roads with high permitted travel speeds. Measurements were performed with stepwise referencing to individual traffic lanes, progressing from the edge lanes toward the central part of the carriageway. This approach made it possible to identify the winter-specific heterogeneity of skid resistance across the roadway width and to assess its impact on vehicle stability during braking and maneuvering. The 5 km section selected for the transverse friction analysis was chosen based on its structural and operational representativeness within the studied highway category. This segment includes standard lane geometry, typical pavement structure, and traffic intensity consistent with the broader regional network, including a substantial proportion of heavy vehicles. Importantly, it also contains sections adjacent to safety barriers and edge zones where winter maintenance heterogeneity is most pronounced, which is central to the objectives of this study. Therefore, although the transverse analysis was conducted on a defined subsection, the observed friction patterns are considered representative of highways with comparable structural, traffic, and climatic conditions.
It should be noted that the friction measurements were conducted under natural winter temperature conditions. The viscoelastic behavior of rubber materials, including potential glass transition effects at low temperatures, was not explicitly controlled or separately evaluated in this study.
The surface condition described as “compacted ice and snow deposits” was identified based on visual inspection and field observation during the measurement campaigns. It should be noted that no direct physical quantification of these conditions was performed. Parameters such as ice layer thickness, liquid water content, and precise pavement surface temperature were not instrumentally measured during testing. Therefore, the reported results correspond to operational field conditions rather than strictly controlled thermophysical states of the pavement surface.
Ambient temperature during the measurements was recorded; however, localized surface temperature variations and phase composition of the surface layer (ice–water–snow ratio) were not explicitly characterized.
In this study, road categories are defined according to the national highway classification system [
26], which is based primarily on functional role, design standards, and traffic intensity. The classification reflects differences in design speed, lane width, structural pavement composition, and average annual daily traffic (AADT), including the proportion of heavy vehicles. These parameters directly influence pavement loading conditions and maintenance practices and are therefore relevant for interpreting skid resistance performance. The categorization is used to ensure that friction results are analyzed within comparable structural and operational frameworks.
To assess the temporal degradation of pavement macrotexture and to analyze the influence of traffic loading on the rate of texture wear, sections of the regional road “Taraz–Asa–Akkul–Saudakent,” classified as a Category III Road, were selected. On these sections, long-term monitoring of pavement macrotexture parameters was carried out. Measurements were repeatedly performed at the same survey sections during the 2023–2025 period, which made it possible to trace the dynamics of macrotexture depth changes during service life and to establish quantitative relationships between traffic intensity, traffic composition, and pavement texture degradation.
For clarity and to improve readability for international readers,
Table 1 summarizes the analyzed road sections, indicating their pavement type, structural category, and main traffic characteristics. In the subsequent sections, abbreviated designations are used for convenience.
At each survey point, friction measurements were performed in three repeated runs to ensure repeatability. The reported values represent the arithmetic mean of these repetitions. In addition to mean values, minimum recorded friction coefficients were analyzed to assess safety-critical conditions, as extreme values are more relevant for braking performance than averaged indicators.
2.2. Instrumentation and Measured Parameters
To obtain reliable and comparable data on the skid resistance of road pavements and the characteristics of their surface, the study employed a set of measurement instruments and methods that allowed the assessment of both instantaneous friction coefficient values and the spatial and temporal variability of these parameters.
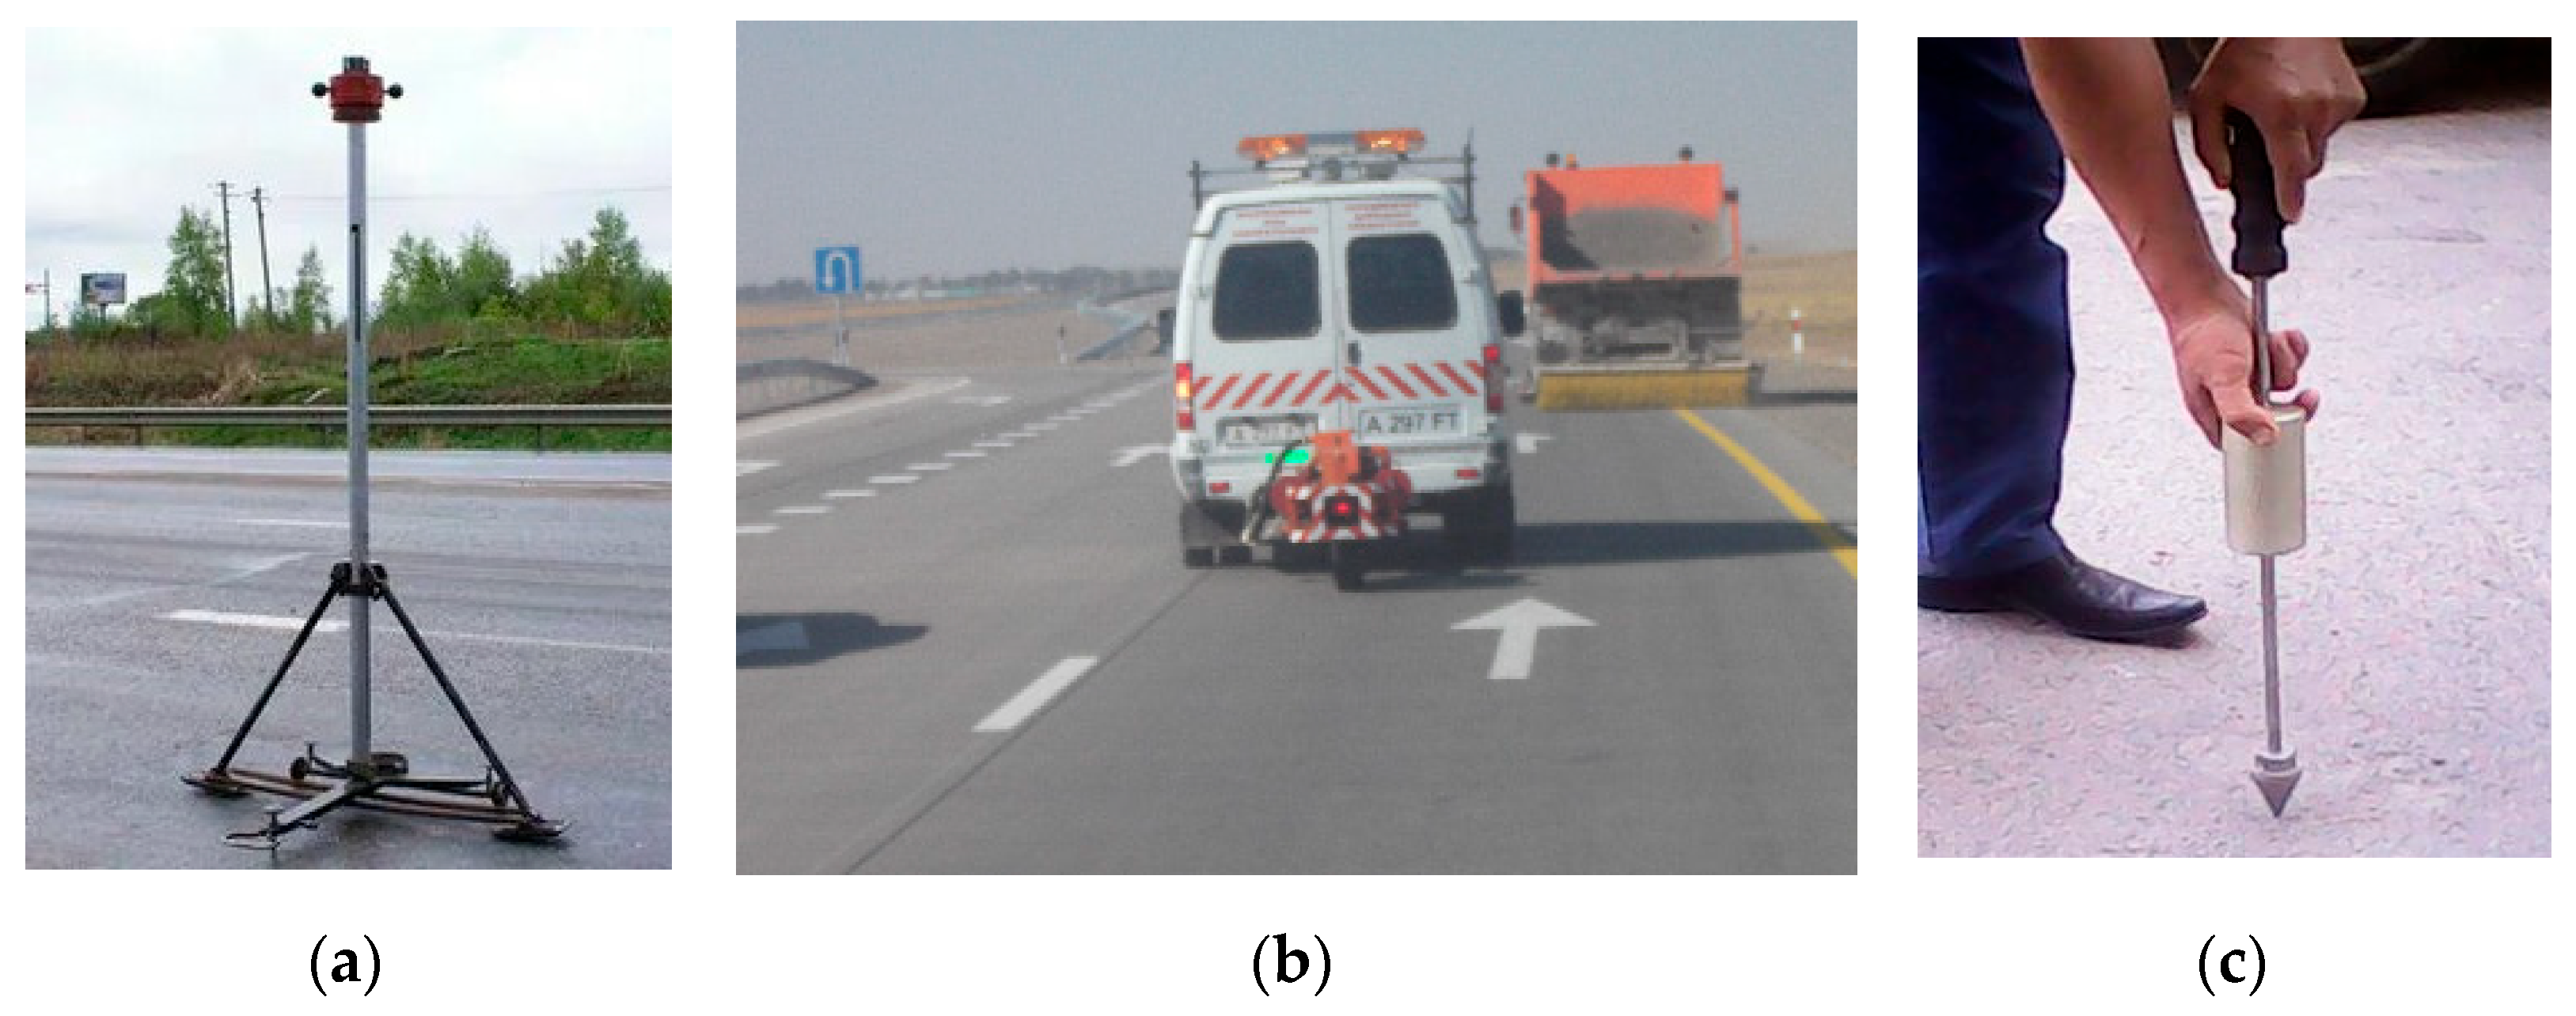
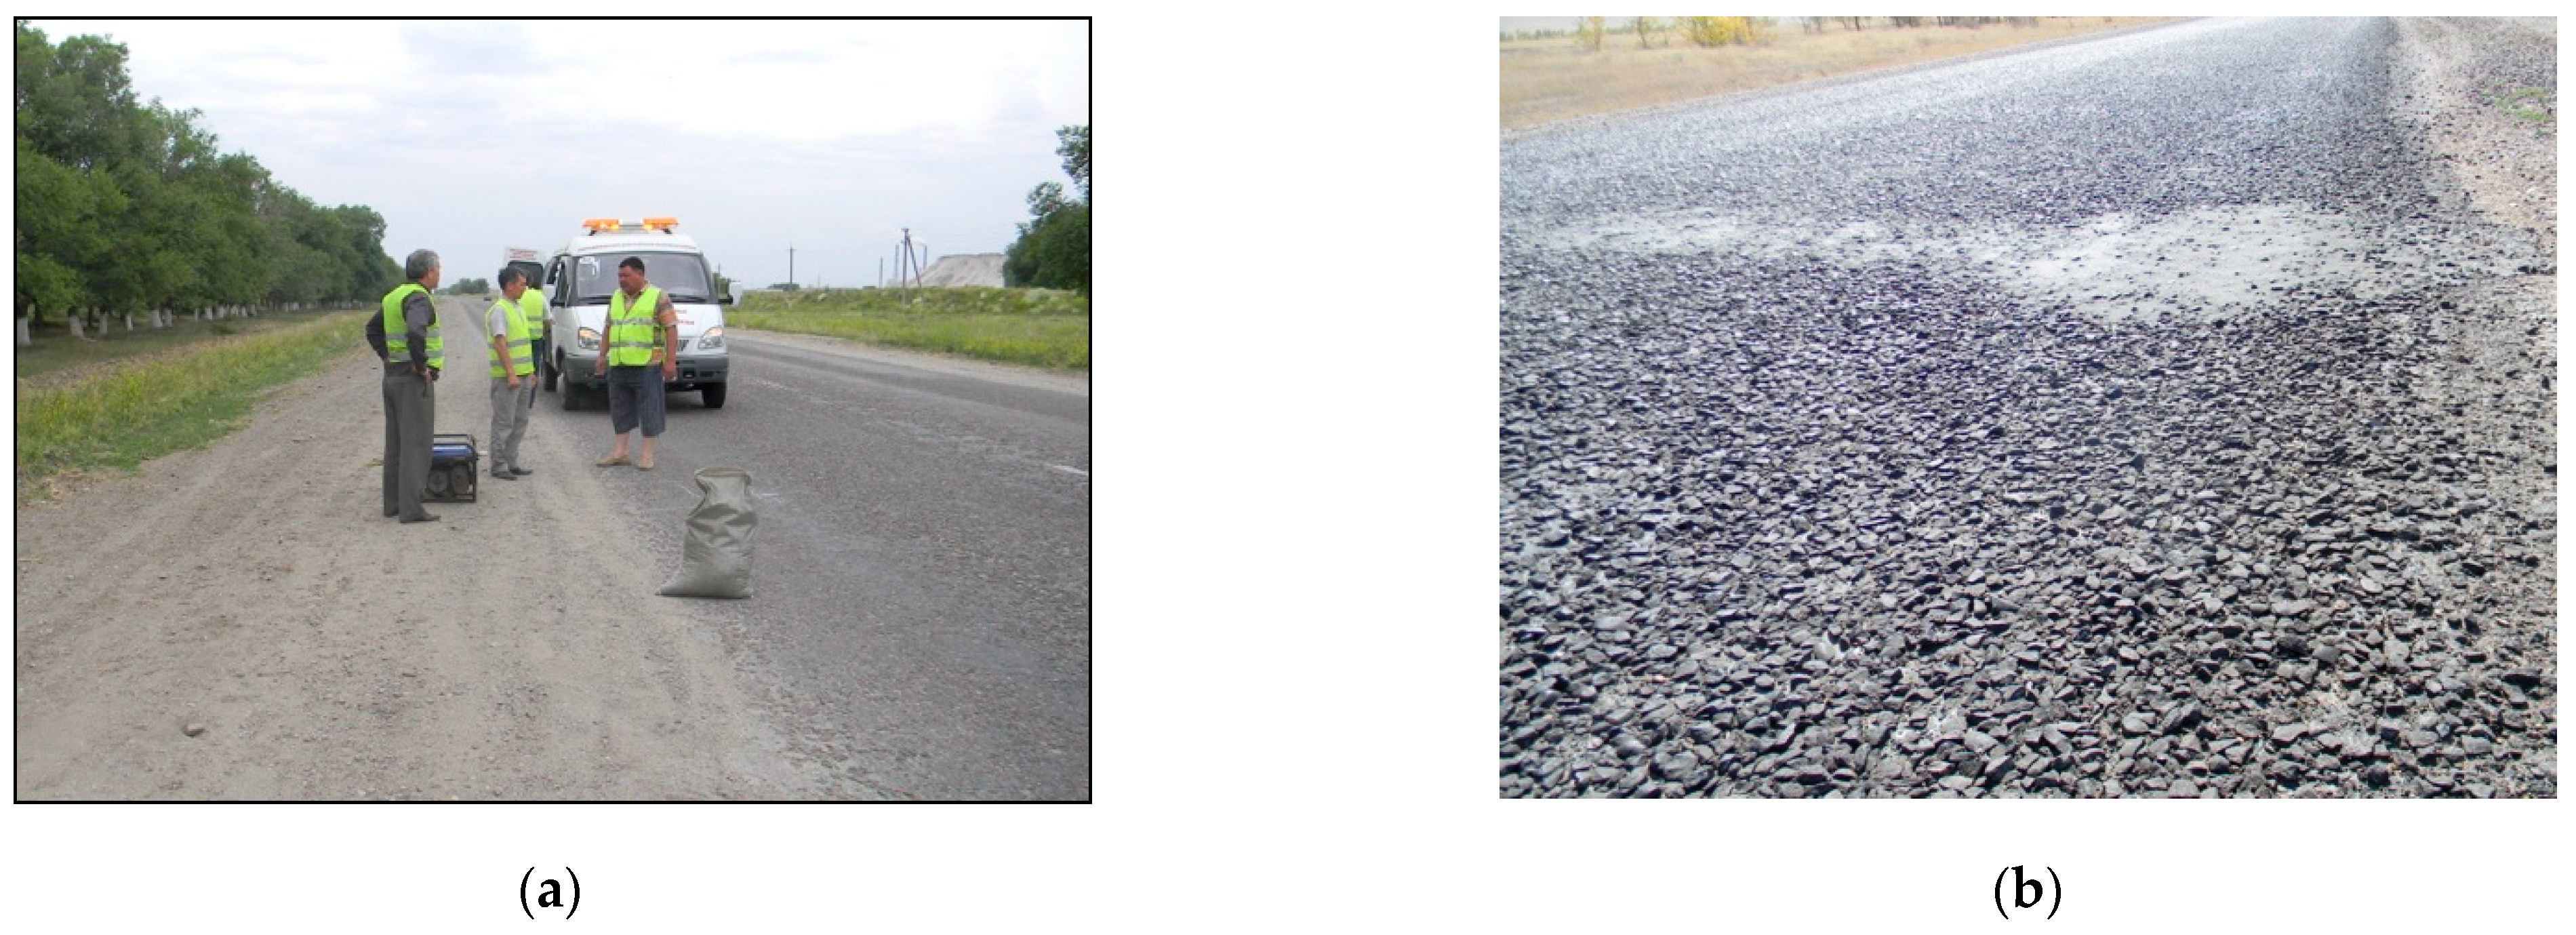
Measurement of pavement skid resistance was performed using several types of instruments (
Figure 3). A portable friction measurement device (IKSp) (
Figure 3a) was used as the primary tool for point measurements, enabling the determination of both longitudinal and transverse friction coefficients at fixed locations on the pavement surface. For continuous route-based measurements under traffic conditions, a dynamometric trailer (PKRS-2U) (
Figure 3b) was employed, allowing continuous recording of longitudinal friction coefficient values over extended road sections and providing the spatial distribution of skid resistance along the alignment. To assess skid resistance under winter conditions and to analyze its distribution across traffic lanes, a portable skid resistance control device (PKSp) (
Figure 3c) was used, which enabled sequential measurements on edge lanes and in the central part of the carriageway. In addition, when it was necessary to evaluate the influence of the physical condition of the pavement material on skid resistance properties, a hardness tester was applied to evaluate the surface hardness of the road pavement.
The combined use of the IKSp and PKRS-2U instruments was regarded as a fundamentally important methodological approach, as it ensured the integration of continuous route-based measurements of the friction coefficient with point-based control measurements conducted at the same road sections. This approach enhanced the reliability of the experimental data, enabled the identification of localized zones with reduced skid resistance, and allowed for cross-validation and comparison of results obtained using different measurement methods.
Measurement of pavement surface roughness parameters was carried out considering that surface texture can be characterized by various methods, including optical, ultrasonic, laser, stereophotogrammetric, and contact techniques. These methods are based either on the analysis of reflected signals (in the case of optical, ultrasonic, and laser measurements), on three-dimensional surface reconstruction from photographic data, or on direct surface profiling through contact between a measuring probe and the pavement. In the present study, the simple, standardized, and reproducible sand patch method was selected as the baseline field technique for quantitative assessment of pavement macrotexture depth. This method provides sufficient accuracy for engineering evaluations, is widely used in road practice, and allows comparison of results obtained in different years and on different road sections, which is particularly important for analyzing temporal degradation of surface roughness.
Winter measurements were conducted under operational traffic conditions following routine maintenance procedures. Although the exact time since the last snow plough pass was not recorded for each measurement event, surveys were performed during stable winter surface states representative of real driving conditions. Ambient air temperature was documented during field campaigns and ranged within typical winter operational intervals for the region. The objective was to characterize effective friction conditions encountered by drivers rather than to isolate laboratory-controlled ice behavior.
It should be noted that asphalt concrete sections were not included in the winter measurement campaign. This decision was due to methodological limitations related to surface conditions during winter.
Under winter conditions, asphalt surfaces are typically covered by snow, ice, or compacted slush, which significantly alters the surface characteristics and prevents direct measurement of intrinsic pavement properties such as macrotexture and friction. As a result, measurements obtained under such conditions would primarily reflect the properties of the snow–ice layer rather than the asphalt material itself [
27].
Therefore, including asphalt concrete sections in the winter analysis would not provide directly comparable data with the summer measurements, where the pavement surface is exposed and its physical properties can be reliably assessed [
28].
The winter analysis in this study is thus focused on shoulder conditions and snow-affected surfaces, which are critical for vehicle dynamics and safety under real operating conditions [
27,
28,
29,
30].
This approach allows maintaining internal consistency of the dataset while avoiding misinterpretation of surface-dependent parameters.
2.3. Analytical Calculations (Theoretical Framework)
To analyze vehicle motion under conditions of non-uniform pavement state, a case was considered in which different wheels are subjected to different friction coefficients (for example, the wheels on one side of the vehicle are on a cleared lane, while those on the opposite side are on an icy shoulder) [
31]. The total friction force during braking is represented as the sum of the forces acting on pavement sections with different levels of skid resistance:
where Q denotes the wheel load (the weight acting on a wheel/axle),
φ1 is the friction coefficient on the main traffic lane, and
φ2 is the friction coefficient on the shoulder or slippery section.
The average vehicle deceleration during straight-line braking is given by [
32]
where g is the acceleration due to gravity (9.81 m/s
2).
The calculations were applied to evaluate the reduction in braking efficiency and the increased risk of loss of vehicle stability under conditions of sharp friction contrasts across the carriageway width. In addition, rolling resistance was considered: when a vehicle deviates onto a soft or snow-covered shoulder, the rolling resistance coefficient f may increase up to 0.1 (compared to 0.01–0.02 on asphalt), which further increases the likelihood of skidding and degrades vehicle controllability even before the full braking force is realized.
According to experimental and analytical studies [
33,
34,
35], rolling resistance on compacted or loose snow surfaces increases significantly compared to dry asphalt conditions due to additional energy losses associated with snow deformation and plowing effects.
While typical rolling resistance coefficients for paved roads range from approximately 0.01 to 0.02, winter conditions may lead to an order-of-magnitude increase depending on snow depth, density, and surface condition. Therefore, the adopted value of
f = 0.1 can be considered a conservative estimate for poorly maintained or snow-covered shoulders [
33,
34,
35].
2.4. Field Measurements of the Friction Coefficient
Field measurements of the friction coefficient and surface roughness parameters were conducted during summer and winter periods on highways of Category Ia and Category III within the territory of the Republic of Kazakhstan. Summer measurements were carried out in June 2025 under dry pavement conditions on sections of the Almaty–Ust-Kamenogorsk highway (km 22–44 with cement concrete pavement; km 288–337 with asphalt concrete pavement). Winter measurements were performed in January 2025 on cement concrete pavements of the Astana–Petropavlovsk highway (km 186 + 400–189 + 000) and the Almaty–Ust-Kamenogorsk highway (km 41 + 200–43 + 800).
During winter measurements, the actual operational condition of the carriageway surface was recorded, including the presence of compacted snow–ice layers, cleared wheel tracks, and contaminated edge zones. It was established that, because of non-uniform snow removal, the friction coefficient varies significantly across the carriageway width, particularly in areas adjacent to barrier guardrails, where persistent snow–ice compaction forms.
Field investigations of pavement skid resistance were conducted in two stages corresponding to different seasonal operating conditions of highways. This approach made it possible to compare pavement friction properties under favorable summer conditions and under the most adverse winter conditions, as well as to identify features of the spatial distribution of the friction coefficient.
Summer measurements of the friction coefficient were carried out in June 2025 on sections of the Almaty–Ust-Kamenogorsk highway with cement concrete and asphalt concrete pavements. The field methodology included route-based measurements of the longitudinal friction coefficient using a dynamometric trailer (PKRS-2U), which provided continuous recording of φ values while traveling along the studied sections. To improve measurement accuracy and to verify the results, additional point-based control measurements of both longitudinal and transverse friction coefficients were performed using a portable IKSp device. In parallel, macrotexture measurements were conducted at representative survey points, allowing the friction coefficient values to be correlated with surface texture parameters and their interrelationship to be identified. To account for the influence of surface moisture, part of the control measurements was carried out after precipitation events in the presence of a thin water film on the pavement, enabling assessment of changes in skid resistance relative to dry surface conditions. The representative survey points were selected to reflect typical operational and structural conditions within the analyzed pavement sections. The selection criteria included uniform pavement structure, absence of recent localized repairs, stable traffic loading conditions, and standard lane geometry. Points were distributed across central and edge zones to capture potential lateral variability in surface texture. Locations influenced by localized defects (e.g., potholes, patching, or construction joints) were excluded to ensure that the measurements reflect general pavement performance rather than isolated anomalies. This approach ensures that the macrotexture data are indicative of the broader pavement sections under study.
Winter measurements of the friction coefficient were conducted in January 2025 on cement concrete highways of Category Ia with high permitted travel speeds (up to 140 km/h). Measurements were performed using a portable skid resistance monitoring device (PKSp). A distinctive feature of the methodology was the sequential execution of measurements across traffic lanes—from the edge lanes adjacent to shoulders and barrier guardrails toward the central part of the carriageway. Friction coefficient values φ were recorded at predefined reference points, ensuring data comparability and enabling assessment of the spatial variability of skid resistance across the roadway width. This approach made it possible to quantitatively identify winter-specific friction heterogeneity, typical of sections where snow compaction forms near the shoulders while the central traffic lanes remain relatively better cleared.
The study presents datasets of experimental friction coefficient values obtained during winter measurements, along with their averaged values for individual traffic lanes. The tabular presentation of the data provides a clear illustration of the differences in skid resistance between edge lanes and central lanes and enables these results to be used for subsequent analysis of the impact of heterogeneous skid resistance on traffic safety. The analyzed road sections include dual carriageways with two traffic lanes per direction for higher-category highways and single carriageways with one lane per direction for lower-category roads. The lane configuration is consistent within each road category throughout the monitored segments. The reported averaged friction values were calculated separately for each traffic lane by aggregating measurements obtained along the longitudinal direction of that lane. No averaging was performed across opposing directions of traffic. This approach ensures that lane-specific friction characteristics are preserved and allows meaningful comparison across road categories with different cross-sectional configurations.
2.5. Measurement of Macrotexture Using the Sand Patch Method and Consideration of Traffic Loading
Assessment of pavement surface macrotexture was performed using the standardized field sand patch method in accordance with the requirements of GOST 58422.1–2021 [
36]. This method was applied to determine pavement macrotexture depth as one of the key parameters influencing skid resistance and the ability of the surface to ensure effective tire–pavement interaction under wet and icy conditions. The procedure involved applying a strictly dosed volume of dry, clean sand onto the pavement surface, which was then uniformly spread in a circular pattern until the surface voids between aggregate particles were filled. After sand distribution, the diameter of the resulting sand patch was measured, and the average macrotexture depth for the investigated section was calculated on this basis. To ensure measurement consistency and minimize operator-dependent variability, the sand patch tests were performed by the same trained operator throughout the entire three-year monitoring period. This approach reduced inter-operator variability and improved the comparability of macrotexture measurements. Additionally, all tests were conducted following a standardized procedure, including consistent sand volume, spreading technique, and measurement of the patch diameter.
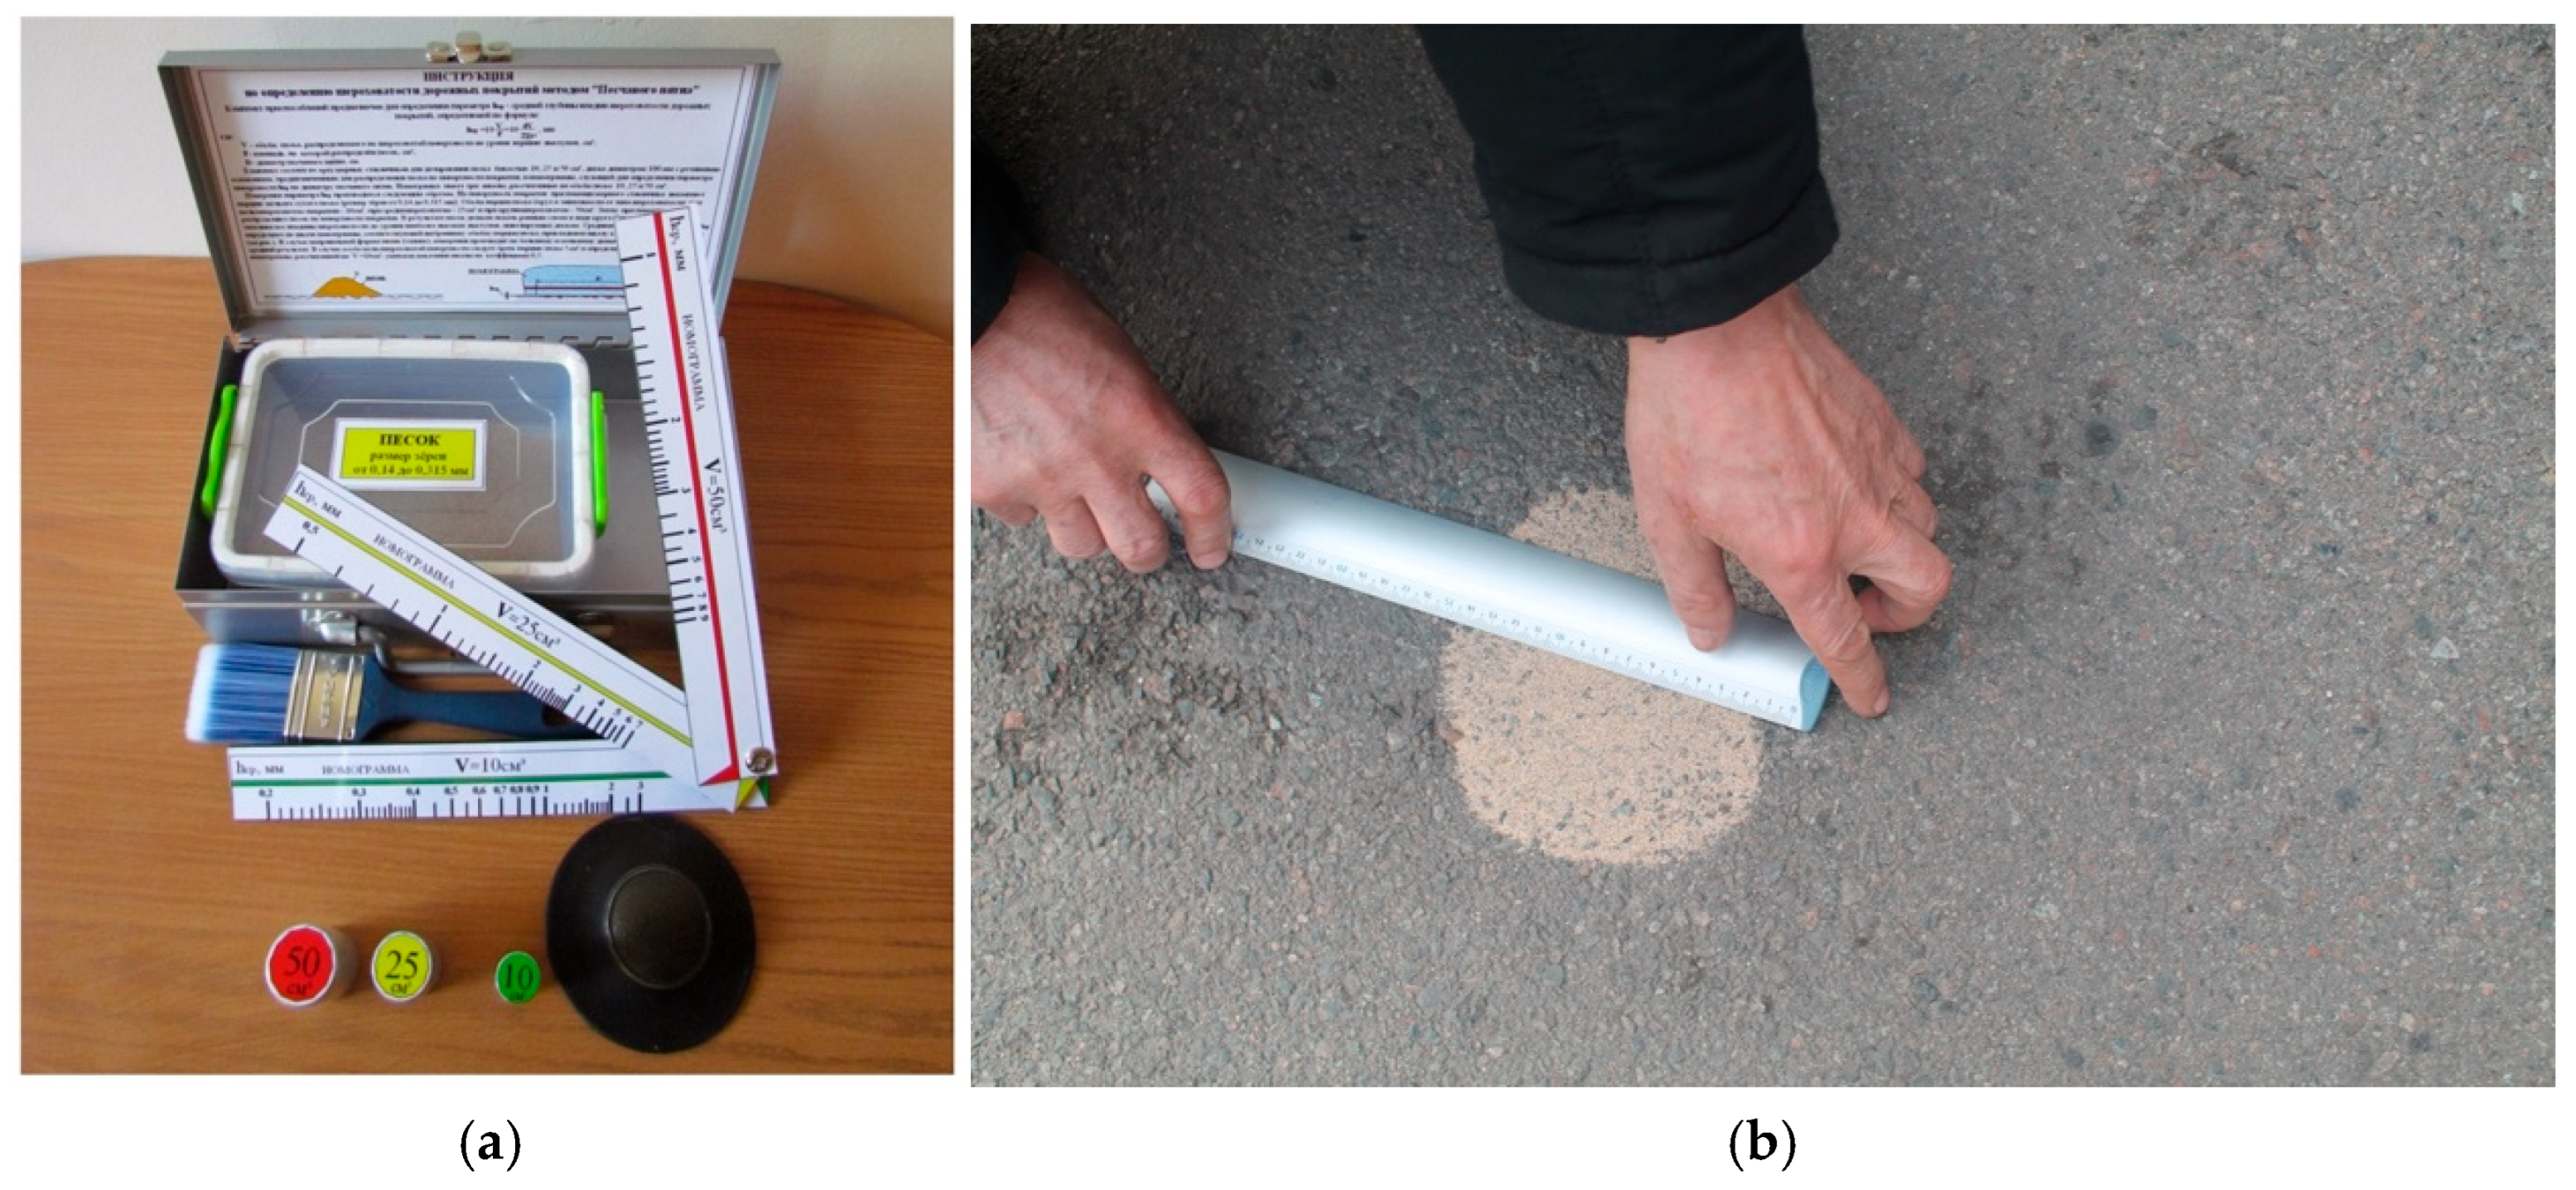
A standard set of equipment was used to perform the measurements, including a graduated container for sand dosing, a flat disk (tamper) for uniform distribution of sand over the surface, a measuring ruler for determining the patch diameter, and a brush for cleaning the pavement prior to testing (
Figure 4). The sand volume was selected depending on the initial surface condition and the nature of pavement roughness. For finely textured surfaces, a sand volume of approximately 10 cm
3 was used; for medium-textured surfaces, about 25 cm
3; and for coarse-textured surfaces, approximately 50 cm
3. This approach ensured the correctness of the measurements and made it possible to obtain comparable macrotexture depth values on pavements with different surface structures.
Friction coefficient measurements were performed using the PKRS-2U dynamometric trailer and the portable IKSp and PKSp devices. Measurements were carried out sequentially across traffic lanes and over the width of the carriageway. On winter test sections, measurements were conducted for each traffic lane, which made it possible to obtain a profile of friction coefficient variation across the roadway width.
The measurement interval along the road sections followed the standard chainage reference used in highway surveys (every 200 m), ensuring data comparability between different sections and repeated inspections. At each measurement point, repeated measurements were performed, after which averaged friction coefficient values were used in the analysis and presented in the results tables.
To assess the temporal degradation of macrotexture, measurements were performed at the same survey sections of the “Taraz–Asa–Akkul–Saudakent” road over three consecutive years: 2023, 2024, and 2025. Repeated measurements at identical locations made it possible to determine the actual reduction in macrotexture depth during service life and to calculate ΔR as a quantitative indicator of surface roughness degradation. This long-term monitoring enabled analysis of pavement surface wear dynamics and identification of patterns of texture evolution under the influence of traffic loading.
When interpreting the obtained data, traffic intensity and traffic composition indicators were considered for each investigated section. The analysis included assessment of the proportions of passenger cars, freight vehicles, and heavy multi-axle truck combinations within the overall traffic flow. These characteristics were considered key factors governing pavement polishing and macrotexture degradation, since heavy and multi-axle vehicles exert substantially greater contact and abrasive loads on the road surface. The resulting data on traffic intensity and composition were used to establish relationships between macrotexture wear rates and traffic loading, as well as for subsequent predictive calculations of changes in pavement skid resistance during service life. In the present study, traffic loading was characterized using absolute counts of vehicle categories and their composition within the traffic stream. These data were used as empirical indicators of operational loading conditions affecting macrotexture degradation. However, the traffic data were not converted into equivalent single-axle loads (ESAL), which are commonly used to standardize cumulative pavement loading in fatigue-based analyses. Therefore, the adopted traffic characterization reflects the actual traffic composition of the studied sections but does not provide a unified load-equivalency basis for inter-site or inter-network generalization.
In the context of this study, “freight vehicles” refer to heavy goods vehicles (HGVs) as defined by the national vehicle classification system of Kazakhstan. This category includes multi-axle trucks and articulated vehicles with a gross vehicle weight exceeding 3.5 tonnes, typically characterized by higher axle loads and increased pavement loading effects. The classification is based on regulatory transport standards that distinguish passenger vehicles from freight vehicles according to gross vehicle mass and functional use. This definition is provided to ensure comparability with international studies, where weight thresholds and vehicle categories may differ.
The macrotexture of the pavement surface was characterized using the sand patch method, which remains a widely accepted and standardized approach for estimating mean texture depth (MTD) in field conditions. However, it should be noted that this method provides an averaged volumetric indicator and does not capture detailed three-dimensional surface features such as peak distribution, texture anisotropy, or micro-level asperity evolution. Advanced techniques based on three-dimensional surface profiling (e.g., laser scanning or optical profilometry) can provide more sensitive indicators for early-stage aggregate polishing and texture degradation. These methods allow the extraction of parameters such as surface roughness spectra and 3D texture indices. In the present study, the sand patch method was selected due to its robustness, field applicability, and compatibility with existing regulatory practices. Nevertheless, the limitations of this approach are acknowledged.
2.6. Data Processing and Analysis
Processing of the experimental data was performed in a stepwise manner to identify quantitative relationships between pavement surface texture parameters, the friction coefficient, and operating conditions. For this purpose, homogeneous datasets were formed based on field measurements, including friction coefficient values, macrotexture parameters, and traffic loading characteristics.
At the first stage, skid resistance properties were compared with pavement surface texture. Based on the field measurements, datasets of friction coefficient values φ were compiled for longitudinal and transverse directions of motion as well as for different traffic lanes. In parallel, datasets of macrotexture depth values measured at the same survey sections and traffic loading data for each site were assembled. Based on these datasets, trends in skid resistance variation as a function of surface condition were analyzed. A reduction in macrotexture depth was considered the primary factor leading to a decrease in the friction coefficient and an increase in its spatial heterogeneity, which is particularly pronounced under winter operating conditions, when the influence of snow and ice deposits further amplifies differences in skid resistance across the carriageway width.
At the second stage, changes in the effective tire–pavement contact area were evaluated. Based on the experimental macrotexture data, an empirical relationship between the effective contact area Sφ and the average height of surface asperities was established. Derivation of this relationship made it possible to interpret pavement texture degradation as a gradual transition from a distinctly rough surface to a smoother, “polished” structure. This transition is accompanied by a reduction in the adhesive–deformation component of friction, which directly manifests itself in a decrease in the friction coefficient and deterioration of skid resistance under adverse weather conditions.
At the third stage, forecasting of macrotexture degradation and the associated changes in the friction coefficient was performed. Predictive assessments were based on extrapolation of the experimental data with consideration of traffic intensity and traffic composition. The total number of equivalent vehicles that had passed along a traffic lane since the opening to traffic (M1) was determined, as well as the projected number of vehicles expected to pass through the section over a future design operating period (ΔM). Subsequently, in accordance with the applicable normative methodology, the expected residual macrotexture height Rt at the end of the specified service period was calculated, considering the aggregate size used and the identified rate of texture wear. At the final stage, using the established correlation between macrotexture depth R and the friction coefficient φ, the probable future reduction in pavement skid resistance was estimated. This approach made it possible to link the projected texture degradation with changes in operational traffic safety and to provide a basis for substantiating the timing of texture restoration and maintenance interventions. It should be clarified that the term “equivalent vehicles” in the present study refers to a traffic-count-based operational aggregation rather than to standardized ESAL conversion. Accordingly, the proposed texture attenuation approach should be interpreted as an empirical time-evolution model calibrated for the observed traffic composition, not as a universally transferable fatigue-accumulation model.
In addition to arithmetic mean values, variability indicators were calculated for friction measurements at each survey point, including the standard deviation (SD). Where appropriate, 95% confidence intervals (CI) were also determined to characterize the uncertainty of the mean estimates. This was considered particularly important for safety-related interpretation, since averaged values alone may mask localized low-friction spots that are critical for braking stability and lane-change safety.
2.7. Quality Control, Limitations, and Reproducibility
To ensure the reproducibility and reliability of the obtained results, a set of methodological measures was implemented during the study. Measurements of macrotexture parameters were carried out at the same survey sections of the highways within a long-term monitoring framework, which made it possible to eliminate the influence of spatial pavement heterogeneity and to accurately assess the actual temporal dynamics of texture degradation. In determining the friction coefficient, a combination of route-based and point-based measurements was applied using the PKRS-2U dynamometric trailer and the portable IKSp device, providing cross-validation of the data and increasing the reliability of the results. During the winter period, friction coefficient measurements were performed sequentially across traffic lanes, from the edge lanes to the central lanes, which allowed for an objective assessment of skid resistance heterogeneity across the carriageway width and for reproduction of typical operational scenarios.
It should be noted that the applied methodology has several limitations associated with the inherent variability of winter operating conditions. Temperature regime, type and condition of snow and ice deposits, surface moisture, and the intensity of road maintenance activities may change significantly even over short time intervals, thereby affecting instantaneous friction coefficient values. In addition, under field conditions, pavement skid resistance is a function not only of surface texture parameters but also of the current surface state, including the presence of snow, water, or ice. Accordingly, interpretation of the results was carried out with due consideration of these factors. Winter measurement data were therefore treated primarily as indicators of the “pavement–winter maintenance” operational scenario, reflecting the actual road condition at a given point in time, whereas the results of multi-year macrotexture measurements were interpreted as indicators of material degradation of the pavement surface under traffic loading. This approach made it possible to properly distinguish between operational and structural influences and to ensure the robustness of the study’s conclusions. An additional limitation of the proposed macrotexture attenuation model is that traffic loading was not normalized using ESAL or axle load spectra. Since different vehicle categories impose substantially different axle loads and contact stresses, the use of absolute vehicle counts may not fully represent cumulative damage mechanisms governing surface wear. As a result, the model should be regarded as condition-specific and primarily applicable to road sections with traffic compositions like those examined in this study.
Quality control and reproducibility of the results were ensured through repeated measurements at identical road sections and survey points, as well as through the consistent use of the same instruments and methodologies throughout the entire observation period. To assess macrotexture degradation, measurements were carried out on the same sections of the “Taraz–Asa–Akkul–Saudakent” road over a three-year period (2023–2025) using the sand patch method in accordance with the requirements of GOST R 58422.1–2021 [
36].
The natural variability of pavement surface conditions, particularly during the winter period, is considered an inherent part of the real operational process. Therefore, winter friction coefficient values are interpreted not as laboratory reference characteristics, but as indicators of the actual vehicle–road interaction conditions. This approach ensures the practical reproducibility of the results and their applicability for traffic safety assessment and the development of operational and maintenance measures.
3. Results
3.1. Calculated Relationships Between Skid Resistance and Braking Efficiency
The results of the theoretical analysis confirmed the critical influence of non-uniform pavement conditions on braking efficiency and vehicle stability [
37]. Under partial icing of the carriageway, when the wheels on one side of the vehicle travel on a cleared lane while those on the opposite side move on the shoulder or a zone of compacted snow–ice, the resultant friction force is governed by the worst friction conditions [
38,
39]. According to the analytical relationships (1) and (2), at friction coefficients of φ
1 ≈ 0.2 and φ
2 ≈ 0.1, the average deceleration during emergency braking decreases to values on the order of 1.5 m/s
2, which is several times lower than the values typical of a uniformly clean and rough pavement surface.
For comparison, under homogeneous driving conditions and high skid resistance levels (
φ ≈ 0.6–0.8), the calculated deceleration reaches 5–6 m/s
2, ensuring effective and controllable braking. The calculated values of friction forces and deceleration for various combinations of carriageway and shoulder surface conditions are presented in
Table 2. Analysis of the data in
Table 2 demonstrates that even localized presence of sections with compacted snow or ice leads to a disproportionate reduction in the resultant tire–pavement friction force and, consequently, to a sharp deterioration in braking performance and vehicle stability.
The values presented in
Table 2 are derived from field measurements conducted during the monitoring campaign. For each parameter, values represent averaged measurements obtained over the corresponding pavement sections under comparable operational conditions. The dataset includes repeated measurements collected over the monitoring period, and the reported values correspond to arithmetic means calculated within each road category.
The forces presented in
Table 2 are theoretical estimations derived from Equations (1) and (2) under static equilibrium assumptions and are intended to illustrate the magnitude of force imbalance under split-friction conditions rather than to represent instrumented vehicle measurements. The rolling resistance coefficient
f = 0.1 was adopted based on literature data for winter road conditions and validated through sensitivity analysis.
To evaluate the robustness of the theoretical force estimations presented in
Table 2, a sensitivity analysis of the rolling resistance coefficient was performed. The coefficient f was varied within a plausible range for winter conditions (0.05–0.15), reflecting differences in snow compaction, moisture content, and surface irregularities reported in the literature. The results indicate that the calculated rolling resistance force is linearly proportional to f, as defined by the classical relation:
where N is the normal load.
An increase in f from 0.05 to 0.15 results in a threefold increase in rolling resistance force, which significantly affects the total longitudinal force balance. This confirms that the assumed value of
f = 0.1 represents a mid-range estimate and that the theoretical results in
Table 2 remain valid within the realistic variability of winter road conditions.
However, it should be noted that extreme conditions (e.g., deep loose snow or ice layers) may lead to even higher resistance values, which should be considered in future modeling studies.
3.2. Skid Resistance Characteristics Under Dry Pavement Conditions
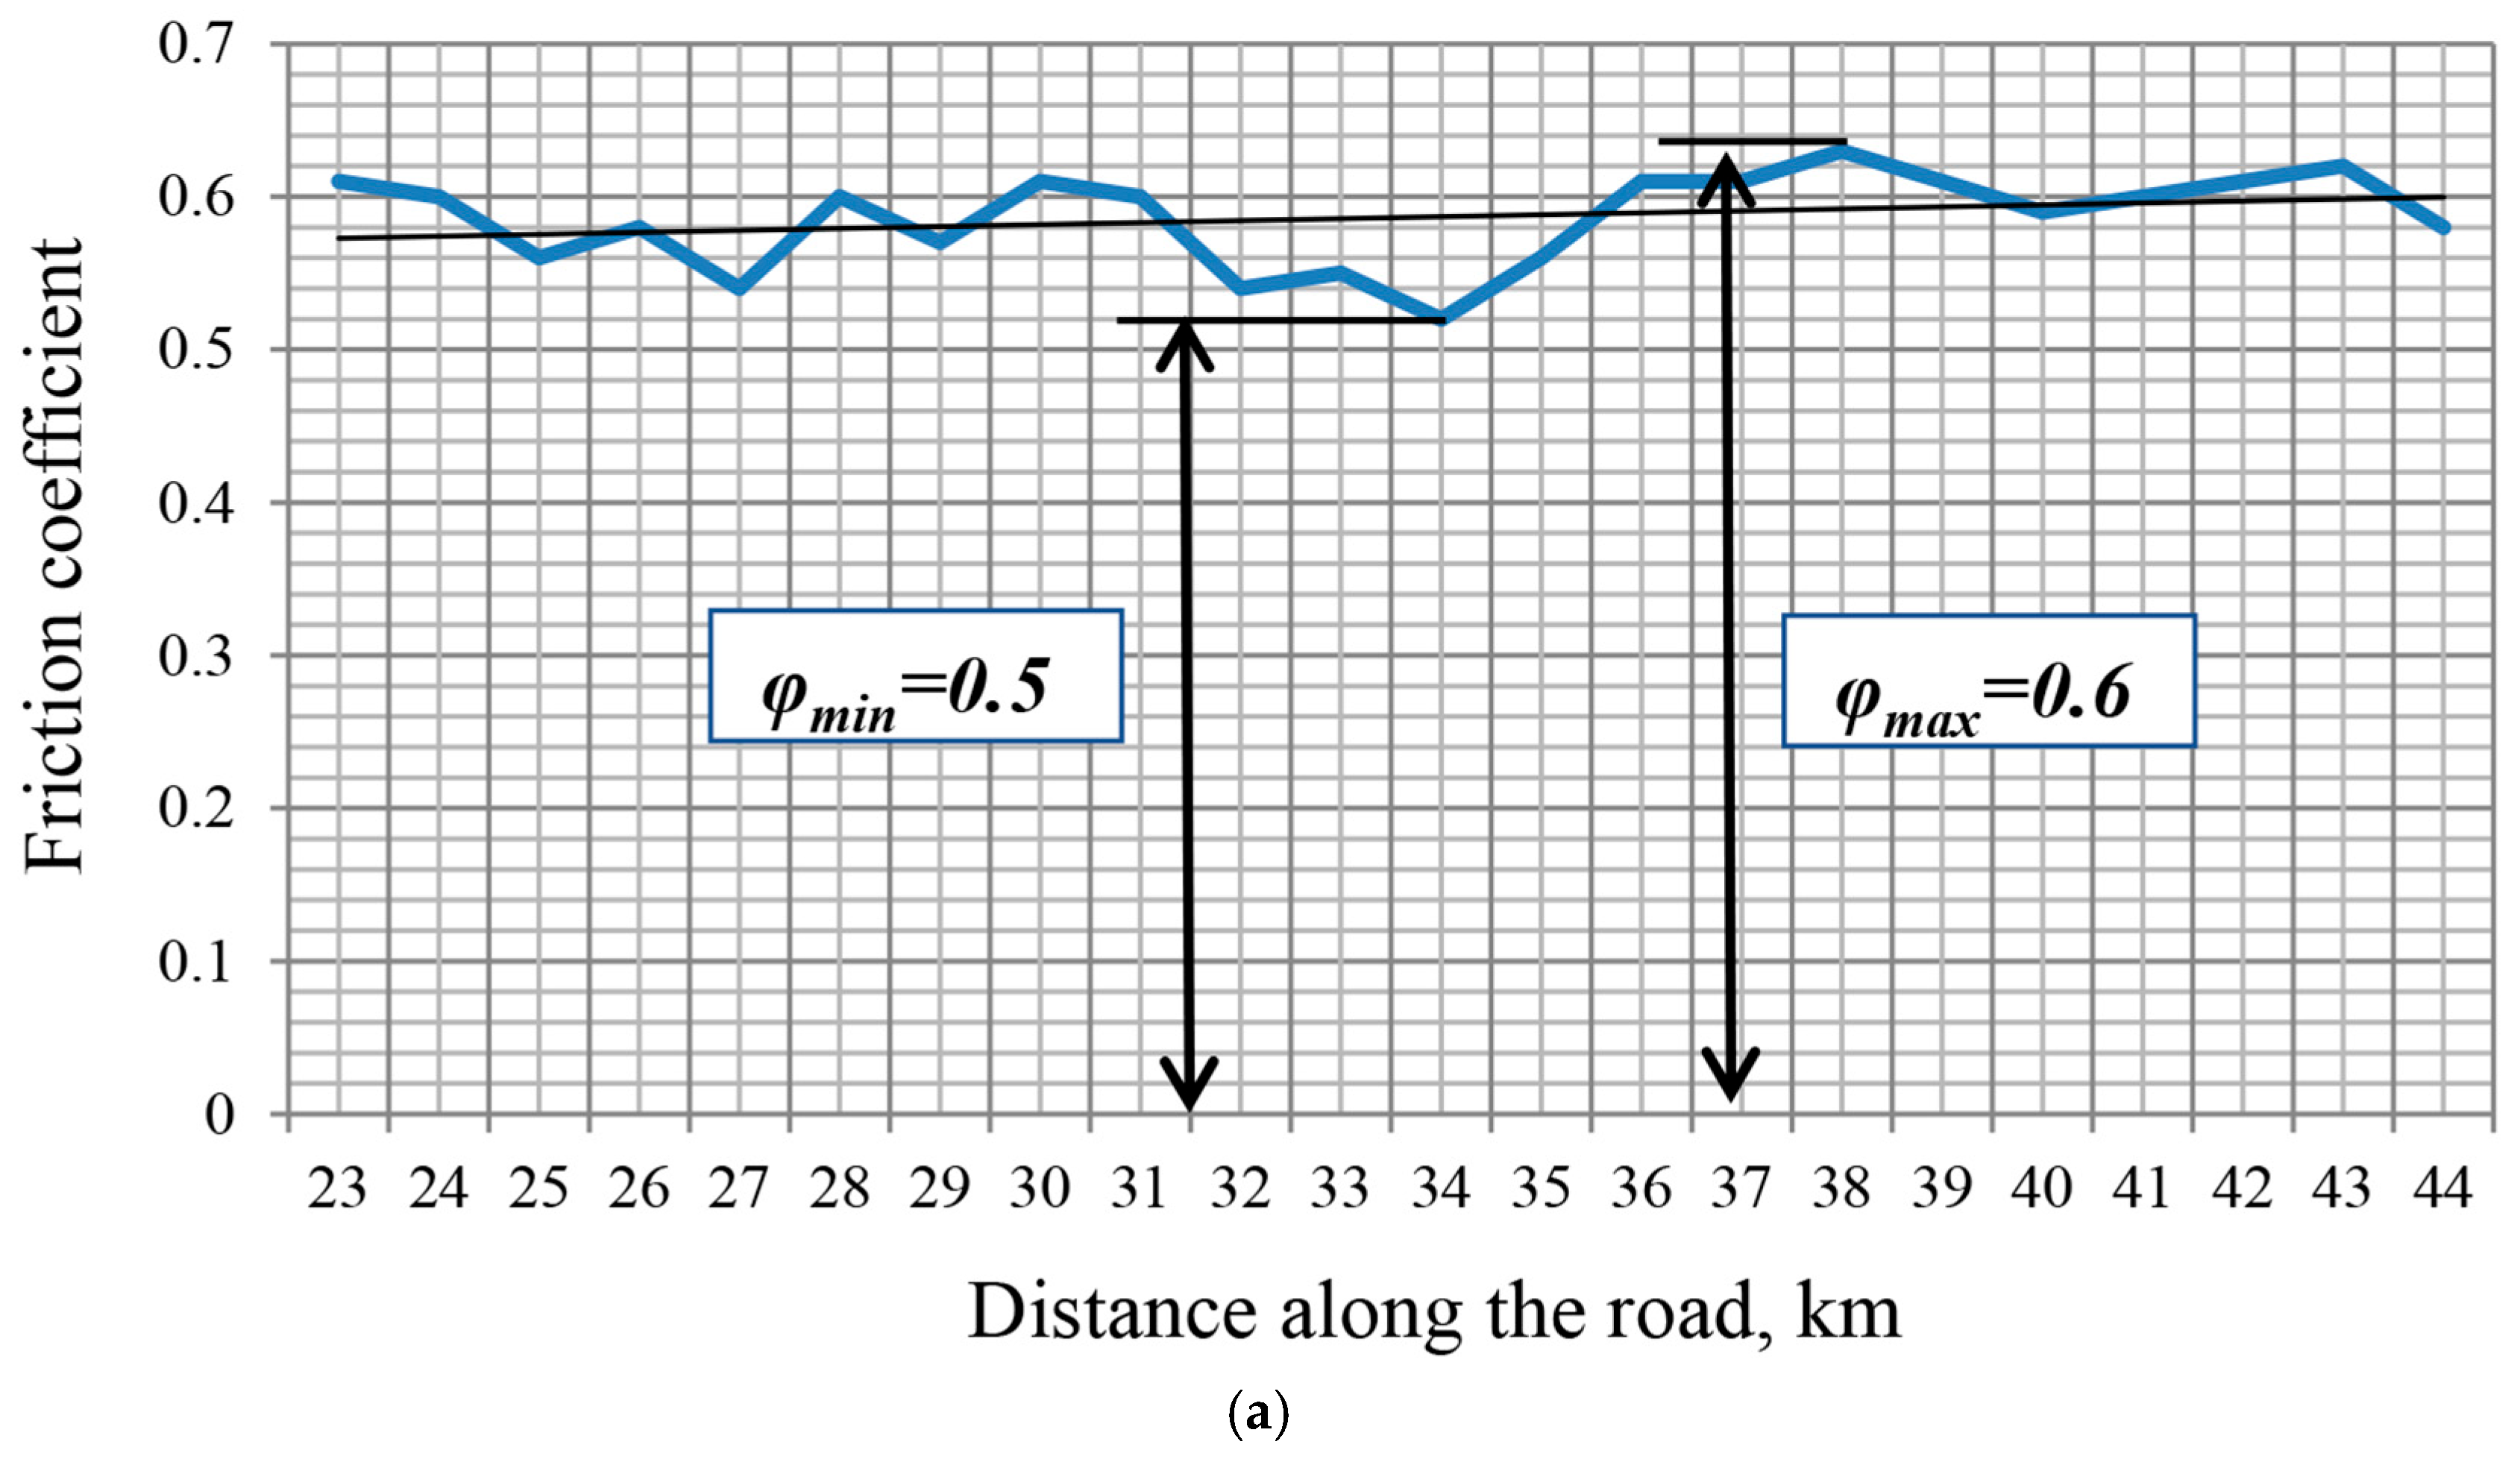
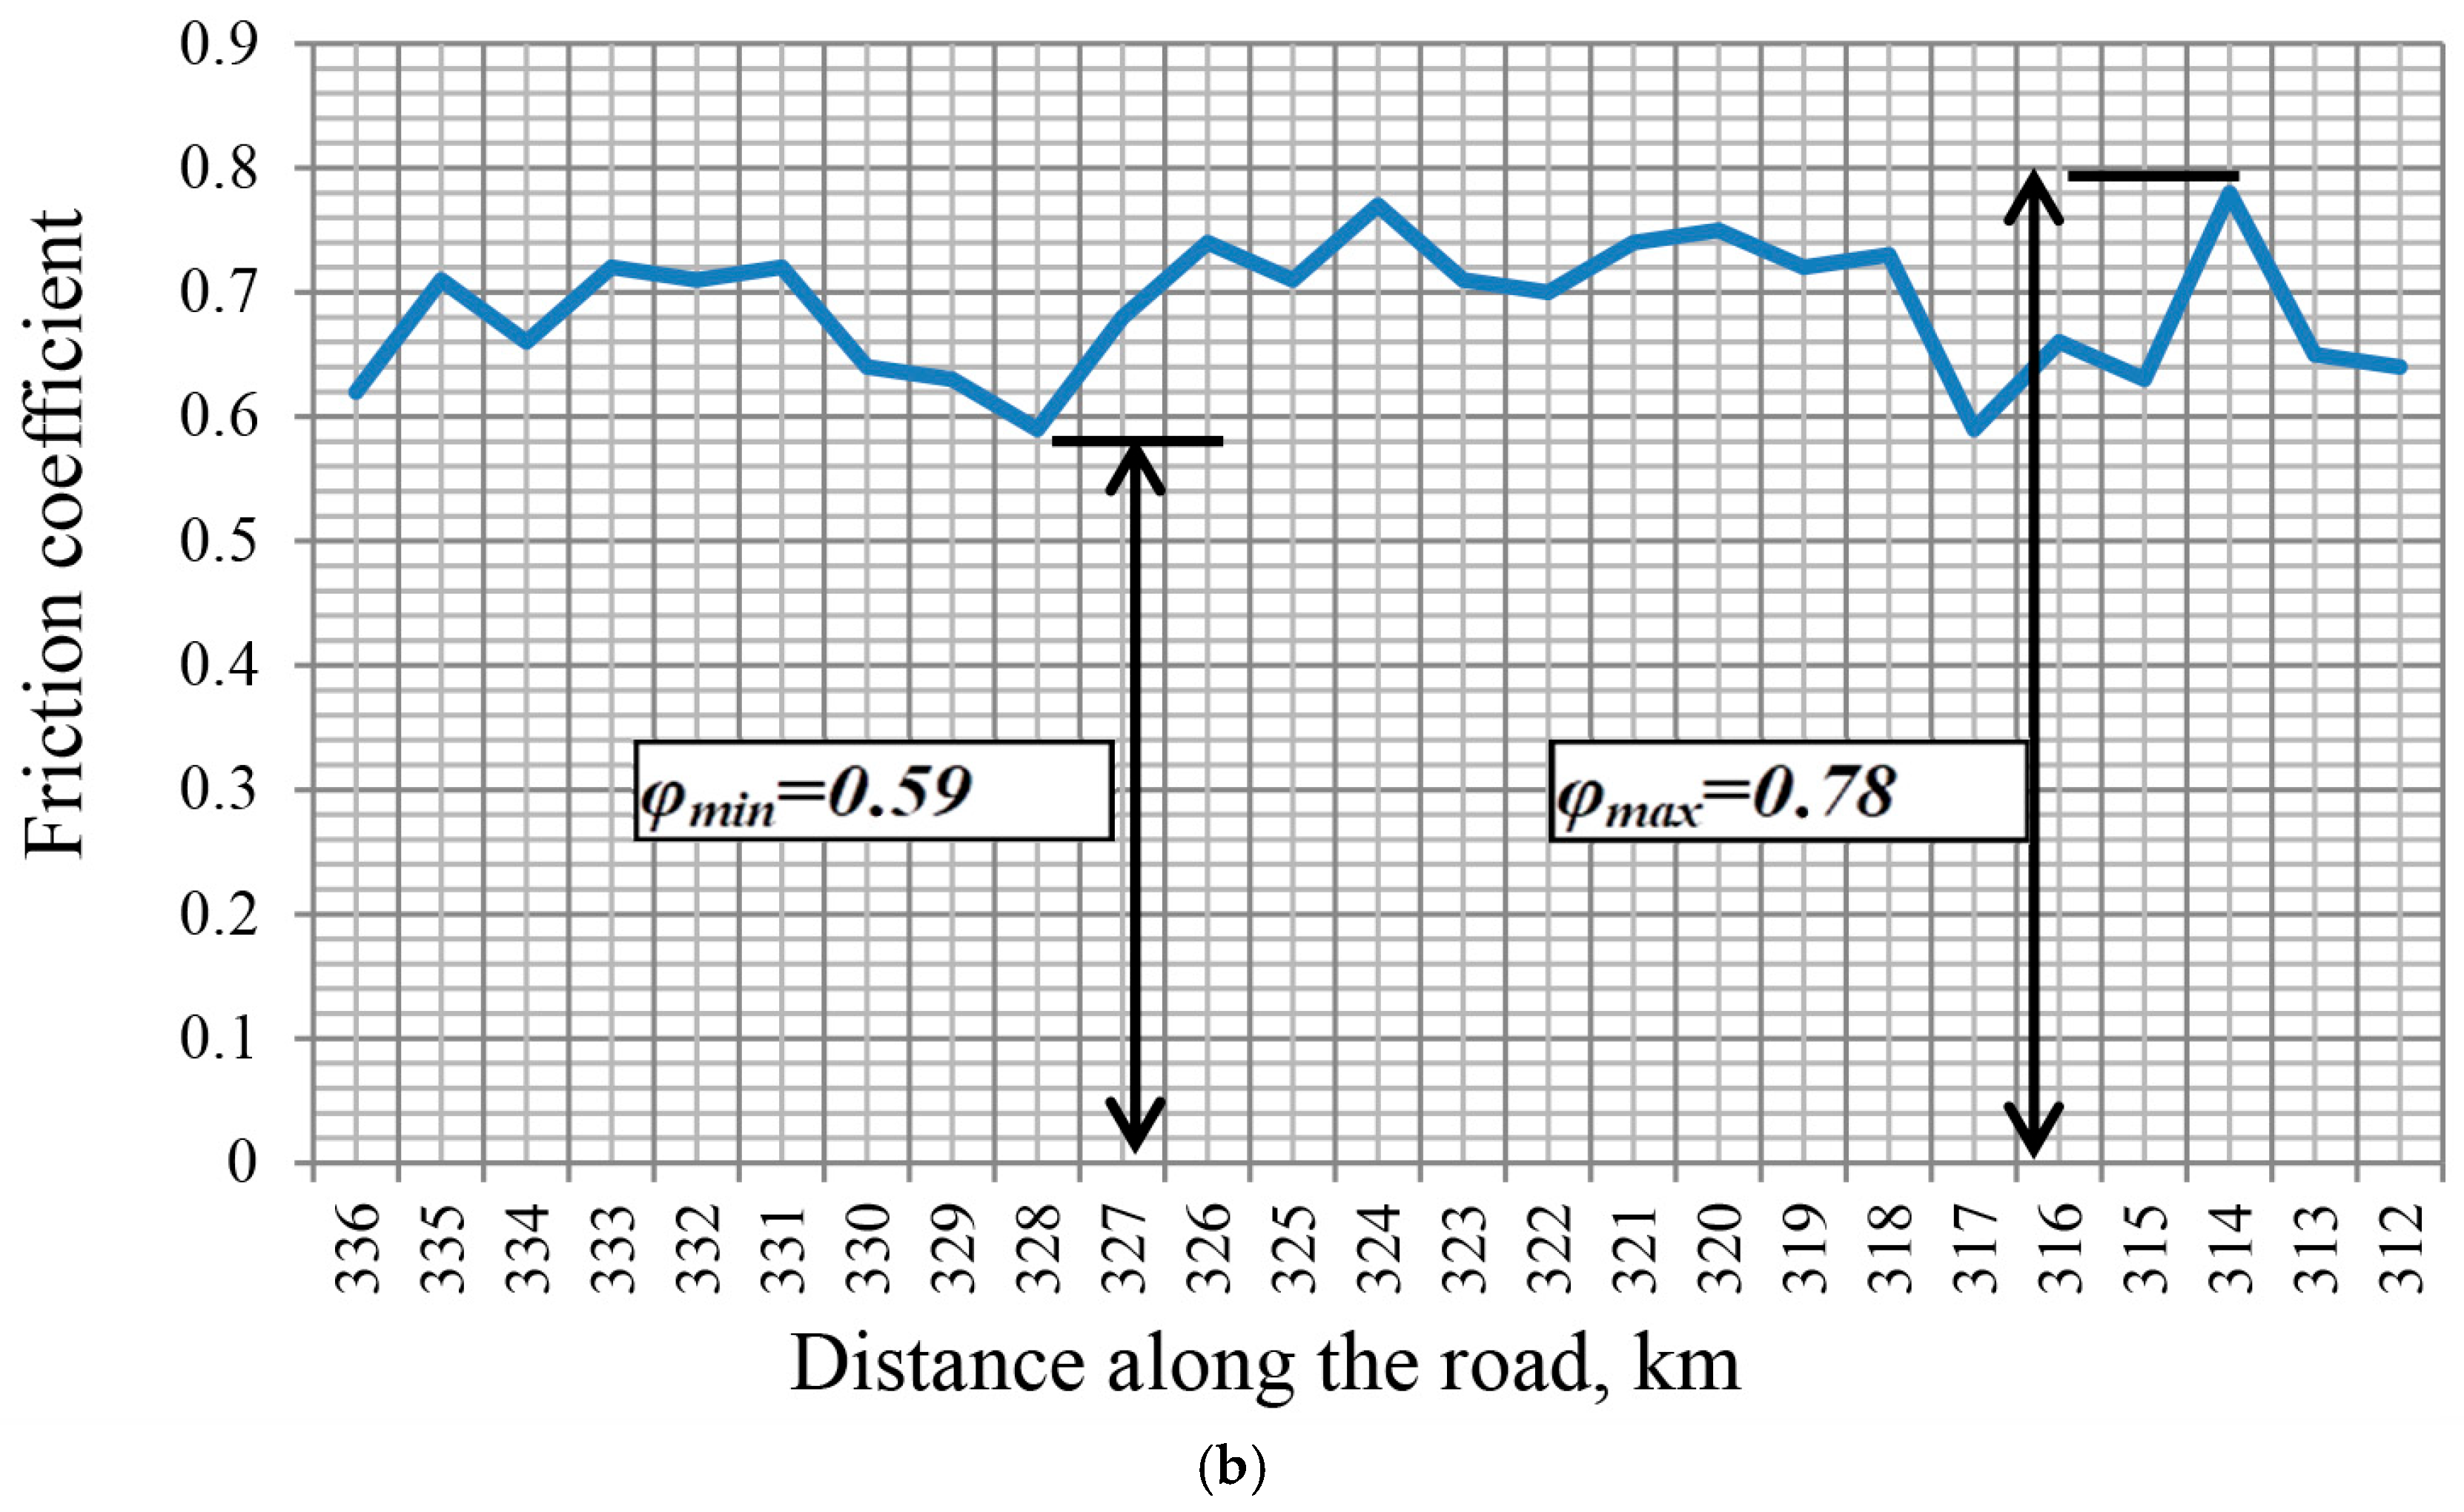
The results of experimental measurements of the friction coefficient during the summer period on dry sections of the Almaty–Ust-Kamenogorsk highway revealed noticeable differences in the skid resistance properties of asphalt concrete and cement concrete pavements. The distributions of longitudinal friction coefficient values
φ for both pavement types are presented in
Figure 5.
The average value of the longitudinal friction coefficient on the asphalt concrete section ranged from 0.64 to 0.70, whereas on the cement concrete section it was approximately 0.58. Thus, under dry surface conditions, the asphalt concrete pavement provided a friction coefficient that was about 15–20% higher than that of the cement concrete pavement. In addition, the asphalt concrete pavement exhibited greater variability in φ values, with a range of approximately 24% (from 0.59 to 0.78), while the variability for the cement concrete pavement was about 6% (from 0.52 to 0.63). The higher variability observed for asphalt concrete may reflect differences in mixture composition, localized wear patterns, and traffic-induced polishing, rather than construction inconsistency alone. Asphalt surfaces are more sensitive to aggregate exposure and microtexture evolution over time compared to cement concrete.
The obtained results indicate a more developed surface texture for the asphalt concrete pavement. According to the experimental assessments, the macrotexture depth of the asphalt concrete pavement is almost four times greater than that of the cement concrete pavement. This difference is attributed to variations in material structure: cement concrete is characterized by a smoother surface with lower relief and a more pronounced susceptibility to polishing, whereas asphalt concrete retains a granular texture due to its aggregate skeleton. The cement concrete sections were constructed using standard transverse tining surface texturing. However, long-term wear and polishing may reduce the effectiveness of the initial macrotexture, contributing to the observed friction levels.
Measurements of the transverse friction coefficient (
Table 3 and
Table 4) showed comparable values for both pavement types under dry conditions (φ ≈ 0.6–0.7), with no statistically significant differences. Thus, under favorable weather conditions, the skid resistance of modern road pavements is at an acceptable level; however, cement concrete pavements exhibit a lower reserve of surface roughness, which increases their sensitivity to moisture and icing.
In this study, “reverse direction” refers to measurements performed in the opposite traffic direction on the same carriageway, corresponding to the lanes serving the descending chainage. Measurements were conducted separately for each traffic direction, and no averaging was performed across opposing carriageways.
3.3. Influence of Moisture and Hydroplaning Risk
The results presented in
Table 5 indicate that both asphalt concrete and cement concrete surfaces experience a comparable relative reduction in friction under wet conditions, typically within the range of 10–15%. This suggests that, within the observed dataset, no significant difference in moisture sensitivity between the two pavement types can be identified based solely on the measured friction coefficients.
When a hydrodynamic wedge forms between the tire and the pavement surface, the friction force decreases sharply, which may lead to a sudden loss of skid resistance and the onset of hydroplaning [
40]. The experimentally recorded friction coefficient values on wet pavements do not guarantee safety during prolonged heavy rainfall, particularly on sections with smoother cement concrete surfaces characterized by a lower reserve of macrotexture. This confirms that even when
φ values are relatively high under dry conditions, texture deterioration and the presence of a water film can significantly alter the operational driving conditions.
The obtained results emphasize the key role of pavement macrotexture in ensuring stable skid resistance. Maintaining a sufficient level of surface roughness promotes more effective drainage of water from the tire–pavement contact patch and delays the development of hydrodynamic effects. In the context of the present study, this indicates that the initial pavement texture is a critically important safety factor not only during the winter period but also in transitional seasons, and that its degradation due to wear increases accident risk under rainy conditions as well.
3.4. Friction Coefficient Under Winter Conditions
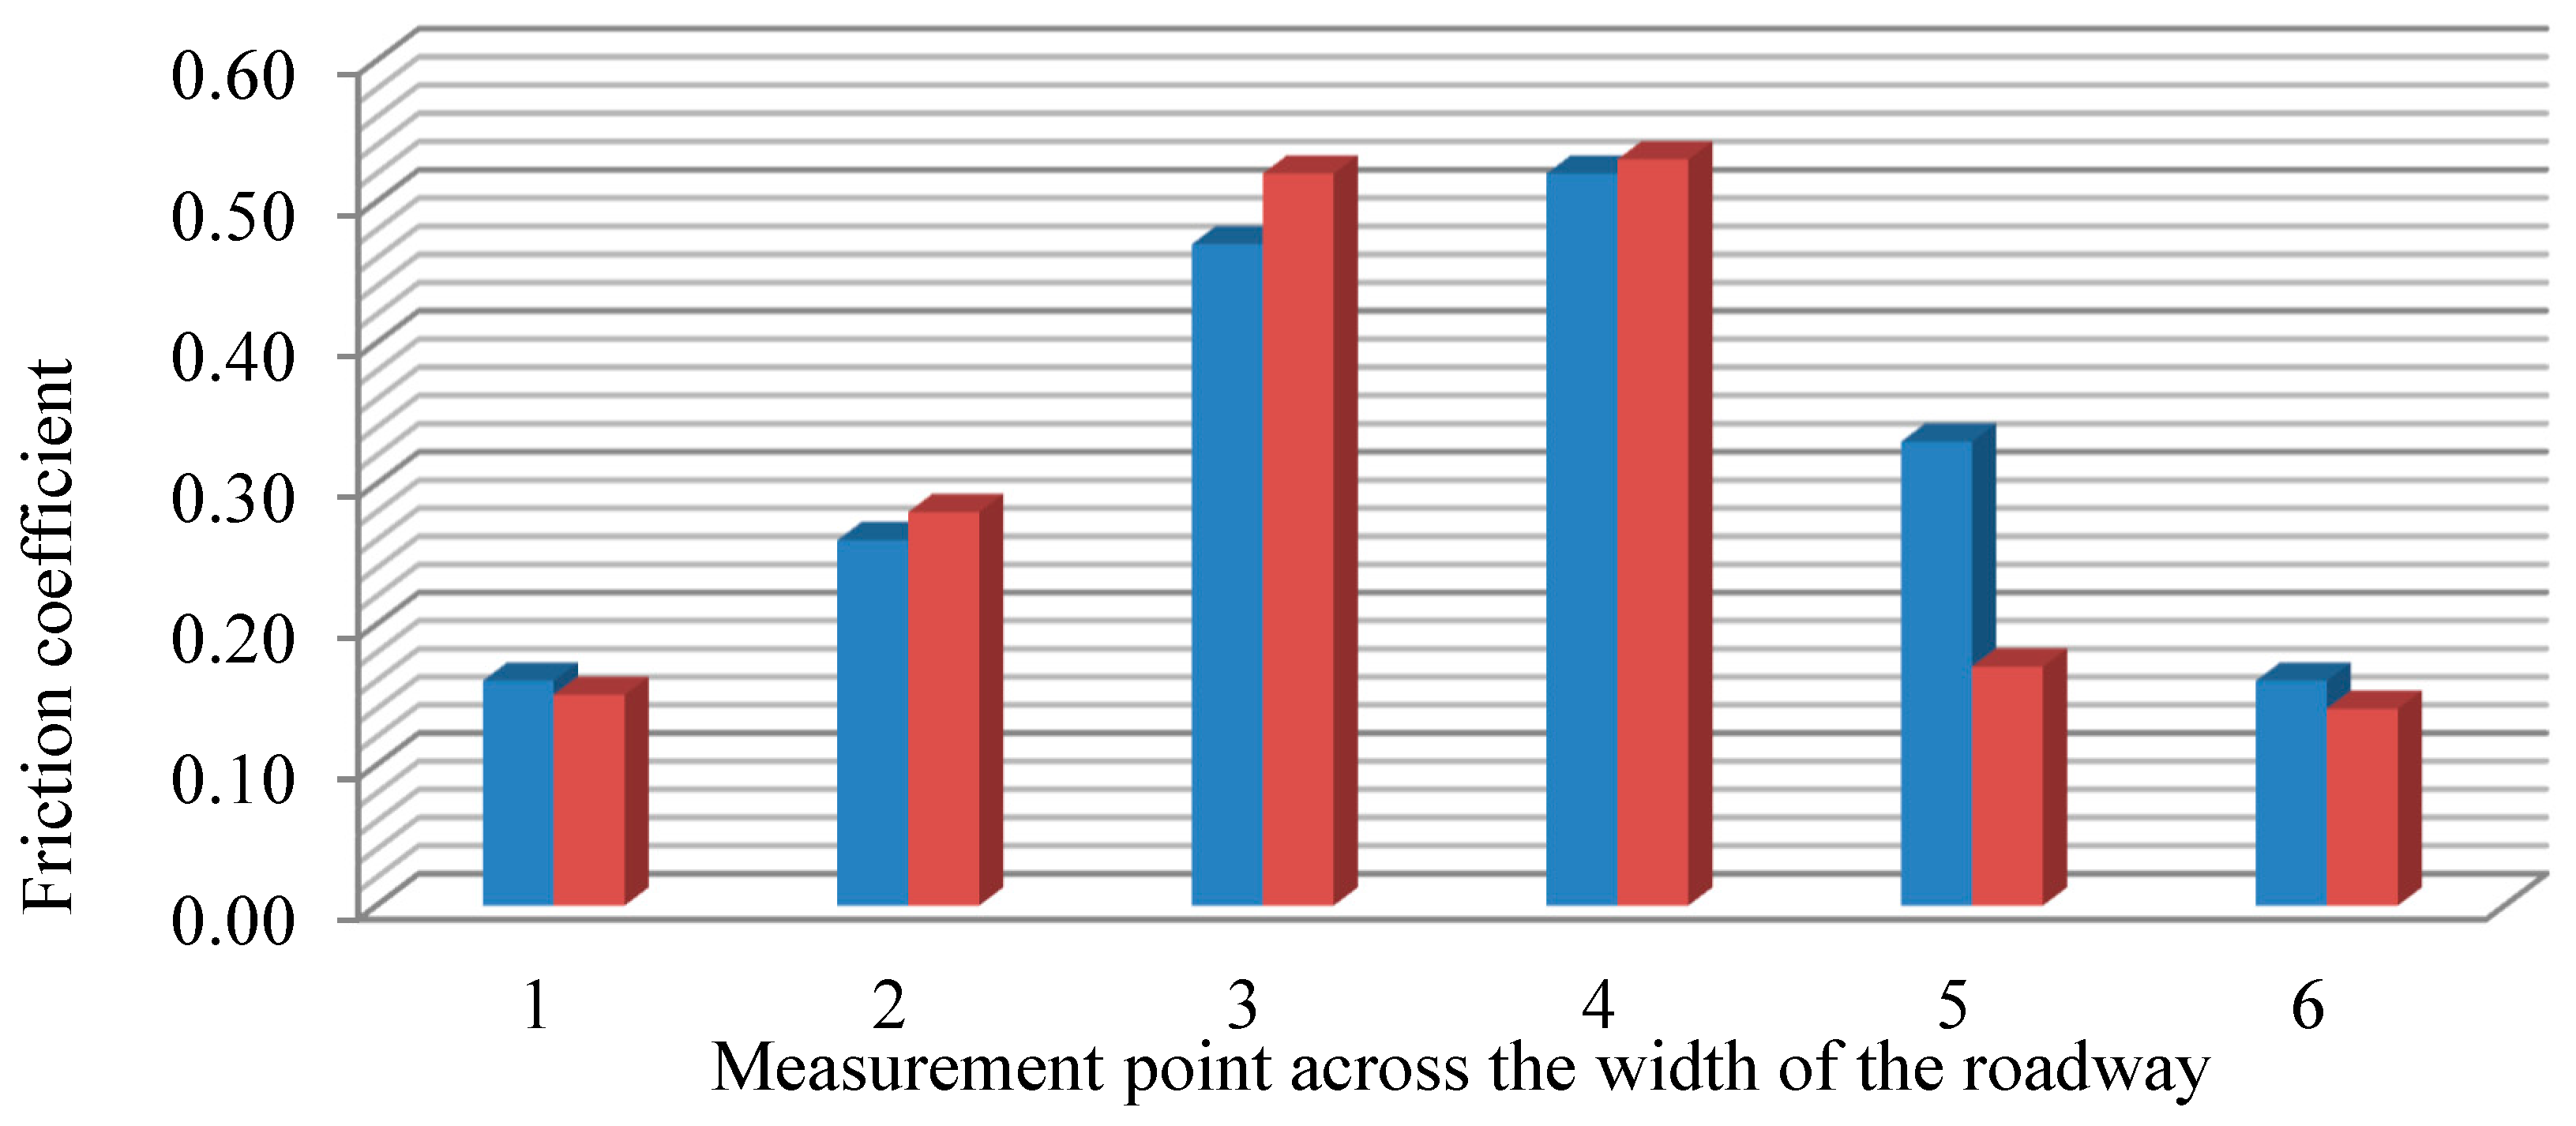
The results of winter measurements of the friction coefficient on cement concrete roads are presented in the form of profiles of φ variation across the carriageway width (
Figure 6,
Table 6). The obtained data demonstrate an extremely high degree of skid resistance heterogeneity during the winter period.
For the transverse friction analysis, measurements were performed at six predefined lateral positions across the traffic lane. These points were distributed from the pavement edge toward the lane centerline to capture friction variability across the carriageway width. The lateral positions were defined relative to the lane width, including edge, intermediate, and central zones. The spacing between measurement points was kept consistent across all analyzed sections to ensure comparability. This standardized measurement grid allows reproducible assessment of friction heterogeneity across the lane width.
To ensure clarity in the interpretation of measurement locations, the survey points presented in
Table 6 correspond to fixed positions across the transverse profile of the roadway. Point 1 represents the outer edge of the lane (shoulder side), while subsequent points are located progressively toward the lane center and the opposite edge. The spacing between points was kept constant to ensure comparability of measurements across the road width. This configuration allows capturing the transverse variability of friction and identifying localized low-friction zones that are critical for vehicle stability.
On the inner traffic lanes, where the pavement was relatively well cleared and a stable wheel track had formed, the longitudinal friction coefficient values were φl ≈ 0.47–0.53. In contrast, on the outer lanes adjacent to barrier guardrails, where accumulation of compacted snow–ice was observed, the friction coefficient decreased to 0.13–0.20. At certain locations near the edge of the carriageway, minimum φl values of approximately 0.09–0.11 were recorded, corresponding to near-glare ice conditions.
While the pronounced reduction in friction under these winter conditions is directly associated with snow–ice accumulation, it should be noted that outer lanes are also typically subjected to higher heavy-vehicle loading, which contributes to long-term aggregate polishing and gradual texture reduction. Therefore, the observed friction contrast likely reflects the combined effect of seasonal icing and cumulative traffic-induced surface evolution.
On average, the friction coefficient in the central part of the carriageway was approximately 0.5, whereas in the edge zones it was on the order of 0.15, reflecting a threefold or greater difference. Even under relatively satisfactory snow removal operations, the differences between cleared lanes and areas adjacent to guardrails reached 20–25%, while in the presence of persistent snow–ice compaction, they increased to a factor of 2–5. Such heterogeneity explains instances of sudden vehicle skidding during braking and lane-changing maneuvers, when wheels transition from a roughened surface to a smooth, compacted layer, causing an abrupt reduction in braking force on one side of the vehicle.
It is important to emphasize that the observed spatial heterogeneity of skid resistance (a factor of 2–5 across the carriageway width) was established based on field measurements on high-speed cement concrete highways and represents the first quantitatively confirmed result of this kind for the conditions of Kazakhstan.
3.5. Pavement Texture Wear over Time
The results of multi-year macrotexture measurements on the “Taraz–Asa–Akkul–Saudakent” road indicate a pronounced trend of pavement texture degradation under the influence of traffic loading (
Table 7,
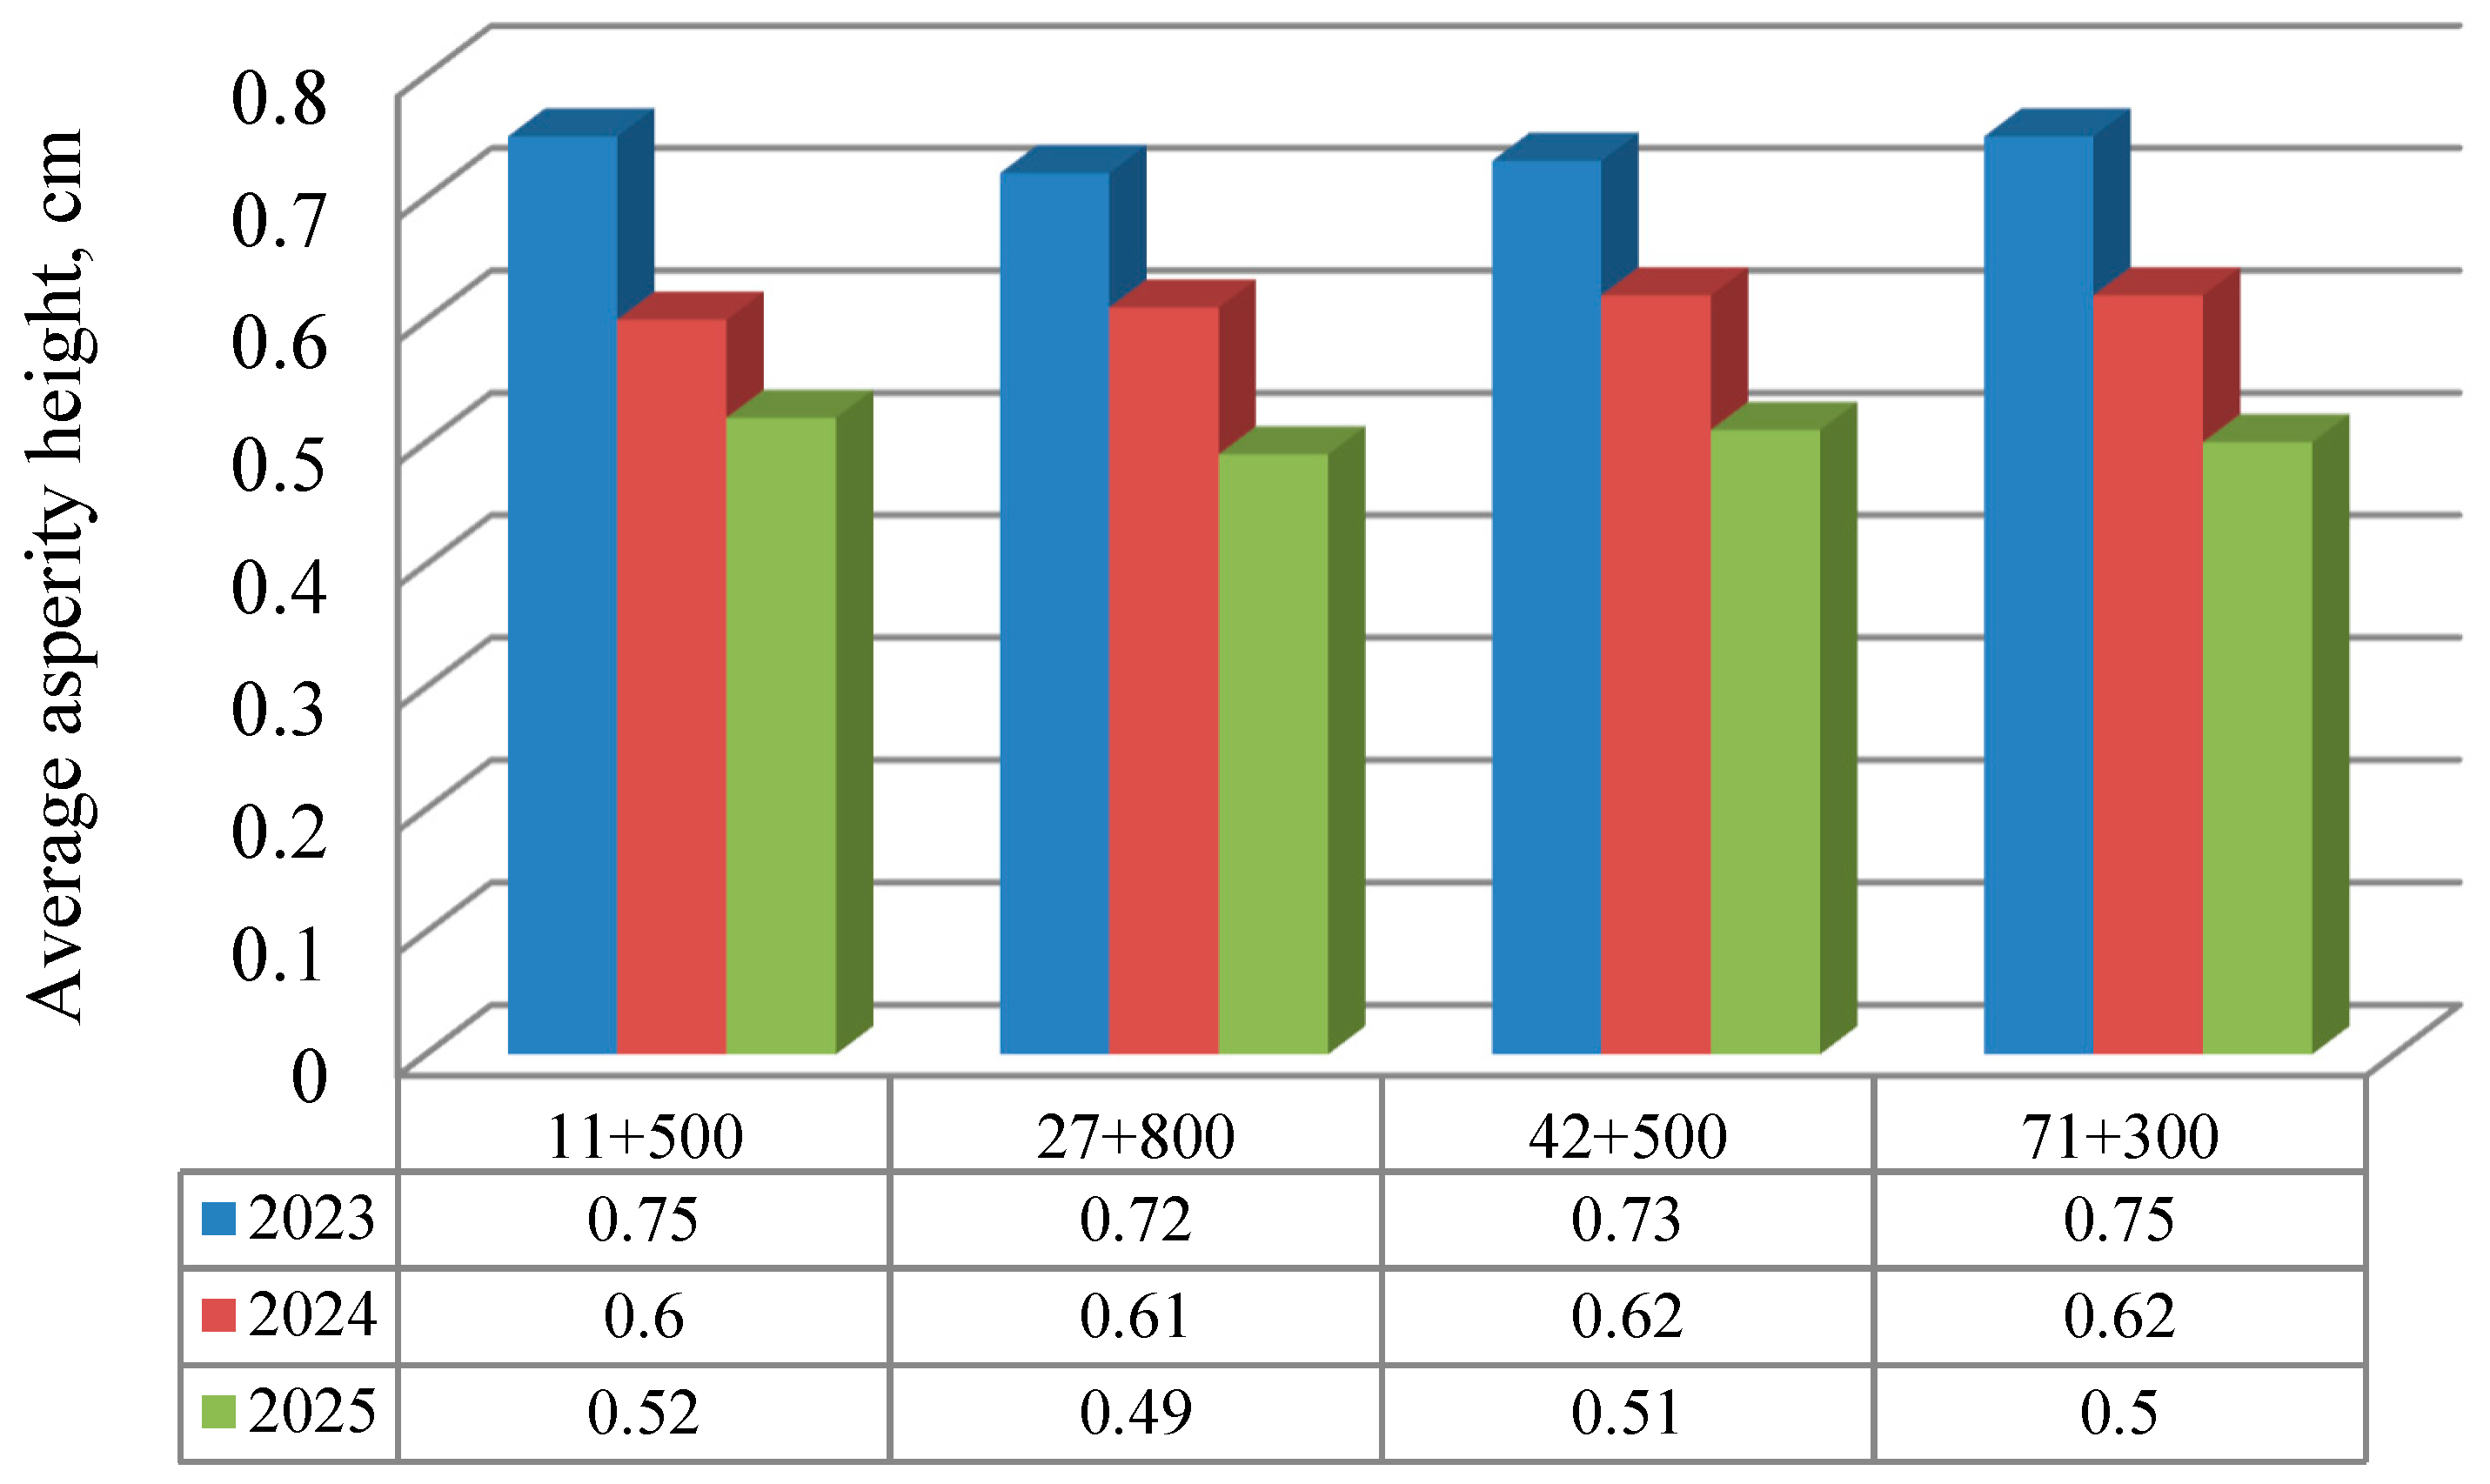
Figure 7). The dynamics of changes in the average macrotexture peak height over the 2023–2025 period for sections with different traffic intensities are presented in
Figure 8.
The four sections presented in
Table 7 were selected to represent typical operational conditions within the analyzed highway network. The selection criteria included comparable traffic intensity, stable heavy-vehicle share, and absence of recent major rehabilitation works to ensure structural consistency. All selected sections have the same pavement surface material and similar wearing course thickness, corresponding to the design specifications for their respective road category. This approach was adopted to isolate the influence of traffic loading and winter conditions on friction performance while minimizing the impact of structural variability.
Over three years of operation, macrotexture depth decreased by 22–32% depending on the road section. The resulting dataset of repeated R measurements at identical survey locations over the 2023–2025 period constitutes the first empirical basis for macrotexture degradation rates in Kazakhstan that is suitable for forecasting operational risks. On the most heavily trafficked section (No. 1), the average asperity height decreased from R ≈ 0.75 cm to 0.52 cm (approximately 30%), whereas on the least loaded section (No. 4) it decreased from 0.73 cm to 0.57 cm (about 22%). In absolute terms, macrotexture losses amounted to 0.14–0.23 cm (1.4–2.3 mm) (
Table 8). It was established that higher traffic intensity and a greater proportion of heavy freight vehicles lead to accelerated surface polishing and more pronounced texture degradation.
At the same time, the identified relationship should be interpreted with caution from a mechanistic perspective. The present analysis is based on traffic composition and category counts rather than ESAL-based load normalization. Therefore, the model captures observed empirical trends of macrotexture decline under the specific operating conditions of the studied sections, but it does not yet constitute a standardized fatigue-based formulation transferable across road networks with different axle-load spectra.
These observations are consistent with previously reported findings in the literature, where similar friction behavior under comparable traffic and environmental conditions has been documented. This agreement supports the reliability of the measured results and confirms the relevance of the proposed interpretation.
The obtained results quantitatively confirm the systematic process of pavement wear: surface asperities are gradually worn down, the pavement becomes smoother, and the friction coefficient decreases. Analysis of the time series indicates that the highest rate of degradation occurs during the initial years of operation, when the upper rough surface layer is subjected to the most intense abrasive action from vehicle tires.
One of the key findings of the study is the pronounced heterogeneity of the friction coefficient across the carriageway width during the winter period. Field measurements demonstrated that under conditions of non-uniform removal of snow and ice deposits, the friction coefficient on edge lanes and in the vicinity of barrier guardrails may decrease by a factor of 2–5 compared to the central part of the carriageway. This effect is clearly illustrated by the distribution of φ values across traffic lanes under winter conditions, with the corresponding quantitative indicators presented in
Table 3 of winter friction coefficient measurements. Such heterogeneity creates critically hazardous conditions during lane changes, emergency braking, and forced deviations toward the roadway edge, thereby explaining the mechanisms underlying the occurrence of multi-vehicle traffic accidents on high-speed cement concrete highways.
It should be noted that similar transverse heterogeneity may also occur under non-winter conditions due to traffic-related surface evolution, particularly heavy-vehicle-induced aggregate polishing. The present study focuses on winter measurements and does not include a direct summer comparison within the same sections. Therefore, while the pronounced friction contrast observed in this study is strongly associated with snow–ice accumulation, the potential contribution of long-term traffic effects cannot be fully separated without seasonal comparative data. Future research should include systematic summer–winter measurements to isolate the relative contributions of icing and traffic-induced texture evolution.
Interpretation of these results allows a reassessment of the causes of winter road traffic accidents. Although official statistics often classify accidents as consequences of driver error, comparison of the measured friction coefficient values with pre-accident threshold levels indicates that, in several cases, drivers find themselves in conditions where it is physically impossible to achieve effective braking or maintain directional stability. Therefore, the road-related factor associated with pavement condition and the quality of winter maintenance should be considered an equally significant contributor to accident occurrence alongside the human factor.
The degradation of pavement macrotexture over time is of substantial importance for interpreting the results. Long-term measurements demonstrated a persistent reduction in macrotexture asperity height across all investigated sections, with degradation rates directly dependent on traffic intensity and the proportion of heavy vehicles. Comparison of the initial and current macrotexture values R for individual sections (
Table 9) and their changes over the observation period indicates that, within several years of operation, pavements may lose 22–33% of their original texture. Such degradation leads to a reduction in the friction coefficient even under dry conditions, while under wet or icy conditions it results in a sharp decline in φ, thereby significantly increasing accident risk.
In
Table 9, the macrotexture parameter R denotes the asperity height measured at predefined lateral zones across the carriageway. The subscripts indicate the measurement location:
Rc corresponds to the central lane zone,
Ri to the inner lane, and
Re to the edge zone adjacent to the barrier guardrail. These indices are introduced to distinguish texture variations across the pavement width. In
Table 9, the subscript
i denotes the measurement section corresponding to a specific road location (Km+). The parameters
Rнaч.i,
RE, and
Rti represent the initial macrotexture height, the predicted value after the service period, and the relative reduction, respectively.
Predictive modeling of changes in macrotexture and skid resistance makes it possible to move from analysis of the current pavement condition to assessment of long-term operational risks. The calculated values of macrotexture height and the corresponding friction coefficient for the forecast period (
Table 9), as well as their graphical interpretation (figure showing the predicted temporal evolution of R and φ), indicate that, if current traffic intensity is maintained, the friction coefficient on certain sections may decrease to levels of
φ ≈ 0.3–0.35 within 5–6 years of operation. These values are close to the threshold below which the risk of road traffic accidents increases nonlinearly. It is important to note that the reduction in skid resistance is a gradual process and may not be subjectively perceived by drivers; however, its consequences manifest abruptly under adverse weather conditions.
The practical consequences of reduced skid resistance are most clearly manifested in an increase in vehicle braking distance. Based on the measured and forecast friction coefficient values, calculated assessments of braking distance were performed for passenger cars and heavy vehicles at representative travel speeds.
Over time, the height of macrotexture asperities decreases, i.e., it is worn down by vehicle wheels. For example, on the first section (km 11 + 500), the initial asperity height was 0.75 cm; over a three-year period, this value decreased to 0.52 cm, corresponding to a reduction of 30.6%. Similarly, on the other sections, macrotexture height decreased by 31.9%, 33.3%, and 21.91%, respectively.
The braking distance is directly dependent on the skid resistance properties of road pavements. Depending on the skid resistance characteristics of the pavement surface, the braking distance is calculated as follows [
41,
42]:
where
Kэ is the braking system efficiency coefficient of the vehicle (
Kэ = 1.1–1.15 for passenger cars;
Kэ = 1.3–1.4 for heavy vehicles);
v is the vehicle speed, km/h;
φ is the pavement friction coefficient;
f is the rolling resistance coefficient;
i is the longitudinal road gradient (the “+” sign indicates uphill motion, while the “–” sign indicates downhill motion).
In this study, K represents the braking system efficiency coefficient. The adopted values correspond to standard engineering assumptions commonly used in vehicle dynamics and braking distance calculations. The selected range reflects typical braking performance under normal operational conditions and is consistent with established transport engineering references [
43,
44]. In the braking distance calculations presented in this section, φ
l denotes the longitudinal friction coefficient, which governs vehicle deceleration along the direction of motion. The transverse friction coefficient (φ
t) is not involved in the braking distance formulation.
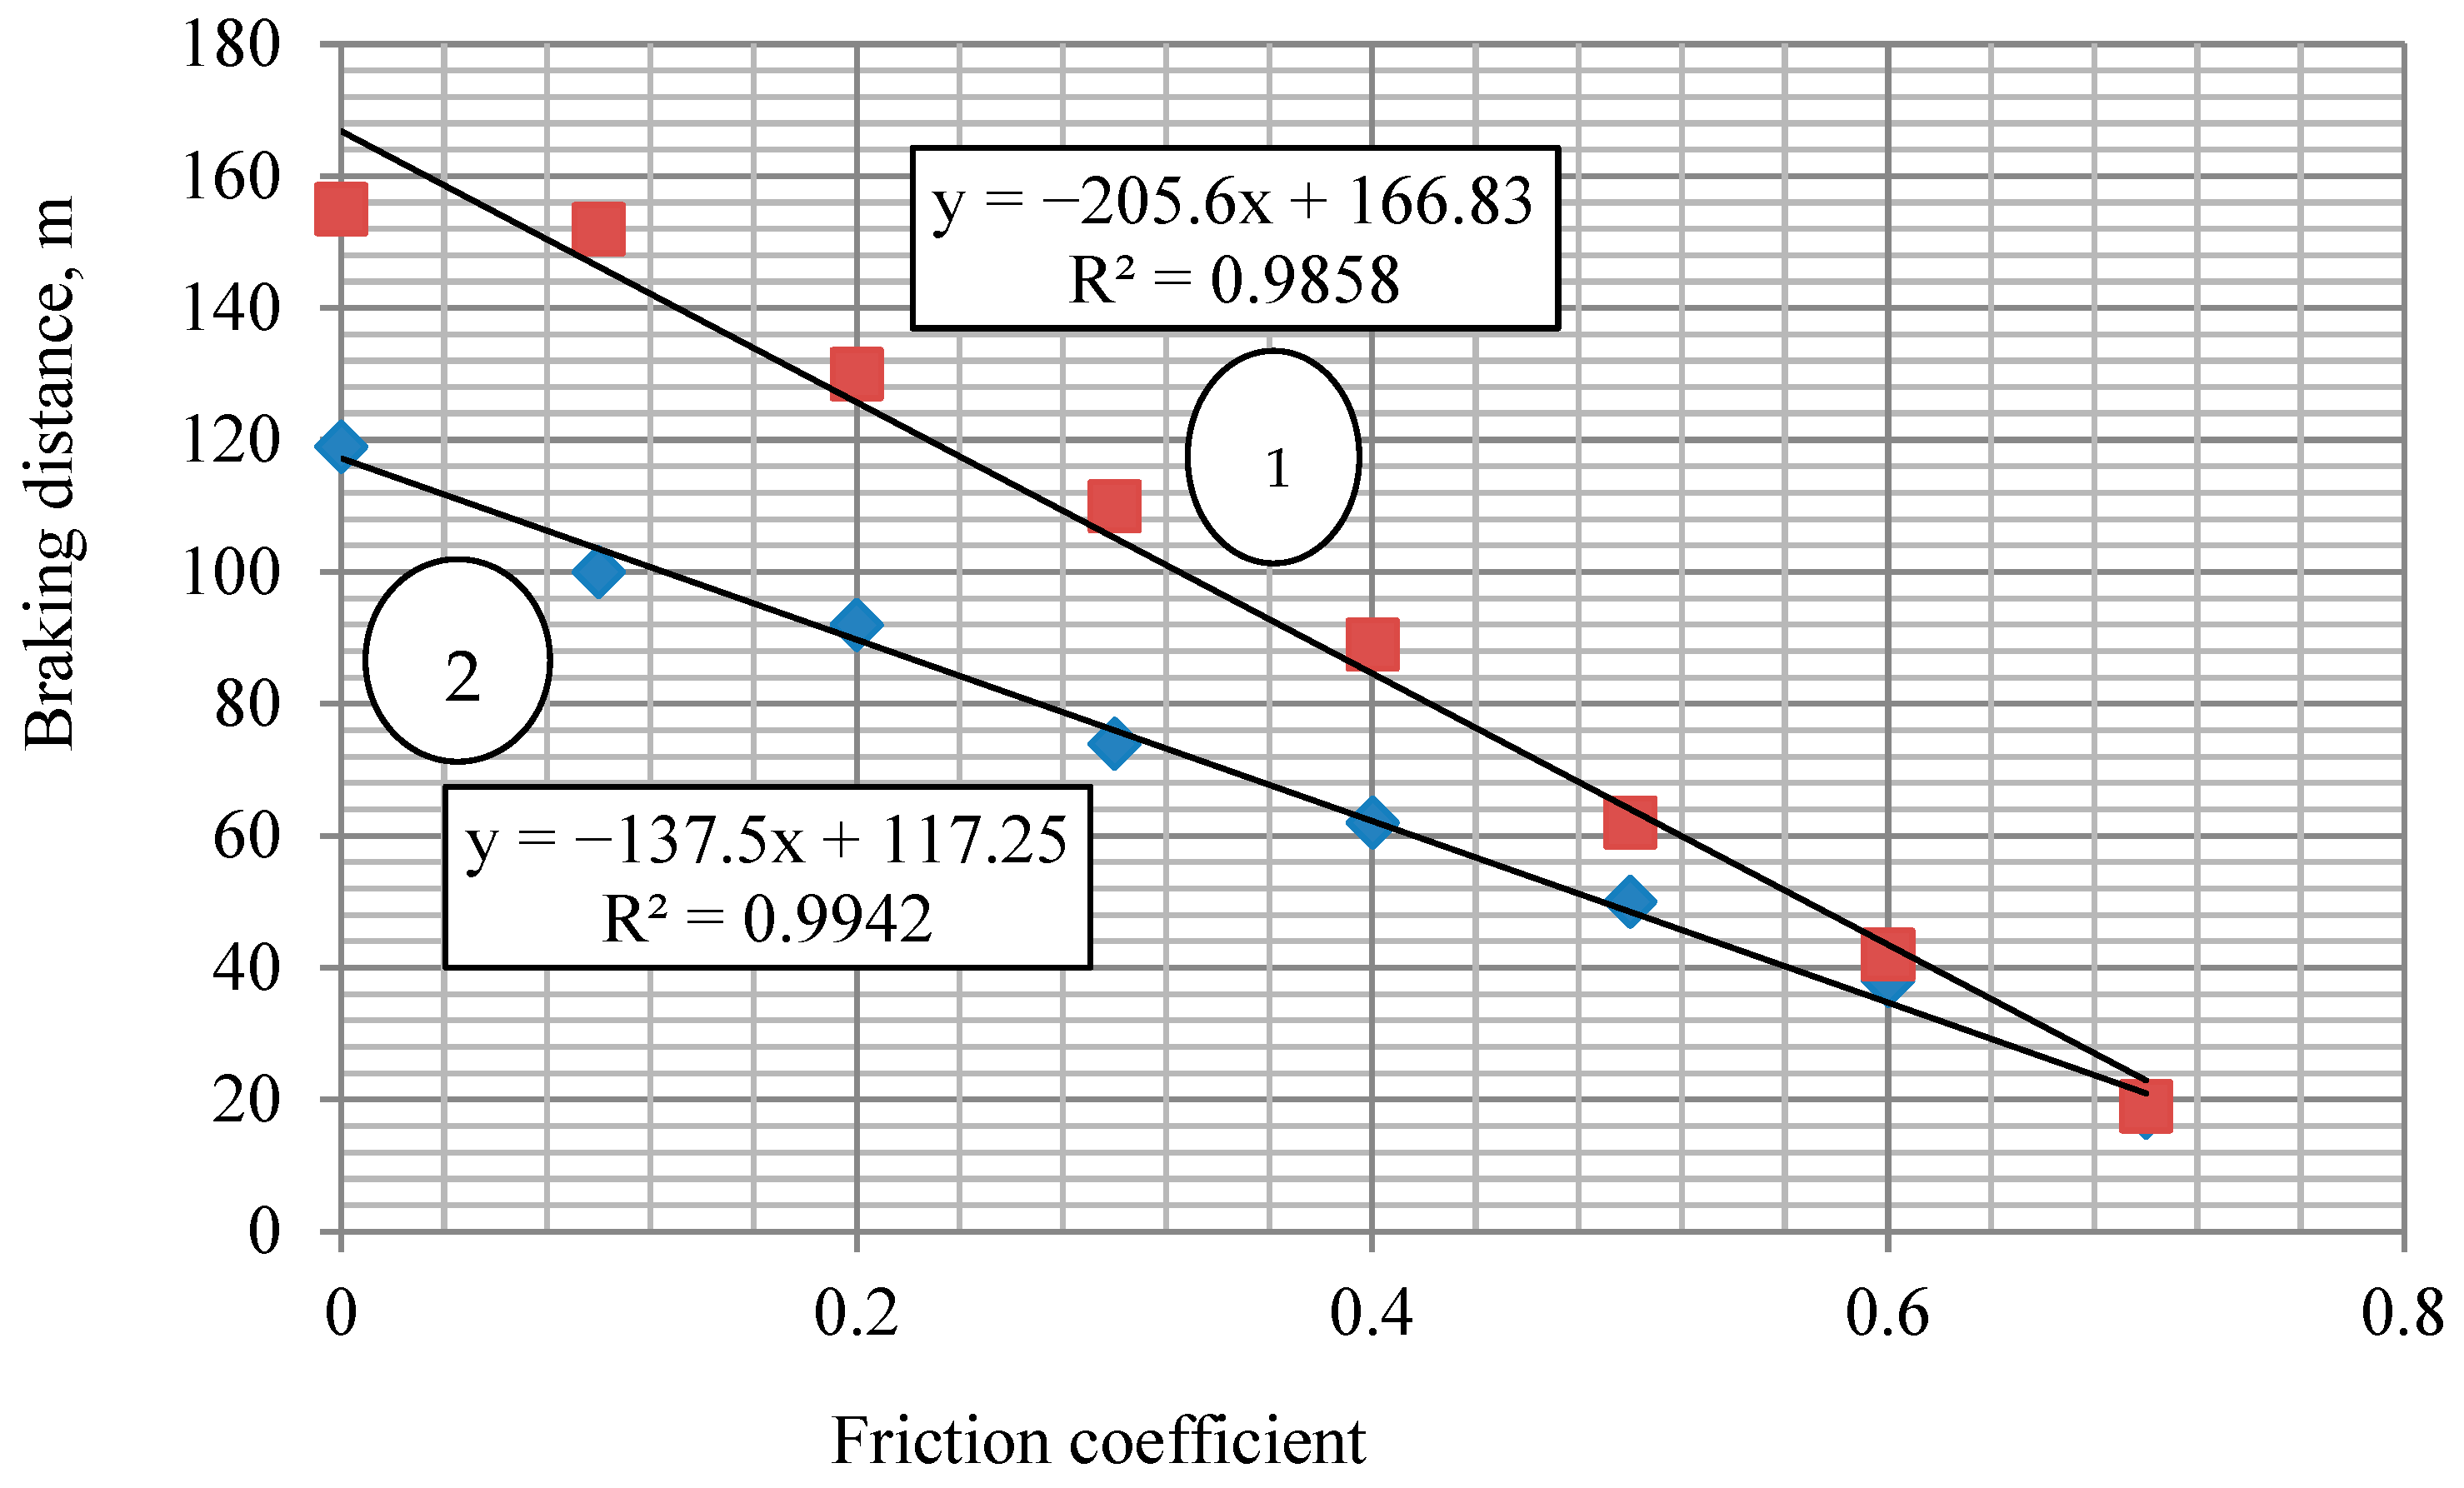
The calculated braking distance values are presented in the corresponding table, and the dependence of braking distance on the friction coefficient is illustrated in
Figure 9.
Analysis of these data shows that a 2–3-fold reduction in
φ results in a 4–7-fold increase in braking distance. This nonlinear relationship explains why, at friction coefficient values below 0.2, a driver’s ability to avoid a collision becomes severely limited even with timely reaction and a properly functioning braking system. Within
Section 4, this calculation is treated as an illustration of the operational consequences of skid resistance degradation rather than as an independent research method.
Although pavement polishing is often described by logarithmic or exponential decay functions, the present linear extrapolation is limited to a short-term forecast horizon (5–6 years) within the observed monitoring interval. The linear model provides a conservative first-order engineering approximation rather than a long-term mechanistic prediction.
Cement concrete pavements deserve particular attention, as the study results show that they possess a lower reserve of macrotexture and are more sensitive to moisture and icing compared to asphalt concrete pavements. Comparison of friction coefficients for dry and wet surface conditions (table comparing φ values under dry and wet states) and the corresponding transition diagram from dry to wet conditions demonstrates that even the presence of a thin water film leads to a 10–15% reduction in skid resistance. Under winter conditions, this effect is further amplified, which, in combination with the high permitted travel speeds on Category I highways, significantly increases accident risk.
In an operational and managerial context, the obtained results indicate the need to shift from a reactive approach to traffic safety toward a preventive strategy. Planned monitoring of macrotexture and friction coefficient, forecasting their temporal evolution, and timely restoration of pavement texture before critical φ thresholds are reached should be regarded as mandatory components of a road safety management system. The tables, graphs, and calculated relationships presented in this study provide a scientifically grounded basis for engineering and organizational decision-making aimed at reducing accident rates under conditions of intensive operation and climatic variability.
4. Discussion
The obtained results confirm that pavement macrotexture parameters and the friction coefficient are system-forming factors of traffic safety, especially under winter operating conditions and adverse weather influences. Unlike short-term accident causes related to driver behavior, pavement texture degradation generates long-term operational risks that manifest independently of the subjective actions of road users.
At low sub-zero temperatures, the friction behavior of rubber–road interaction is strongly influenced by the viscoelastic properties of rubber, including adhesion and hysteresis components. As temperature decreases, rubber stiffness increases, and the material may approach its glass transition range, leading to a reduction in energy dissipation and, consequently, a decrease in friction. In the present study, this effect was not explicitly isolated, and the measured friction values represent the combined influence of surface condition (snow, ice, and macrotexture) and temperature-dependent rubber behavior. Therefore, part of the observed reduction in friction under winter conditions may be attributed not only to surface characteristics but also to changes in the viscoelastic response of the sliding material.
The obtained results should be interpreted within the framework of “safety—measurable indicators—manageable decisions.” Rather than providing a descriptive listing of
φ and
R values, the key contribution of this study lies in demonstrating critical spatial heterogeneity of skid resistance during the winter period and temporal degradation of macrotexture as a stable mechanism underlying long-term risk formation. International reviews and applied studies on skid resistance management indicate that accident rates increase not only when the average friction level decreases, but also in the presence of pronounced friction contrasts across the lane or carriageway width, when a single vehicle is simultaneously exposed to different tire–pavement interaction conditions [
10,
11,
12,
13,
14,
15,
16]. Our data confirm this conclusion for high-speed cement concrete highways in Kazakhstan and provide quantitative refinement: under winter conditions, the friction coefficient in edge zones adjacent to guardrails decreases to near-ice levels, while substantially higher φ values are maintained in the central lanes. In international studies, such scenarios are described as among the most hazardous during maneuvering and emergency braking, as they lead to asymmetric distribution of braking forces and loss of directional stability [
9,
11,
12,
13,
14]. Therefore, from an engineering perspective, “across-width heterogeneity” should be treated as an independent risk factor rather than as a special case of generalized “slippery/non-slippery” conditions.
A comparison of “our results versus the literature” reveals a consistent pattern across three key components. First, regarding the moisture effect, the observed 10–15% reduction in φ in the presence of a thin water film is consistent with the widely described mechanism of reduced adhesive friction and the increased risk of hydrodynamic effects on smoother pavements [
13,
37]. For cement concrete pavements in particular, the critical factor is typically the available macrotexture reserve: lower initial macrotexture increases sensitivity to moisture and polishing, and our comparative data for asphalt concrete and cement concrete pavements confirm this general trend. Second, with respect to winter conditions, the literature emphasizes that intermittent and spatially heterogeneous “snow–ice” states substantially complicate stable vehicle control and require skid resistance to be treated as a spatially variable parameter [
9,
11]. Our measurements provide direct confirmation of this assertion: differences in φ across the carriageway width reach factors of 2–5, while minimum values in edge zones correspond to near-limit conditions for achievable braking. Third, concerning the role of texture, recent studies indicate that skid resistance prediction is significantly improved when macrotexture and microtexture are considered separately, and that surface degradation over time is a determining factor in long-term friction deterioration [
10,
13,
14,
15]. Our contribution lies in tracing macrotexture degradation
R through repeated field measurements conducted in 2023–2025 at identical survey sections and subsequently linking this degradation to forecasts of φ reduction and its associated engineering consequences.
Under conditions of strongly non-uniform friction across the lane width, such as those observed in winter, braking behavior cannot be fully described by a purely longitudinal model. Asymmetric friction may generate a yaw moment, leading to vehicle rotation and reduced directional stability. In addition, vehicles equipped with anti-lock braking systems (ABS) may operate under a “low-selection” strategy, where braking force is limited by the wheel experiencing lower friction. As a result, braking performance may be governed by the minimum friction level rather than the average value used in the calculations. Therefore, the calculated braking distances should be interpreted as idealized estimates, and real-world braking performance under split-friction conditions may be significantly worse.
From an engineering perspective, it is fundamentally important that the identified effects exhibit a nonlinear character. Braking distance calculations demonstrate that a 2–3-fold reduction in φ results in a multiple increase in braking distance (on the order of 4–7 times), meaning that operational risk increases much faster than might be inferred from the absolute change in the friction coefficient alone. This explains why, at low φ values, accident rates can rise sharply even when driver behavior remains unchanged, and the braking system is functioning properly: the physical limit of controllability is reached earlier than a driver can compensate through reaction. Consequently, interpreting winter road traffic accidents solely through the human factor is methodologically incomplete. When high permitted travel speeds on Category Ia highways are combined with localized low-friction zones in edge lanes, a scenario is formed in which collision avoidance becomes difficult to achieve. In this sense, the results of the study refine the causal chain “winter maintenance—friction heterogeneity—vehicle stability/braking—accident occurrence” and identify which elements of this chain are amenable to engineering and operational control.
The regulatory and managerial implications of the results can be formulated as three practical conclusions.
For high-speed roads under winter conditions, it is insufficient to control only the average value of φ within a traffic lane; it is necessary to monitor variability across the carriageway width (edge zones and areas adjacent to guardrails should be treated as high-risk zones). This directly corresponds to the international approach to skid resistance management as part of road network safety systems and is consistent with practices of standardized monitoring and interpretation of results [
13,
14,
15], as well as with the logic of harmonizing skid resistance and texture measurements reflected in PIARC documents and applied international measurement procedures [
16,
17,
18].
Winter maintenance operational decisions must be linked to monitoring data: when multiple contrasts in φ across the carriageway width are identified, priority should be given to eliminating edge “hotspots” of low skid resistance (localized snow and ice removal, adjustment of maintenance equipment routes, and regulated treatment of areas near guardrails and expansion joints). This is not merely an improvement of maintenance quality, but a reduction in the most hazardous scenario in which a single vehicle simultaneously encounters different friction conditions.
Planning of pavement texture restoration works should be based on forecasts of macrotexture degradation R and the associated reduction in φ, rather than solely on visual pavement condition. Given that the measured macrotexture degradation over the 2023–2025 period reaches approximately 22–33%, the results enable a transition from a reactive to a preventive approach: scheduling restoration measures before φ reaches levels at which braking distance growth becomes critical. This approach aligns with the international trend toward integrating skid resistance indicators into road asset management systems [
10,
12,
13,
14,
15] and provides a basis for substantiating maintenance threshold values tailored to the climatic conditions and operational regimes of Kazakhstan.
Overall, the strengthened international context demonstrates that the patterns identified in Kazakhstan are not local anomalies but rather reproduce the general physical and operational logic of tire–pavement interaction. At the same time, quantitative parameters have been obtained for the first time for local conditions, including the rate of macrotexture degradation R, the magnitude of wintertime friction heterogeneity φ, and forecasts of the associated engineering consequences. This enables the results to be used for the development of measurable requirements for winter road maintenance and for pavement texture management on high-speed highways.
A direct seasonal comparison for asphalt concrete surfaces remains limited due to the inability to measure intrinsic pavement properties under snow-covered conditions. Future studies may address this limitation by applying controlled snow removal or using alternative measurement techniques capable of separating pavement and snow layer effects.
One of the limitations of the present study is the use of a single macrotexture characterization method based on the sand patch technique. While this method is suitable for assessing mean texture depth, it may not fully capture early-stage surface polishing or microtexture evolution. Future research should integrate three-dimensional surface measurement techniques, such as laser profilometry or high-resolution scanning, to provide a more comprehensive assessment of pavement surface condition and its influence on friction behavior.
5. Conclusions
The present study provides a comprehensive analysis of the impact of pavement texture degradation on the friction coefficient and traffic safety under winter operating conditions. Based on theoretical assessments, field measurements, and predictive calculations, quantitative relationships were established between surface macrotexture, pavement skid resistance properties, and the operational risks of road traffic accidents.
The scientific novelty and main results of the study can be summarized as follows: (1) for the first time under the conditions of Kazakhstan, multi-year (2023–2025) data on pavement macrotexture degradation (R) were obtained on the basis of repeated field measurements at identical survey sections, enabling a quantitative assessment of surface wear rates; (2) it was demonstrated that under winter conditions the friction coefficient φ may vary by a factor of 3–5 across the carriageway width (central lanes versus edge zones adjacent to guardrails), which explains the mechanism of sudden loss of vehicle stability during braking and lane-changing maneuvers even when drivers comply with standard driving regimes; (3) a forecast of skid resistance reduction (φ) over a future period was performed based on macrotexture degradation R and the established R–φ relationship, and the consequences were demonstrated in the form of a substantial increase in calculated braking distance at representative travel speeds.
It is shown that, under winter conditions, the key factor in accident occurrence is not only the absolute value of the friction coefficient, but also its spatial heterogeneity across the carriageway width. It was established that under conditions of non-uniform removal of snow and ice deposits, the friction coefficient on edge lanes and in the vicinity of barrier guardrails may decrease by a factor of 2–5 compared to the central part of the carriageway, creating critically hazardous conditions during lane-changing maneuvers and emergency braking even when drivers formally comply with speed limits.
The results of multi-year measurements confirmed that pavement macrotexture degrades over time under the influence of traffic loading, with the rate of texture reduction directly dependent on traffic intensity and the proportion of heavy vehicles. Within several years of operation, pavements may lose up to 22–33% of their initial macrotexture asperity height, which leads to a 10–20% reduction in the friction coefficient even under dry conditions and to a much sharper decline in φ when the surface becomes wet or icy.
Predictive assessments showed that, if current traffic intensity is maintained, the friction coefficient on several sections may decrease to levels of φ ≈ 0.3–0.35 within 5–6 years of operation, i.e., to values close to pre-accident thresholds. Such a gradual degradation of skid resistance may not be subjectively perceived by drivers; however, its consequences manifest in a sharp increase in braking distance and a rise in accident rates under adverse weather conditions.
The proposed time-evolution model for macrotexture attenuation should be interpreted as an empirical section-specific forecasting tool. Because traffic loading was represented by observed vehicle-category counts rather than standardized ESAL values, the model is most applicable to highways with comparable traffic composition and operating conditions, and its broader transferability requires future load normalization.
Calculated assessments of braking distance confirmed the nonlinear nature of the relationship between the friction coefficient and vehicle stopping distance. It was established that a 2–3-fold reduction in φ leads to a 4–7-fold increase in braking distance, which severely limits a driver’s ability to avoid a collision even with timely reaction and a properly functioning braking system. This confirms that at friction coefficient values below 0.2, traffic safety is largely governed by pavement condition rather than by driver behavior.
The simplified braking distance model does not account for asymmetric friction effects, vehicle yaw dynamics, or ABS control strategies; therefore, the actual safety risk under heterogeneous winter conditions may be underestimated.
Both asphalt and cement concrete pavements demonstrated a comparable reduction in friction under wet conditions (approximately 10–15%), indicating similar sensitivity to moisture within the scope of the present study. Therefore, no definitive conclusion regarding higher moisture sensitivity of cement concrete can be drawn based on the obtained experimental data.
From a practical standpoint, the results of the study substantiate the need to transition to a preventive traffic safety system based on regular monitoring of pavement macrotexture and friction coefficient, forecasting their temporal evolution, and timely restoration of surface texture before critical threshold values are reached. The presented findings can be used in the development of requirements for winter road maintenance, planning of maintenance and rehabilitation intervals, and improvement of engineering solutions aimed at reducing accident rates under conditions of intensive operation and climatic variability.




 ,
,