


Abstract
The proliferation of distributed photovoltaic (PV) generation introduces significant operational challenges for distribution networks, including voltage instability and elevated technical losses. While modern PV inverters capable of static synchronous compensator (STATCOM) functionality—forming PV-STATCOM systems—offer a promising solution, their optimal integration remains a complex mixed-integer non-linear programming (MINLP) problem. This paper addresses this gap by proposing a novel hybrid evaluator–optimizer framework for the optimal daily placement and sizing of PV-STATCOM devices. The framework synergistically integrates the metaheuristic crow search algorithm (CSA) for global exploration of discrete device locations with a high-fidelity, multi-period optimal power flow (OPF) model—implemented efficiently in Julia with the Ipopt solver—for continuous operational evaluation and constraint validation. The methodology incorporates realistic 24 h load and solar irradiance profiles. Extensive validation on standard IEEE 33- and 69-bus test systems demonstrates the efficacy of the proposed approach. The results indicate substantial reductions in daily energy losses—by up to 70.4% and 72.9% for the 33- and 69-bus systems, respectively—and corresponding operational costs, outperforming recent state-of-the-art metaheuristic and convex optimization methods reported in the literature. The CSA also exhibits robust convergence and repeatability across multiple independent runs. This work contributes a computationally efficient, open-source planning tool that leverages modern optimization solvers, providing a scalable and effective strategy for enhancing the power quality and economic performance of PV-rich distribution networks.
1. Introduction
1.1. General Context
The increasing penetration of photovoltaic (PV) generation in distribution networks has introduced new operational challenges related to voltage regulation, power losses, and power quality [1,2], mainly due to the intermittent nature of solar irradiance and the limited reactive power capabilities of conventional PV inverters [3,4]. As a result, distribution systems with high PV penetration may experience voltage deviations and reduced operational flexibility, especially under varying load and generation conditions.
Recent advancements in power electronics have enabled PV inverters to operate as PV-STATCOMs, allowing them to provide dynamic reactive power support even during periods of low or zero active power generation [5,6]. This dual functionality has positioned PV-STATCOMs as a promising solution to enhance voltage stability and reduce energy losses in modern distribution networks [7]. However, the effectiveness of PV-STATCOM integration strongly depends on their optimal placement and sizing, which directly influences network performance and economic benefits [8,9].
Several studies have addressed the siting and sizing problem of PV-STATCOMs and other flexible resources in distribution systems using optimization-based approaches, including deterministic formulations and metaheuristic algorithms, such as those reported in [10,11,12]. While deterministic methods offer computational efficiency, they often rely on convex relaxations or simplifying assumptions that may limit their applicability to highly non-linear and mixed-variable problems. In contrast, metaheuristic techniques have demonstrated strong capabilities in handling non-convex, large-scale optimization problems with discrete and continuous decision variables, which are inherent characteristics of the PV-STATCOM planning problem.
Despite the extensive application of metaheuristic algorithms in distribution system planning, the specific use of the crow search algorithm (CSA) for optimizing the operation, placement, and sizing of PV-STATCOM devices remains relatively unexplored [13]. Given the complex and non-linear nature of the optimal power flow problem, combined with discrete siting decisions and continuous sizing variables, exploring alternative optimization strategies that provide robust search capabilities and effective exploration–exploitation balance is well motivated.
In this context, this work aims to investigate the application of CSA for the optimal placement and sizing of PV-STATCOMs in distribution networks, considering a multi-period operational framework. The proposed approach seeks to minimize energy losses and operational costs while enhancing voltage profiles, contributing to the development of flexible and efficient planning tools for active distribution systems.
1.2. Literature Review
The dynamic compensation of active and reactive power using photovoltaic static synchronous compensators (PV-STATCOM) has been extensively studied as a transformative strategy for modern distribution networks. By enabling voltage support, loss reduction, and improved economic operation, these systems address critical challenges arising from high renewable energy penetration. This planning problem is inherently complex, typically formulated as an MINLP model due to the simultaneous need to determine discrete placement and continuous sizing of devices. Consequently, recent research has increasingly turned to metaheuristic optimization techniques to find feasible, high-quality solutions under nonlinear operational constraints.
In a study addressing uncertainty, Ebrahimi et al. [14] applied the Teaching–Learning-Based Optimization (TLBO) algorithm to co-optimize the placement of PV-based distributed generation and DSTATCOM devices in IEEE 33-bus networks. Their model incorporated uncertainties in both load and generation, achieving a 36.8% improvement in the voltage stability index and a notable 94.8% reduction in total power losses.
Addressing the temporal dimension of grid operation, Combita-Murcia et al. [13] proposed a master–slave methodology using the Salp Swarm Algorithm (SSA) to optimize the daily operation of PV-STATCOM devices. In their framework, the master stage generates power injection setpoints, while the slave stage validates each solution via a successive approximation power flow method. The results demonstrated significant improvements in energy losses and operational costs, confirming the efficacy of SSA for hourly dispatch problems.
Shaheen et al. [8] employed the Hunter Prey Optimization (HPO) algorithm to determine optimal PV-STATCOM placements in IEEE 33- and 69-bus networks over a 24 h horizon. Their objective to minimize energy losses and improve voltage profiles yielded impressive outcomes, with loss reductions above 57% and a 44% enhancement in voltage regulation. The study further highlighted HPO’s superior performance compared to established algorithms such as Particle Swarm Optimization (PSO), Differential Evolution (DE), and Artificial Rabbit Optimization (ARO).
Elshahed [10] explored the use of the Artificial Rabbit Optimization (ARO) algorithm for providing ancillary services through PV-STATCOM devices in IEEE 33-bus networks. The work focused on night-time reactive power compensation and voltage profile enhancement, demonstrating that ARO outperforms classical techniques like DE and Gaining-Sharing Knowledge (GSO) under static operating conditions.
From a computational reformulation perspective, Garrido-Arévalo et al. [7] approached the problem using convex optimization techniques. By reformulating voltage constraints as second-order cone programming (SOCP) constraints, they transformed the MINLP into a mixed-integer convex model. Applied to IEEE 33-bus networks, this method improved computational efficiency and solution quality, particularly for both radial and meshed system topologies.
Mahmoud et al. [6] utilized the Grey Wolf Optimizer (GWO) to coordinate the active and reactive power operation of PV-STATCOMs in IEEE 33-bus networks with high photovoltaic penetration. While the study successfully enhanced voltage regulation, it was limited to fixed-load conditions and did not consider time-varying operational dispatch.
Finally, Sirjani [15] implemented an Adaptive Particle Swarm Optimization (APSO) algorithm to determine the optimal placement and capacity of PV-STATCOM devices in IEEE 33-bus networks. Incorporating empirical load and generation data, the model achieved measurable improvements in technical losses and voltage stability.
Collectively, these studies underscore the effectiveness of metaheuristic algorithms in solving the PV-STATCOM planning problem. However, the application of the crow search algorithm (CSA) to this domain—particularly under dynamic, time-varying operating conditions—remains largely unexplored. Furthermore, while many studies rely on conventional power flow solvers within the evaluation stage, the potential of high-performance, open-source MINLP solvers available in modern computational environments like Julia has not been fully leveraged. This gap motivates the present work, which seeks to develop a robust hybrid methodology combining the exploratory strength of CSA with the precision of exact MINLP solvers for the optimal daily operation of PV-STATCOM systems.
Table 1 synthesizes recent research on PV-STATCOM planning and operation, highlighting the employed algorithms, technical objectives, and test systems used for validation.
Table 1.
Summary of metaheuristic and convex optimization approaches for PV-STATCOM integration.
Several trends emerge from Table 1. First, the majority of recent studies prioritize technical objectives—chiefly minimizing energy losses and enhancing voltage profiles—whereas a smaller subset explicitly addresses economic metrics such as annual operating costs. Second, metaheuristic algorithms inspired by biological or social behaviors dominate the literature, including particle swarm optimization (PSO), salp swarm algorithm (SSA), hunter–prey optimization (HPO), and artificial rabbit optimization (ARO). These methods leverage population-based search mechanisms to effectively balance exploration and exploitation within high-dimensional, non-linear solution spaces characteristic of distribution system optimization.
Convex reformulations, particularly second-order cone programming (SOCP), offer an alternative pathway by relaxing non-convex constraints to improve computational tractability. However, such approaches often rely on simplifying assumptions—such as lossless models or fixed operating conditions—that may limit their applicability in dynamic, multi-period scenarios. In contrast, metaheuristic algorithms provide inherent flexibility to handle both discrete (placement) and continuous (sizing) variables, making them well-suited for the mixed-integer non-linear programming (MINLP) formulations that arise in practical PV-STATCOM planning.
Despite their successful application in distribution system optimization problems, metaheuristic techniques, including population-based algorithms, are known to exhibit certain inherent limitations. Previous studies have reported that their performance is often sensitive to the selection of algorithm-specific parameters, such as population size, awareness probability, or step-length factors, which may influence convergence speed and solution quality depending on the problem structure. Additionally, due to their stochastic nature, metaheuristic methods may present variability in convergence behavior across different executions, which motivates the use of multiple runs and statistical performance indicators to assess robustness. Nevertheless, their flexibility and ability to handle non-convex, mixed-integer formulations have led to their widespread adoption in complex planning problems involving PV-STATCOM integration, where exact or convex approaches may face modeling or scalability challenges.
Within this landscape, the crow search algorithm (CSA) remains notably underexplored for PV-STATCOM applications, despite its demonstrated robustness in both continuous and discrete optimization domains. This work aims to address that gap by proposing a hybrid evaluator–optimizer architecture that integrates CSA’s exploratory strength with the numerical precision of modern MINLP solvers available in Julia. The proposed methodology targets the dual objectives of reducing energy losses and operational costs in distribution networks with high photovoltaic penetration, offering a scalable and computationally efficient alternative to existing planning frameworks.
1.3. Contributions and Scope
This work develops and validates a mathematical model for the optimal sizing and placement of photovoltaic static synchronous compensators (PV-STATCOMs) in electrical distribution networks. The primary objectives are to minimize energy losses and reduce operational and maintenance costs. The anticipated impacts of the proposed approach span technical, economic, social, and methodological dimensions.
From a technical perspective, the methodology integrates the metaheuristic crow search algorithm (CSA) with modern MINLP solvers. This hybrid framework aims to enhance voltage regulation, reduce technical losses, and improve the dynamic stability of distribution systems with high photovoltaic penetration. By co-optimizing the placement and capacity of PV-STATCOM devices, the model directly addresses critical operational challenges such as reverse power flows, overvoltage conditions, and inefficient reactive power dispatch. The outcome is a more robust and reliable grid operation that can better accommodate increasing levels of distributed renewable generation.
Economically, the model facilitates efficient capital and operational resource allocation. Through optimal siting and sizing, it reduces both energy losses and the need for costly network upgrades, thereby improving the financial viability of distributed solar projects. This is particularly significant in operational contexts where high marginal energy costs and substantial technical losses impose considerable financial burdens on utilities and project developers.
On a social and environmental level, the proposed planning framework supports the expansion of reliable electricity access in underserved or remote communities. Decentralized PV-STATCOM systems offer a viable pathway to enhance power quality without requiring extensive and expensive grid reinforcement. Furthermore, by enabling greater integration of clean energy sources, the methodology contributes directly to decarbonization goals and supports the global energy transition, aligning with broader sustainability targets.
Beyond these direct grid impacts, the implementation of the complete model in the Julia programming environment yields significant secondary benefits. The use of open-source, high-performance solvers promotes transparency, reproducibility, and accessibility in power system research. The developed computational framework also serves as a valuable educational resource for training power engineers in advanced optimization techniques and modern software practices.
Finally, the proposed methodology is designed with modularity and adaptability in mind. Its structure allows for straightforward extension to other network topologies, additional operational constraints, or more complex hybrid energy system configurations. This inherent flexibility opens promising avenues for future research in areas such as multi-period optimal dispatch, planning under uncertainty, and the integrated control of diverse distributed energy resources.
1.4. Document Structure
In this article, Section 2 presents the mathematical formulation associated with the problem of optimal placement and sizing of PV-STATCOM devices in distribution networks, considering objective functions aimed at minimizing energy losses and operating costs. Section 3 describes the methodology implemented in Julia, based on a evaluator–optimizer architecture that combines the crow search algorithm in the optimizer stage with MINLP solvers in the evaluator stage. Section 4 outlines the main characteristics of the IEEE 33- and 69-node test systems, together with the demand and solar irradiance curves used for model validation. Section 5 analyzes the results obtained and the evaluation of the proposed methodology’s performance. Finally, Section 6 presents the conclusions and future research directions derived from this work.
2. Mathematical Formulation
This section outlines the mathematical model for the optimal placement and sizing of photovoltaic static synchronous compensators (PV-STATCOMs) in distribution networks. The formulation addresses the problem of dynamic active and reactive power compensation over a daily operational horizon, with the objective of minimizing electrical losses and operational costs. The model structure, including objective functions and operational constraints, is adapted from established frameworks presented in [16].
The integration of PV-STATCOM devices is formulated as an MINLP problem. This classification arises from the simultaneous presence of discrete decision variables—such as the placement of compensators—and continuous variables—including their rated capacities and hourly power setpoints. non-linearity is introduced through the AC power flow equations, which govern the network’s electrical behavior. Additionally, the model incorporates time-varying inputs, including solar irradiance profiles and nodal load demand, alongside the technical parameters of the distribution network, such as line impedances and voltage limits.
The complete formulation thus captures the interdependencies between device allocation, power dispatch, and network constraints, providing a comprehensive basis for the planning and daily operation of PV-STATCOM systems in modern distribution grids.
2.1. Objective Function Formulation
The first objective function aims to minimize the total daily electrical energy losses in the distribution network. These losses, stemming from the resistive properties of conductors and the network’s topological configuration, are quantified using nodal voltages and the system admittance matrix. The corresponding formulation is expressed as follows:
In this formulation, denotes the total daily electrical energy losses [kWh], and represent the complex voltages at nodes k and m during period h [p.u.], is the admittance element of the bus admittance matrix connecting nodes k and m [p.u.], refers to the duration of period h [h]—typically set to one for hourly discretization—H represents the set of time periods in the operational horizon (e.g., 24 h), and N is the set of nodes (buses) in the distribution network. This formulation captures the impact of both network topology and power flow patterns on resistive losses, providing a physically consistent measure of energy efficiency across the daily operational cycle.
Equation (2) defines the second objective function, which aims to minimize the total daily economic cost associated with active power supplied from the substation to the distribution network. This cost is computed as the sum, over all time periods and nodes, of the real power drawn from the substation multiplied by the energy price per kilowatt-hour, reflecting the operational expenditure incurred by the utility.
where is the daily cost of energy purchased at the substation [$], denotes the average cost per kilowatt-hour at the substation terminals [$/kWh], and represents the complex apparent power supplied by the substation at node k during period h [kVA]. As in the previous formulation, is the duration of period h [h], H is the set of time periods, and N is the set of nodes in the network. The operator extracts the real component, corresponding to the active power component of the supplied apparent power.
Although both technical and economic performance indicators are reported, the optimization problem is formulated as a single-objective problem. The objective function explicitly minimizes the total daily electrical energy losses defined in (1). The economic cost defined in (2) is evaluated as a derived metric by multiplying the resulting energy losses by a constant electricity price and according to the period of the losses’ evaluation. Therefore, minimizing energy losses inherently leads to the minimization of operating costs, and no conflicting objectives are considered.
2.2. Model Constraints
The proposed MINLP model incorporates a set of technical constraints that ensure feasible and stable operation of the distribution network when integrating PV-STATCOM devices. These constraints govern power balance, device capabilities, network operating limits, and system security, as detailed in Equations (3)–(10).
Constraint (3) enforces complex power balance at each node and time period, ensuring that generation, demand, and losses are physically consistent. Inequalities (4) and (5) limit the apparent and active power outputs of the PV-STATCOM devices according to their installed capacity and the available solar irradiance , respectively. Equation (6) defines the reactive power injection as the imaginary component of the complex power. Constraints (7)–(9) specify the reference (slack) bus conditions: fixed nominal voltage, zero complex power (balanced substation injection), and non-negative active power supply to prevent reverse power flow. Finally, inequality (10) ensures that nodal voltages remain within permissible regulatory limits at all times.
Taken together, this set of constraints guarantees operational feasibility, preserves power quality, and maintains system stability under time-varying load and generation profiles, thereby enabling secure integration of PV-STATCOM systems into modern distribution networks.
2.3. Model Interpretation
The MINLP formulation defined by Equations (1)–(10) can be interpreted as a holistic planning and operational framework for PV-STATCOM integration. Equation (1) defines the primary technical objective, minimizing total daily energy losses due to resistive effects in the distribution lines. Complementarily, Equation (2) captures the economic objective by minimizing the cost of active power supplied from the substation. Together, these objectives reflect both the physical efficiency and the economic viability of network operation under time-varying load and solar irradiance conditions.
The constraint set ensures physical and operational feasibility. Equation (3) enforces complex power balance at each node and time period, which inherently encompasses both active and reactive power equilibrium. Inequality (4) bounds the apparent power output of each PV-STATCOM device according to its installed capacity, while (5) couples the active power generation to the available solar resource . Equation (6) explicitly defines the reactive power injection from the PV-STATCOM as the imaginary component of its complex power output.
Network reference conditions are established by Constraints (7)–(9). Specifically, (7) fixes the voltage magnitude at the slack bus to the nominal value, (8) sets the complex power at the slack bus to zero (ensuring balanced substation injection), and (9) prevents reverse active power flow by requiring non-negative real power supply from the substation. Finally, Inequality (10) maintains all nodal voltages within permissible regulatory limits , thereby preserving power quality across the network.
The resulting optimization problem is inherently non-convex and highly non-linear, stemming from the AC power flow equations and the interplay between continuous variables (voltages, power flows) and discrete decisions (device placement). Each candidate solution corresponds to a specific configuration of PV-STATCOM locations and sizes, which is evaluated through an optimal power flow (OPF) routine. In the proposed methodology, the crow search algorithm (CSA) serves as the global optimizer, iteratively generating new configurations that are validated via the OPF in a master–slave architecture. This hybrid approach combines the exploratory strength of metaheuristics with the mathematical precision of non-linear programming, enabling effective solutions for dynamic, multi-period operation of distribution networks with high photovoltaic penetration.
3. Proposed Hybrid Optimization Approach
The optimal placement and sizing of PV-STATCOM devices constitutes a complex optimization problem characterized by non-linearity, non-convexity, and the presence of both discrete (location) and continuous (size) decision variables. In addition, the repeated evaluation of candidate solutions through optimal power flow calculations leads to a highly irregular and multi-modal objective function landscape.
In this context, metaheuristic optimization techniques provide a suitable alternative to deterministic approaches, as they can effectively explore large and complex search spaces without relying on convexity assumptions. Among them, the crow search algorithm presents several features that make it well-suited for the addressed problem. CSA is a population-based, memory-driven algorithm that maintains a balanced exploration–exploitation mechanism, enabling it to preserve solution diversity and escape local optima.
Furthermore, CSA has demonstrated robust performance in mixed-variable and high-dimensional optimization problems [17]. Based on these considerations, CSA is adopted in this work as an appropriate optimization framework to address the PV-STATCOM placement and sizing problem within a multi-period OPF formulation.
3.1. Methodology
This work addresses the optimal placement and sizing problem of PV-STATCOM devices through a hybrid evaluator–optimizer framework. The proposed methodology comprises two integrated components:
- Evaluation stage: A multi-period OPF model, formulated in the Julia programming language, serves as the technical feasibility evaluator. For each candidate configuration, it verifies compliance with operational constraints and computes the objective functions pertaining to energy losses and operating costs.
- Optimization stage: The CSA functions as the metaheuristic optimizer. It iteratively generates new configurations of PV-STATCOM location and capacity by leveraging population memory and evolutionary search rules.
The interaction between these components defines the optimization cycle. Candidate solutions, projected onto the discrete space of network nodes, are generated by the CSA and subsequently evaluated by the OPF model. This synergistic approach allows the CSA to effectively explore the combinatorial solution space, while the OPF ensures rigorous validation of all technical and operational constraints.
3.2. Optimizer Stage: Crow Search Algorithm
The CSA is a metaheuristic optimization technique inspired by the collective social behavior of crows in their natural habitat [18]. Crows are known for their remarkable intelligence, spatial memory, and sophisticated strategies for food storage and theft prevention. They observe other crows, learn behavioral patterns, and employ deceptive movements to protect their hidden caches from pilferage [19].
This seemingly chaotic yet rational behavior can be formalized into a computational model capable of balancing global exploration and local exploitation within the solution space [20]. In CSA, each candidate solution is represented as a crow within a flock. Each crow retains a memory of its best-found positions and adaptively follows others to discover new regions, while stochastic parameters govern protective behaviors and environmental awareness.
The CSA design is underpinned by the following key behavioral traits of crows:
- Living and foraging in groups (swarms or populations).
- Ability to memorize and recall high-quality food locations.
- Strategic pursuit of other individuals to discover better resources.
- Protection of stored food through random movements and awareness-based evasion.
The algorithm can be adapted to combinatorial optimization problems through the sequential steps below.
3.3. Initial Population
As a population-based metaheuristic, the CSA explores and exploits the solution space through the iterative evolution of an initial set of candidate solutions. In this work, the initial population is generated randomly, with each individual representing a potential configuration for the placement of PV-STATCOM units across the distribution network.
The population consists of individuals, each encoded as a vector of dimension , where corresponds to the number of PV-STATCOM units to be installed. Each component of the vector represents an integer bus index, with the slack bus explicitly excluded from consideration. Mathematically, the initial population can be represented as follows:
where each element is randomly selected from the set of admissible network buses.
The CSA is characterized by the usage of memories, where each crow has information regarding the position of the largest food pantry during the exploration and exploitation of the solution space. The memories of the crows take the following form:
Note that initially, the memories are assigned with the values of the initial population, since in the first iteration, every crow is starting its exploration of the solution space.
3.4. Evolution Criteria and Memory Updating
At each iteration j, the algorithm evaluates population evolution by comparing the best objective function value obtained in the current iteration with the best value achieved so far. In the proposed formulation, each individual represents a candidate solution defined by a vector of integer-valued bus indices corresponding to the locations of PV-STATCOM units.
At iteration j, the position of the crow is updated according to:
The CSA position update depends on several key parameters: denotes the current position of the k-th crow at iteration t, represents the memory (best-known position) of a randomly selected crow j, is the flight length parameter that controls movement step size, is a uniformly distributed random number in the interval , and is the awareness probability, which models the likelihood that a crow detects being followed.
Within the update rule, the term defines the search direction toward promising regions of the solution space, while the product regulates the trade-off between global exploration and local exploitation. Larger values of encourage broader exploration, whereas smaller values promote intensification around high-quality solutions. Each newly generated candidate solution is evaluated using the OPF model. Subsequently, an elitist memory update strategy is applied, whereby a crow’s memory is replaced only if the new solution yields a better objective function value.
This elitist preservation ensures that high-quality solutions are retained throughout the iterative process, enhancing convergence reliability.
3.5. Updating the Individuals
The iterative process of the CSA is governed by a composite stopping criterion designed to balance solution quality and computational efficiency. This criterion integrates a maximum iteration limit with an early-stopping mechanism based on convergence monitoring.
The maximum iteration limit ensures definitive termination under all conditions, serving as an upper bound on execution time. However, due to the high computational cost associated with the multi-period OPF evaluations, an additional adaptive criterion is introduced. This criterion tracks the evolution of the global best objective function value over successive iterations. If no improvement is observed for a predefined number of consecutive iterations—referred to as the patience parameter—the algorithm is halted prematurely. This indicates that the search has converged to a stable region and further iterations are unlikely to yield significant gains.
This strategy significantly reduces unnecessary OPF evaluations while preserving solution accuracy.
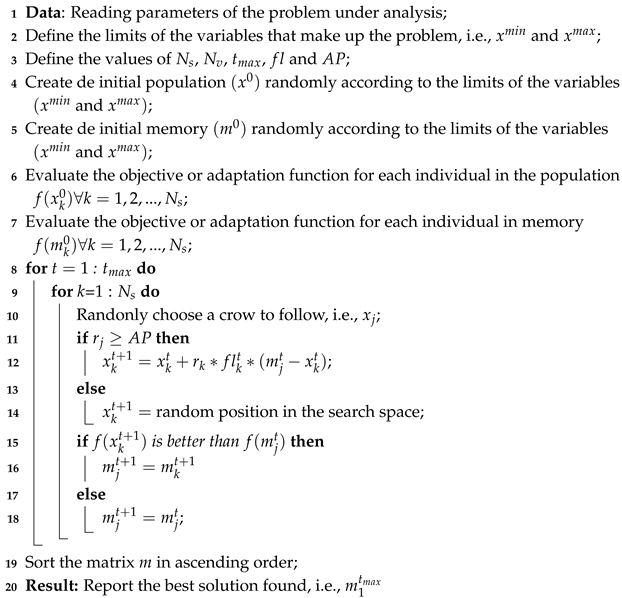
3.6. Pseudo-Code Application of CSA
Algorithm 1 summarizes the implementation of the CSA to solve the PV-STATCOM generation source location problem.
| Algorithm 1 Pseudo-code for the proposed CSA approach in optimization problems. |
 |
3.7. Evaluator Stage: Optimal Power Flow Formulation
The evaluator stage assesses the technical feasibility and operational performance of each candidate solution generated by the optimizer. This evaluation is performed using a multi-period OPF model, which simulates the steady-state operation of the distribution network over a daily horizon under variable loading and generation conditions [21].
The OPF model is discretized into a set of time intervals that capture the diurnal variations in load demand and photovoltaic generation. For each interval, the network operating conditions are solved independently, while the decision variables—representing the placement and sizing of PV-STATCOM units—remain constant across the entire horizon [22]. The formulation is based on a complex power balance at every bus and time step, with nodal voltages and power injections as variables. The slack bus supplies the residual active power required to satisfy system demand, and each PV-STATCOM unit operates within its capacity limits to inject controllable active and reactive power. Voltage magnitudes at all buses are constrained within statutory limits to ensure regulatory compliance.
The objective function of the OPF aggregates three cost components over the daily horizon: (i) total network energy losses, (ii) energy supplied from the slack bus, and (iii) the contribution from distributed PV-STATCOM generation. These components are weighted using predefined coefficients that reflect their relative operational and economic significance.
The OPF problem is implemented in Julia using the JuMP modeling framework and solved with the non-linear solver IPOPT, which is capable of handling the non-convex nature of the AC power flow equations [23]. This setup enables efficient and repeatable evaluations, making it suitable for integration within a metaheuristic optimization loop.
For every candidate configuration provided by the optimizer, the OPF returns the corresponding objective function value, which quantifies the solution’s fitness. The model also yields the optimal power dispatch of each PV-STATCOM unit, allowing for detailed analysis of their utilization patterns and operational impact.
3.8. Interface Connection
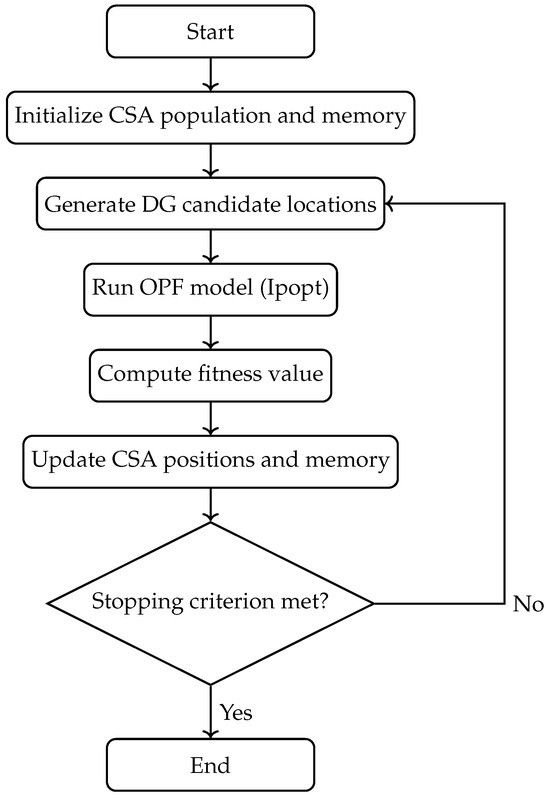
Figure 1 illustrates the general architecture of the proposed framework for the optimal placement and sizing of PV–STATCOM units in distribution networks. In this scheme, the CSA is responsible for exploring the discrete solution space, while the OPF model deterministically solves the continuous optimization problem associated with each candidate configuration.
Figure 1.
General architecture of the proposed CSA–OPF framework.
This hierarchical structure allows for decoupling the discrete location decisions handled by the metaheuristic from the continuous operational and sizing decisions solved through non-linear programming.
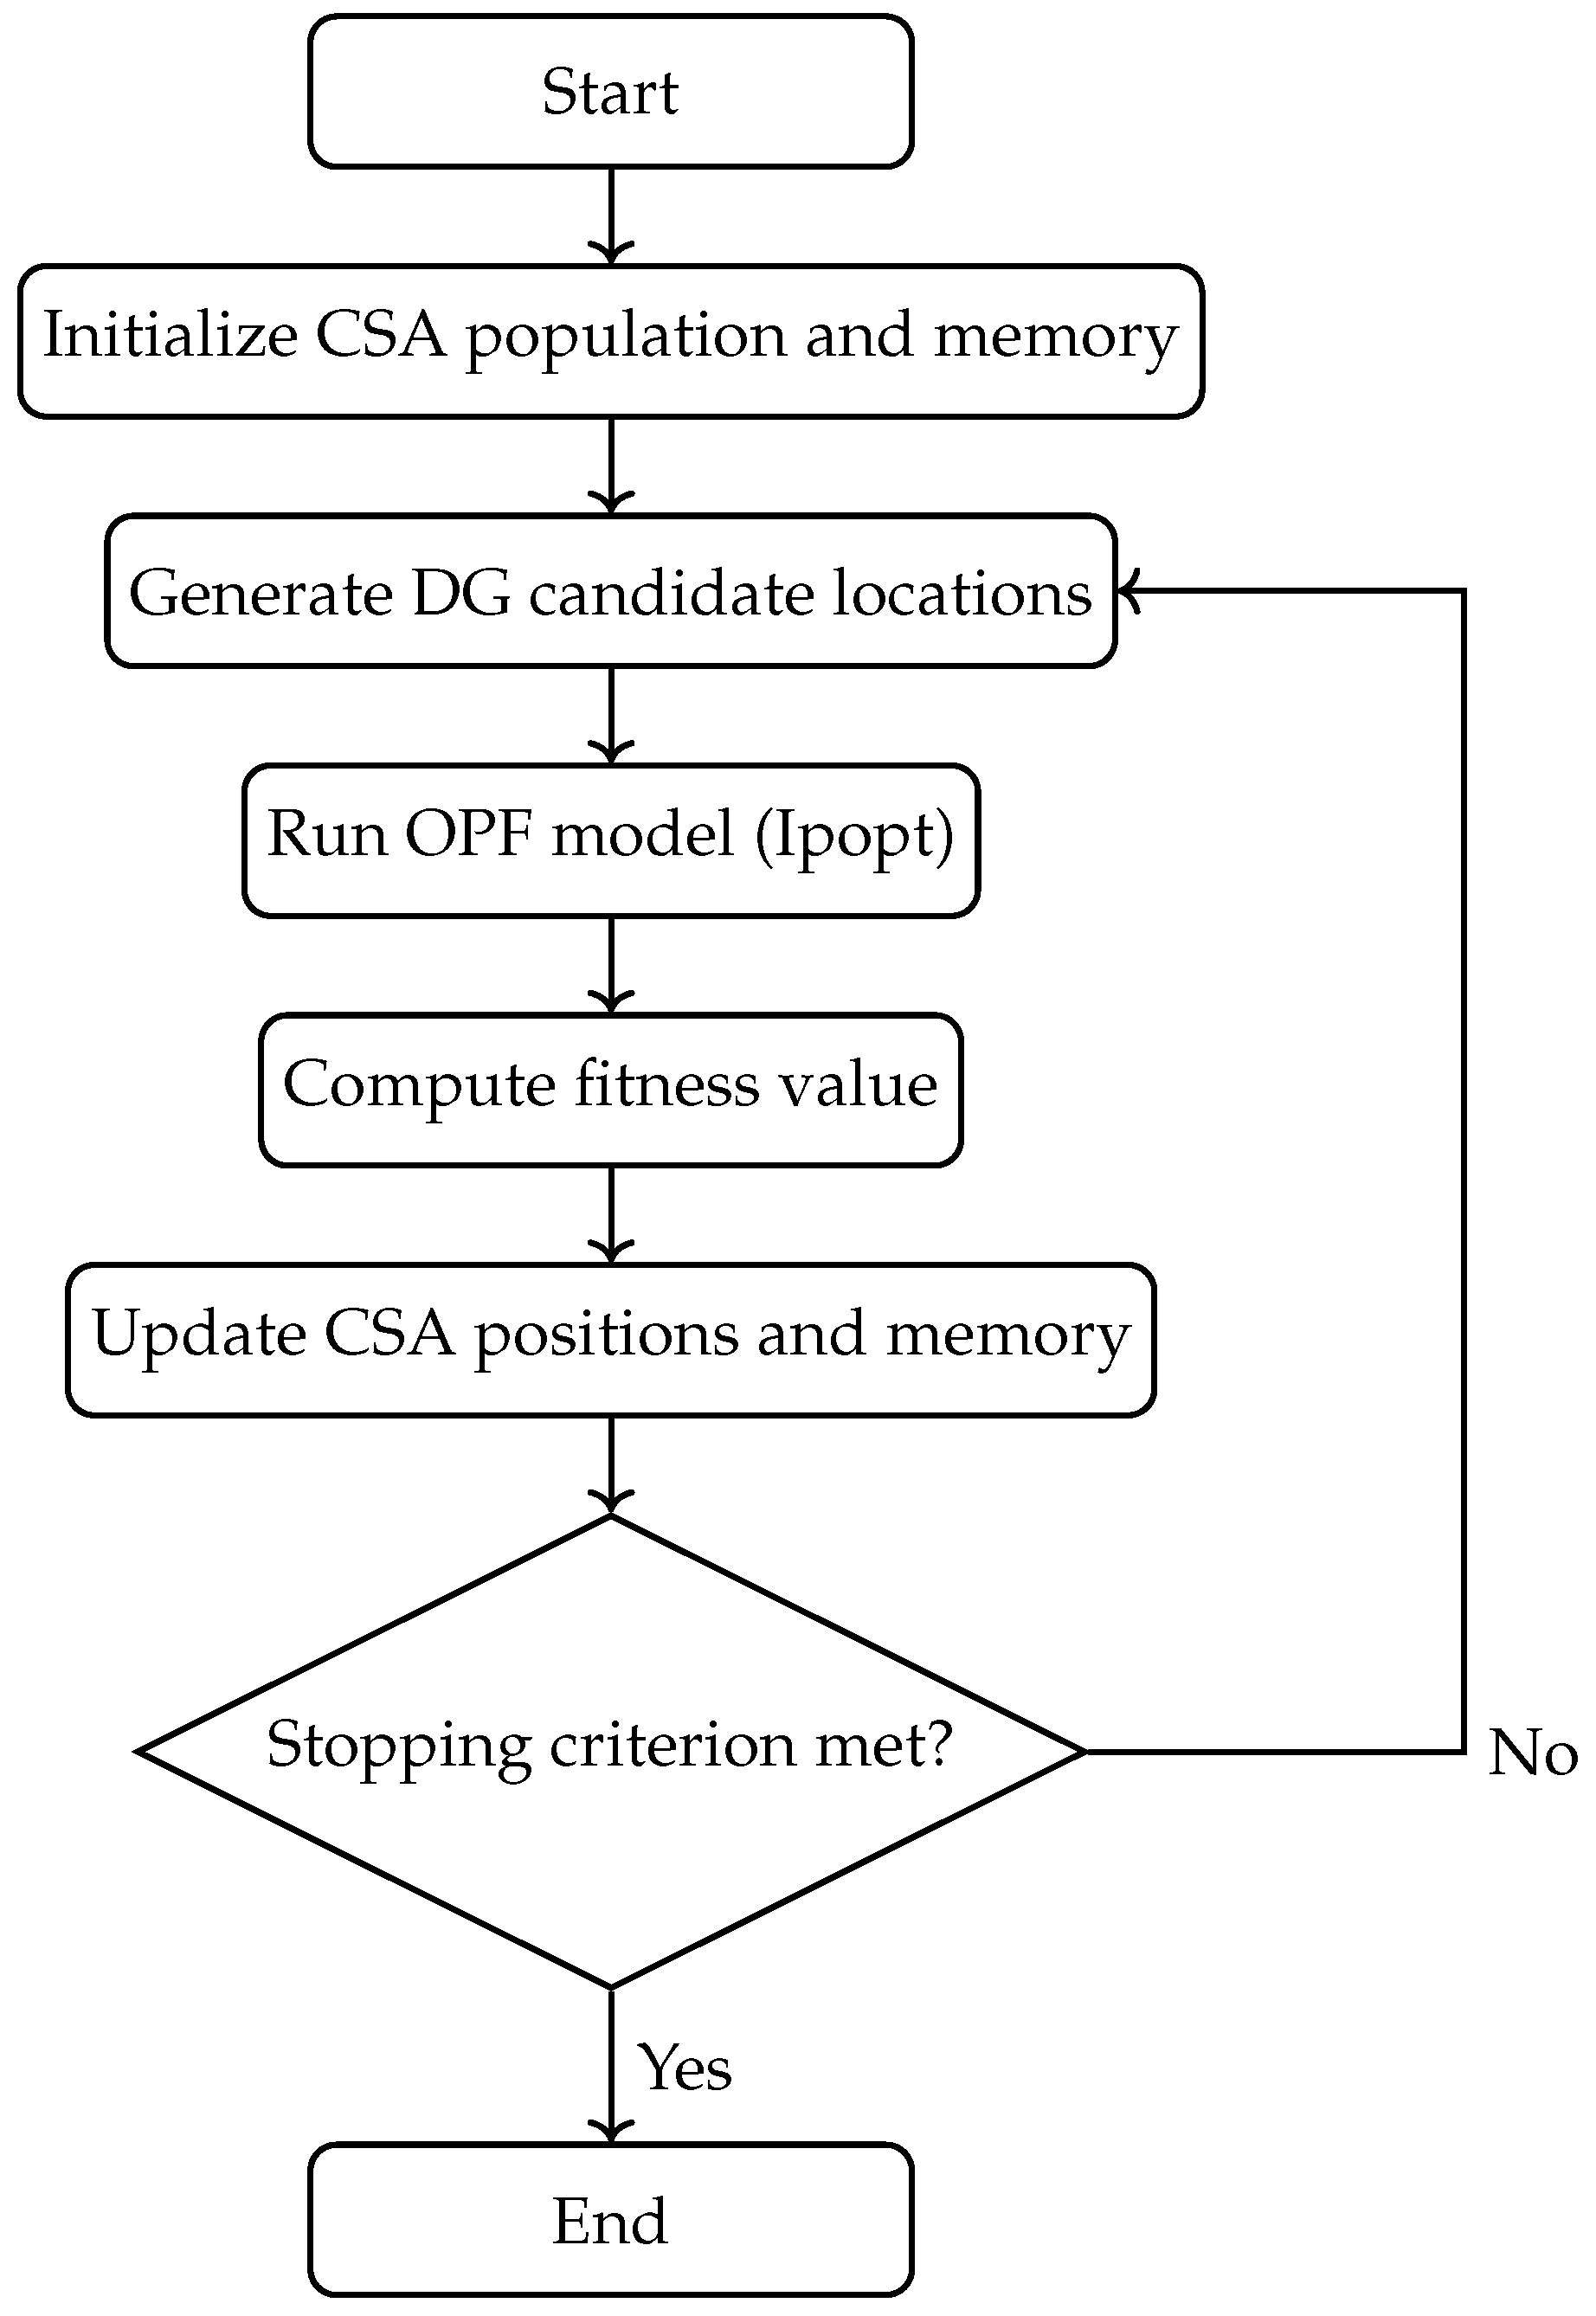
Figure 2 illustrates the flowchart of the proposed CSA–OPF optimization process. The procedure starts with the random initialization of the population and the assignment of memory structures to each individual, where each candidate solution represents a discrete configuration of PV-STATCOM locations within the distribution network.
Figure 2.
Flowchart of the CSA–OPF optimization process.
Subsequently, new candidate DG location configurations are generated according to the evolutionary rules of the crow search algorithm. Each configuration is evaluated through the execution of the optimal power flow Model, which determines the optimal active and reactive power dispatch of the PV-STATCOM units, verifies compliance with system technical constraints, and computes the corresponding objective function value related to energy losses and operating costs.
Based on the obtained fitness value, the algorithm updates the positions and memories of the individuals following an elitist selection strategy, retaining solutions that improve the global performance. This iterative process continues until the stopping criterion is met, either by reaching the maximum number of iterations or by detecting a lack of improvement over a predefined number of consecutive iterations. Finally, the algorithm reports the best solution found, corresponding to the optimal placement and sizing configuration of PV-STATCOM devices.
4. Test Systems
To validate and benchmark the proposed optimization methodology, this section presents the two widely recognized distribution network models employed as test systems throughout this study. The IEEE 33-bus and IEEE 69-bus systems serve as standard benchmarks in power system research, providing well-defined topologies, electrical parameters, and load profiles that enable a rigorous and reproducible performance evaluation. The following subsections detail their main characteristics, including network configuration, base operating conditions, and the time-varying load and generation profiles used to simulate realistic daily operation.
4.1. IEEE 33-Bus Distribution Network
To apply the methodology of this case study, the test system operates at a nominal voltage level of 12.66 kV and consists of 33 buses and 32 distribution lines. The total peak load demand is 3715 kW and 2300 kvar, while the active power losses at peak operating conditions are approximately 210.9876 kW. Bus 1 is defined as the slack node, supplying the remaining active power required by the network and maintaining the reference voltage magnitude.
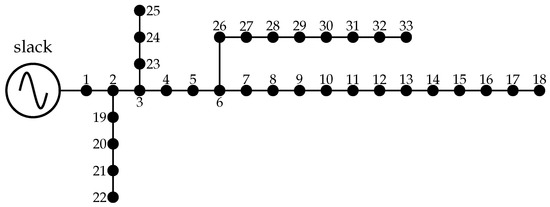
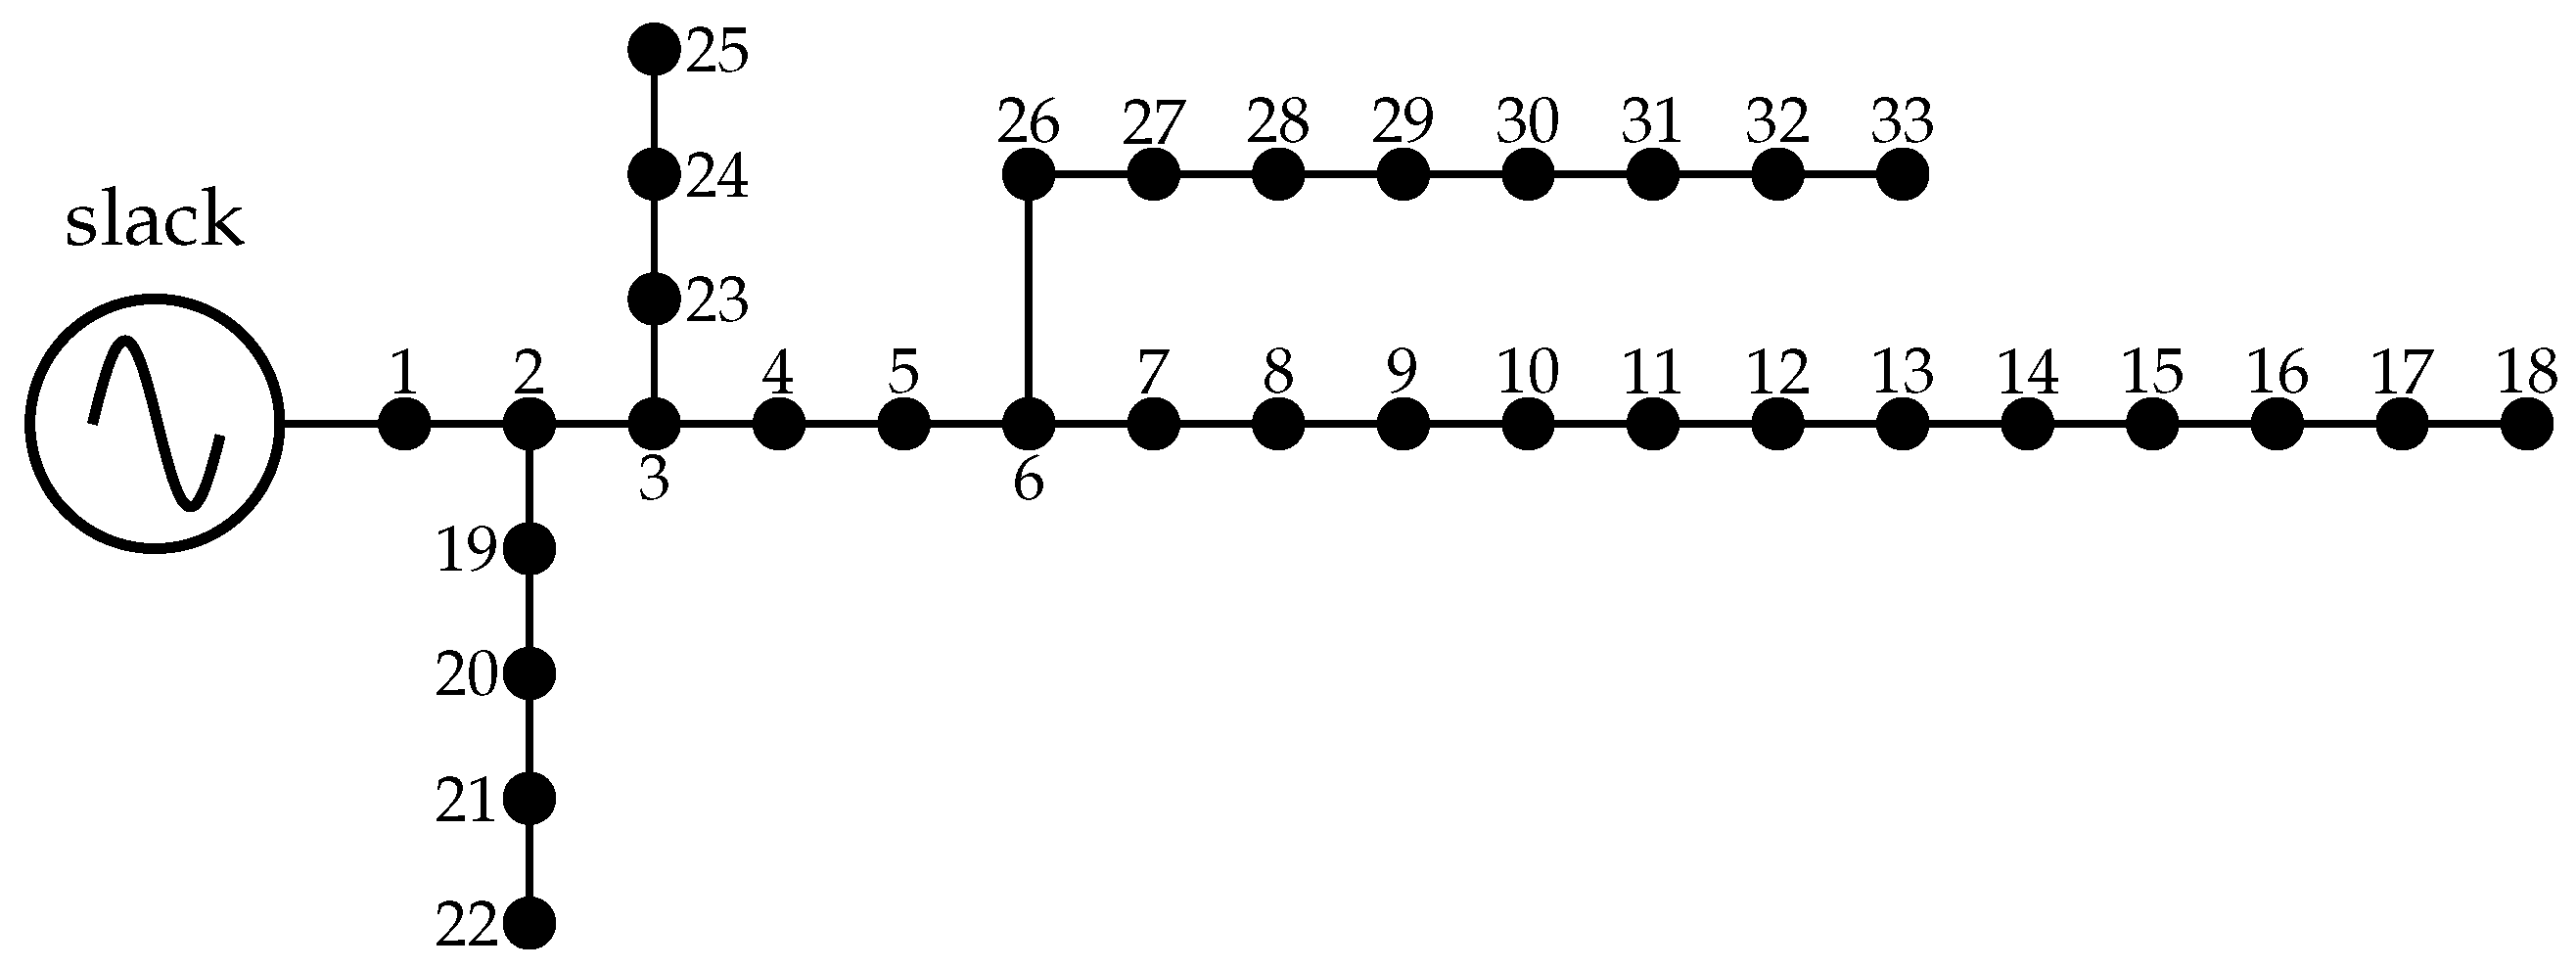
The electrical parameters of the distribution lines, including resistance and reactance values, as well as the active and reactive power demands at each bus, are summarized in Table 2. These parameters are taken from the standard IEEE 33-bus test system and are commonly adopted in PV-STATCOM planning studies, enabling a fair comparison with previously reported results. Figure 3 show the electrical diagram of the IEEE 33-node test system in its radial and meshed versions [24].
Table 2.
Main parameters for the 33-node test system.
Figure 3.
Electrical diagram of 33-bus radial test system.
4.2. IEEE 69-Bus Distribution Network
The network operates at a nominal voltage level of 12.66 kV and consists of 69 buses interconnected through 68 distribution lines arranged in a radial topology. The total peak load demand of the system is 3802.19 kW and 2694.60 kvar, while the active power losses under base operating conditions are approximately 224.92 kW. Bus 1 is designated as the slack bus, responsible for supplying the total power required by the network and establishing the reference voltage magnitude for the remaining buses [25].
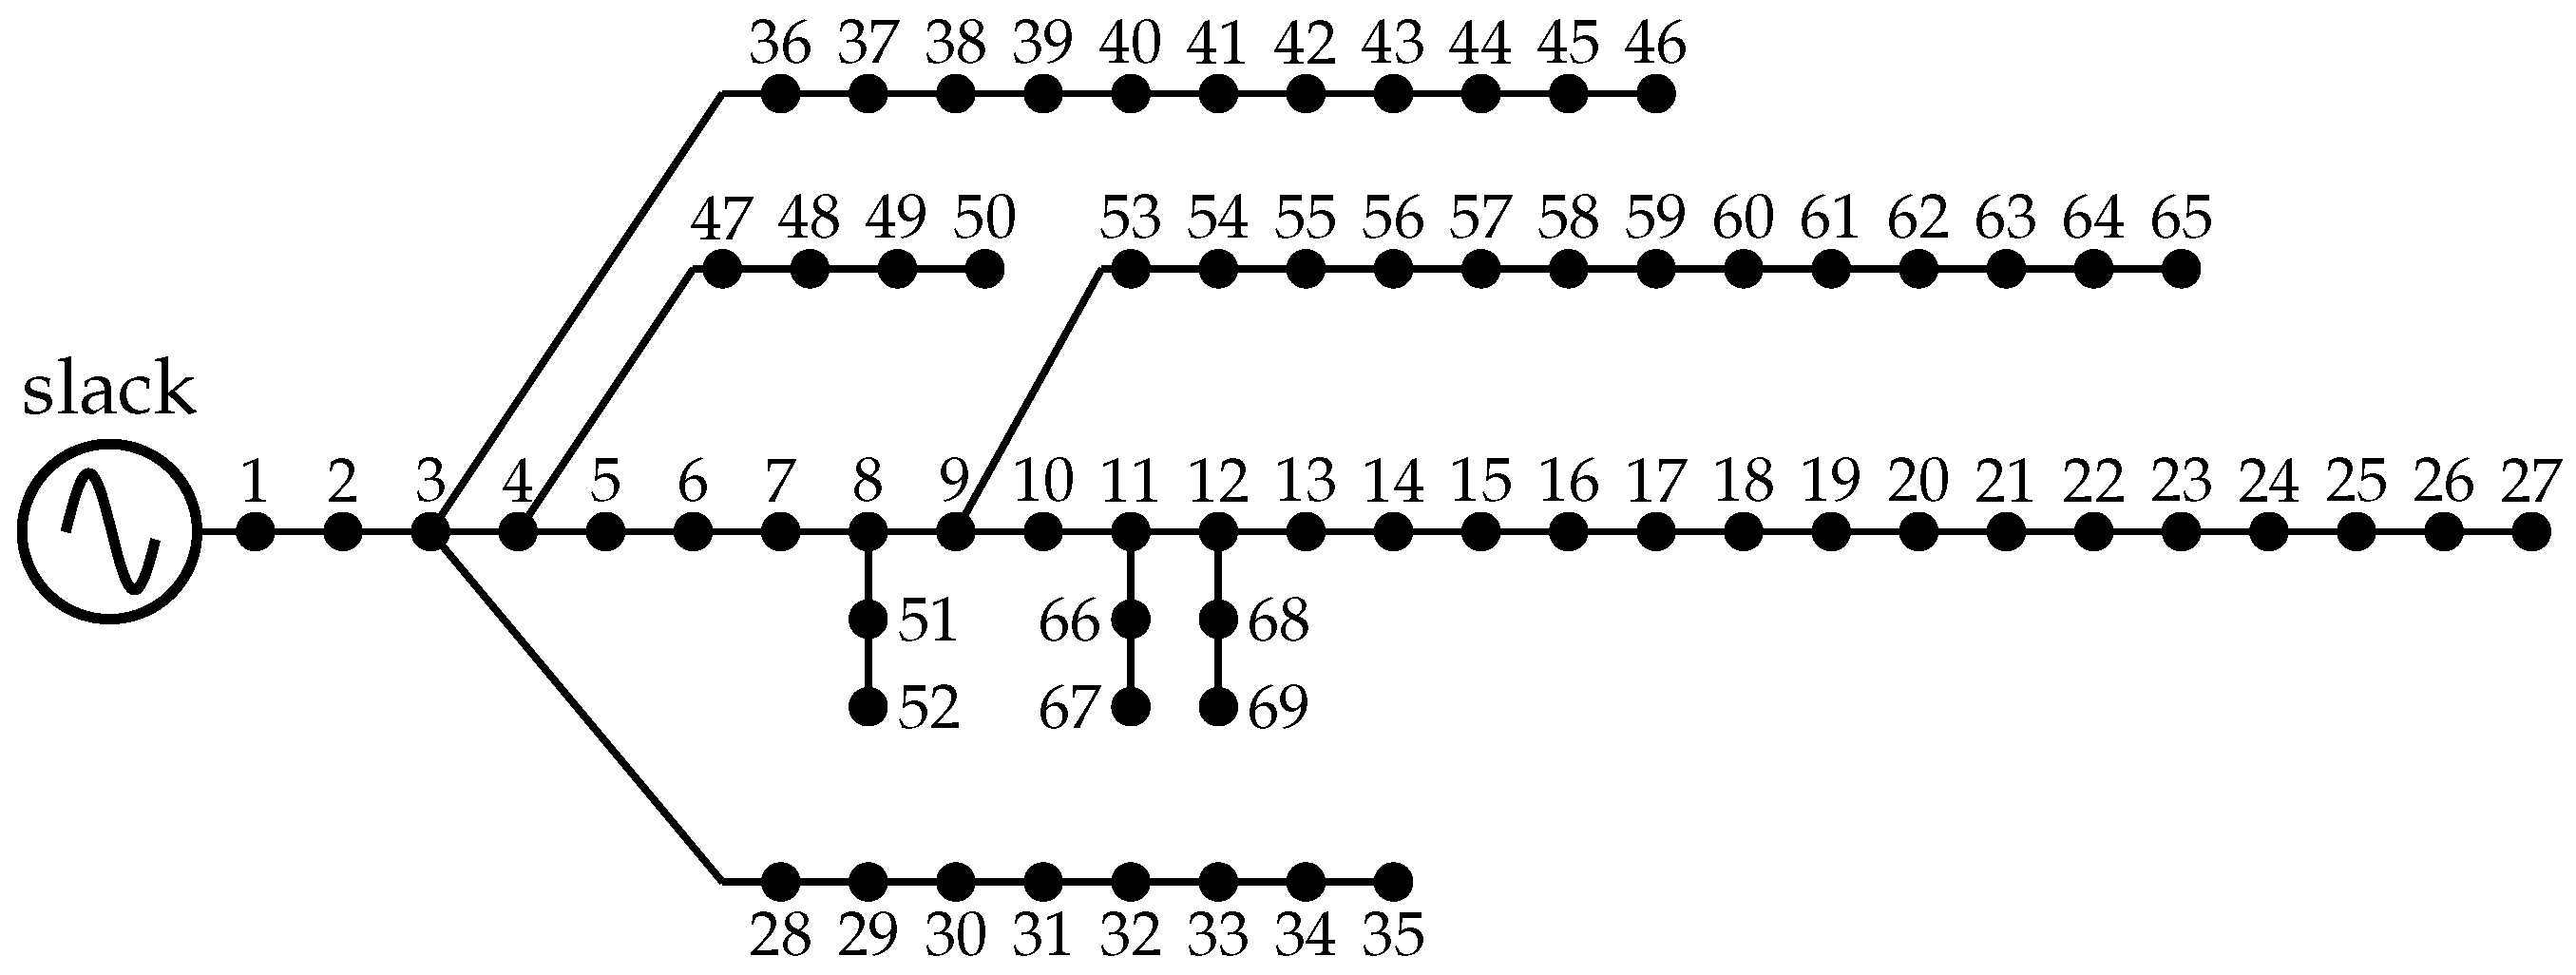
The electrical parameters of the distribution lines, including resistance and reactance values, along with the active and reactive power demands at each bus, are presented in Table 3. Figure 4 illustrates the single line diagram of the 69-bus distribution system.
Table 3.
Main parameters for the 69-node test system.
Figure 4.
Electrical diagram of 69-bus radial test system.
4.3. Load Demand and Solar Irradiance Profiles
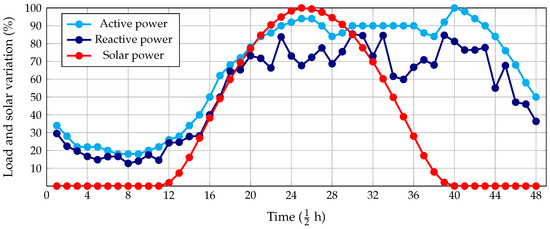
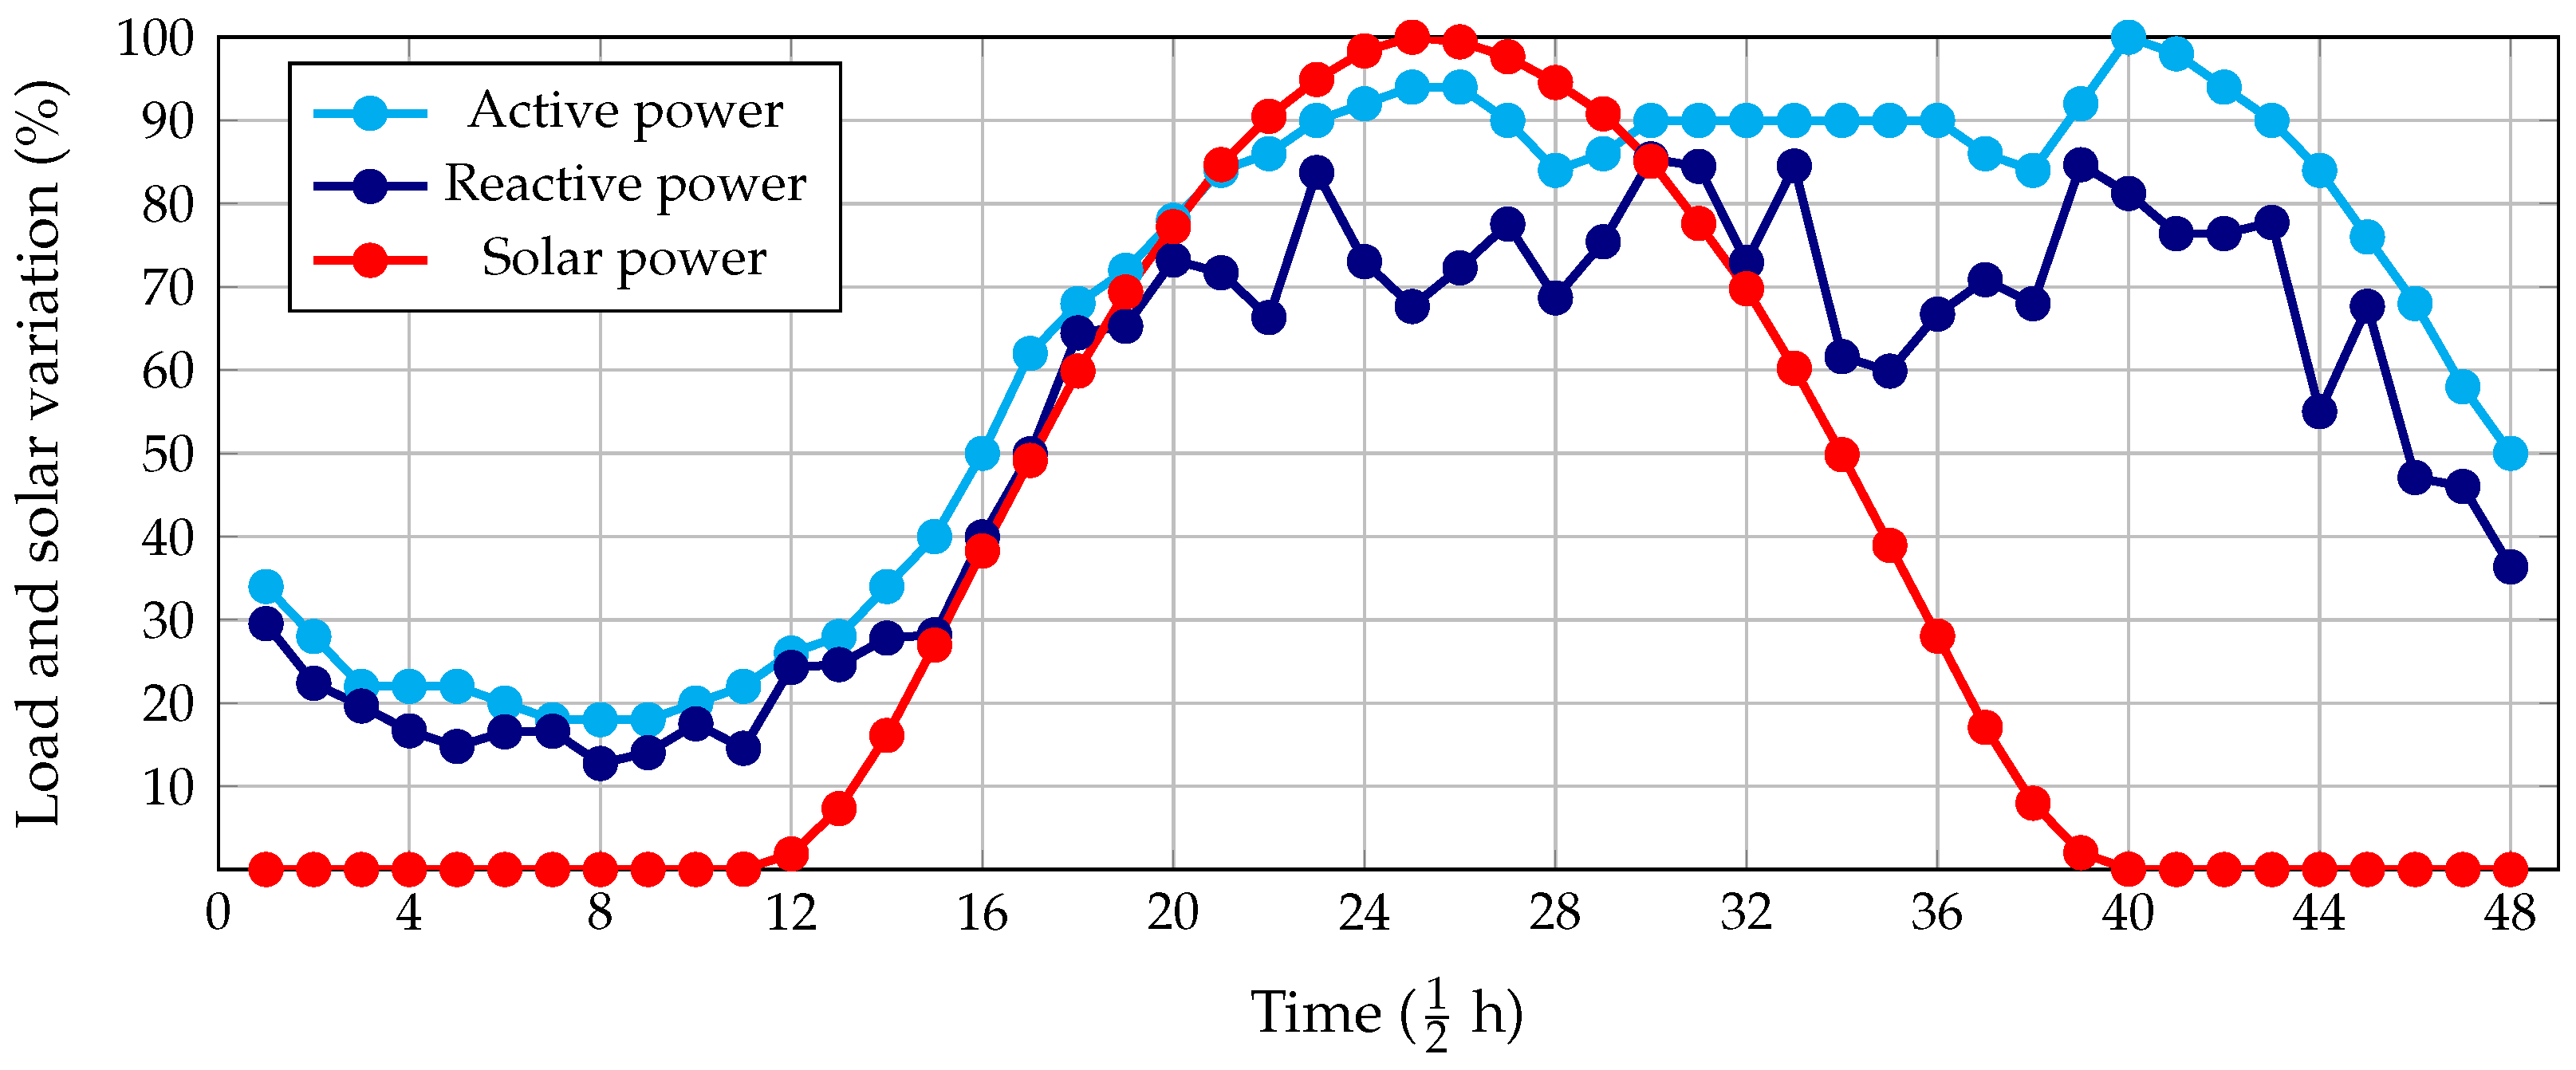
To represent daily operating conditions, a normalized 24 h load demand curve and a solar irradiance profile were considered, as shown in Figure 5. The load curve is used to scale the nominal active and reactive power demands at each bus, while the irradiance profile determines the hourly active power output of the photovoltaic units. These profiles are applied consistently to all test systems and time periods evaluated [26].
Figure 5.
Average solar generation and active and reactive power demand curve.
5. Results
This section presents and analyzes the results obtained from the implementation of the optimization methodology proposed in Section 3, applied to the test systems described in Section 4. The analysis focuses on assessing the performance of CSA for the optimal placement and sizing of PV-STATCOM units, considering relevant technical and economic performance indicators under daily operating scenarios.
The proposed methodology was implemented using the Julia programming language within the Visual Studio version 1.104.1, released on 19 September 2025 Code development environment, enabling an efficient integration between the metaheuristic optimizer and the multiperiod optimal power flow model. All simulations were carried out on a MacBook Air equipped with an Apple M3 processor (Apple Inc., Cupertino, CA, USA, 2025) and 16 GB of RAM, running macOS, which provided a suitable computational platform for repeated evaluations and convergence analysis of the proposed approach.
5.1. Additional Parametric Information
The main parameters used in the implementation of the CSA are listed in Table 4. These parameters are independent of the test system and were consistently adopted for all simulation scenarios analyzed in this work.
Table 4.
Additional parametric information of the CSA.
5.2. 33-Bus System
Table 5 summarizes the numerical results obtained for the IEEE 33-bus distribution system by comparing the base operating condition without PV-STATCOM units and the solutions derived from the proposed CSA-based optimization methodology. The table reports the optimal and statistical performance indicators of the objective function, expressed in terms of daily energy losses and the associated daily operating cost , for different population sizes .
Table 5.
Comparison of the base case and CSA-based optimization results for the 33-bus system.
- According to Table 5, the results for different population sizes are the base case, yielding a value of kWh/day and a of 15,411.46 USD/day. The best CSA solution reduces to kWh/day and the to USD/day, corresponding to an absolute reduction of 1625.68 kWh/day in the losses and a relative decrease of 70.44% compared to the base case per day.
- To evaluate the robustness and repeatability of the proposed approach, each population size was executed independently 10 times. Table 5 reports the best, , and standard deviation of . , and show low standard deviation , indicating high reproducibility across repetitions; presents higher dispersion . The early-stopping parameter (Early stopping ) efficiently avoids unnecessary OPF evaluations.
- The average number of iterations required for convergence ranges between 90 and 111 iterations, due to the implemented early stopping criterion. Larger populations tend to converge slightly faster in terms of effective iterations, suggesting improved exploration of the solution space and faster identification of high-quality solutions.
- As expected, computational time increases with population size due to the higher number of OPF evaluations. While larger populations enhance robustness, they also increase computational burden. Among the tested configurations, = 9 provides the best compromise between solution stability, convergence reliability, and computational efficiency.
To complement the statistical performance analysis, Table 6 presents the optimal placement and sizing of PV-STATCOM units for the 33-bus distribution system. The reported configuration corresponds to the solution achieving the minimum daily energy losses Eloss, obtained consistently across multiple CSA population sizes. This table provides the final planning decision derived from the proposed methodology, indicating the selected buses and the optimal apparent power rating of each installed PV-STATCOM unit.
Table 6.
Optimal placement and sizing of PV-STATCOM units for the 33-bus system.
The optimal sizing results in Table 6 show a moderate-to-high utilization of the available PV-STATCOM capacity, with the largest unit installed at bus 30, which is one of the most heavily loaded buses in the system. This configuration enables a substantial reduction in daily energy losses while ensuring that voltage magnitudes remain within the prescribed operational limits.
5.3. 69-Bus System
Table 7 summarizes the comparative results between the base case and the CSA-based solutions for different population sizes , including the minimum daily energy losses , statistical indicators, convergence characteristics, and computational effort.
Table 7.
Comparison of the base case and CSA-based optimization results for the 69-bus system.
- The 69-bus distribution system is first analyzed under a base operating condition, in which no PV-STATCOM units are installed. Under this scenario, the network exhibits high daily energy losses and elevated operating costs due to the absence of reactive power compensation and distributed generation support. The obtained base case results indicate daily energy losses of kWh/day, corresponding to an operating cost of 14,677.08 USD/day, which highlights the essential requirement of implementing advanced optimization strategies to improve the system performance.
- From the results reported in Table 7, it is observed that the proposed methodology achieves a substantial reduction in daily energy losses, decreasing from kWh/day in the base case to kWh/day in the optimized scenario. This represents a reduction of approximately 72.9%, which is directly reflected in the daily operating cost , reduced from USD/day to 3976.26 USD/day.
- Increasing the population size leads to an improvement in statistical robustness, as evidenced by the reduction in the standard deviation of the fitness values from for to for . However, this improvement does not yield a better optimal solution.
- For both population sizes, the algorithm converges well before reaching the maximum number of iterations . The average number of iterations required to reach convergence is 110 iterations for and 118 iterations for , confirming the effectiveness of the adopted early stopping criterion.
- Increasing the population size significantly increases the computational burden. In the 69-bus system, achieves the same optimal solution as while reducing the execution time from 101,115 s to 45,018 s, thus providing the most efficient trade-off.
Overall, the obtained results confirm the effectiveness of the proposed CSA OPF framework for large-scale distribution systems, demonstrating its capability to significantly reduce energy losses, improve operational efficiency, and provide stable and consistent solutions with a reasonable computational effort.
Table 8 presents the optimal placement and sizing of the PV-STATCOM units corresponding to the minimum energy loss solution obtained for the 69-bus distribution system.
Table 8.
Optimal placement and sizing of PV-STATCOM units for the 69-bus system.
Table 8 shows the results for both population sizes. The configurations and converge to the same global optimal solution, identifying buses , and 63 as the optimal locations for PV-STATCOM installation. This result demonstrates the robustness and consistency of the CSA algorithm, as the optimal placement and sizing remain invariant despite changes in the population size.
5.4. Complementary Ananlysis
Table 9 presents a comparison of PV-STATCOM loss minimization methods reported in the literature for the 33-bus distribution system. All approaches are evaluated under operating conditions that allow for the simultaneous injection of active and reactive power, oriented to minimizing losses in operating day.
Table 9.
Comparison of PV-STATCOM loss minimization results for the 33-bus system.
From the energy losses, the SOCP-based OPF formulation reports daily losses of kWh/day, achieving a reduction of 67.46% with respect to its benchmark case. Meanwhile, metaheuristic approaches such as AROA and HPO exhibit higher remaining loss levels, equal to kWh/day and kWh/day, respectively. Although both methods successfully reduce system losses compared to their corresponding base cases, their reported reductions remain below 60%, indicating a lower effectiveness in identifying highly efficient compensation configurations.
Compared to the SOCP-based approach, the proposed method reduces daily energy losses by approximately kWh/day. When contrasted with metaheuristic techniques such as HPO and AROA, the reduction exceeds 800 kWh/day. In practical terms, these differences translate directly into lower operational costs and reduced energy dissipation throughout the network, which becomes relevant when the results are extrapolated over long term operating horizons.
The proposed CSA-based OPF strategy achieves the lowest loss level among all compared methods, with kWh/day, corresponding to a loss reduction of 70.37%. This represents an improvement of approximately 2.9% over the SOCP-based solution and more than 13% compared to the best-performing metaheuristic method reported in the literature.
Table 10 shows the best results obtained by other metaheuristic algorithms reported in the literature, which are compared against those of the proposed methodology for the 69-bus test system.
Table 10.
Comparison of PV-STATCOM loss minimization results for the 69-bus system.
The SOCP-based approach reports daily losses of kWh/day, achieving a reduction of 70.32% with respect to the benchmark scenario. Metaheuristic techniques such as AROA and HPO exhibit significantly higher residual losses, with values exceeding 1600 kWh/day and loss reductions below 60%.
The proposed CSA-based OPF approach attains the lowest energy losses among all compared methods, reaching kWh/day, which represents a reduction of %. This result not only surpasses all heuristic-based approaches but also improves upon SOCP. CSA represents a reduction of approximately kWh/day compared to the SOCP-based method. Moreover, when compared to the AROA and HPO algorithms, the CSA reduces energy losses by more than 1020 kWh/day on average. These reductions highlight the effectiveness of the proposed methodology, as even moderate percentage improvements result in substantial energy savings and, consequently, lower operational costs when considered over extended operating periods.
6. Conclusions and Future Work
This paper presented an optimization framework for the optimal placement and sizing of PV-STATCOM units in radial distribution networks, formulated as a non-linear optimal power flow problem and solved using an optimization–evaluation strategy. In this framework, the crow search algorithm acts as the optimization engine, generating candidate locations and sizes for PV-STATCOM units, while the OPF model operates as an evaluation tool, computing network operating conditions, energy losses, and daily operating costs for each candidate solution. The proposed methodology explicitly incorporates daily load and irradiance profiles, voltage magnitude constraints, and network operational limits, enabling a realistic and comprehensive assessment of PV-STATCOM integration in distribution systems such as IEEE 33 and 69. According to the numerical results obtained in these test systems, the main conclusions of this study are presented below.
- The numerical results obtained for the 33-bus and 69-bus test systems confirm the effectiveness of the proposed OPF–CSA framework in reducing energy losses and daily operating costs. For the 33-bus system, the base case without PV-STATCOM units exhibits an energy loss of kWh/day and a daily operating cost of USD 15,411.46. After optimization, the minimum energy loss is reduced to kWh/day, corresponding to a reduction of approximately 70.4%, while the daily cost decreases to USD . Similarly, for the 69-bus system, the base case losses of kWh/day and daily cost of USD 14,677.08 are reduced to kWh/day and USD , respectively, representing a loss reduction of nearly 72.9%.
- The statistical indicators reported in Table 5 and Table 7 highlight the robustness and repeatability of the CSA when applied to the optimal placement and sizing problem. In both test systems, the best fitness values are consistently reached across multiple independent runs, with relatively low standard deviations. For instance, in the 69-bus system, the standard deviation decreases from for to for , indicating a more concentrated convergence behavior as the population size increases. Moreover, the coincidence of the best solutions across different runs confirms the absence of premature convergence and reinforces the reliability of the proposed optimization framework.
- The optimal solutions obtained for both test systems reveal consistent placement and sizing patterns. In the 33-bus system, PV-STATCOM units are installed at electrically weak buses located far from the slack node, where voltage drops and losses are more pronounced. A similar behavior is observed in the 69-bus system, where the optimal nodes are located in downstream sections of the feeder. The optimal sizes range between 29% and 79% of the maximum PV-STATCOM capacity, indicating that partial utilization of the installed capacity is sufficient to achieve significant performance improvements. These findings confirm that the proposed method effectively captures the electrical characteristics of the network when determining both location and size.
- The comparative analysis conducted for the IEEE 33- and 69-bus systems demonstrates that the proposed CSA approach is capable of achieving energy loss reductions that are competitive and consistent to those reported by recent literature methodologies. In both test systems, the CSA solution attains the lowest energy loss levels while maintaining the same number of PV-STATCOM units, outperforming metaheuristic strategies such as AROA and HPO, as well as convex optimization formulations under comparable operating scenarios. These results confirm that the proposed methodology not only provides high-quality solutions in terms of loss minimization but also exhibits strong scalability and robustness when applied to distribution networks of increasing size and complexity.
Future research may extend this work in several complementary directions. From a modeling perspective, the proposed framework can be expanded to incorporate additional distributed energy resources, such as battery energy storage systems and -vehicle-charging infrastructure, enabling coordinated planning studies. Methodologically, the adoption of stochastic, scenario-based, or robust optimization approaches would allow for a more explicit treatment of uncertainties associated with load demand, renewable generation, and market conditions. To better reflect real-world operating environments, future studies may consider unbalanced three-phase distribution network models, comprehensive techno-economic assessments including capital investment and maintenance costs of PV-STATCOM deployment, and the integration of planning-oriented optimization with detailed time-domain dynamic simulations to assess transient stability and inverter control interactions. Finally, computational enhancements through parallel computing or surrogate modeling, together with validation using real network data and benchmarking against state-of-the-art techniques, represent important steps toward large-scale and practical applications.
Author Contributions
Conceptualization, methodology, software, and writing (review and editing): D.S.C.-G., H.D.S.-C., O.D.M. and D.S.G.-R. All authors have read and agreed to the published version of the manuscript.
Funding
The authors acknowledge the support provided by Thematic Network 723RT0150, i.e., Red para la integración a gran escala de energías renovables en sistemas eléctricos (RIBIERSE-CYTED), funded through the 2022 call for thematic networks of the CYTED (Ibero-American Program of Science and Technology for Development). The third author would like to thank Oficina de Investigaciones at Universidad Distrital Francisco José de Caldas for supporting the internal research project with code 33787724, titled “Desarrollo de una metodología de gestión eficiente de potencia reactiva en sistemas de distribución de media tensión empleando modelos de programación no lineal”.
Institutional Review Board Statement
Not applicable.
Informed Consent Statement
Not applicable.
Data Availability Statement
The original contributions presented in this study are included in this article. Further inquiries can be directed to the corresponding author.
Acknowledgments
The authors acknowledge the use of AI-based tools, including OpenAI’s ChatGPT Version 5.1, which supported the refinement of this manuscript’s language, structure, and overall clarity. These tools were utilized exclusively to improve the presentation and readability of the original ideas, formulations, and numerical simulations provided by the authors. Importantly, the AI tools did not contribute to the development of the scientific content, to the formulation, or the validity of the results, for which the authors assume full responsibility.
Conflicts of Interest
The authors declare no conflicts of interest.
References
- Mehrabani, A.; Allah Aalami, H.; Pirayesh Neghab, A. Integrated planning framework for microgrid incorporating the flexibility provision capabilities of demand response programs. Int. J. Electr. Power Energy Syst. 2024, 155, 109521. [Google Scholar] [CrossRef] [Scilit]
- Mubarak, H.; Muhammad, M.A.; Mansor, N.N.; Mokhlis, H.; Ahmad, S.; Ahmed, T.; Sufyan, M. Operational Cost Minimization of Electrical Distribution Network during Switching for Sustainable Operation. Sustainability 2022, 14, 4196. [Google Scholar] [CrossRef] [Scilit]
- Varma, R.K.; Siavashi, E.; Mohan, S.; McMichael-Dennis, J. Grid Support Benefits of Solar PV Systems as STATCOM (PV-STATCOM) Through Converter Control: Grid Integration Challenges of Solar PV Power Systems. IEEE Electrif. Mag. 2021, 9, 50–61. [Google Scholar] [CrossRef] [Scilit]
- Pattanaik, B.; Balachandran, R.; Prakash, S.; Haro, R.D. PV-STATCOM based smart inverter for reliable distribution system. In Proceedings of the 2021 5th International Conference on Intelligent Computing and Control Systems (ICICCS), Madurai, India, 6–8 May 2021; pp. 733–738. [Google Scholar] [CrossRef] [Scilit]
- Luo, L.; Gu, W.; Zhang, X.P.; Cao, G.; Wang, W.; Zhu, G.; You, D.; Wu, Z. Optimal siting and sizing of distributed generation in distribution systems with PV solar farm utilized as STATCOM (PV-STATCOM). Appl. Energy 2018, 210, 1092–1100. [Google Scholar] [CrossRef] [Scilit]
- Mahmoud, K.; Abdel-Nasser, M.; Lehtonen, M.; Hussein, M.M. Optimal Voltage Regulation Scheme for PV-Rich Distribution Systems Interconnected with D-STATCOM. Electr. Power Components Syst. 2020, 48, 2130–2143. [Google Scholar] [CrossRef] [Scilit]
- Garrido-Arévalo, V.M.; Gil-González, W.; Montoya, O.D.; Chamorro, H.R.; Mírez, J. Efficient Allocation and Sizing the PV-STATCOMs in Electrical Distribution Grids Using Mixed-Integer Convex Approximation. Energies 2023, 16, 7147. [Google Scholar] [CrossRef] [Scilit]
- Shaheen, A.M.; El-Sehiemy, R.A.; Ginidi, A.; Elsayed, A.M.; Al-Gahtani, S.F. Optimal Allocation of PV-STATCOM Devices in Distribution Systems for Energy Losses Minimization and Voltage Profile Improvement via Hunter-Prey-Based Algorithm. Energies 2023, 16, 2790. [Google Scholar] [CrossRef] [Scilit]
- Mishra, R.R.; Tripathi, P. Recent Developments in PV—Static Synchronous Compensator. In Proceedings of the 2020 2nd International Conference on Innovative Mechanisms for Industry Applications (ICIMIA), Bangalore, India, 5–7 March 2020; pp. 658–664. [Google Scholar] [CrossRef] [Scilit]
- Elshahed, M.; Tolba, M.A.; El-Rifaie, A.M.; Ginidi, A.; Shaheen, A.; Mohamed, S.A. An Artificial Rabbits’ Optimization to Allocate PVSTATCOM for Ancillary Service Provision in Distribution Systems. Mathematics 2023, 11, 339. [Google Scholar] [CrossRef] [Scilit]
- Abualigah, L.; Faweer, S.; Raza, A.; Gul, F.; Ezugwu, A.E.; Alshinwan, M.; Nasar, M.R.A.; Mughaid, A.; AlZu’bi, S. Crow search algorithm: A survey of novel optimizer and its recent applications. In Metaheuristic Optimization Algorithms; Elsevier: Amsterdam, The Netherlands, 2024; pp. 167–176. [Google Scholar] [CrossRef] [Scilit]
- Guzmán-Henao, J.A.; Cortés-Caicedo, B.; Restrepo-Cuestas, B.J.; Bolaños, R.I.; Grisales-Noreña, L.F. Optimal integration of photovoltaic generators into urban and rural power distribution systems. Sol. Energy 2024, 270, 112400. [Google Scholar] [CrossRef] [Scilit]
- Combita-Murcia, J.D.; Romero-Salcedo, C.A.; Montoya, O.D.; Giral-Ramírez, D.A. Dynamic compensation of active and reactive power in distribution systems through PV-STATCOM and metaheuristic optimization. Results Eng. 2024, 22, 102195. [Google Scholar] [CrossRef] [Scilit]
- Ebrahimi, A.; Moradlou, M.; Bigdeli, M.; Mashhadi, M.R. Optimal sizing and allocation of PV-DG and DSTATCOM in the distribution network with uncertainty in consumption and generation. Discov. Appl. Sci. 2025, 7, 411. [Google Scholar] [CrossRef] [Scilit]
- Sirjani, R. Optimal Placement and Sizing of PV-STATCOM in Power Systems Using Empirical Data and Adaptive Particle Swarm Optimization. Sustainability 2018, 10, 727. [Google Scholar] [CrossRef] [Scilit]
- Varma, R.K. PV-STATCOM APPLICATIONS IN DISTRIBUTION SYSTEMS. In Smart Solar PV Inverters with Advanced Grid Support Functionalities; Wiley: Hoboken, NJ, USA, 2022; pp. 145–204. [Google Scholar] [CrossRef] [Scilit]
- He, J.; Peng, Z.; Zhang, L.; Zuo, L.; Cui, D.; Li, Q. Enhanced crow search algorithm with multi-stage search integration for global optimization problems. Soft Comput. 2023, 27, 14877–14907. [Google Scholar] [CrossRef] [Scilit] [PubMed]
- Hussien, A.G.; Amin, M.; Wang, M.; Liang, G.; Alsanad, A.; Gumaei, A.; Chen, H. Crow Search Algorithm: Theory, Recent Advances, and Applications. IEEE Access 2020, 8, 173548–173565. [Google Scholar] [CrossRef] [Scilit]
- Lee, D.; Kim, J.; Shon, S.; Lee, S. An Advanced Crow Search Algorithm for Solving Global Optimization Problem. Appl. Sci. 2023, 13, 6628. [Google Scholar] [CrossRef] [Scilit]
- Wang, T.; Zhang, C.; He, A.; Dong, W. Overview of Crow Search Algorithm. J. Phys. Conf. Ser. 2022, 2258, 012017. [Google Scholar] [CrossRef] [Scilit]
- Esmaeel Nezhad, A.; Tavakkoli Sabour, T.; Joshi, R.P.; Sadegh Javadi, M.; Nardelli, P.H.J. Robust Chance-Constrained Scheduling of Medium-Voltage Networks in the Presence of Distributed Energy Resources. IEEE Access 2025, 13, 203501–203518. [Google Scholar] [CrossRef] [Scilit]
- Yang, C.; Sun, Y.; Zou, Y.; Zheng, F.; Liu, S.; Zhao, B.; Wu, M.; Cui, H. Optimal Power Flow in Distribution Network: A Review on Problem Formulation and Optimization Methods. Energies 2023, 16, 5974. [Google Scholar] [CrossRef] [Scilit]
- Cosovic, M.; Kundacina, O.; Delalic, M.; Teskeredzic, A.; Raca, D.; Mesanovic, A.; Miskovic, D.; Vukobratovic, D.; Monti, A. JuliaGrid: An open-source julia-based framework for power system state estimation. Sustain. Energy, Grids Netw. 2026, 45, 102073. [Google Scholar] [CrossRef] [Scilit]
- Venkatesh, B.; Ranjan, R. Optimal radial distribution system reconfiguration using fuzzy adaptation of evolutionary programming. Int. J. Electr. Power Energy Syst. 2003, 25, 775–780. [Google Scholar] [CrossRef] [Scilit]
- Sahoo, N.; Prasad, K. A fuzzy genetic approach for network reconfiguration to enhance voltage stability in radial distribution systems. Energy Convers. Manag. 2006, 47, 3288–3306. [Google Scholar] [CrossRef] [Scilit]
- Montoya, O.D.; Gil-González, W. Dynamic active and reactive power compensation in distribution networks with batteries: A day-ahead economic dispatch approach. Comput. Electr. Eng. 2020, 85, 106710. [Google Scholar] [CrossRef] [Scilit]



Disclaimer/Publisher’s Note: The statements, opinions and data contained in all publications are solely those of the individual author(s) and contributor(s) and not of MDPI and/or the editor(s). MDPI and/or the editor(s) disclaim responsibility for any injury to people or property resulting from any ideas, methods, instructions or products referred to in the content. |
© 2026 by the authors. Licensee MDPI, Basel, Switzerland. This article is an open access article distributed under the terms and conditions of the Creative Commons Attribution (CC BY) license.