


Abstract
Digital Twin technologies in maritime applications have primarily focused on individual subsystems, such as vessel machinery, navigation, or environmental monitoring, while limited attention has been given to the integrated representation of human operators, vessel dynamics, machinery, and environmental conditions. To address this challenge, a conceptual Virtual Symbiotic Environment for Maritime Operations (VSEMO) is proposed; the VSEMO integrates human, traffic, docking, environmental, and machinery Digital Twins within a closed-loop system engineering framework. The proposed architecture incorporates Explainable Artificial Intelligence to support transparent operational risk assessment and decision support, while immersive virtual reality provides a realistic environment for adaptive operator training. As an initial proof of concept, a Graph Convolutional Network is developed using synthetic graph-based operational scenarios to demonstrate the feasibility of jointly estimating subsystem-level and aggregate operational risk indicators. Although the computational implementation is limited to snapshot-based synthetic data, the proposed framework establishes a scalable and modular foundation for future real-time Digital Twin ecosystems that integrate physiological sensing, vessel telemetry, environmental information, and explainable artificial intelligence for maritime training and decision support.
1. Introduction
Modern maritime operations require a comprehensive approach to safety and operational efficiency, one that considers the dynamics of the vessel [1], the cognitive and physical limits of human operators [2], and the environmental conditions of the ocean [3]. These elements have been evaluated in isolation, leaving critical gaps in real-time risk assessment and decision support. To overcome this limitation, the maritime industry requires advanced digital frameworks capable of unifying these domains into a single and cohesive ecosystem. Meanwhile, the digitalization of the world has facilitated the development of advanced technological solutions, including cloud computing, the Internet of Things (IoT), virtual reality (VR), augmented reality (AR), and artificial intelligence (AI). These advances have enabled the materialization of cyber-physical systems (CPS), which fuse the physical world with cyberspace and introduce the paradigm of digital twins (DTs) [4].
DTs are virtual representations of physical objects, systems, or processes that are continuously updated with real-time data from their physical counterparts [5]. By processing sensor data through advanced algorithms, DTs serve as comprehensive decision-support systems capable of monitoring, analyzing, and predicting system behavior [6]. Furthermore, their bidirectional data connection enables real-world task replication throughout the product lifecycle. This capability is particularly valuable for complex, large-scale, or high-cost physical systems, as they allow extensive experimentation while significantly reducing operational time and expenses [5].
While DTs and human digital twins (HDTs) have gained relevance across industrial and healthcare sectors [7], their application in maritime operations remains underdeveloped. In this domain, DTs enable risk-free simulation of vessel systems and navigation algorithms, while HDTs allow researchers to evaluate human factors which, alongside adverse weather, drive most maritime accidents [8]. However, there is a lack of a comprehensive framework integrating vessel systems, weather stressors, and human behavior to analyze their joint interactions in maritime operations.
To address current limitations in maritime risk management, this study proposes a comprehensive framework that integrates DT technology to enhance maritime operations through the fusion of human factors, vessel dynamics, and environmental conditions. Grounded in research gaps identified in recent literature, the concept of Virtual Symbiotic Environment for Maritime Operations (VSEMO) is introduced as a novel closed-loop systems engineering architecture that unifies HDTs, vessel machinery DTs, and environmental DTs, being the environment, all the elements surrounding the vessel [9], into a cohesive ecosystem. By incorporating explainable AI (XAI) and VR, the VSEMO framework processes multi-domain data to provide transparent operational risk assessments and adaptive decision support for complex maritime maneuvers.
This paper is organized as follows: Section 2 establishes the background to contextualize this study. Section 3 presents a state-of-the-art review to identify the literature gaps that were considered for the proposed VSEMO. Section 4 outlines the conceptual framework for the VSEMO, detailing the criteria for selecting the maritime operation and the initial stages of the VR environment driven by AI-generated synthetic data. Finally, Section 5 concludes the paper by summarizing the impact of DTs on maritime operations, the strengths and current limitations of the proposed VSEMO, and outlining future research directions.
2. Background
The concept of DT originated during NASA’s Apollo program, where physical replicas mirrored spacecraft status to prevent catastrophic mission failures [10]. The term was later formalized by Michael Grieves in Product Lifecycle Management (PLM) as a virtual construct describing a physical asset [11]. DTs have evolved into complex cyber-physical ecosystems across manufacturing, energy, transportation, and healthcare, driven by continuous bidirectional data flows and the convergence of enabling technologies, such as IoT, 5G, edge computing, and AI. In fact, the extensive use of information and communication technologies (ICTs) and advanced manufacturing technologies (AMT) has been crucial to creating an intelligent industry [12]. Key milestones in this evolution are presented in Figure 1 according to [13].
Figure 1.
Milestones of DTs. Adapted from [13], five-dimensional DT model obtained from [14].
A DT comprises three core elements: a physical asset, its virtual representation, and a bidirectional communication link that enables real-time synchronization between both domains [11]. These foundational capabilities have driven adoption across industries, with manufacturing accounting for approximately one-third of all reported DT applications [12].
While DT implementations vary across different domains, an accepted definition is a “digital copy of a real factory, machine, worker, etc., that is created and can be independently expanded, automatically updated, and globally available in real time” [15]. On the other hand, DT performance relies on datasets covering normal and abnormal operating conditions. Incomplete or unrepresentative data degrades the fidelity of the model, impacting essential functions such as system tuning, process optimization, and operational decision-making [16].
2.1. Environmental and Weather Digital Twins
Although often used interchangeably, environment and weather have different meanings; weather denotes short-term atmospheric states, whereas environment encompasses all the elements in the ecosystem [9]. Advances in numerical prediction, ensemble forecasting, and AI have enabled environmental DTs, ranging from marine models to global initiatives like Destination Earth (DestinE) [17,18,19,20]. Marine DTs represent oceanographic dynamics to evaluate hypothetical scenarios and monitor risk by integrating simulations, observations, and machine learning (ML) algorithms as shown in Figure 2 [3,20,21,22].
Figure 2.
Weather and climate digital twin. Adapted from [23].
However, their implementation faces three major obstacles: sparse sensor coverage across vast spatial scales, the impossibility of direct physical feedback on natural ocean systems, and severe computational demands [3]. In real-time ship operations, these challenges translate into two primary barriers: predicting deterministic wave behavior along a vessel’s trajectory [1,3], and executing high-fidelity motion predictions instantaneously to support proactive operational adjustments [1].
2.2. Human Digital Twins
HDTs have emerged within Industry 5.0 and human-centered paradigms as personalized digital representations integrating physical, physiological, cognitive, and behavioral dimensions through continuously updated data [24,25]. Given the extreme complexity of full human modeling, current research utilizes partial HDTs focused on specific performance traits [25]. Based on the foundational definition of DTs [11], the HDT framework connects the physical operator with a virtual model via a bidirectional interface, fostering a symbiotic interaction that enhances human capabilities. By continually assessing physiological and cognitive states, HDTs dynamically adapt to user performance [26], as illustrated in Figure 3.
Figure 3.
HDT compared with a traditional DT.
Unlike traditional DTs, HDTs explicitly model human behavior, physiological states, and cognitive dynamics alongside physical systems [27]. Capturing these multidimensional traits requires sensor data updated in real-time with non-physical factors, such as stress, fatigue, and emotional response, that influence operational decision-making [26,28,29]. However, HDT implementation faces two primary barriers: technical challenges in harmonizing heterogeneous data standards across monitoring devices, and critical privacy concerns regarding sensitive personal data management.
2.3. Implementation of Artificial Intelligence to Assist Maritime Operations
In critical environments like maritime operations, explainable AI (XAI) has become essential for building operator trust, transparency, and regulatory compliance within the paradigms of Industry 4.0 and 5.0 [30,31]. In the context of maritime operations, real-time XAI transforms black-box algorithms into accountable decision-support systems, providing officers with interpretable, actionable guidance under strict time constraints [30,32].
Integrating XAI with DTs enables continuous anomaly detection, real-time risk assessment, and adaptive operator intervention [33]. By combining feature importance with counterfactual and causal reasoning, XAI allows officers to evaluate alternative operational outcomes, significantly strengthening mental models and decision confidence during complex navigation scenarios [32,34].
However, deploying XAI in DT architecture poses computational and usability challenges. Edge-processing bottlenecks need model optimization techniques such as pruning and quantization [35], while sensor noise demands robust real-time verification frameworks [36]. Furthermore, to bridge the usability gap for operators under operational stress, XAI interfaces must use role-adaptive explanatory interfaces that tailor information complexity to users’ specific operational needs [37].
2.4. Potential of Digital Twins in Maritime Operations
While marine operations focus on the physical ocean environment, maritime operations encompass human navigation, vessel traffic, commerce, and governance [38,39,40,41,42]. Within this domain, DTs have reached operational maturity, enhancing ship efficiency, predictive maintenance, and vessel autonomy [43,44]. By establishing high-fidelity virtual mappings, vessel DTs accurately model ship behavior under environmental, operational, and regulatory constraints [45]. Figure 4 illustrates a framework for modeling a vessel system through DT architecture.
Figure 4.
DT in maritime operations.
Beyond vessel machinery, integrating the human operator into the real-time simulation loop represents a critical frontier [10]. Given that most maritime accidents are related to human factors [46], monitoring cognitive workload, fatigue, and decision-making states is essential for operational safety. HDTs address this need by evaluating operator performance, optimizing human-machine interfaces (HMIs), and refining bridge resource management (BRM) strategies [2]. Ultimately, human-centric DTs provide deep educational value by powering responsive virtual learning environments [47]. By continuously integrating real-time performance metrics and operator feedback, these interactive simulations can improve situational awareness, communication, and decision-making during complex maritime maneuvers [2,47].
3. Literature Review
To contextualize the proposed architecture, this section provides a targeted synthesis of state-of-the-art developments in DTs applied to maritime operations. By examining existing vessel machinery DTs and operators HDTs, this section identifies advancements and highlights research gaps. This literature synthesis establishes the theoretical necessity for the VSEMO framework, demonstrating the need for an integrated closed-loop ecosystem tailored for advanced seafarer training and operational risk management.
3.1. Seafarer Behavioral Assessment and Human Digital Twins
Integrating the human element into maritime DTs has evolved from physical ergonomics to complex cognitive modeling. Current research leverages HTDs across four operational layers: workplace ergonomics, physiological tracking, simulation-based training, and cognitive architecture [2,48,49,50,51,52]. While early industrial implementations focused on optimizing physical safety and outfitting assembly via 3D replicas and AR [48,49], maritime applications have increasingly shifted to real-time vessel operations and seafarer performance.
In operational contexts, HDTs transform seafarers into dynamic data sources to track physiological state and well-being [50]. Within the “Maritime 4.0” paradigm, integrating cloud-connected simulators with onboard data infrastructure enables trainees to practice different maneuvers without physical exposure [51]. These setups provide real-time performance analytics while capturing expert mental models to support crew competency development and transitional autonomous navigation.
HDTs transition from passive monitoring to computational modeling of cognitive processes and human error during critical bridge maneuvers. Recent approaches employ cognitive mimetics to map operator mental control logic during operational deviations [52]. Furthermore, a multilayer architecture combines non-contact pose tracking with discrete dynamic event trees to quantify implicit cognitive states, such as fatigue, stress, and distraction, mirroring the crew’s mental state to predict unsafe actions in real-time simulation [2].
3.2. Digital Twins in Vessel System Modeling
Recent literature on vessel system modeling demonstrates a clear transition from classical hydrodynamic parameter identification toward AI based on complex physics, reduced-order predictive modeling, and standardized co-simulation environments [53,54,55,56,57,58,59,60,61,62,63,64,65]. Early implementations focused on tuning 3-degree-of-freedom (3-DoF) and 6-DoF maneuvering equations and steering control loops using scale models, optimization algorithms, and grey-box system identification bound by the International Maritime Organization (IMO) standards [53,54,55]. However, because pure physics-based models struggle with complex hydrodynamic interactions, hybrid DT architectures have become dominant. By combining physical models with ML, these frameworks effectively fit residual errors, significantly improving speed and roll motion forecasting [56,57,58].
To push real-time trajectory forecasting further, recent approaches leverage advanced deep learning (DL) and equation-free dynamics. Transformer encoder architectures have demonstrated superior performance over traditional long short-term memory (LSTM) in modeling transoceanic trajectories with high computational efficiency [59]. Simultaneously, for short-term motion nowcasting under dynamic sea states, equation-free DTs utilize Bayesian extensions of Dynamic Mode Decomposition to approximate Koopman operators. This enables reduced-order modeling in fractions of a second, providing continuous learning loops and multi-wave encounter predictions with explicit uncertainty quantification [60].
For practical decision support and immersive simulation, maneuvering DTs must integrate multi-body kinematics, spatial context, and low-latency visualization. Modern architectures connect nonlinear ship dynamics with crane or auxiliary systems using the Functional Mock-up Interface standard, achieving co-simulations for dynamic positioning [61]. Furthermore, combining standardized machinery protocols (ISO 19848) with 3D WebGL graphics and live Automated Identification System (AIS) data enables realistic geographic visualization within coastal topographies [62,63]. Finally, WebGPU-based pathfinding algorithms and computer vision pipelines, such as convolutional neural networks (CNNs) with LSTM and YOLOv8, bridge the gap between the virtual and real world, allowing DTs to optimize hazardous routes and measure passing vessel dimensions in real time [64,65].
3.3. Vessel Machinery Systems
Vessel machinery DTs have evolved from static diagnostic tools into dynamic engines for real-time fault detection, adaptive energy management, and lifecycle emissions tracking [66,67,68,69,70]. In high-fidelity thermodynamic modeling, DTs couple engine physics with neural networks and engine control systems (ECS) to establish reference baseline states across varying operating conditions. By continuously comparing physical sensor streams against these baselines, the system detects operational anomalies and triggers virtual recalibrations [66]. In addition, integrating thermodynamic equations with stochastic processes enables long-term war prognosis, generating synthetic reference datasets to predict component remaining useful life and dynamically aligning the virtual asset across maintenance lifecycles [67].
Bridging physical models with operational feedback, recent architectures prioritize real-time sensor integration to optimize combustion parameters dynamically [68]. By integrating navigation metrics to evaluate thermodynamic performance, these DTs establish predictive feedback loops that transmit analytical recommendations directly to the engine control unit. This continuous tuning maximizes fuel efficiency while ensuring strict adherence to international maritime emission limits.
To support maritime decarbonization without computationally heavy thermodynamic solvers, data-driven frameworks utilize unsupervised ML to classify vessel data into discrete operating regimes for energy efficiency optimization [69]. Simultaneously, real-time power system DTs coupled with dynamic life-cycle assessment (LCA) modules simulate ship power grids and dynamic load distribution [70]. By continuously calculating well-to-wake greenhouse gas emissions from live operational profiles, these frameworks execute adaptive power adjustments to maintain efficiency and prevent regulatory breaches.
3.4. Structural Health Monitoring
Structural health monitoring represents a critical boundary in maritime modeling, where DTs transition from kinematic maneuvering and machinery diagnostics to real-time structural stress, fatigue, and deformation assessment [71,72,73]. To overcome the severe computational burden of traditional finite element analysis (FEA) under dynamic wave loads, early frameworks coupled sensor networks with inverse stiffness solvers and VR environments [71]. By continuously assimilating real-time force and strain streams, these interfaces enable interactive failure mode visualization and collaborative decision-making during active operations.
To significantly accelerate structural evaluations, recent research incorporates DL into finite element models. Frameworks leveraging multi-scale feature enhancement (MSFE) and attention mechanisms execute dynamic stress and vibration predictions under varying sea states orders of magnitude faster than conventional FEA, maintaining high precision [72]; this rapid inference enables closed-loop control capabilities, automatically issuing real-time safety alerts, executing dynamic fin optimizations, or triggering emergency shutdowns when stress thresholds are executed.
To avoid reliance on black-box surrogate models or heavy computing clusters, modern methodologies utilize mathematical model order reduction [73]. By employing snapshot-based Krylov subspace projection methods, complex hull mechanics with millions of DoF are mapped into compact state spaces under irregular wave distributions. This approach reduces computation times while retaining exceptional precision, offering a robust, scalable solution for on-site structural health evaluation, fatigue tracking, and dynamic damage diagnosis under real-world operating conditions.
3.5. Digital Twins in Environmental Dynamic Integration
Environmental DTs in maritime applications have evolved from macro-scale atmospheric forecasting to deterministic, short-term ocean wave reconstruction [1,74]. At the oceanographic level, integrating 3D observational data into atmospheric circulation models refines wave and wind predictions for weather routing and hazard management [74]. To bridge macro-scale forecasts with localized ship responses, recent frameworks utilize onboard X-band radar and motion units to reconstruct 3D wave fields in real time within a 10 to 30 min deterministic window. Coupling wave predictions with impulse response functions allows operators to evaluate short-term maneuvering risks prior to encountering critical wave groups [1].
Beyond weather stressors, environmental DTs incorporate surrounding traffic, spatial channel boundaries, and navigational hazards [8,75]. Fusing static electronic charts with dynamic AIS and radar feeds enables enhanced velocity obstacle algorithms that enforce vessel maneuverability limits for safe collision avoidance in dense waterways [75]. Concurrently, live synthetic pipelines synchronizing multi-sensor feeds replicate 3D waterways, providing a risk-free simulation environment to train and evaluate ML navigation models before physical deployment [8].
To maintain fidelity under real-world sea disturbances and sensor noise, recent methodologies prioritize dynamic hydrodynamic parameter tuning [76,77]. Optimization algorithms applied to full-scale sea trial datasets identify hydrodynamic coefficients despite wind and waVe disturbances [76]. In addition, online adaptive DTs utilize discrete Bayesian mechanisms to update heave, pitch, and hydrodynamic parameters alongside their statistical confidence levels. By dynamically updating physical models rather than relying solely on black-box AI, these frameworks ensure robust operational safety assessments throughout the vessel lifecycle [77].
3.6. Identified Gaps in the Literature
While the literature demonstrates significant advancements in DTs for vessel maneuvering, machinery diagnostics, and structural health monitoring, a primary limitation persists: existing implementations treat human factors, vessel dynamics, and environmental conditions as isolated domains rather than interacting components of a unified ecosystem. Specifically, the integration of HDTs to monitor seafarer cognitive workload, stress, and behavioral responses alongside physical vessel mechanics remains underdeveloped.
Although simulators allow safe execution of high-risk maneuvers, current frameworks lack a holistic, closed-loop architecture that converges HDTs, operational vessel DTs, real-time environmental physics, and XAI, as shown in Table 1. Crucially, interpretable decision support and adaptive human-in-the-loop feedback mechanisms are virtually absent across reported maritime simulation platforms.
Table 1.
Comparison of frameworks from the systematic literature review.
To bridge these fundamental gaps, there is a clear imperative to introduce the VSEMO. The structural deficiencies of current literature and the expanded capabilities offered by the VSEMO framework are summarized in Table 2. By synthesizing human behavioral modeling, dynamic vessel state tracking, and real-time environmental physics within an explainable decision-support architecture, VSEMO transforms isolated simulated domains into a unified, adaptive platform for seafarer training and operational risk assessment.
Table 2.
Main observations evaluated in the literature.
4. Development of the Framework for the Virtual Symbiotic Environment for Maritime Operations
To effectively model complex maritime maneuvers within an explainable, adaptive, and human-centric architecture, the proposed VSEMO integrates five closed-loop stages (Figure 5):
Figure 5.
Proposed closed-loop framework for VSEMO integrating XAI for continuous feedback and scenario refinement.
- Identification of operator training needs and improvements: Gaps and priorities in operator capabilities and operational performance are identified by defining competency requirements and key performance indicators (KPIs). In this stage, management-level users (e.g., trainers, companies, maritime authorities, investors) select the operator training objective based on organizational needs and risk reduction priorities.
- Definition of maritime operation and variables: The maritime operation is defined and selected based on key variables that influence its execution, categorized into operation type, operator characteristics, weather factors, and factors of the vessel machinery.
- Creation of the VR environment: An immersive and interactive space is built to reproduce maritime scenarios. This includes selecting 3D assets (vessel types, instruments, ports, crew) and establishing their physical behaviors via mathematical models in the virtual world. It also involves configuring output devices (e.g., headsets, haptics, environmental actuators) to send physical feedback signals to the trainee, as well as input devices (e.g., sensors, cameras, microphones) for real-time data acquisition during interactions.
- DT modeling for maritime operations: The interaction layer synchronizes real-time physical and virtual data streams to maintain three interconnected DTs:
- The HDT continuously quantifies operator cognitive load, decision-making logic, stress, and behavioral responses.
- The weather DT reconstructs and forecasts dynamic wave fields, wind profiles, and hypothetical sea conditions in real time within the VR simulator.
- The vessel systems DT simulates non-linear equipment behavior, fault responses, and mechanical degradation across operational lifecycles.
Rather than operating as isolated models, these DTs engage in continuous multi-domain interactions. Dynamic sea-state disturbances (weather DT) induce mechanical loads and simulated equipment faults (vessel systems DT), which elevate cognitive workload and stress levels in the operator (HDT). At the same time, the operator’s corrective maneuvering decisions (HDT) feed back to alter vessel controls and machinery performance (vessel system DT) within the changing ocean context (weather DT). - Data processing for XAI and feedback: Data collected during interaction (from sensors, VR inputs, and action tracking) is processed to train XAI models for predictive risk analysis, real-time anomaly detection, and decision support. The XAI evaluates operator performance and decision-making to generate a personalized and transparent report tailored to the trainee based on the targeted competencies. In addition, the insights and outcomes generated by the XAI are used to provide feedback to the other stages:
- To stage 1: refining high-level training priorities and KPI thresholds based on holistic performance metrics.
- To stage 2: dynamically updating operational scenarios and environmental variables.
- To stage 3: calibrating VR physical actuators and synthetic environment physics.
- To stage 4: executing parameter updates and baseline refinements across the three DTs.
Although the current research is working on the “Creation of the virtual environment” state, this framework establishes the foundational requirements for building a comprehensive VSEMO that fuses DTs with XAI to enhance safety and efficiency in maritime operations.
The structural architecture of the proposed VSEMO directly operationalizes the sequential 7-stage data processing and closed-loop feedback workflow (Figure 6). By aligning operational requirements with analytical algorithms, raw multi-domain inputs are continuously ingested, evaluated, explained, and refined across its architectural stages.
Figure 6.
Closed-loop systems engineering workflow for VSEMO.
The pipeline begins at Stage 1 (Inputs) of the workflow, which maps onto the Identification, Definition, and Creation modules of the architecture. Raw data streams, encompassing human physiological metrics (fatigue, workload), vessel status (engine performance, helm controls), environmental perturbations (wind, waves, visibility), and scenario baselines, are captured in real time. These inputs originate from physical hardware interfaces (VR headsets, biosensors, haptics) as well as the virtual physics engine, creating contextualized snapshots of the operational state.
Once raw metrics are captured, they are ingested by the DT Integration Layer (Modeling Stage), aligning directly with Stage 2 (Fusion) and Stage 3 (Inference). The physical-virtual data streams are synchronized across three concurrent twins:
- HDT: Models cognitive load, behavior, and decision-making performance.
- Weather DT: Computes dynamic environmental forecasts and sea states.
- Machinery DT: Simulates equipment failure, telemetry, and hydrodynamic dynamics.
In Stage 2 (Fusion), these isolated streams are merged into a synchronized, multi-domain data representation. This fused representation then powers Stage 3 (Inference), leveraging algorithms such as graph neural networks (GNNs) and fuzzy algorithms, while remaining open to other computational, ML and DL techniques, to evaluate system dynamics and calculate situation assessments, confidence metrics, and numerical risk predictions. Crucially, while initial risk estimates are formed during scenario configuration, operational risk predictions are continuously recalculated in Stage 3 following model updates (after Stage 7), reflecting the real-time dynamic states of the synchronized DTs.
The inferential output feeds directly into the Data Processing module (Processing Stage), operationalizing Stage 4 (Decision) and Stage 5 (Explanation).
- Decision Support (Stage 4): Evaluates operational objectives against safety rules to issue real-time control guidance, prioritized alerts, and recommended maneuvers.
- XAI Engine (Stage 5): Translates complex model reasoning into human-understandable diagnostics. By highlighting key feature importances, message-passing graphs, and causal links, the system provides transparent explanations (explaining why and how a risk threshold was breached) alongside visual context and uncertainty parameters.
The closing of the loop represents the core integration between the two figures. Stage 6 (Feedback) registers operator responses (acceptance, rejection, or control adjustments) along with error logs and incident outcomes. This feedback dataset then transitions to Stage 7 (Learning), triggering three continuous update mechanisms across the architectural diagram:
- DT Refinement: Insights and error deviations feed directly into the DT Integration Layer to recalibrate model parameters, fault simulations, and predictive states.
- Strategic Needs Alignment: Long-term reporting and KPI tracking return to the top-tier Management Level (Identification Phase) to refine competency baselines, training priorities, and organizational policies.
4.1. Operational Training Needs and Human Behavior Modeling
Ship bridge operators (including navigators, helmsmen, and watchkeeping officers) play a decisive role in maintaining maritime safety and operational efficiency. Continuous crew monitoring and real-time feedback are vital, as human error represents a main cause of maritime casualties, accounting for an estimated 75% and 96% of accidents [43]. On the other hand, the increasing complexity of modern bridge systems driven by technological advancements underscores the need for robust frameworks dedicated to competency selection, specialized training, and performance assessment.
Consequently, operator evaluations focus on Bridge Resources Management (BRM) competencies directly mapped to internal maritime standards [78,79,80]. Five core competencies were identified for BRM training:
- Communication assessment: Evaluates the execution of clear, immediate, and standardized dialogue across different scenarios, especially during high-stress maneuvers and emergency responses.
- Situational awareness: Assesses the operator’s ability to balance visual scanning of electronic displays (e.g., ECDIS, radars) with environmental observation during maneuvering.
- Alarm management: Measures bridge crew response times, prioritization strategies, and interpretation of raw sensor data when encountering critical alarms.
- Team dynamics: Analyzes bridge crew interactions and leadership within the bridge hierarchy under operational pressure.
- Vessel maneuvering: Evaluates the execution of safe maneuvers during complex navigation scenarios adhering to maritime regulations.
Table 3 details the operational training needs and measurable KPIs corresponding to each BRM competency.
Table 3.
Operational training needs and KPIs in BRM.
The selection of these operational training needs and KPIs enables management-level users (e.g., companies, trainers, stakeholders) to minimize maritime accidents, optimize operational efficiency, enhance training effectiveness, and reduce costs. To gain a deeper understanding of bridge crew actions during simulation tests, human factors must be quantitatively modeled to evaluate watchkeeping performance, efficiency, and safety. This assessment relies on metrics ranging from physiological data to physical motor interactions, as detailed in Table 4.
Table 4.
Operational human factors, indicators, and measurement tools.
Integrating objective biometric metrics, physiological indicators, and KPIs aligned to BRM establishes a robust foundation for modeling human operator behavior within the HDT structure. By capturing cognitive workload, stress responses, and motor interactions, this multi-modal approach enables the quantitative evaluation of watchkeeping performance and decision-making under operational pressure. However, to effectively validate these human factor models and analyze real-time crew behavior within a Virtual Symbiotic Environment, these biometric and behavioral assessments must be deployed across realistic, highly challenging operating conditions. Consequently, the following subsection details the selection and design of the case study, establishing the operational context, environmental stressors, and navigation hazards required to trigger and measure these dynamic operator responses.
4.2. Conceptual System-Level Mathematical Abstraction of the VSEMO Framework
The Virtual Symbiotic Environment for Maritime Operations (VSEMO) is conceived as a multi-domain cyber-physical architecture integrating human performance, surrounding traffic, docking operations, environmental conditions, and machinery status. At the system level, these domains may be represented through a general nonlinear interconnected-system abstraction.
The formulation presented in this subsection is intended to define the principal system components, information variables, and interaction pathways. It does not constitute a fully identified hydrodynamic, physiological, or machinery model. The nonlinear functions introduced below therefore represent structural placeholders whose parameters and detailed physical equations must be identified for a particular vessel, operator, and operational scenario. The term state is used here at the system-abstraction level. Depending on the subsystem, may include latent dynamic variables, estimated states, or compact internal representations maintained by the corresponding Digital Twin.
4.2.1. Global Physical-System State
Let the complete physical and human system state be represented by
where
- denotes the latent or dynamic state associated with the Human Digital Twin;
- denotes the state associated with the surrounding traffic situation;
- denotes the vessel state relevant to docking and harbor maneuvering;
- denotes the internal state or forecast state of the Environmental Digital Twin;
- denotes the state of the machinery and propulsion systems.
The dimension of the complete state vector is
The Aggregator node used in the implemented Graph Convolutional Network is not included in Equation (1), because it is a computational latent node and does not represent an independent physical subsystem.
4.2.2. Measurements and Operational Indicators
Not all variables used by VSEMO should be interpreted as dynamic states. Quantities such as fatigue, closest point of approach, traffic density, wave height, fuel consumption, and vibration may correspond to measured signals, derived indicators, estimated quantities, or contextual variables.
Accordingly, the measurement vector is defined as
where represents the measurement and feature-extraction functions and denotes sensor noise and measurement uncertainty.
The complete measurement vector may be decomposed as
The following vectors provide representative examples of observable or estimated quantities that may be associated with each Digital Twin.
Human-Related Variables
Traffic-Related Variables
Docking-Related Variables
Environmental Variables
Machinery Variables
4.2.3. Executed Control Actions and AI Recommendations
The vector of commands physically applied to the vessel is defined as
where is the rudder-angle command, is the propulsion or thrust command, and represents a positioning, braking, or dynamic-positioning command.
The recommendation produced by the intelligent decision-support module is represented separately by
where denotes the AI decision-support policy and contains the predicted subsystem and global risk indicators.
In a human-in-the-loop configuration, the executed control action may be written as
where is the operator-selected action, represents operational and safety constraints, and is the action-selection or approval mechanism. This formulation distinguishes an AI recommendation from a command that is physically applied to the vessel. The variables listed above characterize the broader VSEMO sensing space and should not be interpreted as the exact feature vectors used in the current graph convolutional network (GCN) proof of concept. The implementation-specific graph features are defined separately in Section 4.3.
4.2.4. External Disturbances
Uncontrollable physical disturbances are represented by
where the components represent external wind, current, wave, and other unmodeled physical perturbations.
Sensor uncertainty is not included in because it is represented separately by in Equation (3). Furthermore, represents the physical environmental forcing, whereas represents the estimated or forecast internal state of the Environmental Digital Twin.
4.2.5. General Nonlinear System Dynamics
At the conceptual system level, the maritime operation is represented as
where
contains the nonlinear dynamic functions associated with the five domains.
A general neighborhood-based formulation is used to avoid assuming that every subsystem interacts directly with every other subsystem:
where and denotes the set of physical or operational subsystems that influence subsystem i.
Equation (16) allows the interaction topology to depend on the operational scenario. For example, environmental conditions may influence human workload, docking performance, vessel maneuverability, and machinery loading, while operator actions may influence docking and traffic interactions. The formulation does not impose an all-to-all coupling structure and does not assume that all dependencies have equal strength.
The functions are not identified in the current proof of concept. They provide a general systems engineering abstraction of the intended VSEMO architecture and may later be instantiated using vessel-dynamics equations, physiological models, machinery degradation models, environmental forecasts, or system-identification methods.
4.2.6. Construction of Computational Features
The implemented GCN does not receive the complete latent state vector directly. Instead, each graph node receives a feature vector constructed from selected measurements, derived indicators, contextual variables, control information, and environmental conditions.
For subsystem i, the GCN input features are represented by
where denotes feature selection, scaling, normalization, and padding, contains contextual or categorical variables, and k identifies an independent operational scenario.
The complete graph-feature matrix is
where the Aggregator feature vector is initialized as
The Aggregator receives no measured operational variables. Its representation is learned through message passing from the subsystem nodes and through the trainable parameters of the neural network.
4.2.7. Relationship Between the Conceptual System and the Implemented GCN
The system-level dynamic formulation and the implemented GCN operate at different levels of abstraction.
Equation (14) represents the conceptual continuous-time evolution of the physical and human maritime system. In contrast, the GCN operates on independent discrete operational snapshots and estimates risk indicators from the features observed in each snapshot.
Each graph sample is represented as
where and denote the computational nodes and edges, respectively, is the node-feature matrix, and contains the reference risk indicators.
The implemented model estimates
where is the trained Graph Convolutional Network and
The index k represents an independent synthetic operational scenario rather than a discrete time step. Therefore, the current GCN does not model temporal transitions between and , nor does it identify the nonlinear dynamic functions in Equation (16). Instead, it approximates a static mapping from a graph-structured operational snapshot to subsystem-level and aggregate risk indicators.
Consequently, conceptual state-space abstraction defines how the complete VSEMO architecture can be understood from a systems engineering perspective, while the GCN constitutes the current data-driven implementation for snapshot-based risk estimation. Future developments may connect both levels through temporal graphs, recurrent GNNs, state estimation, or physics-informed learning approaches.
4.3. Graph Neural Network Implementation for Maritime Risk Estimation
The graph-based risk-estimation model was implemented using PyTorch Geometric 2.2.0 and the GCN formulation. The purpose of the model is to estimate five subsystem-level indicators and one global maritime operational-risk score from heterogeneous synthetic operational variables.
The implemented model is characterized as a homogeneous, bidirectional, star-topology GCN. The graph contains six nodes corresponding to the Human, Traffic, Docking, Environmental, Machinery, and Aggregator components. Although these nodes represent semantically different operational domains, the architecture is homogeneous because all nodes are processed using the same input transformation, graph-convolution operators, activation functions, and output layer.
The five operational subsystem nodes are connected to the central Aggregator node through bidirectional edges in the computational graph. Consequently, message passing through bidirectional rather than being strictly oriented from subsystems toward the Aggregator. At the GCN implementation level, this design enables the Aggregator to integrate multi-domain subsystem features while allowing global contextual information to propagate back to peripheral nodes across graph-convolution layers. It is important to distinguish this micro-level bidirectional GNN message passing from the macro-level bidirectional feedback workflow of the VSEMO conceptual architecture, which operates iteratively across overall system stages.
All node inputs are represented using five-dimensional vectors. Subsystems containing fewer than five original variables are zero-padded to ensure compatibility with the shared input layer. The Aggregator node is initialized with a zero-valued feature vector and must infer the global operational condition exclusively through graph message passing.
The network applies a shared linear projection from five to 64 features, followed by three GCN convolution layers and a shared scalar output layer. It simultaneously predicts one continuous value for every node: Human Performance Score, Traffic Risk Score, Docking Risk Score, Environmental Severity, Machinery Stress, and global operational risk. Accordingly, the implementation constitutes a node-level multi-output regression model rather than a conventional graph-level classification architecture.
Trained and evaluated on synthetic operational datasets, the current GCN serves as an architectural proof-of-concept rather than an empirically validated maritime risk model. Each generated operational scenario is represented as an independent graph. The model does not employ graph-attention coefficients or edge-specific learned weights; instead, message aggregation is performed using the normalized adjacency formulation implemented by the GCNConv operator. Consequently, subsystem importance should not be interpreted directly from explicit attention values or edge coefficients. Any contribution of a subsystem to the global prediction is encoded implicitly within the learned node representations and must be analyzed using an additional explainability procedure, such as node masking, permutation analysis, integrated gradients, or a dedicated graph explanation algorithm. Empirical validation using real-world vessel telemetry is identified as essential future work to transition this conceptual framework into operational deployment. Each generated operational scenario is represented as an independent graph.
where is the number of generated operational scenarios, V is the fixed node set, E is the fixed edge set, contains the node features for scenario k, and contains the corresponding target risk values.
4.3.1. Graph Topology
The graph contains six nodes,
where
- represents the human-performance subsystem;
- represents the traffic-risk subsystem;
- represents the docking-risk subsystem;
- represents the environmental-severity subsystem;
- represents the machinery-stress subsystem;
- represents the aggregate operational-risk node.
The conceptual information flow is organized as a star topology centered on the Aggregator node. The initial subsystem-to-Aggregator edge set is
To enable this multi-directional context sharing within the GNN, reverse edges are explicitly added to the computational graph,
The complete edge set used during graph convolution is
Thus, the graph contains ten directed edge entries that computationally represent five bidirectional connections between the peripheral subsystem, nodes and the central Aggregator node,
This implementation allows the Aggregator to receive information from every operational subsystem while also allowing its latent representation to influence the subsystem-node embeddings during successive GCN layers.
The adjacency matrix is therefore symmetric for the implemented topology,
before the self-loops and normalization terms internally introduced by the GCNConv operator are considered.
4.3.2. Synthetic Subsystem Variables
The synthetic database contains operational inputs generated from uniform probability distributions over the interval , except for the encounter-type variable, which takes one of three discrete values.
The Human node uses
where F is fatigue, W is workload, and B represents bridge resource management performance.
The Traffic node uses
where is the closest point of approach, is the time to the closest point of approach, is the relative bearing, is the closing-rate indicator, and is the encounter type.
The Docking node uses
where denotes berth clearance, denotes positional offset, is the approach angle, and is the lateral-speed indicator.
The Environmental node uses
where and represent wind speed and direction, and represent current speed and direction, and denotes sea-state severity.
The Machinery node uses
where is thrust availability, is steering-system health, is actuator or system delay, is the alarm rate, and denotes system redundancy.
The Aggregator node does not receive direct risk values as input. Its initial feature vector is defined as
Consequently, the Aggregator must infer the global risk through message propagation from the five operational subsystem nodes.
4.3.3. Feature-Dimension Unification
Because the subsystem nodes contain different numbers of input variables, all node features are padded with zeros to a common dimension of five. The padding operation is defined as
where appends zero-valued elements until the feature vector has five components.
For example,
and
The node-feature matrix for one graph is consequently
4.3.4. Generation of Reference Subsystem Indicators
The target values used to supervise the GNN are generated through deterministic nonlinear equations applied to the synthetic inputs.
The human-performance stress indicator is
where
is the logistic sigmoid function.
The traffic-risk score is
where the encounter-dependent coefficient is
The docking-risk score is generated as
The environmental-severity indicator is
The machinery-stress indicator is
Finally, the global reference risk is calculated as the weighted combination
The coefficients sum to unity,
which maintains the aggregate risk within the normalized interval when the subsystem indicators are also bounded between zero and one.
The node-target vector is
Therefore, the GNN is trained as a node-level multi-output regression model in which one continuous target is predicted for every node.
The weighting factors in Equation (47) reflect the domain-specific risk hierarchy established in maritime accident literature [102,103,104,105,106].
- Traffic Risk Score (, highest weight): Collision and near-miss events involving vessel traffic represent the most critical situational risk factor during port approach and harbor maneuvering. Empirical studies consistently demonstrate that traffic interactions dominate collision probability in confined waters [102,106].
- Human Performance Score () and Docking Risk Score (): Human error is documented to contribute to 75–96% of maritime casualties [102,103]. During low-speed docking maneuvers, the primary case study evaluated herein, human operator decisions directly translate into physical docking trajectories and hull-pier interaction hazards. Consequently, human performance and docking execution are modeled as co-primary risk drivers with equal weighting, consistent with their maximum sensitivity ratings in Table 6.
- Environmental Severity (): Although adverse environmental stressors (wind, waves, currents) significantly increase operational complexity [104,105], weather hazards during harbor docking are predominantly mediated through the human and docking subsystems (e.g., wind gusts increasing helm demand, cognitive workload, and lateral trajectory deviation) rather than acting as a direct standalone casualty driver [104].
- Machinery Stress (, lowest weight): Machinery failures are statistically lower base-rate events during docking maneuvers and are rarely the sole root cause of casualties without mediating human misoperations or navigational errors (Table 7) [106]. This lower weight is consistent with the machinery sensitivity score of in Table 6.
While these fixed coefficients establish a domain-grounded heuristic for this architectural proof of concept, formal sensitivity analysis, weight optimization, and empirical robustness validation using real-world vessel telemetry are identified as essential future work [107].
4.3.5. Input Embedding Layer
The padded feature vector of each node is transformed from five input features to a 64-dimensional latent representation using a shared linear layer,
where
The same input transformation is applied to all six nodes.
4.3.6. Graph-Convolution Layers
The model contains three consecutive graph-convolution layers. For layer ℓ, the GCN update follows
where
is the adjacency matrix augmented with self-connections, and
is its degree matrix.
The use of three GCN layers corresponds to three message-passing steps. Because the implemented star graph includes reverse edges, information can propagate from the subsystem nodes to the Aggregator and then back to the subsystem nodes. After multiple layers, each subsystem prediction may therefore contain contextual information obtained from the other subsystems through the central Aggregator.
The resulting propagation pattern can be expressed as
Although no direct subsystem-to-subsystem edges are defined, two message-passing steps allow one subsystem to influence another indirectly through .
4.3.7. Node-Level Output Layer
After the third GCN layer, a shared linear output layer maps each 64-dimensional node embedding to one scalar prediction,
where
The complete model prediction is
No sigmoid activation is applied after the final linear layer in the current implementation. Thus, the model performs unconstrained continuous regression, even though the reference values are generated within the interval .
4.3.8. Training Procedure
The complete dataset is divided randomly into training and validation subsets,
corresponding to an 80/20 split.
All six node predictions are supervised simultaneously using the mean squared error,
where B is the number of graphs in a training batch.
The model parameters are optimized using the Adam algorithm with a learning rate of
The batch size is 256 graphs, and the model is trained for 60 epochs.
Model performance is evaluated using the root mean squared error,
where represents the number of evaluated node samples. RMSE is calculated both for the complete set of node predictions and separately for each of the six node types.
4.3.9. Implementation Results
At the final training epoch, the model obtained an overall training RMSE of 0.10034 and an overall validation RMSE of 0.10070. The similarity between these values indicates that the model did not exhibit substantial global overfitting under the implemented training-validation partition.
The final validation RMSE values obtained for the individual nodes were
The model produced relatively low errors for the Human, Traffic, Docking, and Aggregate nodes. However, larger errors were observed for the Environmental and Machinery nodes. These results indicate that the current shared GCN architecture does not learn all subsystem mappings with equal accuracy.
One possible explanation is that the same input transformation, graph-convolution parameters, and output layer are shared among operational domains governed by different nonlinear target functions. In addition, bidirectional graph propagation mixes subsystem information even when the local environmental and machinery targets are primarily determined by their own local variables. However, these results can be regarded as proof of concept as presented.
Future work can incorporate node-type-specific encoders, heterogeneous graph convolutions, weighted loss functions, or separate local prediction heads to improve the environmental and machinery predictions.
4.3.10. Interpretation of the Implemented Architecture
The implemented model can be summarized as
The architecture should therefore be characterized as a homogeneous, bidirectional, star-topology GCN for node-level regression. It is not currently an attention-based GNN, a strictly directed aggregation model, or a graph-level pooling architecture. The Aggregate node is treated as the sixth supervised node, initialized with zero input features, whose risk value is inferred through graph message passing. The general algorithm is provided below (Algorithm 1).
| Algorithm 1: Compact GCN-Based Maritime Risk Estimation. |
|
Although alternative machine learning models, such as multilayer perceptrons, random forests, or gradient-boosting methods, could also be trained to estimate operational risk from the same synthetic variables, the graph representation was selected because it naturally captures the relational structure of the proposed VSEMO architecture. In the proposed framework, Human, Traffic, Docking, Environmental, and Machinery Digital Twins are not independent predictors but interacting entities whose influence on operational risk depends on their relationships. Representing these entities as graph nodes enables information exchange through message passing, allowing each subsystem to update its latent representation based on neighboring Digital Twins before estimating both subsystem-specific and aggregate risk. Consequently, the Graph Convolutional Network is not intended solely as a predictive model but as a computational realization of the systems engineering architecture proposed in this work. Moreover, the graph formulation provides a scalable foundation for future extensions involving heterogeneous Digital Twins, dynamic graph topologies, and temporal graph neural networks, which cannot be represented as naturally using conventional tabular learning models.
4.4. Virtual Reality as a Tool for the Development of Simulated Maritime Operation Scenarios
Modern maritime operations demand absolute precision, situational awareness, and teamwork in environments under high-risk or unpredictable situations. While traditional desktop simulators and full-mission physical bridge mock-ups have long served as the industry benchmark, VR has emerged as a dynamic tool for training bridge operations [108].
By immersing maritime officers in 360°, photorealistic, and acoustically accurate environment, VR bridges the gap between theoretical knowledge and real-world execution [108]. Operators can experience complex maneuvers under high-risk conditions by executing tight mooring operations or handling emergency collision-avoidance scenarios, without placing high-cost vessels, crew, or marine environments at risk. VR enables high-repetition, stress-inducing training scenarios that trigger authentic physiological responses (e.g., elevated heart rates and cognitive load) [109]. This psychological fidelity accelerates muscle memory, sharpens decision-making under pressure, and optimizes BRM. To understand where VR excels, it is essential to compare VR, AR and mixed reality (MR) technologies within the context of bridge simulator training (Table 5).
Table 5.
Core concepts, strengths, and limitations of simulation technologies.
While AR shines as an operational support tool onboard real vessels and MR provides an impressive bridge between hardware consoles and synthetic worlds, VR remains the most powerful, scalable, and cost-effective medium for immersive, end-to-end simulation and stress-adaptation training.
The benefits of using VR extend far beyond immersive visual training since it functions as a data collection engine. During VR training sessions, the platform continuously tracks multi-modal user interactions, including:
- Oculomotor metrics: eye-tracking data revealing visual scan paths, screen fixation, and gaze duration across ECDIS, radar, and bridge windows [87].
- Kinematic actions: head movements, reaction times, and control input patterns [101].
- Biometric signals: integrated HRV, GSR, and EEG signals capturing real-time stress and cognitive workload [92,93,94,97].
These data streams can be fed into DTs and XAI frameworks, since an XAI risk advisor can analyze an operator’s decisions, evaluate their operational risk level in real time, and provide transparent, actionable debriefing advice. By implementing VR immersion, DT data collection, and XAI advisory systems, maritime instructions can transform bridge training from simple scenario practice into a predictive, data-driven science that continuously elevates human performance and operational safety at sea.
4.5. Selection of the Maritime Operation Scenario for Case Study
As part of the conceptual framework foundation for selecting maritime operations, a structured process was conducted to identify the naval tasks most suitable for VR simulation and experimental evaluation. The objective was to ensure that chosen tasks are (1) theoretically representative of complex maritime operations where human, environmental, and machinery factors interact, and (2) technically feasible to simulate and instrument within the constraints of our VR laboratory presented in Figure 7a. Meanwhile, the equipment for the VR environment prototype is presented in Figure 7b.
Figure 7.
(a) Experimental space for simulated maritime operations during VR prototype testing. (b) VR equipment for experiments: (1) Manus Metagloves Pro, (2) bHaptics Tactsuit Air, (3) bHaptics Tactglove DK2, (4) LEVOIT smart humidifier, (5) Meta Quest 3, (6) Midea air conditioner, (7) Dell Pro Max 16 MC16250 laptop.
Candidate operations were selected based on operational domains associated with deterioration of human performance, specifically fatigue, stress, environmental stressors, and high operational workload. These operations were mapped to established dimensions of task complexity, particularly interdependencies, dynamic coordination, uncertainty, and sustained cognitive load. Complex maritime tasks, such as maneuvering, collision avoidance, and emergency response, result in measurable reductions in situational awareness and increased error rates, especially under degraded environmental conditions.
Given our experimental space (2.4 × 3.9 m), only operations performed seated or standing without walking were retained. Furthermore, the selection was restricted to tasks impacted by controllable environmental variables (temperature, humidity, noise, visibility) and whose cognitive or physiological components can be captured via available multi-modal sensors (ECG, EEG, breathing rate, posture, EDA, and video capture devices). This constraint excluded operations requiring extensive movement (e.g., firefighting, flight deck operations) or whole-body motion (e.g., small boat handling).
Through this structured evaluation, five primary operations emerged as the most appropriate:
- Maneuvering, docking, and collision avoidance: Complex operations requiring rapid decision-making under uncertainty, where time pressure and environmental stressors significantly increase error probability [114,115].
- Navigation and bridge watchkeeping: A safety-critical task involving continuous monitoring and visual scanning, linked to fatigue-related performance decline and reduced vigilance [116,117].
- Replenishment-at-sea (bridge role): A tightly coordinated multi-vessel operation sensitive to degraded visibility, ship motion, and high operator workload demands [118].
- Combat information center (CIC) tactical decision-making: A cognitively intense task dominated by information fusion, situational awareness, and stress management [119,120].
- Crane and cargo-handling operations: A precision control task affected by visibility, noise, operator fatigue, and degraded sensory signals [121,122].
These operations represent a balanced set of high-complexity, environmentally sensitive, and safety-critical tasks that are simultaneously feasible to simulate in VR and compatible with multi-modal physiological instrumentation.
A selection matrix was developed to systematically compare candidate operations against five criteria derived from literature and experimental constraints:
- Human performance sensitivity (HPSen): Reflects how strongly the task elicits measurable psychophysiological responses (stress, workload, attentional demands).
- Environmental sensitivity (ES): Captures performance degradation under variations in temperature, humidity, noise, and visibility.
- Machinery sensitivity (MS): Considers task dependence on equipment performance and potential human-machine interaction failures.
- VR simulability (VRS): Determines if the task can be realistically reproduced within laboratory spatial and technical constraints.
- Monitoring feasibility (MF): Assesses support for multi-modal physiological and behavioral data collection.
Table 6 describes the total weighted score for maritime operations. Each operation is scored on a 1–5 scale for each criterion. The total weighted score is computed as the sum of (score × criterion weight).
Table 6.
Maritime operations selection matrix.
Criteria weights were assigned based on empirical evidence from maritime accident analyses, which consistently rank human factors as the primary contributor to operational complexity and casualties, followed by environmental conditions and machinery failures (Table 7).
Table 7.
Ranking of factors by operational impact.
Selection of Case Study: Docking
Docking, also known as berthing, was selected as the primary case study to evaluate the VR maritime bridge simulator and operator performance. From engineering, operational, and human factors perspectives, docking serves as an ideal “benchmark task” due to three core attributes:
- Dynamic multivariable complexity: Docking occurs in confined waters where safety approaches zero. It forces the bridge crew to integrate hydrodynamic forces (vessel momentum, shallow-water effects, propulsion lag) and environmental forces (cross-winds, tidal currents, wave drift) simultaneously. This immediately stresses the simulator’s physics engine and sensor feedback loops [123].
- VR immersion synergy: Unlike open-sea navigation, docking demands precise spatial orientation and depth perception to judge distances between the hull, pier, and surrounding structures. VR headsets provide binocular 3D depth perception and 360° head tracking, enabling operators to lean out of the virtual bridge wing and monitor clearances naturally [124,125].
- High cognitive and stress load: At low speeds, rudder effectiveness diminishes, forcing reliance on engine pulses and thrusters. Sudden environmental perturbations (e.g., wind gusts) require split-second corrective decisions, making docking uniquely suited for evaluating situational awareness, crisis management, and cognitive workload under real-time stress [126,127].
4.6. Selection of Hardware and Software for VR Environment
To implement the proposed framework, the selection of appropriate VR hardware and software is imperative. This infrastructure functions as the primary interface where the digital twin (DT) synchronizes physical operator inputs, environmental physics, biometric accuracy, multi-sensor data acquisition, and computational efficiency to guarantee seamless execution devoid of latency-induced operator fatigue or cognitive distortion.
When evaluating development engines for VR simulation, the core trade-off is between optimization capabilities and raw graphical fidelity. Unreal Engine excels at high-end photorealism with features like Nanite and Lumen, making it well-suited for cinematic or PC-restricted applications. By contrast, Unity offers superior optimization for standalone and mobile VR devices through lightweight rendering pipelines (URP/HDRP) and a flexible C# development ecosystem. Comparative academic studies show that Unity delivers faster multi-device data synchronization, lower hardware overhead, and higher frame-rate stability, factors critical for human-in-the-loop training simulation. Therefore, Unity was selected as the engine of choice to ensure cost-effective deployment, high portability, and stable performance on standalone Quest hardware without requiring ultra-high-end, PC-restricted workstations. Table 8 summarizes the comparison between Unity and Unreal Engine for VR simulation.
Table 8.
Comparative evaluation between Unity and Unreal Engine for VR simulation [128].
Among contemporary head-mounted displays (HMDs), the Meta Quest 3 exemplifies the most balanced platform suitable for this framework based on Table 9. Equipped with the Snapdragon XR2 Gen 2 processor, high-resolution pancake optics, and inside-out tracking, it offers standalone mobility while ensuring sub-millimeter tracking precision and high usability in simulation environments. Compared with high-cost headsets such as the Apple Vision Pro or XR-4, the Meta Quest 3 offers an accessible, scalable, and pragmatic solution for high-frequency operator training.
To complement the visual experience and deliver a fully immersive, multi-sensory environment, the architecture integrates specialized hardware components into Unity 3D via native and flexible API bridges [129]:
- High-precision hand tracking: the Manus Metagloves Pro provide precise, low-latency finger tracking and tactile feedback, enabling realistic interaction with virtual bridge control consoles and instruments without obstructing natural hand movements [130].
- Body and hand haptics: the bHaptics Tactsuit Air (haptic vest) and the bHaptics Tactglove DK2 deliver localized vibrotactile feedback for physical interactions, environmental collisions, and simulated alarm stimuli. Both devices offer Unity 3D plugins that allow event-driven haptic mapping [131].
- Environmental feedback via external microcontrollers: To simulate real-time maritime weather conditions, the framework incorporates a LEVOIT smart humidifier and a Midea air conditioner. These physical appliances are interfaced with Unity 3D using external microcontrollers (such as Arduino or ESP32 via serial/Wi-Fi communication). This setup enables the Unity 3D environment engine to trigger relay modules or IR signals, adjusting ambient temperature and moisture level synchronized with the simulated operational scenario [132,133].
Table 9.
Hardware classification and trade-off analysis.
To optimize physical immersion, the Meta Quest 3 was integrated with bHaptics hardware. The TactGlove offers localized tactile feedback during control interactions (e.g., operating bridge levers, switches, and throttles), while the TactSuit Air provides multi-point torso haptic signals that represent environmental forces, machinery vibrations, or system alerts. Literature suggests that multi-modal haptic feedback considerably accelerates motor learning, enhances situational awareness, and improves task performance under stress [138,139].
The developed VR environment translates these hardware and software selections into an interactive maritime bridge simulator. Figure 8 illustrates the initial implementation stages.
Figure 8.
(a) Operator interface, including helm, engine telegraphs, radar displays, and real-time meteorological readout panels. (b) Spatial relationship between the naval vessel, harbor crane structures, and the quay during a docking task. (c,d) Dynamic lighting, ocean surface physics, and changing ambient conditions (sunset vs. day lighting) surrounding the port facilities.
Beyond immersive visualization and tactile fidelity, the primary function of this hardware-software architecture is to serve as a high-frequency data engine for the entire framework. Every control input, head trajectory, and haptic interaction within the Meta Quest 3 and bHaptics ecosystem is continuously logged alongside the operator’s physiological signals. This synchronized data stream provides the empirical foundation for the next layer: the integration of XAI.
4.7. Explainable Artificial Intelligence for Risk Assessment and Operator Feedback
A significant contribution of this research is the utilization of a Graph Neural Network (GNN) to model interactions among various maritime operational subsystems, including human performance, traffic, docking, environmental conditions, and machinery [140]. This approach enables the framework to discern how alterations within one subsystem can affect overall operational safety. The model concurrently predicts risks at the subsystem level and calculates an aggregate operational risk score, thereby enhancing situational awareness and facilitating the identification of primary causes of increased risk. To foster trust and usability, the framework incorporates explainable artificial intelligence (XAI) through visualizations depicting graph topology, message passing, correlations, and node-level predictions, thus rendering the decision-making process transparent. Beyond risk prediction, this framework functions as a proactive decision-support system, applicable to applications such as collision avoidance, vessel traffic management, harbor operations, and crew resource management. Lastly, its scalable graph architecture is designed to accommodate future integration with real-time maritime data sources, such as AIS, RADAR, GPS, weather monitoring, and IoT sensors, thereby establishing a foundation for intelligent maritime digital twins, smart ports, and autonomous maritime transportation systems. The GNN framework developed for maritime risk assessment establishes a solid theoretical foundation by modeling operations as an interconnected system. Each subsystem (human performance, traffic, berthing, environment, and machinery) is represented as a node in a graph, enabling the capture of dependencies and dynamic relationships among them. This approach transforms risk assessment into a predictive and explainable process that identifies both local and global risks and provides useful information for decision-making in critical environments. Figure 9 illustrates the graph structure used by the GNN to represent the maritime operation. The five subsystem nodes (human, traffic, docking, environment, and machinery) are connected to a central Aggregator node representing overall operational risk via five bidirectional edges (computationally represented by ten directed edge entries). The values displayed in each node correspond to the true value (T) and the predicted value (P) generated by the GNN. For example, the human node has a true value of 0.65 and a predicted value of 0.65, while the Aggregator node has a true value of 0.61 and a predicted value of 0.62. The close agreement between true and predicted values demonstrates that the model has learned the relationships between subsystem risks and overall maritime risks. While the functional hierarchy aggregates subsystem parameters into the global risk node, the bidirectional edge connections reflect the GCN message, passing mechanics, where node embeddings are exchanged iteratively between the subsystems and the Aggregator during convolution.
Figure 9.
Graph topology used by the GNN representing the maritime operation.
To implement this approach in an interactive environment, a Unity 3D simulation was developed using a C# script. The script defines all variables needed to control the system’s behavior and can be edited in real time. This allows users to adjust parameters and immediately observe how changes affect the virtual scenario (Figure 10). Furthermore, a random number generator was incorporated to calculate the risk factor, adding variability and realism to each run. The information is organized in an interactive table that displays the generated values and their impact on the environment, facilitating an understanding of the system’s inner workings.
Figure 10.
Implementation of the GCN in the Unity 3D VR environment.
5. Discussion and Conclusions
The proposed VSEMO extends current DT research by introducing a unified systems architecture that simultaneously integrates Human, Traffic, Docking, Machinery, and Environmental Digital Twins within a common decision-support framework. A literature review revealed that existing maritime DT applications generally focus on isolated operational domains, such as standalone machinery diagnostics, structural health monitoring, or vessel navigation, with limited multi-domain integration. By establishing a modular architecture that bridges human performance, physical vessel dynamics, and atmospheric conditions, VSEMO addresses this research gap through a closed-loop systems engineering formulation.
Unlike conventional maritime simulators that emphasize predefined scenario scripting or hydrodynamic realism alone, VSEMO incorporates the operator as an active, dynamic component of the DT ecosystem. By integrating human physiological measurements, behavioral observations, and operational context alongside vessel telemetry, the framework enables continuous assessment of officer cognitive states during high-risk maneuvers. A central contribution of this architecture is the incorporation of XAI. Rather than issuing opaque numerical risk scores, the framework generates interpretable explanations that highlight the primary factors driving operational risk, such as weather degradation, machinery anomalies, traffic density, or operator stress, thereby fostering operator trust, facilitating instructor evaluation, and supporting evidence-based decision-making during both training and operational analysis.
To demonstrate the computational feasibility of the proposed framework, a GCN was developed as an architectural proof-of-concept using synthetic operational data as six-node bidirectional graphs. The graph representation models the complex relationships among the five subsystem DTs and a central Aggregator node, enabling multi-directional message passing before estimating subsystem-specific risk indicators, confirming that graph-based learning provides an effective mechanism for integrating heterogeneous operational data within a unified predictive model, establishing a computational foundation upon which future real-time DT implementations can be developed.
From a systems engineering perspective, VSEMO establishes an integrated decision cycle encompassing sensing, information fusion, risk inference, explanation, feedback, and learning. Beyond its theoretical contributions, the framework emphasizes operational accessibility and scalability. By combining standalone virtual reality hardware, commercially available physiological sensors, and modular software components, VSEMO significantly reduces the capital costs traditionally associated with high-fidelity maritime simulators while preserving the flexibility required for immersive operator training. This facilitates deployment across educational institutions, research laboratories, and professional maritime training centers without requiring specialized computational infrastructure.
Nevertheless, several limitations should be explicitly acknowledged. First, the current computational validation relies on synthetic datasets generated from representative operational scenarios rather than empirical measurements collected during real maritime operations; thus, the predictive performance of the GCN should be interpreted as an architectural proof of concept rather than a fully validated operational risk model. Second, the nonlinear mathematical formulation introduced in this work represents a conceptual systems-engineering abstraction intended to describe multi-twin interactions, rather than an identified physical model of vessel dynamics. Third, the present GCN estimates operational risk from static graph representations and does not yet capture temporal dependencies or long-term operator behavior. Finally, the current virtual reality setup is tailored for seated or standing bridge operations and does not reproduce tasks requiring extensive physical locomotion or high-end hydrodynamic solvers.
Author Contributions
Conceptualization, A.A.L.-A., P.P. and L.M.; methodology, A.A.L.-A., P.P. and L.M.; software, H.A.C.-G. and P.P.; validation, A.A.L.-A., P.P. and H.A.C.-G.; formal analysis, A.A.L.-A.; investigation, A.A.L.-A. and P.P.; resources, P.P. and L.M.; data curation, A.A.L.-A. and H.A.C.-G.; writing—original draft preparation, A.A.L.-A., P.P. and L.M.; writing—review and editing, P.P. and A.A.L.-A.; visualization, A.A.L.-A.; supervision, P.P. and L.M.; project administration, P.P. and L.M.; funding acquisition, P.P. and L.M. All authors have read and agreed to the published version of the manuscript.
Funding
This work is supported by the Office of Naval Research under Award Number N629092512062. The views expressed are those of the authors and do not reflect the official policy or position of the Department of War or the U.S Government.
Data Availability Statement
The original contributions presented in this study are included in the article. Further inquiries can be directed to the corresponding author.
Acknowledgments
The authors wish to express their gratitude for the support provided by the US Navy’s Office of Naval Research, the Artificial Intelligence for Manufacturing and Supply Chain Institute, and Tecnologico de Monterrey.
Conflicts of Interest
The authors declare no conflicts of interest.
Abbreviations
The following abbreviations are used in this manuscript:
| DT | Digital twin |
| HDT | Human digital twin |
| VSEMO | Virtual Symbiotic Environment for Maritime Operations |
| VR | Virtual reality |
| AR | Augmented reality |
| IoT | Internet of things |
| AI | Artificial intelligence |
| CPS | Cyber-physical system |
| PLM | Product lifecycle analysis |
| HMI | Human machine interface |
| DOF | Degree-of-Freedom |
| DL | Deep learning |
| MSE | Mean squared error |
| LSTM | Long short-term memory |
| AIS | Automated identification system |
| CNN | Convolutional neural network |
| MAPE | Mean absolute percentage error |
| FEA | Finite element analysis |
| MSFE | Multi-scale feature enhanced network |
| ECS | Engine control systems |
| EDA | Electrodermal activity |
| GSR | Galvanic skin response |
| HRV | Heart rate variability |
| LF/HF | Low frequency/high frequency |
| PVT | Psychomotor vigilance task |
| KSS | Karolinska sleepiness scale |
| PPG | Photoplethysmography |
| COLREGs | Convention on the International Regulations for Preventing Collisions at Sea |
| RMSSD | Root mean square of successive differences |
| BRM | Bridge resource management |
| CIC | Combat information center |
| HPSen | Human performance sensitivity |
| ES | Environmental sensitivity |
| MS | Machinery sensitivity |
| VRS | Virtual reality simulability |
| MF | Monitoring feasibility |
| TWS | Total weighted score |
| KPI | Key performance indicator |
| HMD | Head-mounted display |
| MR | Mixed reality |
| ML | Machine learning |
| HPS | Human performance stress |
| TRS | Traffic risk score |
| DRS | Docking risk score |
| GNN | Graph neural network |
| RMSE | Root mean squared error |
References
- Lee, J.H.; Nam, Y.S.; Kim, Y.; Liu, Y.; Lee, J.; Yang, H. Real-time digital twin for ship operation in waves. Ocean Eng. 2022, 266, 112867. [Google Scholar] [CrossRef] [Scilit]
- Han, S.; Li, F.; Lee, C.H.; Wang, T.; Diaconeasa, M.A. Mirror the mind of crew: Maritime risk analysis with explicit cognitive processes in a human digital twin. Adv. Eng. Inform. 2024, 62, 102746. [Google Scholar] [CrossRef] [Scilit]
- Chen, G.; Yang, J.; Huang, B.; Ma, C.; Tian, F.; Ge, L.; Xia, L.; Li, J. Toward digital twin of the ocean: From digitalization to cloning. Intell. Mar. Technol. Syst. 2023, 1, 3. [Google Scholar] [CrossRef] [Scilit]
- Madusanka, N.S.; Fan, Y.; Yang, S.; Xiang, X. Digital Twin in the Maritime Domain: A Review and Emerging Trends. J. Mar. Sci. Eng. 2023, 11, 1021. [Google Scholar] [CrossRef] [Scilit]
- Eom, J.O.; Yoon, J.H.; Yeon, J.H.; Kim, S.W. Port Digital Twin Development for Decarbonization: A Case Study Using the Pusan Newport International Terminal. J. Mar. Sci. Eng. 2023, 11, 1777. [Google Scholar] [CrossRef] [Scilit]
- Hasan, A.; Widyotriatmo, A.; Fagerhaug, E.; Osen, O. Predictive digital twins for autonomous surface vessels. Ocean Eng. 2023, 288, 116046. [Google Scholar] [CrossRef] [Scilit]
- Asad, U.; Khalid, A.; Lughmani, W.A.; Rasheed, S.; Khan, M.M. A Human Intention and Motion Prediction Framework for Applications in Human-Centric Digital Twins. Biomimetics 2025, 10, 656. [Google Scholar] [CrossRef] [Scilit]
- Raza, M.; Prokopova, H.; Huseynzade, S.; Azimi, S.; Lafond, S. Towards Integrated Digital-Twins: An Application Framework for Autonomous Maritime Surface Vessel Development. J. Mar. Sci. Eng. 2022, 10, 1469. [Google Scholar] [CrossRef] [Scilit]
- Schicker, I.; Bügelmayer-Blaschek, M.; Lexer, A.; Baier, K.; Hasel, K.; Gazzaneo, P. Beyond Resolution: Multi-Scale Weather and Climate Data for Alpine Renewable Energy in the Digital Twin Era—First Evaluations and Recommendations. arXiv 2025, arXiv:2511.05584. [Google Scholar]
- Glaessgen, E.; Stargel, D. The Digital Twin Paradigm for Future NASA and U.S. Air Force Vehicles. In Proceedings of the 53rd AIAA/ASME/ASCE/AHS/ASC Structures, Structural Dynamics and Materials Conference 20th AIAA/ASME/AHS Adaptive Structures Conference 14th AIAA, Honolulu, HA, USA, 23–26 April 2012. [Google Scholar] [CrossRef] [Scilit]
- Grieves, M. Digital Twin: Manufacturing Excellence through Virtual Factory Replication. White Pap. 2015, 1, 1–7. [Google Scholar]
- Yu, W.; Liu, G.; Zhu, L.; Yu, W. Digital Twin: A Literature Review of Concepts, Technologies, and Applications. IEEE Access 2025, 13, 183075–183095. [Google Scholar] [CrossRef] [Scilit]
- Cui, M.X.; He, K.H.; Wang, F.; Paik, J.K. Human Digital Healthcare Engineering for Enhancing the Health and Well-Being of Seafarers and Offshore Workers: A Comprehensive Review. Systems 2025, 13, 335. [Google Scholar] [CrossRef] [Scilit]
- Tao, F.; Zhang, M.; Nee, A. Five-Dimension Digital Twin Modeling and Its Key Technologies. In Digital Twin Driven Smart Manufacturing; Elsevier: Amsterdam, The Netherlands, 2019; pp. 63–81. [Google Scholar] [CrossRef] [Scilit]
- Semeraro, C.; Lezoche, M.; Panetto, H.; Dassisti, M. Digital twin paradigm: A systematic literature review. Comput. Ind. 2021, 130, 103469. [Google Scholar] [CrossRef] [Scilit]
- Zhang, M.; Tao, F.; Huang, B.; Liu, A.; Wang, L.; Anwer, N.; Nee, A.Y.C. Digital twin data: Methods and key technologies. Digit. Twin 2024, 1, 2. [Google Scholar] [CrossRef] [Scilit]
- Destination Earth. Climate Change Adaptation Digital Twin. Available online: https://destine.ecmwf.int/climate-digital-twin/ (accessed on 30 March 2026).
- Leutbecher, M.; Palmer, T. Ensemble forecasting. J. Comput. Phys. 2008, 227, 3515–3539. [Google Scholar] [CrossRef] [Scilit]
- Lubchenco, J.; Karl, T.R. Predicting and managing extreme weather events. Phys. Today 2012, 65, 31–37. [Google Scholar] [CrossRef] [Scilit]
- Schreck, J.S.; Sha, Y.; Chapman, W.; Kimpara, D.; Berner, J.; McGinnis, S.; Kazadi, A.; Sobhani, N.; Kirk, B.; Becker, C.; et al. Community Research Earth Digital Intelligence Twin: A scalable framework for AI-driven Earth System Modeling. npj Clim. Atmos. Sci. 2025, 8, 239. [Google Scholar] [CrossRef] [Scilit]
- Bauer, P.; Stevens, B.; Hazeleger, W. A digital twin of Earth for the green transition. Nat. Clim. Change 2021, 11, 80–83. [Google Scholar] [CrossRef] [Scilit]
- Miedtank, A.; Schneider, J.; Manss, C.; Zielinski, O. Marine digital twins for enhanced ocean understanding. Remote Sens. Appl. Soc. Environ. 2024, 36, 101268. [Google Scholar] [CrossRef] [Scilit]
- Vannière, B.; Sandu, I.; Gascon, E.; Forbes, R.; Polichtchouk, I.; Niekerk, A.V.; Suetzl, B.; Diamantakis, M.; Bechtold, P.; Balsamo, G. Towards a Digital Twin of the Earth: ECMWF’s effort to build a Kilometre-scale Earth System Model. In EGU General Assembly Conference Abstracts, Proceedings of the EGU General Assembly 2023, Vienna, Austria, 23–28 April 2023; Copernicus Publications: Göttingen, Germany, 2023. [Google Scholar] [CrossRef] [Scilit]
- Mordaschew, V.; Latos, B.; Tackenberg, S. A Human Digital Twin for Worker-Centric Production. Procedia Comput. Sci. 2025, 253, 2137–2146. [Google Scholar] [CrossRef] [Scilit]
- Park, J.; Park, E.; Lee, D.; Kang, S.; Lee, T.; Hong, H.; Lee, S.J.; Kim, H.; Park, Y.R.; Lee, U. Human Digital Twins for pervasive healthcare: A scoping review. Health Inform. J. 2025, 31, 1–22. [Google Scholar] [CrossRef] [Scilit] [PubMed]
- Gaffinet, B.; Ali, J.A.H.; Naudet, Y.; Panetto, H. Human Digital Twins: A systematic literature review and concept disambiguation for industry 5.0. Comput. Ind. 2025, 166, 104230. [Google Scholar] [CrossRef] [Scilit]
- Gong, Y.; Qi, F.; Wang, J.Y.; Liu, Y.; Ma, T.; Cheng, Z.; Jiang, Y.; Chen, R.; Wang, X.; Luo, L.; et al. An Interactive Platform for a High Performance Digital Twin of a Human Heart. In Proceedings of the 2023 IEEE International Conference on Metaverse Computing, Networking and Applications (MetaCom), Kyoto, Japan, 26–28 June 2023; pp. 193–200. [Google Scholar] [CrossRef] [Scilit]
- Johnson, Z.; Saikia, M.J. Digital Twins for Healthcare Using Wearables. Bioengineering 2024, 11, 606. [Google Scholar] [CrossRef] [Scilit] [PubMed]
- Naudet, Y.; Baudet, A.; Risse, M. Human Digital Twin in Industry 4.0: Concept and Preliminary Model. In Proceedings of the 2nd International Conference on Innovative Intelligent Industrial Production and Logistics, Virtual, 25–27 October 2021; SCITEPRESS–Science and Technology Publications: Setúbal, Portugal, 2021; pp. 137–144. [Google Scholar] [CrossRef] [Scilit]
- Albydhany, M.H.; Al-Darraji, I. Explainable AI for Visual Inspection: A Comparative Analysis and Review. J. Vis. Exp. 2025, 224, e69440. [Google Scholar] [CrossRef] [Scilit] [PubMed]
- Rosário, A.T.; Dias, J.C. Illuminating Industry Evolution: Reframing Artificial Intelligence Through Transparent Machine Reasoning. Information 2025, 16, 1044. [Google Scholar] [CrossRef] [Scilit]
- Nguyen, L.V.; Ho, H.T. Explainable Intelligence in Digital Twins: State-of-the-Art and Open Challenges; Lecture Notes in Electrical Engineering; Springer: Singapore, 2026; pp. 1–14. [Google Scholar] [CrossRef] [Scilit]
- Kobayashi, K.; Alam, S.B. Explainable, interpretable, and trustworthy AI for an intelligent digital twin: A case study on remaining useful life. Eng. Appl. Artif. Intell. 2024, 129, 107620. [Google Scholar] [CrossRef] [Scilit]
- Zhang, Y.; Methnani, L.; Brorsson, E.; Zohrevandi, E.; Darnell, A.; Kucher, K. Designing Explainable and Counterfactual-Based AI Interfaces for Operators in Process Industries. In Proceedings of the 20th International Joint Conference on Computer Vision, Imaging and Computer Graphics Theory and Applications, Porto, Portugal, 26–28 February 2025; SCITEPRESS–Science and Technology Publications: Setúbal, Portugal, 2025; pp. 831–842. [Google Scholar] [CrossRef] [Scilit]
- Sumathi, M.S.; Prathiba, N.; Raghunandan, G.H.; Savitha, M.M. Lightweight explainable energy-aware deep learning-based task scheduling for microcontroller embedded systems. Discov. Comput. 2026, 29, 416. [Google Scholar] [CrossRef] [Scilit]
- Hramov, A.E.; Pisarchik, A.N. Big Data Management and Quality Evaluation for the Implementation of AI Technologies in Smart Manufacturing. Appl. Sci. 2025, 15, 11905. [Google Scholar] [CrossRef] [Scilit]
- Decker, T.; Gross, R.; Koebler, A.; Lebacher, M.; Schnitzer, R.; Weber, S.H. The Thousand Faces of Explainable AI Along the Machine Learning Life Cycle: Industrial Reality and Current State of Research; Lecture Notes in Computer Science (Including Subseries Lecture Notes in Artificial Intelligence and Lecture Notes in Bioinformatics); Springer: Cham, Switzerland, 2023; pp. 184–208. [Google Scholar] [CrossRef] [Scilit]
- Agüero-Tobar, M.A.; González-Araya, M.C.; González-Ramírez, R.G. Assessment of maritime operations efficiency and its economic impact based on data envelopment analysis: A case study of Chilean ports. Res. Transp. Bus. Manag. 2023, 46, 100821. [Google Scholar] [CrossRef] [Scilit]
- Bye, R.J.; Holmen, I.M.; Størkersen, K.V. Safety in marine and maritime operations: Uniting systems and practice. Saf. Sci. 2021, 139, 105249. [Google Scholar] [CrossRef] [Scilit]
- Christiansen, M.; Fagerholt, K.; Nygreen, B.; Ronen, D. Chapter 4 Maritime Transportation. In Handbooks in Operations Research and Management Science; Elsevier: Amsterdam, The Netherlands, 2007; Volume 14, pp. 189–284. [Google Scholar] [CrossRef] [Scilit]
- Hanowsky, M.; Mitchell, K.N.; Kothari, K.; Lillycrop, W.J.; Loney, D. Optimal scheduling of maintenance dredging in a maritime transportation system. Marit. Transp. Res. 2024, 6, 100113. [Google Scholar] [CrossRef] [Scilit]
- Rahayu, L.; Busscher, T.; Tillema, T.; Woltjer, J. Maritime transport governance challenges in the Global South. Mar. Policy 2024, 163, 106147. [Google Scholar] [CrossRef] [Scilit]
- Major, P.; Li, G.; Zhang, H.; Hildre, H.P. Real-Time Digital Twin Of Research Vessel for Remote Monitoring. In Proceedings of the ECMS 2021 Proceedings, Virtual, 31 May–2 June 2021; pp. 159–164. [Google Scholar] [CrossRef] [Scilit]
- Liu, Y.; Shangguan, D.; Chen, L.; Liu, X.; Yin, G.; Li, G. Multi-Domain Digital Twin and Real-Time Performance Optimization for Marine Steam Turbines. Symmetry 2025, 17, 689. [Google Scholar] [CrossRef] [Scilit]
- Campbell, J.N.; Ferreira, M.D.; Isenor, A.W. Generation of Vessel Track Characteristics Using a Conditional Generative Adversarial Network (CGAN). Appl. Artif. Intell. 2024, 38, 2360283. [Google Scholar] [CrossRef] [Scilit]
- Oraith, H.; Blanco-Davis, E.; Yang, Z.; Matellini, B. An Evaluation of the Effects of Human Factors on Pilotage Operations Safety. J. Mar. Sci. Appl. 2021, 20, 393–409. [Google Scholar] [CrossRef] [Scilit]
- Karanam, S.A.K.; Hartman, N.W. A systematic review of Digital Twin (DT) and virtual learning environments (VLE) for smart manufacturing education. Manuf. Lett. 2025, 44, 1597–1608. [Google Scholar] [CrossRef] [Scilit]
- Kunkera, Z.; Opetuk, T.; Hadžić, N.; Tošanović, N. Using Digital Twin in a Shipbuilding Project. Appl. Sci. 2022, 12, 12721. [Google Scholar] [CrossRef] [Scilit]
- Kunkera, Z.; Željković, I.; Mimica, R.; Ljubenkov, B.; Opetuk, T. Development of Augmented Reality Technology Implementation in a Shipbuilding Project Realization Process. J. Mar. Sci. Eng. 2024, 12, 550. [Google Scholar] [CrossRef] [Scilit]
- Taylor, N.C.; Bekker, A.; Kruger, K. Mariner 4.0: Integrating Seafarers into a maritime 4.0 environment. Int. J. Marit. Eng. 2023, 164, 373–384. [Google Scholar] [CrossRef] [Scilit]
- Baylon, A.; Santos, E.M. Digital Twin Technology in Maritime: A MAAP Innovation Strategy. TransNav Int. J. Mar. Navig. Saf. Sea Transp. 2025, 19, 1229–1235. [Google Scholar] [CrossRef] [Scilit]
- Saariluoma, P.; Karvonen, A.; Sorsamäki, L. Human Digital Twins in Acquiring Information About Human Mental Processes for Cognitive Mimetics. In Frontiers in Artificial Intelligence and Applications; IOS Press BV: Washington, DC, USA, 2022; Volume 343, pp. 163–176. [Google Scholar] [CrossRef] [Scilit]
- Dubey, A.C.; Subramanian, A.V.; Kumar, V.J. Steering model identification and control design of autonomous ship: A complete experimental study. Ships Offshore Struct. 2022, 17, 992–1004. [Google Scholar] [CrossRef] [Scilit]
- Kinaci, O.K. Ship digital twin architecture for optimizing sailing automation. Ocean Eng. 2023, 275, 114128. [Google Scholar] [CrossRef] [Scilit]
- Atasayan, E.; Milanov, E.; Alkan, A.D. Application of an offline grey box method for predicting the manoeuvring performance. Brodogradnja 2024, 75, 75304. [Google Scholar] [CrossRef] [Scilit]
- Nielsen, R.E.; Papageorgiou, D.; Nalpantidis, L.; Jensen, B.T.; Blanke, M. Machine learning enhancement of manoeuvring prediction for ship Digital Twin using full-scale recordings. Ocean Eng. 2022, 257, 111579. [Google Scholar] [CrossRef] [Scilit]
- Schirmann, M.L.; Collette, M.D.; Gose, J.W. Data-driven models for vessel motion prediction and the benefits of physics-based information. Appl. Ocean Res. 2022, 120, 102916. [Google Scholar] [CrossRef] [Scilit]
- Schirmann, M.L.; Gose, J.W.; Collette, M.D. A comparison of physics-informed data-driven modeling architectures for ship motion predictions. Ocean Eng. 2023, 286, 115608. [Google Scholar] [CrossRef] [Scilit]
- Shehata, A.; Zhang, M.; Tsoulakos, N.; Kujala, P. A Transformer based task execution digital twin of 3-DOF maneuvering of Bulk Carrier for autonomous maritime systems. Ocean Eng. 2025, 341, 122797. [Google Scholar] [CrossRef] [Scilit]
- Palma, G.; Serani, A.; Aram, S.; Wundrow, D.W.; Drazen, D.; Diez, M. Bayesian Hankel dynamic mode decomposition for ship motion digital twinning. Appl. Ocean Res. 2025, 165, 104863. [Google Scholar] [CrossRef] [Scilit]
- Chu, Y.; Li, G.; Hatledal, L.I.; Holmeset, F.T.; Zhang, H. Coupling of dynamic reaction forces of a heavy load crane and ship motion responses in waves. Ships Offshore Struct. 2021, 16, 58–67. [Google Scholar] [CrossRef] [Scilit]
- Fonseca, Í.A.; Gaspar, H.M.; de Mello, P.C.; Sasaki, H.A.U. A Standards-Based Digital Twin of an Experiment with a Scale Model Ship. Comput.-Aided Des. 2022, 145, 103191. [Google Scholar] [CrossRef] [Scilit]
- Fonseca, Í.A.; de Oliveira, F.F.; Gaspar, H.M. Open Framework for Digital Twin Ship Data: Case Studies on Handling of Multiple Taxonomies and Navigation Simulation. Int. J. Marit. Eng. 2023, 165, 23–42. [Google Scholar] [CrossRef] [Scilit]
- Wu, A.; Che, T.; Chen, J.; Zhu, X.; Xu, Q.; Dou, T.; Zhang, R.; Chen, S.; Wang, J.; Guo, Y. RouteView 2.0: A real-time operational planning system for vessels on the Arctic Northeast Passage. Environ. Model. Softw. 2025, 191, 106464. [Google Scholar] [CrossRef] [Scilit]
- Liao, R.; Zhang, Y.; Wang, H.; Mao, J.; Li, A.; Chen, Z. Digital twin-assisted automatic ship size measurement for ship–bridge collision early warning systems. J. Zhejiang Univ.-Sci. A 2026, 27, 1–11. [Google Scholar] [CrossRef] [Scilit]
- Stoumpos, S.; Theotokatos, G. A novel methodology for marine dual fuel engines sensors diagnostics and health management. Int. J. Engine Res. 2022, 23, 974–994. [Google Scholar] [CrossRef] [Scilit]
- Jeon, J.; Theotokatos, G. A methodology to develop and manage data-driven models for marine engine long-term health prognosis. ISA Trans. 2025, 175, 3–15. [Google Scholar] [CrossRef] [Scilit] [PubMed]
- Vrvilo, P.; Vidović, T.; Radica, G.; Roldo, L. Methods and equipment for analysis and diagnosis of marine engines during navigation. Energy Sources Part A Recovery Util. Environ. Eff. 2024, 46, 15808–15824. [Google Scholar] [CrossRef] [Scilit]
- Taghavi, M.; Perera, L.P. Advanced data cluster analyses in digital twin development for marine engines towards ship performance quantification. Ocean Eng. 2024, 298, 117098. [Google Scholar] [CrossRef] [Scilit]
- Kim, H. A real-time lifecycle analysis model with digital twin and novel control method for enhancing the environmental performance of electric/hybrid propulsion ships. Ocean Eng. 2025, 329, 121195. [Google Scholar] [CrossRef] [Scilit]
- Wei, P.; Li, C.; Jiang, Z.; Wang, D. Real-time simulation of ship structure based on virtual-real fusion interaction. Ocean Eng. 2024, 295, 116815. [Google Scholar] [CrossRef] [Scilit]
- Yao, Y.; Gao, Z.; Lu, H.; Cao, X.; Tang, J.; Hao, X.; Zhang, M.; Liu, L. Structural performance prediction of marine stabilizer fins based on multi-scale feature enhancement network and digital twins. Ocean Eng. 2025, 319, 120277. [Google Scholar] [CrossRef] [Scilit]
- Sim, K.; Kim, B.W.; Han, J.S.; Lee, K. Structural Response Evaluation of Krylov Subspace-Based Reduced-Order Model for Real-Time Structural Health Monitoring and Prediction of Container Ships. J. Ocean Eng. Technol. 2025, 39, 276–286. [Google Scholar] [CrossRef] [Scilit]
- Parasyris, A.; Metheniti, V.; Alexandrakis, G.; Kozyrakis, G.V.; Kampanis, N.A. Data Assimilated Atmospheric Forecasts for Digital Twin of the Ocean Applications: A Case Study in the South Aegean, Greece. Algorithms 2024, 17, 586. [Google Scholar] [CrossRef] [Scilit]
- Liu, X.; He, Y.; Zhang, K.; Mou, J.; Zhang, K.; Zhao, X. Research on the decision-making method for autonomous navigation for the ocean-going ship in the ships’ routeing waters. Ocean Eng. 2025, 323, 120641. [Google Scholar] [CrossRef] [Scilit]
- Xiang, J.; Xia, G.; Liu, H.; Zhou, W.; Ma, Y. Auto-constructed PID-based search algorithm for ship parameter identification under environmental disturbances. Ships Offshore Struct. 2026, 1–17. [Google Scholar] [CrossRef] [Scilit]
- Han, X.; Leira, B.J.; Sævik, S. Vessel hydrodynamic model tuning by Discrete Bayesian updating using simulated onboard sensor data. Ocean Eng. 2021, 220, 108407. [Google Scholar] [CrossRef] [Scilit]
- Röttger, S.; Vetter, S.; Kowalski, J.T. Effects of a classroom-based bridge resource management training on knowledge, attitudes, behaviour and performance of junior naval officers. WMU J. Marit. Aff. 2016, 15, 143–162. [Google Scholar] [CrossRef] [Scilit]
- Shi, K.; Fan, S.; Weng, J.; Yang, Z. Seafarer competency analysis: Data-driven model in restricted waters using Bayesian networks. Ocean Eng. 2024, 311, 119001. [Google Scholar] [CrossRef] [Scilit]
- O’Connor, P. Assessing the Effectiveness of Bridge Resource Management Training. Int. J. Aviat. Psychol. 2011, 21, 357–374. [Google Scholar] [CrossRef] [Scilit]
- Hung, T.E.; Lin, J.H.; Chang, C.C. Influence of watchkeeping experience on workload during ship manoeuvring simulations. Ergonomics 2026, 1–11. [Google Scholar] [CrossRef] [Scilit] [PubMed]
- Bhagat, S.; Kim, T.E.; Munim, Z.H. A weighted KSA framework for measuring ship navigator competence in loss-of-ship-control scenarios. Case Stud. Transp. Policy 2026, 25, 101880. [Google Scholar] [CrossRef] [Scilit]
- Orlandi, L.; Brooks, B.; Bowles, M. A Comparison of Marine Pilots’ Planning and Manoeuvring Skills: Uncovering Mental Models to Assess Shiphandling and Explore Expertise. J. Navig. 2015, 68, 897–914. [Google Scholar] [CrossRef] [Scilit]
- Xue, H.; Batalden, B.M.; Røds, J.F. Development of a SAGAT Query and Simulator Experiment to Measure Situation Awareness in Maritime Navigation. In Proceedings of the Advances in Intelligent Systems and Computing; Springer: Berlin/Heidelberg, Germany, 2020; Volume 1212, pp. 468–474. [Google Scholar] [CrossRef] [Scilit]
- Karimpour, R.; Figari, M.; Martelli, M. Manual marine generator synchronisation under automation failure: A dual SAGAT–SART study of situational awareness in a ship engine-room simulator. J. Mar. Eng. Technol. 2026, 25, 781–793. [Google Scholar] [CrossRef] [Scilit]
- Mahadevan, H.S.; Kumar, A.; Grundmann, R.; Schwarze, A. Assessment of Situational Awareness in Relation to Advanced Navigation Systems Using Ship Handling Simulators. Eng. Proc. 2025, 88, 36. [Google Scholar] [CrossRef] [Scilit]
- Atik, O. Eye tracking for assessment of situational awareness in bridge resource management training. J. Eye Mov. Res. 2020, 12, 1–18. [Google Scholar] [CrossRef] [Scilit] [PubMed]
- Jiang, S.; Chen, W.; Kang, Y. Correlation Evaluation of Pilots’ Situation Awareness in Bridge Simulations via Eye-Tracking Technology. Comput. Intell. Neurosci. 2021, 2021, 7122437. [Google Scholar] [CrossRef] [Scilit] [PubMed]
- Sharma, A.; Eun Kim, T. Exploring technical and non-technical competencies of navigators for autonomous shipping. Marit. Policy Manag. 2022, 49, 831–849. [Google Scholar] [CrossRef] [Scilit]
- Sandhåland, H.; Oltedal, H.A.; Hystad, S.W.; Eid, J. Distributed situation awareness in complex collaborative systems: A field study of bridge operations on platform supply vessels. J. Occup. Organ. Psychol. 2015, 88, 273–294. [Google Scholar] [CrossRef] [Scilit] [PubMed]
- Shi, K.; Weng, J.; Fan, S.; Yang, Z.; Ding, H. Exploring seafarers’ emotional responses to emergencies: An empirical study using a shiphandling simulator. Ocean Coast. Manag. 2023, 243, 106736. [Google Scholar] [CrossRef] [Scilit]
- Nishimura, N.; Murai, K.; Hayashi, Y. Basic study of a mental workload for student’s simulator training using heart rate variability, salivary amylase activity and facial temperature. In Proceedings of the 2011 6th International Conference on System of Systems Engineering, Albuquerque, NM, USA, 27–30 June 2011; pp. 67–71. [Google Scholar] [CrossRef] [Scilit]
- Hama, K.; Murai, K.; Hayashi, Y.; Stone, L.C. Evaluation of ship navigator’s mental workload for ship handling based on physiological indices. In Proceedings of the 2009 IEEE International Conference on Systems, Man and Cybernetics, San Antonio, TX, USA, 11–14 October 2009; pp. 228–232. [Google Scholar] [CrossRef] [Scilit]
- Hsieh, M.H.; Xia, Z.; Lim, W.; Chen, C.H. Detecting In-the-Wild Stress and Fatigue of Vessel Traffic Operators Based on Heart Rate Variability. In Engineering for Social Change, Proceedings of the 31st ISTE International Conference on Transdisciplinary Engineering, London, UK, 9–11 July 2024; SAGE Publications: Washington, DC, USA, 2024. [Google Scholar] [CrossRef] [Scilit]
- King, L.A. Visual Navigation Patterns and Cognitive Load; Lecture Notes in Computer Science (LNAI); Springer: Berlin/Heidelberg, Germany, 2009; Volume 5638, pp. 254–259. [Google Scholar] [CrossRef] [Scilit]
- Moharana, B.; Hynes, E.; Keighrey, C.; Murray, N. Exploring the Role of Pupil Dilation and Blink Rate in Perceived Workload in Collaborative Virtual Reality. In Proceedings of the 2025 IEEE Conference on Virtual Reality and 3D User Interfaces Abstracts and Workshops (VRW), Saint Malo, France, 8–12 March 2025; pp. 544–551. [Google Scholar] [CrossRef] [Scilit]
- Nechyporenko, A.; Frohme, M.; Strelchuk, Y.; Omelchenko, V.; Gargin, V.; Ishchenko, L.; Alekseeva, V. Galvanic Skin Response and Photoplethysmography for Stress Recognition Using Machine Learning and Wearable Sensors. Appl. Sci. 2024, 14, 11997. [Google Scholar] [CrossRef] [Scilit]
- Kartoğlu, C.; Kum, S. Assessment of Electronic Navigation Equipment’s Effect to Mental Workload by Utilising Revised Nasa Task Load Index; CRC Press: Boca Raton, FL, USA, 2017; pp. 23–28. [Google Scholar] [CrossRef] [Scilit]
- McCauley, M.E.; McCauley, P.; Riedy, S.M.; Banks, S.; Ecker, A.J.; Kalachev, L.V.; Rangan, S.; Dinges, D.F.; Dongen, H.P.V. Fatigue risk management based on self-reported fatigue: Expanding a biomathematical model of fatigue-related performance deficits to also predict subjective sleepiness. Transp. Res. Part F Traffic Psychol. Behav. 2021, 79, 94–106. [Google Scholar] [CrossRef] [Scilit] [PubMed]
- Wang, Z.; Xu, H.; Teng, C.; Wang, C. Effects of a simulated maritime shift schedule on vigilance, sleep, and sleepiness. Chronobiol. Int. 2024, 41, 237–247. [Google Scholar] [CrossRef] [Scilit] [PubMed]
- Pan, Y.; Renganayagalu, S.K.; Komandur, S. Tactile Cues for Ship Bridge Operations. In Proceedings of the ECMS 2013, Alesund, Norway, 27–30 May 2013; pp. 177–183. [Google Scholar] [CrossRef] [Scilit]
- Coraddu, A.; Oneto, L.; de Maya, B.N.; Kurt, R. Determining the most influential human factors in maritime accidents: A data-driven approach. Ocean Eng. 2020, 211, 107588. [Google Scholar] [CrossRef] [Scilit]
- Ma, L.; Ma, X.; Wang, T.; Zhao, Y.; Lan, H. A data-driven approach to determine the distinct contribution of human factors to different types of maritime accidents. Ocean Eng. 2024, 295, 116874. [Google Scholar] [CrossRef] [Scilit]
- Artanto, D.; Pitana, T.; Ciptomulyono, U.; Adisha, A.G. Analysis of Environmental Factors on Maritime Security Operations Using the Bayesian Network Method. IOP Conf. Ser. Earth Environ. Sci. 2024, 1298, 012027. [Google Scholar] [CrossRef] [Scilit]
- Islam, R.; Abbassi, R.; Garaniya, V.; Khan, F. Development of a human reliability assessment technique for the maintenance procedures of marine and offshore operations. J. Loss Prev. Process Ind. 2017, 50, 416–428. [Google Scholar] [CrossRef] [Scilit]
- Fan, C.; Wróbel, K.; Montewka, J.; Gil, M.; Wan, C.; Zhang, D. A framework to identify factors influencing navigational risk for Maritime Autonomous Surface Ships. Ocean Eng. 2020, 202, 107188. [Google Scholar] [CrossRef] [Scilit]
- Ponce, P.; Montesinos, L. AI-Based Framework for Virtual Reality Maritime Operations Training. In Proceedings of the Interservice/Industry Training, Simulation, and Education Conference (I/ITSEC), Orlando, FL, USA, 30 November–3 December 2026. Paper No. 26381. [Google Scholar]
- D’augusta, V.; Longo, F.; Manfredi, K.A.; Mirabelli, G.; Nicoletti, L.; Solina, V.; Talarico, S. Enhancing Maritime Training: The Role of VR in Ship Bridge Simulators - The CAL-TEK Case Study. In Proceedings of the 26th International Conference on Harbor, Maritime and Multimodal Logistic Modeling & Simulation, CAL-TEK Srl, Tenerife, Spain, 18–20 September 2024. [Google Scholar] [CrossRef] [Scilit]
- Guo, F.B.; Yang, Z.; Davis, E.B.; Khalique, A.; Bury, A. Does Being Human Cause Human Errors? Consideration of Human-Centred Design in Ship Bridge Design. In Advances in Neuroergonomics and Cognitive Engineering. AHFE 2021; Springer: Cham, Switzerland, 2021; pp. 302–309. [Google Scholar] [CrossRef] [Scilit]
- Mallam, S.C.; Nazir, S.; Renganayagalu, S.K. Rethinking Maritime Education, Training, and Operations in the Digital Era: Applications for Emerging Immersive Technologies. J. Mar. Sci. Eng. 2019, 7, 428. [Google Scholar] [CrossRef] [Scilit]
- Petermann, F.M.; Alsos, O.A.; Papachristos, E.; Andersen, C.O.S.; Madsen, A.N. Maritime Head-up Display (mHUD): A safety-enhancing navigational tool for ship bridges and remote operation centres. J. Navig. 2025, 78, 221–245. [Google Scholar] [CrossRef] [Scilit]
- Nordby, K.; Fauske, J.E.; Gernez, E.; Mallam, S. A User Interface Design Framework for Augmented-Reality-Supported Maritime Navigation. J. Mar. Sci. Eng. 2024, 12, 505. [Google Scholar] [CrossRef] [Scilit]
- Bolierakis, S.N.; Kostovasili, M.; Karagiannidis, L.; Amditis, A. Training on LSA lifeboat operation using Mixed Reality. Virtual Real. Intell. Hardw. 2023, 5, 201–212. [Google Scholar] [CrossRef] [Scilit]
- Monteiro, T.G.; Li, G.; Skourup, C.; Zhang, H. Investigating an Integrated Sensor Fusion System for Mental Fatigue Assessment for Demanding Maritime Operations. Sensors 2020, 20, 2588. [Google Scholar] [CrossRef] [Scilit] [PubMed]
- Abaei, M.M.; Abbassi, R.; Garaniya, V.; Arzaghi, E.; Toroody, A.B. A dynamic human reliability model for marine and offshore operations in harsh environments. Ocean Eng. 2019, 173, 90–97. [Google Scholar] [CrossRef] [Scilit]
- Fan, S.; Yang, Z. Accident data-driven human fatigue analysis in maritime transport using machine learning. Reliab. Eng. Syst. Saf. 2024, 241, 109675. [Google Scholar] [CrossRef] [Scilit]
- Zhao, Z.; Wadsworth, E.; Jepsen, J.R.; van Leeuwen, W.M. Comparison of perceived fatigue levels of seafarers and management approaches in fatigue mitigation: Case studies from two Chinese and two European shipping companies. Mar. Policy 2020, 116, 103897. [Google Scholar] [CrossRef] [Scilit]
- Kandemir, C.; Celik, M. Determining the error producing conditions in marine engineering maintenance and operations through HFACS-MMO. Reliab. Eng. Syst. Saf. 2021, 206, 107308. [Google Scholar] [CrossRef] [Scilit]
- Tam, K.; Hopcraft, R.; Crichton, T.; Jones, K. The potential mental health effects of remote control in an autonomous maritime world. J. Int. Marit. Saf. Environ. Aff. Shipp. 2021, 5, 40–55. [Google Scholar] [CrossRef] [Scilit]
- Li, X.; Yuen, K.F. A human-centred review on maritime autonomous surfaces ships: Impacts, responses, and future directions. Transp. Rev. 2024, 44, 791–810. [Google Scholar] [CrossRef] [Scilit]
- Cheliotis, M.; Lazakis, I.; Theotokatos, G. Machine learning and data-driven fault detection for ship systems operations. Ocean Eng. 2020, 216, 107968. [Google Scholar] [CrossRef] [Scilit]
- Kandemir, C.; Celik, M.; Akyuz, E.; Aydin, O. Application of human reliability analysis to repair & maintenance operations on-board ships: The case of HFO purifier overhauling. Appl. Ocean Res. 2019, 88, 317–325. [Google Scholar] [CrossRef] [Scilit]
- Pitana, T.; Pramudhita, M.T.; Siswantoro, N.; Napitupulu, J.R.C. Application of virtual reality as an alternative training media as complement of ship bridge simulator (case study: Port of tanjung emas semarang). IOP Conf. Ser. Earth Environ. Sci. 2023, 1166, 012049. [Google Scholar] [CrossRef] [Scilit]
- Ngodang, T.; Murai, K.; Hayashi, Y.; Mitomo, N.; Yoshimura, K.; Hikida, K. The Effect of Motion-Induced Factor on the Operator Performance during Ship’s Watch. In Proceedings of the 2013 IEEE International Conference on Systems, Man, and Cybernetics, Manchester, UK, 13–16 October 2013; pp. 4595–4600. [Google Scholar] [CrossRef] [Scilit]
- Markopoulos, E.; Markopoulos, P.; Laivuori, N.; Moridis, C.; Luimula, M. Finger tracking and hand recognition technologies in virtual reality maritime safety training applications. In Proceedings of the 2020 11th IEEE International Conference on Cognitive Infocommunications (CogInfoCom), Mariehamn, Finland, 23–25 September 2020; pp. 000251–000258. [Google Scholar] [CrossRef] [Scilit]
- Jiang, R.; Fan, S. Seafarer Mental Workload Assessment Using a Hybrid Deep Learning Model. TransNav 2025, 19, 55–60. [Google Scholar] [CrossRef] [Scilit]
- Grech, M. Marine Transport: Using Technologies for Managing the Risk of Fatigue at Sea. In The Handbook of Fatigue Management in Transportation; CRC Press: Boca Raton, FL, USA, 2023; pp. 455–466. [Google Scholar] [CrossRef] [Scilit]
- Fabrizio, A.; Rocchi, E.; Carnevale, A.; Ferrarotti, A.; Papalia, R.; Schena, E.; Longo, U.G.; Carli, M. Performance Evaluation of Meta Quest 3 and Meta Quest Pro in Static and Dynamic Conditions for Shoulder Rehabilitation in Virtual Reality. IEEE Access 2026, 14, 61772–61783. [Google Scholar] [CrossRef] [Scilit]
- Xin, Z.; Yano, H.; Fujitsuka, K.; Amemiya, T.; Yem, V. Waterless virtual footbath using airflow and thermal contrast: Design and exploratory evaluation of relaxation-oriented VR experience. Front. Virtual Real. 2026, 7, 1826083. [Google Scholar] [CrossRef] [Scilit]
- Caeiro-Rodríguez, M.; Otero-González, I.; Mikic-Fonte, F.A.; Llamas-Nistal, M. A Systematic Review of Commercial Smart Gloves: Current Status and Applications. Sensors 2021, 21, 2667. [Google Scholar] [CrossRef] [Scilit] [PubMed]
- Schmücker, V.; Jakob, R.; Grensing, F.; Brück, R.; Eiler, T. Extension of an Existing VR Memory Training with Haptic Impressions due to a Haptic Vest. Curr. Dir. Biomed. Eng. 2023, 9, 186–189. [Google Scholar] [CrossRef] [Scilit]
- Madur, P.; Bureti, N.; Rajeshkumar, S.J.; Mangalraj, P. Digital Twins for Sophisticated Laboratory Automation for Energy Management and Security. In Proceedings of the 2025 International Conference on Computer, Electrical & Communication Engineering (ICCECE), Kolkata, India, 7–8 February 2025; pp. 1–8. [Google Scholar] [CrossRef] [Scilit]
- Ramprasad, R.; Priya, R.S.; Narayanan, J. Augmenting Blueprints: A Mobile AR Viewer for Architectural Prototypes. In Proceedings of the 2024 International Conference on Advances in Computing, Communication and Applied Informatics (ACCAI), Chennai, India, 9–10 May 2024; pp. 1–7. [Google Scholar] [CrossRef] [Scilit]
- Hu, T.; Yang, F.; Scargill, T.; Gorlatova, M. Apple v.s. Meta: A Comparative Study on Spatial Tracking in SOTA XR Headsets. In Proceedings of the 30th Annual International Conference on Mobile Computing and Networking, Washington, DC, USA, 19–22 November 2024; pp. 2120–2127. [Google Scholar] [CrossRef] [Scilit]
- Rao, L.; Park, Y.; Klement, A.; Kang, C.; Park, E.; Zhuang, J.; Kim, C.; Chiu, H.Y.; Ning, R.; Wang, D.; et al. Infinite Display for Meta Quest Pro. SID Symp. Dig. Tech. Pap. 2023, 54, 32–35. [Google Scholar] [CrossRef] [Scilit]
- Aros, M.; Arnold, H.; Chaparro, B. Exploring Device Usability: A Heuristic Evaluation of the Apple Vision Pro and Meta Quest 3. In Communications in Computer and Information Science; Springer: Cham, Switzerland, 2025; pp. 3–12. [Google Scholar] [CrossRef] [Scilit]
- Egger, J.; Gsaxner, C.; Luijten, G.; Chen, J.; Chen, X.; Bian, J.; Kleesiek, J.; Puladi, B. Is the Apple Vision Pro the Ultimate Display? A First Perspective and Survey on Entering the Wonderland of Precision Medicine. JMIR Serious Games 2024, 12, e52785. [Google Scholar] [CrossRef] [Scilit] [PubMed]
- Dakeev, M.; Basith, I.; Obeidat, S.; Pecen, R.; Yildiz, F.; Maliassova, A.; Horton, P. Comparative Analysis of Haptic Gloves for Custom-Developed VR Applications. In Proceedings of the 2024 ASEE Annual Conference & Exposition Proceedings, ASEE Conferences, Portland, OR, USA, 23–26 June 2024; pp. 2012–2025. [Google Scholar] [CrossRef] [Scilit]
- Monica, R.; Aleotti, J. Improving virtual reality navigation tasks using a haptic vest and upper body tracking. Displays 2023, 78, 102417. [Google Scholar] [CrossRef] [Scilit]
- Ponce, P.; Montesinos, L. Towards a Human-Machine-Environment Digital Twin Framework for Maritime Operations. In Proceedings of the IEEE International Conference on Systems, Man, and Cybernetics (SMC), Bellevue, WA, USA, 4–7 October 2026. [Google Scholar]
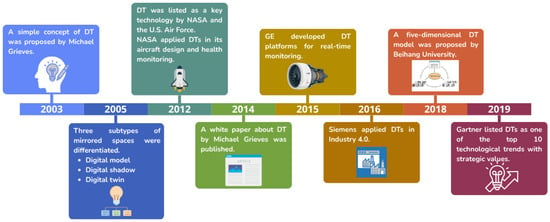
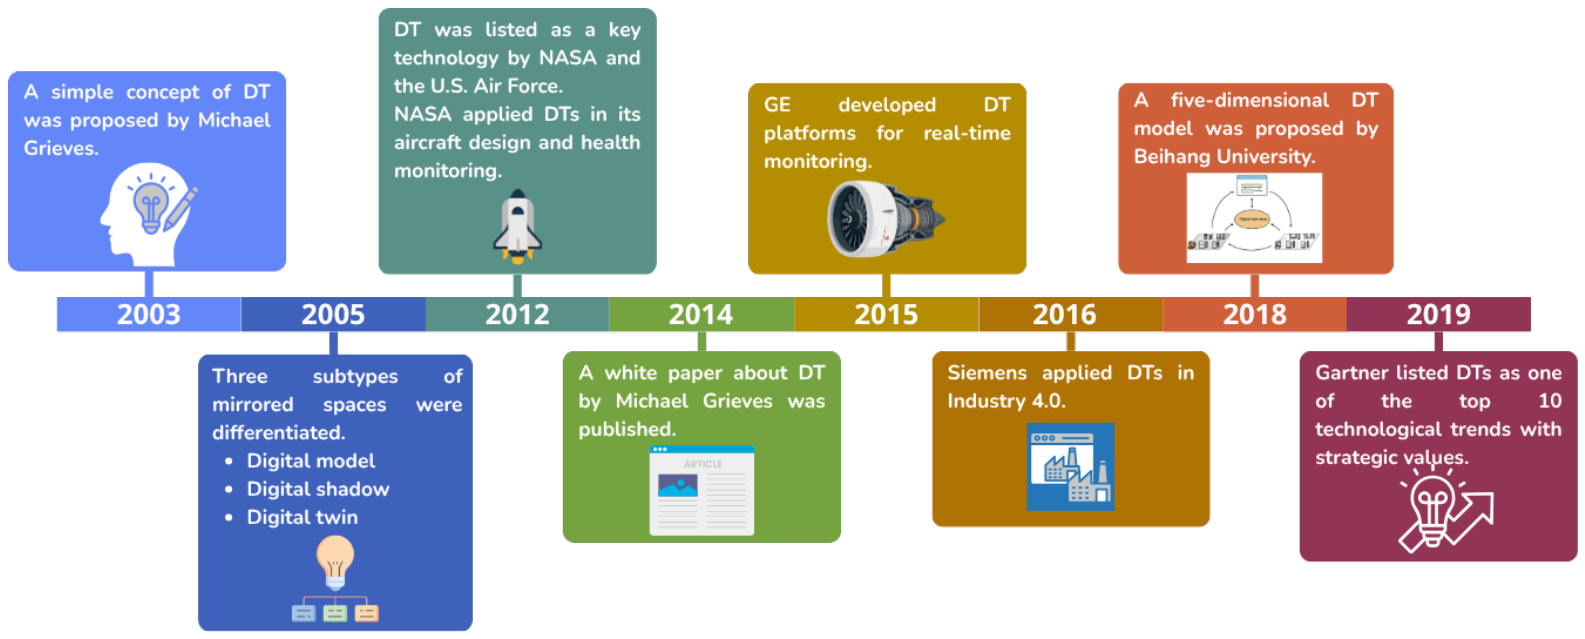
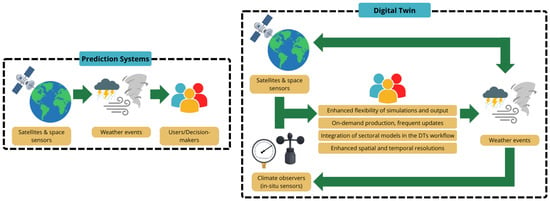
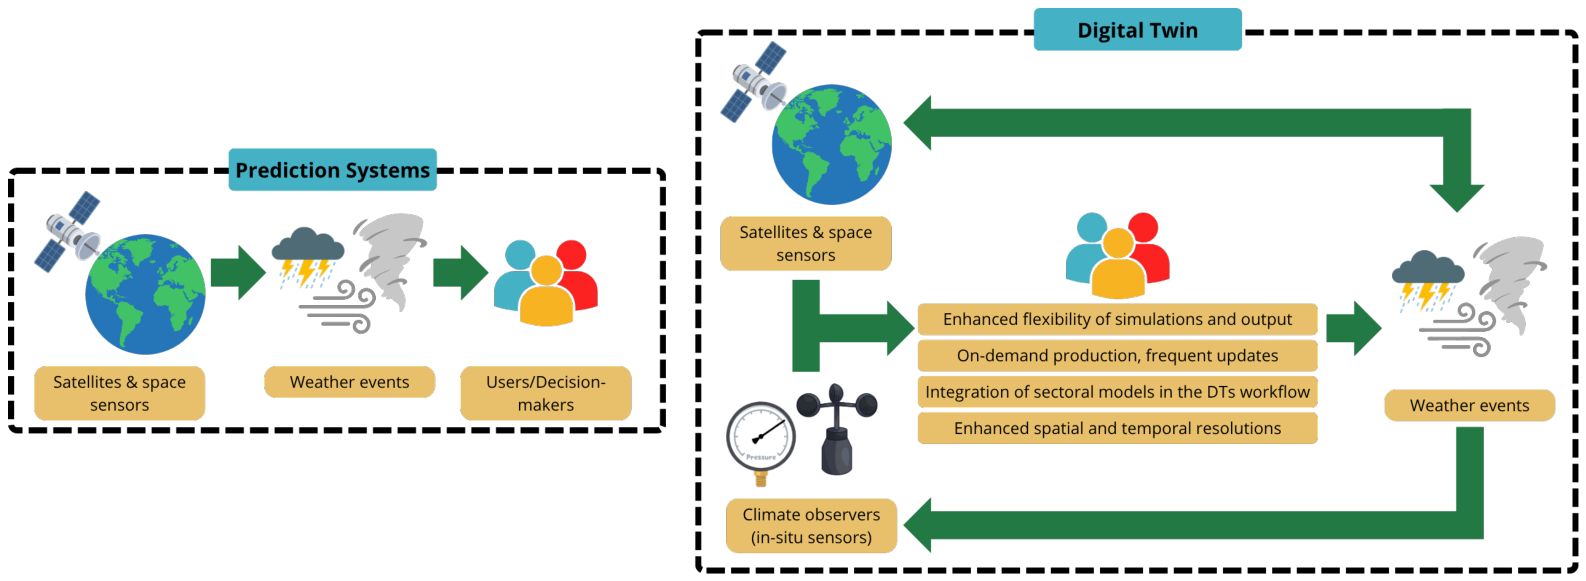
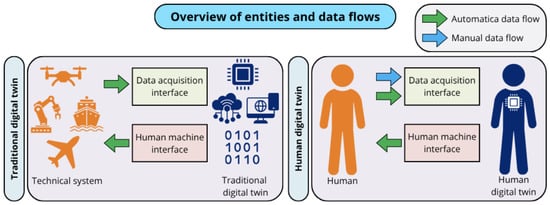
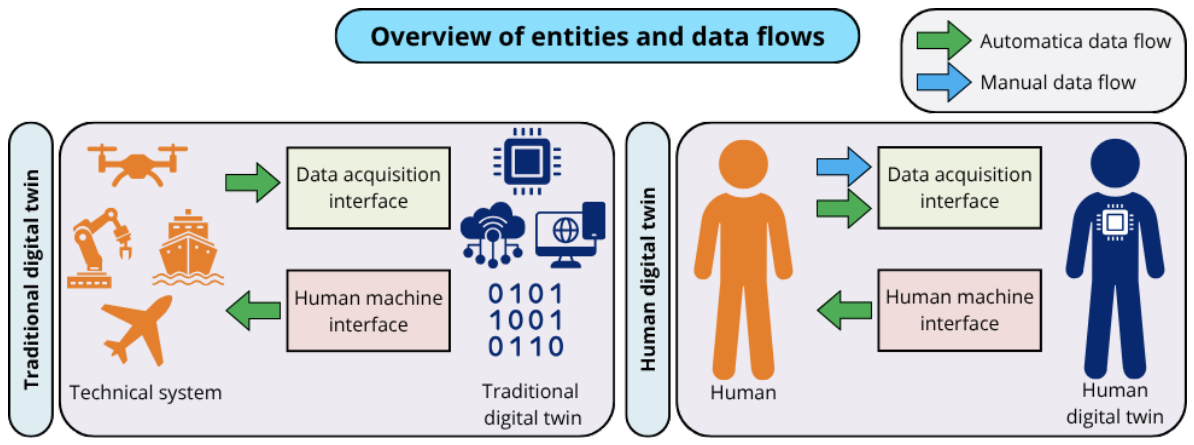
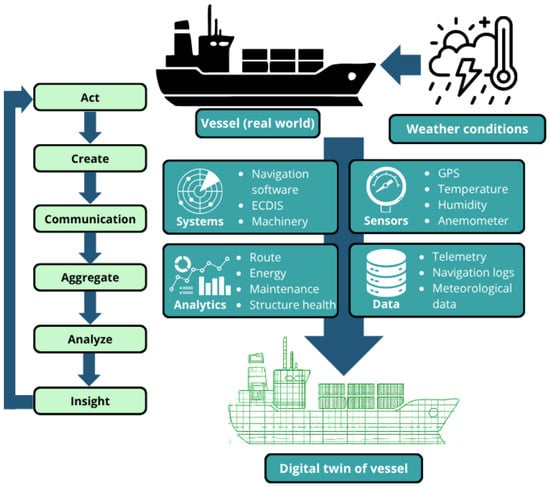
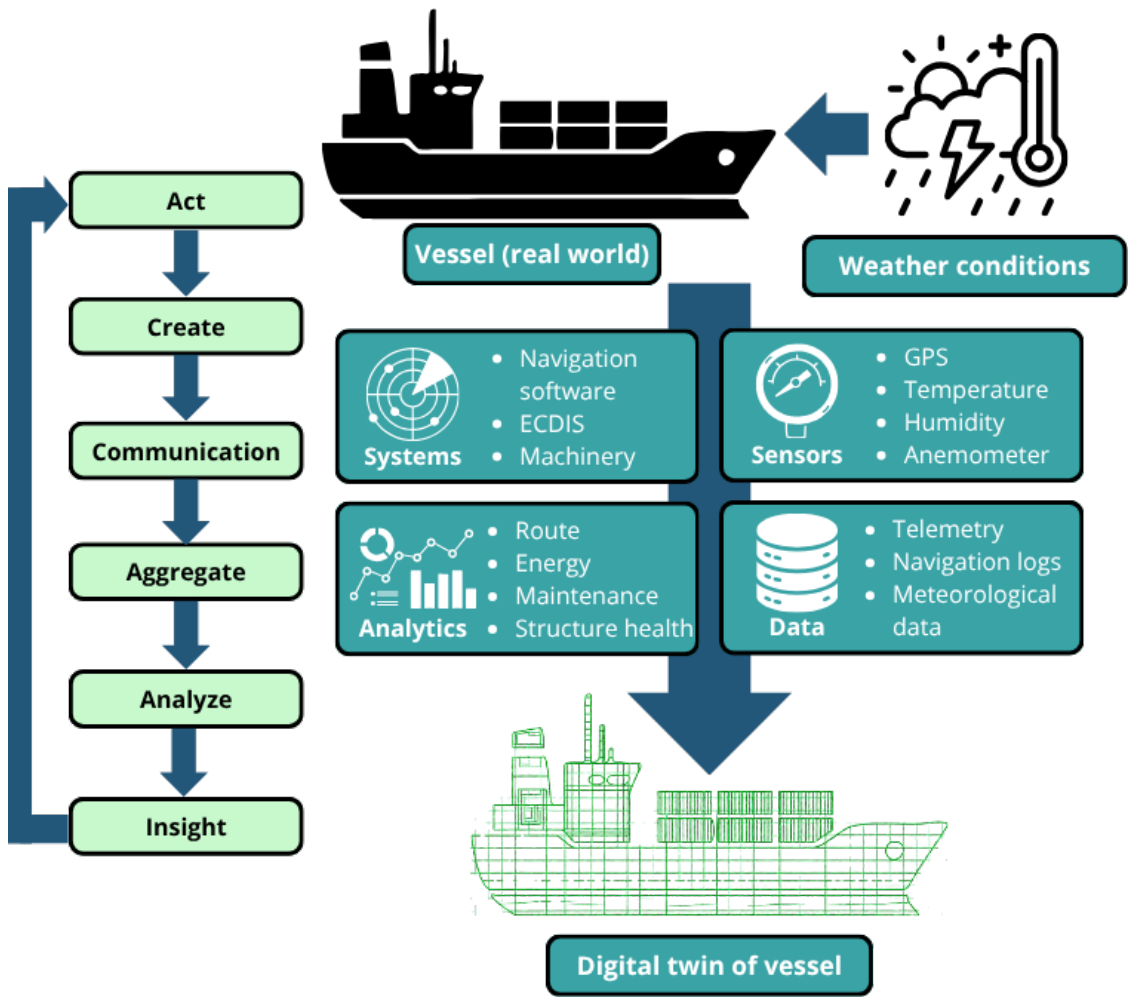
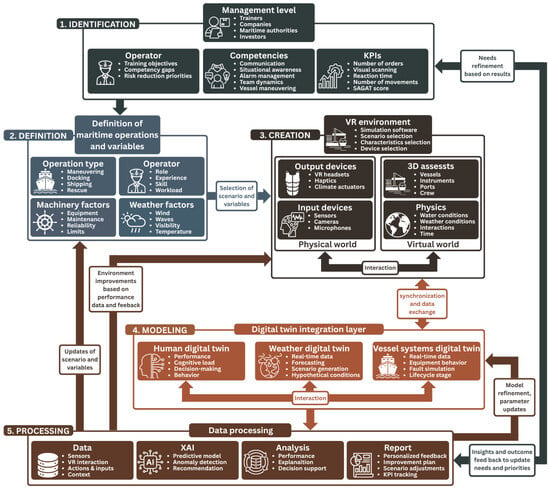
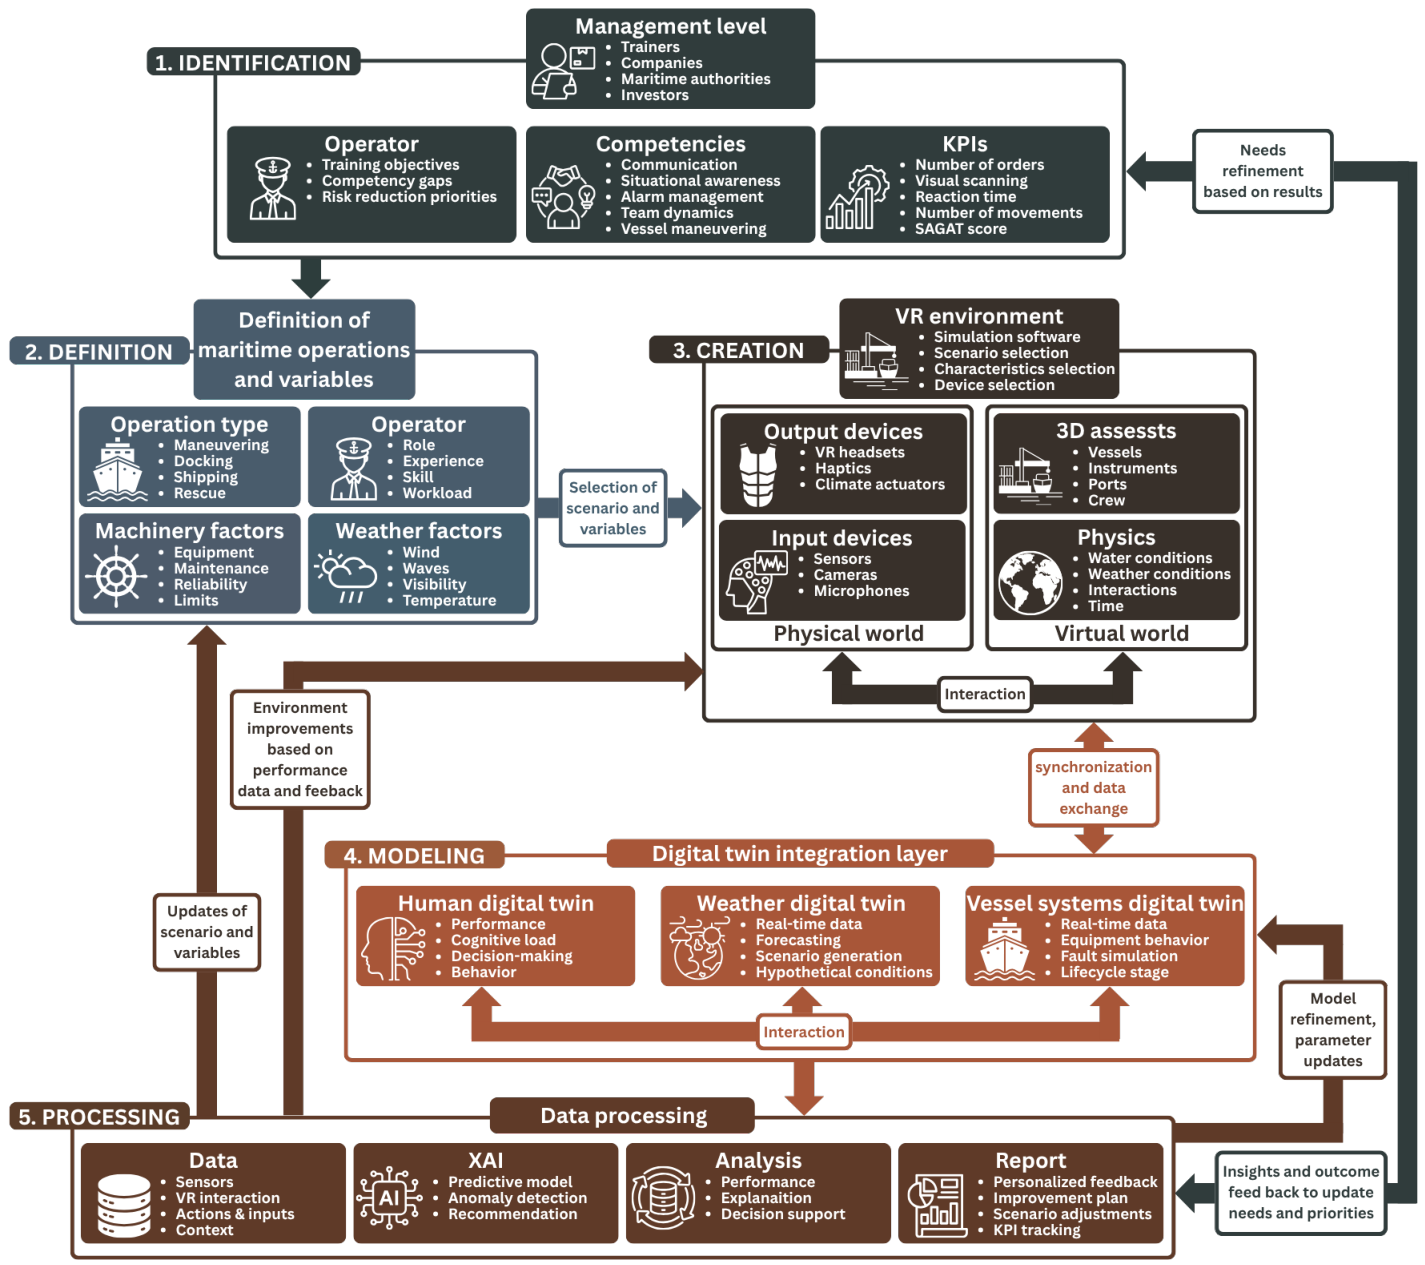
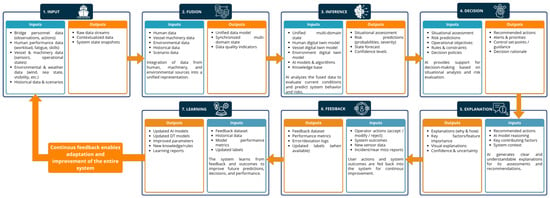
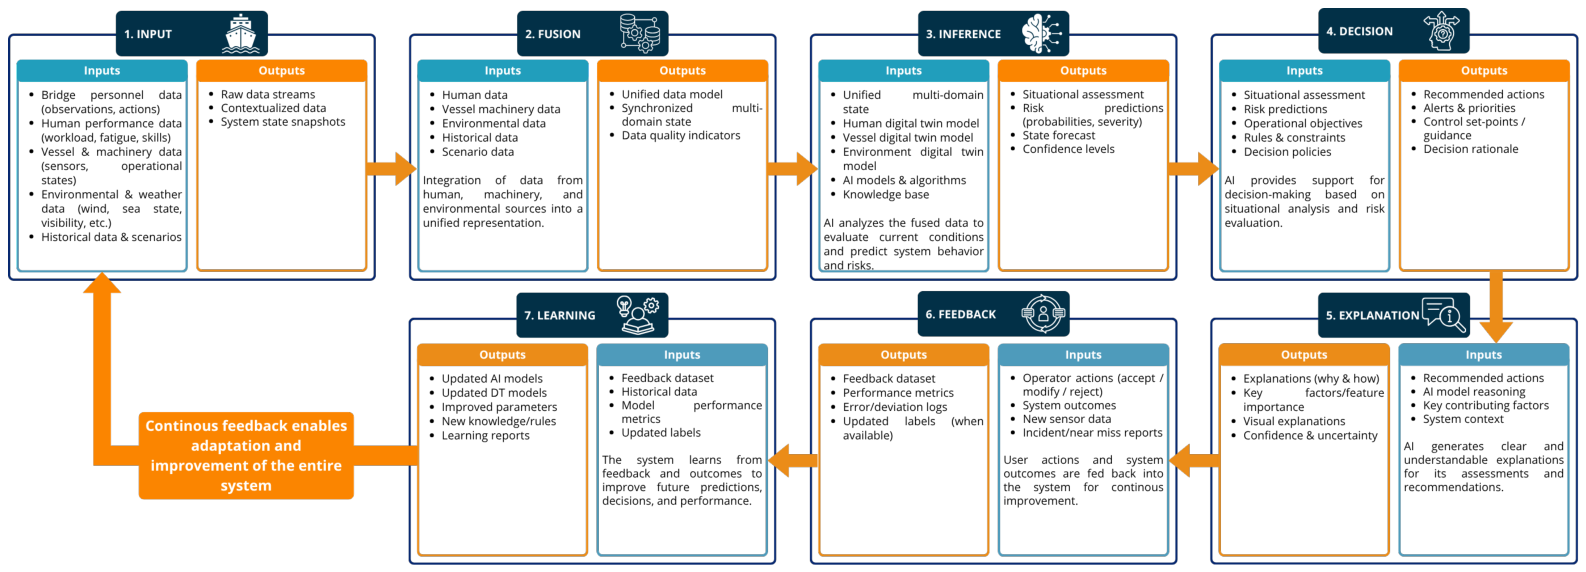
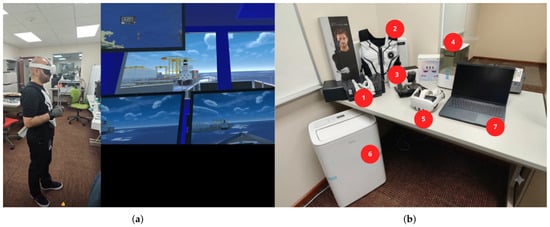
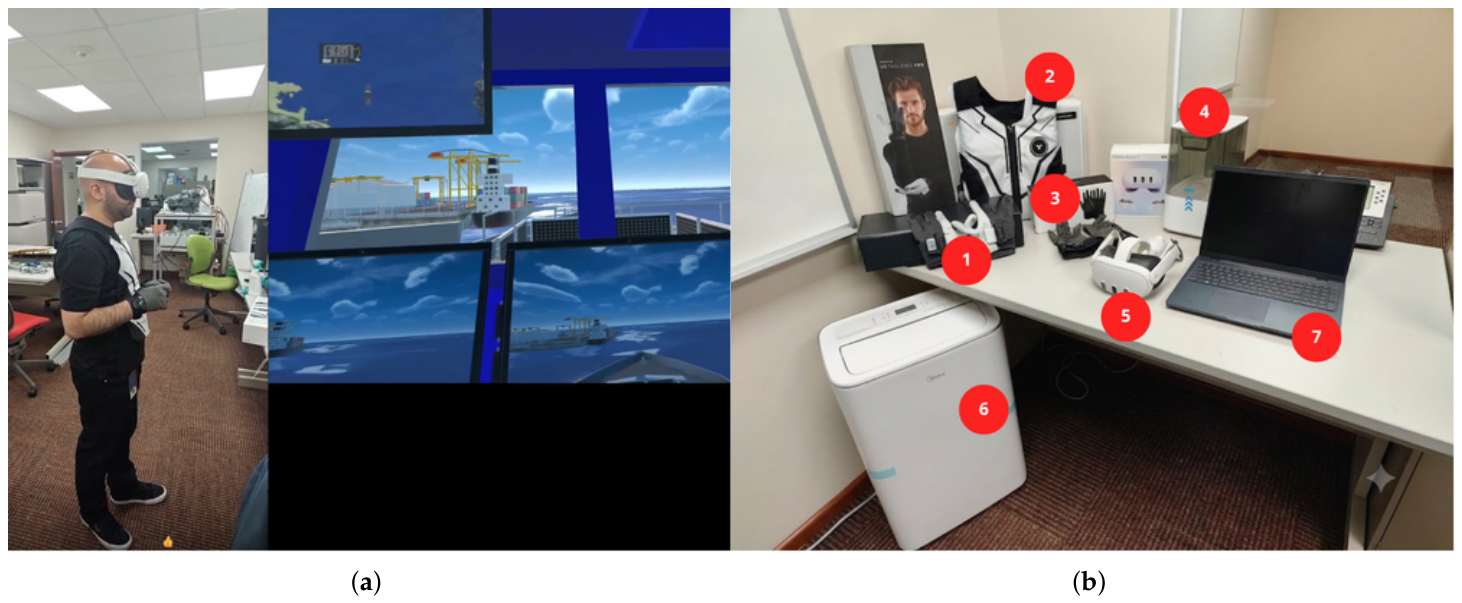
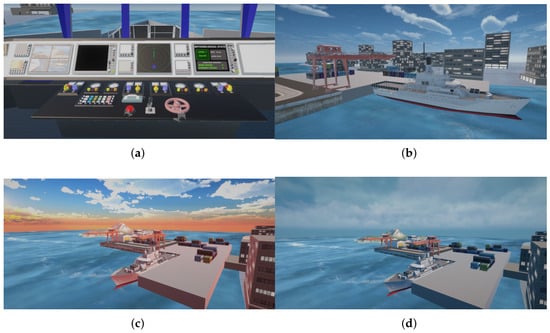
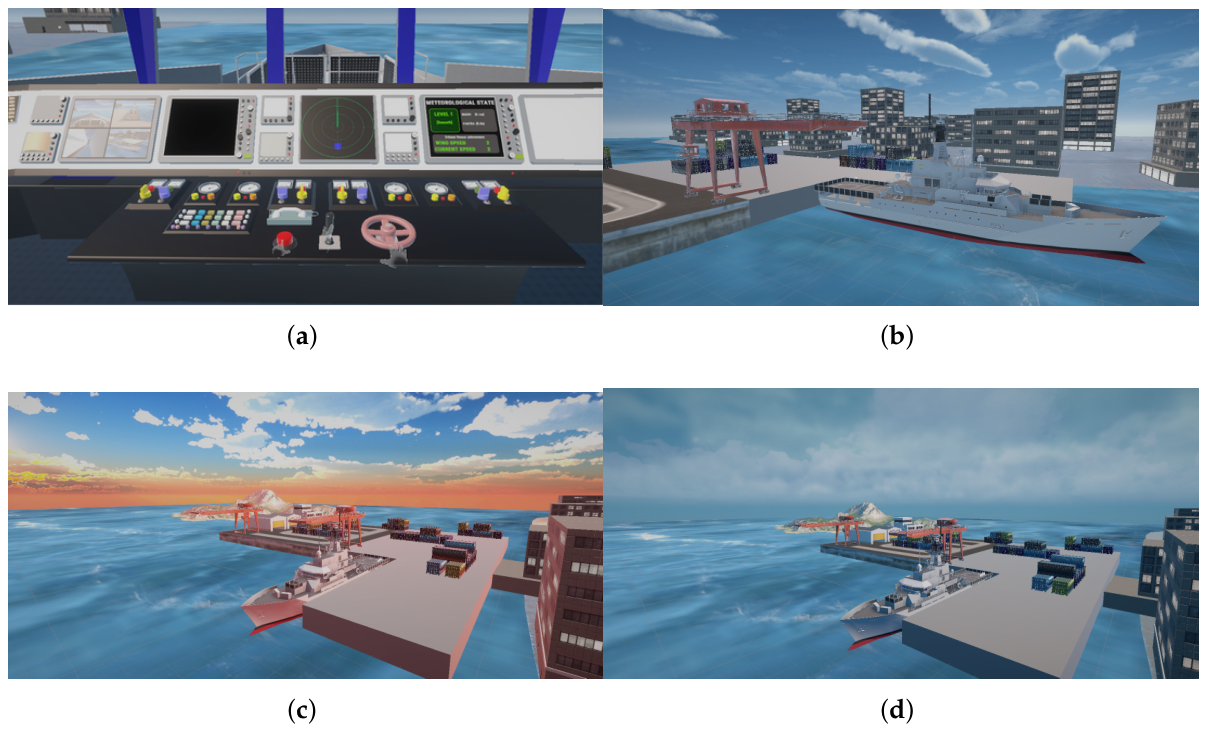
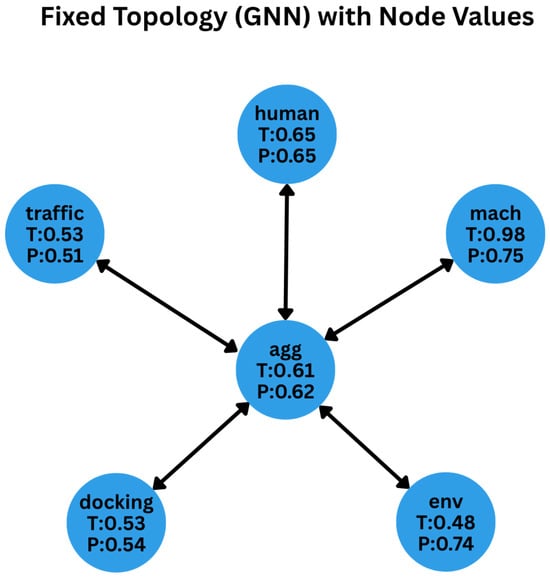
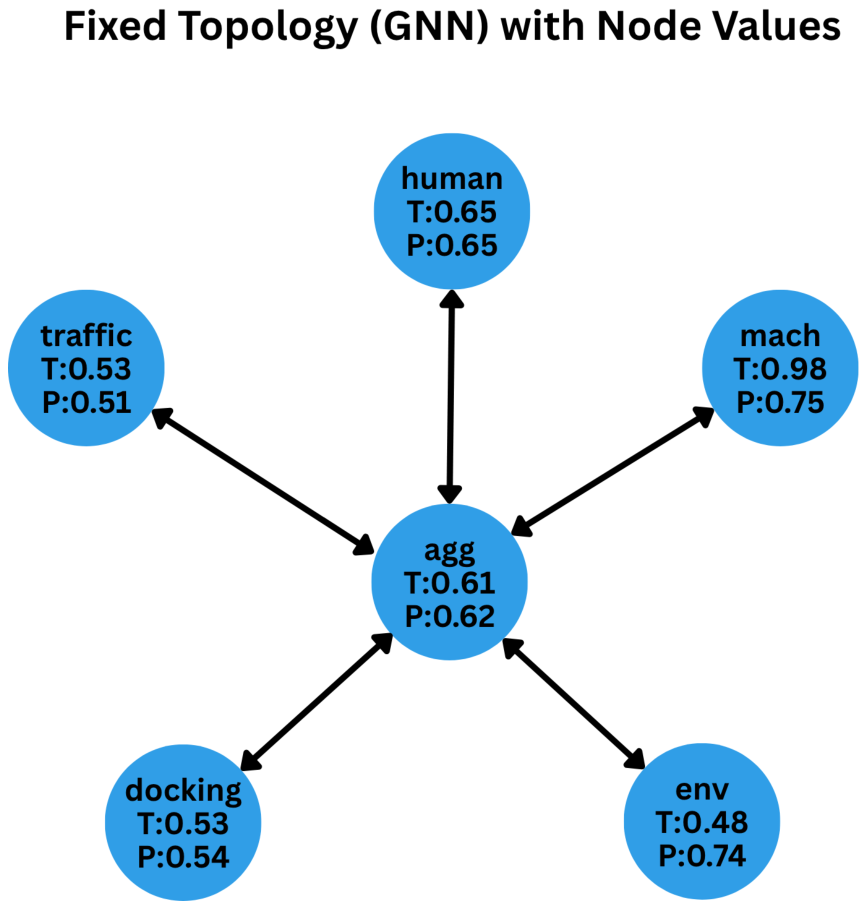
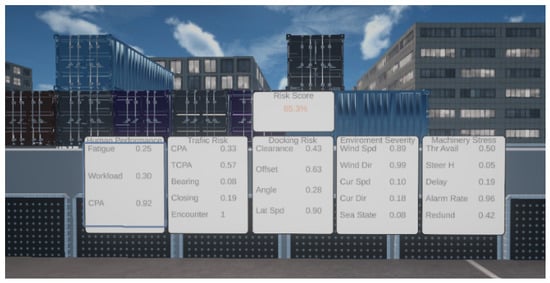
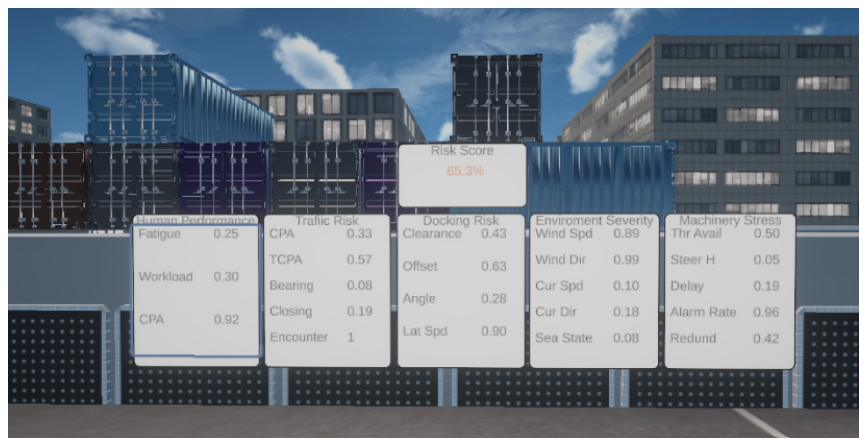

Disclaimer/Publisher’s Note: The statements, opinions and data contained in all publications are solely those of the individual author(s) and contributor(s) and not of MDPI and/or the editor(s). MDPI and/or the editor(s) disclaim responsibility for any injury to people or property resulting from any ideas, methods, instructions or products referred to in the content. |
© 2026 by the authors. Licensee MDPI, Basel, Switzerland. This article is an open access article distributed under the terms and conditions of the Creative Commons Attribution (CC BY) license.