


Abstract
Flooding is a major natural hazard in arid and semi-arid regions, posing significant risks to infrastructure, property, and public safety. This work developed a machine learning-based framework for flood susceptibility assessment in Wadi Numan, Saudi Arabia, using eight flood conditioning factors: Surface Elevation (SE), Slope, Topographic Wetness Index (TWI), Curve Number (CN), Drainage Density (DD), Normalized Difference Vegetation Index (NDVI), Rainfall Depth (RD), and Terrain Ruggedness Index (TRI). A total of 42 classification models available in the MATLAB Classification Learner application were evaluated and compared alongside Artificial Neural Network (ANN) Pattern Recognition models. Model performance was assessed using accuracy, sensitivity, precision, specificity, F1-score, confusion matrices, and ROC curves. Among the evaluated models, Logistic Regression achieved the best overall performance, with an accuracy of 79.05%, sensitivity of 79.61%, precision of 78.10%, specificity of 78.51%, and an F1-score of 78.85%. SHAP analysis was applied to the best-performing model to quantify the relative importance of the flood conditioning factors. The results identified Surface Elevation (SE) (27.46%) as the most influential factor, followed by Topographic Wetness Index (TWI) (21.52%), Drainage Density (DD) (15.23%), Curve Number (CN) (11.25%), Rainfall Depth (RD) (10.19%), Terrain Ruggedness Index (TRI) (7.58%), NDVI (5.25%), and Slope (1.52%). The final flood susceptibility map was generated using a weighted overlay approach, integrating the selected flood-causing factors according to their derived importance weights. The flood susceptibility map showed that approximately 19.07% of the watershed (128.81 km2) falls within the High and Very High susceptibility classes, while the Moderate class accounts for 37.34% of the area. These results identify the areas requiring greater attention for flood management and mitigation. The developed framework provides useful information for infrastructure planning and sustainable watershed management and can also be applied to other arid and semi-arid watersheds.
1. Introduction
Floods are one of the most damaging natural disasters in the world, resulting in large losses to the environment, infrastructure, and human life [1]. In recent decades, flood frequency and severity have increased because of climate change, rapid urbanization, and land-use changes that alter natural drainage systems and increase surface runoff [1,2,3]. Consequently, effective flood risk assessment and management have become essential components of sustainable urban planning, particularly in arid and semi-arid regions.
Makkah City, western Saudi Arabia, is highly susceptible to flash floods due to its mountainous terrain, steep slopes, intense rainfall events, and limited natural storage capacity. Wadi Numan, located east of Makkah, is one of the most flood-prone watersheds in the region and contains important residential areas and critical infrastructure, including Mash’ar Arafa, Umm Al-Qura University, Al-Awali District, Al-Hussainiyah, the Al-Mash’ar Al-Haram railway, and the Taif Highway [2]. Recent flood events, including the severe storm of December 2022, highlighted the vulnerability of the watershed and the need for improved flood mitigation and planning strategies [4,5].
Flood vulnerability assessment and mapping have been greatly enhanced by recent developments in machine learning (ML), geographic information systems (GIS), with remote sensing [6,7]. Unlike conventional statistical methods, ML algorithms can identify complex relationships among environmental variables and provide more accurate flood predictions [8,9]. Models such as Logistic Regression, Support Vector Machines (SVM), K-Nearest Neighbors (KNN), Decision Trees, and Artificial Neural Networks (ANN) have been widely applied to evaluate flood susceptibility using topographic, hydrological, climatic, and land-use factors [10,11].
The integration of GIS and ML enables the analysis of spatial flood patterns and supports the development of reliable flood susceptibility maps for disaster preparedness, infrastructure protection, and watershed management [12,13,14,15,16]. Accordingly, this study investigates flood susceptibility across Wadi Numan by integrating GIS, remote sensing, and machine learning methods. The assessment considers a range of hydro-environmental and topographic variables that may influence flooding, including elevation, slope, rainfall, drainage density, terrain ruggedness index (TRI), topographic wetness index (TWI), curve number (CN), and vegetation cover. SHAP (SHapley Additive Explanations) analysis is then applied to evaluate the contribution of each variable to flood susceptibility [17]. Based on these contributions, the selected factors are integrated through a weighted overlay procedure to delineate areas with different levels of flood susceptibility and produce the final susceptibility map. The results are expected to support flood risk reduction, infrastructure planning, and sustainable watershed management in Wadi Numan and similar arid environments across Saudi Arabia.
Literature Review
In recent years, flood susceptibility mapping has improved considerably through the use of Geographic Information Systems (GIS), remote sensing, and machine learning (ML) [7,18]. ML methods such as Artificial Neural Networks (ANN), Decision Trees (DT), Random Forest (RF), Support Vector Machines (SVM), and ensemble models have been widely used to identify areas that are more likely to experience flooding [19,20,21].
Several studies have combined ML with GIS and remote sensing to improve flood susceptibility mapping. For example, Inyang et al. [22], Abu El-Magd et al. [23], Ighile et al. [13], Gholami et al. [24], Ghanim et al. [25], Singha et al. [26], Nguyen et al. [27], and Mishra et al. [18] showed that ML models can capture the relationships between topographic, hydrological, climatic, and land-use factors that contribute to flooding. Similar approaches have been applied in Saudi Arabia, including Jeddah, and have shown promising results for identifying flood-prone areas [25,28].
However, some challenges remain. The reliability of flood susceptibility models can be affected by the quality of the flood inventory, the selection of flood-conditioning factors, sampling methods, and the availability of independent data for model validation. Another important issue is that many ML models provide accurate predictions without clearly explaining why certain locations are classified as highly susceptible. This makes the contribution of individual flood-conditioning factors difficult to interpret. Explainable artificial intelligence methods, such as SHapley Additive exPlanations (SHAP), can help address this issue by showing how individual variables influence model predictions.
These challenges are especially important in arid watersheds, where flood observations are often limited and short, intense rainfall can generate sudden flash floods. Although ML has already been used for flood susceptibility mapping in Saudi Arabia, further work is needed to compare different ML models, validate their predictions using independent flood and non-flood locations, and better understand the role of individual environmental factors.
Therefore, this study develops an integrated GIS, remote-sensing, ML, and explainable-AI approach for flood susceptibility mapping in Wadi Numan, Makkah. Several ML models are compared and evaluated using an independent flood/non-flood validation dataset. SHAP analysis is then used to identify the relative contribution of the selected hydro-environmental factors. Finally, the spatial factors are integrated using a GIS-based weighted overlay approach to produce the final flood susceptibility map. The main contribution of this study is the combination of model comparison, independent validation, factor interpretation, and spatial susceptibility mapping within an arid watershed environment.
2. Methodology
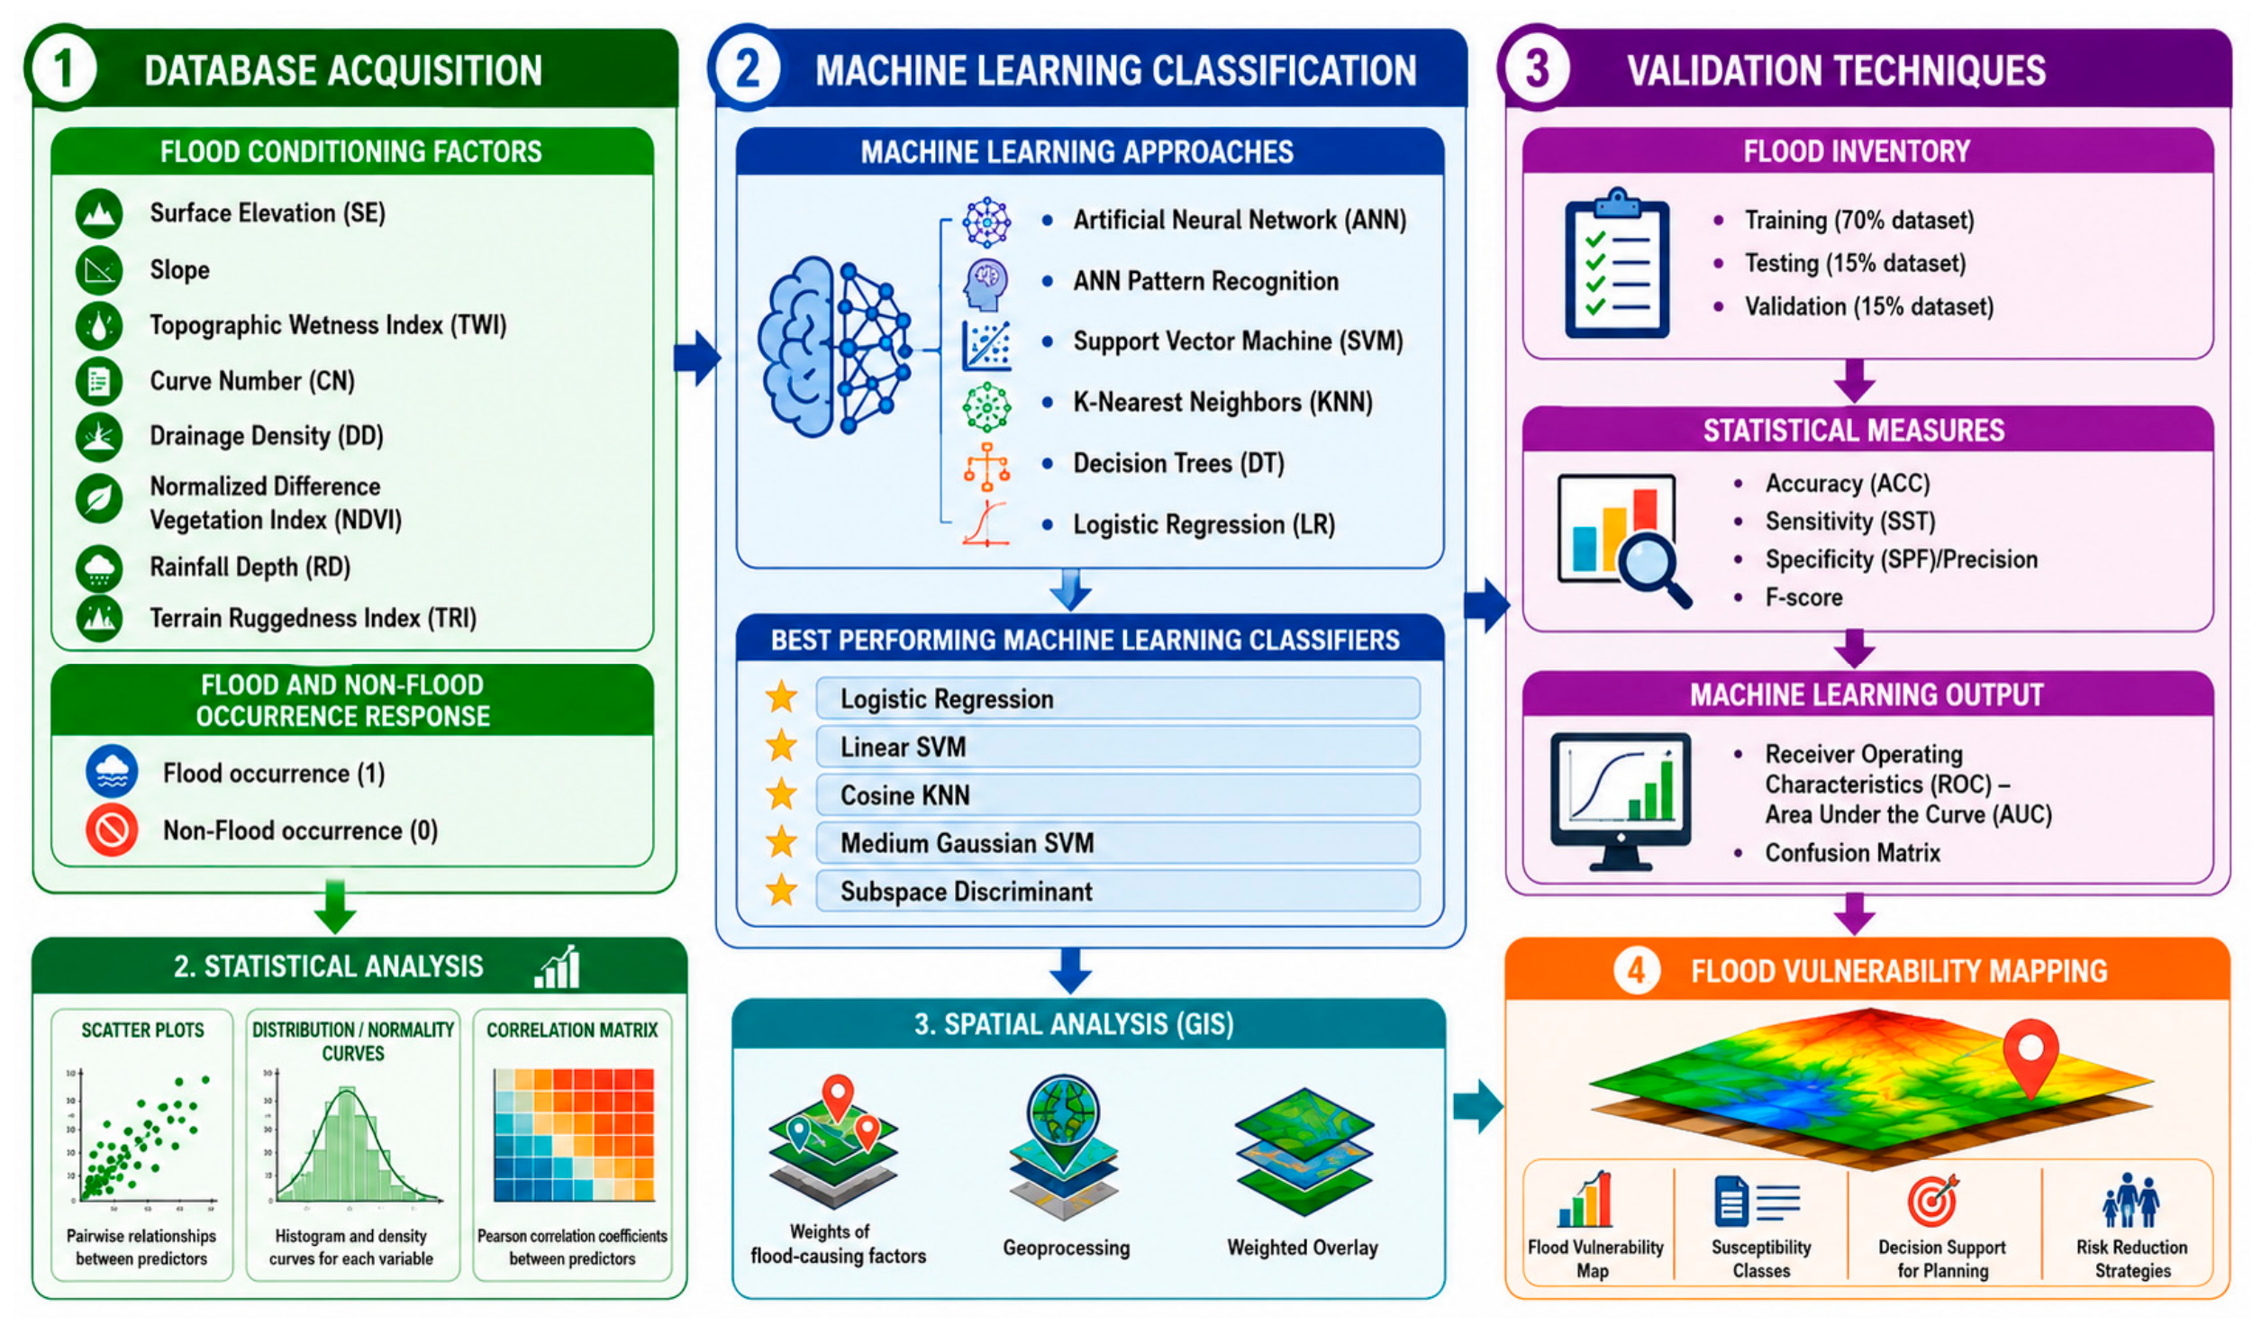
The methodology adopted in this study is illustrated in Figure 1 and consists of four main stages: database acquisition and preparation, statistical analysis, machine learning modeling, and flood susceptibility mapping. Eight flood conditioning factors were considered, including Surface Elevation (SE), Slope, Topographic Wetness Index (TWI), Curve Number (CN), Drainage Density (DD), Normalized Difference Vegetation Index (NDVI), Rainfall Depth (RD), and Terrain Ruggedness Index (TRI). GIS layers were prepared for each factor and used as input variables for model development. The flood inventory consisted of locations classified as flood occurrences (1) and non-flood occurrences (0). Flood occurrence points were identified based on historical flood records obtained from the Ministry of Environment, Water and Agriculture (MEWA), Makkah Region Branch, and the Saudi Geological Survey, supported by available spatial information and field observations. Flood points represented locations with documented evidence of historical flooding, whereas non-flood points were selected from areas with no documented flood occurrences. The resulting flood inventory was subsequently used to extract the corresponding flood-conditioning factors and develop the classification models. The non-flood locations were spatially distributed across the study area to provide representative absence samples for model development and validation. Their selection was not based solely on distance from the drainage network; therefore, some non-flood points may appear close to stream lines. Proximity to a stream does not necessarily indicate flood occurrence, as flooding is also influenced by local topography, slope, rainfall, land cover, and runoff characteristics.
Figure 1.
Study methodology.
The dataset was randomly divided into training (70%), validation (15%), and testing (15%) subsets. Statistical analyses, including scatter plots, distribution curves, and correlation matrix analysis, were performed to examine the characteristics and relationships among the flood conditioning factors. Subsequently, 42 classification models available in the MATLAB Classification Learner application were evaluated. In addition, Artificial Neural Network (ANN) Pattern Recognition models with different hidden neuron configurations were developed to further assess the predictive capability of neural network approaches.
Model performance was evaluated using accuracy, sensitivity, specificity, precision, F1-score, confusion matrices, and ROC curves. SHAP (SHapley Additive exPlanations) analysis was then applied to quantify the relative importance of the flood conditioning factors. To assess the robustness and stability of the machine-learning models and reduce dependence on a single random data partition, repeated stratified five-fold cross-validation was performed using the complete dataset of 287 observations. The stratification procedure maintained approximately the same proportion of flood and non-flood observations within each fold. The five-fold cross-validation procedure was repeated 10 times using different random partitions, resulting in 50 test-fold evaluations for each model. For each evaluation, four folds were used for model training and the remaining fold was used for testing. Model performance was evaluated using accuracy, precision, sensitivity, specificity, F1-score, and the area under the receiver operating characteristic curve (AUC). The mean, standard deviation, and 95% confidence interval were calculated across the repeated cross-validation runs. Finally, the model outputs were integrated within a GIS environment to generate the flood susceptibility map for the study area.
2.1. Study Area
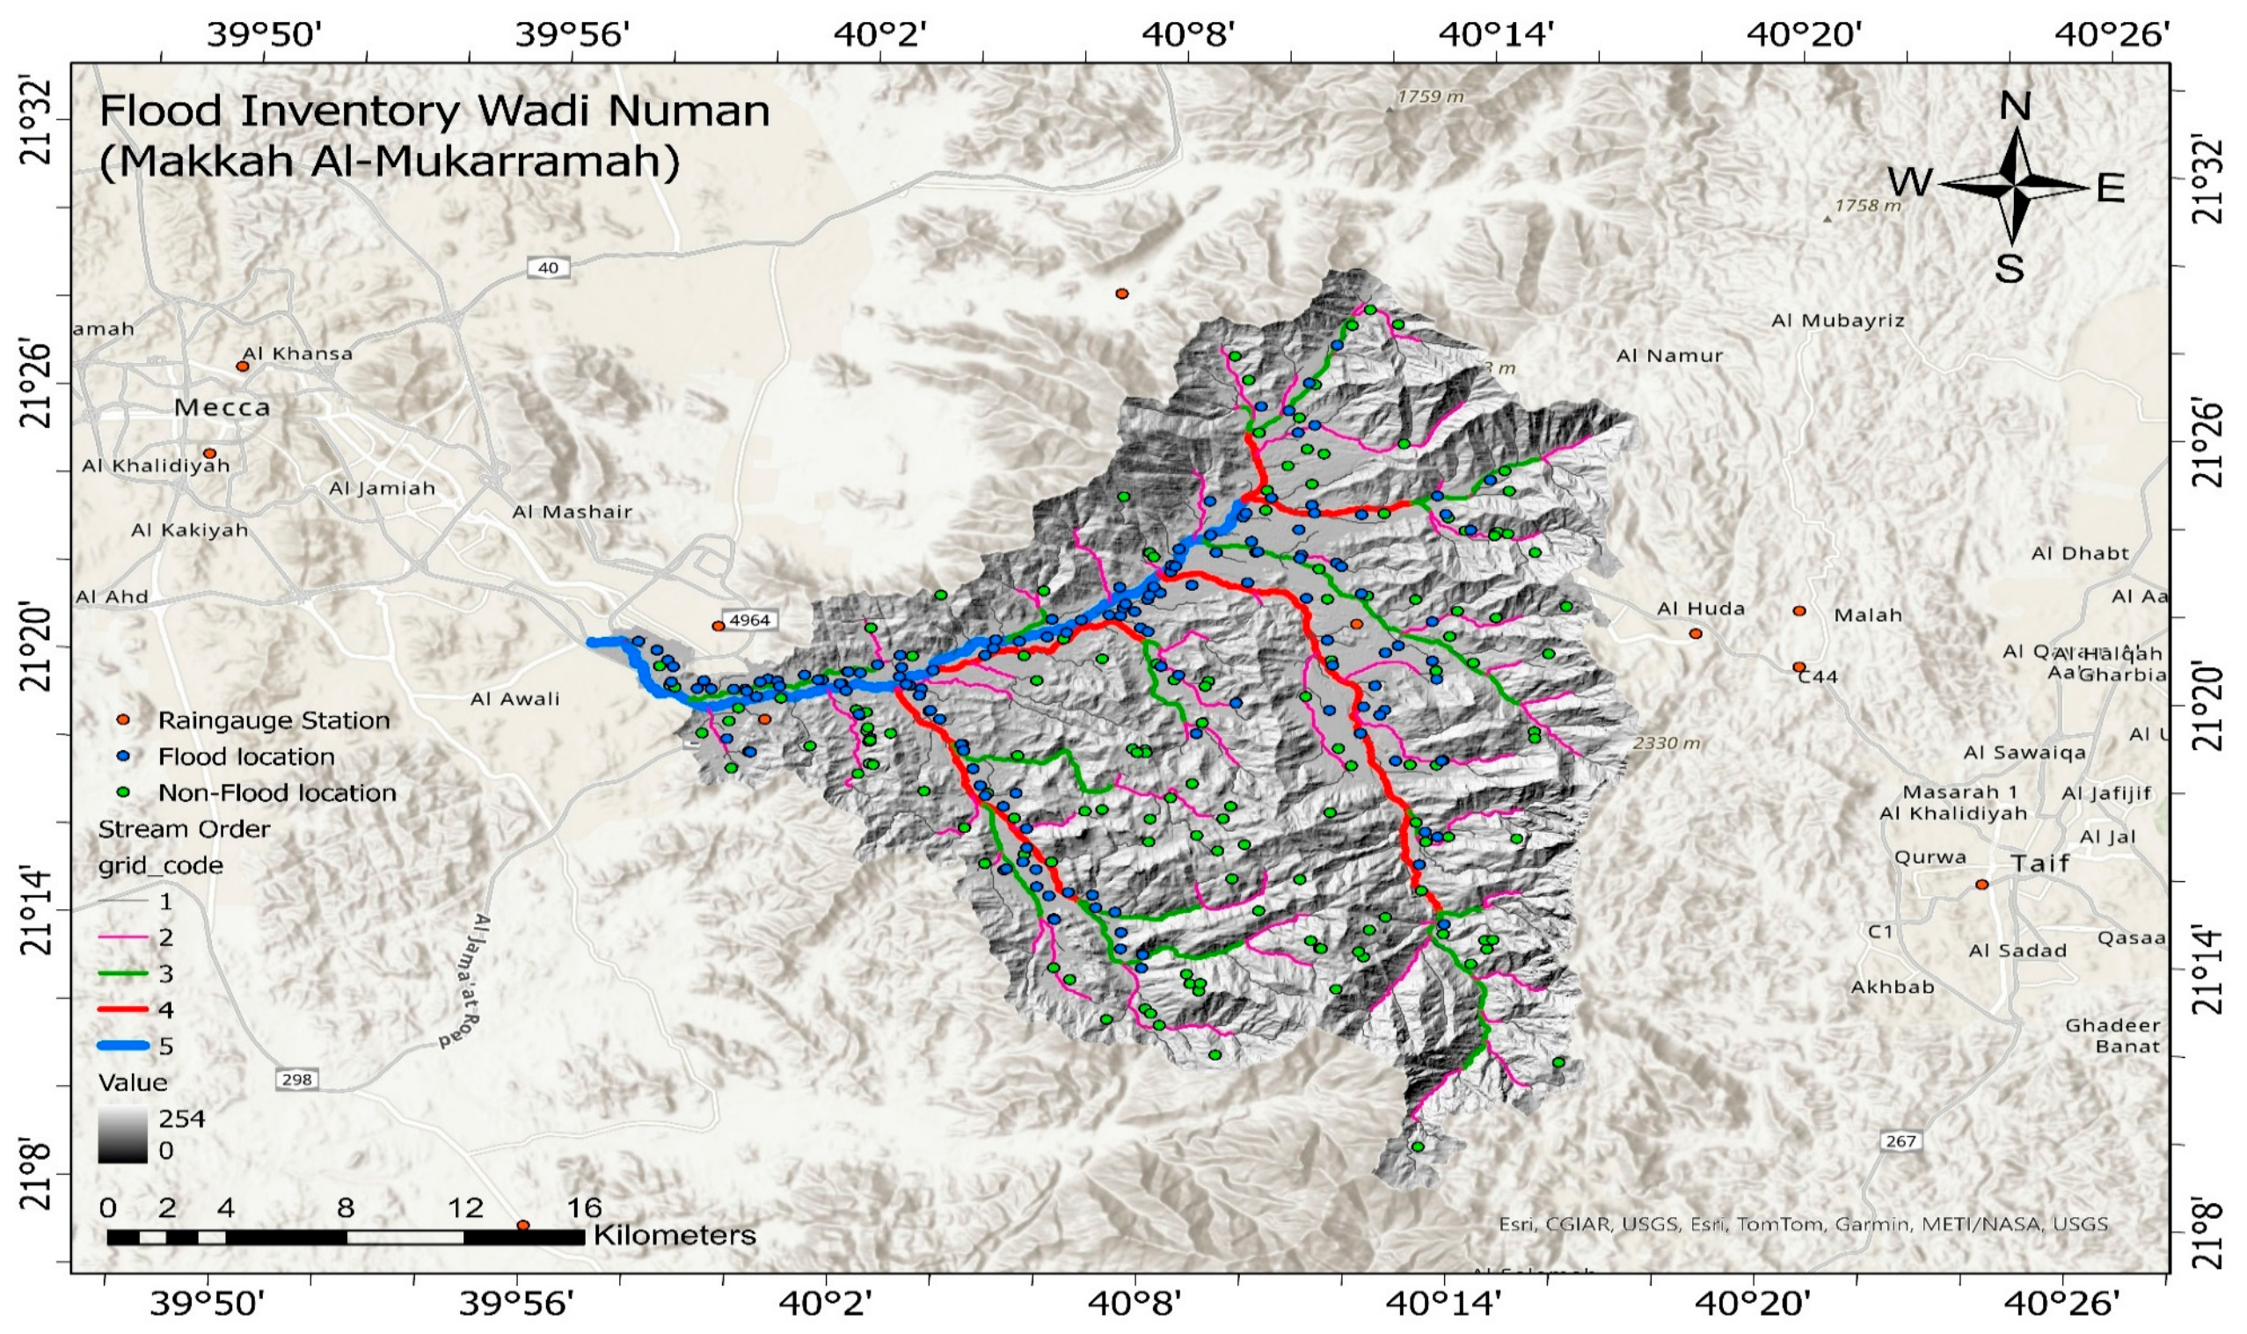
Wadi Numan is located east of Makkah in western Saudi Arabia (21°10′–21°28′N, 39°52′–40°18′E; Figure 2). The basin originates in the Alhada Mountains and flows westward toward the Red Sea, draining several sub-catchments within the watershed. Historically, Wadi Numan played an important role in supplying water to Makkah and the surrounding holy sites through the famous Abbasid-era “Ein Zubaidah” water system. The watershed is characterized by steep slopes, rugged terrain, and sparse vegetation cover, making it highly susceptible to flash flooding and soil erosion. Significant sediment transport has occurred over time, resulting in downstream alluvial deposits that reach thicknesses of up to 70 m [4]. Although flash floods pose a considerable risk to urban developments and critical infrastructure, including Umm Al-Qura University, they also contribute to groundwater recharge and help sustain valuable water resources in the region. Consequently, Wadi Numan remains an important watershed from both historical and contemporary perspectives, serving as a vital water resource while requiring effective flood-risk management strategies [5].
Figure 2.
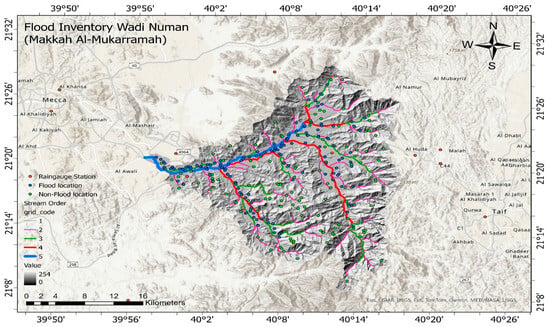
Location of Wadi Numan showing the drainage network and flood inventory, including flood and non-flood sample locations.
2.2. Flood Conditioning Factors (Criteria’s)
Flood-related factors were selected based on the watershed’s physical characteristics, environmental conditions, and data availability [11,29,30]. A 30-m SRTM DEM from USGS Earth Explorer, along with maps, online databases, and government records, was used in the analysis. The flood inventory consisted of 144 historical flood locations and 144 non-flood locations collected from local authorities between 1985 and 2023. This dataset captures long-term flood patterns, rainfall variability, and key watershed characteristics, providing a strong basis for flood susceptibility assessment (Figure 2).
2.2.1. Surface Elevation (SE)
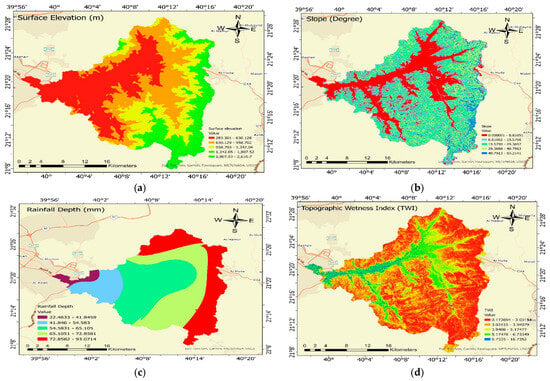
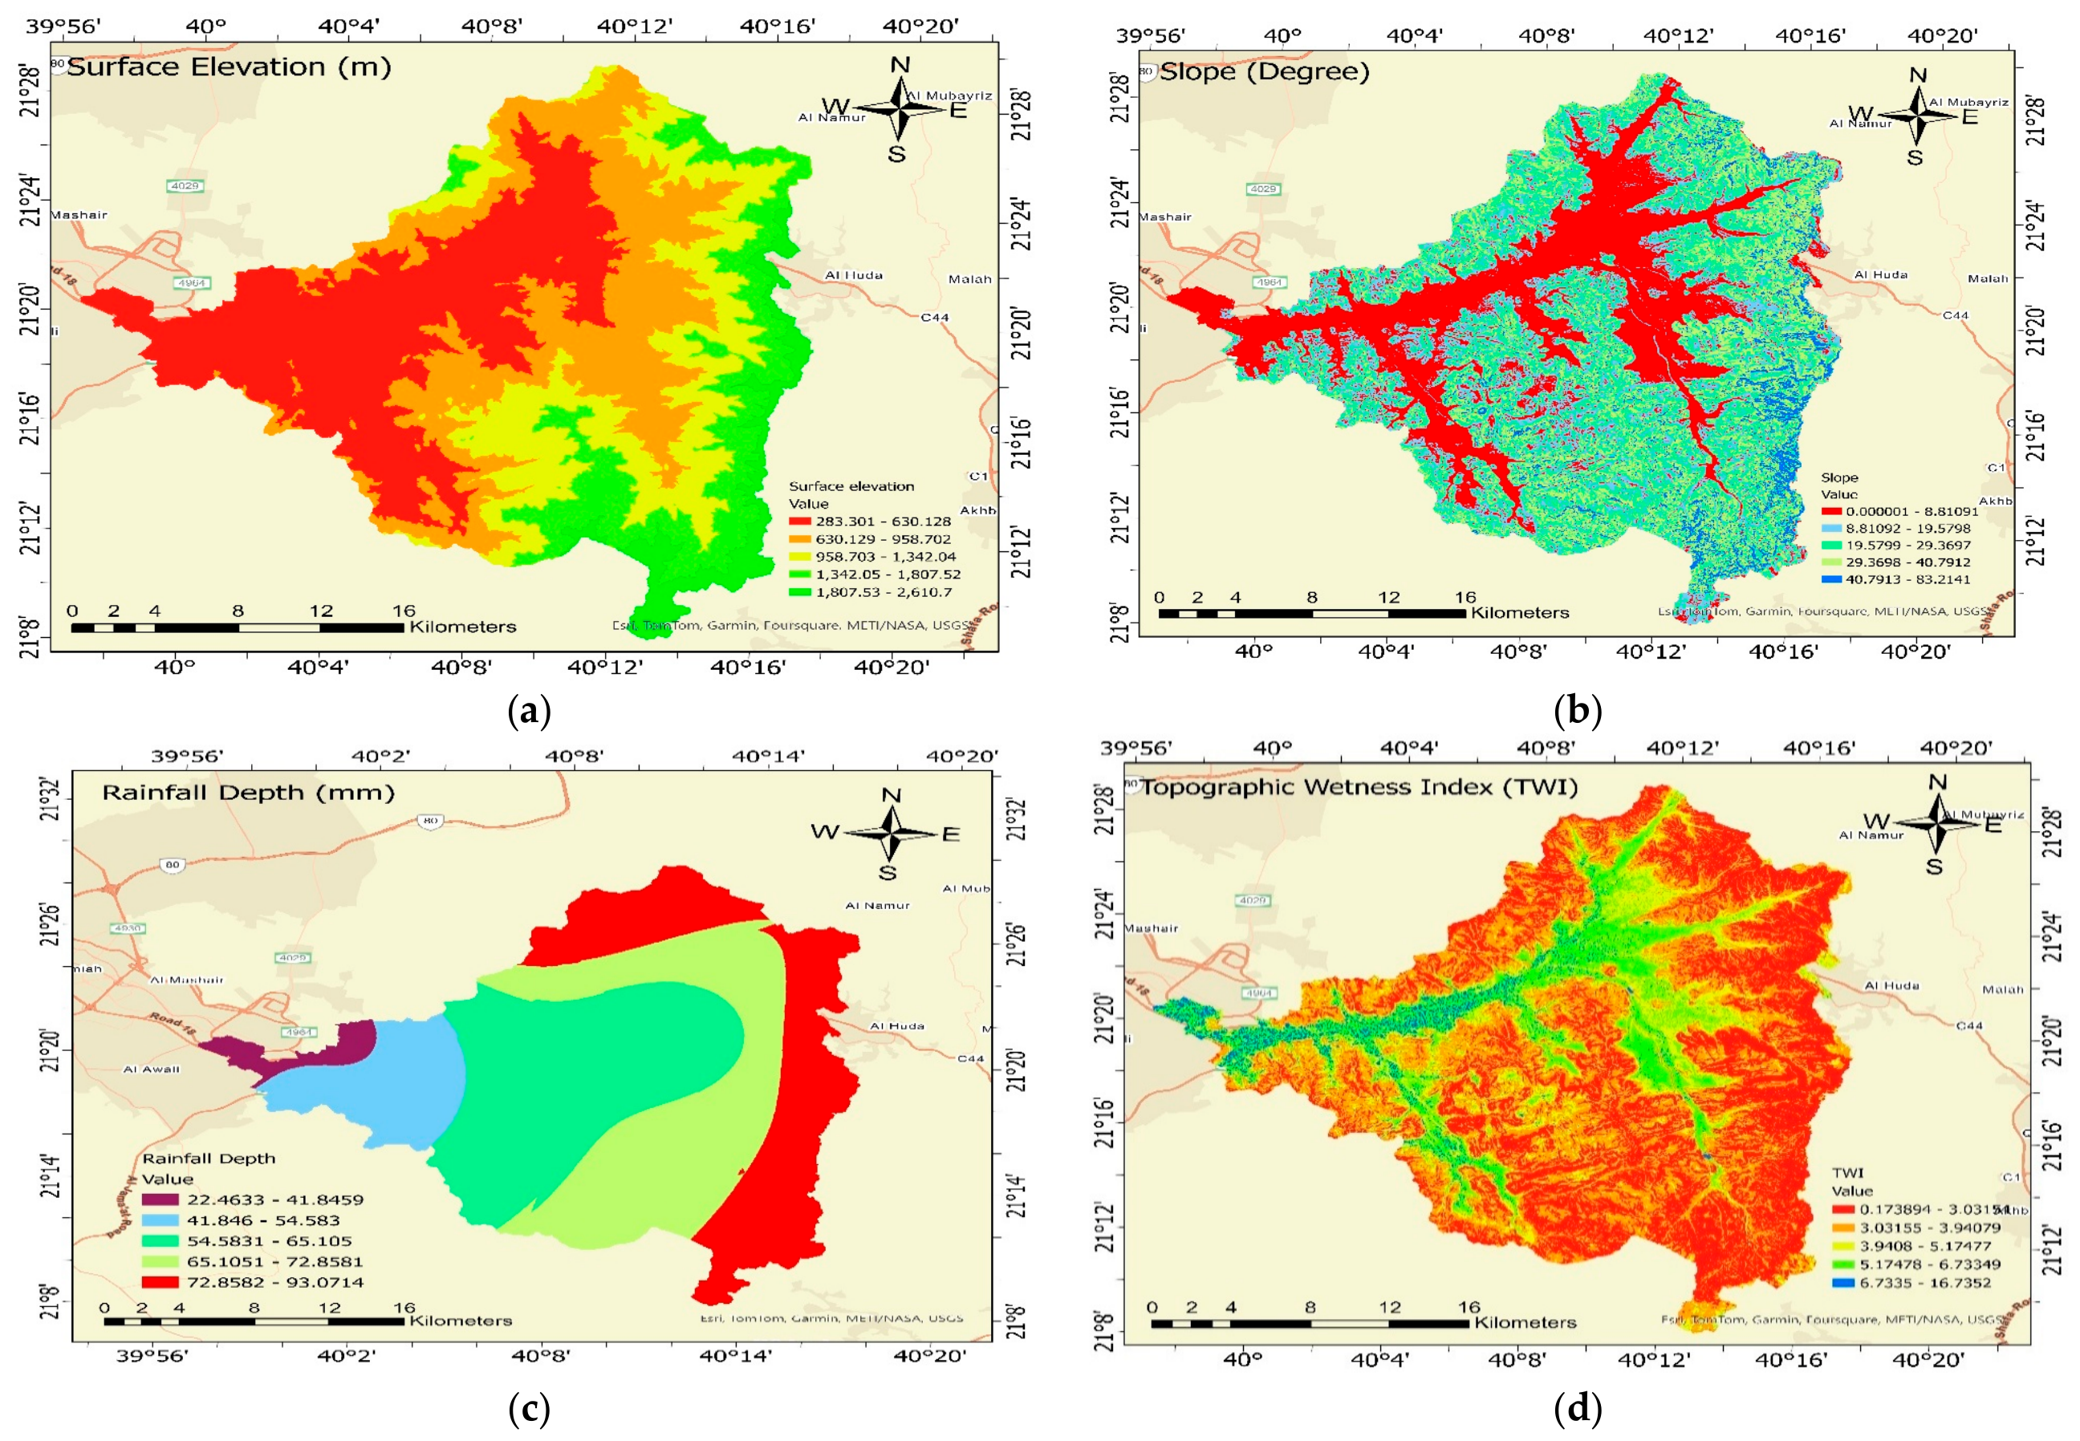
The surface elevation of a region indicates how high it is above sea level. As seen in Figure 3a, the elevation varies between 283 to 2600 m above sea level. Higher elevations are mainly concentrated in the eastern and mountainous parts of the watershed, while lower elevations occur toward the western and downstream areas.
Figure 3.
Flood conditioning factors used in the flood susceptibility analysis: (a) Surface Elevation (SE), (b) Slope, (c) Rainfall Depth (RD), and (d) Topographic Wetness Index (TWI).
2.2.2. Slope
The study area is characterized by rugged terrain and steep slopes, which play a major role in controlling surface runoff and flash flood generation [1,14]. Steeper slopes generally promote faster runoff and reduce infiltration, increasing the likelihood of flooding [16,29]. The slope map was derived from the SRTM-DEM using ArcGIS Pro 2.8.0 and is presented in Figure 3b.
2.2.3. Rainfall Depth (RD)
Flash floods in Makkah are mainly triggered by intense rainfall events. In this study, rainfall depth (RD) was estimated using data from 22 rain gauge stations located within and around Wadi Numan. Figure 3c presents the locations of the surrounding rain gauge stations used in the analysis. The rainfall data were obtained from the Makkah Regional Meteorological Center and processed in a GIS environment using the Inverse Distance Weighted (IDW) interpolation method to produce the rainfall distribution map (Figure 4c). The rainfall records from 1990 to 2022 showed noticeable variation across the watershed. Rainfall Depth (RD) represents the maximum daily rainfall depth recorded at the available rain-gauge stations over the observation period. The recorded maximum daily rainfall values ranged from approximately 9.9 to 167.4 mm, with an average of 65.5 mm [30]. These station records were spatially interpolated to generate the rainfall-depth raster used in the flood susceptibility analysis. Within the Wadi Numan study area, the interpolated RD values ranged from 22.46 to 93.07 mm (Figure 3c). Therefore, the difference between the two ranges reflects the original rainfall observations at the gauge stations and the interpolated rainfall values within the study-area boundary. The spatial distribution of RD shows considerable variability across the watershed, with relatively higher rainfall depths occurring in the elevated mountainous areas. This spatial variability is relevant to flood susceptibility because rainfall contributes to runoff generation and the potential development of flash floods within Wadi Numan.
Figure 4.
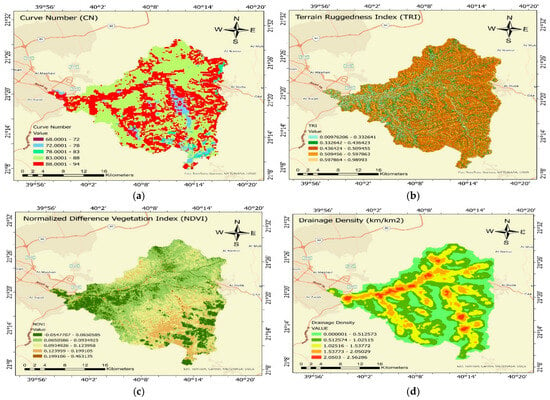
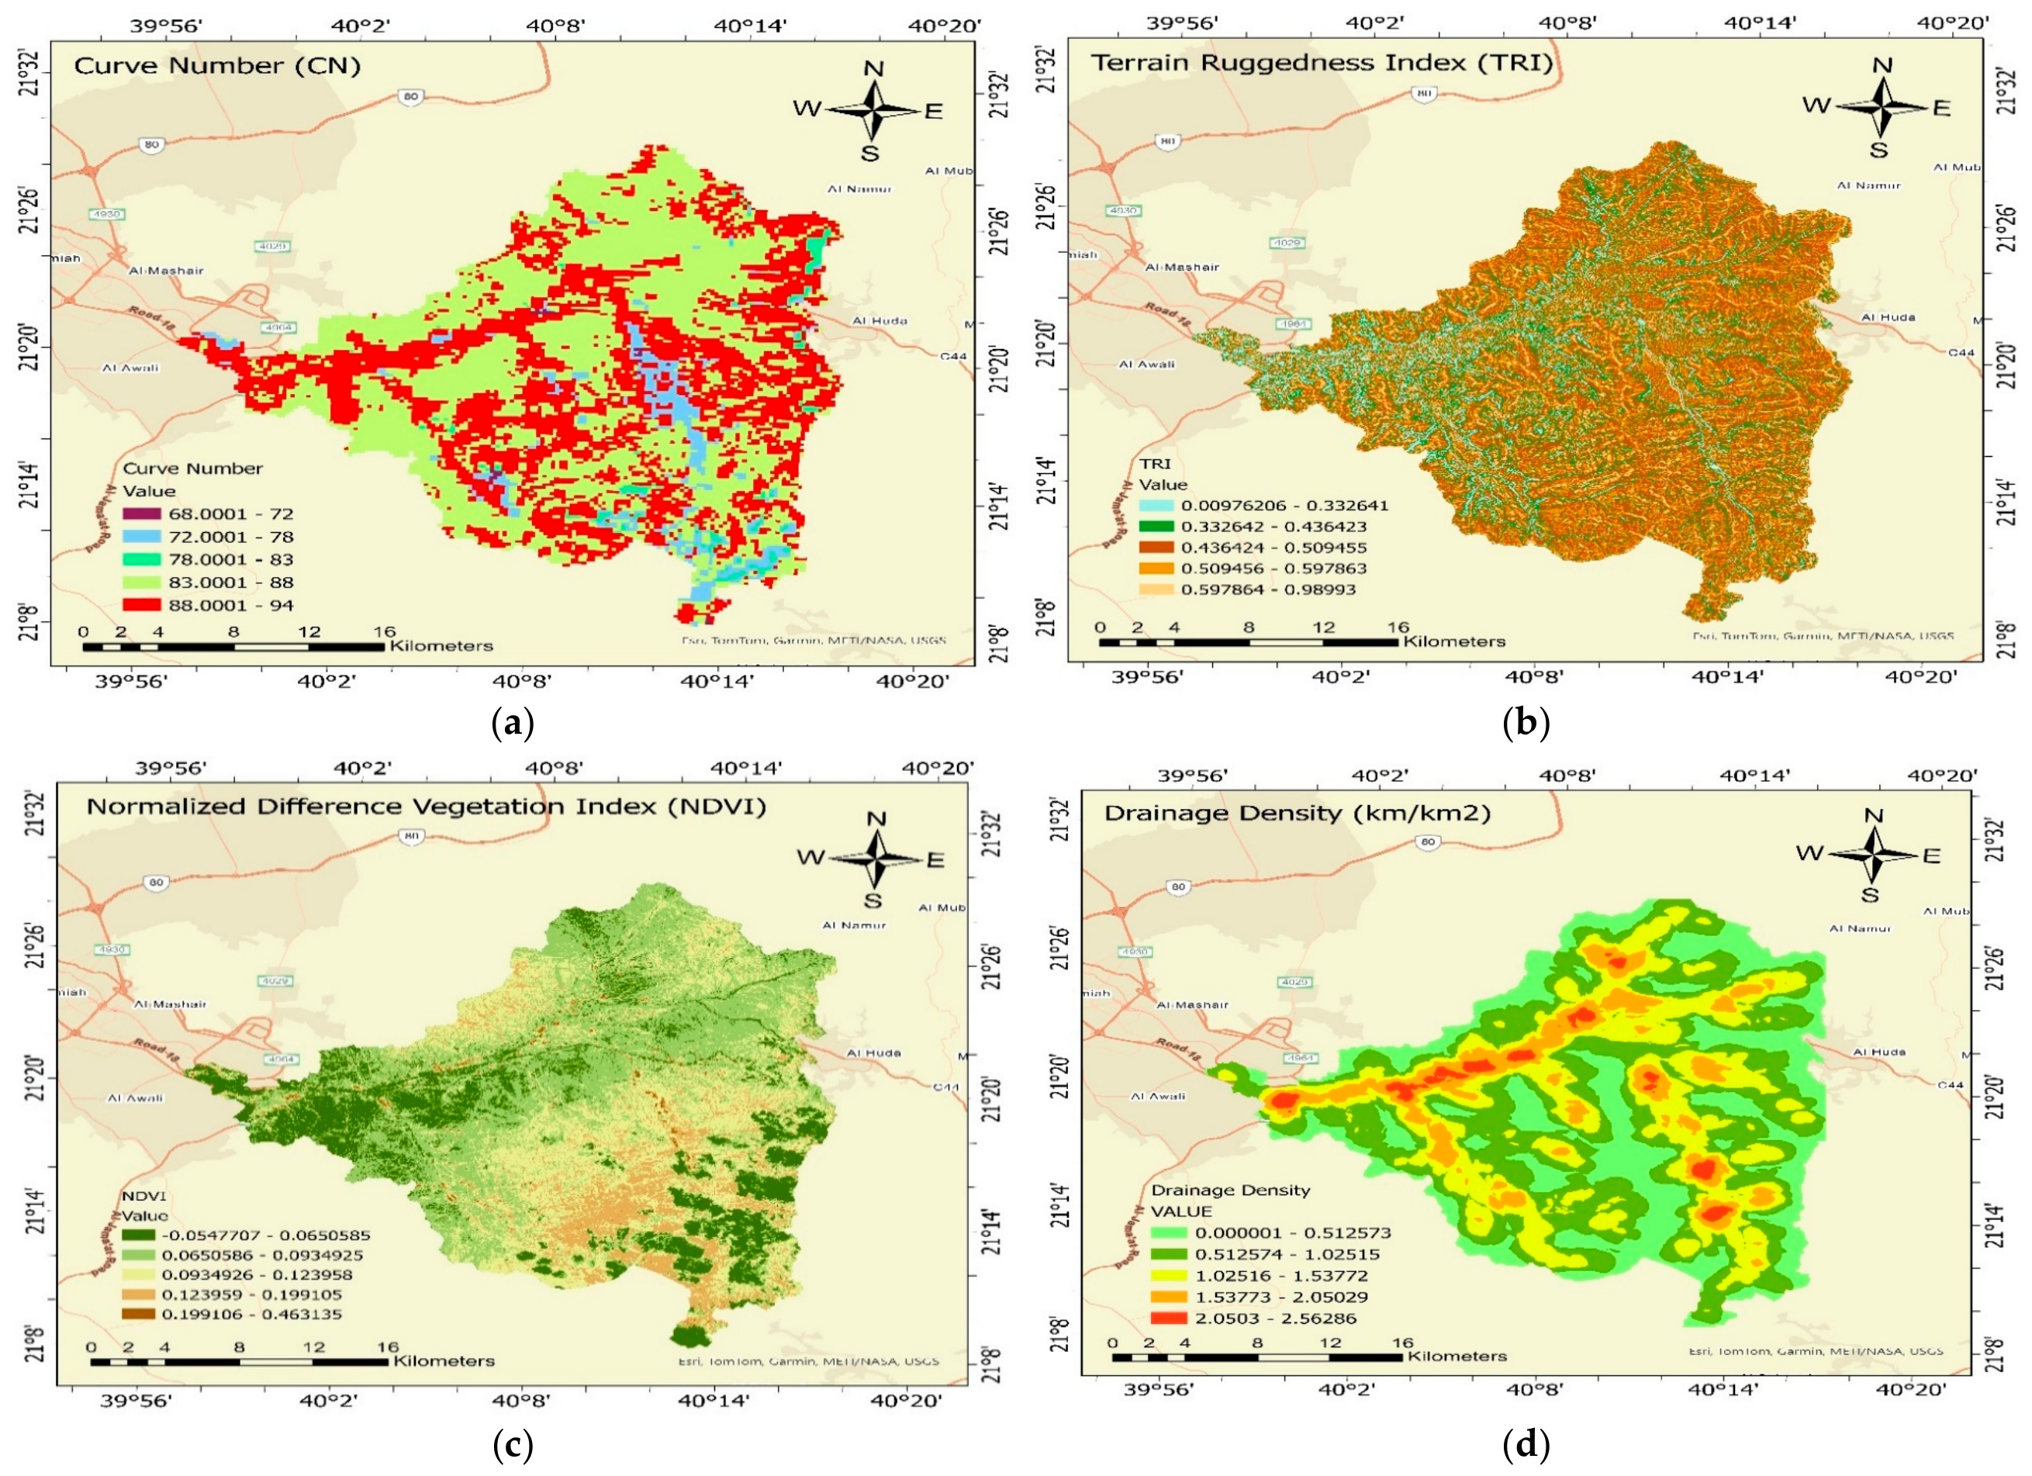
Spatial distribution of the flood conditioning factors used in flood susceptibility modeling: (a) Curve Number (CN), (b) Terrain Ruggedness Index (TRI), (c) Normalized Difference Vegetation Index (NDVI), and (d) Drainage Density (DD).
2.2.4. Topographic Wetness Index (TWI)
The Topographic Wetness Index (TWI) is widely used to identify areas with a greater tendency to accumulate water and, therefore, a higher potential for flooding [1,31]. It combines information on terrain slope and upstream contributing area to represent the spatial distribution of moisture across the landscape. Higher TWI values generally indicate wetter conditions and a greater likelihood of runoff accumulation and flood occurrence. In this study, TWI was calculated using Equation (1).
In Equation (1), the slope is expressed in radians, while As represents the upslope contributing area, and is local slope angle, expressed in radians. The Topographic Wetness Index (TWI) was calculated using the Spatial Analyst tools in ArcGIS, and its spatial distribution is shown in Figure 3d. Areas with higher TWI values generally indicate greater potential for water accumulation and wetter conditions, making them more susceptible to runoff concentration and flooding. In contrast, areas with lower TWI values tend to be drier because they receive less contributing flow from the surrounding terrain [3,30,31].
2.2.5. Curve Number (CN)
The Curve Number (CN) data used in this study were obtained from the global dataset developed by Jaafar et al. [32], with a spatial resolution of approximately 250 m. The dataset was developed following the USDA Curve Number method and provides CN values for different antecedent moisture conditions. In this study, AMC II was selected because it represents average soil-moisture conditions and provides a reasonable baseline for assessing general runoff and flood susceptibility. The CN data were clipped to the Wadi Numan watershed boundary and used as one of the flood-conditioning factors in the susceptibility analysis. The range of CN values is 0 to 100 [32,33]. A number of 100 indicates the fact that there is insufficient soil absorption, indicating that rain equals runoff, and a value of 0 indicates that there is zero runoff, indicating that the soil takes the bulk of the water [34]. CN readings in the research region vary from a high value of 94 to a minimum of 57. Figure 4a shows the region’s CN distribution.
2.2.6. Terrain Ruggedness Index (TRI)
The Terrain Ruggedness Index (TRI) measures the variation in elevation between a cell and its surrounding neighbors, providing an indication of terrain roughness and complexity [35]. Higher TRI values are typically associated with steep and rugged landscapes where elevation changes rapidly over short distances. The spatial distribution of TRI across the study area is shown in Figure 4b and described by Różycka et al. [36].
where Xij is the elevation of each neighbor cell to cell (0,0). The spatial distribution of the Terrain Ruggedness Index (TRI) across the study area is shown in Figure 4b.
2.2.7. Normalized Difference Vegetation Index (NDVI)
For assessing plant health and vegetation cover, NDVI (Normalized Difference Vegetation Index) is a popular remote sensing measure. It is predicated on the idea that, because of chlorophyll activity, healthy vegetation absorbs visible red light while significantly reflecting Near-Infrared (NIR) radiation. NDVI values vary from −1 to +1, with higher positive values denoting dense and healthy flora, values close to zero denoting bare soil and urban regions, and negative ones typically denoting water bodies [37]. The Normalized Difference Vegetation Index (NDVI) is calculated using Equation (3).
In the NDVI calculation, NIR refers to the reflectance measured in the near-infrared portion of the spectrum, whereas Red denotes reflectance within the red spectral region. For Landsat 8 and Landsat 9 data, these spectral regions are represented by Bands 5 and 4, respectively. The resulting NDVI values and their spatial variation throughout Wadi Numan are presented in Figure 4c.
2.2.8. Drainage Density (DD)
Drainage density (DD) represents the concentration of drainage channels within a watershed and is calculated as the total stream length per unit area. Higher DD values indicate a denser drainage network, which generally promotes faster runoff and increases flood susceptibility. In this study, the drainage density map was generated from the extracted stream network using the Line Density tool in ArcGIS and was included as one of the flood-conditioning factors in the susceptibility analysis. When rainfall exceeds the infiltration capacity of the soil, excess water generates surface runoff and contributes to drainage network development, particularly in regions with high rainfall intensity and accumulation [38]. The resulting stream density map, generated in ArcGIS, is shown in Figure 4d.
2.3. Data Preprocessing
For the flood susceptibility analysis, a database comprising 287 observations was developed. Each observation was characterized using eight flood-related predictor variables: surface elevation (SE), slope (SL), rainfall depth (RD), Normalized Difference Vegetation Index (NDVI), Drainage Density (DD), Terrain Ruggedness Index (TRI), Topographic Wetness Index (TWI), and Curve Number (CN). These variables were subsequently used as inputs for developing the flood susceptibility model. These factors represent the main topographic, hydrological, and environmental conditions that influence flood occurrence. Surface elevation, slope, rainfall depth, and TWI affect runoff generation and water accumulation, while TRI reflects terrain complexity and flow concentration. NDVI represents vegetation cover, and CN describes the runoff potential of the watershed based on land use and soil characteristics. To further examine the relationships among these variables, a correlation analysis was conducted.
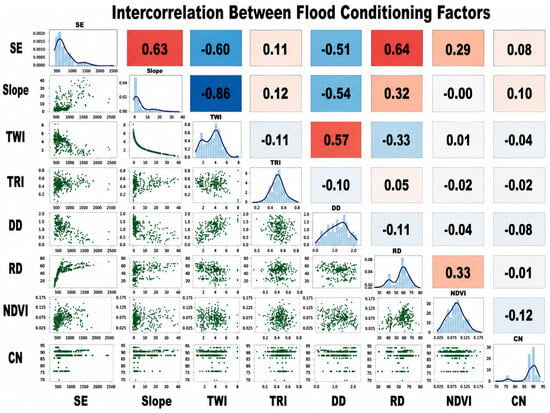
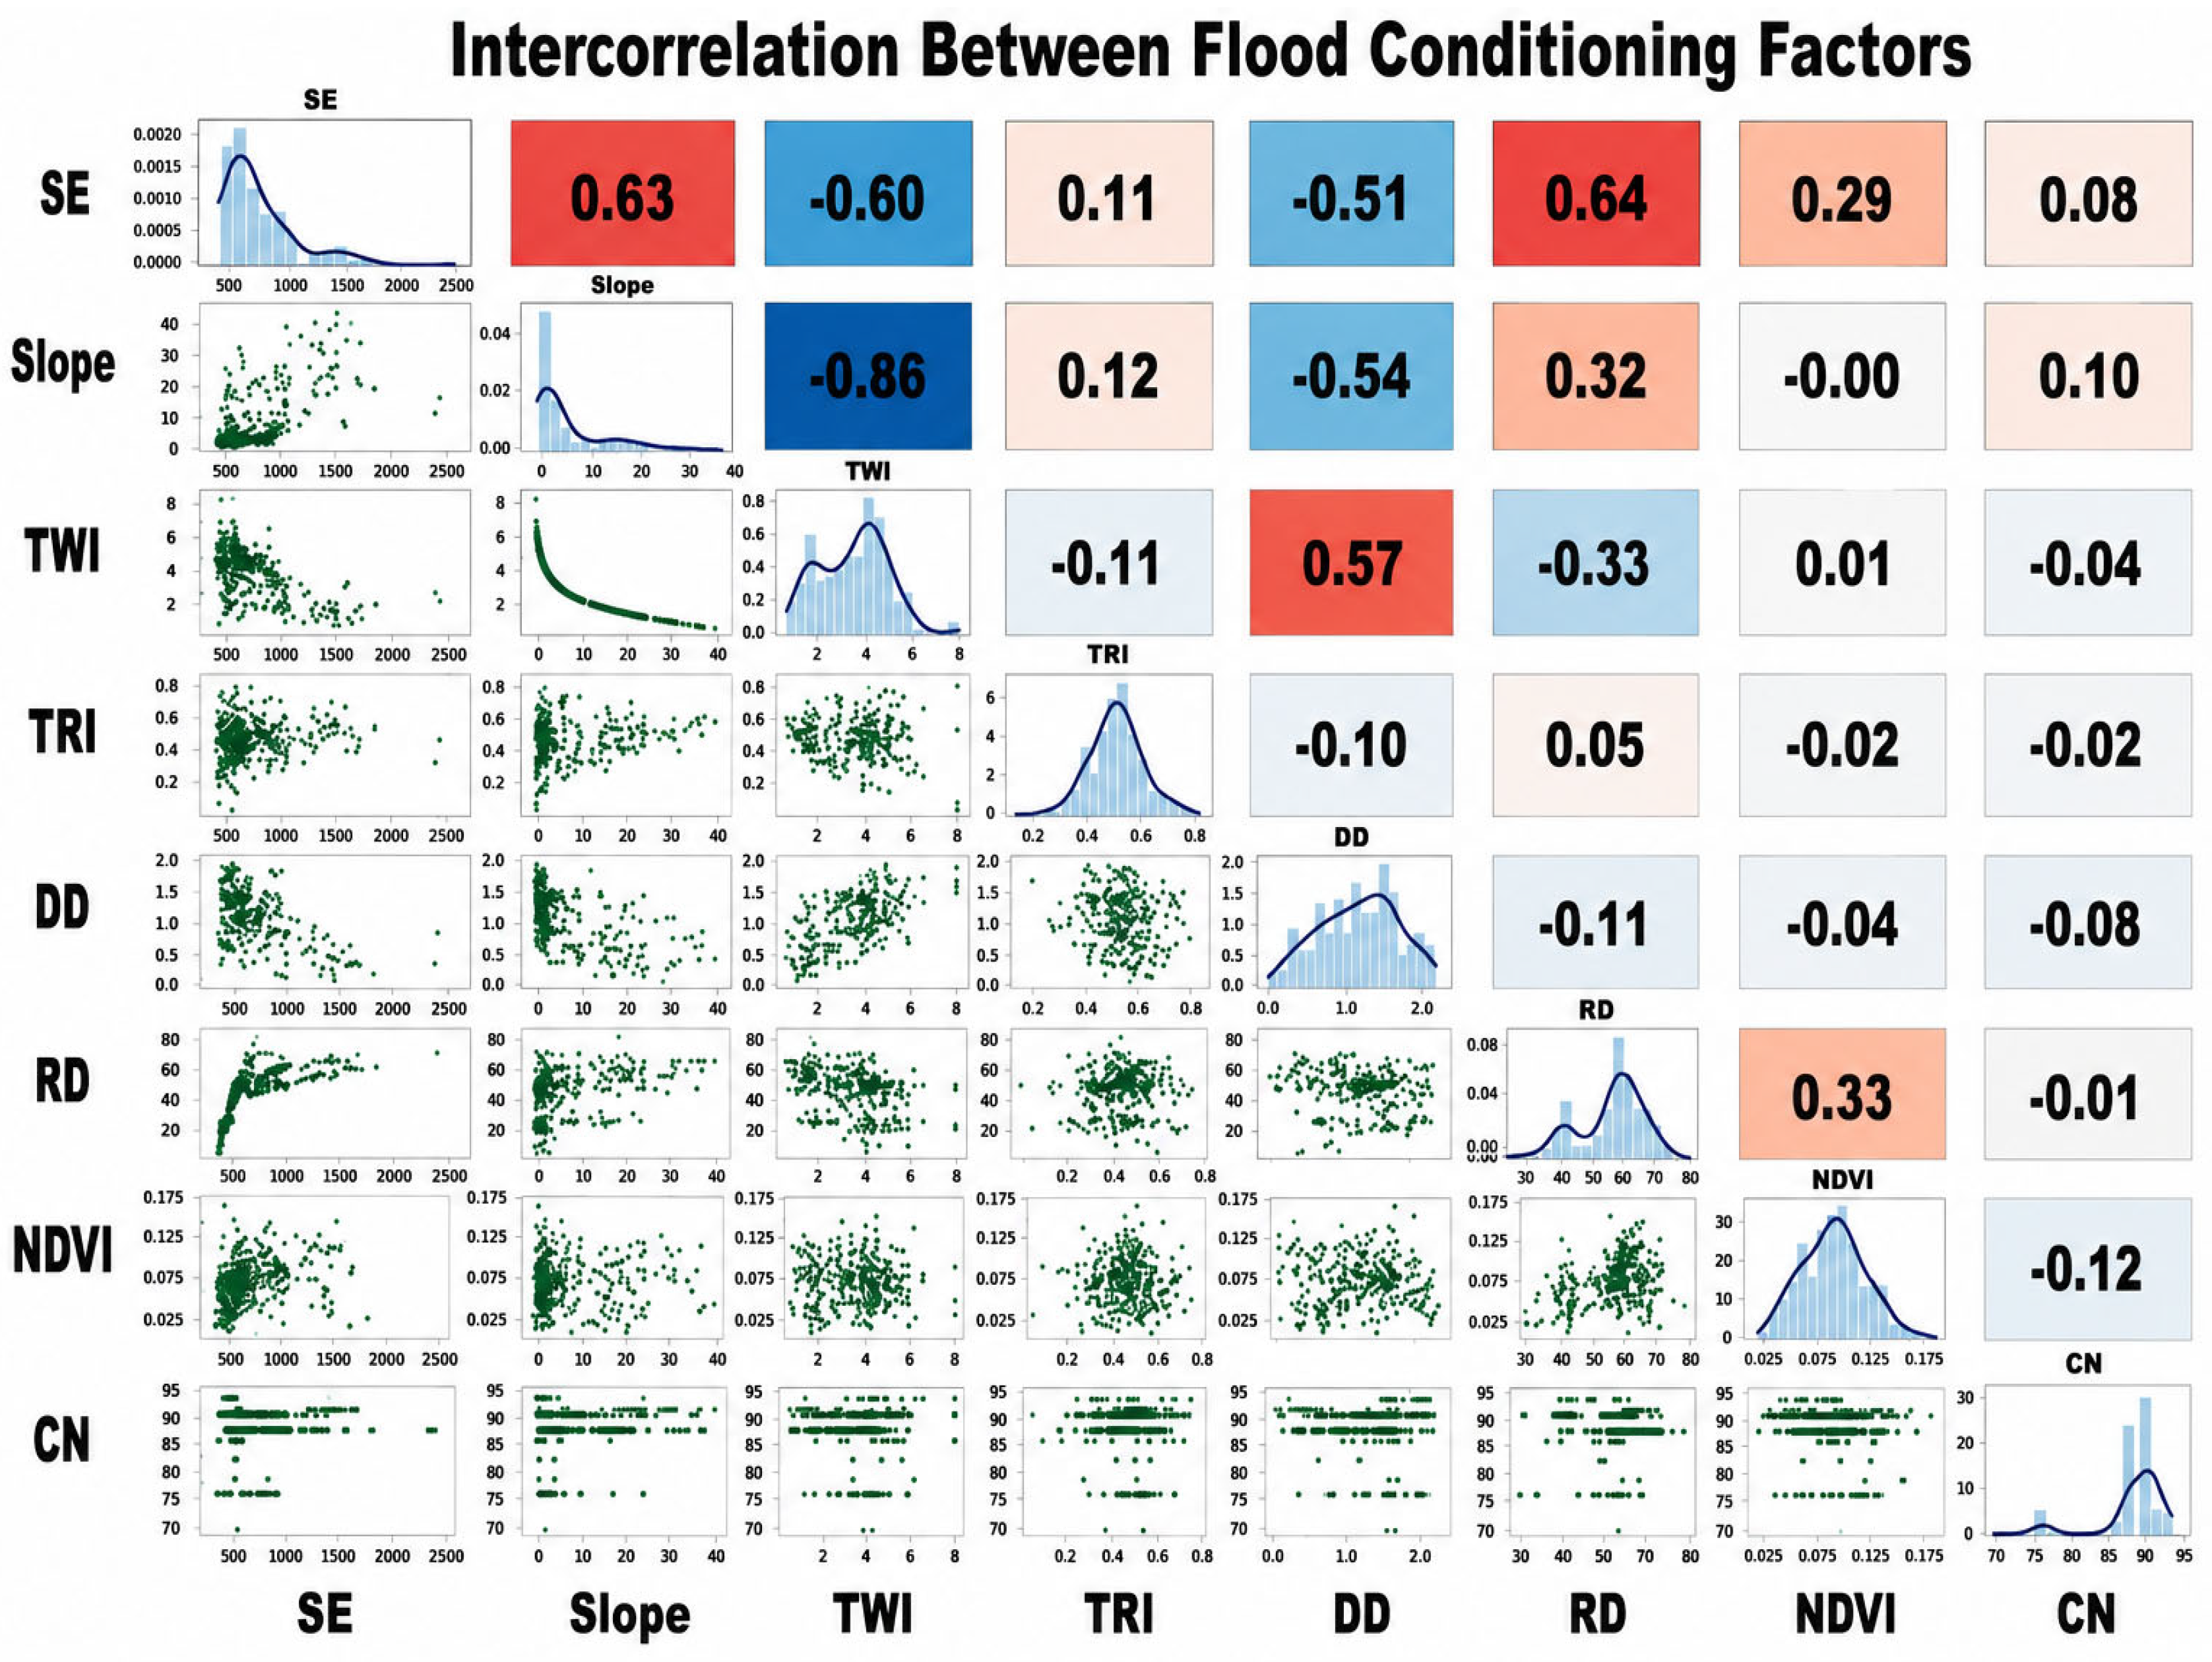
Figure 5 illustrates the relationships among the eight flood-conditioning factors using scatter plots, distribution curves, and correlation coefficients. A strong negative correlation was observed between slope and TWI (r = −0.86), while positive correlations were found between SE and RD (r = 0.64), SE and slope (r = 0.63), and TWI and DD (r = 0.57). Most other factors showed weak correlations. Despite these relationships, all eight variables were retained for flood susceptibility modeling, as each represents a different aspect of the hydro-environmental conditions influencing flood occurrence.
Figure 5.
Pairwise relationships among flood conditioning factors used in the machine learning models.
2.4. Machine Learning Classification Methods
A machine learning framework was developed to identify the most suitable classifiers for flood susceptibility assessment and to determine the relative importance of the selected flood conditioning factors. The analysis was conducted using the MATLAB Classification Learner application, which provides a comprehensive suite of supervised machine learning algorithms for classification and predictive modeling [39,40,41,42]. Using the same input dataset, 42 built-in classification algorithms from several machine learning families were tested [39,40,41,42]. The evaluated approaches covered logistic regression, support vector machines (SVM), k-nearest neighbors (KNN), discriminant classifiers, decision trees, ensemble methods, and neural network models.
Model performance was evaluated using several statistical measures, including overall accuracy, sensitivity, specificity, confusion matrix results, and the area under the receiver operating characteristic curve (AUC). The classifiers were then ranked according to their predictive performance, and the four models that produced the strongest results were retained for further evaluation. These included Logistic Regression, Linear Support Vector Machine (Linear SVM), Cosine K-Nearest Neighbor (Cosine KNN), Medium Gaussian SVM.
Logistic Regression is a widely used statistical classification technique that estimates the probability of a binary outcome using a set of predictor variables [40,42]. Due to its simplicity and interpretability, it has been widely applied in environmental and hydrological studies involving binary classification problems.
Support Vector Machines (SVMs) are widely used supervised machine learning methods for classification tasks. They can effectively distinguish between classes by identifying a decision boundary that maximizes their separation and can be applied to both linear and complex non-linear datasets [43,44,45,46,47,48]. SVMs have been successfully applied in flood susceptibility assessment because of their ability to capture complex relationships among environmental variables and produce robust predictions even with limited datasets [49,50].
K-Nearest Neighbor (KNN) is a distance-based classification method that assigns class labels according to the similarity of neighboring observations [51,52]. The Cosine KNN classifier uses cosine distance to measure similarity among samples and is particularly effective when the relative pattern among variables is more important than their absolute values.
In addition to the classifiers evaluated within MATLAB 2024b Classification Learner, an independent Artificial Neural Network (ANN) Pattern Recognition analysis was performed to further investigate the predictive capability of neural-network-based approaches. Artificial Neural Networks are powerful data-driven models capable of learning complex non-linear relationships between input variables and target classes [53,54]. Several ANN architectures with different numbers of hidden neurons were tested and evaluated using training, validation, and testing datasets. The ANN results were subsequently compared with those obtained from the four best-performing machine learning classifiers to assess whether increased model complexity improved flood prediction accuracy and generalization performance. ANNs have been widely used in flood prediction studies because of their ability to model complex hydrological processes and uncover patterns that may not be captured by conventional statistical methods [55,56,57,58]. This framework made it possible to determine which machine learning methods provided the most consistent performance for flood susceptibility assessment. It also allowed the predictive capabilities of traditional machine learning techniques to be directly compared with those of neural network-based approaches [58].
2.5. Statistical Validation
The efficacy of the machine learning classifiers is validated in this work using five more statistical techniques: accuracy (ACC), Recall/sensitivity (SST), as well as specificity (SPF). The five statistical performance measures were calculated using Equations (4)–(8) [1].
The confusion matrix summarizes the classification outcomes for each model. Correctly predicted flooded and non-flooded pixels are represented by True Positives (TP) and True Negatives (TN), respectively. In contrast, False Positives (FP) refer to non-flooded pixels mistakenly predicted as flooded, while False Negatives (FN) represent flooded pixels incorrectly assigned to the non-flooded class. The TP, TN, FP, and FN counts obtained from the confusion matrix were used to evaluate the predictive performance of each model.
2.6. SHAP (SHapley Additive exPlanations) Analysis
SHAP (SHapley Additive exPlanations) is a popular technique used to explain machine learning models in a simple and understandable way. Developed by Lundberg and Lee [17], SHAP helps determine the importance of each factor and explains how variables influence the prediction results either positively or negatively. The method is based on Shapley values from game theory, where each variable receives a fair contribution to the final prediction. SHAP compares the effect of each parameter against the average model prediction, making machine learning models more transparent and interpretable. In flood susceptibility and environmental studies, SHAP analysis is valuable for identifying the most influential flood conditioning factors affecting the model results. It improves the understanding, reliability, and interpretation of artificial intelligence and machine learning models.
3. Results and Discussions
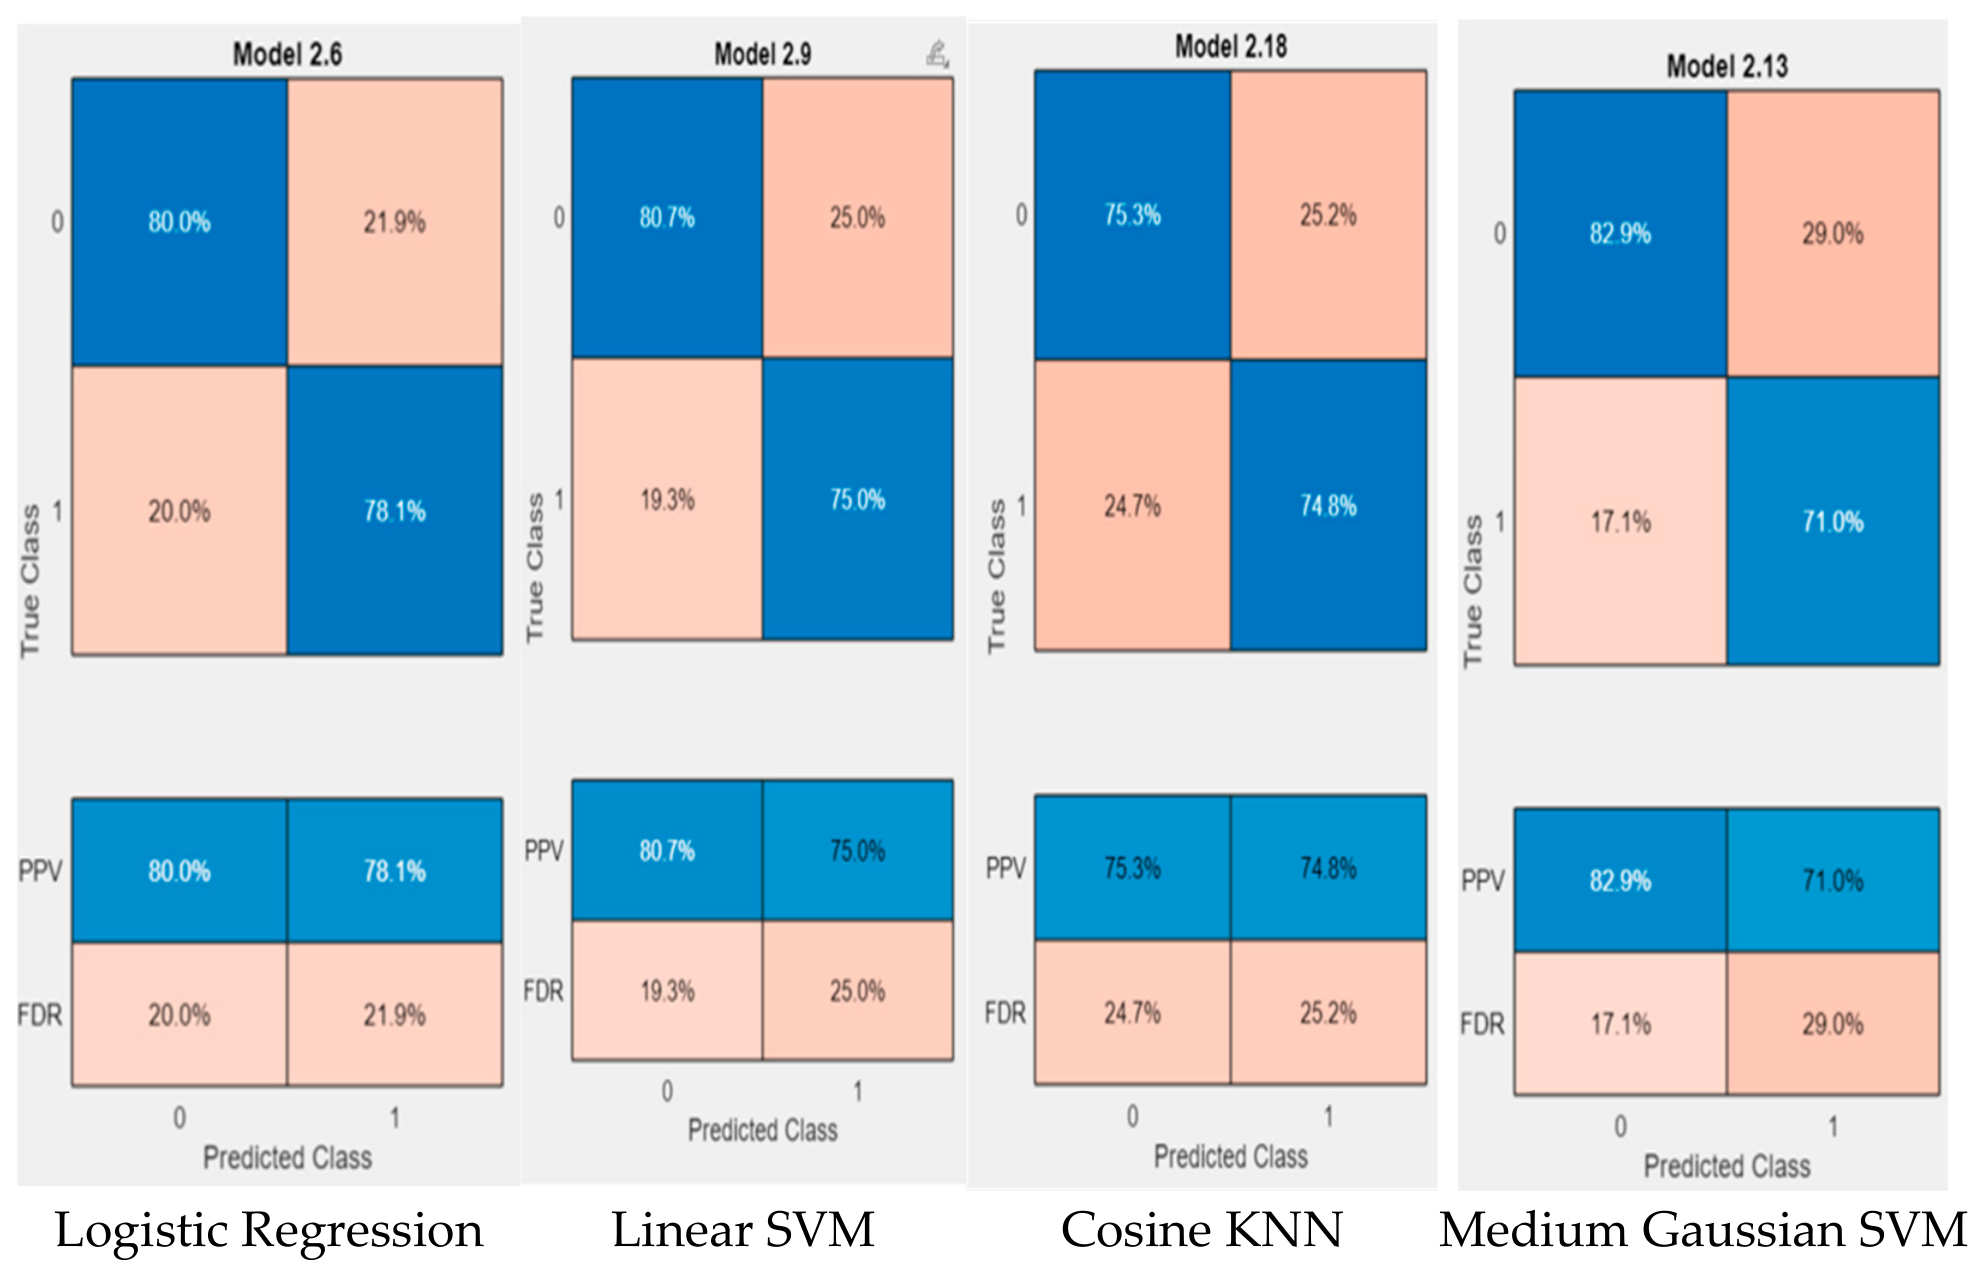
Figure 6 presents the confusion matrices of the four highest-performing machine learning classifiers selected from 42 models evaluated using the MATLAB Classification Learner app. The selected models include Logistic Regression, Linear SVM, Cosine KNN, Medium Gaussian SVM, which demonstrated the strongest predictive performance among all tested algorithms.
Figure 6.
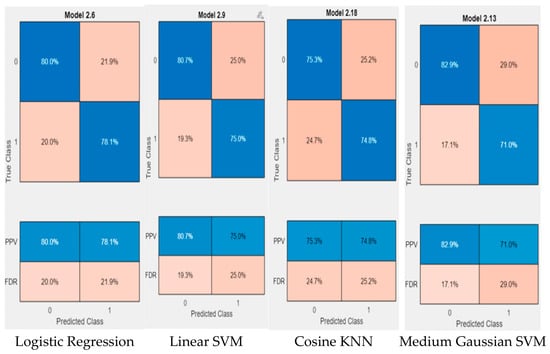
Confusion matrices of the four best-performing machine learning models for flood susceptibility classification.
The confusion matrices (Figure 6) show that the four models were able to distinguish between flood and non-flood locations with good accuracy. In the figure, blue cells represent correctly classified observations, while light orange cells indicate misclassified observations. The diagonal cells show correct predictions, whereas the off-diagonal cells represent classification errors. Logistic Regression and Linear SVM provided the most balanced results, correctly classifying approximately 80–81% of non-flood locations and 75–78% of flood locations. Medium Gaussian SVM achieved the highest classification rate for non-flood locations (82.9%), although its flood detection rate was slightly lower (71.0%). Cosine KNN produced similar classification rates for both classes, correctly identifying 75.3% of non-flood locations and 74.8% of flood locations.
The relatively small differences among the confusion matrices indicate that all four models provide stable and reliable predictions. Logistic Regression and Linear SVM showed a slight advantage in balancing false positives and false negatives, while the remaining models produced comparable results. These findings suggest that the selected classifiers are suitable tools for flood susceptibility assessment and can effectively support the development of flood vulnerability maps.
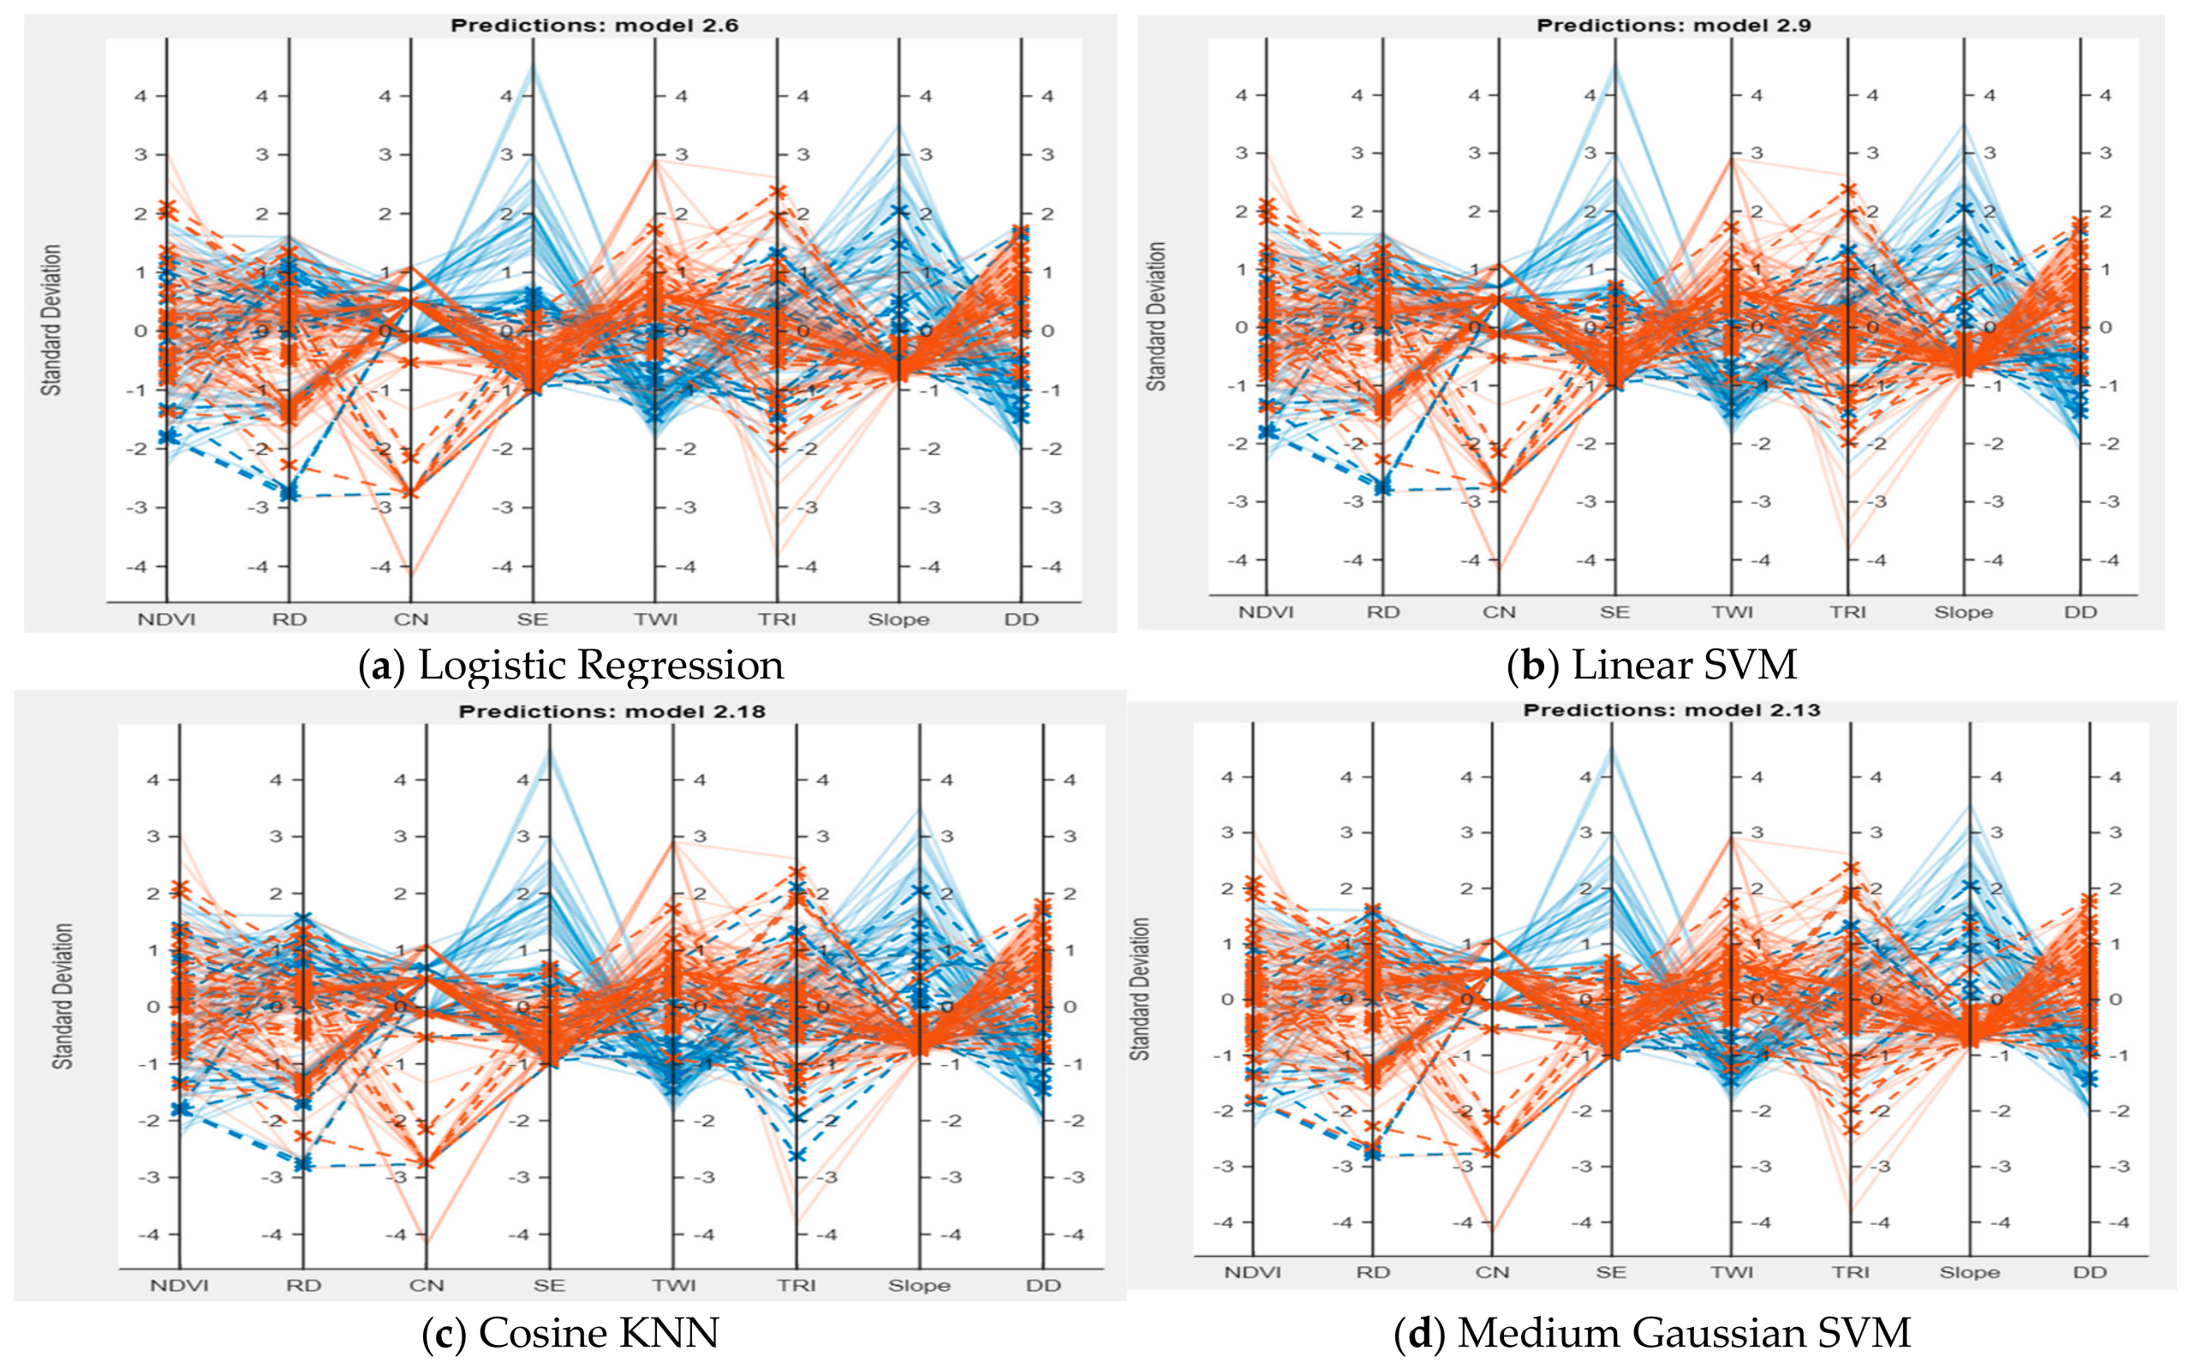
Figure 7 presents parallel coordinate plots for the four best-performing machine learning models: Logistic Regression, Linear SVM, Cosine KNN, and Medium Gaussian SVM. The plots show how the standardized flood conditioning factors vary between flood and non-flood locations. The variables include NDVI, Rainfall Depth (RD), Curve Number (CN), Surface Elevation (SE), Topographic Wetness Index (TWI), Terrain Ruggedness Index (TRI), Slope, and Drainage Density (DD). Figure 7 shows the parallel coordinate plots for Logistic Regression and Linear SVM. The blue lines represent locations predicted as non-flood (Class 0), while the orange lines indicate locations predicted as flood (Class 1). Each line shows how the eight hydro-environmental variables vary across an individual location. The overlap between the blue and orange lines suggests that flood and non-flood locations share similar characteristics in some areas, making it more difficult for the models to distinguish between them.
Figure 7.
Parallel coordinate plots of the four best-performing machine learning models for flood susceptibility classification.
The plots reveal noticeable differences between flood and non-flood samples across several predictors, indicating that the selected variables are effective in distinguishing areas with different flood susceptibility levels. Surface Elevation, Slope, Rainfall Depth, and Topographic Wetness Index show the clearest separation between the two classes, highlighting their importance in flood occurrence. Drainage Density and Terrain Ruggedness Index also contribute to the classification process, although their influence appears less pronounced. NDVI exhibits greater overlap between flood and non-flood samples, suggesting a comparatively smaller individual contribution.
A similar pattern can be observed across all four models, indicating that they identify consistent relationships among the flood conditioning factors. This consistency increases confidence in the robustness of the classification results. The figure also demonstrates that flood occurrence is influenced by the combined effects of topographic, hydrologic, and environmental factors rather than by a single variable. These findings support the use of machine learning techniques for capturing the complex interactions that control flood susceptibility within the study area.
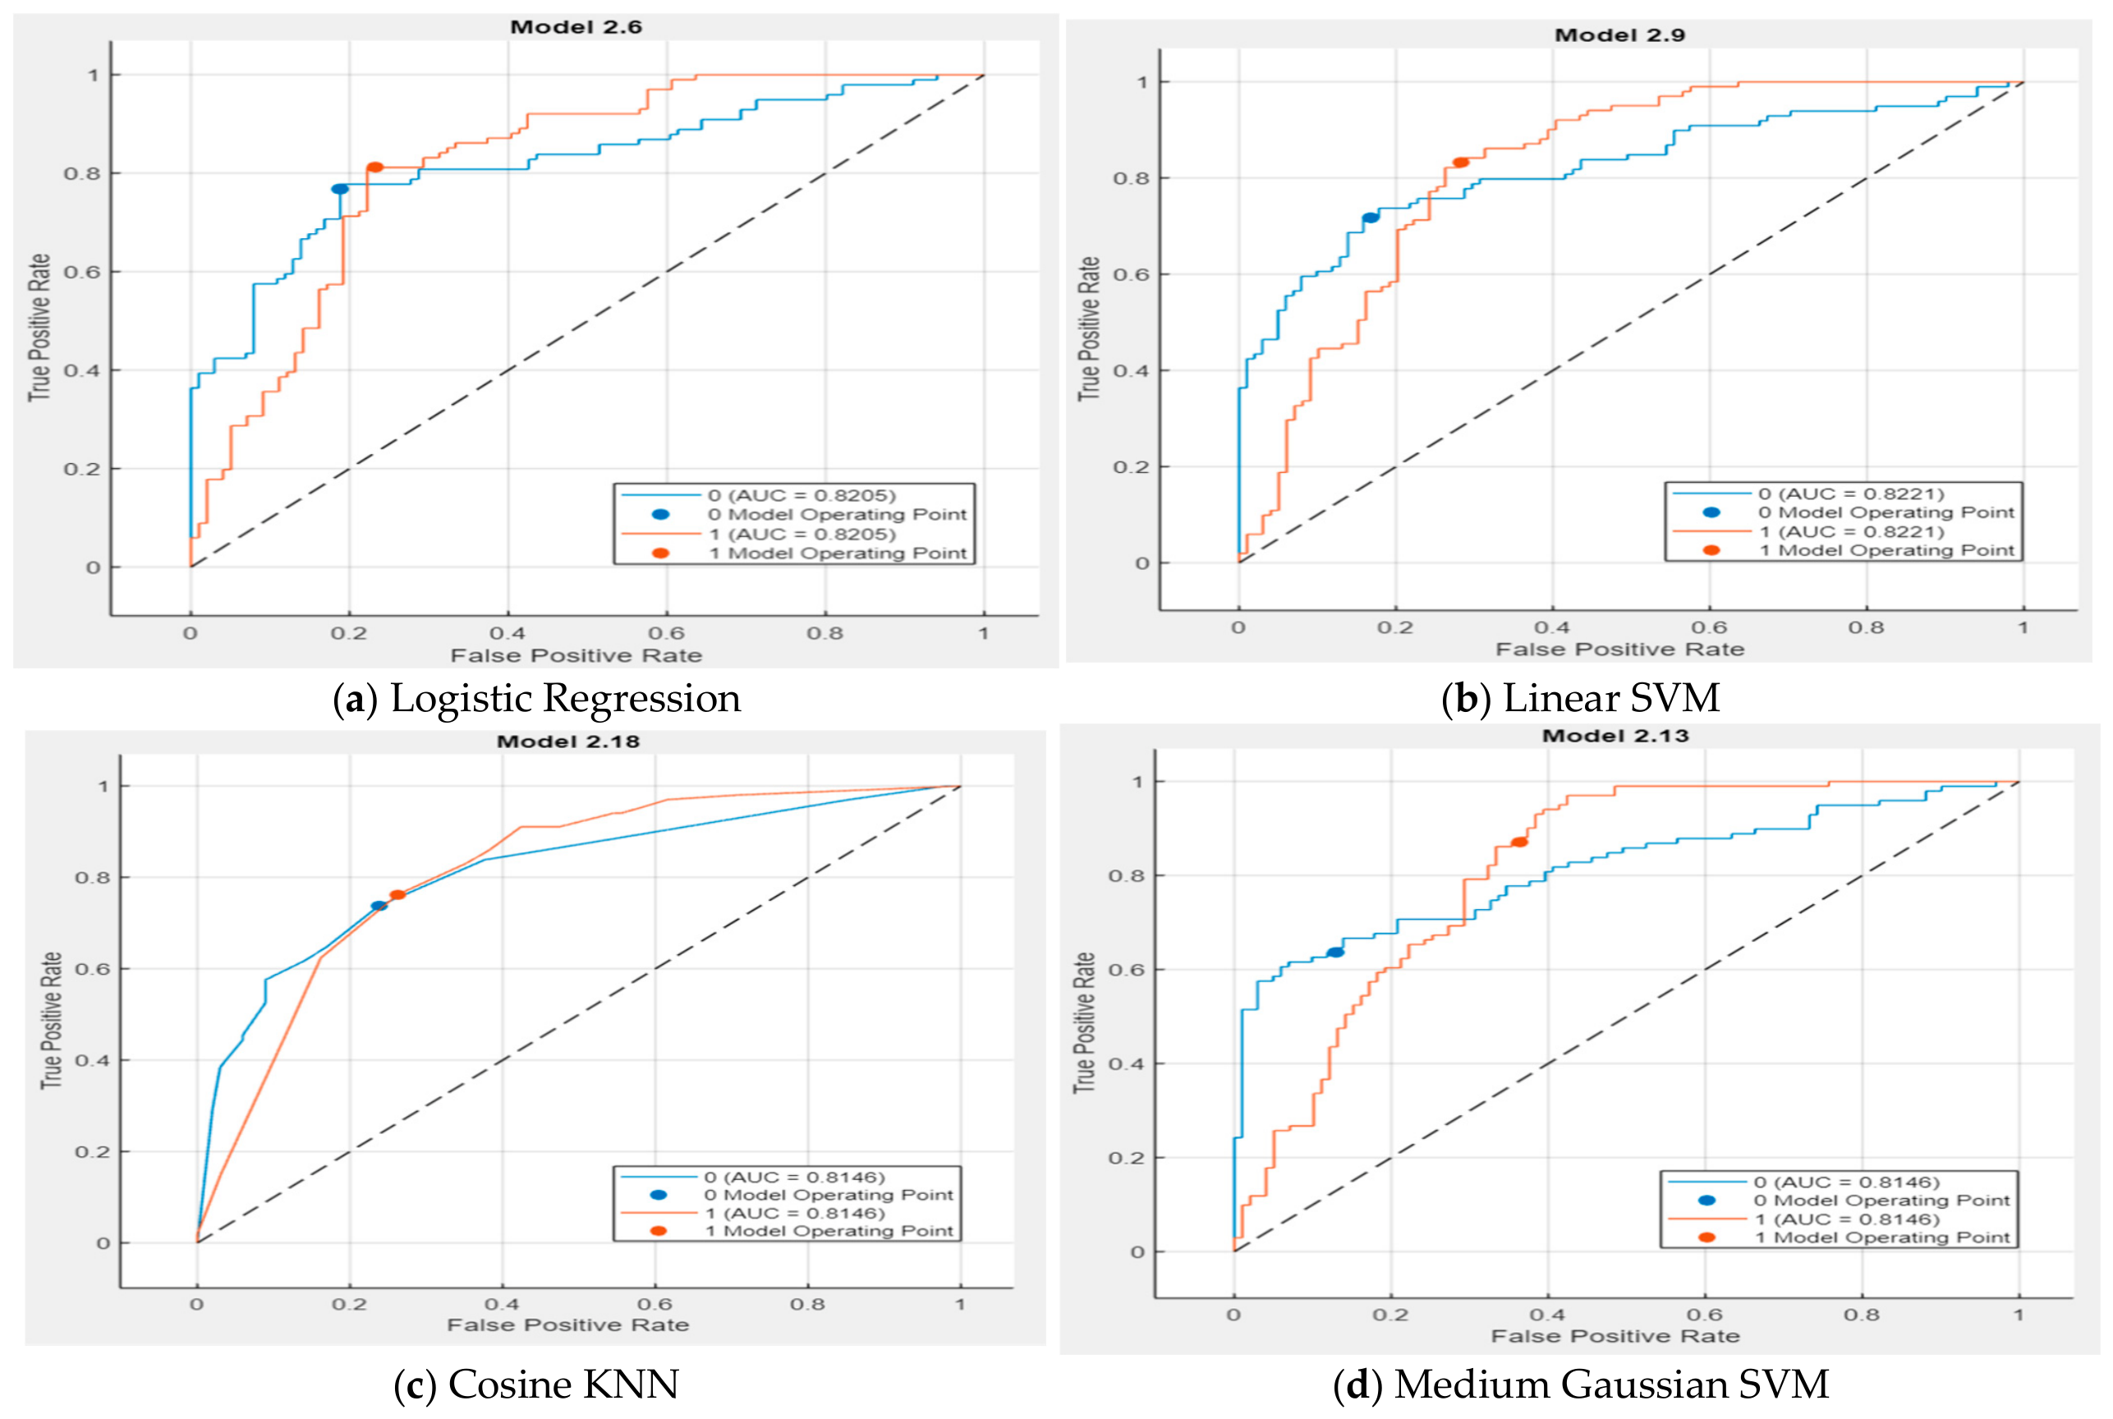
Figure 8 shows the ROC curves for the four best-performing machine learning models: Logistic Regression, Linear SVM, Cosine KNN, and Medium Gaussian SVM. ROC curves are commonly used to evaluate how well a model can distinguish between flood and non-flood locations. The diagonal dashed line represents random classification, while curves located farther above this line indicate better model performance.
Figure 8.
Receiver Operating Characteristic (ROC) curves of the best-performing machine learning models for flood susceptibility classification.
All four models performed well, with AUC values ranging from approximately 0.81 to 0.82. Linear SVM achieved the highest AUC value (0.8221), closely followed by Logistic Regression (0.8205). Cosine KNN and Medium Gaussian SVM produced slightly lower but still strong AUC values of about 0.8146. These results indicate that all four models have a good ability to differentiate between flood-prone and non-flood-prone areas.
The ROC curves are very similar, suggesting that the selected classifiers provide consistent and reliable predictions. Although Linear SVM and Logistic Regression showed a slight advantage, the differences among the models are relatively small. This finding demonstrates that the selected flood conditioning factors contain sufficient information to support accurate flood susceptibility prediction regardless of the classification algorithm used.
The AUC values exceeding 0.80 indicate good predictive performance and confirm that the developed models are effective tools for identifying areas vulnerable to flooding. These results provide additional confidence in the reliability of the flood susceptibility maps generated for the study area.
3.1. Comparison Between Models
Table 1 confirms that Logistic Regression provides the best-balanced overall performance, with the highest accuracy (79.05%) and F1-score (78.85%). Medium Gaussian SVM has the highest sensitivity (80.59%), suggesting stronger flood detection, whereas the ANN model has the highest specificity (87.5%) and precision (83.6%) but much lower sensitivity (64.8%), indicating better identification of non-flood cases but a greater tendency to miss actual flood cases.
Table 1.
Performance metrics of the best-performing machine learning classifiers and ANN pattern recognition model for flood susceptibility classification.
ANN Pattern Recognition
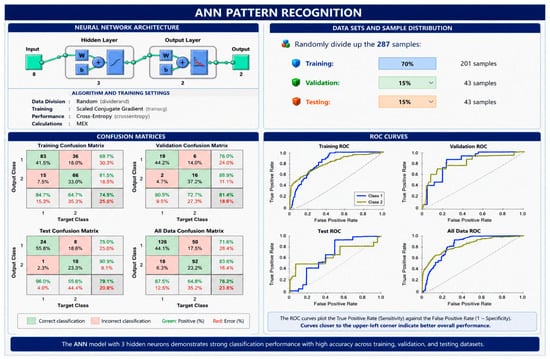
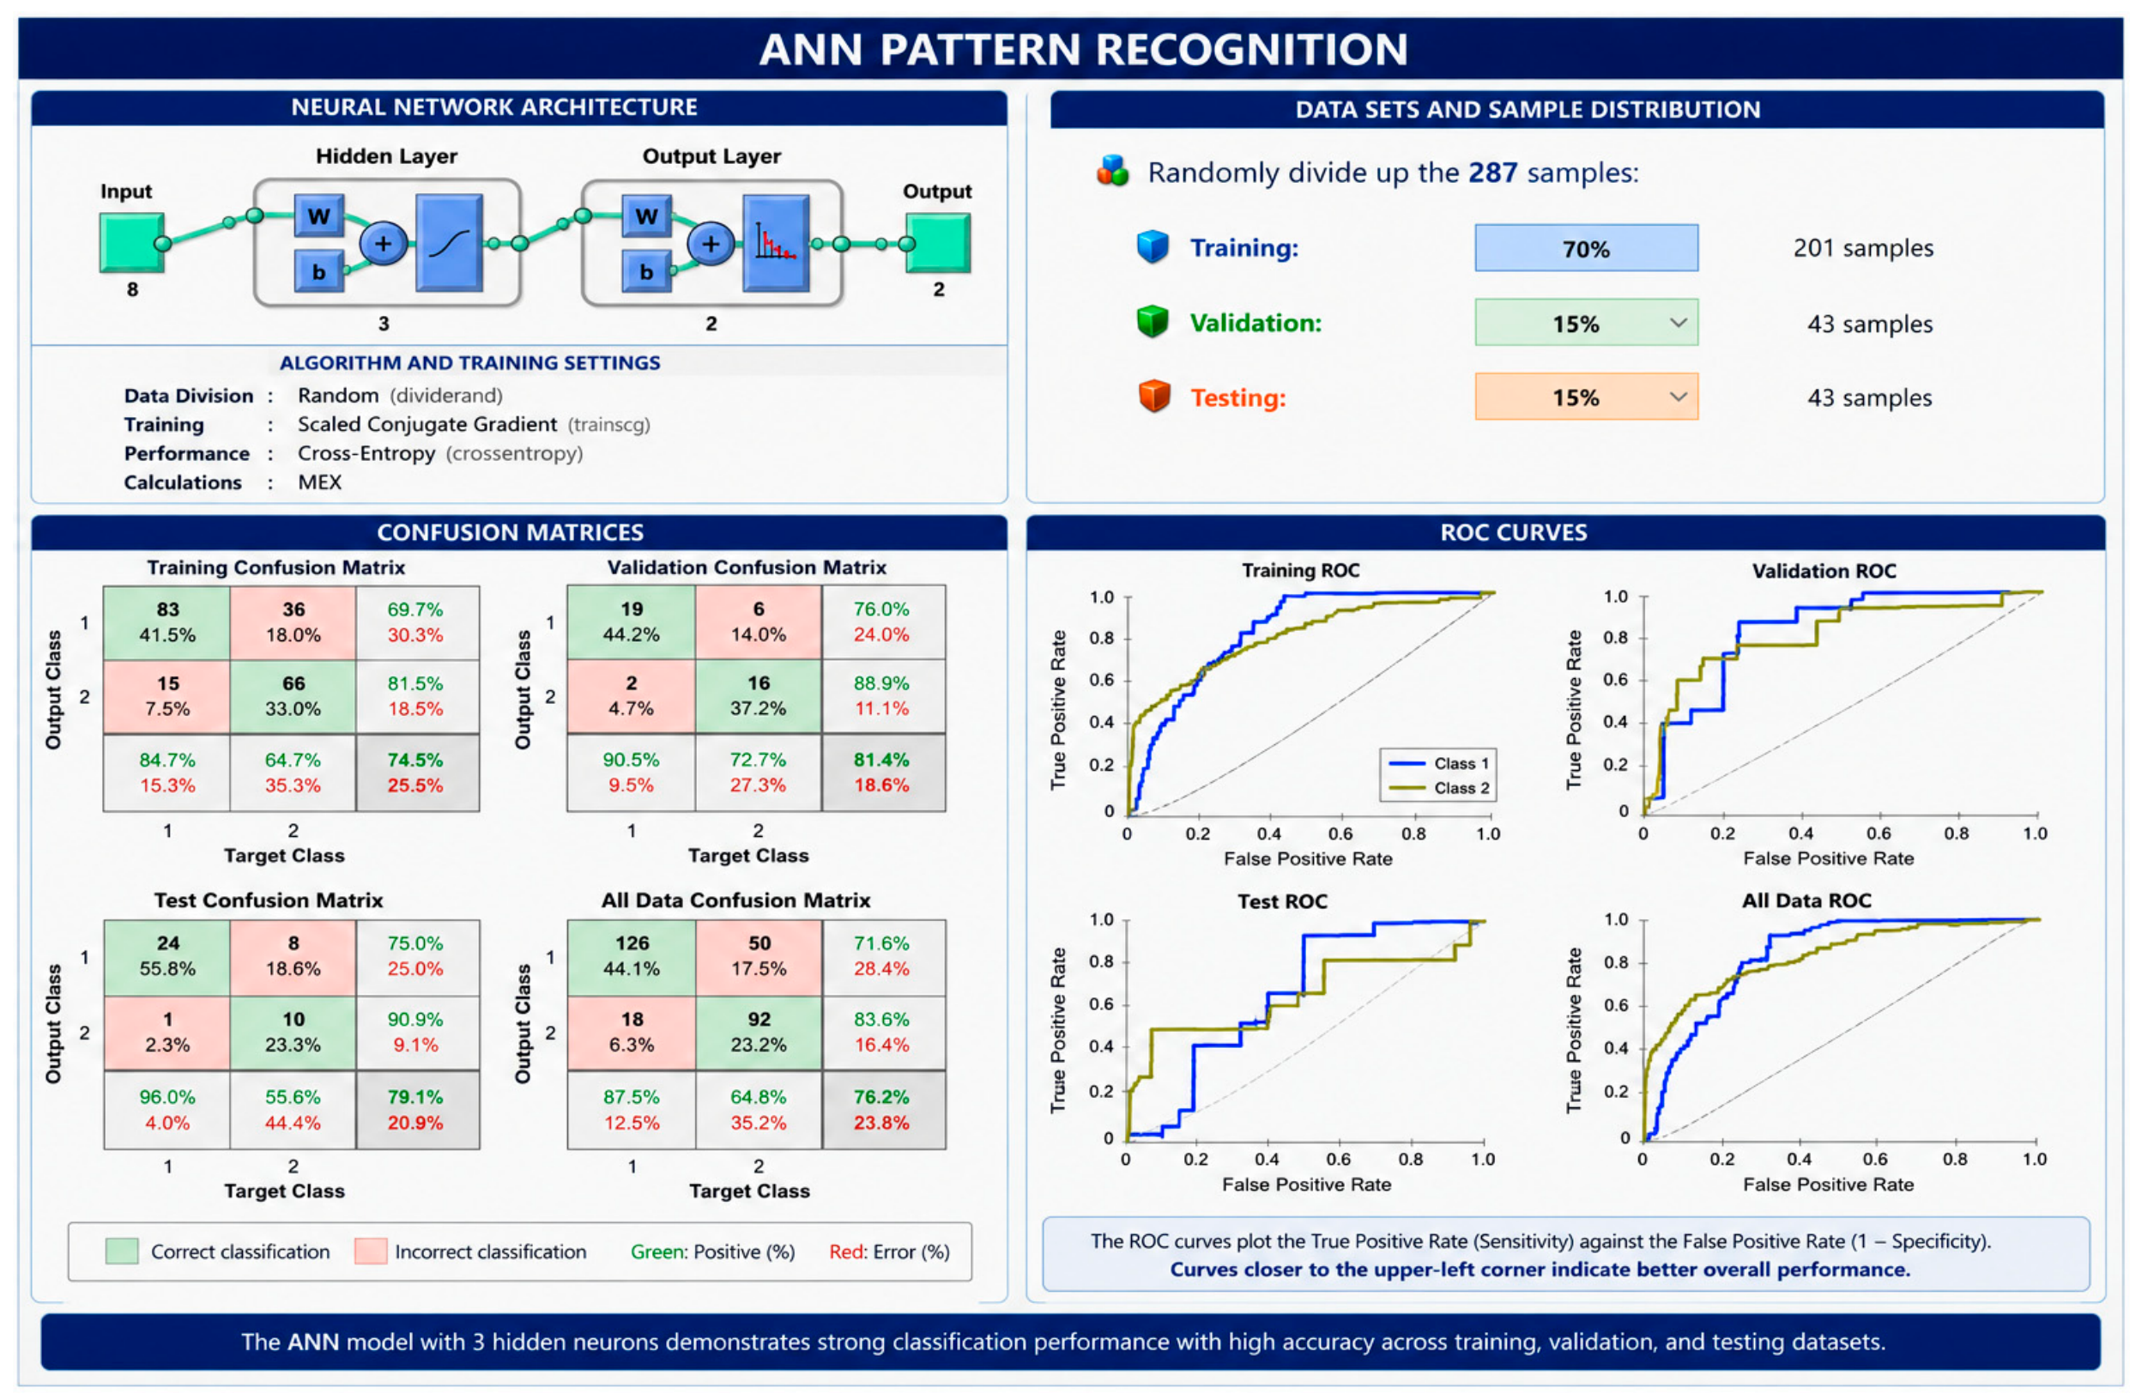
Figure 9 illustrates the configuration of the Artificial Neural Network (ANN) and summarizes its classification performance for distinguishing flooded from non-flooded locations. The analysis used 287 observations, which were randomly allocated to three subsets: 201 samples (70%) for model training, 43 samples (15%) for validation, and the remaining 43 samples (15%) for independent testing. The adopted ANN was a two-layer feedforward architecture, in which the hidden neurons employed a sigmoid transfer function and the final layer used a softmax function to generate the classification outputs. Network parameters were optimized during the learning process using the Scaled Conjugate Gradient training algorithm.
Figure 9.
ANN pattern recognition results for flood susceptibility classification for 3 neuron layers.
Four ANN architectures containing 3, 5, 15, and 20 hidden neurons were evaluated to identify the most suitable network structure. Performance was assessed using confusion matrices and ROC curves for the training, validation, testing, and combined datasets. The ANN model with three hidden neurons provided the best balance between accuracy and model simplicity, achieving an overall classification accuracy of 76.2% (Table 2). The confusion matrices indicate that most flood and non-flood samples were correctly classified, as reflected by the high percentages along the main diagonal.
Table 2.
ANN pattern recognition results with different hidden neurons.
The validation accuracy reached 83.7% for the 15-neuron model and 81.4% for the 3-neuron model. However, the testing results, which provide a better indication of model generalization, showed that the 3-neuron model (79.1%) and 5-neuron model (81.4%) performed most consistently. The ROC curves further demonstrate good discrimination between flood and non-flood classes, with most curves located near the upper-left corner, indicating high sensitivity and specificity. The results suggest that increasing the number of hidden neurons beyond three did not lead to meaningful improvements in predictive performance. Instead, the simpler network structure produced comparable or better results while reducing model complexity. These findings indicate that the ANN model with three hidden neurons is well suited for flood susceptibility classification and can effectively capture the relationships between the selected flood conditioning factors and flood occurrence.
Table 3 includes 22 flood and 21 non-flood validation cases. Logistic Regression and Linear SVM correctly predicted 19 flood and 15 non-flood cases, while Cosine KNN correctly predicted 18 flood and 16 non-flood cases. Medium Gaussian SVM correctly identified the highest number of flood cases (20) but only 12 non-flood cases. These results provide another useful way to compare the four models. Overall, Logistic Regression and Linear SVM achieved the highest number of correct predictions, while Medium Gaussian SVM showed the best performance specifically in detecting flood cases.
Table 3.
Flood-causing data used for validation, observed flood occurrences, and results of the four best-performing machine-learning (ML) approaches.
3.2. Models Hyperparameters
Table 4 summarizes the hyperparameter settings of the four best-performing machine learning models selected from the 42 classifiers evaluated in MATLAB Classification Learner. All models were developed using the full set of eight flood conditioning factors, while PCA remained disabled and default misclassification costs were applied. The selected classifiers cover a diverse range of machine learning methods, encompassing Logistic Regression, Support Vector Machine (SVM), K-Nearest Neighbor (KNN), and ensemble-based algorithms. The results show that good classification performance was achieved using relatively simple model configurations. For example, the Linear SVM used a linear kernel, while the Medium Gaussian SVM employed a Gaussian kernel with a moderate kernel scale. The Cosine KNN model used ten nearest neighbors and a cosine distance metric. Despite the differences in their learning mechanisms, all four models produced comparable predictive performance. The fact that these models performed well without extensive parameter tuning suggests that the selected flood conditioning factors provide strong and meaningful information for distinguishing between flood and non-flood locations. It also indicates that increasing model complexity was not necessarily associated with better performance, highlighting the importance of selecting relevant predictors and appropriate model structures for flood susceptibility assessment.
Table 4.
Hyperparameters of the four best-performing machine learning models selected from the MATLAB Classification Learner app.
3.3. Repeated Stratified Cross-Validation and Model Stability Assessment
The repeated stratified cross-validation results indicated relatively stable performance across the different data partitions, as shown in Table 5. The mean accuracies were 0.7547 ± 0.0470 for Logistic Regression, 0.7516 ± 0.0455 for Linear SVM, 0.7422 ± 0.0452 for Cosine KNN, and 0.7572 ± 0.0415 for Medium Gaussian SVM. Medium Gaussian SVM achieved the highest mean accuracy (0.7572; 95% CI: 0.7454–0.7690) and sensitivity (0.8714), whereas Logistic Regression showed the highest mean specificity (0.7071). The relatively small differences in mean accuracy among the four models indicate comparable predictive performance. Although Logistic Regression performed well in the independent validation assessment, the repeated cross-validation results did not establish its consistent superiority over the other models, as no single model consistently outperformed the others across all evaluation metrics.
Table 5.
Performance of Machine-Learning Models Using Repeated Stratified Five-Fold Cross-Validation.
3.4. SHAP Analysis of the Best-Performing Model (Logistic Regression)
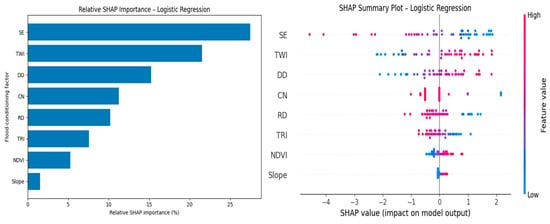
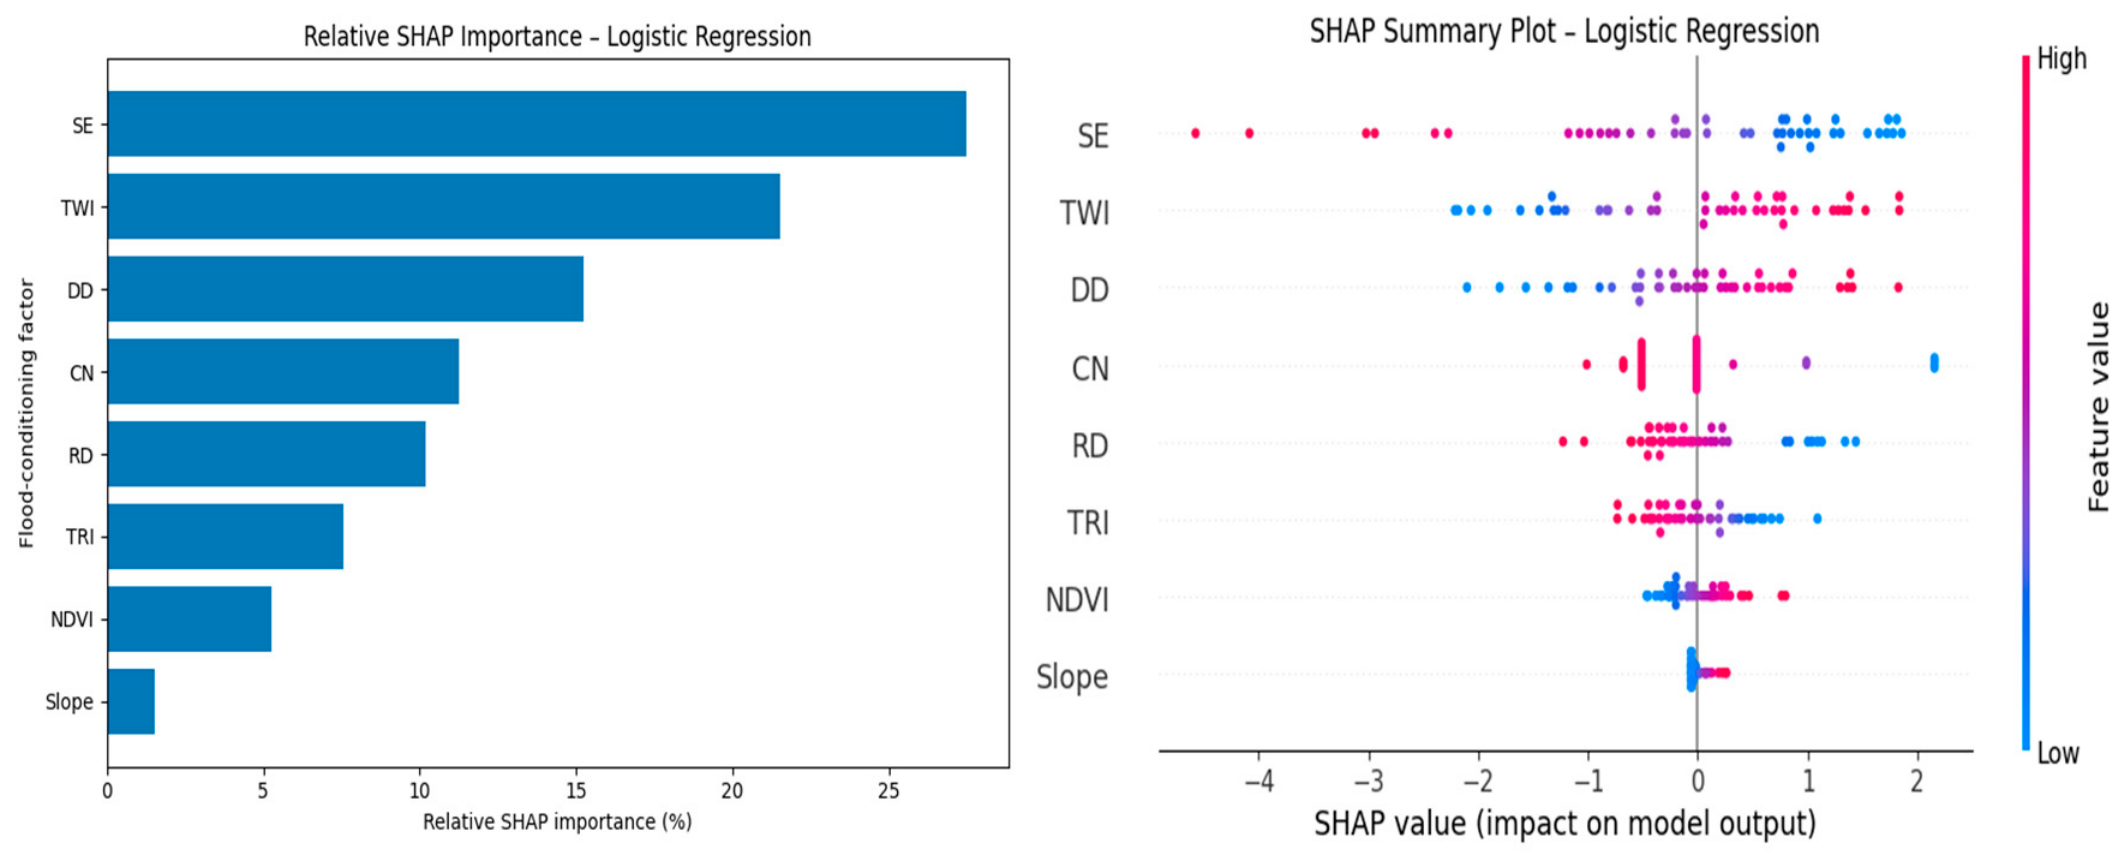
Figure 10 presents the SHAP (SHapley Additive exPlanations) analysis for the Logistic Regression (LR) model, showing both the relative importance of the flood-conditioning factors and the direction of their influence on model predictions. As summarized in Table 6, Surface Elevation (SE) was the most influential factor, with a mean absolute SHAP value of approximately 1.239 and a relative weight of 27.46%. This was followed by the Topographic Wetness Index (TWI) at 21.52%, Drainage Density (DD) at 15.23%, Curve Number (CN) at 11.25%, Rainfall Depth (RD) at 10.19%, Terrain Ruggedness Index (TRI) at 7.58%, NDVI at 5.25%, and Slope at 1.52%. Together, SE, TWI, and DD accounted for about 64.2% of the total model importance, while the five most influential factors contributed approximately 85.7%.
Figure 10.
SHAP values illustrating the relative importance of flood-conditioning factors in the best-performing Logistic Regression (LR) model.
Table 6.
Relative Importance of Flood Conditioning Factors from the SHAP analysis from the best-performing Logistic regression model.
The SHAP summary plot also provides insight into how individual factor values affect the LR predictions. Lower elevation values are generally associated with positive SHAP values, indicating a greater contribution to flood susceptibility in low-lying areas, whereas higher elevations tend to reduce the predicted susceptibility. In contrast, higher TWI values are mostly associated with positive SHAP values, reflecting the greater potential for water accumulation and flow convergence. Drainage Density also shows a noticeable positive contribution in many observations, highlighting the importance of drainage-network characteristics in controlling flood occurrence. The remaining variables have comparatively smaller contributions and show more variable effects across the dataset.
Table 6 also explains how the SHAP results were translated into weights for the weighted-overlay analysis. The mean absolute SHAP value of each factor was divided by the total mean absolute SHAP value of all factors to obtain a normalized weight. These normalized weights sum to 1.0 and were then expressed as percentages for use in the susceptibility mapping. This approach allows the weighting scheme to reflect the relative contribution of each predictor to the LR model, rather than relying on subjectively assigned weights.
Although normalized SHAP values were used to establish data-driven weights for the flood-conditioning factors, the sensitivity of the resulting susceptibility map to variations in these weights was not explicitly assessed. Changes in the relative weights of influential factors, particularly TWI, RD, and NDVI, could affect the spatial distribution of susceptibility scores and potentially alter the classification of areas near susceptibility thresholds. Consequently, the robustness of the mapped susceptibility patterns under alternative weighting scenarios remains uncertain. Future studies should incorporate sensitivity and uncertainty analyses by systematically varying factor weights and comparing the resulting susceptibility maps to evaluate the stability of spatial patterns and susceptibility classifications.
3.5. Flood Susceptibility Map
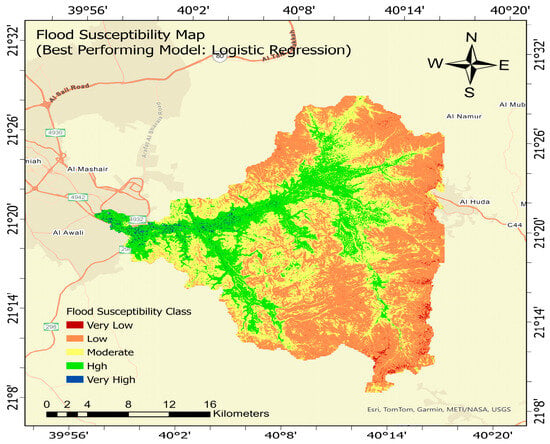
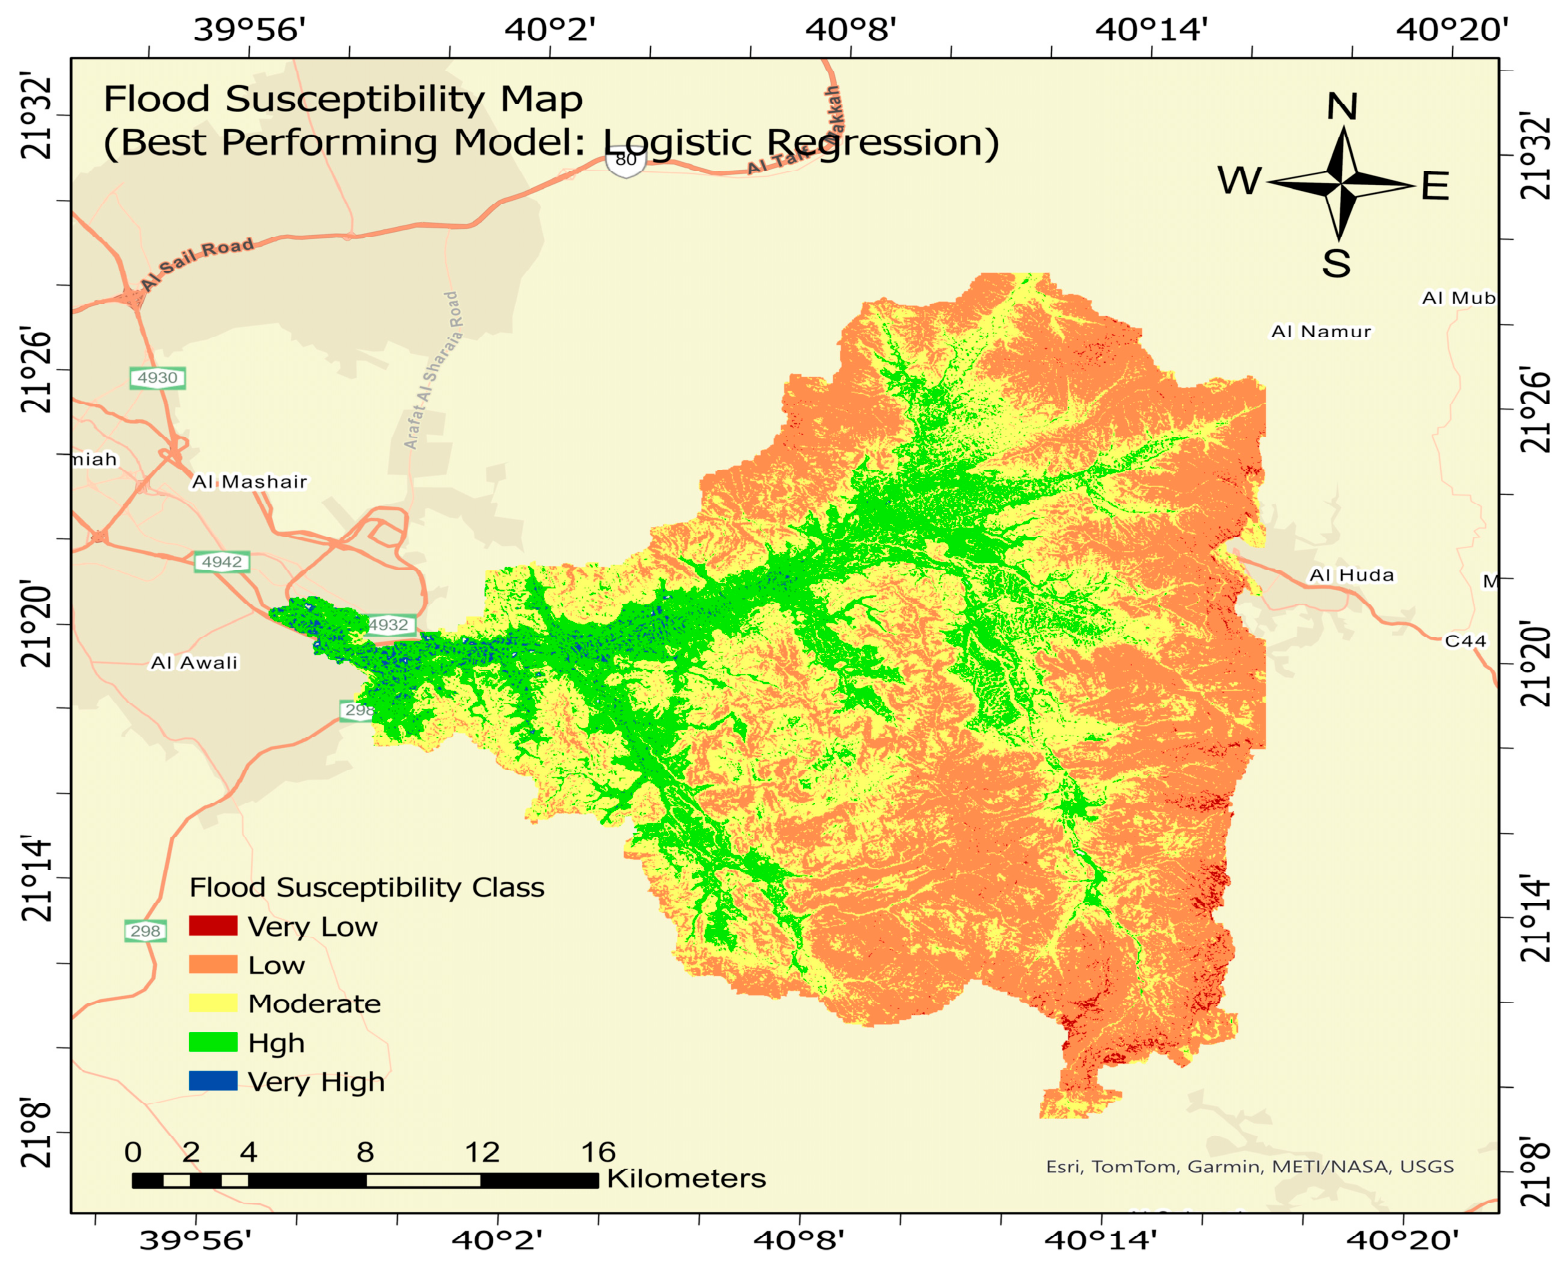
Figure 11 shows the final flood susceptibility map produced using the Logistic Regression model, which achieved the highest predictive performance among the evaluated models. The map was generated in ArcGIS Spatial Analyst using the Weighted Overlay tool, where the flood-conditioning factors were integrated according to their relative importance derived from the model results. The resulting map shows clear spatial variation in flood susceptibility across the Wadi Numan watershed. The Low susceptibility class covers the largest area, approximately 289.57 km2 (42.87%), followed by the Moderate class, which occupies 252.21 km2 (37.34%). The High susceptibility class covers 123.78 km2 (18.32%), while the Very High class occupies 5.03 km2 (0.74%). The Very Low susceptibility class covers approximately 4.91 km2 (0.73%). Overall, the High and Very High susceptibility classes together account for approximately 128.81 km2 (19.07%) of the watershed. These higher-susceptibility areas are mainly associated with drainage pathways and low-lying areas where runoff can accumulate, while lower susceptibility generally occurs away from the main runoff-concentration zones. The spatial pattern reflects the combined influence of topography, drainage characteristics, rainfall, vegetation, and other hydrological conditions and provides useful information for identifying areas that should receive greater attention in flood management and mitigation planning.
Figure 11.
Flood susceptibility map produced by the best-performing machine learning model (Logistic Regression).
4. Discussion
The spatial distribution of flood susceptibility obtained in this study is generally consistent with previous investigations conducted in Jeddah, Makkah, and other watersheds in western Saudi Arabia. The present results show that highly susceptible areas are closely associated with drainage pathways and relatively low-lying terrain, where runoff generated in upstream areas can accumulate. Therefore, locations receiving the highest local rainfall do not necessarily correspond to areas with the highest flood susceptibility. This behavior is common in arid watersheds, where intense rainfall over elevated and steep terrain can rapidly generate runoff that is transferred through wadis toward lower elevations.
Similar behavior was reported by Al-Juaidi [14] for the eastern Jeddah watersheds. Using Logistic Regression and geo-environmental flood-conditioning factors, that study demonstrated the importance of interactions between topographic slope and other environmental factors in determining flood susceptibility. This supports the present finding that flood occurrence cannot be explained by rainfall or any single conditioning factor alone, but rather by the combined influence of terrain, drainage characteristics, runoff conditions, and other environmental factors.
Other machine-learning studies in Jeddah have reached comparable conclusions. Al-Areeq et al. [28] evaluated several ML approaches using GIS and remote-sensing-derived flood-conditioning factors and reported strong predictive performance. Their results highlighted the exposure of Jeddah’s lower areas to runoff originating from the mountainous watersheds to the east. Ghanim et al. [25] similarly applied several machine-learning algorithms to Jeddah using topographic, hydrological, climatic, and land-surface variables. These studies further demonstrate that flooding in Jeddah results from interactions among several conditioning factors rather than the influence of a single variable.
More recent research in Jeddah using machine-learning models combined with SHAP analysis also supports this interpretation. Terrain and drainage-related characteristics, together with runoff-generating and land-surface conditions, were identified as important predictors of flood susceptibility. These findings are particularly relevant to the present study because they demonstrate that variables such as TRI, CN, and drainage characteristics can have considerable predictive importance even when their individual distributions do not show a simple relationship with observed flood locations.
The results are also consistent with previous research conducted directly within Wadi Numan. Abdelkarim and Gaber [4] combined geomatics, remote sensing, hydrological modeling, and hydraulic modeling to evaluate flood risk in the watershed. Their study demonstrated that flood hazards are strongly associated with drainage pathways and downstream development and highlighted the transfer of runoff from upstream contributing areas toward lower parts of the watershed.
Overall, these regional studies support the spatial pattern identified in the present work. Flood susceptibility in Wadi Numan should therefore be understood as the combined response of rainfall, topography, drainage connectivity, runoff potential, and land-surface characteristics. This also helps explain why the SHAP importance of individual variables does not necessarily correspond directly to differences in their mean values between flood and non-flood locations. Correlations and interactions among the conditioning factors can redistribute their contributions within the model. Consequently, the SHAP values reported in this study represent the statistical contribution of each factor to model predictions and should not be interpreted as independent cause-and-effect relationships.
Recent advances further emphasize the value of combining hydrological knowledge with artificial intelligence. Mohammadi et al. [59] demonstrated that integrating lumped hydrological models with AI-based approaches can improve rainfall–runoff prediction and model performance. In a similar direction, the present study combines GIS-based flood-conditioning factors with machine-learning models and SHAP interpretation to improve both predictive capability and model transparency. This provides a clearer understanding of the factors controlling flood susceptibility and supports more informed flood-risk planning and management.
The findings of this work have important practical implications for flood-risk planning and management in Wadi Numan, particularly in identifying flood-prone areas and supporting the prioritization of mitigation measures. The developed flood susceptibility maps can assist local authorities and decision-makers in guiding land-use planning, infrastructure development, and flood mitigation strategies. However, effective flood-risk management requires not only reliable susceptibility assessments but also stakeholder participation and coordinated decision-making. In this context, Yilmaz [60] proposed a fuzzy multi-stakeholder framework that integrates stakeholder perspectives and institutional priorities to support sustainable flood-risk management. The study emphasized the importance of understanding stakeholder influence and balancing environmental, social, economic, and climate adaptation objectives. Accordingly, the flood susceptibility maps developed in the present study could provide valuable spatial information to support stakeholder discussions, resource allocation, and the development of coordinated flood mitigation strategies. Integrating these spatial assessments with participatory decision-making frameworks could further enhance the practical application of the findings and contribute to sustainable flood-risk management in Wadi Numan and other arid regions.
5. Conclusions
This work established a machine learning framework to evaluate the spatial susceptibility to flooding in Wadi Numan, Saudi Arabia. Eight hydro-environmental and terrain-related variables were incorporated into the analysis: surface elevation (SE), slope, Topographic Wetness Index (TWI), Curve Number (CN), drainage density (DD), Normalized Difference Vegetation Index (NDVI), rainfall depth (RD), and Terrain Ruggedness Index (TRI). A total of 42 classification models available in the MATLAB Classification Learner application were evaluated and compared, in addition to ANN Pattern Recognition models, to identify the most suitable approach for flood susceptibility mapping.
Among all evaluated models, Logistic Regression achieved the best overall performance, with an accuracy of 79.05%, sensitivity of 79.61%, precision of 78.10%, specificity of 78.51%, and an F1-score of 78.85%. The model also produced one of the highest AUC values, demonstrating reliable discrimination between flood-prone and non-flood-prone areas. Although Linear SVM, Cosine KNN, Medium Gaussian SVM, and ANN Pattern Recognition models produced comparable results, Logistic Regression provided the most balanced and consistent predictive performance.
To interpret the model predictions, SHAP analysis was applied to Logistic Regression, which showed the strongest predictive performance among the tested classifiers. This analysis was used to quantify the contribution of each flood-conditioning variable to the model output. The results showed that Surface Elevation (SE) was the most influential factor (27.46%), followed by TWI (21.52%), Drainage Density (15.23%), Curve Number (11.25%), Rainfall Depth (10.19%), TRI (7.58%), NDVI (5.25%), and Slope (1.52%). These findings highlight the important role of topographic and hydrological factors in controlling flood susceptibility within the study area. Spatial analysis of the final susceptibility map showed that the High and Very High classes together cover approximately 128.81 km2 (19.07%) of the Wadi Numan watershed. The High susceptibility class accounts for 123.78 km2 (18.32%), while the Very High class covers 5.03 km2 (0.74%). The Moderate class occupies 252.21 km2 (37.34%), whereas the Low class represents the largest portion of the watershed, covering 289.57 km2 (42.87%). Only 4.91 km2 (0.73%) is classified as Very Low susceptibility. These results show that although most of the watershed falls within Low to Moderate susceptibility, specific high-susceptibility zones remain important and should receive greater attention in flood mitigation, land-use planning, and watershed management.
The findings demonstrated that Logistic Regression, Linear SVM, Cosine KNN, and Medium Gaussian SVM provided comparable predictive performance in flood susceptibility assessment. Although Logistic Regression demonstrated strong performance in the independent validation assessment, repeated stratified cross-validation revealed no consistently superior model. Medium Gaussian SVM achieved the highest mean accuracy and sensitivity, whereas Logistic Regression showed the highest mean specificity. These results highlight the importance of evaluating multiple performance metrics and using repeated cross-validation to assess model reliability rather than selecting a preferred model based on a single evaluation.
These results provide valuable information for flood risk management, infrastructure planning, and sustainable watershed development in Wadi Numan. The flood susceptibility map can assist decision-makers in identifying priority areas for mitigation measures such as stormwater drainage improvements, retention and detention facilities, protection of natural drainage corridors, and land-use planning restrictions in high-risk zones. The proposed methodology offers a practical and transferable framework that can be applied to other arid and semi-arid watersheds facing similar flood challenges.
Flood occurrence is influenced by the complex interactions of multiple hydrological, geomorphological, and environmental factors rather than by any single factor. Therefore, the flood susceptibility assessment presented in this study is not intended to replace conventional hydrological and hydraulic models but rather to complement them by providing additional insights into the spatial distribution of flood-prone areas and the factors contributing to flood susceptibility. Such complementary approaches are particularly valuable when changes in watershed characteristics and flood-generating processes necessitate the reassessment or refinement of traditional hydrological models [61].
One limitation of this study concerns the temporal consistency and spatial resolution of the input datasets. Differences in the acquisition periods of vegetation (NDVI), runoff curve number (CN), and historical flood inventory data may introduce uncertainty into the susceptibility assessment due to changes in vegetation cover, land use, and runoff conditions over time. Furthermore, variations in spatial resolution may affect the representation of local hydrological and topographic characteristics and the resulting flood susceptibility patterns. Future studies should consider temporally consistent and higher-resolution datasets to improve mapping accuracy and reliability.
Author Contributions
Conceptualization, A.E.M.A.-J.; methodology, A.E.M.A.-J.; software, A.E.M.A.-J.; validation, A.E.M.A.-J. and O.T.; formal analysis, A.E.M.A.-J.; investigation, A.E.M.A.-J. and O.T.; resources, A.E.M.A.-J.; data curation, A.E.M.A.-J.; writing—original draft preparation, A.E.M.A.-J.; writing—review and editing, A.E.M.A.-J.; visualization, A.E.M.A.-J.; supervision, A.E.M.A.-J.; project administration, A.E.M.A.-J.; funding acquisition, A.E.M.A.-J. All authors have read and agreed to the published version of the manuscript.
Funding
The authors gratefully acknowledge the Deanship of Scientific Research (DSR) at King Abdulaziz University, Jeddah, Saudi Arabia, for funding this project under grant No. (IPP: 655-135-2026) and for providing technical support.
Data Availability Statement
The data supporting the findings of this study are available from the corresponding author upon reasonable request.
Acknowledgments
The authors acknowledge the technical support provided by King Abdulaziz University, Jeddah, Saudi Arabia.
Conflicts of Interest
The authors declare no conflict of interest.
References
- Khosravi, K.; Shahabi, H.; Pham, B.T.; Adamowski, J.; Shirzadi, A.; Pradhan, B.; Dou, J.; Ly, H.B.; Gróf, G.; Ho, H.L.; et al. A comparative assessment of flood susceptibility modeling using multi-criteria decision-making analysis and machine learning methods. J. Hydrol. 2019, 573, 311–323. [Google Scholar] [CrossRef] [Scilit]
- Daud, S.; Ullah, M.; Rehman, A.; Saba, T.; Damaševičius, R.; Sattar, A. Topic classification of online news articles using optimized machine learning models. Computers 2023, 12, 16. [Google Scholar] [CrossRef] [Scilit]
- Al-Juaidi, A.E.M.; Taylan, O.; Toros, H. A comparative evaluation of machine learning classification models utilizing GIS and key flood-causing factors for enhancing flood vulnerability assessment. Environ. Dev. Sustain. 2025, 1–31. [Google Scholar] [CrossRef] [Scilit]
- Abdelkarim, A.; Gaber, A.F.D. Flood risk assessment of the Wadi Nu’man Basin, Mecca, Saudi Arabia (during the period, 1988–2019) based on the integration of geomatics and hydraulic modeling: A case study. Water 2019, 11, 1887. [Google Scholar] [CrossRef] [Scilit]
- Alsharif, O.H.; Al-Juaidi, A.E.M.; Elmanadely, M.S. A GIS–MCDM framework for soil erosion risk prioritization in arid watersheds: Evidence from Wadi Numan, Saudi Arabia. Land 2026, 15, 1157. [Google Scholar] [CrossRef] [Scilit]
- Kotsiantis, S.B.; Zaharakis, I.; Pintelas, P. Supervised machine learning: A review of classification techniques. Emerg. Artif. Intell. Appl. Comput. Eng. 2007, 160, 3–24. [Google Scholar]
- Sharma, S.V.; Budhbhatti, R.; Srinivasulu, J.; Rao, K.H.V.; Singh, A.; Anand, V. Flood risk assessment of Bihar State in India utilizing a combination of multi-criteria analysis (MCA) and analytical hierarchy process (AHP) using geospatial techniques. J. Indian Soc. Remote Sens. 2024, 53, 1457–1478. [Google Scholar] [CrossRef] [Scilit]
- Talukdar, S.; Singha, P.; Mahato, S.; Shahfahad, N.; Pal, S.; Liou, Y.; Rahman, A. Land-use land-cover classification by machine learning classifiers for satellite observations—A review. Remote Sens. 2020, 12, 1135. [Google Scholar] [CrossRef] [Scilit]
- Khan, N.S.; Roy, S.K.; Talukdar, S.; Billah, M.; Iqbal, A.; Zaman, R.U.; Chowdhury, A.; Mahtab, S.B.; Mallick, J. Empowering real-time flood impact assessment through the integration of machine learning and Google Earth Engine: A comprehensive approach. Environ. Sci. Pollut. Res. 2024, 31, 53877–53892. [Google Scholar] [CrossRef] [Scilit] [PubMed]
- Tehrany, M.; Jones, S.; Shabani, F. Identifying the essential flood conditioning factors for flood prone area mapping using machine learning techniques. Catena 2019, 175, 174–192. [Google Scholar] [CrossRef] [Scilit]
- Islam, T.; Zeleke, E.B.; Afroz, M.; Melesse, A.M. A systematic review of urban flood susceptibility mapping: Remote sensing, machine learning, and other modeling approaches. Remote Sens. 2025, 17, 524. [Google Scholar] [CrossRef] [Scilit]
- Dano, U.L. Flash flood impact assessment in Jeddah City: An analytic hierarchy process approach. Hydrology 2020, 7, 10. [Google Scholar] [CrossRef] [Scilit]
- Ighile, E.H.; Shirakawa, H.; Tanikawa, H. Application of GIS and machine learning to predict flood areas in Nigeria. Sustainability 2022, 14, 5039. [Google Scholar] [CrossRef] [Scilit]
- Al-Juaidi, A.E.M. The interaction of topographic slope with various geo-environmental flood-causing factors on flood prediction and susceptibility mapping. Environ. Sci. Pollut. Res. 2023, 30, 59327–59348. [Google Scholar] [CrossRef] [Scilit] [PubMed]
- Khiavi, A.N.; Vafakhah, M. Using algorithmic game theory to improve supervised machine learning: A novel applicability approach in flood susceptibility mapping. Environ. Sci. Pollut. Res. 2024, 31, 52740–52757. [Google Scholar] [CrossRef] [Scilit] [PubMed]
- Al-Juaidi, A.E.M. Enhancing flood vulnerability mapping in eastern Jeddah watersheds through advanced multicriteria decision analysis and sensitivity assessment. Environ. Dev. Sustain. 2025, 1–28. [Google Scholar] [CrossRef] [Scilit]
- Lundberg, S.M.; Lee, S.-I. A unified approach to interpreting model predictions. Adv. Neural Inf. Process. Syst. 2017, 30, 4765–4774. [Google Scholar]
- Mishra, M.; Guria, R.; da Silva, R.M.; Sethi, S.; Mishra, M.; Almazroui, M.; Chakrabortty, R.; Santos, C.A.G. Integrating machine learning and geospatial analysis for flood hazard, vulnerability, and risk assessment in Odisha, India. Water Resour. Manag. 2026, 40, 348. [Google Scholar] [CrossRef] [Scilit]
- Kia, M.B.; Pirasteh, S.; Pradhan, B.; Mahmud, A.R.; Sulaiman, W.N.A.; Moradi, A. An artificial neural network model for flood simulation using GIS: Johor River Basin, Malaysia. Environ. Earth Sci. 2012, 67, 251–264. [Google Scholar] [CrossRef] [Scilit]
- Tsai, C.-C.; Lu, M.-C.; Wei, C.-C. Decision tree-based classifier combined with neural-based predictor for water-stage forecasts in a river basin during typhoons: A case study in Taiwan. Environ. Eng. Sci. 2012, 29, 108–116. [Google Scholar] [CrossRef] [Scilit] [PubMed]
- Bentéjac, C.; Csörgő, A.; Martínez-Muñoz, G. A comparative analysis of gradient boosting algorithms. Artif. Intell. Rev. 2021, 54, 1937–1967. [Google Scholar] [CrossRef] [Scilit]
- Inyang, U.G.; Akpan, E.E.; Akinyokun, O.C. A hybrid machine learning approach for flood risk assessment and classification. Int. J. Comput. Intell. Appl. 2020, 19, 2050012. [Google Scholar] [CrossRef] [Scilit]
- Abu El-Magd, S.A.; Maged, A.; Farhat, H.I. Hybrid-based Bayesian algorithm and hydrologic indices for flash flood vulnerability assessment in coastal regions: Machine learning, risk prediction, and environmental impact. Environ. Sci. Pollut. Res. 2022, 29, 57345–57356. [Google Scholar] [CrossRef] [Scilit] [PubMed]
- Gholami, V.; Sahour, H.; Khaleghi, M.R.; Yousefi, A. Evaluating the effects of vegetation and land management on runoff control using field plots and machine learning models. Environ. Sci. Pollut. Res. 2023, 30, 31202–31217. [Google Scholar] [CrossRef] [Scilit] [PubMed]
- Ghanim, A.A.J.; Shaf, A.; Ali, T.; Zafar, M.; Al-Areeq, A.M.; Alyami, S.H.; Irfan, M.; Rahman, S. An improved flood susceptibility assessment in Jeddah, Saudi Arabia, using advanced machine learning techniques. Water 2023, 15, 2511. [Google Scholar] [CrossRef] [Scilit]
- Singha, C.; Rana, V.K.; Pham, Q.B.; Nguyen, D.C.; Łupikasza, E. Integrating machine learning and geospatial data analysis for comprehensive flood hazard assessment. Environ. Sci. Pollut. Res. 2024, 31, 48497–48522. [Google Scholar] [CrossRef] [Scilit] [PubMed]
- Nguyen, H.D.; Nguyen, Q.; Bui, Q. Solving the spatial extrapolation problem in flood susceptibility using hybrid machine learning, remote sensing, and GIS. Environ. Sci. Pollut. Res. 2024, 31, 18701–18722. [Google Scholar] [CrossRef] [Scilit] [PubMed]
- Al-Areeq, A.; Abba, S.; Yassin, M.; Benaafi, M.; Ghaleb, M.; Aljundi, I. Computational machine learning approach for flood susceptibility assessment integrated with remote sensing and GIS techniques from Jeddah, Saudi Arabia. Remote Sens. 2022, 14, 5515. [Google Scholar] [CrossRef] [Scilit]
- Liuzzo, L.; Sammartano, V.; Freni, G. Comparison between different distributed methods for flood susceptibility mapping. Water Resour. Manag. 2019, 33, 3155–3173. [Google Scholar] [CrossRef] [Scilit]
- Al-Juaidi, A.; Emam, A. Flood vulnerability assessment of Wadi Numan, Makkah: Insights from advanced multicriteria decision analysis and fuzzy logic techniques. J. Hydrol. Eng. 2026, 31, 04026004. [Google Scholar] [CrossRef] [Scilit]
- Beven, K.J.; Kirkby, M.J. A physically based, variable contributing area model of basin hydrology. Hydrol. Sci. Bull. 1979, 24, 43–69. [Google Scholar] [CrossRef] [Scilit]
- Jaafar, H.H.; Ahmad, F.A.; El Beyrouthy, N. GCN250, new global gridded curve numbers for hydrologic modeling and design. Sci. Data 2019, 6, 145. [Google Scholar] [CrossRef] [Scilit] [PubMed]
- Al-Juaidi, A.E.M. A simplified GIS-based SCS-CN method for the assessment of land-use change on runoff. Arab. J. Geosci. 2018, 11, 269. [Google Scholar] [CrossRef] [Scilit]
- Al-Juaidi, A.E.M.; Aliewi, A.S. Assessing SCS-CN and its revised models for Wadi runoff estimation in data-scarce Kuwait catchments. Arab. J. Geosci. 2026, 19, 19. [Google Scholar] [CrossRef] [Scilit]
- Riley, S.J.; DeGloria, S.D.; Elliot, R. A terrain ruggedness index that quantifies topographic heterogeneity. Intermt. J. Sci. 1999, 5, 23–27. [Google Scholar]
- Różycka, M.; Migoń, P.; Michniewicz, A. Topographic Wetness Index and Terrain Ruggedness Index in geomorphic characterisation of landslide terrains, on examples from the Sudetes, SW Poland. Z. Geomorphol. Suppl. Issues 2017, 61, 61–80. [Google Scholar] [CrossRef] [Scilit]
- Rouse, J.W.; Haas, R.H.; Schell, J.A.; Deering, D.W. Monitoring vegetation systems in the Great Plains with ERTS. In Proceedings of the Third Earth Resources Technology Satellite-1 Symposium, Washington, DC, USA, 10–14 December 1973; NASA SP-351; NASA: Washington, DC, USA, 1973; pp. 309–317. [Google Scholar]
- Khosravi, K.; Pham, B.T.; Chapi, K.; Shirzadi, A.; Shahabi, H.; Revhaug, I.; Prakash, I.; Tien Bui, D. A comparative assessment of decision trees algorithms for flash flood susceptibility modeling at Haraz watershed, Northern Iran. Sci. Total Environ. 2018, 627, 744–755. [Google Scholar] [CrossRef] [Scilit] [PubMed]
- MathWorks. Classification Learner App; MATLAB Documentation; The MathWorks, Inc.: Natick, MA, USA, 2024. [Google Scholar]
- Hosmer, D.W.; Lemeshow, S.; Sturdivant, R.X. Applied Logistic Regression, 3rd ed.; Wiley: Hoboken, NJ, USA, 2013. [Google Scholar]
- Hastie, T.; Tibshirani, R.; Friedman, J. The Elements of Statistical Learning: Data Mining, Inference, and Prediction, 2nd ed.; Springer: New York, NY, USA, 2009. [Google Scholar]
- Asante-Okyere, S.; Shen, C.; Osei, H. Enhanced machine learning tree classifiers for lithology identification using Bayesian optimization. Appl. Comput. Geosci. 2022, 16, 100100. [Google Scholar] [CrossRef] [Scilit]
- Mishra, M.; Guria, R.; Baraj, B.; Nanda, A.P.; Santos, C.A.G.; Silva, R.M.; Laksono, F.A.T. Spatial analysis and machine learning prediction of forest fire susceptibility: A comprehensive approach for effective management and mitigation. Sci. Total Environ. 2024, 926, 171713. [Google Scholar] [CrossRef] [Scilit] [PubMed]
- Agresti, A. An Introduction to Categorical Data Analysis, 3rd ed.; Wiley: Hoboken, NJ, USA, 2018. [Google Scholar]
- Cortes, C.; Vapnik, V. Support-vector networks. Mach. Learn. 1995, 20, 273–297. [Google Scholar] [CrossRef] [Scilit]
- Hearst, M.A.; Dumais, S.T.; Osuna, E.; Platt, J.; Schölkopf, B. Support vector machines. IEEE Intell. Syst. Appl. 1998, 13, 18–28. [Google Scholar] [CrossRef] [Scilit]
- Long, G.; Tantanee, S.; Nusit, K.; Sooraksa, P. Flood susceptibility mapping in the Yom River Basin, Thailand: Stacking ensemble learning using multi-year flood inventory data. Geocarto Int. 2025, 40, 2461531. [Google Scholar] [CrossRef] [Scilit]
- Al-Juaidi, A. Integrating hydrological, physical, and chemical factors for soil moisture prediction using advanced machine learning models. J. Hydrol. Eng. 2026, 31, 04026025. [Google Scholar] [CrossRef] [Scilit]
- Schölkopf, B.; Burges, C.J.C.; Smola, A.J. Advances in Kernel Methods: Support Vector Learning; MIT Press: Cambridge, MA, USA, 1999. [Google Scholar]
- Joachims, T. Making large-scale SVM learning practical. In Advances in Kernel Methods—Support Vector Learning; Schölkopf, B., Burges, C.J.C., Smola, A.J., Eds.; MIT Press: Cambridge, MA, USA, 1999; pp. 169–184. [Google Scholar]
- Cover, T.; Hart, P. Nearest neighbor pattern classification. IEEE Trans. Inf. Theory 1967, 13, 21–27. [Google Scholar] [CrossRef] [Scilit]
- Altman, N.S. An introduction to kernel and nearest-neighbor nonparametric regression. Am. Stat. 1992, 46, 175–185. [Google Scholar] [CrossRef] [Scilit]
- Haykin, S. Neural Networks and Learning Machines, 3rd ed.; Pearson: Upper Saddle River, NJ, USA, 2009. [Google Scholar]
- Ueyama, H.; Kato, Y.; Akazawa, Y.; Yatagai, N.; Komori, H.; Takeda, T.; Matsumoto, K.; Ueda, K.; Matsumoto, K.; Hojo, M.; et al. Application of artificial intelligence using a convolutional neural network for diagnosis of early gastric cancer based on magnifying endoscopy with narrow-band imaging. J. Gastroenterol. Hepatol. 2021, 36, 482–489. [Google Scholar] [CrossRef] [Scilit] [PubMed]
- Keshtegar, B.; Gholampour, A.; Thai, D.; Taylan, O.; Trung, N. Hybrid regression and machine learning model for predicting ultimate condition of FRP-confined concrete. Compos. Struct. 2021, 262, 113644. [Google Scholar] [CrossRef] [Scilit]
- Alamoudi, M.; Taylan, O.; Keshtegar, B.; Abusurrah, M.; Balubaid, M. Modeling sulphur dioxide (SO2) quality levels of Jeddah City using machine learning approaches with meteorological and chemical factors. Sustainability 2022, 14, 16291. [Google Scholar] [CrossRef] [Scilit]
- Lee, H.; Kim, Y.; Yang, S.Y.; Choi, H. Improved weight initialization for deep and narrow feedforward neural network. Neural Netw. 2024, 176, 106362. [Google Scholar] [CrossRef] [Scilit] [PubMed]
- Chen, H.; Covert, I.C.; Lundberg, S.M.; Lee, S.-I. Algorithms to estimate Shapley value feature attributions. Nat. Mach. Intell. 2023, 5, 590–601. [Google Scholar] [CrossRef] [Scilit]
- Mohammadi, B.; Safari, M.J.S.; Vaheddoost, B.; Yilmaz, M.U. A multi-step strategy for enhancing the rainfall-runoff modeling: Combination of lumped and artificial intelligence-based hydrological models. Environ. Dev. Sustain. 2025, 1–27. [Google Scholar] [CrossRef] [Scilit]
- Yilmaz, M.U. Enhancing Sustainable Flood Risk Management Through a Novel Fuzzy Multi-Stakeholder Framework. Water Resour. Manag. 2025, 39, 1453–1480. [Google Scholar] [CrossRef] [Scilit]
- Drobot, R.; Ilinca, C. A stochastic approach to flood wave propagation on the Crisul Alb River. In Transboundary Floods: Reducing Risks Through Flood Management; Marsalek, J., Stancalie, G., Balint, G., Eds.; NATO Science Series IV: Earth and Environmental Sciences; Springer: Dordrecht, The Netherlands, 2006; Volume 72. [Google Scholar] [CrossRef] [Scilit]

Disclaimer/Publisher’s Note: The statements, opinions and data contained in all publications are solely those of the individual author(s) and contributor(s) and not of MDPI and/or the editor(s). MDPI and/or the editor(s) disclaim responsibility for any injury to people or property resulting from any ideas, methods, instructions or products referred to in the content. |
© 2026 by the authors. Licensee MDPI, Basel, Switzerland. This article is an open access article distributed under the terms and conditions of the Creative Commons Attribution (CC BY) license.