


Abstract
Minimum quantity lubrication (MQL) is a sustainable alternative to flood cooling, but its parameters must be optimized for several responses that behave differently. This study investigated the effects of cutting speed (V), feed rate (f), MQL flow rate (Q), and air pressure (p) on surface roughness (Ra), cutting-zone temperature (T), and tool wear depth after 45 min of machining (WD) in CNC turning of SAE 1215 MS, using a Taguchi L9 array with Grey Relational Analysis. Feed rate was the dominant factor for Ra (46.66%) and T (69.17%), whereas Q and p jointly accounted for 93.76% of the variation in WD (indicative, given two error degrees of freedom). The two-response optimum (Ra + T) was V1f1Q1p1; including WD shifted it to V1f1Q2p2 (31.4 m/min, 0.03 mm/rev, 70 mL/h, 5 bar). A single confirmation run yielded a Grey Relational Grade of 0.8286, 15.39% higher than the best L9 run, with WD 46.8% lower and Ra 14.7% higher. The preferred f and Q were unchanged across eight weighting schemes, whereas V and p depended on the weights, and V also on the wear metric. Including tool wear changes the recommended MQL conditions, although this optimum has the lowest material removal rate tested.
1. Introduction
Surface quality is a critical criterion in precision machining, as it directly influences the fatigue life, wear resistance, and functional performance of manufactured components [1,2,3]. These properties are particularly important in the high-volume production of precision shafts and fasteners from free-machining steels, such as SAE 1215 MS, on automatic lathes. Achieving high surface quality in computer numerical control (CNC) turning is closely associated with thermal management. Built-up edges (BUE), which form when workpiece material adheres to the tool, occur primarily at low cutting speeds and disappear once a threshold cutting speed is exceeded [4]. Conversely, excessive temperatures in the cutting zone accelerate tool wear [5]. Thermal control should therefore be evaluated in conjunction with surface generation and tool wear. However, systematic investigations examining the combined effects of cutting parameters and lubrication delivery conditions on the overall machinability of SAE 1215 MS are limited.
To address these thermomechanical challenges sustainably, minimum quantity lubrication (MQL) has emerged as a prominent alternative to conventional flood cooling [6,7,8]. By atomizing a minute volume of lubricant with compressed air, MQL can reduce friction at the tool–chip and tool–workpiece interfaces and the environmental impact of cutting fluids [9,10]. Although conventional kinematic variables (cutting speed and feed rate) are traditionally prioritized in machining optimization, the MQL delivery parameters—specifically flow rate and air pressure—determine how much lubricant reaches the cutting zone, and cutting-fluid conditions have been shown to affect surface roughness and tool wear [11]. Recent multi-response studies indicate that these fluid delivery conditions influence both surface roughness and tool wear behavior [12,13], which supports treating them as process variables in their own right rather than as auxiliary settings.
Optimizing this complex parameter space is inherently a multi-objective challenge. The Taguchi method, combined with Grey Relational Analysis (GRA), provides an efficient experimental framework for converting multiple competing responses into a single Grey Relational Grade (GRG) [14,15] (hereafter, the combined method is termed Taguchi–GRA). This composite framework has been applied to MQL turning and milling of various engineering alloys [12,13,16,17], and Taguchi signal-to-noise (S/N) optimization alone has been used for hard turning under MQL [18]. Beyond MQL, Taguchi-based optimizations have elucidated the impact of high-pressure coolants on thermal metrics [19], while minimum quantity cooling lubrication (MQCL) with an extreme-pressure/anti-wear (EP/AW) additive reduced tool wear by 20–51% compared with dry turning of AISI 1045 steel [20]. Further studies by Sarıkaya and Güllü [21] and Fratila and Caizar [22] reported using Taguchi-based methods to screen cutting and lubrication parameters in both turning and milling operations. The review by Abellán-Nebot et al. [23] categorizes the factors influencing surface roughness as operational factors (cutting parameters and cooling/lubrication conditions) and processing factors (such as tool wear and built-up edge). Because several of these factors must be considered simultaneously, multi-response optimization frameworks such as Taguchi–GRA are useful tools in sustainable manufacturing research.
Beyond lubricant-delivery strategies, sustainable machining can also be pursued through the surface engineering of cutting tools. Texturing micro- and nanoscale geometries on the rake and flank faces of cutting tools increases the entry and retention of cutting fluid in the contact zones [24], and textured tools have been developed to extend tool life to levels comparable to those achieved with cutting fluids [25,26]. Micro-grooved tools filled with carbon nanotubes (CNTs), which combine high thermal conductivity with friction-reducing capacity, have demonstrated reductions in friction, temperature, and cutting forces, as well as increased tool life, during the turning of AISI 1045 steel [25]. In dry turning of the same steel, the best-performing CNT-filled condition increased tool life by up to 77% relative to a conventional dry tool and outperformed the use of cutting fluid, with friction and temperature reductions reaching 21% and 30%, respectively [26]. Citing earlier work, Ribeiro et al. [25] also note that textured surfaces can act as micro-pools that retain lubricant at the tool–chip interface; thus, combining textured tools with MQL may further reduce cutting-fluid consumption. This combination was not investigated in the present work, which uses a conventional (untextured) cermet insert coated by physical vapor deposition (PVD) and focuses on MQL delivery parameters.
In a preliminary investigation, the present authors identified feed rate as the principal determinant of surface roughness during the CNC turning of SAE 1215 MS under various cooling regimes [1]. Building upon those findings, the present research fixes MQL as the baseline lubrication strategy and introduces MQL flow rate and air pressure as primary control factors. In addition, this study expands the evaluation criteria beyond the conventional surface roughness and cutting-zone temperature pair to incorporate the tool wear depth after 45 min of machining. Taguchi–GRA studies typically report a single optimum for a specified set of responses. However, a condition that produces the best surface finish and the lowest temperature may nevertheless increase tool wear; consequently, an optimum identified for one response set may not be appropriate for another. The central issue addressed here is therefore how the inclusion of tool wear affects the recommended MQL parameters.
Accordingly, the specific objectives of this study are (1) to quantify the individual effects of cutting kinematics and MQL delivery parameters on Ra, T, and WD; (2) to determine their relative contributions by S/N ratio analysis and analysis of variance (ANOVA); (3) to perform a conventional two-response GRA (Ra and T); (4) to perform a three-response GRA that includes tool wear (WD); (5) to compare the resulting optima to reveal the impact of objective selection; (6) to check the three-response optimum by a confirmation experiment; and (7) to assess the sensitivity of the optimum to the GRA weighting scheme and to the definition of the wear response. The principal methodological contribution of this research is to illustrate the response-set dependence of Taguchi–GRA optimization for practical MQL machining operations.
2. Materials and Methods
2.1. Workpiece Material
The workpiece material was SAE 1215 MS low-carbon, free-machining steel, supplied in the form of cylindrical bars with a diameter of 12 mm and an initial hardness of 167 HB. Its nominal chemical composition is C ≤ 0.09 wt.%, Mn 0.75–1.05 wt.%, P 0.04–0.09 wt.%, S 0.26–0.35 wt.%, with Fe comprising the balance. Table 1 summarizes its principal mechanical properties (cold-drawn condition) and thermal properties [27].
Table 1.
Mechanical and thermal properties of SAE 1215 MS steel (mechanical properties in the cold-drawn condition) [27].
2.2. Machine Tool and MQL System
All experiments were conducted on a Tsugami BO12 CNC automatic lathe, which has a 2.2 kW spindle motor, a total system power of 7 kW, and a maximum spindle speed of 10,000 rpm. The same machine was used in the authors’ previous study of SAE 1215 MS [1].
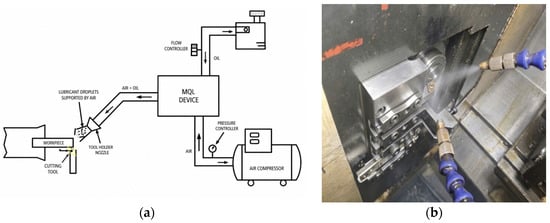
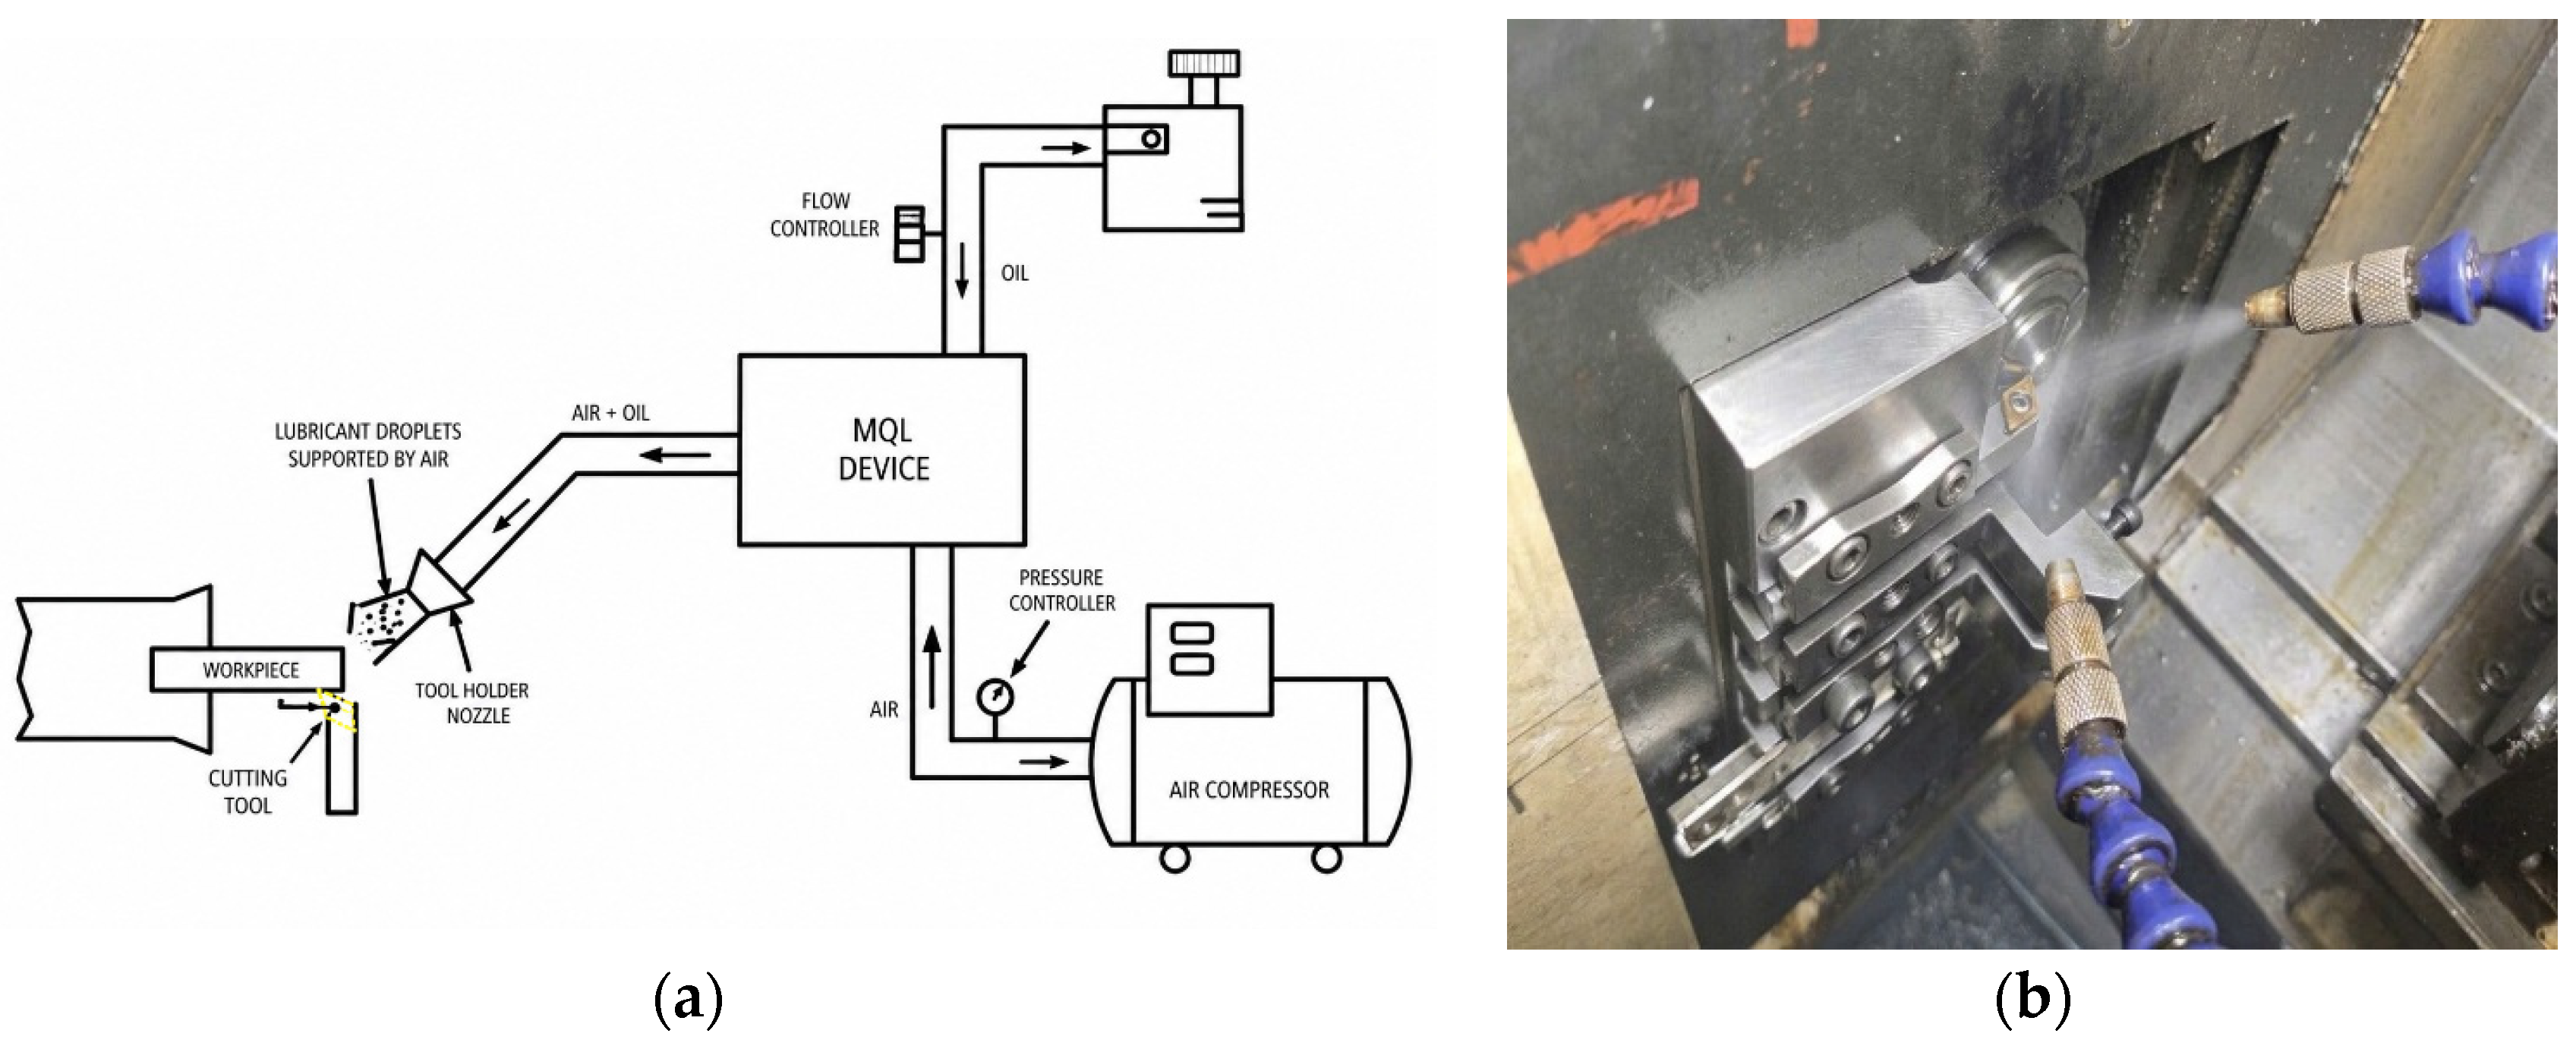
An external MQL system (see Figure 1) delivered a controlled aerosol mist directly toward the cutting zone. The MQL flow rate and the air pressure could be adjusted independently. A semi-synthetic lubricant based on palm oil, with ISO VG 32 viscosity, was employed. The lubricant has a kinematic viscosity of 32 mm2/s at 40 °C and a flash point of 220 °C. It was supplied via a single nozzle positioned at approximately 45° relative to the cutting zone and maintained at a stand-off distance of roughly 30 mm. Machining was performed using the lathe’s automatic bar-feeding function. Each workpiece was turned over an effective length of approximately 30 mm and then severed using a separate cut-off tool. The bar was subsequently advanced, and the cycle was repeated continuously. Each test lasted approximately 45 min.
Figure 1.
Experimental setup: (a) schematic of the external MQL system; arrows indicate the flow direction of the lubricant (oil), compressed air, and air–oil mixture; (b) photograph of the Tsugami BO12 CNC automatic lathe working area showing the cutting tool and the MQL nozzle.
2.3. Cutting Tool
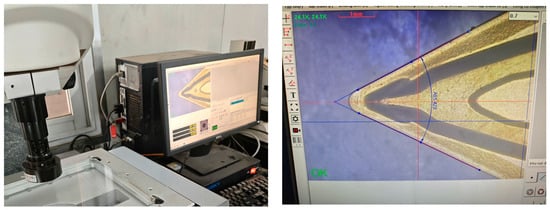
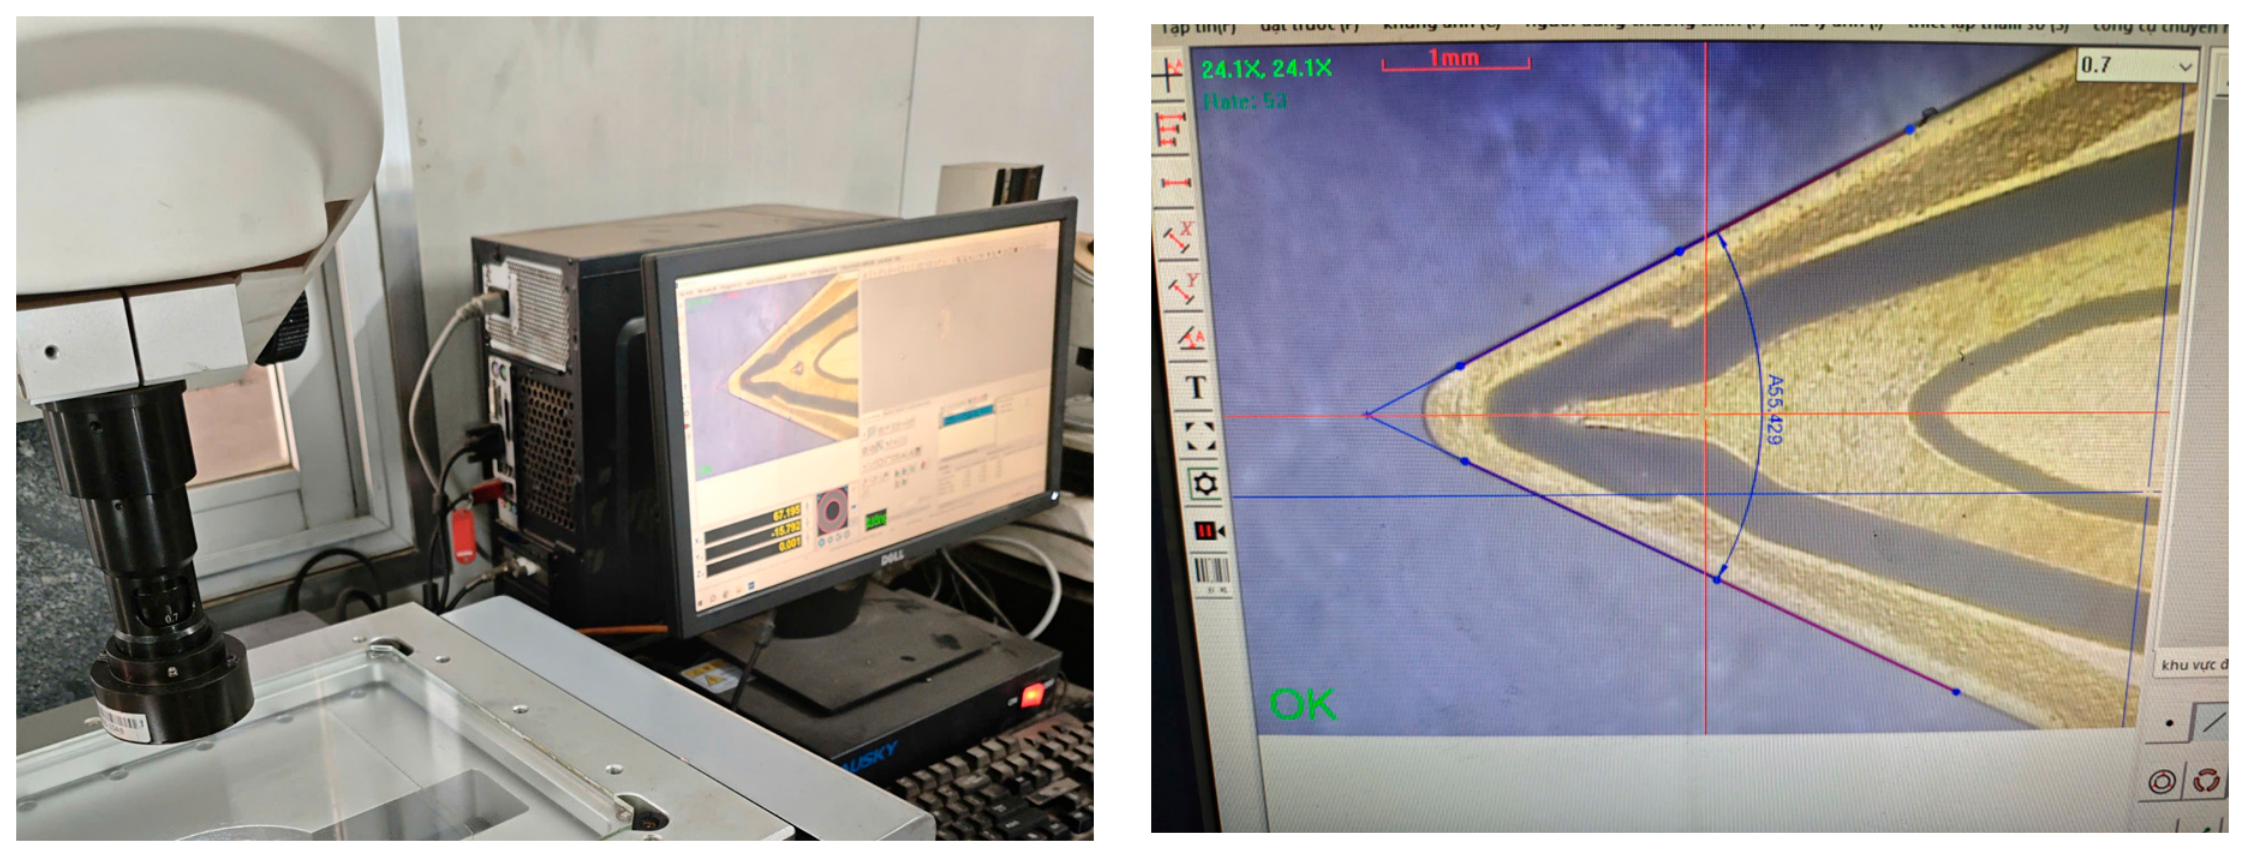
A Kyocera DCMT11T304PP indexable insert (Kyocera Corporation, Kyoto, Japan; 55° rhombic shape, 7° clearance angle, and 0.4 mm nose radius), grade PV730, was used (see Figure 2). The insert is a PVD-coated cermet with a TiAlN/TiN coating, according to the supplier’s specification. The same insert geometry and grade were used throughout the experimental program to avoid variations related to tool geometry and coating.
Figure 2.
Kyocera DCMT11T304PP insert (grade PV730, PVD-coated cermet) used for turning SAE 1215 MS.
In each experimental condition, the same cutting edge was used throughout the 45 min test (Section 2.2), so that the wear measured at the end of the test reflects the wear accumulated under that condition. The cut-off tool was not used for wear measurements.
The turning insert was replaced before each new experimental condition so that accumulated wear was not carried over from one L9 run to the next. The insert replacement criterion during normal operation was an average flank-wear width VB of 0.3 mm (ISO 3685 [28]).
2.4. Measurement Procedures
2.4.1. Surface Roughness
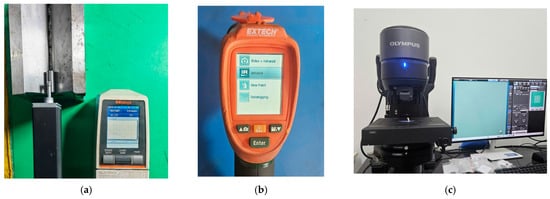
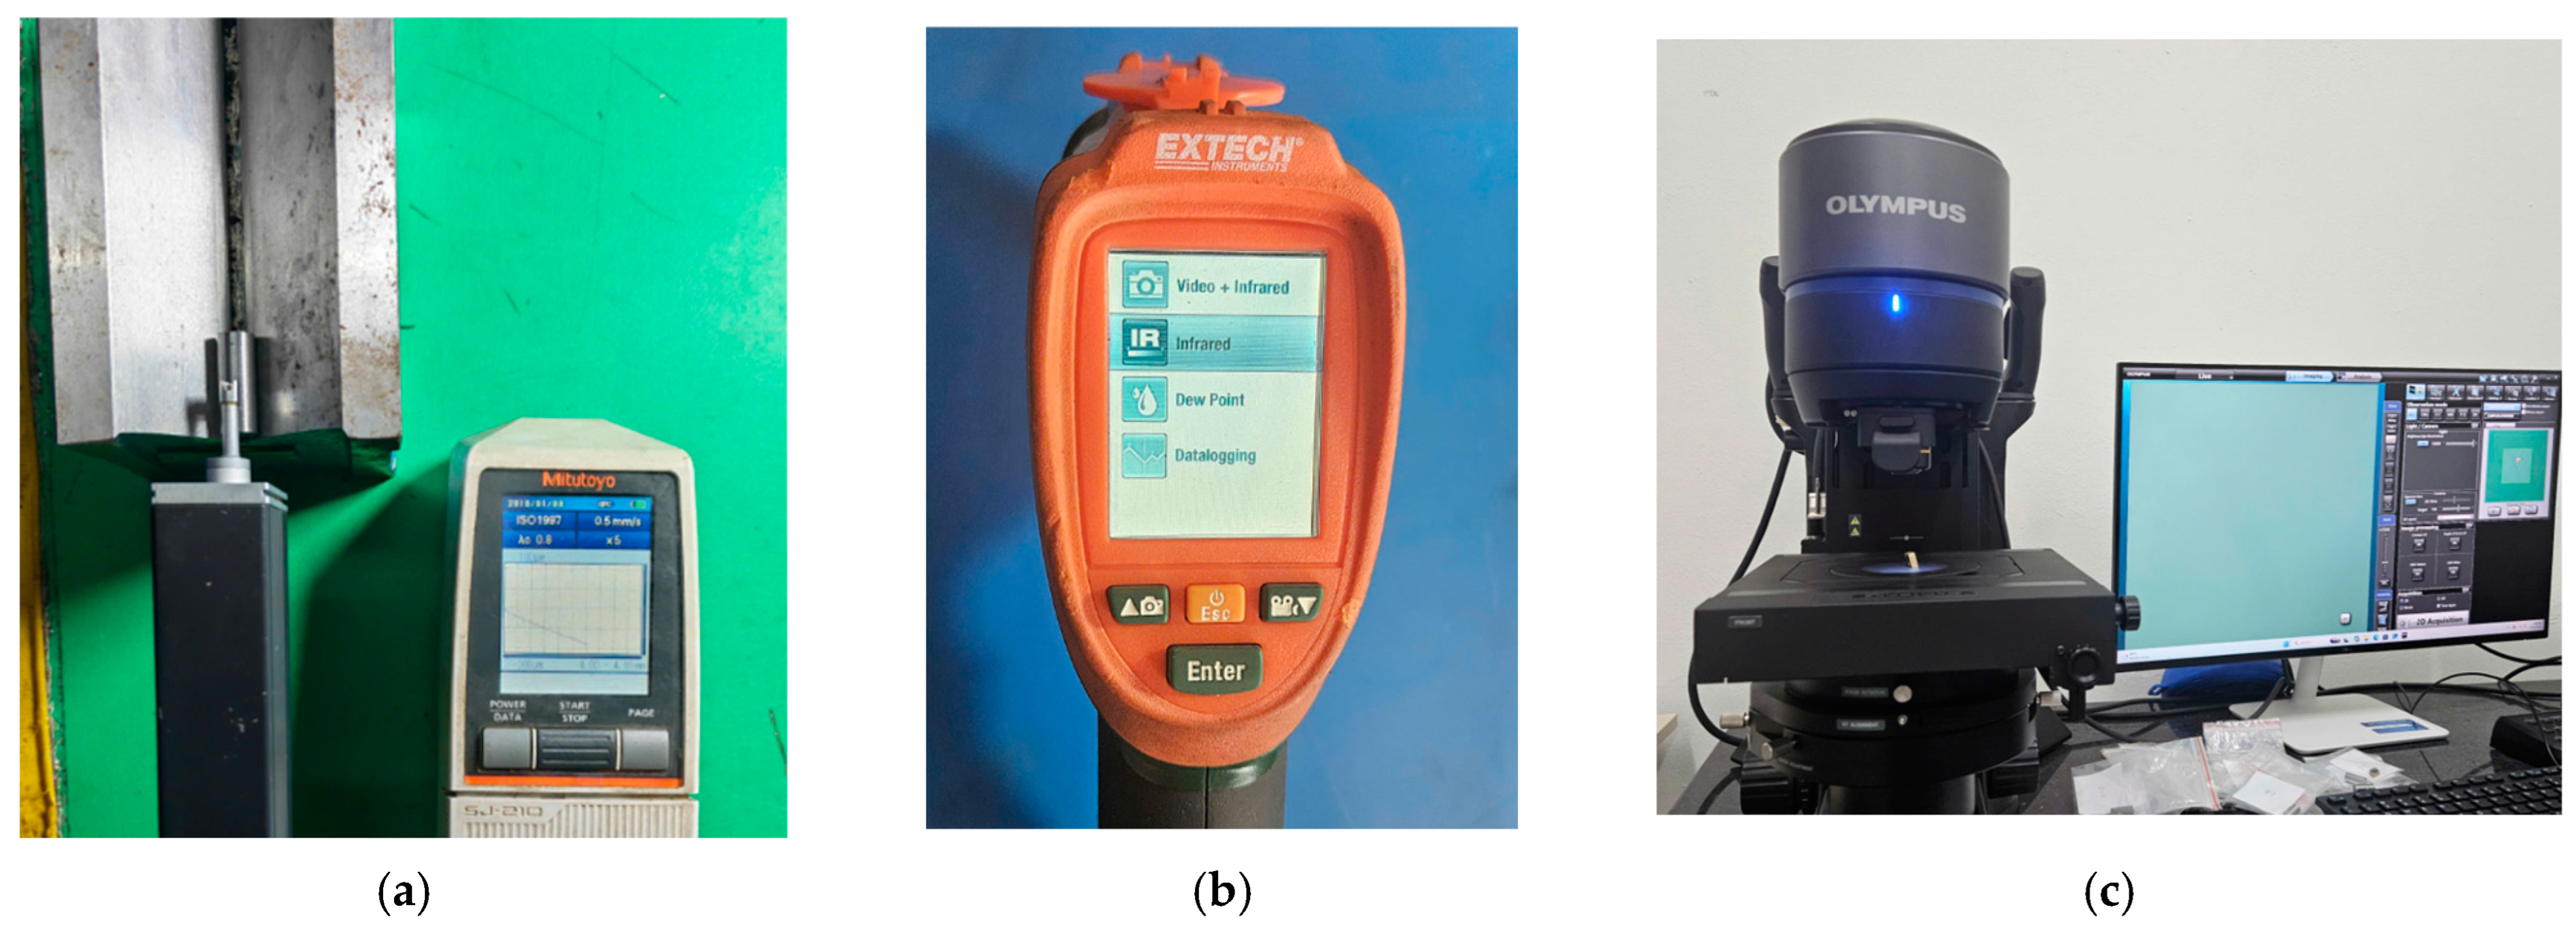
Surface roughness Ra was measured using a Mitutoyo SJ-210 contact profilometer (Mitutoyo Corporation, Kawasaki, Japan) (see Figure 3a). For each specimen, measurements were taken at three circumferential locations, and their arithmetic mean was used as the response value of the run. The measurement uncertainty specified by the manufacturer is ±0.02 μm at k = 2.
Figure 3.
Measurement equipment: (a) Mitutoyo SJ-210 surface profilometer (Mitutoyo, Kawasaki, Japan); (b) Extech VIR50 infrared thermometer (Extech Instruments, Nashua, NH, USA); and (c) Olympus DSX1000 digital microscope (Olympus, Tokyo, Japan).
The standard deviation of the three measurements is reported (Section 3.1) to characterize measurement dispersion. These three readings are repeated measurements of the same machined surface and do not constitute independent replications of the machining process; therefore, the standard deviation reflects variation in roughness around the circumference of one machined surface, together with the profilometer’s repeatability, not run-to-run process variability. Only the two-dimensional parameter Ra was measured; areal parameters such as Sa (ISO 25178-2 [29]) were not evaluated (see Section 3.10).
2.4.2. Cutting-Zone Temperature
The cutting-zone temperature T was measured using an Extech VIR50 infrared thermometer (see Figure 3b), in conjunction with a video-monitoring system directed at the cutting zone. For each experimental run, three consecutive readings were recorded at the fifth minute of cutting and averaged. The manufacturer specifies an accuracy of ±(1% of the reading + 2 °C) over the range of −0.6 to 100 °C and a repeatability of ±1 °C. The instrument has a distance-to-spot ratio of 50:1 and an adjustable emissivity range of 0.10–1.00. The thermometer was positioned 80 cm from the cutting zone, resulting in a measurement spot approximately 16 mm in diameter, and the emissivity was set to 0.85. The standard deviation of the three readings is reported in Section 3.1. These readings are repeated measurements taken during a single machining test and do not constitute independent replications. Because the temperature was measured using infrared thermometry, the reported value represents the apparent temperature averaged across the measurement spot in the cutting zone. It may be affected by the emissivity of the tool, chip, and workpiece surfaces; partial obstruction of the line of sight by chips and lubricant aerosol; the size of the measurement spot; and the dynamic nature of the cutting process. The underlying physics and sources of uncertainty associated with the principal temperature-measurement methods used in material removal processes are reviewed in [30]. Accordingly, the reported values are not claimed to represent the actual tool–chip interface temperature, which is generally higher and would require, for example, tool–work thermocouples or embedded sensors. They are used as a consistent relative indicator of thermal load for comparing the L9 conditions, all of which were measured with the same instrument and procedure.
2.4.3. Tool Wear Depth
Tool flank wear was characterized using an Olympus DSX1000 digital microscope (Olympus Corporation, Tokyo, Japan) (Figure 3c) equipped with an LMPLFLN50XBD 50× objective (Olympus Corporation, Tokyo, Japan). The total magnification was approximately 1290×, with dark-field illumination and an extended-height imaging mode. For the L9 experiments, the scan area was 213.506 × 213.506 μm. The measured WD represents the wear accumulated over the repeated cycles of the 45 min test (Section 2.2), not the wear of a single 30 mm pass.
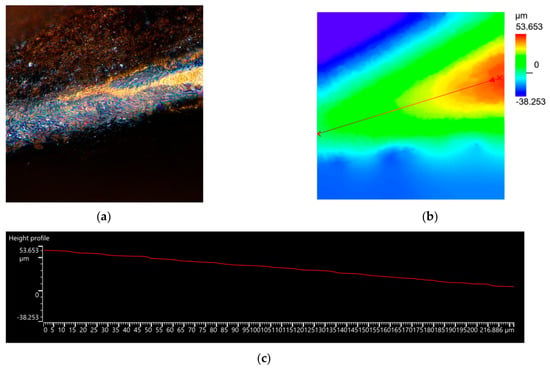
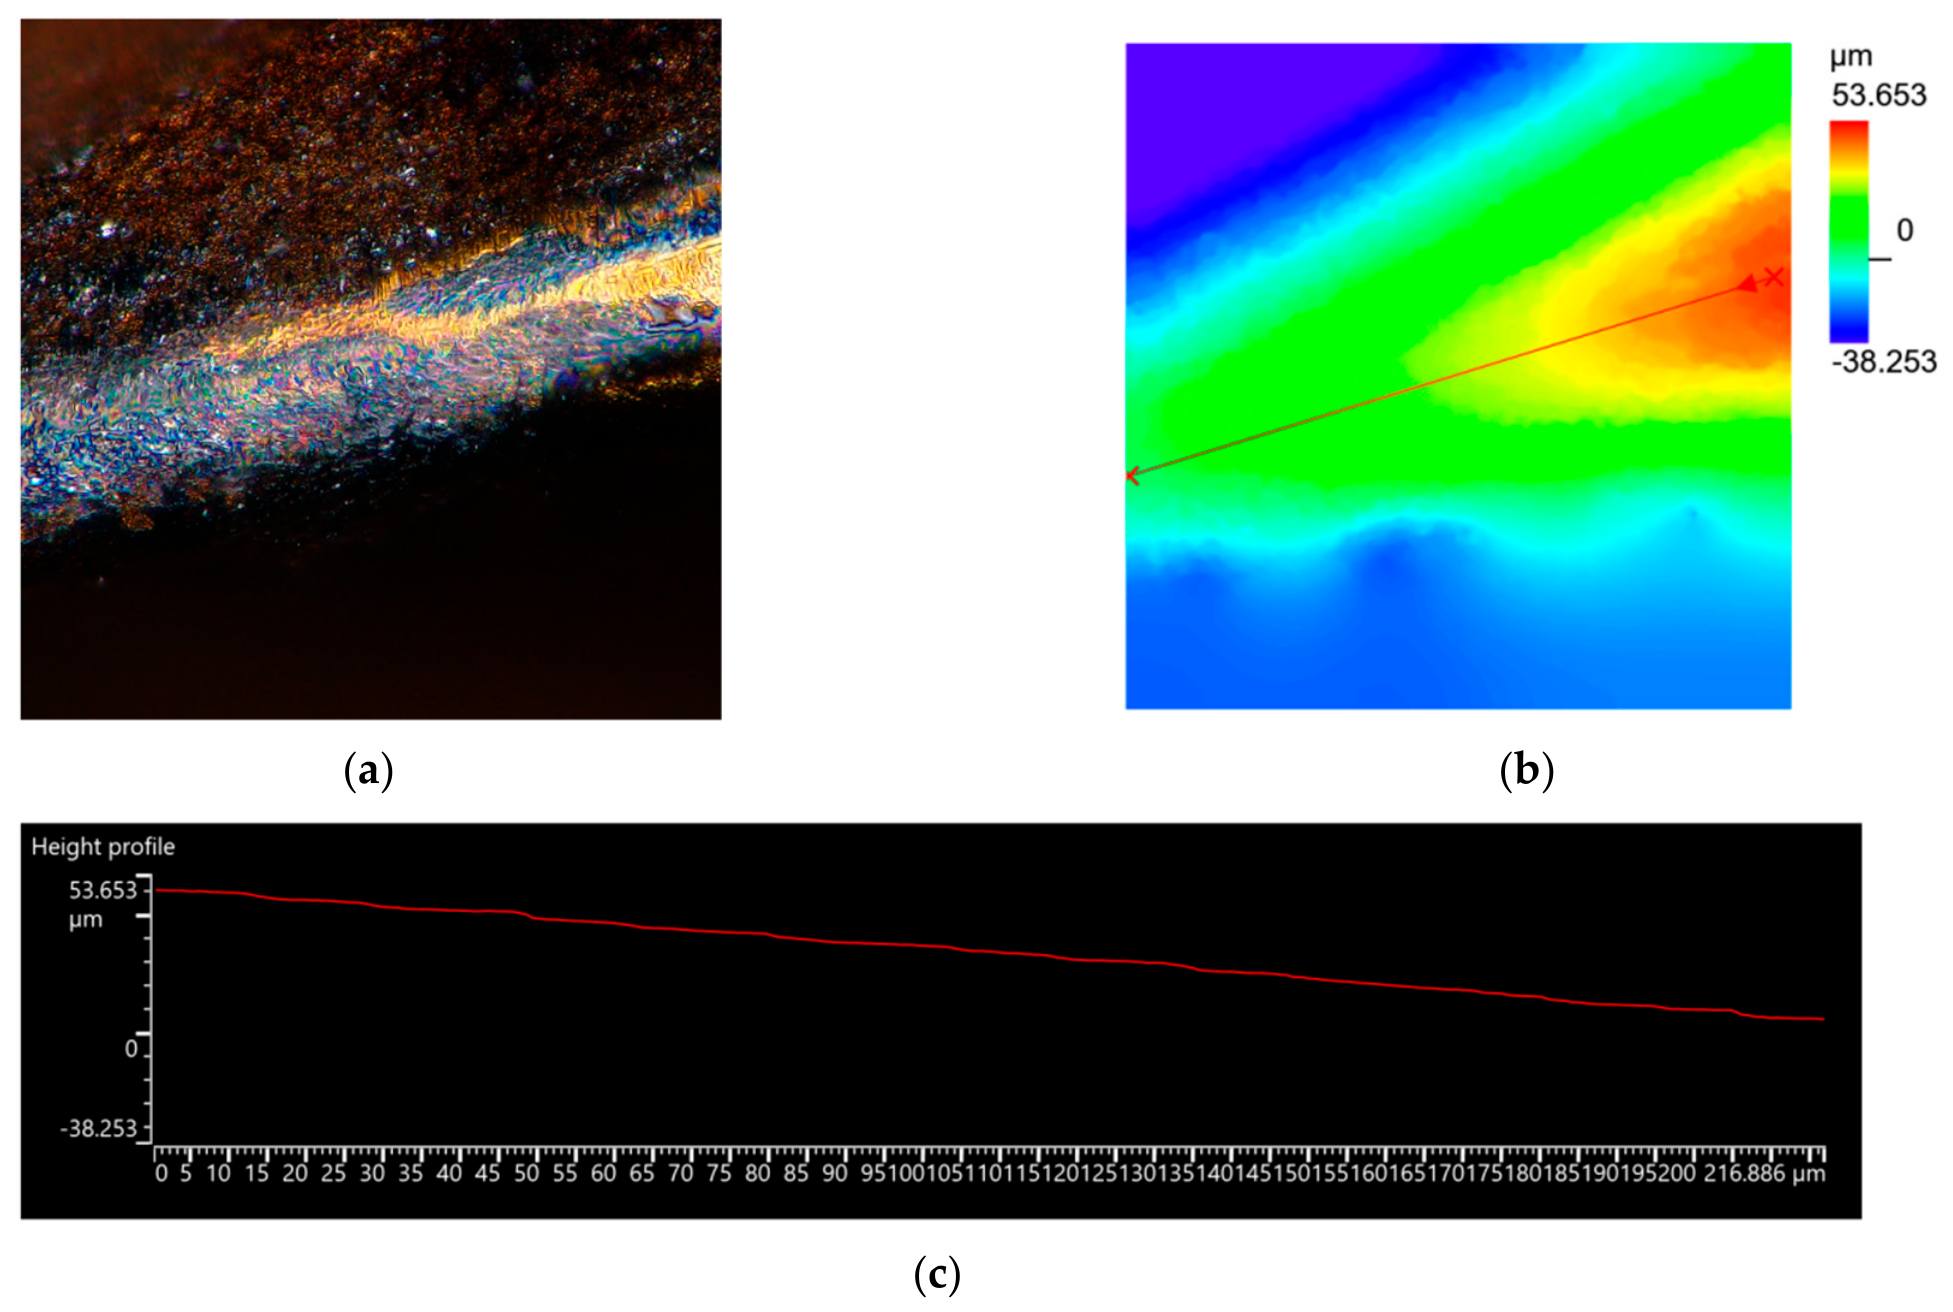
The wear depth WD was defined as the maximum depth of the wear scar below the unworn flank reference surface. It was calculated from the minimum height value in the three-dimensional height map according to
where h00 is the minimum height value obtained from the height map acquired and analyzed with the DSX1000 built-in software (Olympus Corporation, Tokyo, Japan). The zero-height reference was defined on the unworn insert surface; therefore, negative height values indicate material removal attributable to flank wear.
WD = |h00|
The wear depth WD was adopted instead of the conventional flank-wear width VB or maximum flank-wear width VB,max (ISO 3685 [28]) for the following reasons. First, the DSX1000 provides a calibrated three-dimensional height map, so that WD is extracted numerically from the measured topography rather than from an operator-defined boundary of the wear land, which reduces subjectivity. Second, the height map gives the depth of material loss relative to the unworn reference surface (Equation (1)), which provides a direct measure of the severity of the local wear. WD and VB describe different geometric features of the same worn zone (depth of material loss and width of the wear land, respectively); they are related through the clearance geometry of the insert but are not interchangeable, and no conversion between them is claimed. Consequently, the WD values reported here cannot be compared directly with VB values from other studies; the comparison with the literature is restricted to the trends of wear with the process parameters (Section 3.9). Because WD is defined by the minimum height value, it is a local extreme-value indicator that can be affected by local chipping or by a single extreme point, and it should be regarded as a maximum-severity indicator.
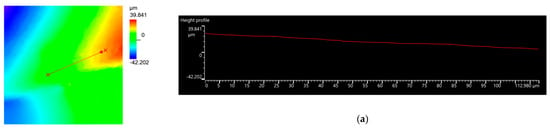
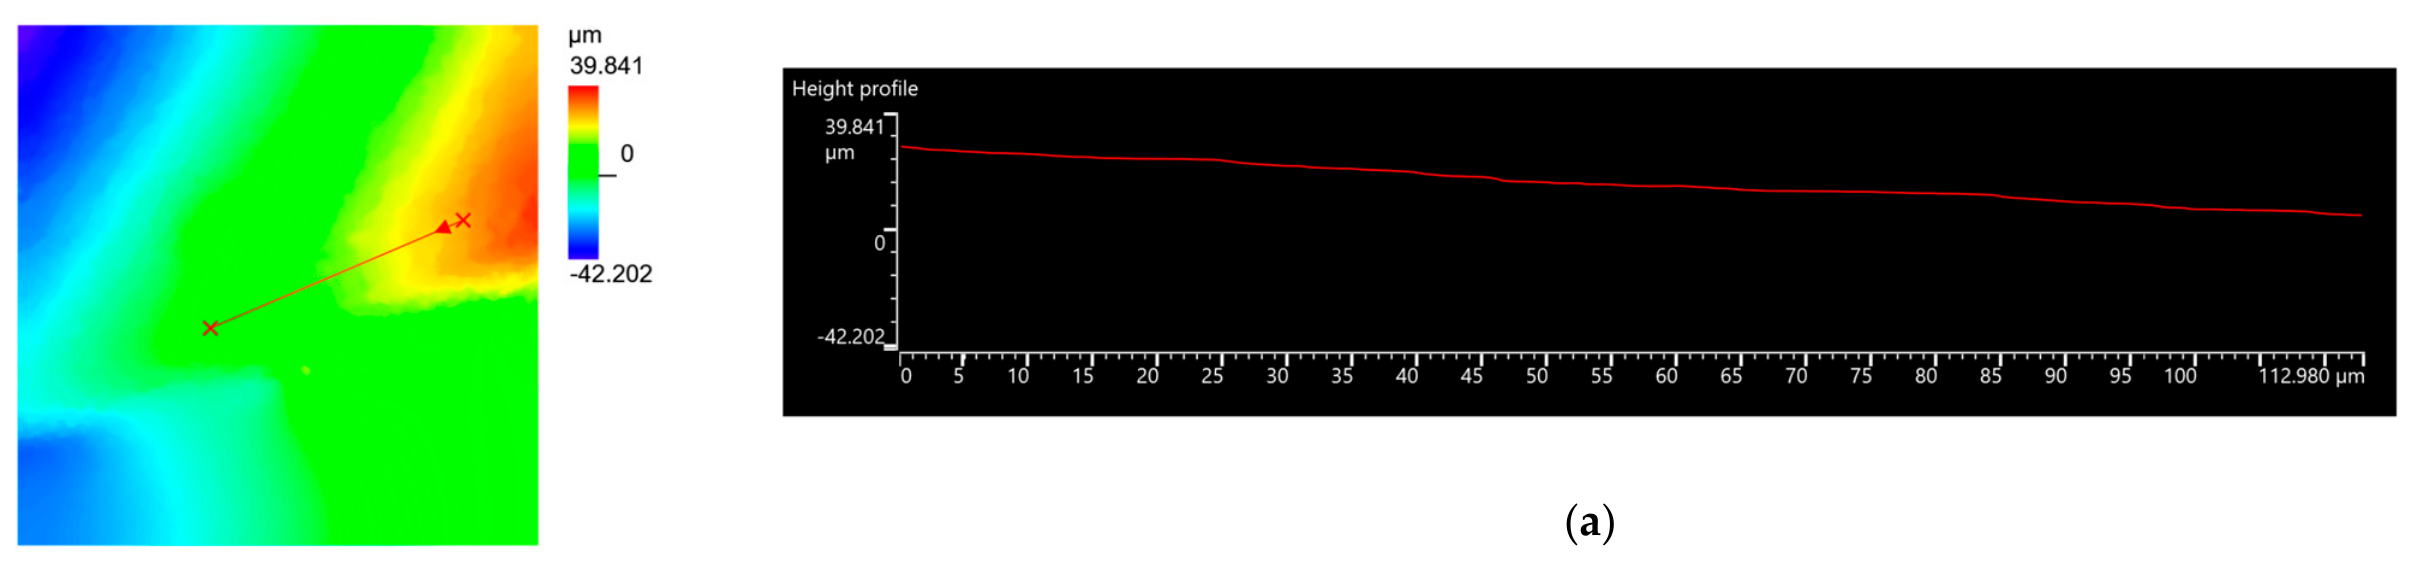
Wear depth was measured once per run by three-dimensional topographic mapping (Figure 4). The repeatability of the measurement was checked by re-measuring Runs 1, 5, and 9; the deviations were below 0.5 μm. These re-measurements verify only the repeatability of the microscope measurement; WD was obtained from one wear scar per run.
Figure 4.
Representative DSX1000 three-dimensional wear-scar characterization for Run 8: (a) color image acquired under dark-field illumination (colors are optical and do not encode data); (b) height map (the color scale gives the height relative to the unworn flank surface in µm; the red line is the profile path used in (c), and × marks its end points); and (c) height profile along the red line in (b). The profile line extends to the edge of the scanned area.
For the confirmation experiment, the same wear-accumulation procedure (approximately 45 min) was applied, and a higher microscope zoom was used to capture the complete wear scar; the same wear-depth extraction principle (Equation (1)) was retained.
2.5. Experimental Design
Four control factors were selected: cutting speed V, feed rate f, MQL flow rate Q, and MQL air pressure p.
The depth of cut was fixed at
throughout all experiments. Each control factor was examined at three levels, as detailed in Table 2. A Taguchi L9 orthogonal array was used because it allows a balanced estimation of the main effects with only nine runs.
ap = 0.5 mm
Table 2.
Process parameters and experimental levels.
All three responses—surface roughness, cutting-zone temperature, and wear depth—were treated as smaller-the-better characteristics.
The test duration was set in advance at approximately 45 min so that nose wear would become measurable. A fixed duration also corresponds to a fixed-time tool-change criterion (Section 3.8.2). Because the process involves continuous automatic turning, the number of workpieces machined during this period depends on the cutting speed and feed rate and therefore varies among the L9 runs. The duration is approximate because the workpiece being cut when the time expires is completed before the test is stopped. As a consequence of the constant duration, the cutting length and the removed volume differ among the runs; they are quantified in Section 3.8.2, where the wear depth is also normalized by them. The L9 array estimates the main effects of the four factors only; all interactions (for example, V × f or Q × p) are confounded with main effects or with the error term, so the analysis assumes negligible interactions [31,32]. The consequences of this assumption are discussed in Section 3.10.
3. Results and Discussion
3.1. Experimental Matrix and Measured Responses
Table 3 presents the complete Taguchi L9 matrix and the measured responses.
Table 3.
Taguchi L9 experimental matrix and measured responses.
For Ra and T, the table reports the arithmetic mean of three measurements. The corresponding standard deviations describe measurement dispersion (repeated measurements, not independent replications; Section 3.10). Only the mean values were used in the subsequent S/N-ratio and GRA calculations. WD was evaluated once per run (Section 2.4.3).
Because the Taguchi analysis was based on run-level mean responses, the S/N ratio of each run was computed from the corresponding mean response. For the smaller-the-better characteristics considered here, the S/N ratio was determined as follows:
where is the mean response obtained from the repeated measurements of each experimental run.
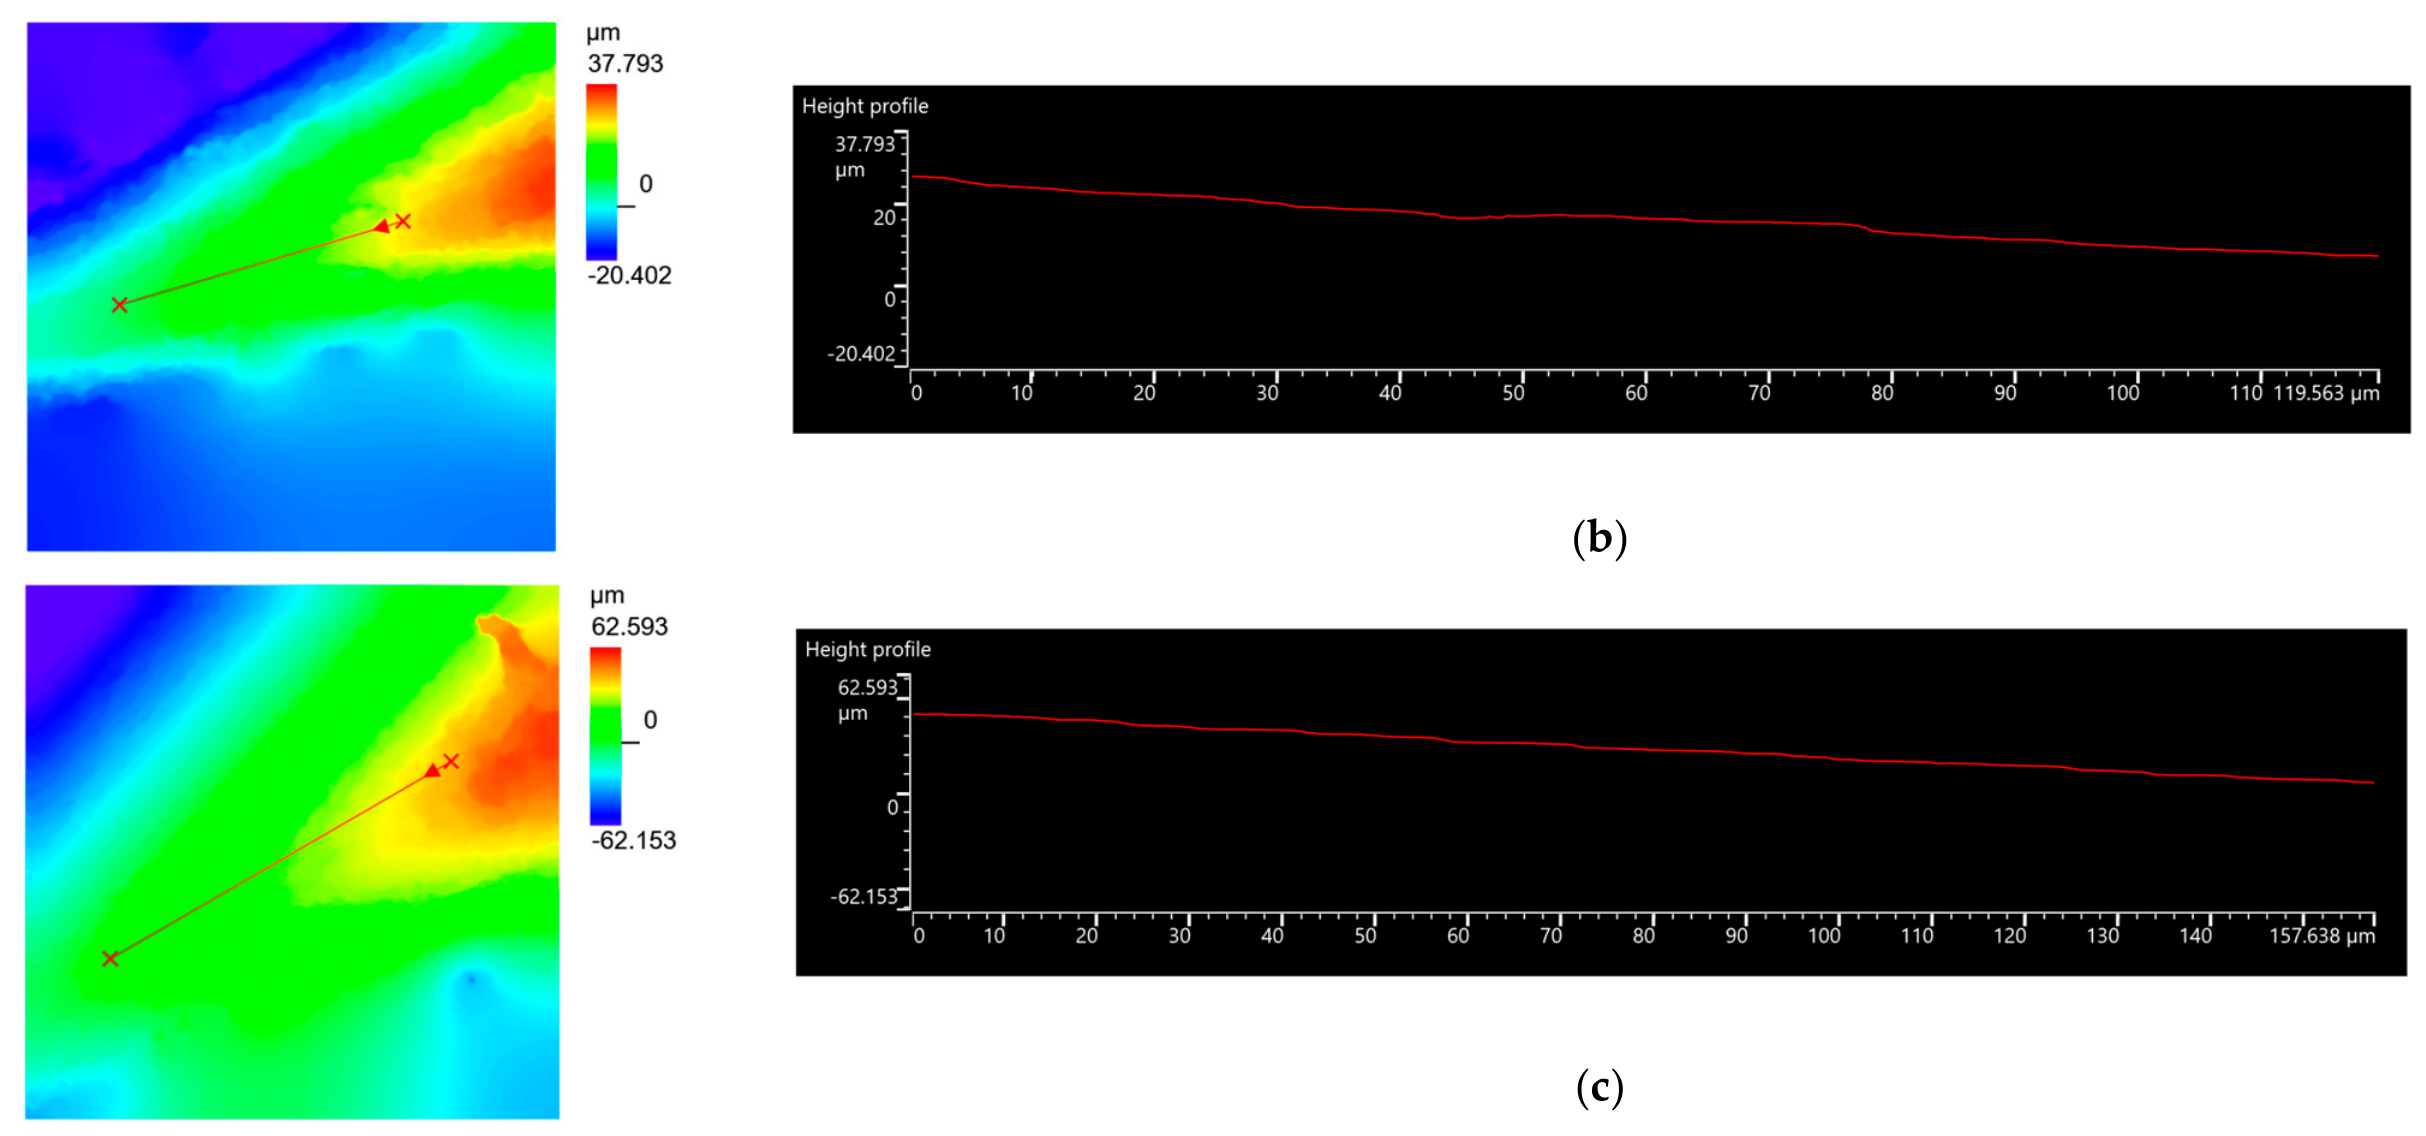
Within the experimental array, Run 7 produced the lowest surface roughness (Ra = 0.496 μm), whereas Run 9 generated the highest cutting-zone temperature (T = 85.2 °C) and Run 1 the lowest (45.1 °C). Regarding tool degradation, the minimum wear depth was observed in Run 2 (WD = 20.402 μm), and the maximum in Run 3 (WD = 62.153 μm).
Because the individual response optima do not coincide, a multi-response optimization is required.
3.2. Effect of Cutting Parameters on Surface Roughness
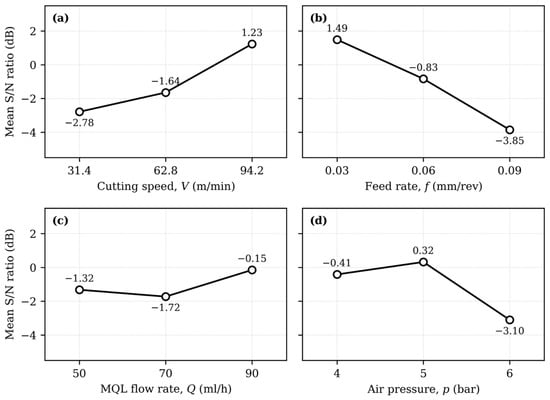
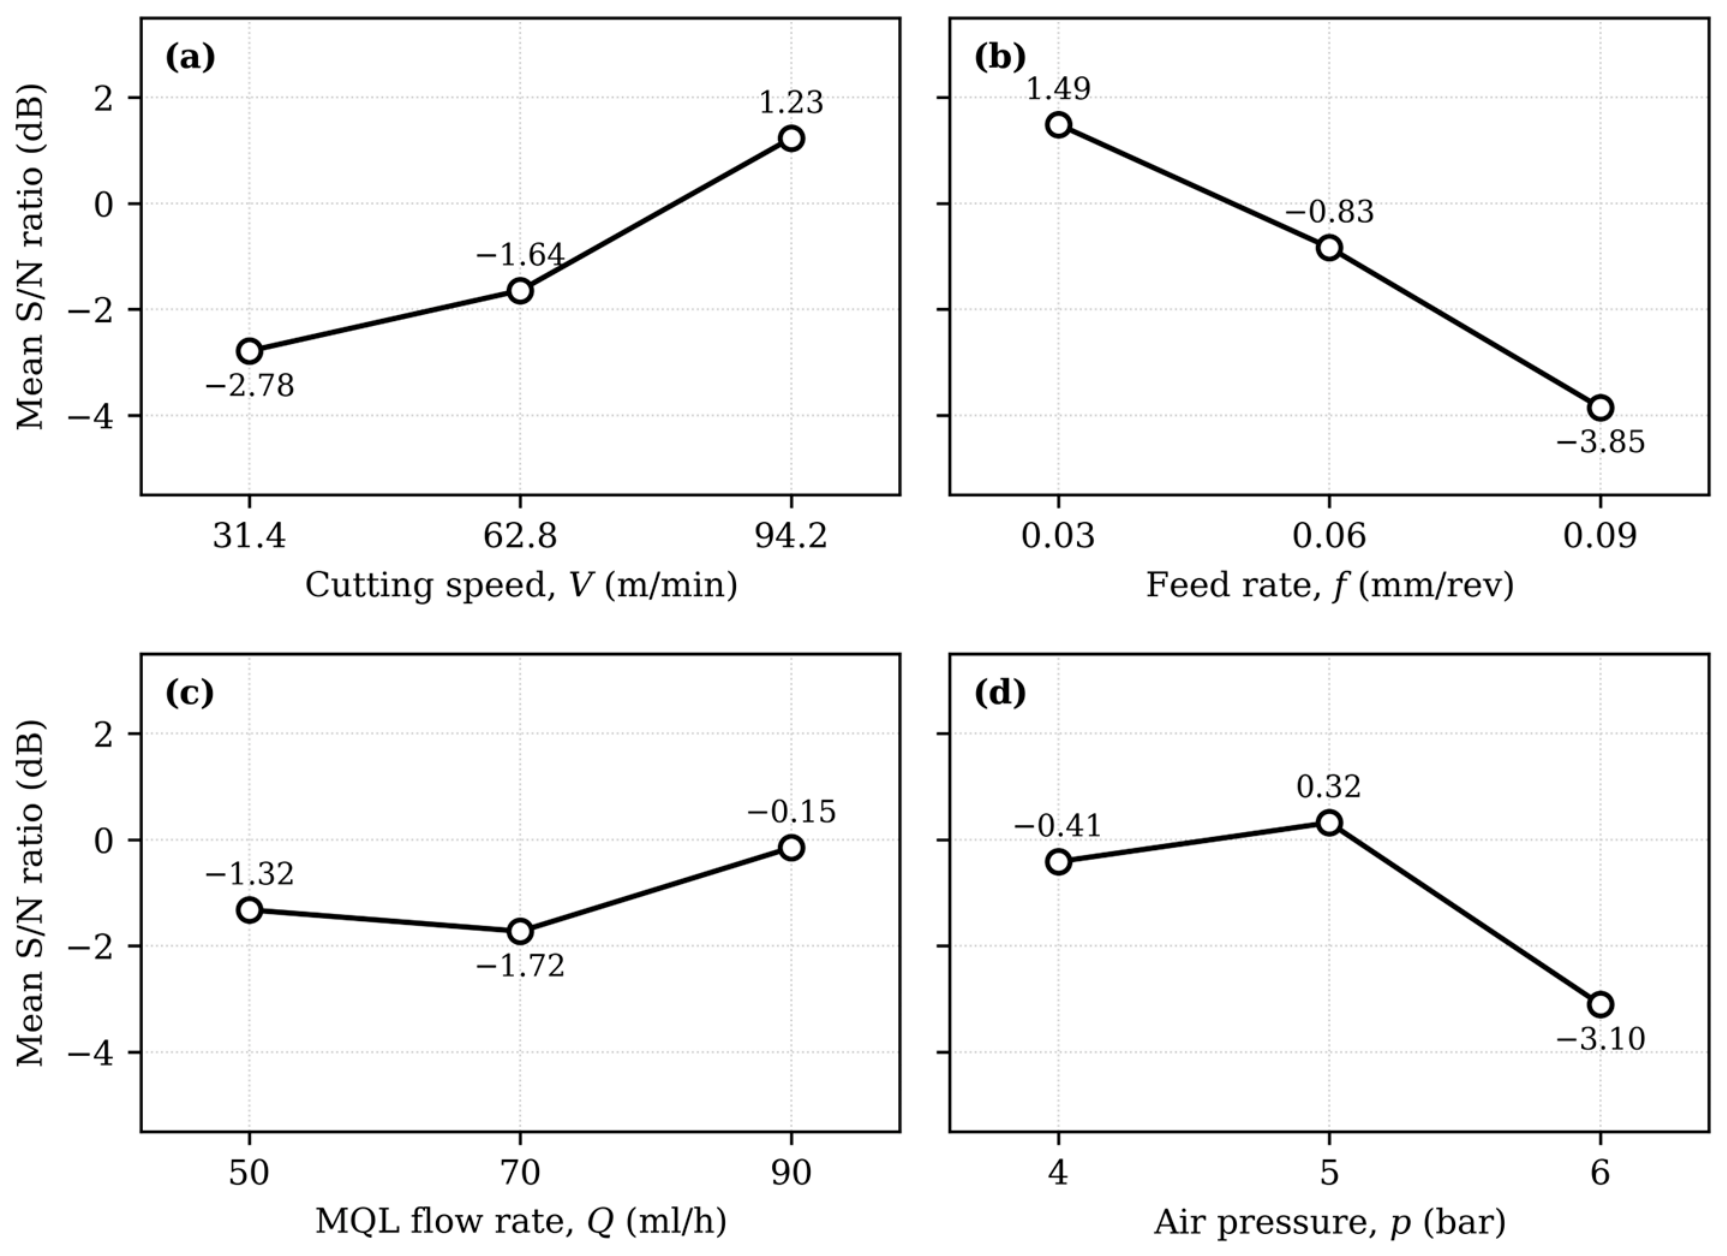
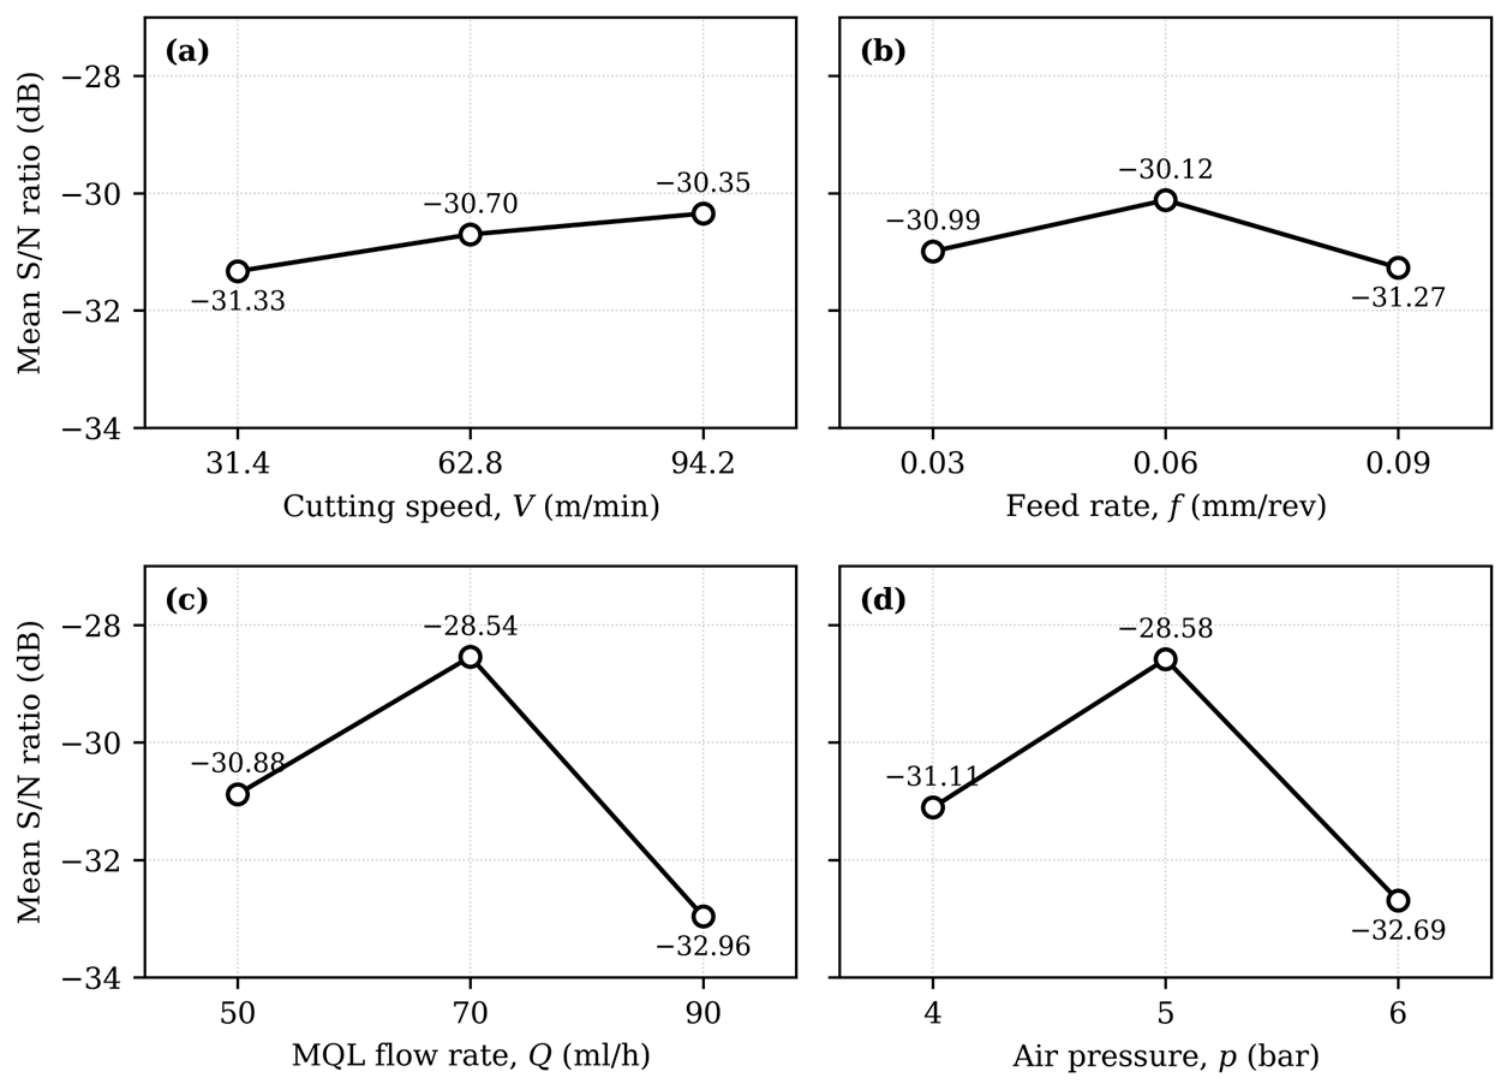
Figure 5 shows the main effects of the four control factors on the S/N ratio of surface roughness. Cutting speed has a favorable effect within the investigated range: the mean S/N ratio increases as the cutting speed increases from 31.4 to 94.2 m/min. Higher cutting speeds can reduce the tendency for built-up edge formation, which has been reported to disappear above a threshold cutting speed in medium-carbon steel [4].
Figure 5.
Main effects plot of S/N ratios for surface roughness Ra: (a) cutting speed V; (b) feed rate f; (c) MQL flow rate Q; (d) air pressure p.
The feed rate has the strongest effect on surface roughness. Increasing the feed rate from 0.03 to 0.09 mm/rev markedly lowers the mean S/N ratio. This behavior is consistent with the geometric contribution of the feed rate to the resulting turning profile. For an idealized tool geometry, the theoretical surface-profile height is related to the feed and the nose radius by
where rϵ is the tool nose radius (0.4 mm for the insert used).
The effect of the feed rate may be further amplified by increases in cutting force, vibration, and plastic deformation. The MQL flow rate has only a small effect on Ra. Increasing Q does not change the mean S/N ratio monotonically: the ratio is highest at 90 mL/h and lowest at 70 mL/h; the larger lubricant supply at 90 mL/h may improve lubrication and chip evacuation. However, its contribution remains considerably lower than that of the feed rate.
Air pressure exhibits a non-monotonic response, with the highest mean S/N ratio at 5 bar. At 6 bar, the S/N ratio decreases markedly, so increasing the pressure beyond 5 bar does not improve surface roughness.
The single-response optimum for surface roughness is therefore V3f1Q3p2, corresponding to V = 94.2 m/min, f = 0.03 mm/rev, Q = 90 mL/h, and p = 5 bar.
This result should be interpreted as the best setting for Ra within the experimental domain investigated, rather than as a global optimum.
3.3. Effect of Cutting Parameters on Cutting-Zone Temperature
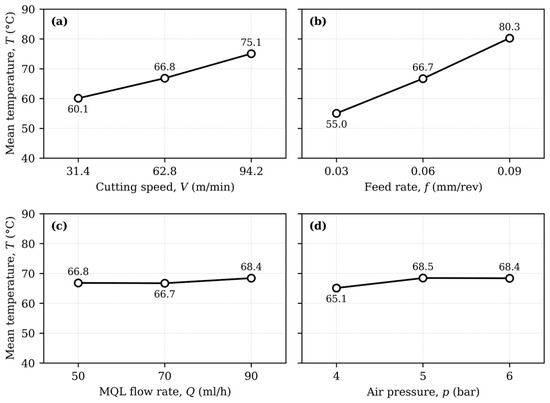
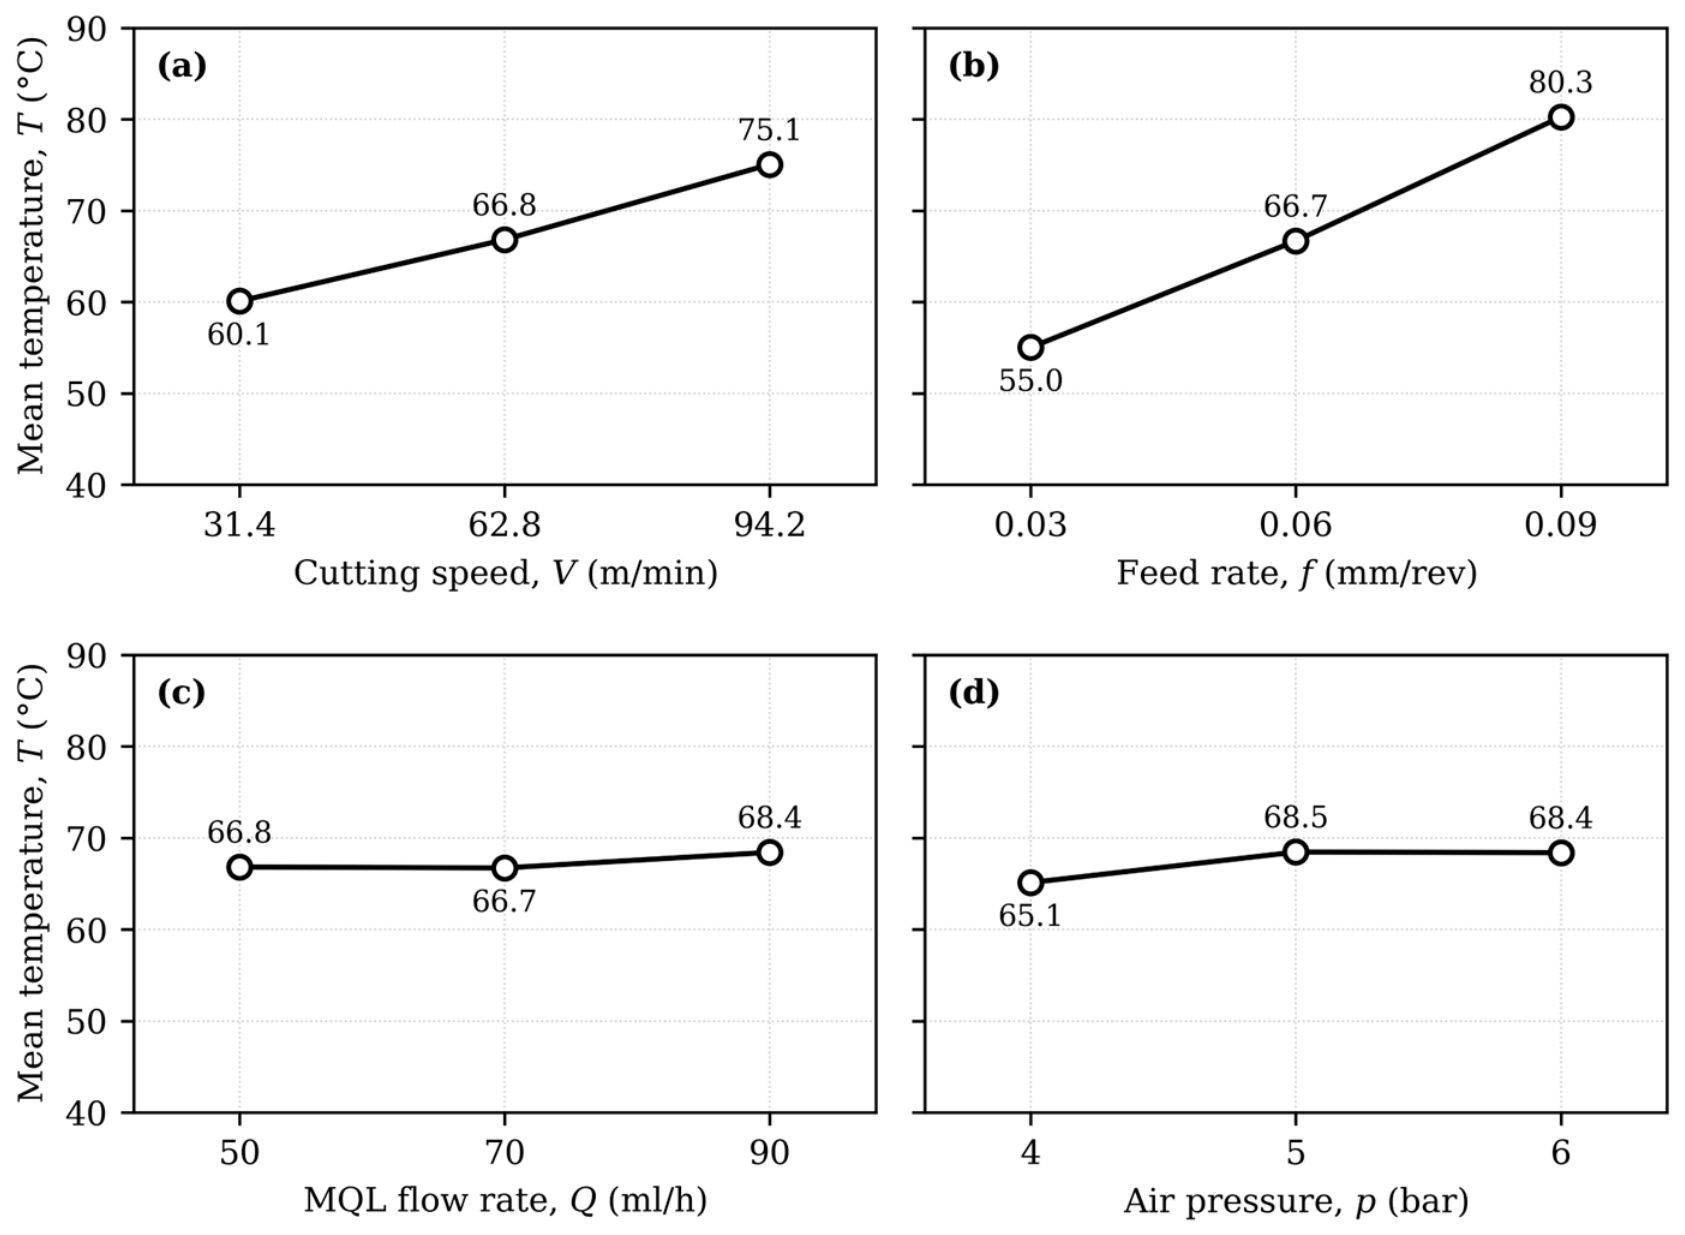
As illustrated in the main effects plot for cutting-zone temperature (Figure 6), the thermal response differs from that of surface roughness. Cutting speed increases the rate of mechanical energy generation in the cutting zone. The mean measured temperature increases with cutting speed within the investigated range, from 60.1 °C at 31.4 m/min to 75.1 °C at 94.2 m/min. Feed rate is the most influential thermal parameter. Increasing the feed rate enlarges the undeformed chip cross-section and generally raises the cutting force and the associated heat generation. The mean temperature rises from 55.0 °C to 80.3 °C as the feed rate increases from 0.03 to 0.09 mm/rev.
Figure 6.
Main effects plot of mean cutting-zone temperature T: (a) cutting speed V; (b) feed rate f; (c) MQL flow rate Q; (d) air pressure p.
The effect of the MQL flow rate is small within the examined range: increasing it from 50 to 90 mL/h changes the mean temperature by less than 2 °C (66.7–68.4 °C). This indicates that, within the tested range, heat generation from cutting speed and feed rate outweighs the small cooling effect of changes in MQL flow rate.
Air pressure also has a modest effect, and the temperature does not decrease appreciably with increasing pressure (65.1, 68.5, and 68.4 °C at 4, 5, and 6 bar). Increasing the air pressure beyond the intermediate level therefore cannot be justified on thermal grounds alone.
Overall, the results indicate that feed rate and cutting speed are the principal thermal parameters, whereas the direct thermal influence of Q and p is comparatively small within the investigated range. Given the measurement principle described in Section 2.4.2, these trends should be interpreted as relative differences in the measured cutting-zone temperature.
3.4. Effect of Cutting Parameters on Tool Wear Depth
Since WD was measured at the end of the 45 min test (Section 2.4.3), the variations in WD among the L9 runs reflect wear accumulation under each condition. Because the cutting length and removed volume differ among the runs (Section 2.5), these variations also include the effect of the different amounts of machined material (Section 3.8.2).
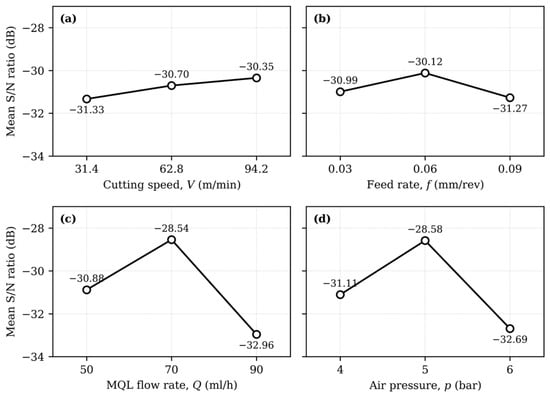
The main effects plot for tool wear depth (Figure 7) reveals a response pattern different from that of Ra and T. Cutting speed has little effect on the wear depth, and feed rate is less influential than the MQL delivery parameters.
Figure 7.
Main effects plot of S/N ratios for tool wear depth WD: (a) cutting speed V; (b) feed rate f; (c) MQL flow rate Q; (d) air pressure p.
In contrast, the MQL flow rate and air pressure show non-monotonic effects, with the highest mean S/N ratio at Q = 70 mL/h and p = 5 bar. Elevating either parameter to its maximum tested level leads to a decline in the wear performance. A plausible explanation is that a low lubricant supply cannot sustain an effective lubricating film, whereas higher flow rates or pressures provide no additional protection. However, this study did not measure aerosol-jet dynamics (e.g., droplet size and velocity, jet visualization) or tribofilm formation (e.g., scanning electron microscopy with energy-dispersive X-ray spectroscopy (SEM/EDS) or X-ray photoelectron spectroscopy (XPS) of the worn surfaces). Therefore, this explanation remains a hypothesis, and the intermediate optimum at 70 mL/h and 5 bar is reported as an empirical observation within the tested range. Furthermore, because no replicated runs were performed, some portion of the non-monotonic trend across the three levels may reflect experimental scatter.
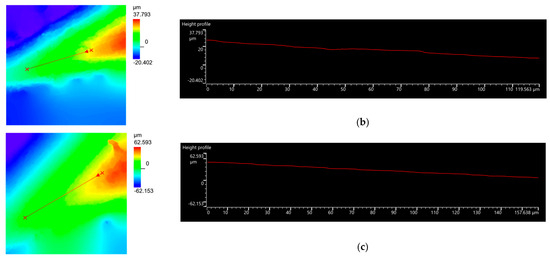
The three-dimensional wear maps (Figure 8) illustrate the differences between the selected conditions. Run 3 shows the largest wear scar in the L9 array (WD = 62.153 μm), whereas Run 2 shows the smallest material loss (WD = 20.402 μm).
Figure 8.
Representative DSX1000 wear-scar profiles for (a) Run 5 (WD = 42.202 μm), (b) Run 2 (WD = 20.402 μm), and (c) Run 3 (WD = 62.153 μm).
3.5. ANOVA of Individual Responses
ANOVA was conducted separately for Ra, T, and WD using the S/N ratios. Since the L9 design includes only eight degrees of freedom, all consumed by the four main effects, the factor with the smallest sum of squares (one factor, 2 df) was pooled into the error term in each ANOVA (Q for Ra and T; V for WD), so that the error term has only two degrees of freedom. Consequently, the percentage contributions should be regarded primarily as relative indicators within the scope of the experiment. The F-tests require particular caution. The critical value F0.05(2,2) = 19.00 is very large, so the tests have low power and only very large effects can be declared significant; at the same time, because the pooled term is the smallest effect, the error mean square is probably underestimated, which inflates the F-values. In addition, no independent replications were conducted; consequently, the error term contains no pure-error estimate of run-to-run variability, and the statistical reliability of the F-tests and percentage contributions cannot be established. Accordingly, the ANOVA results are used descriptively, alongside the main effects plots, to rank the factors, and any statements of significance should be considered indicative only. Confirmation of these rankings would require replicated runs or a design with more residual degrees of freedom [31,32].
3.5.1. Surface Roughness
As shown in Table 4, the ANOVA for surface roughness (Ra) indicates that the feed rate is the most influential parameter, contributing 46.66% to the total variation, followed by the cutting speed at 27.87% and air pressure at 21.12%. Since the MQL flow rate accounts for only 4.36% of the variance, it was pooled into the error term. With F0.05(2,2) = 19.00, none of the F-values in Table 4 reaches the 95% significance threshold, so the ranking of the factors for Ra rests on the contribution percentages only.
Table 4.
ANOVA for surface roughness Ra.
From a machining mechanics perspective, the dominant effect of the feed rate is explained mainly by the kinematics of the turning process; the theoretical peak-to-valley profile of the generated surface is directly proportional to the square of the feed rate. Cutting speed also has a considerable effect (27.87%), as higher velocities alter the plastic deformation characteristics at the shear zone and mitigate BUE formation [4], thereby resulting in a better surface finish. Whereas the contribution of the MQL flow rate is small, air pressure contributes 21.12%. This may indicate that the kinetic energy of the pressurized air plays a more important role in clearing micro-chips from the cutting zone and preventing their re-adhesion to the newly machined surface than the actual volume of lubricant supplied, although this interpretation was not verified experimentally.
3.5.2. Cutting-Zone Temperature
As shown in Table 5, the feed rate is the primary factor affecting the cutting-zone temperature, accounting for 69.17% of the total variance, with cutting speed contributing 26.10%. With the pooled error term, the main effect of the feed rate is statistically significant at the 95% confidence level (Ff = 49.25 > F0.05(2,2) = 19.00), whereas the effect of cutting speed (FV = 18.58) is slightly below this threshold; given the two error degrees of freedom, both results are indicative only (Section 3.5).
Table 5.
ANOVA for cutting-zone temperature T.
The strong effect of the feed rate is expected: a higher feed rate enlarges the undeformed chip cross-section and thus increases the cutting forces, plastic deformation, and heat generated in the primary and secondary shear zones. Moreover, the small combined contribution of MQL flow rate and air pressure (less than 5%) suggests that, within the tested range, changes in aerosol delivery provide limited additional cooling compared with the heat generated at higher feed rates.
3.5.3. Tool Wear Depth
As shown in Table 6, the sensitivity of the tool wear depth after 45 min to the process parameters differs from that of surface roughness and cutting-zone temperature. The MQL delivery parameters account for most of the variation in tool wear depth, with MQL flow rate (Q) and air pressure (p) jointly accounting for 93.76% of the total variance (contributing 49.90% and 43.86%, respectively). The pooled-error F-test indicates that the main effect of MQL flow rate (FQ = 19.65) exceeds the 95% confidence threshold (F0.05(2,2) = 19.00), while the air pressure effect (Fp = 17.27) is marginally below it. As FQ exceeds the critical value only marginally, this result should be regarded as indicative (Section 3.5).
Table 6.
ANOVA for tool wear depth WD.
This difference in parametric sensitivity has relevant physical implications. While kinematic variables (V,f) govern instantaneous surface generation and bulk heat, the wear accumulated over the 45 min test appears to be primarily associated with the tribological effectiveness of the aerosol mist at the cutting zone. A stable, penetrating lubricating film under specific flow and pressure configurations may therefore be an important factor in wear mitigation, but this mechanism was not verified by aerosol-jet or tribofilm measurements in the present study. This contrast motivates the extension from a two-response to a three-response optimization.
3.6. Multi-Objective Optimization Using Grey Relational Analysis
3.6.1. GRA Method
The individual-response analysis shows that the conditions that minimize Ra, T, and WD are not identical. GRA was therefore used to convert the three responses into a single performance index.
The GRA procedure consists of three principal steps:
- normalization;
- calculation of the Grey Relational Coefficient (GRC); and
- calculation of the Grey Relational Grade (GRG).
For a smaller-the-better response, the normalized value is calculated as
where xi(k) is the experimental value of response k for experiment i.
The corresponding deviation sequence is
The Grey Relational Coefficient is then calculated as
where ζ is the distinguishing coefficient. In the present study, ζ = 0.5.
Finally, the Grey Relational Grade is calculated as
where n = 3 represents the three responses Ra, T, and WD.
Equal weights were assigned to all three responses because no application-specific preference among surface roughness, cutting-zone temperature, and tool wear depth was imposed in the present study. Therefore,
A larger GRG indicates a better simultaneous combination of low surface roughness, low cutting-zone temperature, and low wear depth. Section 3.8.1 examines the effect of the equal-weight assumption.
3.6.2. Two-Response GRA Based on Ra and T
As a baseline for assessing the effect of the wear response, a two-response GRA based only on surface roughness and cutting-zone temperature was performed first.
In the baseline two-response GRA, which considers only surface roughness (Ra) and cutting-zone temperature (T), Run 1 attained the highest grade (Table 7, ΓRa,T = 0.8159). This result agrees with machining principles: the combination of the lowest cutting speed (V = 31.4 m/min) and lowest feed rate (f = 0.03 mm/rev) is consistent with a lower generation of thermomechanical energy in the cutting zone, and hence with the low temperature and low roughness observed.
Table 7.
Two-response GRA based on surface roughness and cutting-zone temperature.
Based on the response table (Table 8), the two-response optimum is V1f1Q1p1 (corresponding to V = 31.4 m/min, f = 0.03 mm/rev, Q = 50 mL/h, and p = 4 bar).
Table 8.
Response table for the two-response GRG.
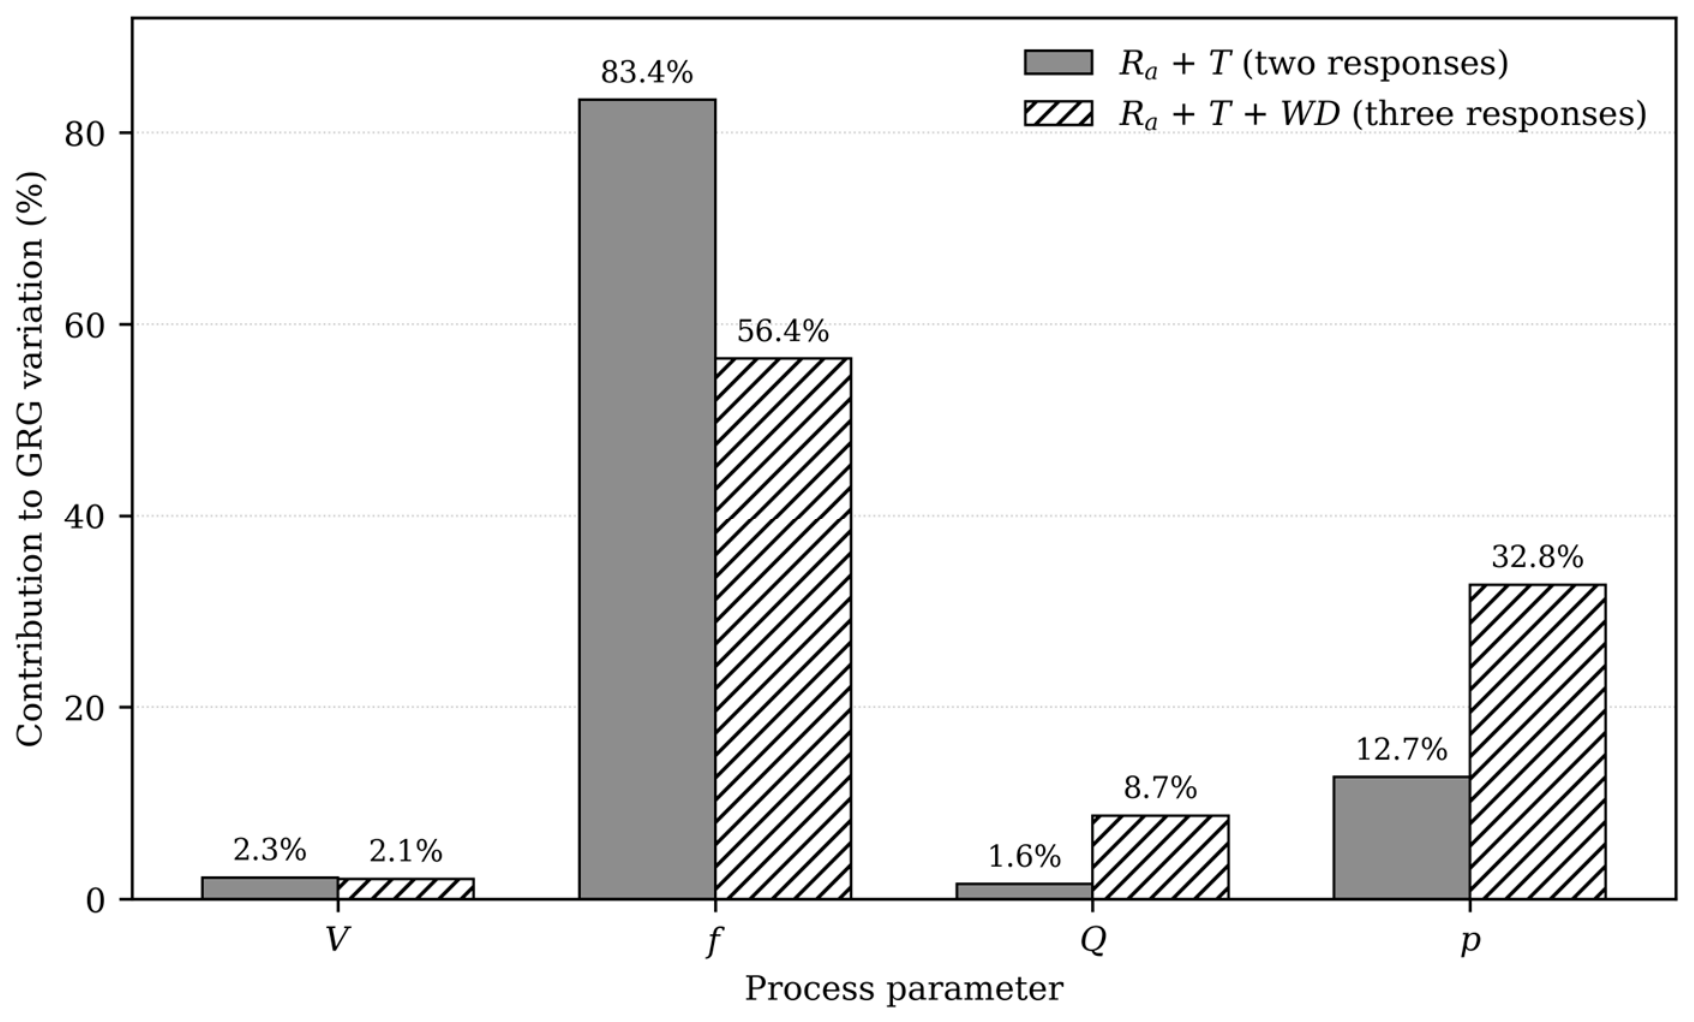
The contribution analysis (Table 9) shows that the feed rate is the dominant factor in this two-response performance, accounting for 83.43% of the overall variation. This dominance is consistent with theoretical expectations, as the feed rate determines both the geometric surface peak-to-valley height and the undeformed chip cross-section, which in turn influence cutting forces and heat generation. When tool wear is excluded, the MQL delivery parameters (Q and p) have a smaller effect (1.60% and 12.71%, respectively). This indicates that a conventional two-response optimization tends to favor the kinematic cutting parameters, and that its result depends on the chosen response set.
Table 9.
Contribution of control factors to the two-response GRG.
3.6.3. Three-Response GRA Based on Ra, T, and WD
Table 10 presents the results of the three-response GRA, in which the GRG combines the three responses into a single index. Within the L9 array, Run 1 achieved the highest grade (Γ1 = 0.7181), closely followed by Run 7 (Γ7 = 0.7055). The high grade of Run 1 results from the lowest measured temperature in the array (GRC = 1.0000) and its low roughness, which outweigh its comparatively high wear depth (GRC = 0.5224). Conversely, Run 3 had the lowest grade (Γ3 = 0.3555). This run combined the highest feed rate with the highest air pressure and gave both the highest surface roughness and the largest wear depth of the array.
Table 10.
Three-response Grey Relational Analysis results.
3.6.4. Response Table and Factor Contribution for Three-Response GRG
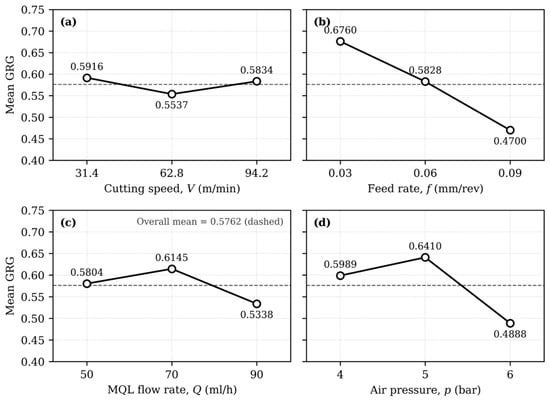
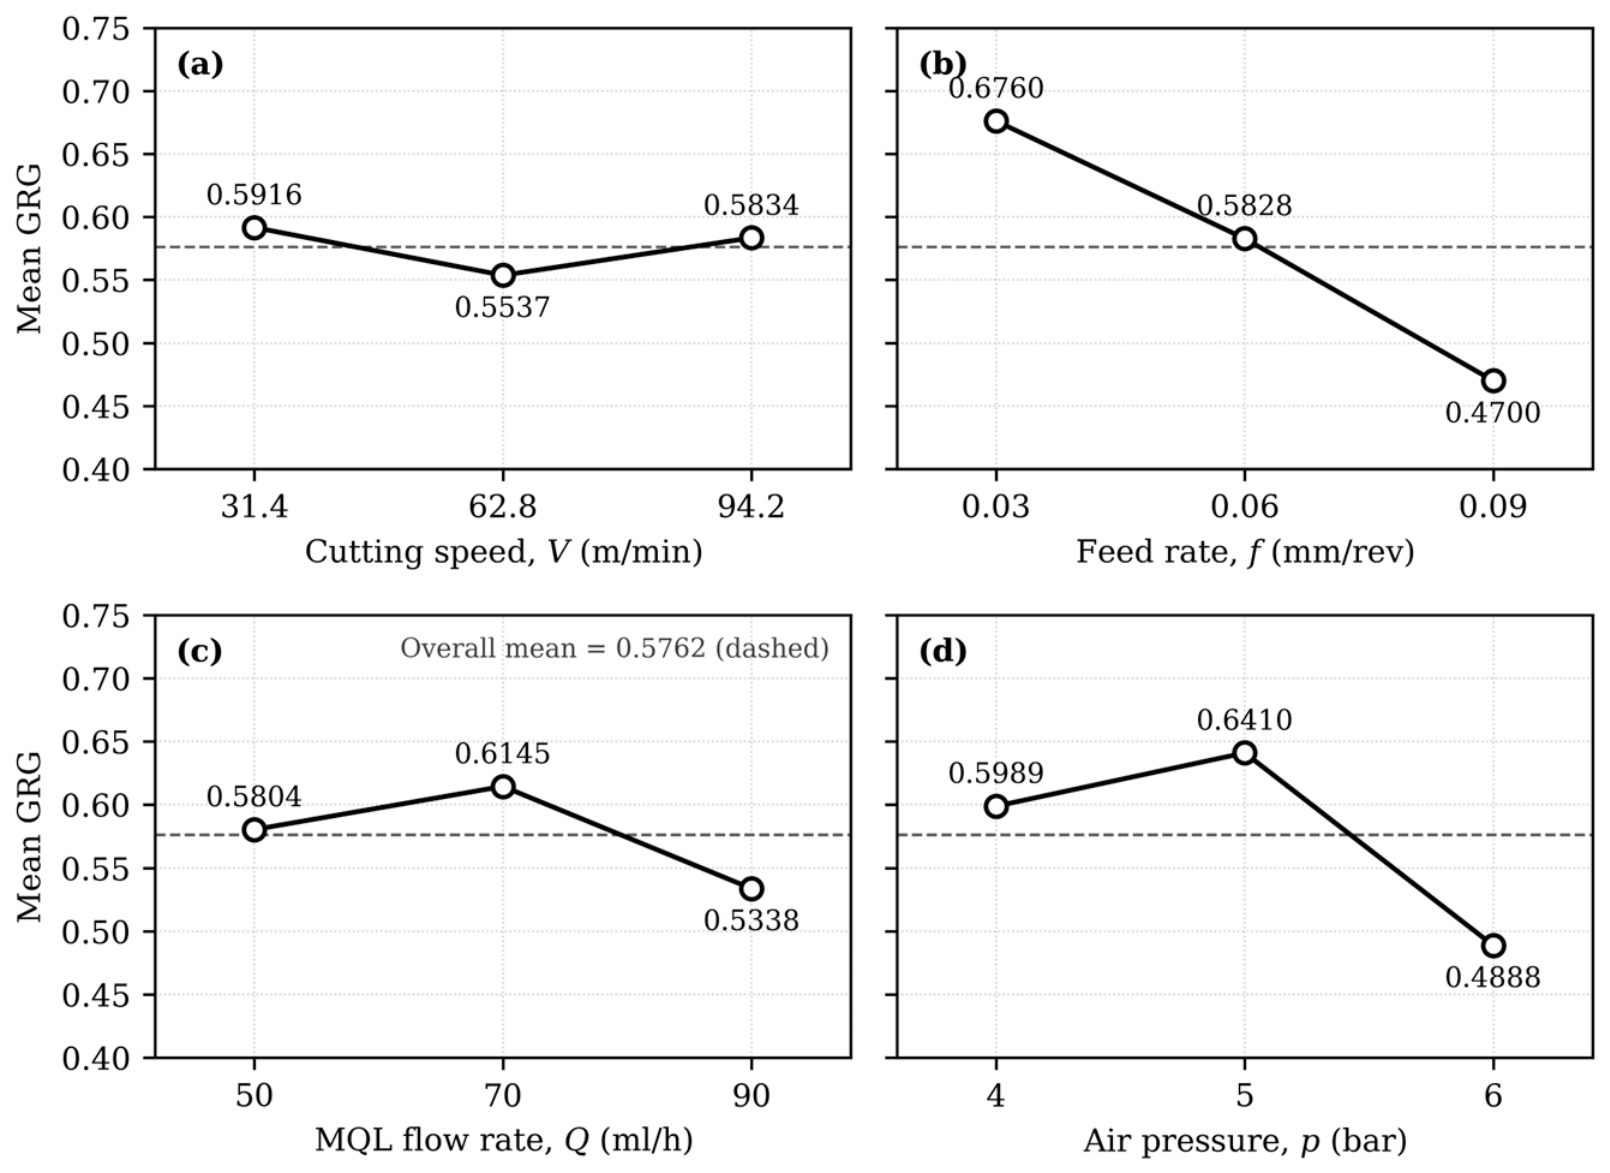
Based on the three-response GRG (Table 11 and Figure 9), the factor ranking by contribution is f > p > Q > V. Feed rate contributes 56.43% to the composite variation, followed by air pressure (32.75%), MQL flow rate (8.71%), and cutting speed (2.12%). The optimal combination within the investigated domain is therefore V1f1Q2p2 (i.e., V = 31.4 m/min, f = 0.03 mm/rev, Q = 70 mL/h, and p = 5 bar). The preference for V1 is weak: the mean GRG at V1 (0.5916) differs from that at V3 (0.5834) by only 0.0082, and the contribution of cutting speed is 2.12% (see Section 3.8.1).
Table 11.
Response table and contribution analysis for the three-response GRG.
Figure 9.
Main effects plot of the Grey Relational Grade for the three-response optimization: (a) cutting speed V; (b) feed rate f; (c) MQL flow rate Q; (d) air pressure p.
3.6.5. Response-Set Dependence of the Optimum
The main outcome of the GRA is the difference between the two- and three-response optimization results.
Minimizing surface roughness alone favors the highest cutting speed, whereas both multi-response objectives favor the lowest cutting speed and feed rate within the investigated domain. In addition, the inclusion of tool wear alters the preferred MQL delivery condition (Table 12):
(Q1,p1) → (Q2,p2).
Table 12.
Comparison of response-specific and multi-response optimum conditions.
Thus, adding tool wear does not change the preferred levels of cutting speed and feed rate; however, it does alter the recommended MQL flow rate and air pressure from 50 mL/h and 4 bar to 70 mL/h and 5 bar. This change is consistent with the individual-response ANOVA. Surface roughness and temperature are mainly associated with V and f, whereas wear depth is mainly associated with Q and p. Therefore, when wear is incorporated into the composite objective, the MQL delivery parameters have a larger influence on the composite grade. This observation illustrates a methodological point: a Taguchi–GRA optimum is inherently dependent on the response set and the weighting scheme; thus, it should not be regarded as an objective-independent or universal optimum. The three-response optimum was subsequently checked by a confirmation experiment (Section 3.7), and the dependence of the optimum on the weighting scheme and on the wear metric is examined in Section 3.8.
3.7. Confirmation Experiment
To check the optimal parameter combination derived from the three-response Taguchi–GRA (V1f1Q2p2), a confirmation experiment was conducted at V = 31.4 m/min, f = 0.03 mm/rev, Q = 70 mL/h, and p = 5 bar. The test protocol was the same as for the L9 runs (Section 2.2).
The predicted GRG () was calculated using the standard Taguchi additive model:
where is the overall mean GRG of the L9 array, is the mean GRG at the optimal level of factor j, and m = 4 is the number of factors. This predictive model yielded .
To quantify the uncertainty of the prediction, the 95% confidence interval for a single confirmation run was calculated as follows [32]:
where F0.05(1,2) = 18.51 for fe = 2 error degrees of freedom, Ve = 0.00120 is the error variance obtained by pooling the cutting-speed term (smallest effect) of the GRG analysis, and neff = N/(1 + ν) = 1 (with N = 9 and ν = 8 degrees of freedom of the four factors used in the prediction; since the cutting-speed term was retained in the prediction of Equation (10), this choice is conservative and gives a wider interval), and r = 1 is the number of confirmation runs. This gives CICE = ± 0.210, i.e., a predicted interval of 0.584 to 1.000 (the GRG cannot exceed 1). The interval is wide because the error variance is estimated with only two degrees of freedom.
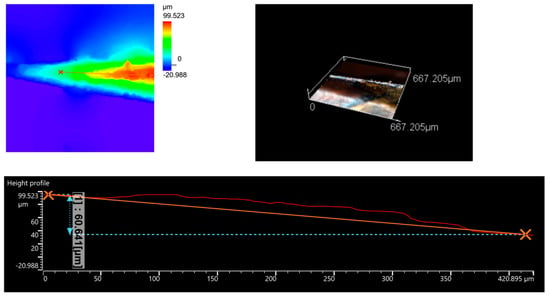
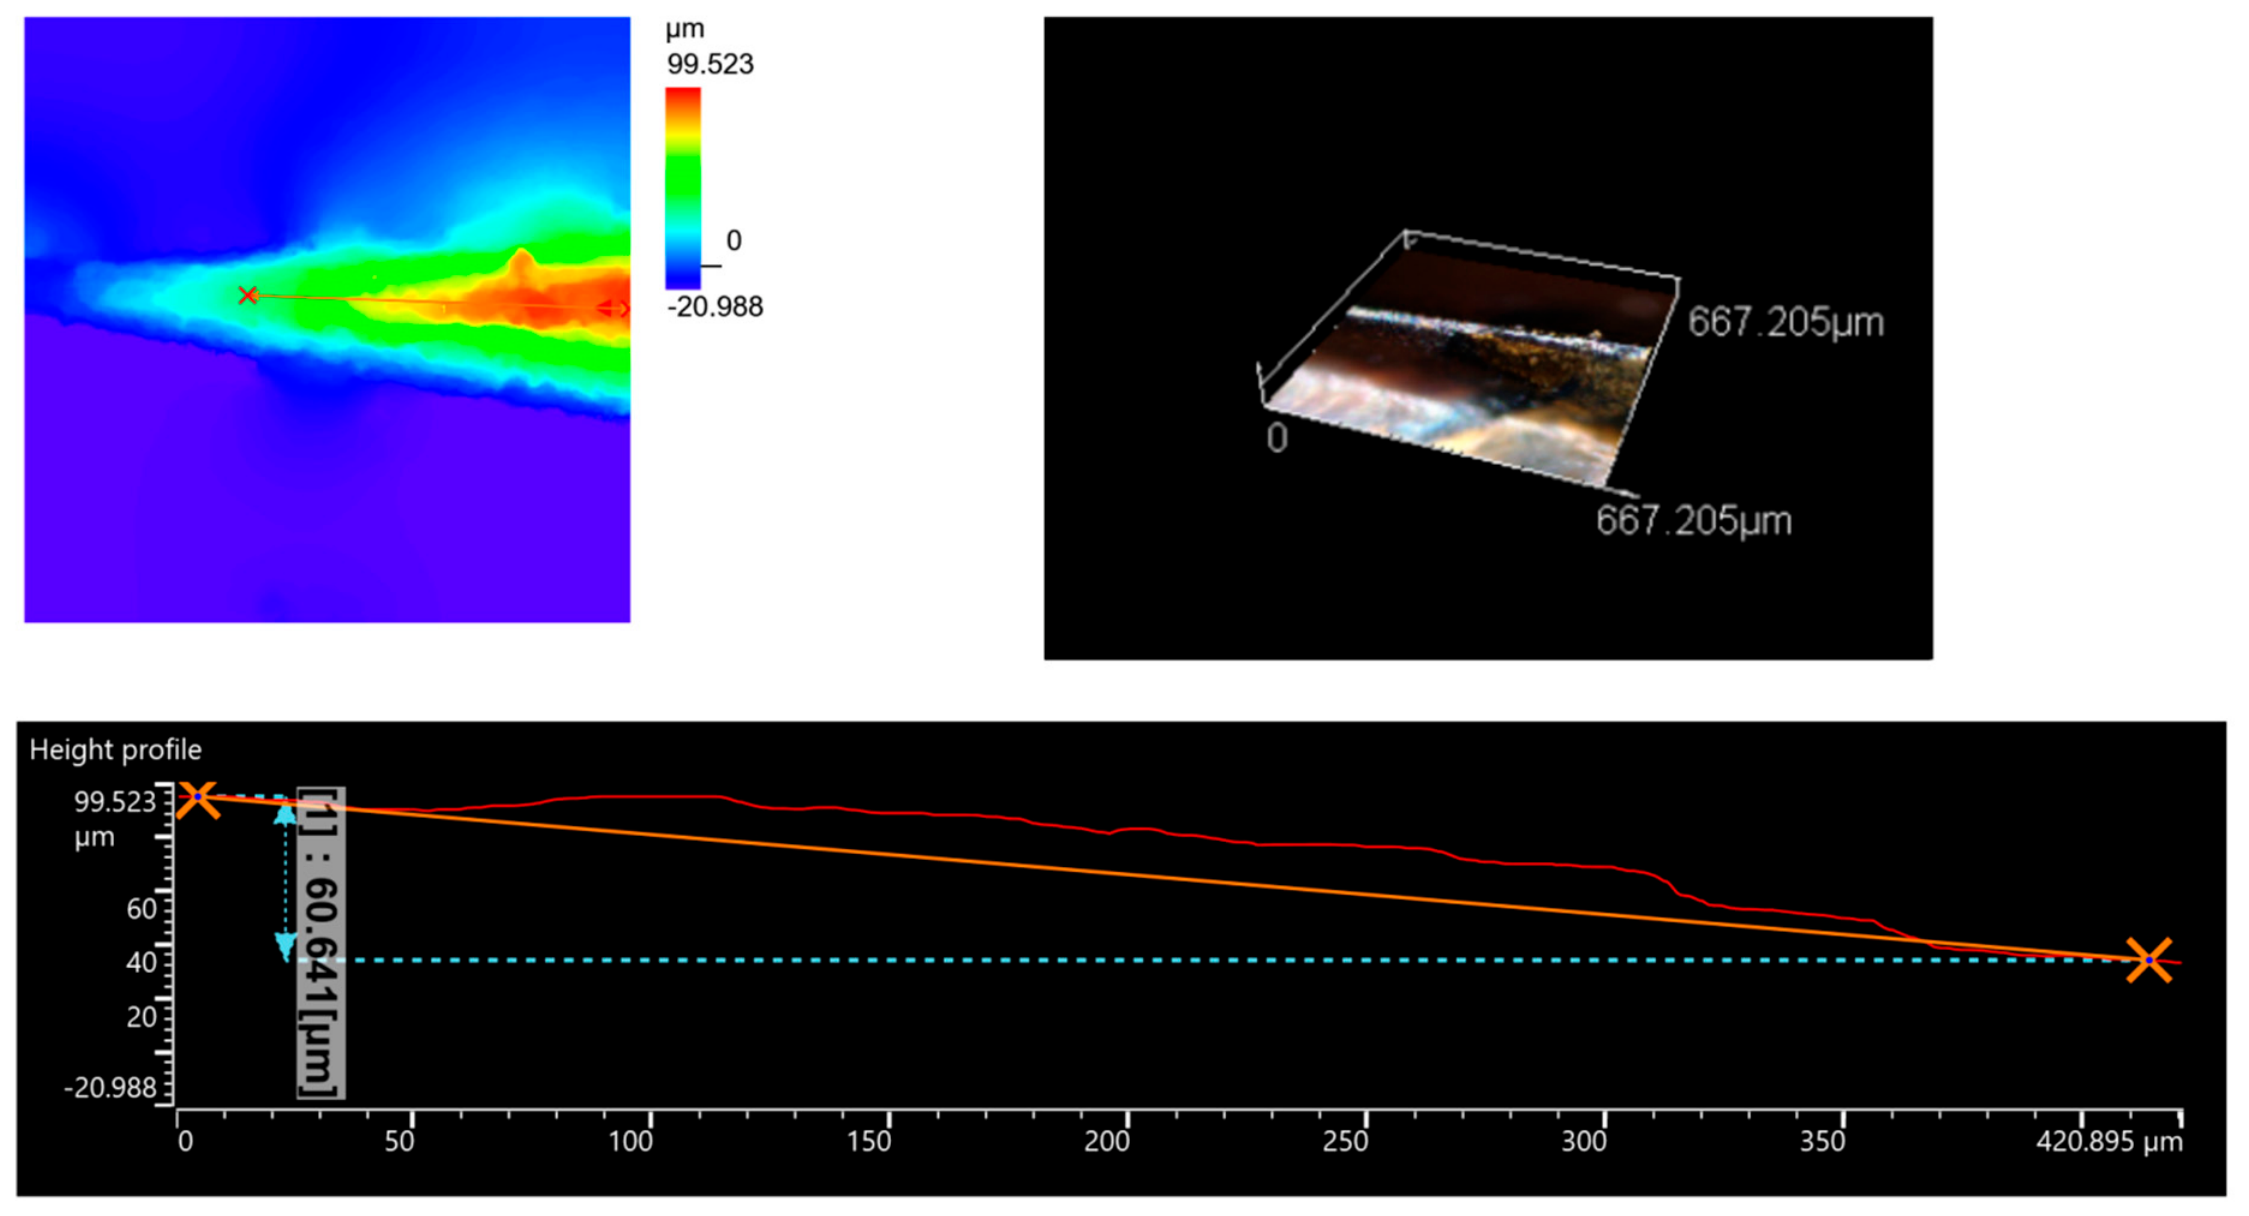
The confirmation experiment (wear scar shown in Figure 10) gave the following responses: Ra = 1.125 μm, T = 46.3 °C, and WD = 20.988 μm. Using the same normalization bounds as for the L9 data, the GRC values were calculated as 0.5696 for surface roughness, 0.9435 for cutting-zone temperature, and 0.9727 for tool wear depth. The resulting GRG was 0.8286. As summarized in Table 13, this experimental value is 4.36% higher than the analytical prediction and 15.39% higher than the highest GRG observed in the L9 array (Run 1, GRG = 0.7181). Because the GRG is a normalized, dimensionless multi-response index, an increase of 15.39% in GRG should not be interpreted as a 15.39% improvement of the machining process. In terms of the measured responses, relative to Run 1, the confirmation run reduced WD from 39.485 to 20.988 μm (−46.8%), increased Ra from 0.981 to 1.125 μm (+14.7%), and changed T from 45.1 to 46.3 °C (+1.2 °C, within the instrument accuracy of about ±2.5 °C at this temperature); the higher GRG is thus mainly due to the lower wear depth, obtained at the expense of a somewhat higher roughness. The confirmed GRG lies within the 95% confidence interval of the prediction and is thus consistent with the additive model; however, only one confirmation run was performed, so the repeatability of the optimum cannot be assessed (Section 3.10).
Figure 10.
DSX1000 wear-scar profile obtained at the optimal confirmation condition, V1f1Q2p2, with measured wear depth WD = 20.988 µm. Colors show height in µm; × markers and the orange line indicate the profile end points and line, and the dashed line is the reference level. The annotated 60.641 µm is the height difference between the end points, not WD.
Table 13.
Confirmation experiment at the three-response GRA optimum.
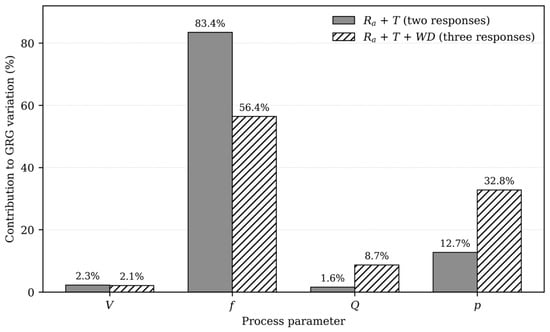
Figure 11 shows how the factor contributions depend on the response set. When considering only Ra and T, the feed rate accounts for 83.4% of the overall variation; however, its contribution drops to 56.4% after including tool wear. Conversely, the contribution of air pressure increases from 12.7% to 32.8%, and the contribution of MQL flow rate rises from 1.6% to 8.7%.
Figure 11.
Effect of response selection on factor contribution in Taguchi–GRA optimization.
3.8. Sensitivity of the Optimum to the GRA Weighting Scheme and to the Wear Metric
3.8.1. Weighting Scheme
In Equation (9), equal weights were assigned to Ra, T and WD. Since the optimum depends on the response set, it may also depend on the weights. To examine this, Equation (8) was generalized to the weighted form
where wk is the weight of response k, and the three-response analysis was repeated for eight weighting schemes: equal weights; three schemes in which one response has a weight of 0.50 and the other two 0.25; three schemes in which one response has a weight of 0.20 and the other two 0.40; and objective weights obtained by the entropy method applied to the normalized responses (w = 0.260, 0.485, and 0.255 for Ra, T and WD). The GRC values of Table 10 were used, and the preferred level of each factor was taken as the level with the highest mean GRC. Table 14 summarizes the results.
Table 14.
Sensitivity of the three-response optimum to the GRA weights.
As shown in Table 14, the preferred levels of feed rate (f1) and MQL flow rate (Q2) are the same in all eight schemes, i.e., Q2 replaces the Q1 of the two-response optimum irrespective of the weights. The preferred air pressure is p2 in seven of the eight schemes and changes to p1 only in scheme 3, in which the temperature has a weight of 0.50. The preferred cutting speed is V1 in six schemes and V3 when Ra has a weight of 0.50 or when Ra and WD are weighted 0.40 each (schemes 2 and 6); this is consistent with the very small effect of cutting speed on the mean GRG (Table 11). The equal-weight optimum V1f1Q2p2 is also obtained in schemes 4, 5, 7, and 8. When WD has the largest weight (scheme 4) or shares it with Ra (scheme 6), air pressure replaces feed rate as the factor with the largest contribution. The two-response optimum is likewise weight-dependent: weights of 0.7 and 0.3 for Ra and T give V3f1Q3p2 (identical to the Ra-only optimum), whereas 0.3 and 0.7 give the same result as equal weights. Hence, the shift in the preferred MQL flow rate when wear is included is robust with respect to the weights examined here, whereas the preferred cutting speed and, to a lesser degree, the air pressure are weight-dependent. The optimum should therefore be regarded as conditional on the weighting; when the priorities of a specific application are known, the weights should be set accordingly.
3.8.2. Wear Normalization by Cutting Length and Removed Volume
As noted in Section 2.5, the number of workpieces, the cutting length, and the removed volume differ among the runs. The number of workpieces machined in each run, N, was calculated from the machining time per workpiece tp of the program cycle (from 95 s at V = 31.4 m/min and f = 0.03 mm/rev to 12 s at V = 94.2 m/min and f = 0.09 mm/rev) as N = 2700/tp, rounded to the nearest integer (Table 15); the workpieces were not counted individually. The removed volume was calculated as Vrem = N Vw, where cm3 is the volume removed from one workpiece (D0 = 12 mm, D1 = D0 − 2ap = 11 mm, L = 30 mm), and the cutting length as Lc = Nπ DmL/f with a mean diameter Dm = 11.5 mm. For reference, the theoretical material removal rate was calculated as
where MRR is in cm3/min for V in m/min, f in mm/rev, and ap in mm. Since Vrem and Lc rest on the nominal geometry of the workpiece and on N calculated from the cycle time, they are approximate. Table 15 lists the resulting values together with WD normalized by Lc and by Vrem.
MRR = V f ap
Table 15.
Machining time per workpiece, number of workpieces, material removal rate, removed volume, cutting length, and normalized wear depth.
The ratio between Vrem and the product MRR × t is 0.64 to 0.72, i.e., about two-thirds of the cycle corresponds to material removal at the theoretical rate, the remainder presumably being used for cut-off, bar feeding, and approach motions. The ranking of the runs changes markedly when wear is expressed per unit cutting length or removed volume. Run 2 has the lowest absolute WD (20.402 μm), but Run 9 has the lowest wear per unit length (10.26 μm/km) and per unit volume (0.228 μm/cm3), whereas Run 3 is the worst on a length basis (62.94 μm/km) and Run 1 on a volume basis (2.602 μm/cm3). Table 16 shows the effect of the wear metric on the ANOVA of the wear-response S/N ratio and on the three-response GRA (same procedure and equal weights). The joint contribution of Q and p decreases from 93.8% for the absolute WD to 25.6% for WD/Lc and 16.2% for WD/Vrem; cutting speed becomes the dominant factor on a length basis (73.0%), and cutting speed (46.2%) and feed rate (37.6%) both contribute on a volume basis.
Table 16.
Effect of the wear metric on the ANOVA contributions of the wear response and on the three-response optimum.
Hence, the finding that WD is governed by the MQL parameters, and the resulting optimum, are conditional on the wear metric. When wear is normalized by the machined length or volume, the preferred cutting speed changes from V1 to V3, whereas f1 and p2 are unchanged, and Q2 is retained for the length basis but not for the volume basis. Under a fixed-time criterion, which is the one used in the present tests and is relevant when the tool is changed after a fixed operating time, the optimum V1f1Q2p2 remains the appropriate result. When tool consumption per unit of machined material is the relevant economic criterion, however, higher cutting speeds appear preferable within the tested range. This dependence on the wear definition is consistent with the main message of the paper—that the optimum depends on the responses considered—but it also means that the present optimum applies only under the fixed-time criterion; the normalized analyses were not verified by additional experiments.
3.9. Comparison with Previous Studies and Practical Implications
While the studies summarized in Table 17 illustrate the use of Taguchi–GRA for machining optimization under MQL conditions [12,13,16], the present study quantifies the effect of objective selection. Specifically, it compares the conventional two-response optimization (Ra + T) with a three-response framework that includes the tool wear depth after 45 min of machining (Ra + T + WD). The comparison shows that the MQL flow rate (Q) and air pressure (p)—parameters with little influence on the cutting-zone temperature and a smaller influence than V and f on surface roughness—emerge as important factors when tool degradation is considered. Consequently, expanding the response set shifts the optimal parameter configuration from V1f1Q1p1 to V1f1Q2p2. Saberi et al. [13] also reported a notable effect of the MQL pressure on tool wear in MQL milling (a reduction of up to 37.5%), although cutting speed was the dominant factor in their study. In the present study, by contrast, the wear depth was mainly associated with the MQL delivery parameters; because the wear depth and the flank-wear width describe different features of the wear scar, only this trend is compared. Tool-condition criteria should therefore be included in the optimization whenever tool life is economically important, since insert consumption and tool changes increase machining costs and downtime.
Table 17.
Comparison with representative Taguchi–GRA studies under MQL machining.
These findings also have practical implications for MQL turning of SAE 1215 MS steel within the tested range. First, the feed rate should be carefully controlled, as its strong influence on both surface roughness and measured cutting-zone temperature suggests that higher feed rates may increase roughness and temperature simultaneously. Second, the MQL delivery parameters should not simply be maximized; the observed intermediate optima indicate that the levels of 70 mL/h and 5 bar gave a lower wear depth than the maximum levels tested, although the underlying aerosol-penetration and tribofilm mechanisms were not investigated. Finally, the derived optimum (V1f1Q2p2) is valid for the fixed-time wear criterion, the tested range, and the assumption of negligible interactions; it should not be regarded as a universal standard for SAE 1215 MS.
Productivity and economic considerations. The three-response optimum was obtained at the lowest cutting speed and the lowest feed rate. Its material removal rate, MRR = 31.4 × 0.03 × 0.5 = 0.471 cm3/min, is the lowest of the L9 array and one-ninth of that of Run 9 (4.239 cm3/min). Correspondingly, the machining time per workpiece is the longest of the array (95 s versus 12 s in Run 9), so that only 28 workpieces are obtained in 45 min (about 37 per h), one-eighth of the 225 workpieces of Run 9 (about 300 per h). None of MRR, machining time, or production rate was included as a response, so the optimum minimizes roughness, measured temperature, and wear depth but is not an optimum in terms of productivity or cost. In high-volume automatic-lathe production, the cycle time per part directly affects cost. To illustrate the effect of a productivity criterion, the number of workpieces N was added as a fourth, larger-the-better response with equal weights; the preferred combination then became V3f1Q2p1 (best L9 run: Run 9), i.e., a higher cutting speed than in the three-response optimum. This illustration was not verified experimentally; a production-oriented optimization would require MRR or cycle time and tool cost in an economic model.
Position within sustainable manufacturing. Unlike tool-side approaches such as textured and CNT-filled tools [24,25,26], the present study varies the lubricant delivery; for a conventional untextured tool, wear is sensitive to the MQL delivery parameters. If textured surfaces retain and supply lubricant to the contact zone [24,25], the optimal flow rate and pressure could differ for textured tools, and combining MQL with textured tools could allow further reductions in wear, friction, and cutting-fluid consumption; this hypothesis was not tested here.
3.10. Limitations of the Study
The following limitations should be considered when interpreting the results. (i) Replications and statistics: no independent replications of the machining runs were performed, and the multiple readings of Ra and T are repeated measurements, not replications. Together with the two error degrees of freedom of the L9 design, this limits the reliability of the F-tests and of the percentage contributions, which are used here as relative indicators only (Section 3.5). (ii) Interactions: the L9 array estimates main effects only, and interactions are confounded with them. Interactions such as V × f (heat generation and wear) or Q × p (aerosol droplet size and transport) are physically plausible, so the reported effects are apparent main effects; a fractional or full factorial design (e.g., L27) would be needed to quantify them [31,32]. The agreement of the confirmation GRG with the additive prediction (Section 3.7) is consistent with, but does not prove, negligible interactions near the optimum. (iii) Wear metric: wear was quantified only by the maximum wear depth WD, a local extreme-value indicator; VB and VB,max were not recorded as responses, which limits direct comparison with other studies. (iv) Test basis: the wear comparison is based on a constant test duration; the normalized results of Section 3.8.2 rely on the number of workpieces calculated from the cycle time (not counted individually) and on the nominal workpiece geometry. (v) Temperature: the infrared measurement gives a relative indicator of the cutting-zone temperature, not the tool–chip interface temperature (Section 2.4.2); the readings were taken at the fifth minute of each 45-min test and therefore characterize an early stage of cutting, before most of the tool wear had accumulated. (vi) Surface characterization: only the two-dimensional parameter Ra was measured; areal parameters such as Sa (ISO 25178-2 [29]) and other aspects of surface integrity (residual stress, microhardness, microstructural change) were not investigated, so the results refer to surface roughness and not to surface integrity in the broad sense. (vii) Confirmation: only one confirmation run was performed, without repetitions, so the repeatability of the optimum cannot be assessed (Section 3.7). (viii) Mechanisms: no aerosol-jet or tribofilm measurements were made, so the mechanistic explanations remain hypotheses. (ix) Scope: the results are limited to one workpiece material, one insert grade, one lubricant, and the parameter ranges of Table 2.
4. Conclusions
This study examined the multi-objective optimization of MQL turning of SAE 1215 MS steel, employing the Taguchi–GRA framework to assess the effects of cutting and MQL delivery parameters. The main conclusions are as follows:
The investigated responses are mainly associated with different process parameters. While the feed rate was the dominant factor for both surface roughness and cutting-zone temperature (contributing 46.66% and 69.17% to their respective variances), the tool wear depth after 45 min of machining showed a different sensitivity: it was mainly associated with the MQL delivery parameters, with flow rate and air pressure jointly accounting for 93.76% of its variation (indicative values; Section 3.10). This difference indicates a limitation of relying solely on conventional surface and thermal metrics, motivating the integration of tool degradation into the optimization model.
The implementation of Taguchi–GRA shows that the identified optimum depends on the selected response set. The two-response optimization gave 31.4 m/min, 0.03 mm/rev, 50 mL/h, and 4 bar (V1f1Q1p1), whereas including the tool wear depth shifted the optimum to 31.4 m/min, 0.03 mm/rev, 70 mL/h, and 5 bar (V1f1Q2p2). Within the three-response model, the feed rate remains the most influential factor at 56.43%, followed by air pressure at 32.75%, MQL flow rate at 8.71%, and cutting speed at 2.12%. Sensitivity analyses showed that the preferred feed rate and MQL flow rate were the same under all eight weighting schemes, whereas the preferred cutting speed and air pressure depended on the weights; normalizing the wear depth by cutting length or removed volume changed the preferred cutting speed (and, on a volume basis, the MQL flow rate), so the optimum is also conditional on the wear metric.
With equal weights, including tool wear changes only the recommended MQL delivery conditions (from 50 mL/h and 4 bar to 70 mL/h and 5 bar), which indicates that optimization approaches that neglect tool consumption may produce recommendations that are less suitable for prolonging tool life under the fixed-time criterion used here.
A single confirmation experiment at the three-response optimum (V1f1Q2p2) gave Ra = 1.125 μm, T = 46.3 °C, and WD = 20.988 μm. The confirmed GRG was 0.8286, which is 4.36% higher than the predicted value (within the wide 95% confidence interval of the prediction) and 15.39% higher than that of the best L9 run. Relative to that run, the wear depth decreased by 46.8%, whereas Ra increased by 14.7%; the GRG increase should not be interpreted as an equivalent improvement of the manufacturing process.
Overall, these results provide a basis for parameter selection in MQL turning of SAE 1215 MS within the tested range. The findings show that Taguchi–GRA optimization depends on the response set (and on the weights and the wear metric), and including tool wear in the composite objective is advisable when tool life is a governing factor. The optimum is not a productivity optimum (it has the lowest material removal rate of the L9 array), and it was derived without interaction terms and without independent replications. Future work should include replicated or larger designs (e.g., L27), conventional VB/VB,max and areal Sa measurements, wear normalized by cutting length or volume, direct temperature measurement, aerosol and tribofilm characterization, and the combination of MQL with textured tools.
Author Contributions
Conceptualization, T.-A.B. and V.-H.P.; methodology, T.-A.B.; software, D.-T.P.; validation, D.-T.P., V.-H.P. and T.-A.B.; formal analysis, T.-A.B.; investigation, D.-T.P.; resources, D.-T.P.; data curation, D.-T.P.; writing—original draft preparation, D.-T.P.; writing—review and editing, T.-A.B. and V.-H.P.; visualization, V.-H.P.; supervision, T.-A.B.; project administration, T.-A.B.; funding acquisition, D.-T.P. All authors have read and agreed to the published version of the manuscript.
Funding
This research is funded by the Hanoi University of Science and Technology (HUST) under project number T2024-PC-021.
Institutional Review Board Statement
Not applicable.
Informed Consent Statement
Not applicable.
Data Availability Statement
The data presented in this study are available on request from the corresponding author.
Conflicts of Interest
The authors declare no conflicts of interest.
Abbreviations
The following abbreviations are used in this manuscript:
| ANOVA | Analysis of Variance |
| BUE | Built-Up Edge |
| CI | Confidence Interval |
| CNC | Computer Numerical Control |
| CNT | Carbon Nanotube |
| df | Degrees of Freedom |
| EDS | Energy-Dispersive X-ray Spectroscopy |
| GRA | Grey Relational Analysis |
| GRC | Grey Relational Coefficient |
| GRG | Grey Relational Grade |
| HB | Brinell Hardness |
| MQCL | Minimum Quantity Cooling Lubrication |
| MQL | Minimum Quantity Lubrication |
| MRR | Material Removal Rate |
| MS | Mean Square |
| PVD | Physical Vapor Deposition |
| SD | Standard Deviation |
| SEM | Scanning Electron Microscopy |
| S/N | Signal-to-Noise (ratio) |
| SS | Sum of Squares |
| WD | Wear Depth |
| XPS | X-ray Photoelectron Spectroscopy |
References
- Pham, D.-T.; Pham, V.-H.; Bui, T.-A. Experimental evaluation of surface roughness during turning of SAE 1215 MS steel on a CNC lathe using dry, flood, and MQL cooling. Surf. Rev. Lett. 2026, 2641002. [Google Scholar] [CrossRef] [Scilit]
- Davim, J.P. (Ed.) Surface Integrity in Machining; Springer: London, UK, 2010. [Google Scholar] [CrossRef] [Scilit]
- la Monaca, A.; Murray, J.W.; Liao, Z.; Speidel, A.; Robles-Linares, J.A.; Axinte, D.A.; Hardy, M.C.; Clare, A.T. Surface integrity in metal machining—Part II: Functional performance. Int. J. Mach. Tools Manuf. 2021, 164, 103718. [Google Scholar] [CrossRef] [Scilit]
- Fortes, R.C.; Pereira, I.C.; Guimarães, G.P.; Da Silva, M.B. A new experimental procedure for investigating built-up edge formation through chip analysis in AISI 1050 steel. Int. J. Adv. Manuf. Technol. 2025, 139, 869–877. [Google Scholar] [CrossRef] [Scilit]
- Demirpolat, H.; Binali, R.; Patange, A.D.; Pardeshi, S.S.; Gnanasekaran, S. Comparison of tool wear, surface roughness, cutting forces, tool tip temperature, and chip shape during sustainable turning of bearing steel. Materials 2023, 16, 4408. [Google Scholar] [CrossRef] [Scilit] [PubMed]
- Dhar, N.R.; Ahmed, M.T.; Islam, S. An experimental investigation on effect of minimum quantity lubrication in machining AISI 1040 steel. Int. J. Mach. Tools Manuf. 2007, 47, 748–753. [Google Scholar] [CrossRef] [Scilit]
- Salur, E.; Kuntoğlu, M.; Aslan, A.; Pimenov, D.Y. The effects of MQL and dry environments on tool wear, cutting temperature, and power consumption during end milling of AISI 1040 steel. Metals 2021, 11, 1674. [Google Scholar] [CrossRef] [Scilit]
- Krolczyk, G.M.; Maruda, R.W.; Krolczyk, J.B.; Wojciechowski, S.; Mia, M.; Nieslony, P.; Budzik, G. Ecological trends in machining as a key factor in sustainable production—A review. J. Clean. Prod. 2019, 218, 601–615. [Google Scholar] [CrossRef] [Scilit]
- Dhar, N.R.; Kamruzzaman, M.; Ahmed, M. Effect of minimum quantity lubrication (MQL) on tool wear and surface roughness in turning AISI-4340 steel. J. Mater. Process. Technol. 2006, 172, 299–304. [Google Scholar] [CrossRef] [Scilit]
- Jouini, N.; Yaqoob, S.; Ghani, J.A.; Mehrez, S. Tool wear effect on machinability and surface integrity in MQL and cryogenic hard turning of AISI 4340. Materials 2025, 18, 5423. [Google Scholar] [CrossRef] [Scilit] [PubMed]
- Debnath, S.; Reddy, M.M.; Yi, Q.S. Influence of cutting fluid conditions and cutting parameters on surface roughness and tool wear in turning process using Taguchi method. Measurement 2016, 78, 111–119. [Google Scholar] [CrossRef] [Scilit]
- Sarıkaya, M.; Güllü, A. Multi-response optimization of minimum quantity lubrication parameters using Taguchi-based Grey Relational Analysis in turning of difficult-to-cut alloy Haynes 25. J. Clean. Prod. 2015, 91, 347–357. [Google Scholar] [CrossRef] [Scilit]
- Saberi, M.; Niknam, S.A.; Hajaliakbari, A.; Davoodi, B.; Hashemi, R. Multi response optimization in MQL milling of GTD450 stainless steel using an integrated Taguchi grey relational analysis. Sci. Rep. 2025, 15, 43771. [Google Scholar] [CrossRef] [Scilit] [PubMed]
- Taguchi, G. Introduction to Quality Engineering: Designing Quality into Products and Processes; Asian Productivity Organization: Tokyo, Japan, 1986. [Google Scholar]
- Deng, J. Introduction to Grey System Theory. J. Grey Syst. 1989, 1, 1–24. [Google Scholar]
- Mustafic, A.; Lovric, S.; Nasic, E.; Halilovic, J.; Osmic, M.; Becirovic, D. Taguchi-based grey relational analysis of performance characteristics in the MQL turning process of X5CrNi18-10 steel. In Proceedings of the 13th International Scientific Conference MMA 2018—Flexible Technologies, Novi Sad, Serbia, 28–29 September 2018. [Google Scholar]
- Rooprai, R.S.; Singh, T.; Singh, M.; Rana, M.; Sharma, V.K.; Sharma, S. Multi-variable optimization for surface roughness and micro-hardness in MQL assisted face milling of EN31 steel using Taguchi based grey relational analysis. Mater. Today Proc. 2021, 43, 3144–3147. [Google Scholar] [CrossRef] [Scilit]
- Mia, M.; Dey, P.R.; Hossain, M.S.; Arafat, M.T.; Asaduzzaman, M.; Ullah, M.S.; Zobaer, S.M.T. Taguchi S/N based optimization of machining parameters for surface roughness, tool wear and material removal rate in hard turning under MQL cutting condition. Measurement 2018, 122, 380–391. [Google Scholar] [CrossRef] [Scilit]
- Mia, M.; Dhar, N.R. Optimization of surface roughness and cutting temperature in high-pressure coolant-assisted hard turning using Taguchi method. Int. J. Adv. Manuf. Technol. 2017, 88, 739–753. [Google Scholar] [CrossRef] [Scilit]
- Maruda, R.W.; Krolczyk, G.M.; Nieslony, P.; Wojciechowski, S.; Michalski, M.; Legutko, S. The influence of the cooling conditions on the cutting tool wear and the chip formation mechanism. J. Manuf. Process. 2016, 24, 107–115. [Google Scholar] [CrossRef] [Scilit]
- Sarıkaya, M.; Güllü, A. Taguchi design and response surface methodology based analysis of machining parameters in CNC turning under MQL. J. Clean. Prod. 2014, 65, 604–616. [Google Scholar] [CrossRef] [Scilit]
- Fratila, D.M.; Caizar, C. Application of Taguchi method to selection of optimal lubrication and cutting conditions in face milling of AlMg3. J. Clean. Prod. 2011, 19, 640–645. [Google Scholar] [CrossRef] [Scilit]
- Abellán-Nebot, J.V.; Vila Pastor, C.; Siller, H.R. A review of the factors influencing surface roughness in machining and their impact on sustainability. Sustainability 2024, 16, 1917. [Google Scholar] [CrossRef] [Scilit]
- Ribeiro, F.S.F.; Lopes, J.C.; Bianchi, E.C.; de Angelo Sanchez, L.E. Applications of texturization techniques on cutting tools surfaces—A survey. Int. J. Adv. Manuf. Technol. 2020, 109, 1117–1135. [Google Scholar] [CrossRef] [Scilit]
- Ribeiro, F.S.F.; Javaroni, R.L.; Lopes, J.C.; Bianchi, E.C.; de Angelo Sanchez, L.E. Machining behavior using micro-grooved cutting tools filled with carbon nanotubes. Tribol. Int. 2024, 192, 109297. [Google Scholar] [CrossRef] [Scilit]
- Ribeiro, F.S.F.; Iavarone, R.L.; de Souza Rodrigues, M.; Lopes, J.C.; Bianchi, E.C.; de Angelo Sanchez, L.E. Sustainable improvement in dry turning using micro-grooved tools filled with carbon nanotubes: Performance evaluation and environmental impacts. Wear 2025, 578–579, 206149. [Google Scholar] [CrossRef] [Scilit]
- AZoM. AISI 1215 Carbon Steel (UNS G12150). Available online: https://www.azom.com/article.aspx?ArticleID=6603 (accessed on 22 September 2026).
- ISO 3685:1993; Tool-Life Testing with Single-Point Turning Tools. International Organization for Standardization: Geneva, Switzerland, 1993.
- ISO 25178-2:2021; Geometrical Product Specifications (GPS)—Surface Texture: Areal—Part 2: Terms, Definitions and Surface Texture Parameters. International Organization for Standardization: Geneva, Switzerland, 2021.
- Davies, M.A.; Ueda, T.; M’Saoubi, R.; Mullany, B.; Cooke, A.L. On the measurement of temperature in material removal processes. CIRP Ann. 2007, 56, 581–604. [Google Scholar] [CrossRef] [Scilit]
- Montgomery, D.C. Design and Analysis of Experiments, 9th ed.; Wiley: Hoboken, NJ, USA, 2017. [Google Scholar]
- Roy, R.K. A Primer on the Taguchi Method, 2nd ed.; Society of Manufacturing Engineers: Dearborn, MI, USA, 2010. [Google Scholar]

Disclaimer/Publisher’s Note: The statements, opinions and data contained in all publications are solely those of the individual author(s) and contributor(s) and not of MDPI and/or the editor(s). MDPI and/or the editor(s) disclaim responsibility for any injury to people or property resulting from any ideas, methods, instructions or products referred to in the content. |
© 2026 by the authors. Licensee MDPI, Basel, Switzerland. This article is an open access article distributed under the terms and conditions of the Creative Commons Attribution (CC BY) license.