


Abstract
The following abbreviations are used: acoustic borehole televiewer (ABI40), uniaxial compressive strength (UCS), factor of safety (FoS), two-dimensional finite-element program RS2, and three-dimensional finite-element program RS3. The stability of deep open-pit slopes is governed by structural heterogeneity, rock-strength variability, and hydrogeological conditions. This study develops a multi-level geotechnical-domain framework and assesses the design slopes at the Vasilkovskoye gold deposit by cross-validating structural-kinematic, limit-equilibrium, and numerical methods. The database comprises two oriented geotechnical boreholes, GA-01 and GA-02, drilled to 753 and 713 m, ABI40 data, and laboratory testing, including 61 uniaxial compression, 30 triaxial, and 50 Brazilian tensile tests. Dips, RocPlane, SWedge, Slide, RS2, and RS3 were applied at bench, inter-ramp, and overall-slope scales. UCS ranges from 4.11 to 247.27 MPa in quartz diorite and from 1.11 to 278.76 MPa in granodiorite. Deteriorating drainage reduced FoS from 2.80 to 1.75 (37.5%) in quartz/mixed diorite and from 2.64 to 1.63 (38.3%) in granodiorite. For the Sector 2 planar mechanism, RocPlane and RS2 yielded FoS values of 1.60 and 1.80. For unweathered rock, sector-specific bench face angles of 70–80° and inter-ramp slope angles of 53.8–60.0° were justified, whereas weathered zones require flatter geometry. In engineering practice, these values are screening-level, site-specific parameters rather than transferable design angles: implementation requires sector-specific kinematic checks, drainage verification, piezometric control, and deformation monitoring. The framework provides a scale-dependent basis for prioritizing structural control at bench scale, domain strength and geometry at inter-ramp scale, and groundwater management at overall-slope scale.
1. Introduction
The Vasilkovskoye gold deposit is located in Akmola Region, Republic of Kazakh-stan, approximately 20 km northwest of Kokshetau. The deposit was discovered in 1963; open-pit mining began in 1980, and the current stage of pit operation commenced in 2009.
The open pit is approximately circular, with a diameter of about 1300 m; its current depth is about 187.5 m, and the average overall slope angle is approximately 44°. Contin-ued deepening increases the influence of major faults, jointing, weathering, and pore pressure, thereby raising the requirements for reliable geotechnical justification.
Modern design of deep open-pit slopes requires accounting for spatial variability in mechanical properties, structural anisotropy, and rock-mass heterogeneity rather than relying on one deterministic parameter set [1,2,3,4]. Geotechnical domainization links drilling, laboratory testing, and structural mapping to sector-specific design parameters. In jointed rock slopes, discontinuity orientation governs potential planar, wedge, and block failure mechanisms [5,6], while comparison of limit-equilibrium and finite-element methods provides an independent check of modeling assumptions [7].
Hydrogeological conditions are an independent stability factor: increasing pore pressure reduces effective stress and the factor of safety [8]. For complex geometries, major faults, and spatially variable contacts, 3D verification is also required because two-dimensional sections do not always reproduce the actual failure mechanism [9,10,11,12]. Experience from the Aktogay open pit in Kazakhstan confirms the value of combining 3D analysis, numerical modeling, and regular updating of the geotechnical model [13].
Despite advances in these approaches, published studies commonly address geotechnical domainization, structural-kinematic analysis, hydrogeological sensitivity, and 2D/3D model cross-validation as separate tasks. The research gap addressed here is the lack of an integrated multi-level framework that links these factors, using a common geotechnical database, to the scale of potential failure—from an individual bench to the overall slope of a deep gold open pit.
The objective of this study is to develop and test such a framework for the Vasilkovskoye deposit, quantify the sensitivity of rock domains to deterioration in drainage conditions, and assess the consistency of structural-kinematic, limit-equilibrium, 2D, and 3D numerical methods.
The novelty of the study lies in establishing a scale-dependent hierarchy of governing stability factors: discontinuity orientation dominates at bench scale, the integral properties of the geotechnical domain and slope geometry govern at inter-ramp scale, and hydrogeo-logical conditions dominate at overall-slope scale. Quantitatively, this framework is sup-ported by the agreement between FoS = 1.60 and 1.80 from RocPlane and RS2 for the planar mechanism and by an approximately 38% reduction in overall stability under deteriorated drainage conditions in two rock domains. The approach therefore shifts the assessment from a single FoS toward domain- and sector-based evaluation and spatially differentiated geotechnical risk management.
2. Materials and Methods
2.1. Study Site and Oriented Geotechnical Drilling
The study site is the Vasilkovskoye gold deposit in Akmola Region, Republic of Kazakhstan, approximately 20 km northwest of Kokshetau. The pit is characterized by a complex intrusive setting; the principal rock types are granodiorite, quartz diorite, and gabbro–diorite. Two oriented geotechnical boreholes, GA-01 and GA-02, were drilled to investigate the rock mass at the planned deeper horizons.
The main parameters of the oriented geotechnical boreholes GA-01 and GA-02, used to obtain structural and geotechnical data for the Vasilkovskoye rock mass, are summarized in Table 1.
Table 1.
Main parameters of the geotechnical boreholes.
2.2. Geotechnical Core Logging and Laboratory Testing
Drilling was performed using a wireline core barrel with core orientation. Geotechnical logging included lithology, color, texture, mineralogical composition, discontinuity orientation, roughness and aperture, infill type, core recovery, Rock Quality Designation (RQD), fracture intensity, degree of weathering, and strength assessment. An ABI40 acoustic televiewer was used to refine the spatial orientation of joints and fractures. Structural interpretation accounted for the true azimuth and dip of the recorded discontinuities.
The laboratory program focused on granodiorite and quartz diorite and included both strength and deformation tests. Particular attention was given to weakened, weathered, fractured, and hydrothermally altered zones.
A comprehensive laboratory testing program was conducted to quantify the physical, mechanical, and deformation properties of the principal lithological units. The number and distribution of tests for boreholes GA-01 and GA-02 are presented in Table 2.
Table 2.
Scope of laboratory testing.
The measured values show pronounced variability in rock-mass mechanical properties. Uniaxial compression testing identified both strongly weakened specimens with UCS values of approximately 1–10 MPa and strong specimens with UCS values exceeding 200 MPa. This variability confirms the need to replace a single averaged property set with geotechnical domainization.
2.3. Geotechnical Domainization
Geotechnical domainization considered lithology, weathering and alteration, fracture intensity and orientation, UCS, deformation characteristics, and hydrogeological and structural features. Three broad rock groups were defined for design analysis: strongly weathered material in the upper rock mass, quartz/mixed diorite, and granodiorite. In this manuscript, bench slope denotes one bench face and its bounding berms; inter-ramp slope denotes the continuous wall between two principal ramps or major berms and may comprise several benches; overall slope denotes the complete wall from crest to toe, including all benches, berms, and ramps. The term pit slope is used only as a generic collective term and not as a separate calculation scale.
Domains were defined from coincident changes in lithology, weathering and alteration, RQD and fracture intensity, discontinuity orientation and condition, UCS and deformation behavior, and hydrogeological or major-structure boundaries. Breaks in the cumulative fracture-intensity curves provided an independent depth-based check. Domain boundaries were accepted only when supported by more than one indicator, thereby avoiding subdivision from a single anomalous test.
GA-01 and GA-02 provide deep oriented intersections through the principal quartz diorite and granodiorite units and are adequate for developing representative vertical parameter profiles at the investigated locations, but two boreholes cannot demonstrate complete spatial representativeness of the full 630 m, three-dimensional pit wall. Extrapolation between boreholes was constrained by the existing geological wireframes, mapped major faults, historical exposure observations, and lithological contacts; it remains an interpretive engineering model rather than a statistically exhaustive characterization. The resulting domains and slope parameters should therefore be treated as sector-specific design hypotheses requiring confirmation by additional oriented drilling, face mapping, hydrogeological testing, and monitoring as mining advances.
2.4. Stability Analysis Framework
The analysis framework followed a sequence of increasing complexity, from kinematic assessment of structural conditions to two-dimensional and three-dimensional modeling. This approach enabled comparison of independent methods.
Software selection followed the failure mechanism and required analysis scale. Dips was selected for stereographic processing and kinematic screening of discontinuity orientations; RocPlane (Rocscience Inc., Toronto, ON, Canada) for transparent force-equilibrium analysis of a prescribed planar block; SWedge for three-dimensional wedge geometry and failure probability; Slide for searched limit-equilibrium surfaces at inter-ramp and overall-slope scales; RS2 for two-dimensional stress-deformation analysis and shear-strength reduction; and RS3 for spatial verification where pit curvature, faults, and lithological contacts cannot be represented adequately in a single section. Results were not averaged or treated as numerically interchangeable. They were compared hierarchically by predicted mechanism, location of the critical zone, response to groundwater deterioration, and stability ranking. Quantitative values were compared only between models representing the same geometry and scenario, and differences were interpreted in light of dimensionality, constitutive model, and failure criterion.
The influence of water was evaluated under three hydrogeological states. Scenario A represents a dry rock mass, Scenario B accounts for natural groundwater drawdown, and Scenario C represents very slow drainage. Sensitivity was evaluated using the factor of safety (FoS) and the relative reduction ΔFoS = (FoS_A − FoS_i)/FoS_A × 100%, where FoS_A corresponds to the dry scenario and FoS_i is the value for the hydrogeological state under consideration.
A set of complementary structural-kinematic, limit-equilibrium, and numerical methods was applied for the integrated assessment of open-pit slope stability; their purposes and software packages are summarized in Table 3.
Table 3.
Methods used for slope stability analysis.
2.5. Rock-Mass and Discontinuity Parameterization
To ensure traceability, the parameters used in this study are classified into three categories. Measured or directly observed parameters comprise laboratory results and geological or structural observations, including UCS, density, discontinuity orientation, and logged discontinuity condition. Adopted or assumed design parameters comprise representative domain-scale values selected from the observed ranges or assigned where direct measurement was unavailable, including design persistence, some JCS values, equivalent friction parameters, and hydraulic-conductivity ranges. Numerical model inputs comprise the values entered into Slide, RS2, and RS3 after conversion or assignment within the selected constitutive and boundary-condition frameworks, including equivalent Mohr–Coulomb parameters, interface stiffnesses, phreatic surfaces, pore-pressure ratios, and drainage boundary conditions. A calculated FoS, SRF, displacement, strain, or pore-pressure field is a model output and is not treated as a measured geological parameter.
Terminology is used consistently according to the level of evidence. Fracture initiation, propagation, and coalescence are stated only for experiments or discontinuity-resolving models that explicitly reproduce these processes; the present continuum RS2 and RS3 results are described as shear-strain localization or development of a potential failure zone. Stability assessment denotes the integrated engineering evaluation, whereas FoS or SRF calculation denotes a method-specific result. Comparisons among Slide, RS2, and RS3 are described as numerical verification or cross-method consistency; field validation is reserved for calibration against measured pore-pressure and deformation data.
The Geological Strength Index (GSI) is used below to characterize rock-mass structure and discontinuity-surface condition. Design parameters were assigned from oriented-core geotechnical logging and laboratory results for each geotechnical domain. Discontinuity parameters included orientation, joint roughness coefficient (JRC), joint-wall compressive strength (JCS), basic friction angle φb, persistence, available trace-length information, and infill condition; rock-mass parameters included lithology, weathering, GSI, density, and strength. Because borehole intersections do not expose full discontinuity traces, trace length could not be measured directly from the core and was therefore reported as unavailable, together with the design persistence values adopted in the numerical models. Infill was logged qualitatively. In the weathered Domain 1 intervals, it consisted mainly of weathering products and locally clay-coated surfaces; however, infill thickness was not consistently quantified. Where JCS was not measured directly, the original project-model relationship JCS = 0.25·UCS was adopted and treated as a source of parametric uncertainty.
2.6. Kinematic and Limit-Equilibrium Analysis
Kinematic assessment was based on joint-set orientation relative to the dip direction of each design sector. Dips was used for stereographic interpretation, RocPlane for planar sliding, SWedge for wedge mechanisms, and Slide for inter-ramp slope and overall-slope checks using the limit-equilibrium method. Analyses were performed by sector because changes in slope azimuth alter the kinematic compatibility of the same discontinuity sets.
2.7. Numerical Modeling in RS2 and RS3
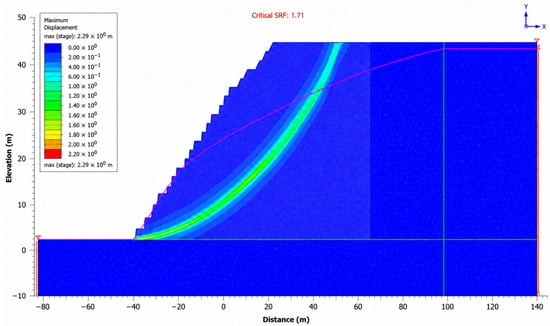
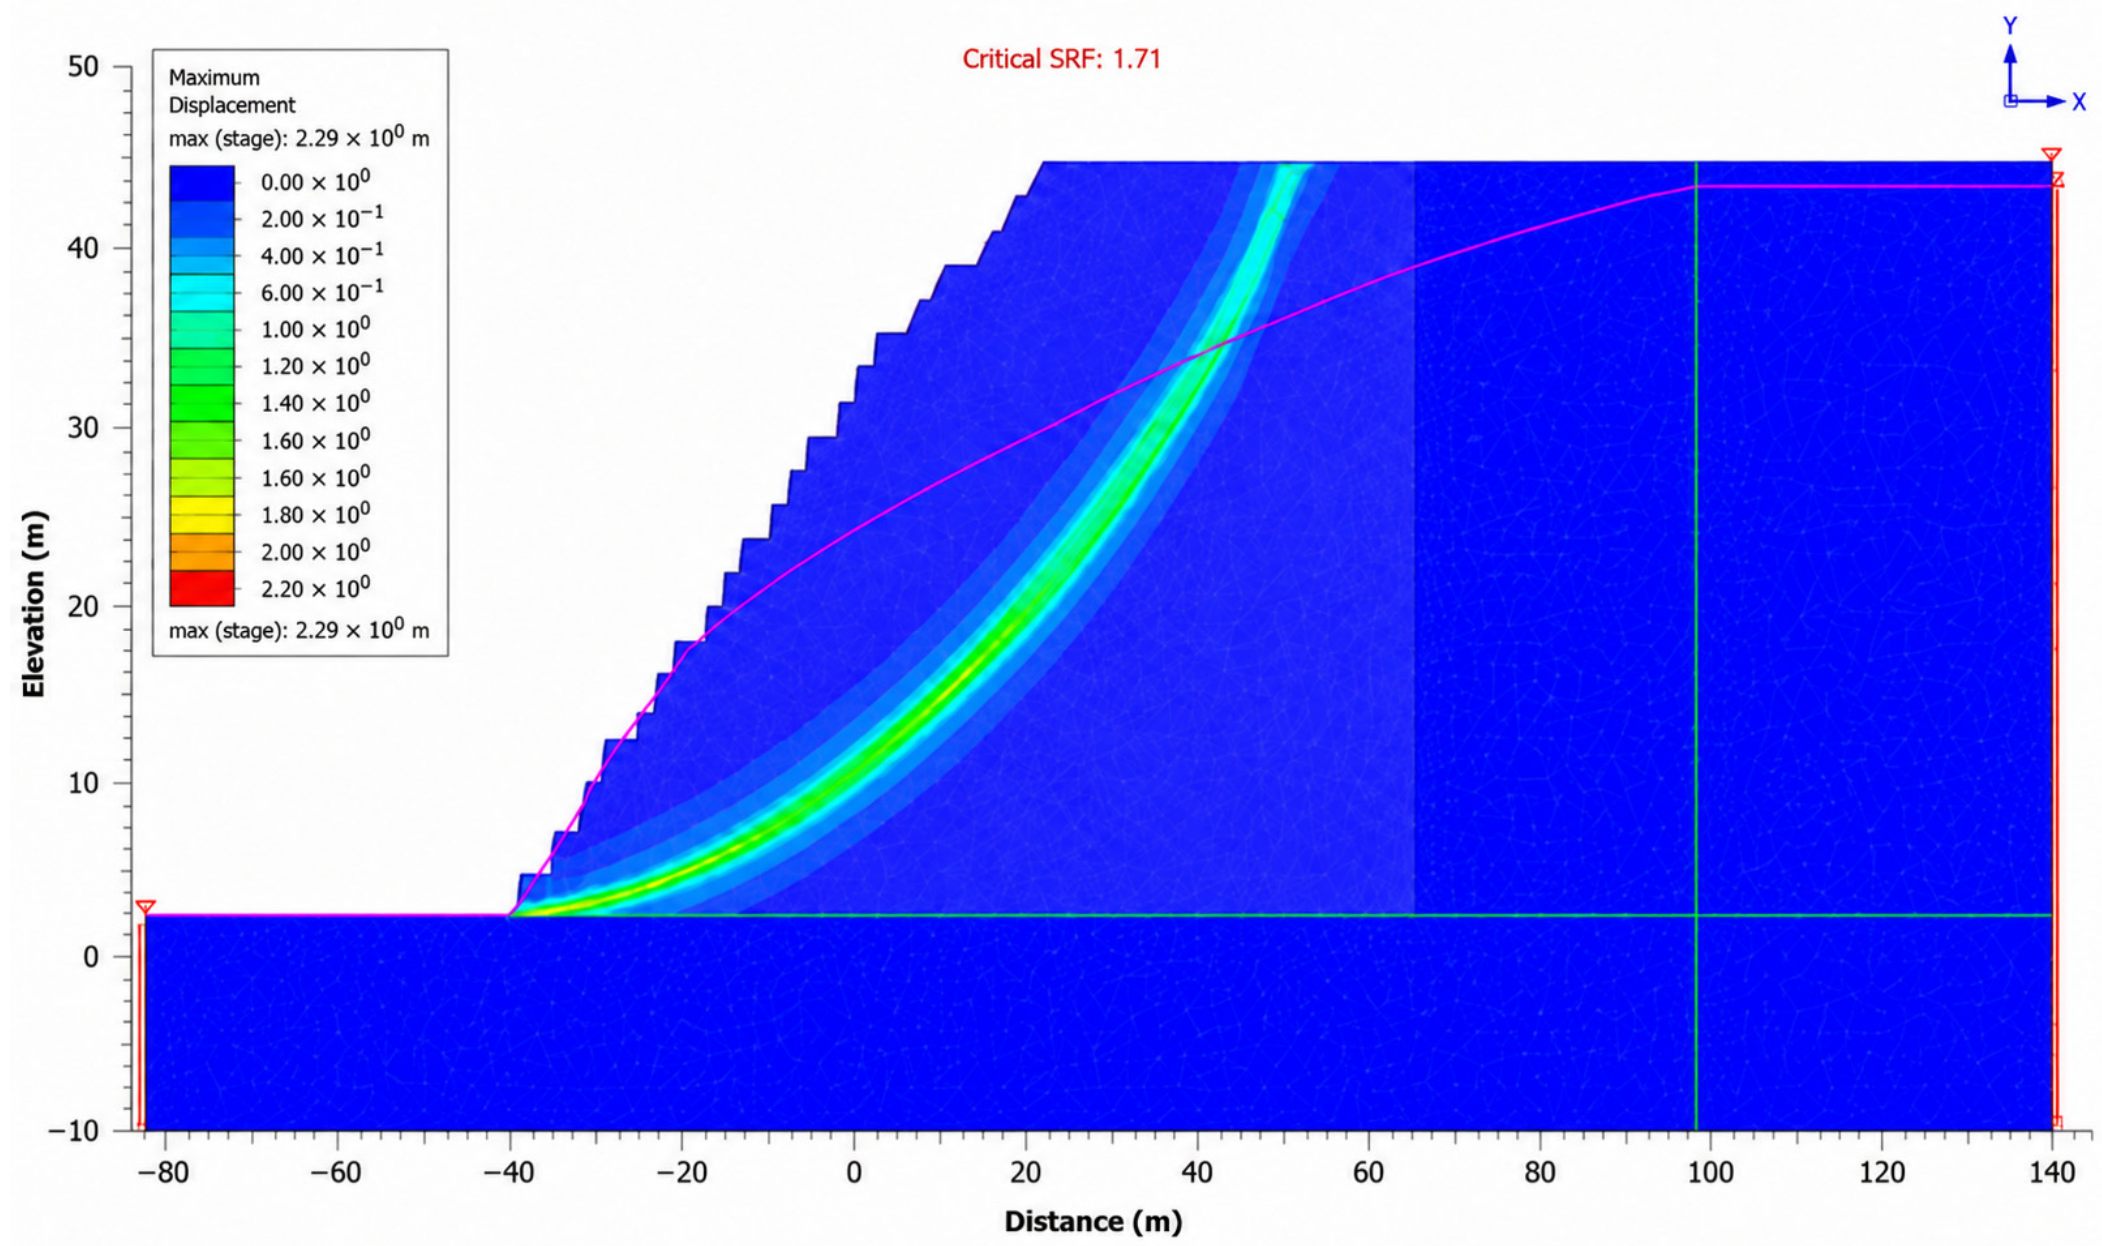
Two-dimensional RS2 models were used to evaluate deformation and stability in representative sections, including structurally controlled and deep-seated mechanisms. Stability was assessed by the shear-strength-reduction method (SSR/SRF), with critical SRF interpreted as the numerical analogue of FoS. Six-noded triangular finite elements were used with a graded mesh: the nominal element size was approximately 10 m in the far field and was locally refined to approximately 2–3 m around benches, major structures, material contacts, and anticipated localization zones. Mesh adequacy was checked by one further refinement; the critical SRF changed by less than 1%. Iterations were continued until the RS2 force-and-energy convergence tolerance of 1 × 10⁻³ was satisfied, with a maximum of 500 iterations per reduction step. For every representative section, the lateral and basal boundaries were positioned at least two slope heights from the crest, toe, or anticipated failure zone and, where geometry allowed, approximately three slope heights away; thus, all models satisfied the recommended 2–3 H offset. RS3 provided independent verification of the spatial geometry of the pit shell and major structures. Two- and three-dimensional results were compared by deformation-localization pattern and integral stability interpretation rather than as mathematically identical problems.
For reproducibility, the Slide, RS2, and RS3 configurations are defined as follows. The reference overall-slope sections were 630 m high, with inter-ramp slope angles of 60.0° for quartz/mixed diorite and 57.6° for granodiorite. Individual benches were 30 m high. Weathered-rock benches used a 60° face angle and 7 m berm; unweathered sectors used 70–80° face angles and 11–13 m berms. The analyzed geometry was imported from the same design surface in all three programs so that crest, toe, berm, ramp, lithological-contact, and major-fault positions were consistent.
Slide analyses used the Morgenstern–Price limit-equilibrium formulation with half-sine interslice–force function, automatic searching of circular and non-circular surfaces, a minimum of 30 slices, and force and moment convergence tolerance of 1 × 10⁻³. The lower boundary followed competent rock below the potential failure zone; lateral limits extended at least 2 H from the crest and toe. Rock-mass shear strength was represented by equivalent Mohr–Coulomb parameters derived for each geotechnical domain over the stress range relevant to the corresponding slope scale. Discontinuities and faults were represented using Mohr–Coulomb shear strength with the specified friction and persistence parameters. Pore pressures were imported from the scenario-specific groundwater field described in Section 2.8.
RS2 used an elastic-perfectly plastic generalized Hoek–Brown rock-mass model, with equivalent Mohr–Coulomb parameters used only for cross-checking against Slide. Explicit major structures used a joint interface model governed by normal stiffness, shear stiffness, cohesion, friction angle, JRC-JCS roughness correction where applicable, and residual strength after slip. Horizontal displacement was fixed at the vertical side boundaries; vertical and horizontal displacement were fixed at the base; the ground surface was stress free. Gravity loading preceded groundwater initialization and shear-strength reduction. During SSR, rock-mass and discontinuity shear strengths were reduced by the same trial factor until non-convergence and a continuous maximum-shear-strain band indicated failure; bracket refinement continued until the critical SRF was resolved to 0.01.
RS3 used the same lithological domains, generalized Hoek–Brown rock-mass formulation, discontinuity strength sets, unit weights, and groundwater scenarios as RS2. Ten-noded tetrahedral elements were graded from approximately 25 m in the far field to 5–10 m near the pit wall, faults, lithological contacts, and the expected localization zone. Lateral and basal boundaries were at least 2 H from the design wall; normal displacement was restrained on vertical boundaries and all translational components were restrained at the base. The critical 3D state was identified from the converged SRF, formation of a continuous shear-strain localization zone, displacement acceleration between successive reduction stages, and kinematic connection of the zone to the slope surface. These criteria distinguish numerical instability from isolated elastic deformation.
2.8. Hydrogeological Scenarios and Interpretation Criteria
Groundwater effects were evaluated using three scenarios defined for this study: A—dry rock mass; B—natural groundwater drawdown; and C—very slow drainage. FoS was used as the primary comparative indicator, while water sensitivity was additionally characterized by the relative reduction ΔFoS = (FoS_A − FoS_i)/FoS_A × 100%. This representation enables comparison of the response of different geotechnical domains independently of their initial stability margin.
The three hydrogeological scenarios were implemented as explicitly different model states. Scenario A (dry reference) assigned zero-gauge pore pressure to the slope and suppressed groundwater loading; it is a numerical reference rather than a claim that the rock mass is completely dry. Scenario B (natural drawdown) used a phreatic surface declining from the rear of the wall toward the pit drainage elevation. Below this surface, pore pressure increased hydrostatically with depth and was reduced toward the exposed slope face; the representative pore-pressure ratio ru was approximately 0.10–0.20 in the potential failure zone. Scenario C (very slow drainage) retained a higher phreatic surface and slower dissipation, producing near-hydrostatic pressure over a larger part of the potential failure zone, with representative ru approximately 0.25–0.35.
Permeability was not measured comprehensively in GA-01 and GA-02. Therefore, the seepage inputs are modeling assumptions used for sensitivity analysis, not calibrated site measurements. Representative isotropic hydraulic conductivities were 1 × 10⁻⁶ m/s for strongly weathered or intensely fractured material, 1 × 10⁻⁸ m/s for relatively intact quartz/mixed diorite and granodiorite, and 1 × 10⁻⁶ to 1 × 10⁻⁵ m/s for major faults and drainage pathways. Scenario B assumed functioning slope drainage and a steady drawdown boundary at the pit face. Scenario C reduced effective drainage capacity by one order of magnitude and retained the elevated initial phreatic surface; it is therefore termed very slow drainage.
Scenario C is not a strictly undrained constitutive calculation. The earlier use of the word undrained referred informally to negligible pressure dissipation during the analyzed period and has been removed. Throughout the revised manuscript, Scenario C is described consistently as a very-slow-drainage seepage condition with low dissipation and elevated pore pressure. No undrained total-stress strength parameters were used.
3. Results
3.1. Hydrogeological Sensitivity of the Overall Slope
The calculations show a systematic decrease in factor of safety as drainage conditions deteriorate. This trend is particularly clear for the 630 m high design slopes.
Overall-slope stability results for the different hydrogeological conditions and rock domains are presented in Table 4.
Table 4.
Factors of safety for overall-slope design scenarios.
For quartz/mixed diorite, the transition from the dry scenario to very slow drainage reduces FoS from 2.80 to 1.75, or by approximately 37.5%. For granodiorite, the corresponding decrease is from 2.64 to 1.63, or approximately 38.3%. These results identify hydrogeological conditions as one of the key controllable factors governing stability.
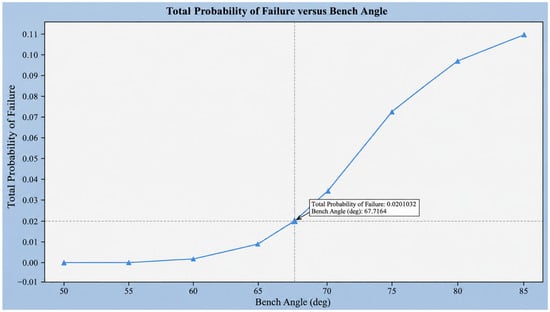
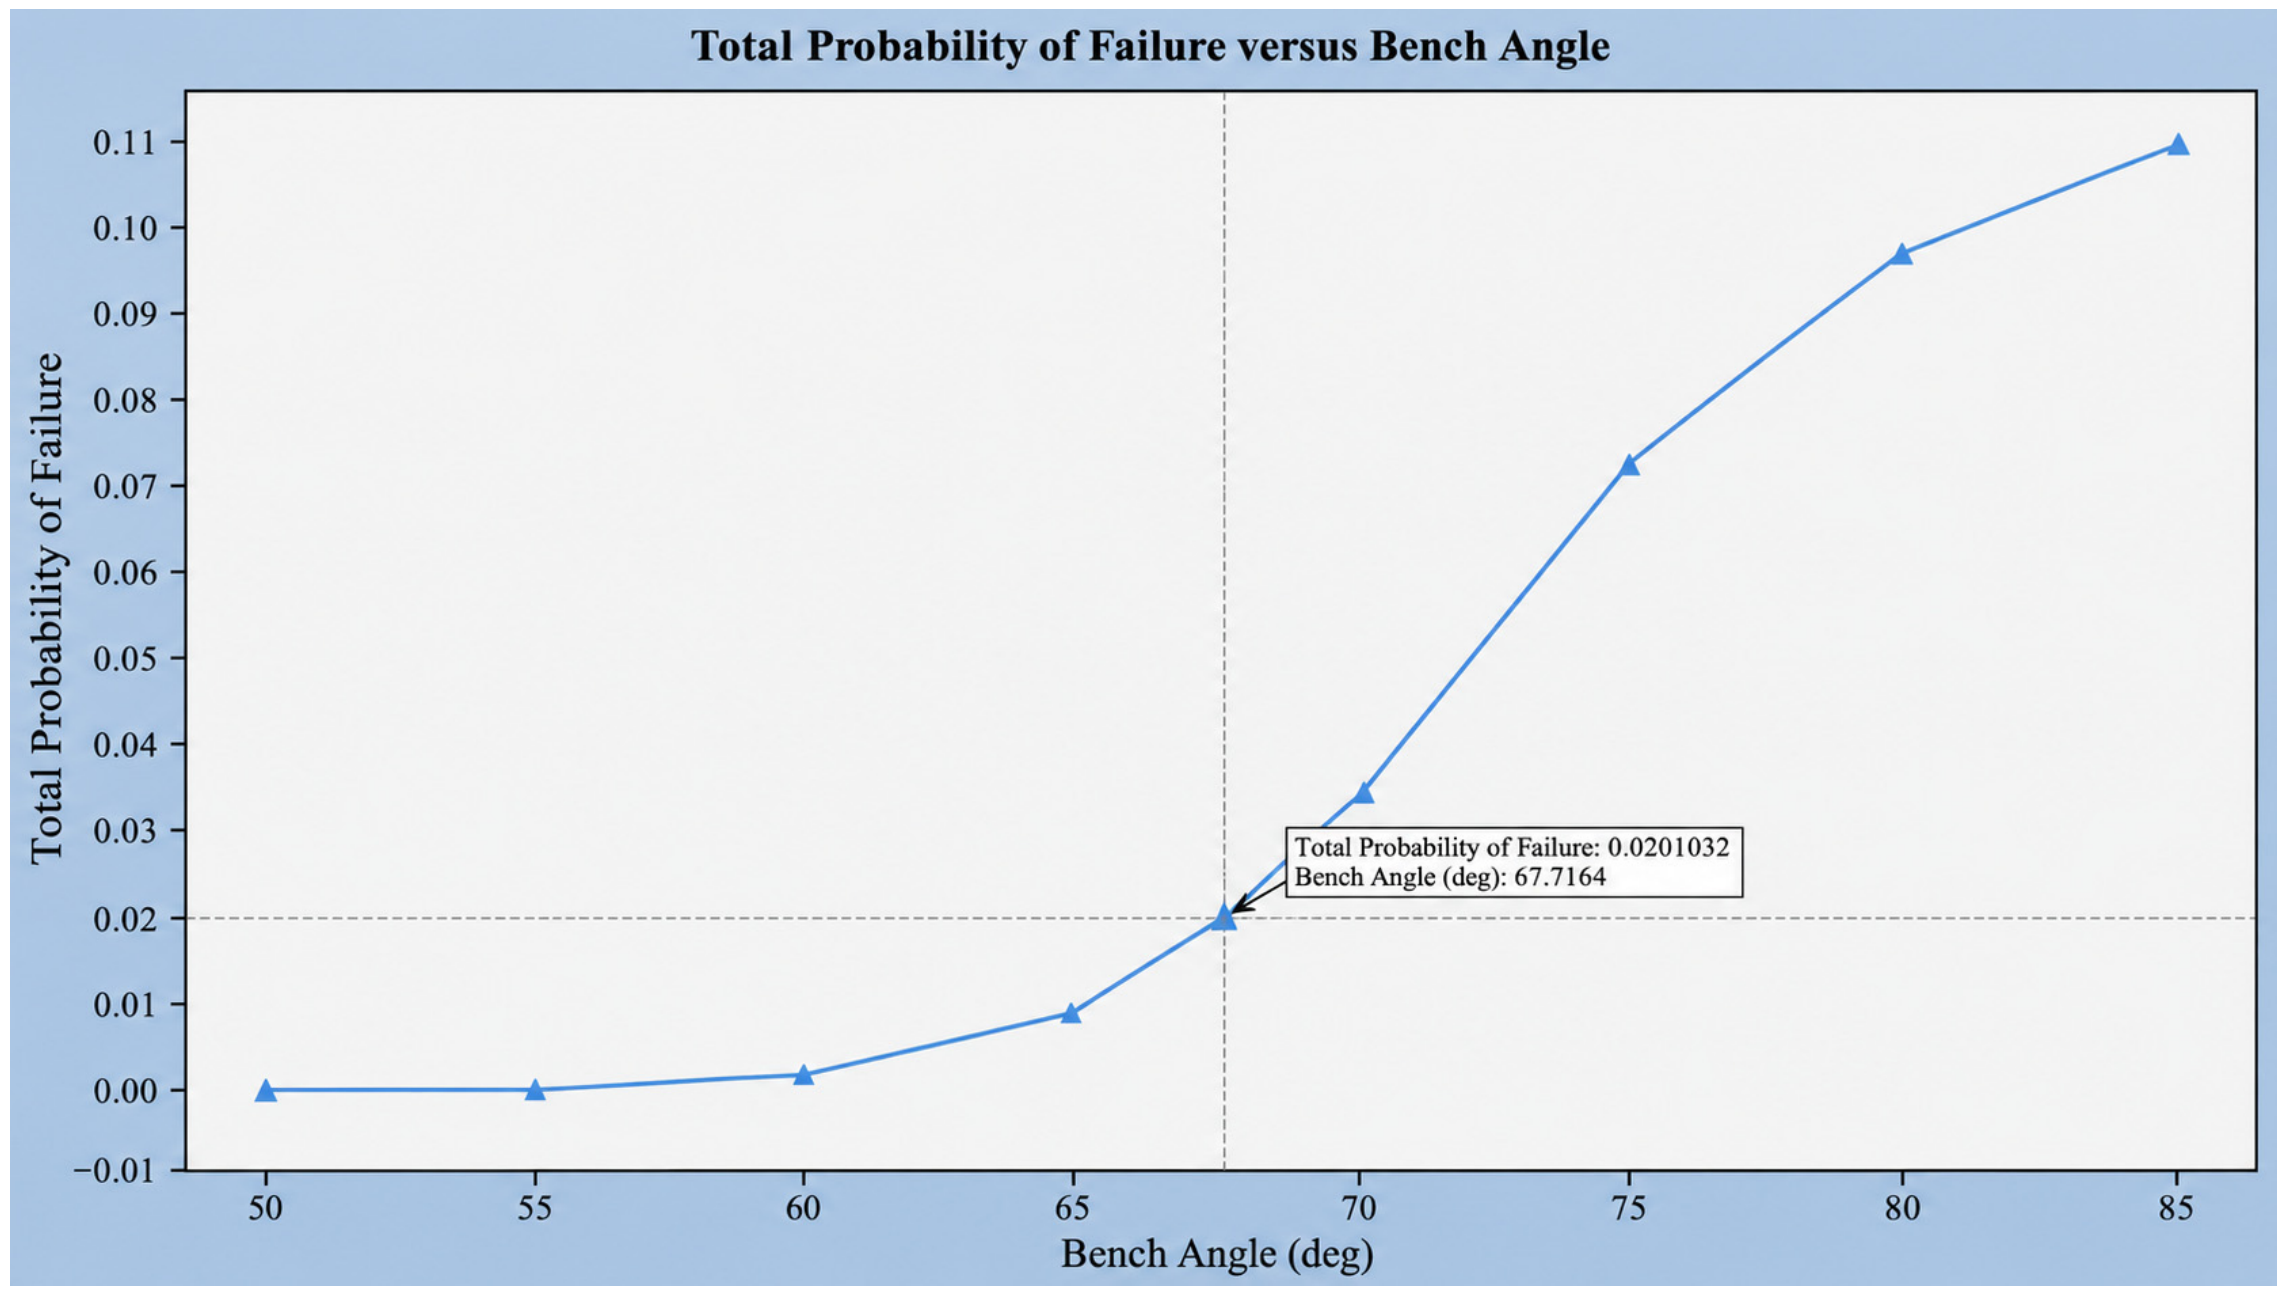
For Sector 2, the planar mechanism analyzed in RocPlane has an FoS of approximately 1.6, whereas the RS2 analysis gives a value of about 1.8. Block sliding in RS2 for the same case is characterized by a critical SRF of approximately 1.38. For Sector 7, SWedge indicates a low probability of failure for the surface wedge under the specific analyzed configuration, while the relationship between failure probability and bench angle indicates a rational range near 70°.
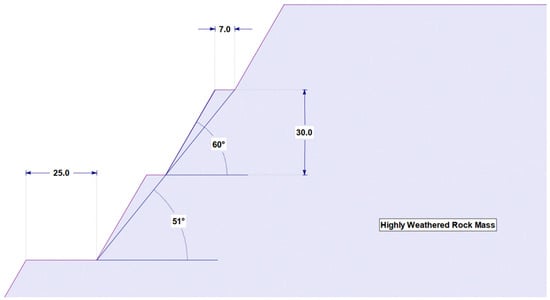
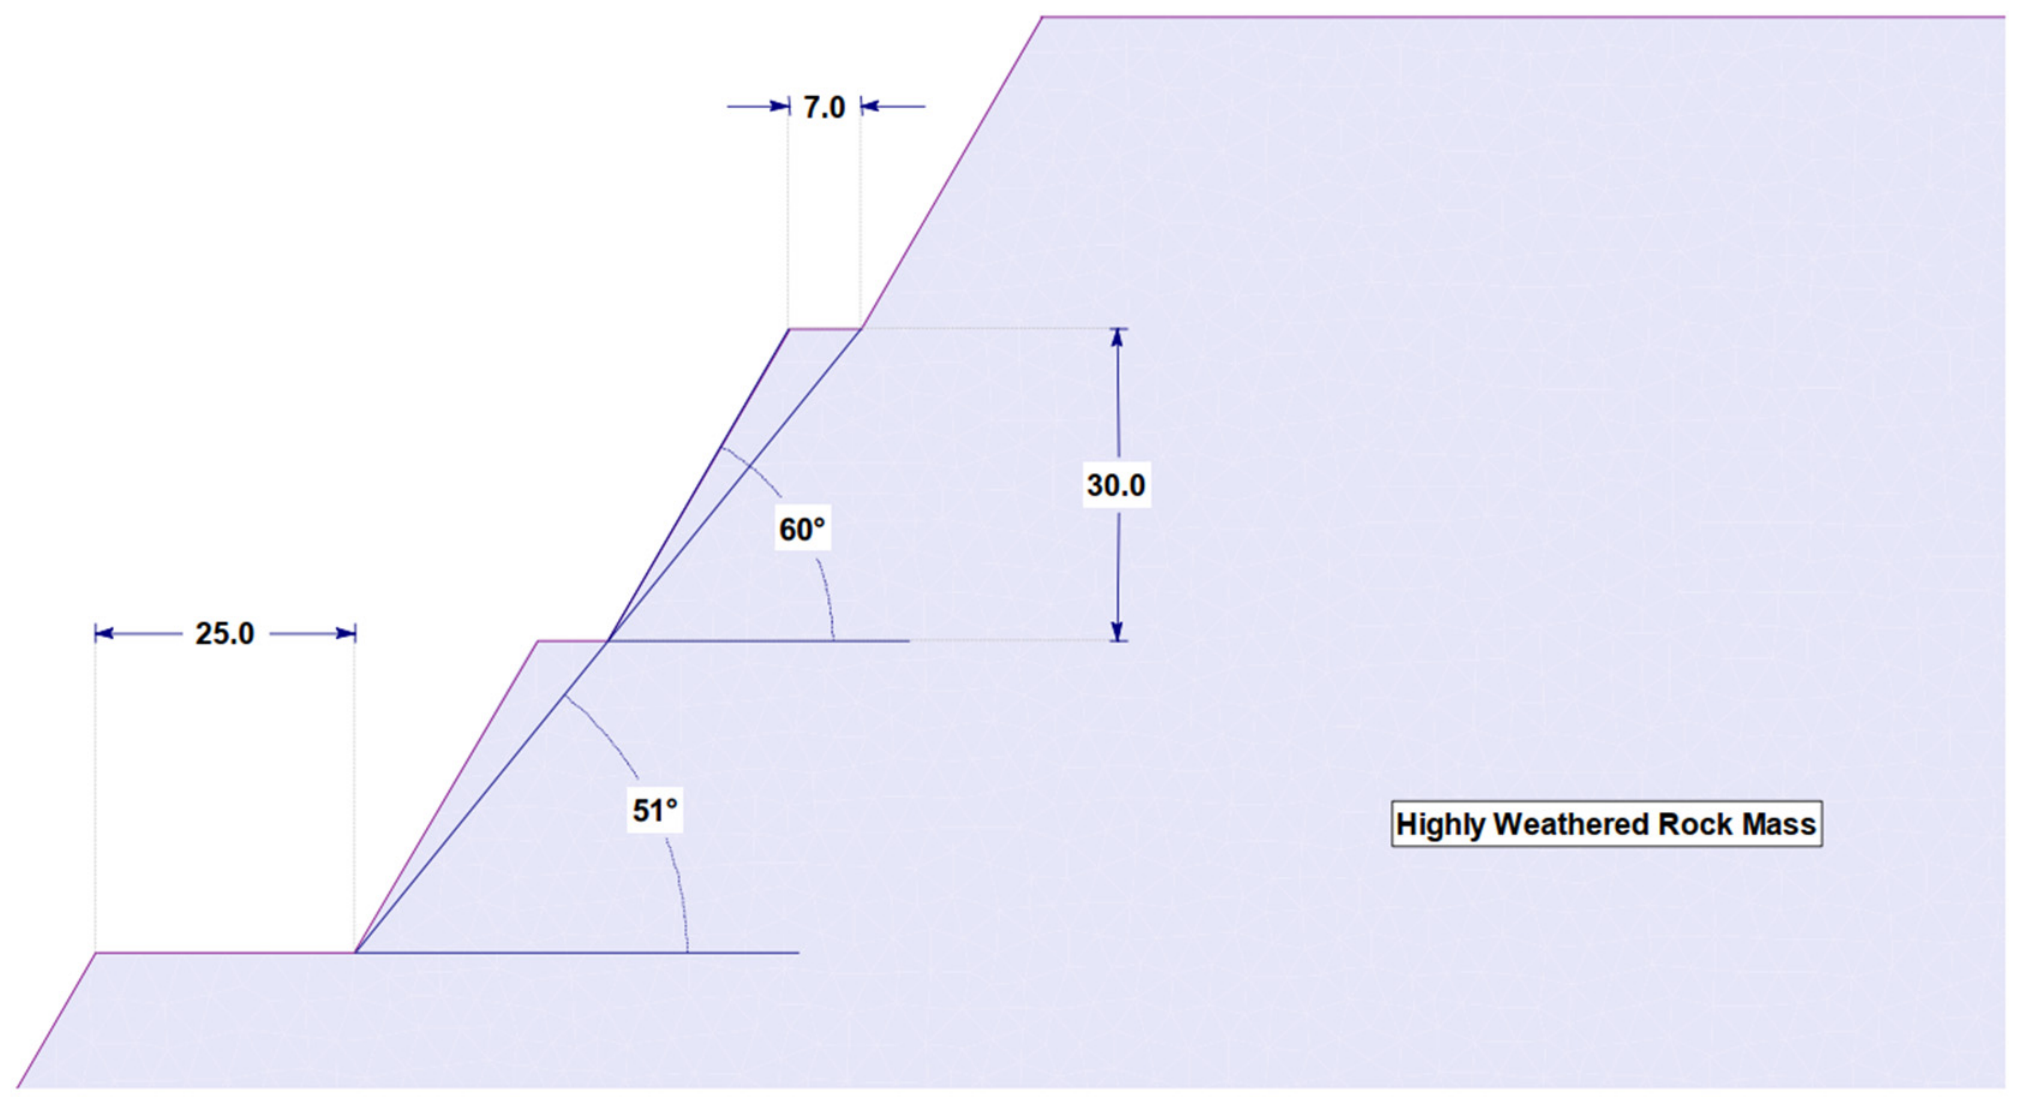
For strongly weathered rock, the original design analysis used 30 m high benches with a 60° bench face angle and a 7 m berm width. For unweathered rock, sector-dependent bench face angles of 70–80° were recommended at a bench height of 30 m and berm widths of approximately 11–13 m. Inter-ramp angles in the unweathered portion range from approximately 53.8 to 60.0°, confirming the need for a sector-based rather than uniform design approach.
To quantify the sensitivity of the overall slope to changes in hydrogeological conditions, the relative factor-of-safety reduction ΔFoS = (FoS_A − FoS_i)/FoS_A·100% was used, where FoS_A is the dry-scenario value and FoS_i corresponds to the hydrogeological condition under consideration. This metric allows comparison of the response of different geotechnical domains regardless of their initial stability level.
The quantitative effect of deteriorating drainage conditions on the stability of different rock domains is given in Table 5.
Table 5.
Relative reduction in factor of safety under deteriorating drainage conditions.
In both domains, the transition from the dry state to Scenario B reduces FoS by 12.9–15.2%, whereas Scenario C produces a reduction of 37.5–38.3%. The nearly identical relative sensitivity of the two lithological domains despite different initial FoS values indicates that deteriorating drainage acts as a systematic control on overall stability. Thus, as the pit deepens, changes in hydraulic conditions can reduce the stability margin even in sectors where dry-condition analyses yield high FoS values.
3.2. Structural Characteristics and Strength Heterogeneity of the Rock Mass
The laboratory data show an extremely wide strength range. UCS of quartz diorite varies from 4.11 to 247.27 MPa, with the maximum approximately 60 times the minimum; granodiorite ranges from 1.11 to 278.76 MPa, a difference of more than 250-fold. Such variability cannot be adequately represented by a single mean value without losing information on weakened intervals. From an engineering perspective, specimens with UCS < 50 MPa are particularly important because their failure is frequently associated with increased fracturing, foliation, weathering, and microcracking.
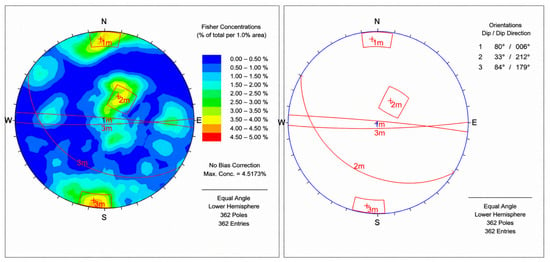
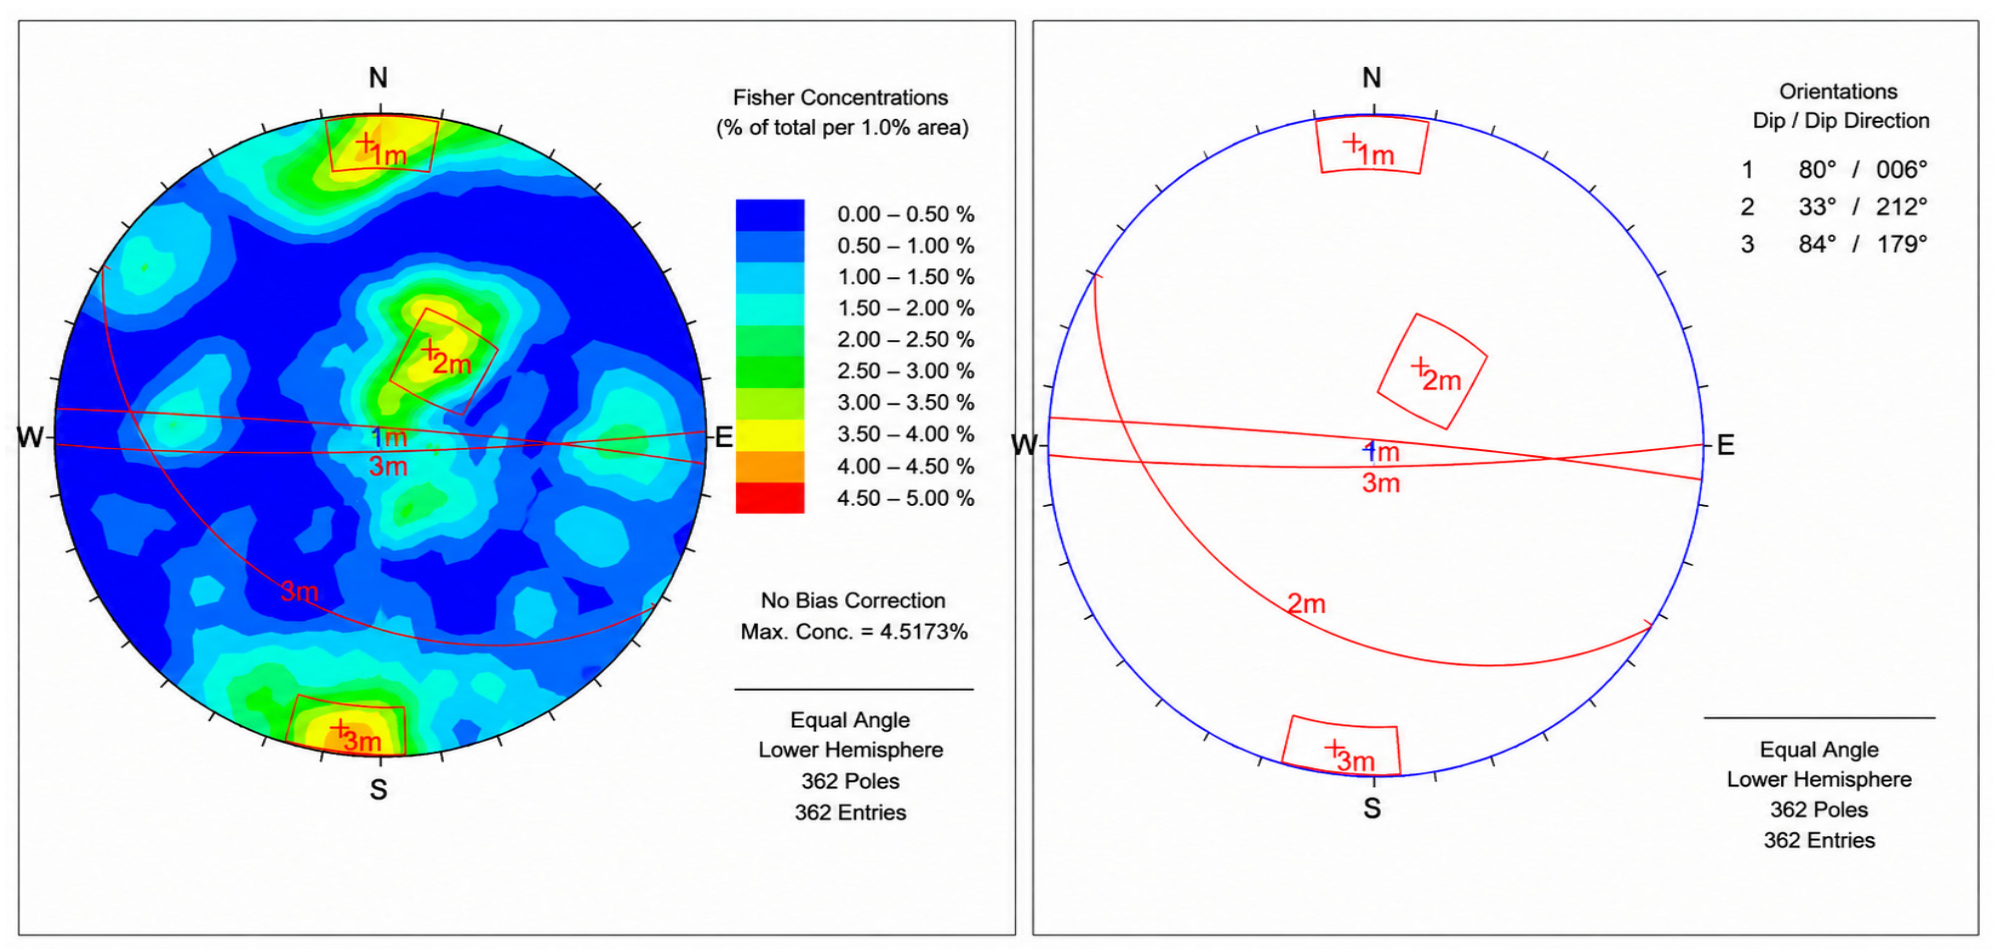
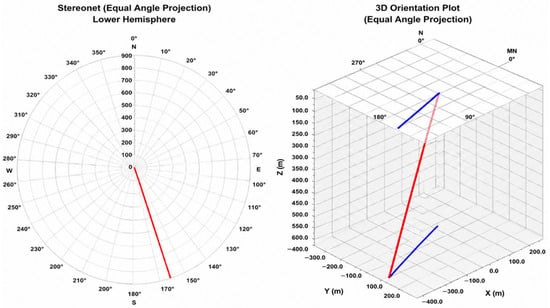
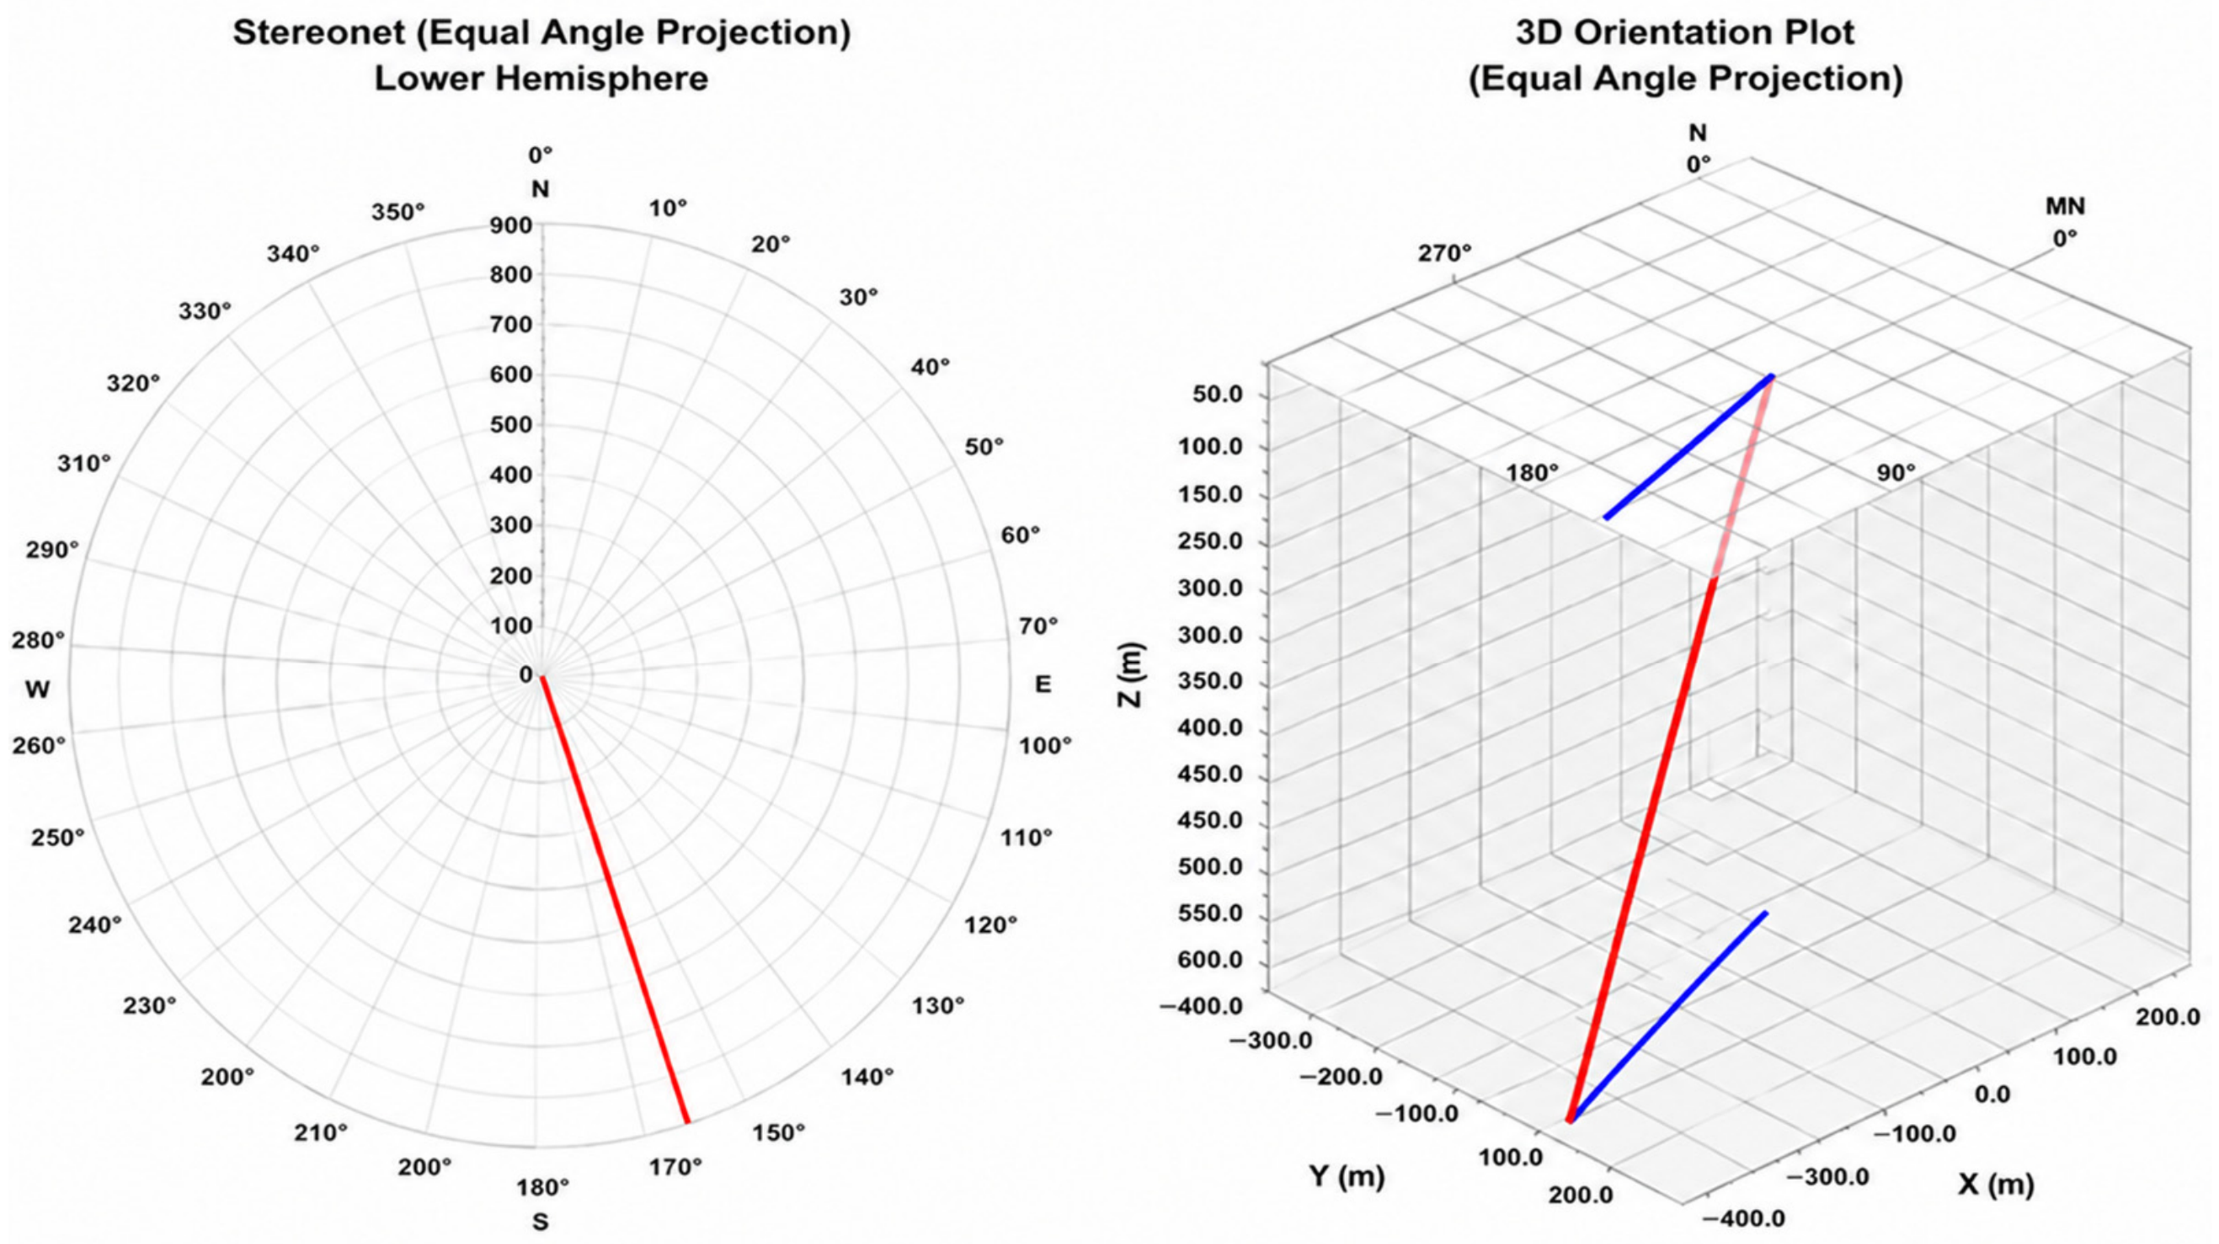
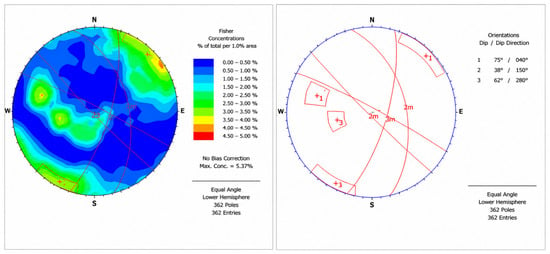
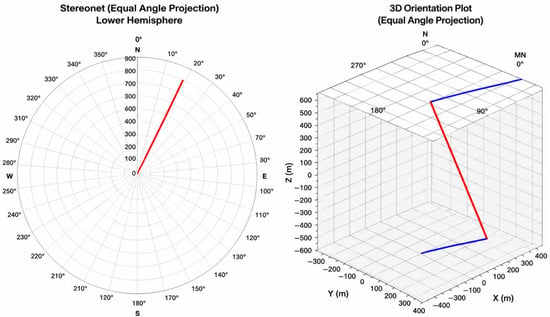
The principal mean discontinuity planes identified from the oriented geotechnical boreholes GA-01 and GA-02, together with the spatial orientation and downhole trajectory changes of these boreholes, are shownin Figure 1, Figure 2, Figure 3 and Figure 4.
Figure 1.
Principal mean discontinuity planes identified in borehole GA-01.
Figure 2.
Borehole trajectory diagrams for GA-01.
Figure 3.
Principal mean discontinuity planes identified in borehole GA-02.
Figure 4.
Borehole trajectory diagrams for GA-02.
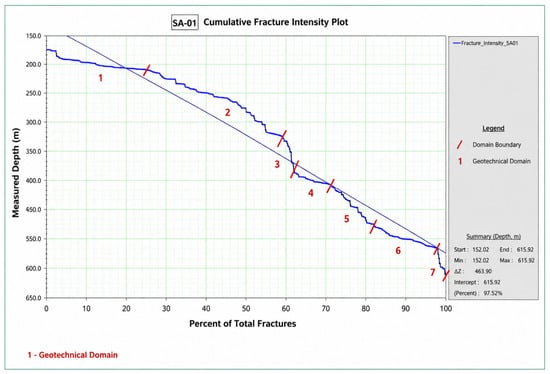
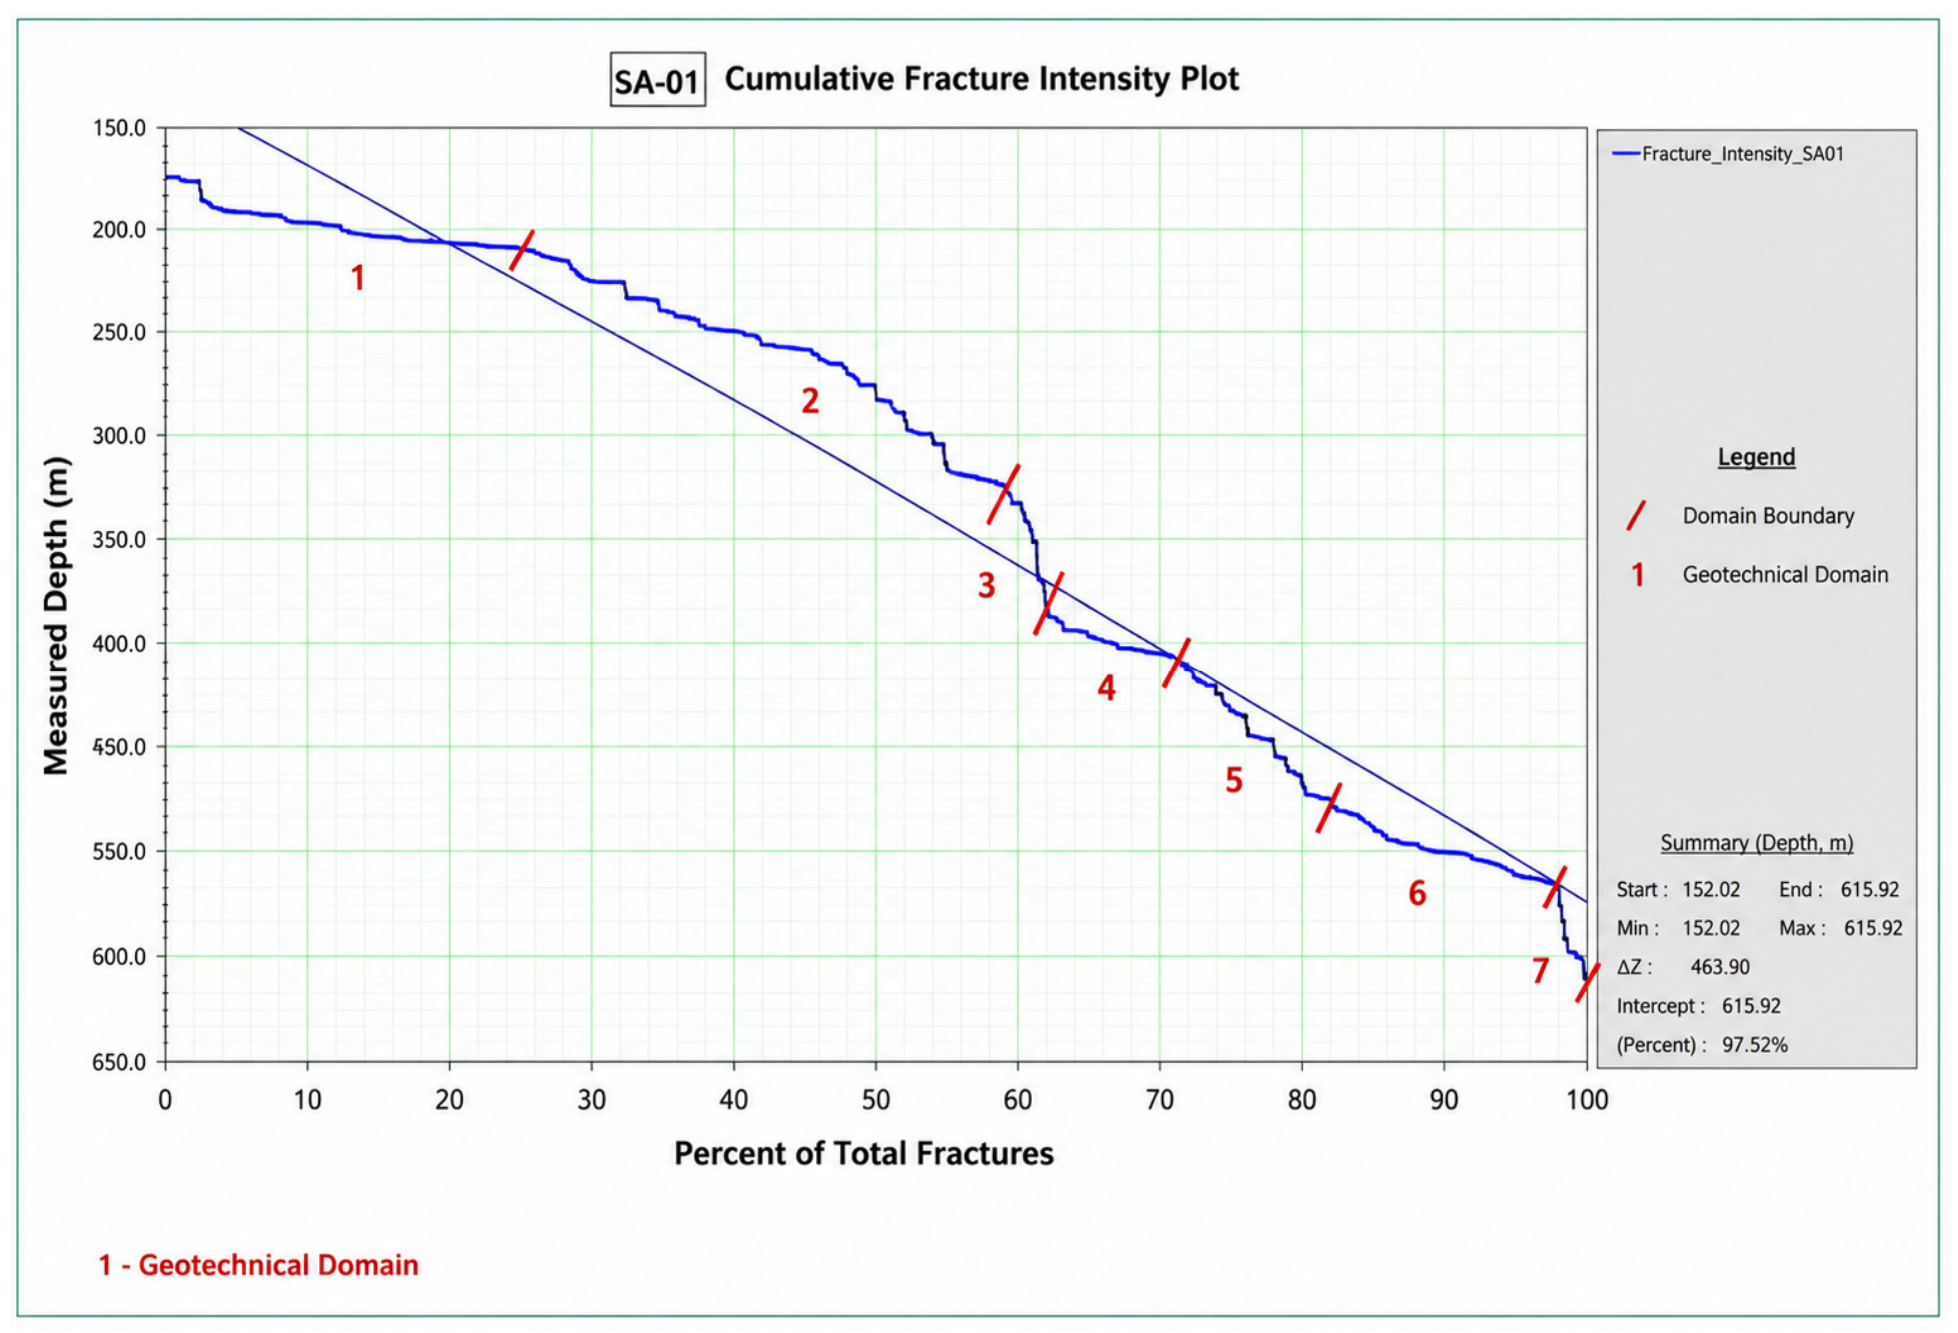
Geotechnical domain boundaries were defined in FracMan 8.0 from changes in the slope of the cumulative fracture-intensity curve (Figure 5); each pronounced break in slope was interpreted as a transition between rock-mass intervals with different fracture intensities.
Figure 5.
Cumulative fracture-intensity curve for borehole GA-01 based on FracMan analysis.
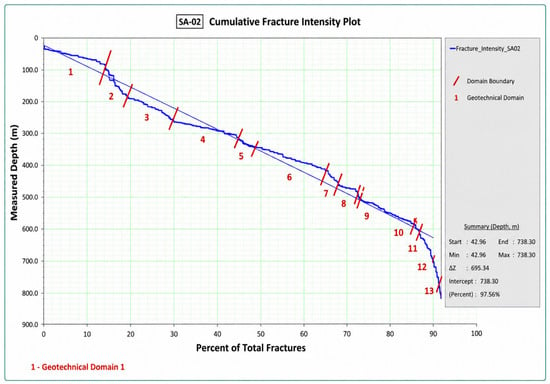
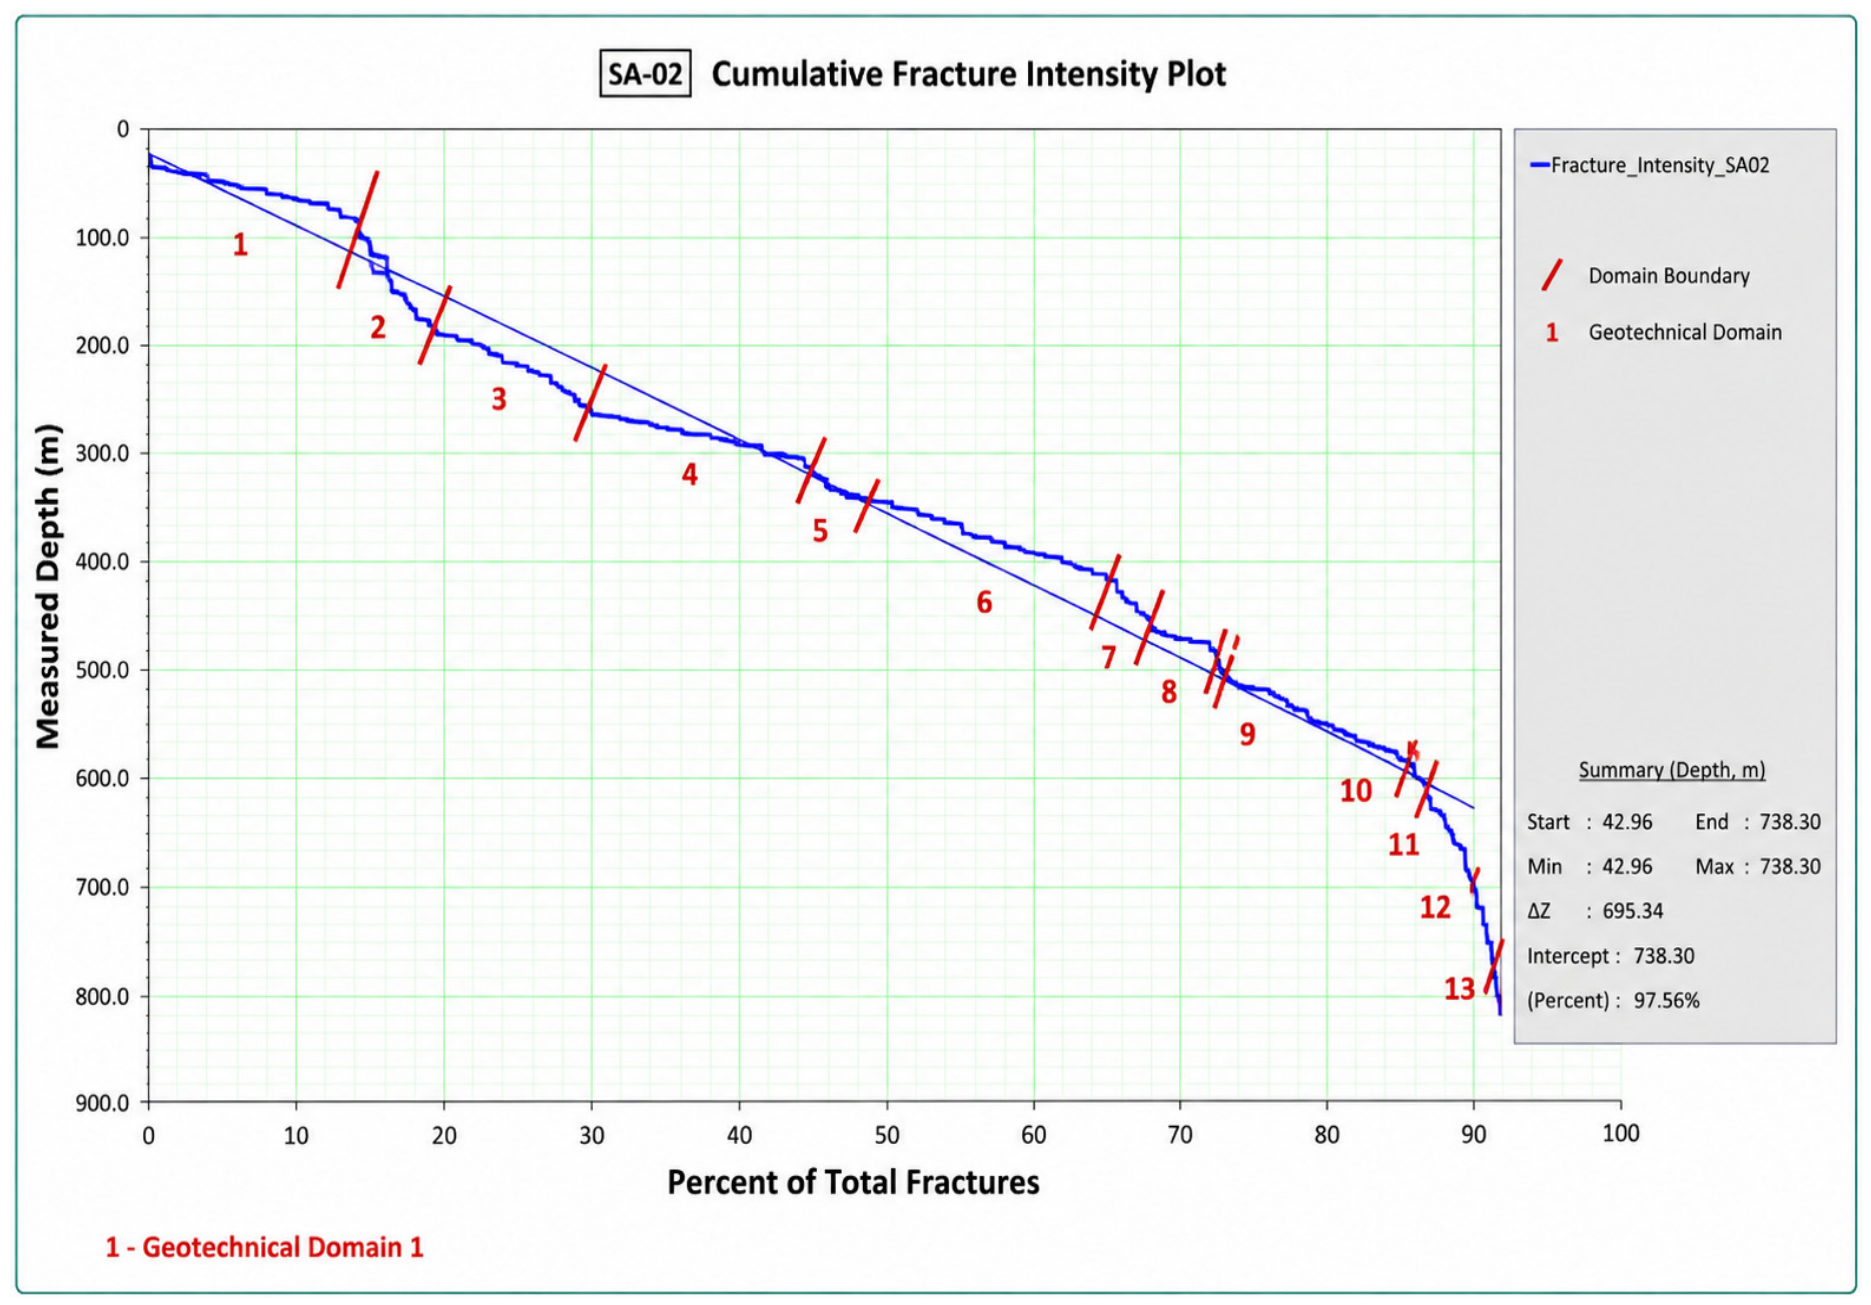
The cumulative fracture-intensity curve for borehole GA-02 is shown in Figure 6.
Figure 6.
Cumulative fracture-intensity curve for borehole GA-02 based on FracMan analysis.
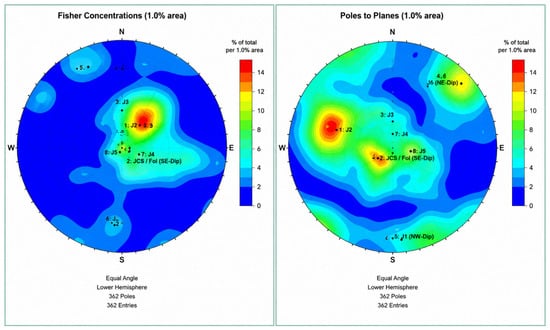
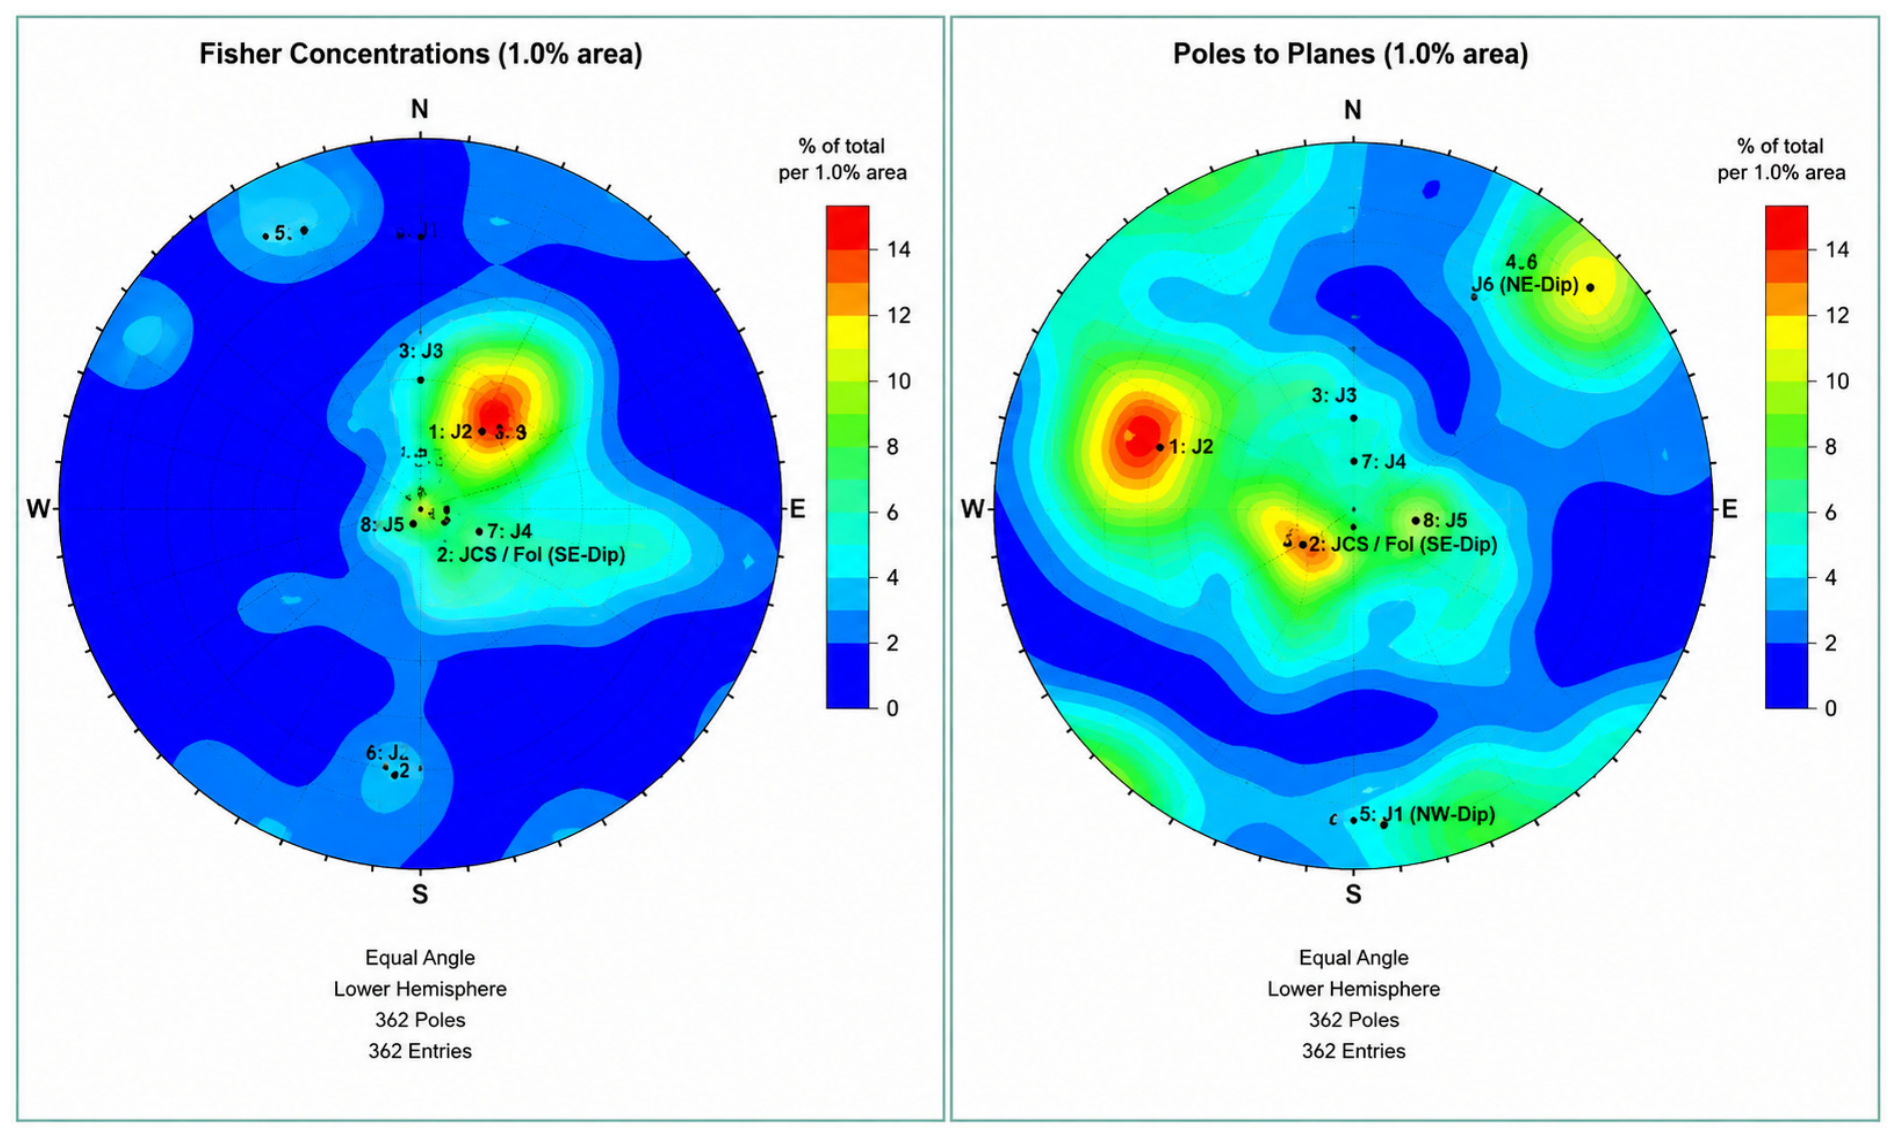
Domain 1 is characterized by high fracture intensity; discontinuity orientations are shown in Figure 7. The stereograms represent weathered quartz diorite from GA-01 and weathered granodiorite from GA-02.
Figure 7.
Joint-set analysis for Domain 1 in borehole GA-01 (quartz diorite), left; joint-set analysis for Domain 1 in borehole GA-02 (granodiorite), right (pole projection).
No single dominant orientation trend was identified because of the high degree of fracturing and weathering and the resulting wide scatter in the recorded structural data.
The principal joint sets identified by structural analysis in the weathered rock mass and their spatial parameters are presented in Table 6.
Table 6.
Principal joint sets in weathered rock.
The joint-set data in Table 6 now include the available trace-length and infill descriptors. Full trace length cannot be recovered from borehole core; therefore, the table distinguishes this unmeasured quantity from the design persistence used in the stability models. Weathering products and locally clay-coated surfaces were observed in Domain 1, but infill thickness was not consistently quantified. These discontinuity systems may form unstable blocks, wedges, or planar failures where their orientation is kinematically compatible with the slope face.
Adversely oriented joint sets identified from oriented core and structural interpretation of boreholes GA-01 and GA-02 were incorporated into the subsequent kinematic and numerical stability analyses.
The adversely oriented joint sets included in the open-pit slope stability assessment are summarized in Table 7.
Table 7.
Adverse joint sets included in the stability analysis, with trace-length availability and infill condition.
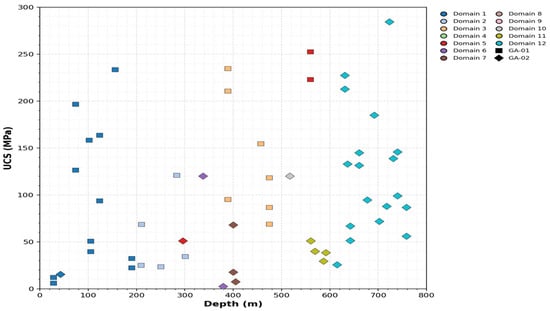
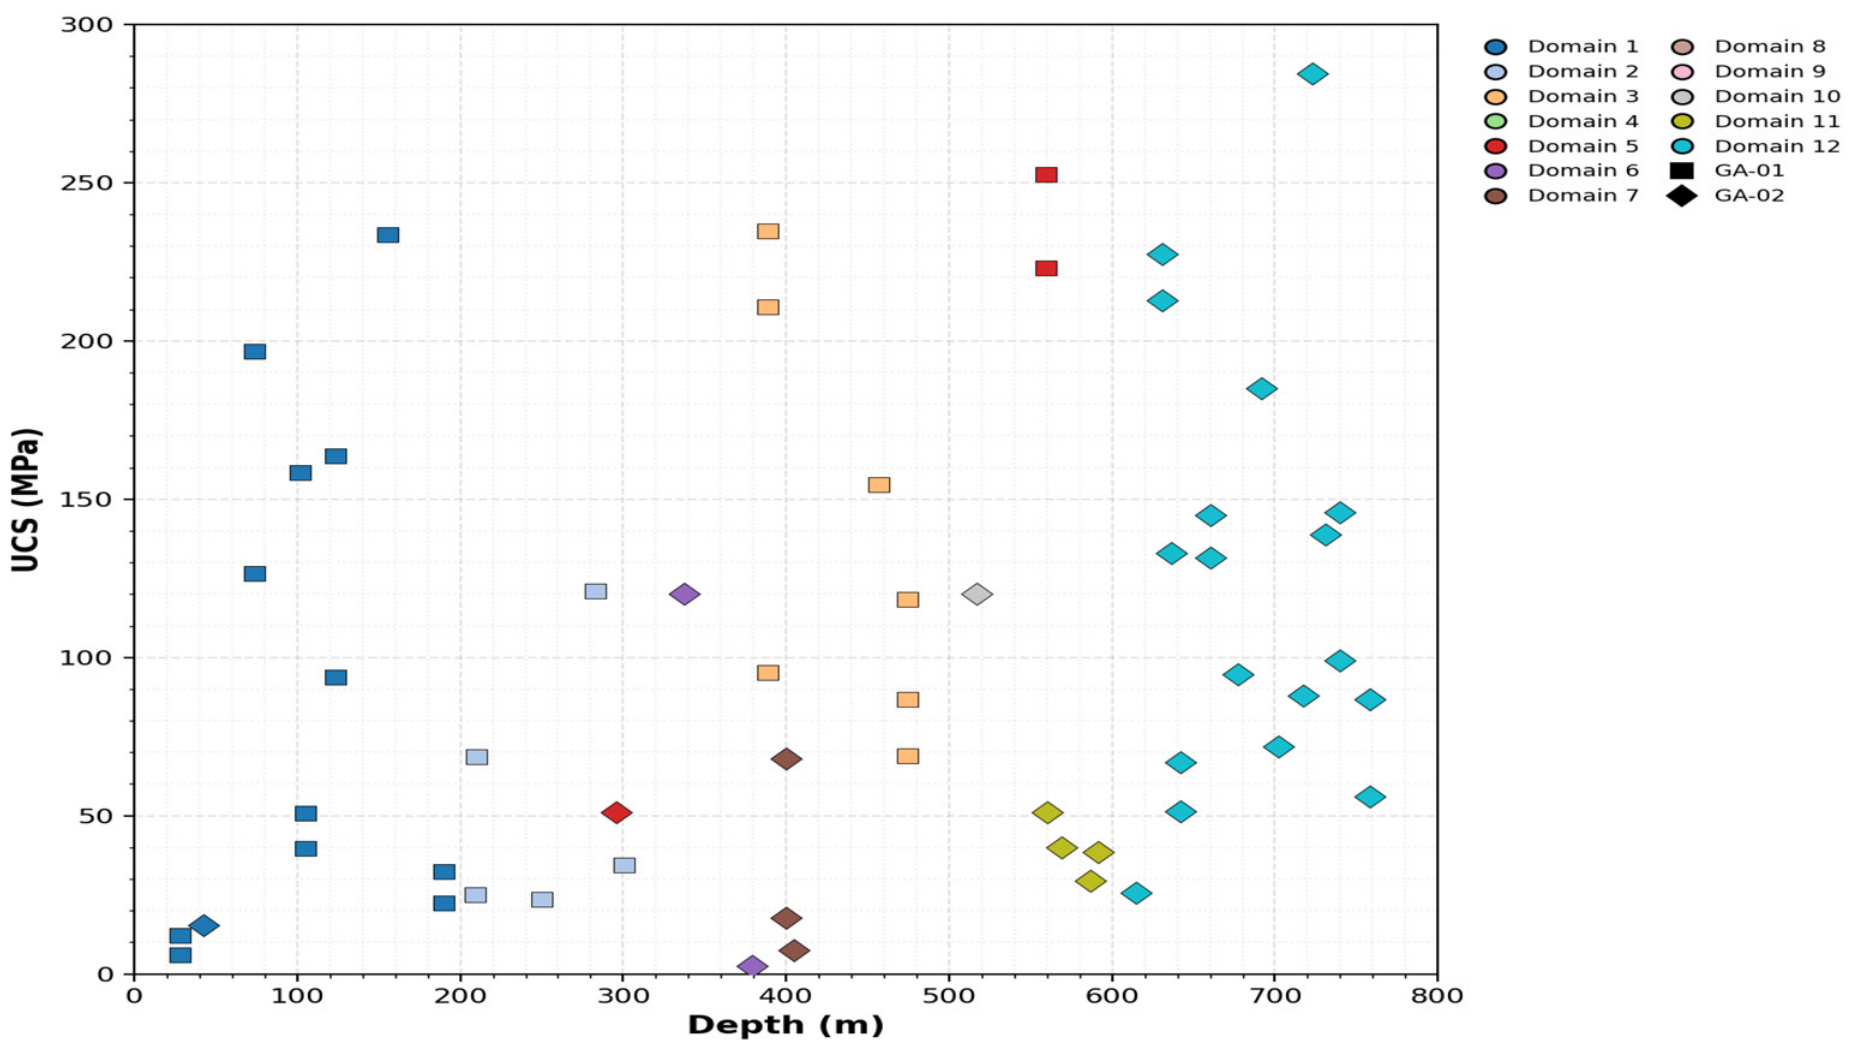
Figure 8 shows that UCS scatter occurs both between and within geotechnical domains. No monotonic UCS-depth trend was identified; instead, clusters of low strength coincide with domain changes and intervals affected by fracture intensity, weathering, or hydrothermal alteration. Domain-based coloring therefore makes clear why depth or lithology alone is insufficient for parameter assignment.
Figure 8.
Uniaxial compressive strength versus depth, color-coded by geotechnical domain; marker shape distinguishes boreholes GA-01 and GA-02.
Failure-mode analysis showed that specimen failure surfaces are frequently controlled by pre-existing weakness planes, foliation, fractures, and veins. In GA-01, steeply inclined failure surfaces predominate (approximately 70–80° to the core axis), whereas GA-02 is characterized by angles of approximately 65–85° in Domains 1–9 and 55–75° in Domains 10–12.
Laboratory results for low-strength specimens (UCS < 50 MPa) are presented in Table 8.
Table 8.
Specimens with uniaxial compressive strength UCS < 50 MPa.
The test results show that low UCS values are spatially associated with weakness planes, including foliation, increased fracturing, microcracking, and weathered intervals. Accordingly, the low strength of individual specimens reflects not only the properties of the mineral matrix but also the structural condition of the core. This finding confirms the need to interpret UCS together with structural logging because simple averaging of laboratory results may overestimate the design strength of the most disturbed rock-mass zones.
The design discontinuity parameters adopted for stability assessment of the deeper pit levels are presented in Table 9.
Table 9.
Design discontinuity parameters for rocks at deeper pit levels.
Regarding Table 9, density values are based on available laboratory data; where an individual measurement was unavailable, a representative value for the corresponding rock type was used. Increased discontinuity persistence is indicated separately. For intervals without direct JCS measurements, the original project-model relationship JCS = 0.25·UCS was used. These values are not interpreted as direct measurements and are treated as a source of uncertainty in discontinuity parameterization; this limitation is considered in the discussion of result reliability.
Table 9 parameter derivation followed a hierarchical procedure. Density was taken as the arithmetic mean of available laboratory measurements for each lithology and domain; an asterisk identifies intervals for which a representative lithological mean was substituted because no interval-specific measurement was available. GSI was selected from core logging, RQD, fracture frequency, surface condition, weathering grade, and ABI40 structural observations, with the adopted value representing the central engineering estimate for the interval. Basic friction angle φb was taken from direct shear results on clean or minimally infilled natural discontinuities and grouped by lithology; the design friction angle φ was then obtained through the Barton–Bandis JRC-JCS formulation at the normal-stress range relevant to the modeled slope.
JRC values were assigned from logged roughness profiles and comparison with standard Barton profiles; they are domain-scale design classes rather than measurements for every individual joint. Persistence was based on the combined oriented-core, televiewer, and available exposure interpretation. A value of 3 m was adopted where no larger persistent structure was identified, whereas 10 m was assigned to the more persistent GA-02 Domains 9 and 11. JCS values without a superscript were based on available discontinuity-wall or corresponding intact-rock test information. Values marked with three asterisks were estimated as JCS = 0.25·UCS and are explicitly classified as estimated. Thus, Table 9 distinguishes measured or logging-derived values, representative substituted values, and empirical estimates.
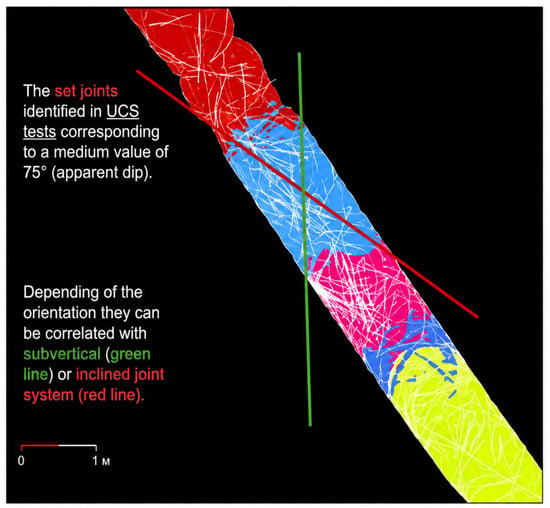
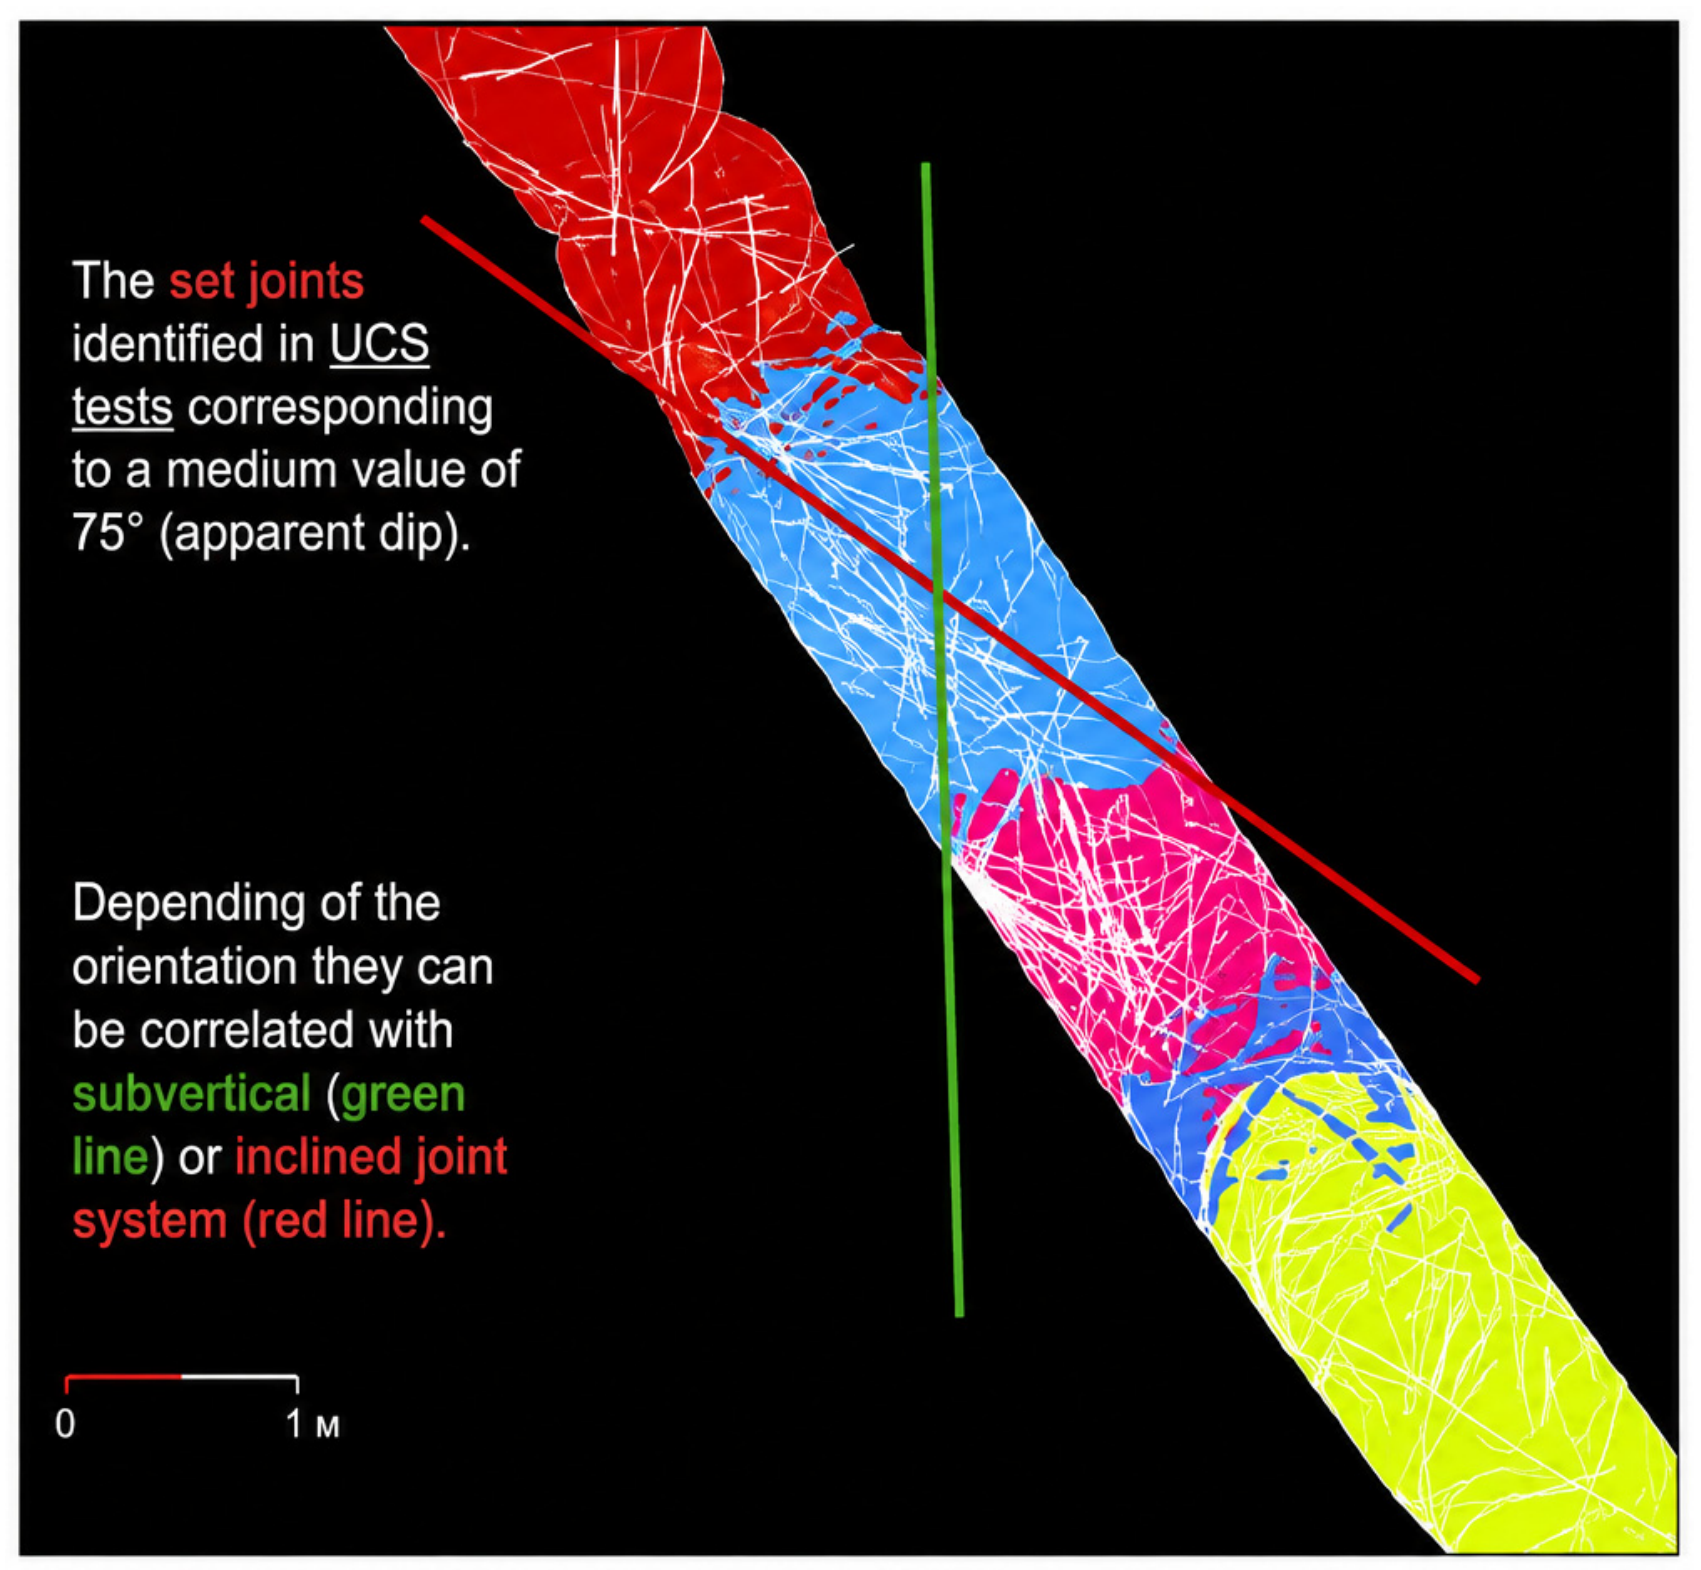
Depending on their orientation, the discontinuities may correspond to subvertical or inclined joint sets (Figure 9).
Figure 9.
Determination of discontinuity inclination angle for specimens with UCS < 50 MPa.
3.3. Geological and Structural Model of the Rock Mass
To construct a simplified engineering-geological model for stability assessment, results from previous investigations and the current study were combined with wireframe elements of the geological model and surfaces of the major faults. These data were used to define lithological domains and key structures for subsequent analyses.
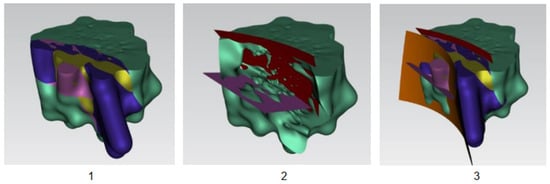
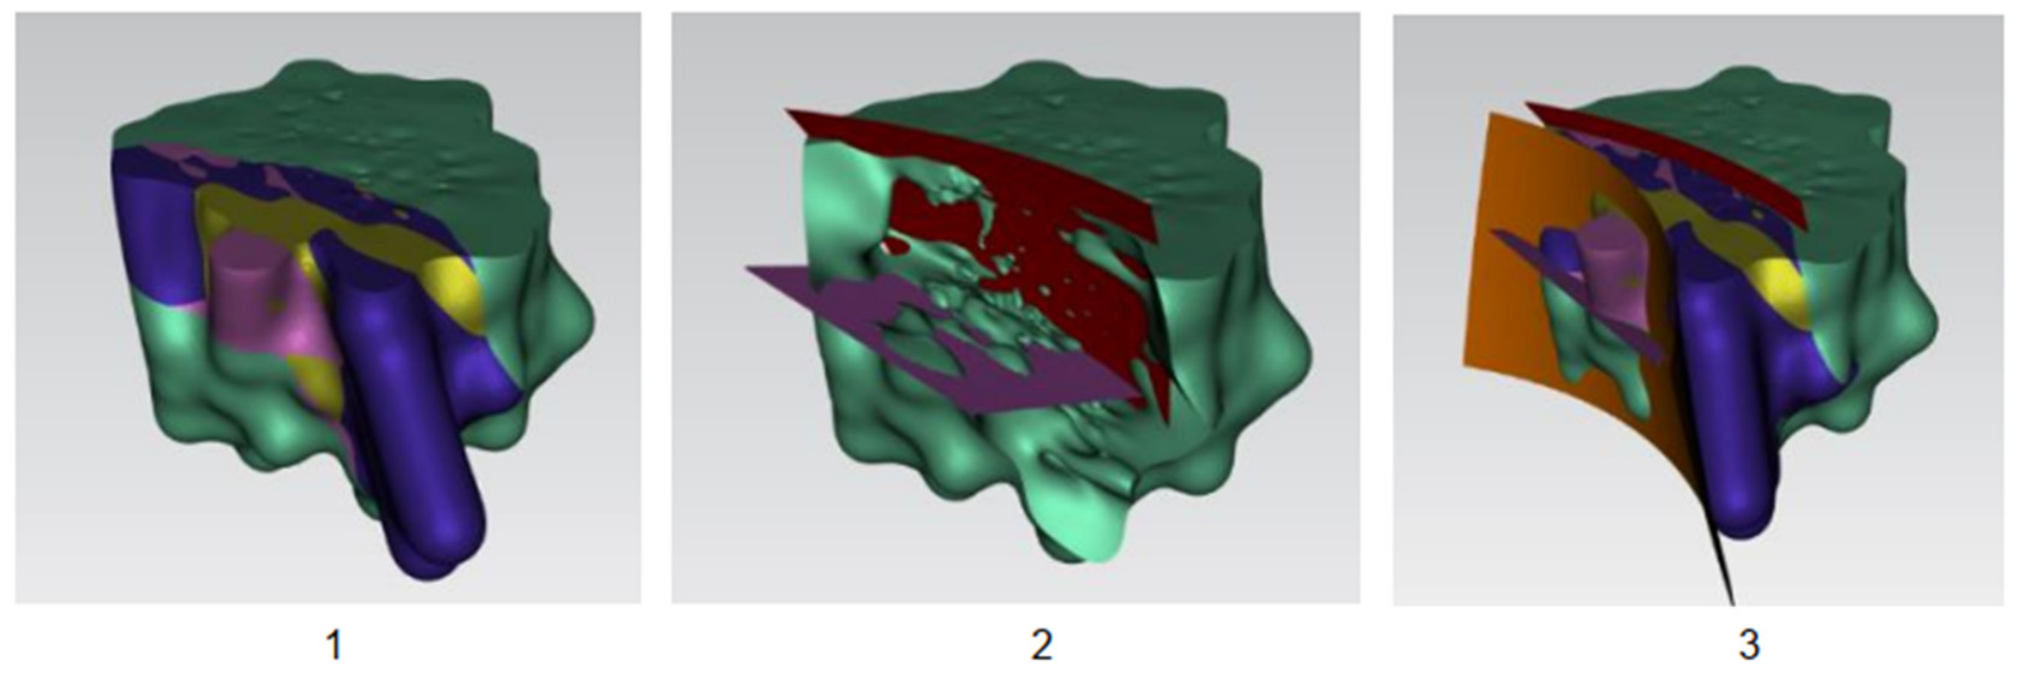
For stability calculations, the original geological model was generalized by retaining the principal lithological boundaries and structural surfaces:
- -
- Base of the quartz diorite/mixed-diorite unit (purple surface, Figure 10(1));Figure 10. Stage 1: Simplification of geological boundaries based on the Altyntau geological model.
- -
- Top of the quartz diorite/mixed-diorite unit (red surface, Figure 10(2));
- -
- Boundary between the quartz diorite/mixed-diorite and gabbro–diorite domains (orange surface, Figure 10(3)).
The identified surfaces were also correlated with rock types based on the logging of boreholes GA-01 and GA-02.
Using the new Altyntau data and results from boreholes GA-01 and GA-02, the discontinuity model developed during the first stage of the study was refined (Figure 11).
Figure 11.
Principal geological structures identified after updating the Stage 1 model.
The updated geological model identifies three principal subvertical discontinuity systems consistent with the Stage 1 model:
- -
- NW-SE-trending system with strike N140°. High persistence (trace length greater than the pit diameter);
- -
- NE-SW-trending system with strike N40°. High persistence (trace length greater than the pit diameter);
- -
- N-S-trending system with strike N0°. Low persistence (trace length approximately 500 m).
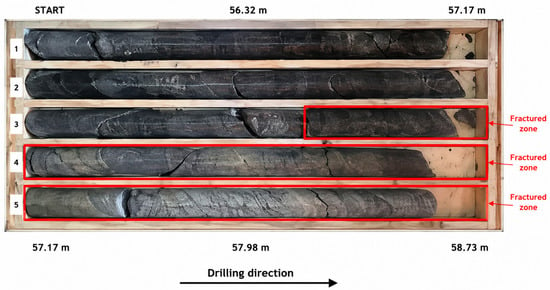
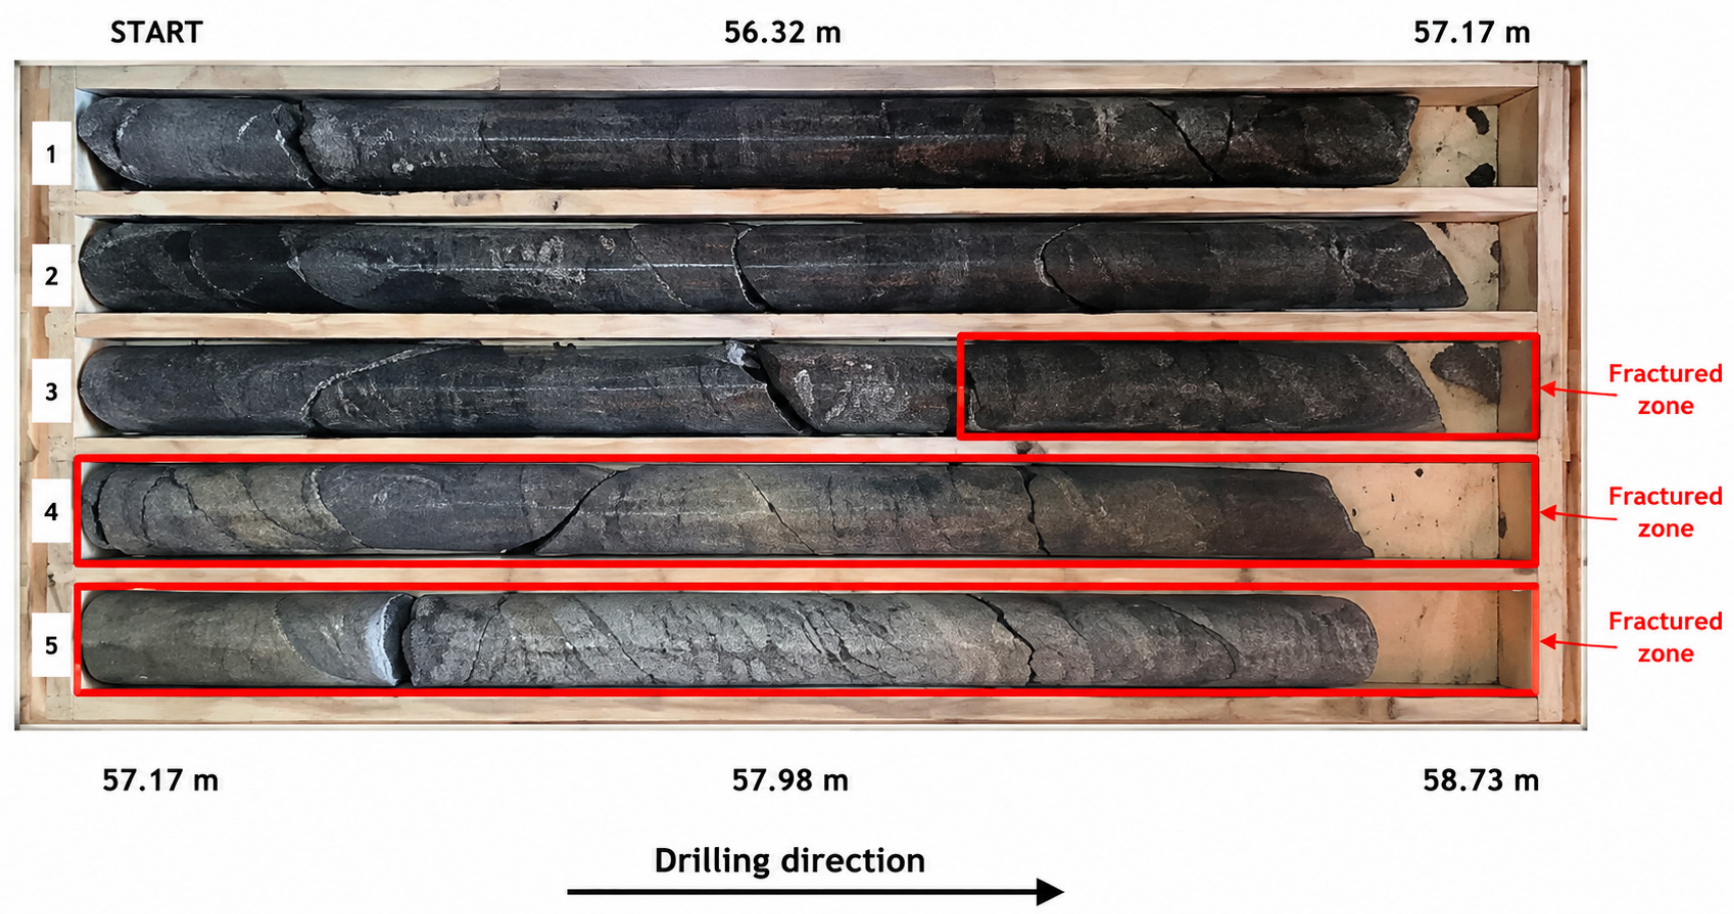
Detailed analysis of borehole GA-01 identified an interval between 235 and 237 m showing evidence of rock alteration, including chemical alteration, a color change from yellowish to gray, and intensely banded and vein-rich zones (Figure 12). This interval may correspond to a 10 m wide zone previously identified at the deposit during Stage 1 and characterized by chemical alteration, replacement processes, and color changes. Exposure mapping indicates that the zone is heterogeneous: some parts appear weathered (International Society for Rock Mechanics (ISRM) Class IV) and fractured, with features of compacted/indurated eluvial material and oxidation, whereas other parts show no distinct evidence of fracturing or weathering. The zone may be associated with the fault system described in the geological literature as the Vasilkovskoye Fault.
Figure 12.
Core from borehole GA-01 over the 232.8–237.3 m interval; the altered 235–237 m interval is highlighted.
3.4. Stability of Benches, Inter-Ramp Slopes, and Overall Slopes
The analyses revealed a pronounced scale dependence of stability. Structurally controlled mechanisms dominate at individual-bench scale, whereas the influence of integrated rock-mass strength and hydrogeological conditions increases at inter-ramp and overall-slope scales. Accordingly, bench geometry in weathered and relatively intact rock was assessed using the combined results of SWedge, RocPlane, Slide, and RS2 rather than a single universal FoS. In the unweathered rock mass, the vertical height of an inter-ramp slope should be limited to three benches (approximately 90 m), with bench groups separated by a haul ramp or a geotechnical berm approximately 25 m wide.
The recommended bench geometry for strongly weathered rock is shown in Figure 13. The stability of individual benches, and therefore the selection of rational geometric parameters, is strongly controlled by rock-mass structure, including the orientation and properties of the principal joint sets.
Figure 13.
Recommended bench geometry in strongly weathered rock.
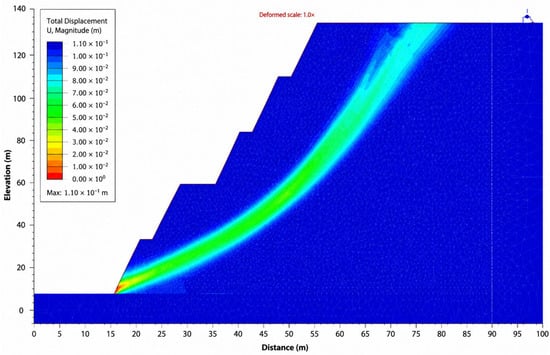
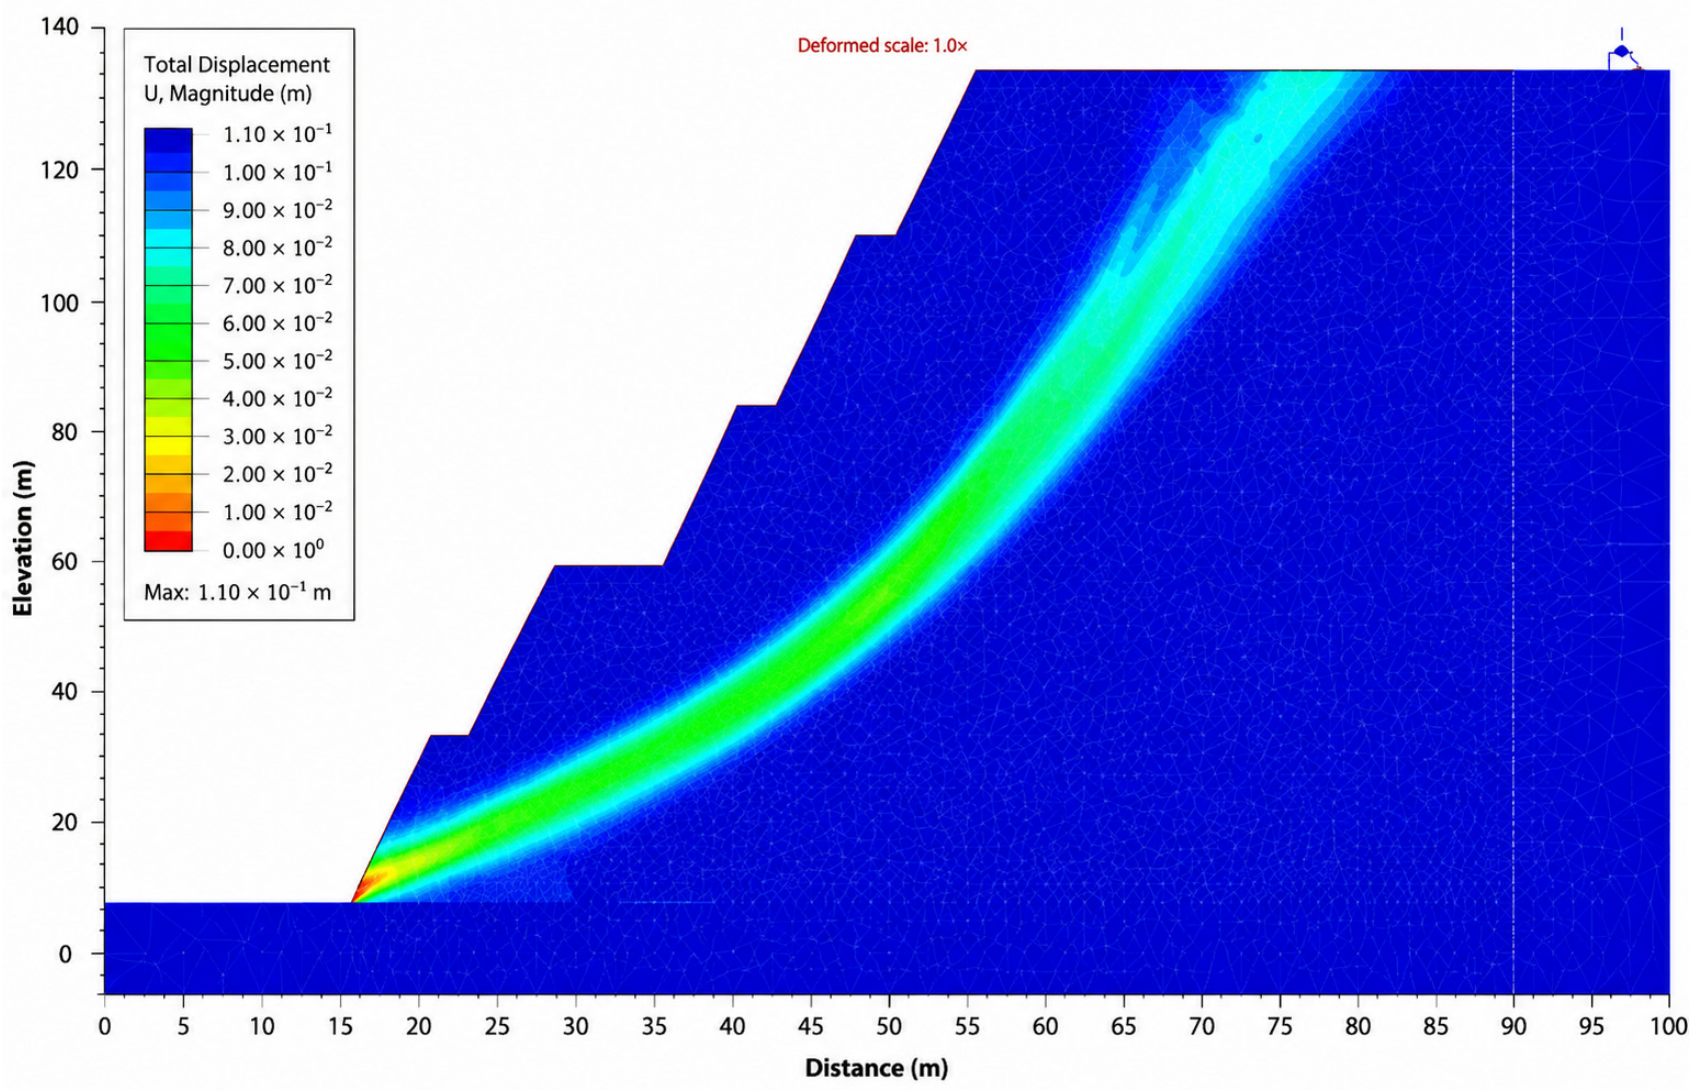
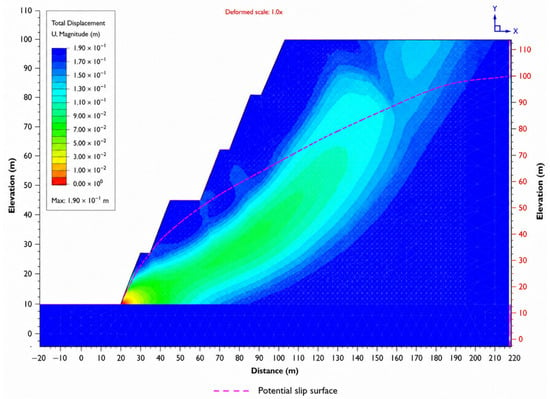
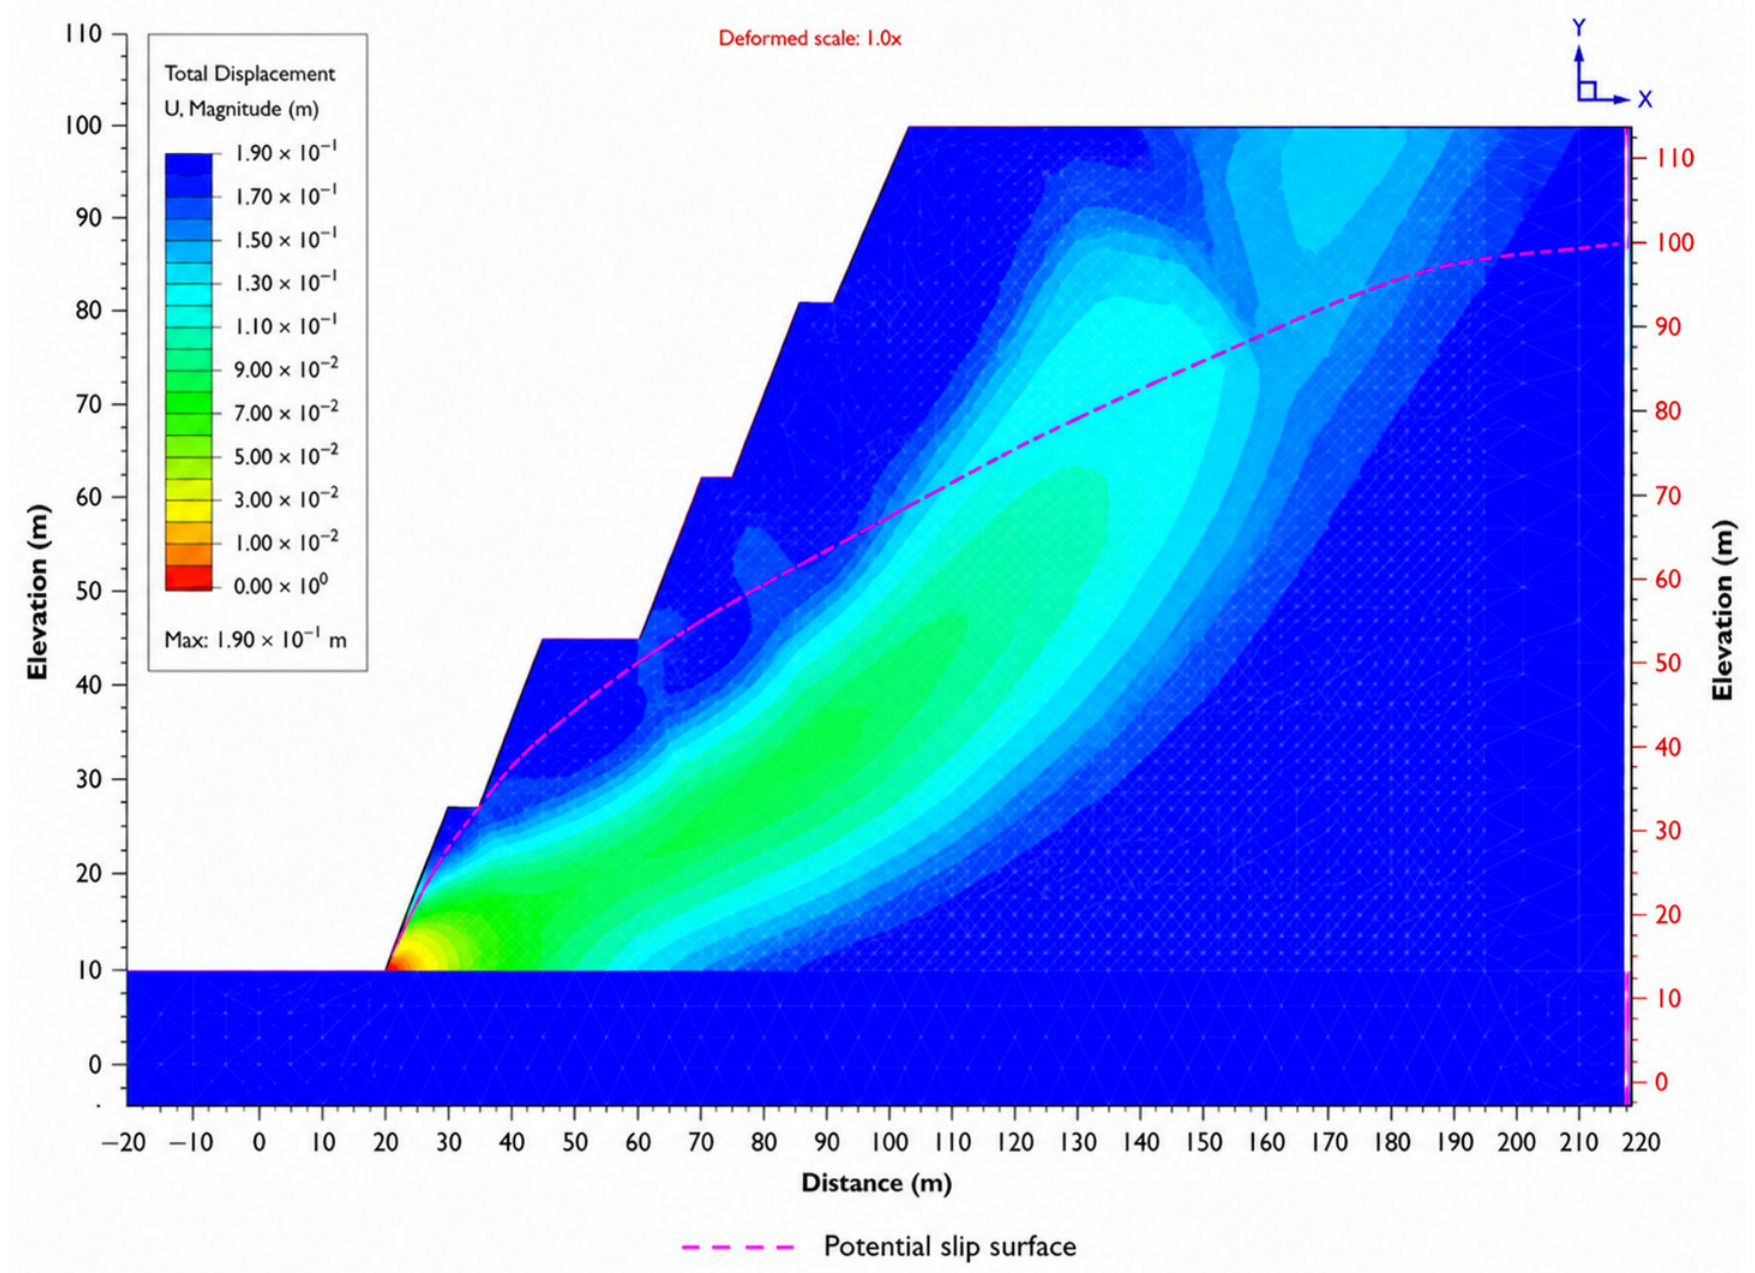
Contours of maximum shear strain in strongly weathered rock under dry conditions (Scenario A), together with the corresponding deformation mechanism at FoS = 3.31, are shown in Figure 14.
Figure 14.
Maximum shear-strain contours in strongly weathered rock under dry conditions (Scenario A), FoS = 3.31.
The shear-strain response of strongly weathered rock under moderate hydrogeological conditions (Scenario B) is shown in Figure 15; the factor of safety is FoS = 2.64.
Figure 15.
Maximum shear-strain contours in strongly weathered rock under moderate hydrogeological conditions (Scenario B), FoS = 2.64.
The distribution of maximum shear strain under the most unfavorable hydrogeological condition, Scenario C, is shown in Figure 16; the factor of safety for the deep-seated failure mechanism is 2.14.
Figure 16.
Maximum shear-strain contours in strongly weathered rock under very-slow-drainage conditions (Scenario C), FoS = 2.14.
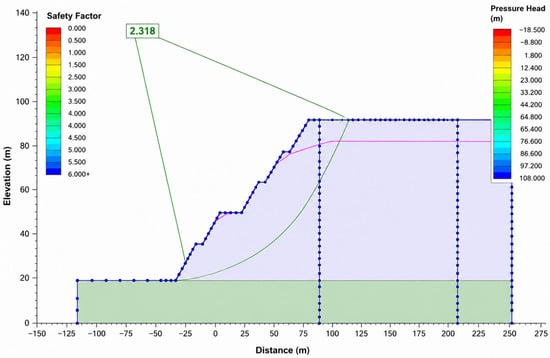
The Slide limit-equilibrium result for Scenario C is presented in Figure 17. Its FoS of 2.32 should not be interpreted as directly equivalent to the RS2 critical SRF of 2.14 because the methods use different failure searches, material representations, and failure criteria; the two results are compared only as an engineering consistency check.
Figure 17.
Limit-equilibrium stability analysis of strongly weathered benches in Slide for Scenario C, FoS = 2.32.
The difference between Slide (FoS = 2.32) and RS2 (FoS = 2.14) is approximately 8.4% relative to the RS2 result. Despite the different mathematical formulations, this level of agreement supports the same overall interpretation that the analyzed geometry retains an adequate stability margin, while also demonstrating the sensitivity of the absolute FoS value to the selected calculation approach.
The RocPlane analysis of planar bench failure in Sector 2 is shown in Figure 18; the calculated factor of safety is FoS = 1.60.
Figure 18.
RocPlane analysis of planar bench failure in Sector 2 for a slope dip direction of 210°, FoS = 1.60.
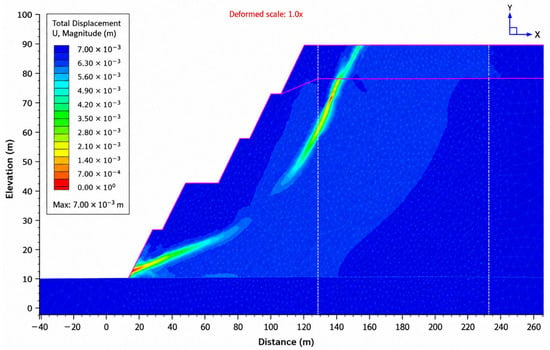
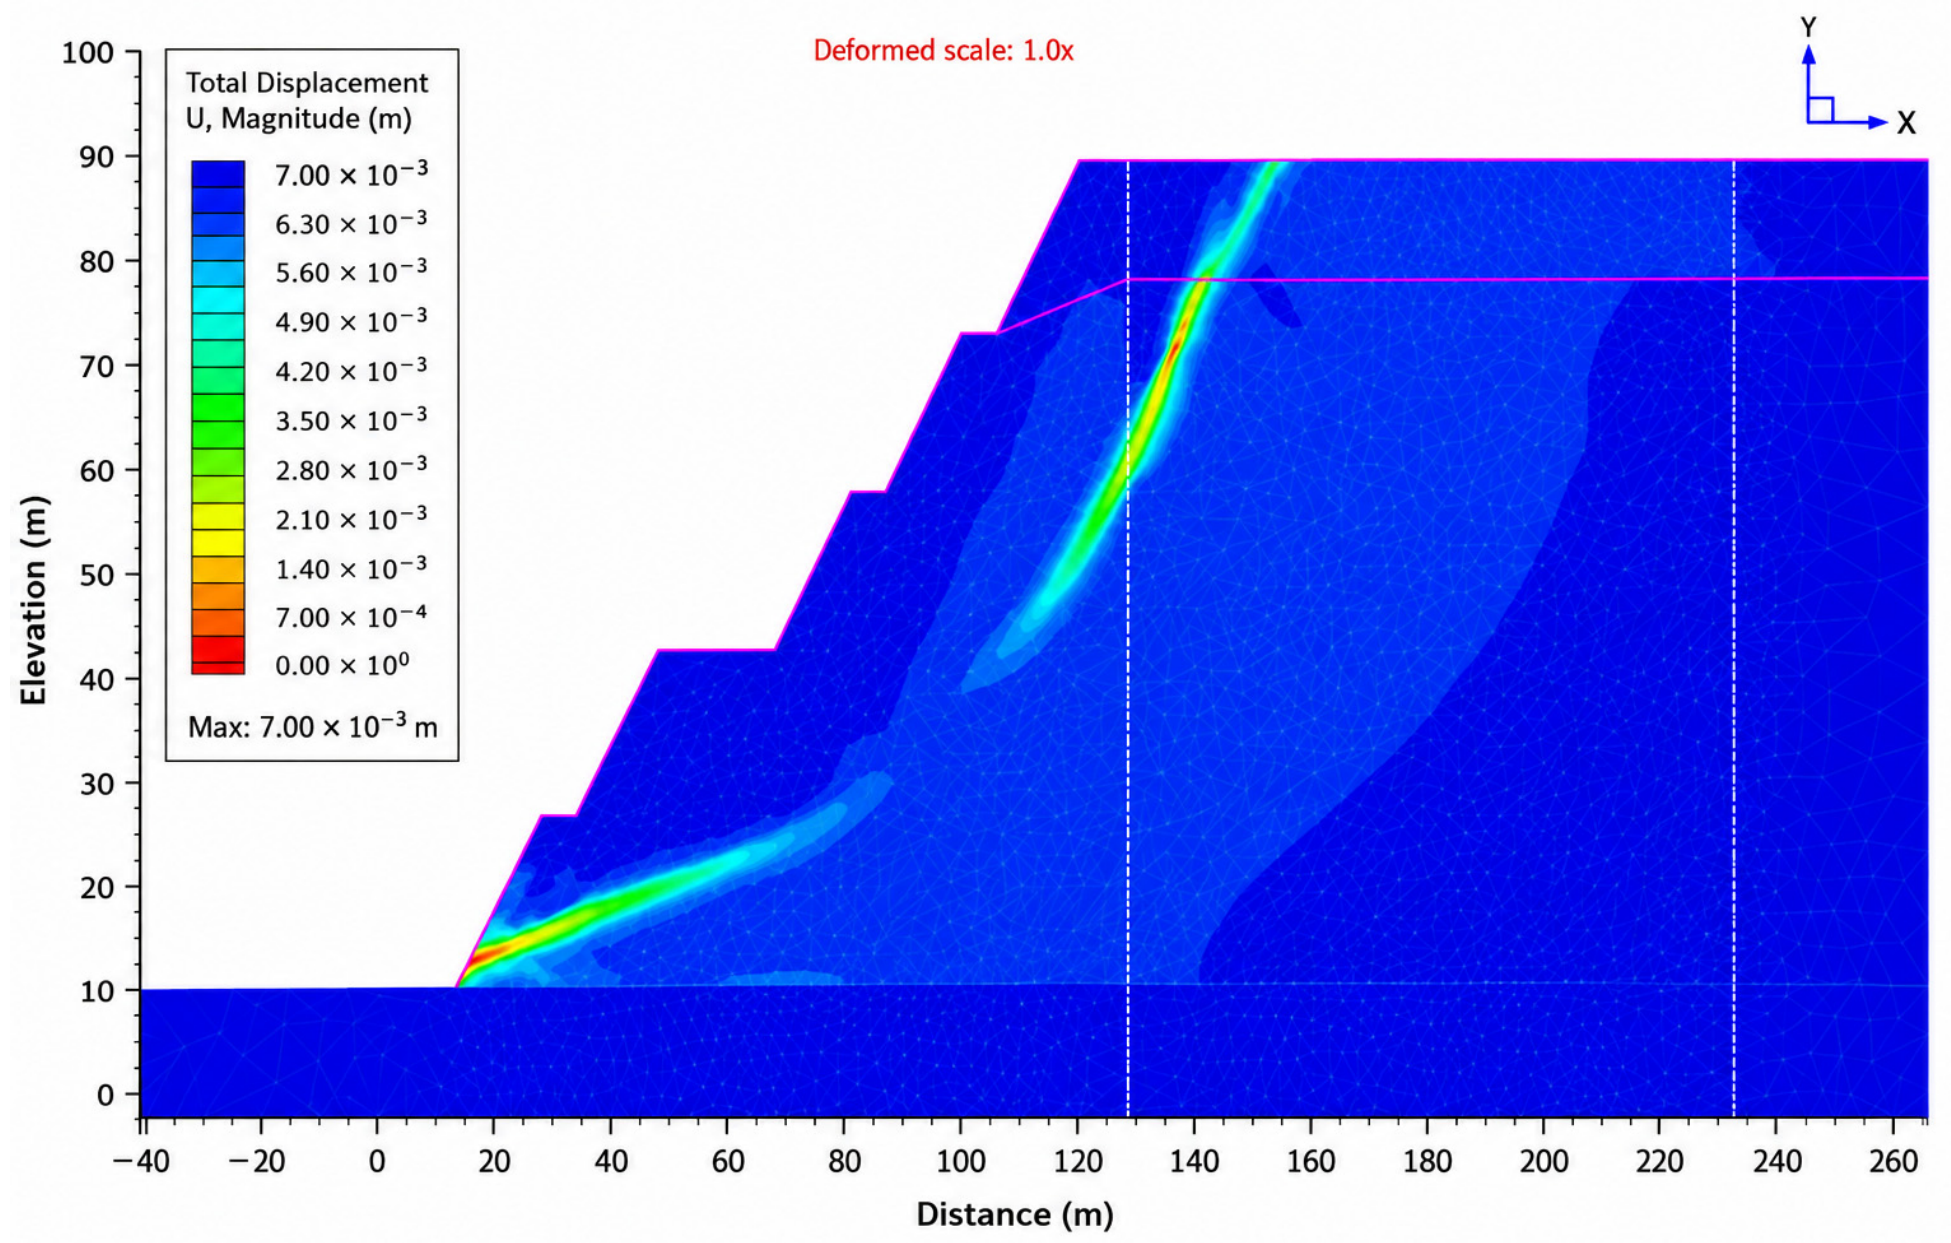
The RS2 analysis of planar bench failure in Sector 2 is shown in Figure 19; the calculated factor of safety is FoS = 1.80.
Figure 19.
RS2 analysis of planar bench failure in Sector 2 for a slope dip direction of 210°, FoS = 1.80.
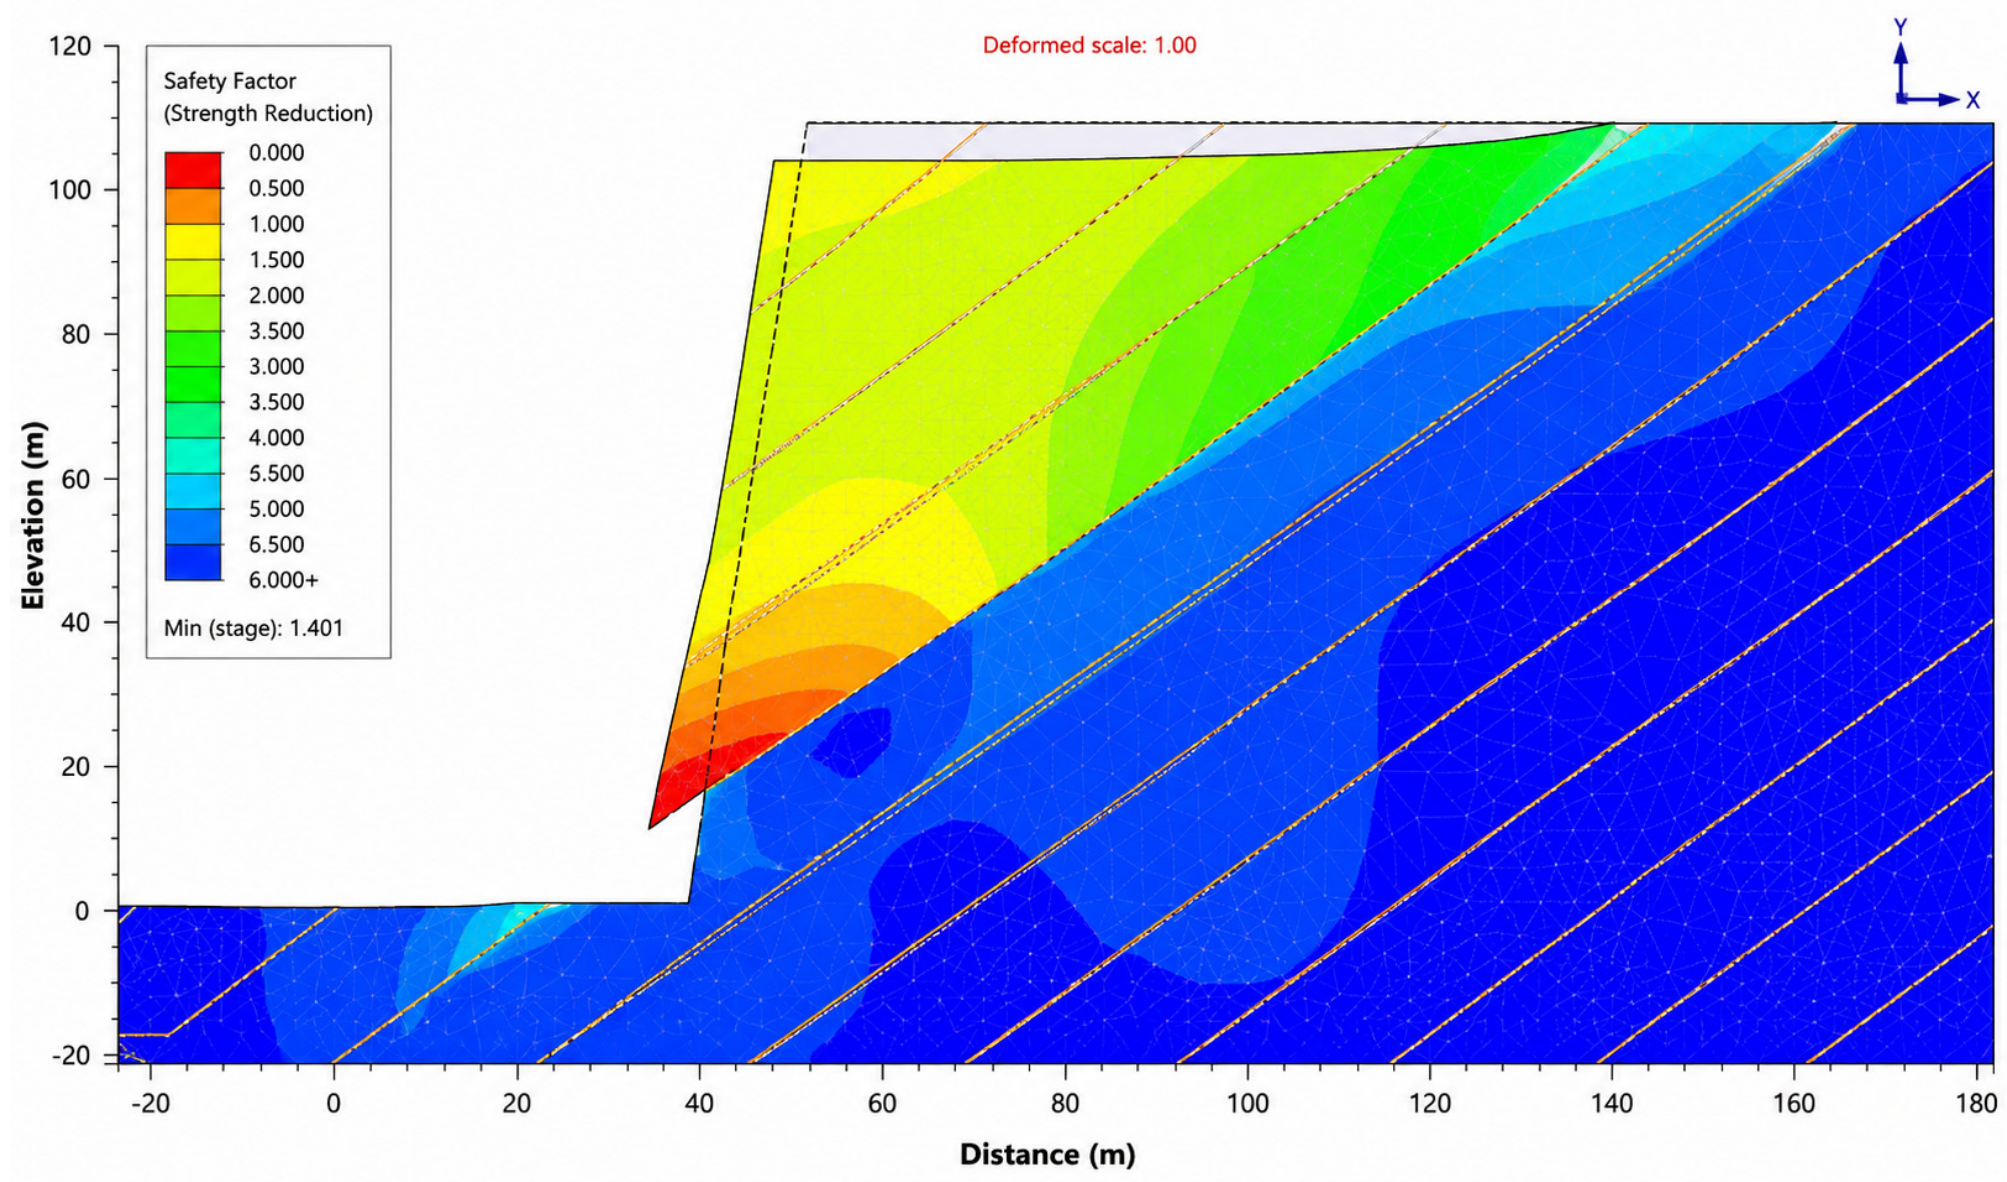
For the Sector 2 planar case, RS2 gives a critical SRF of 1.80, whereas RocPlane gives a block-equilibrium FoS of 1.60. The numerical difference of 0.20 is reported descriptively, not as proof of method equivalence. RocPlane prescribes a planar discontinuity-controlled block, while RS2 permits stress redistribution, deformation, and progressive localization within the modeled rock mass and interfaces.
The RS2 analysis of flexural toppling in Sector 2 is presented in Figure 20.
Figure 20.
RS2 analysis of flexural toppling in Sector 2 for a slope dip direction of 210°.
The RS2 analysis of toppling in Sector 2 for a slope dip direction of 210° is shown in Figure 21.
Figure 21.
RS2 analysis of bench toppling in Sector 2 for a slope dip direction of 210°.
The results of block-sliding analysis in Sector 2, considering all joint sets, are presented in Figure 22.
Figure 22.
RS2 analysis of bench block sliding in Sector 2 for a slope dip direction of 210°, considering all joint sets within the geotechnical domain.
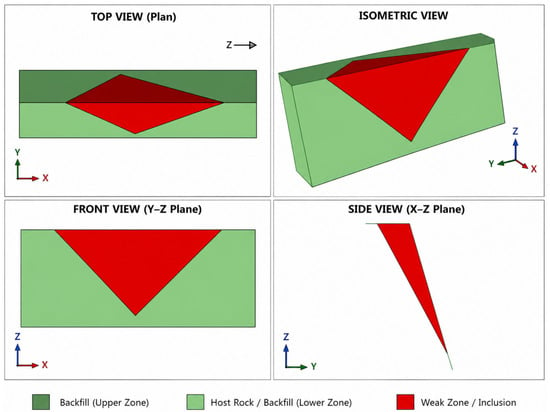
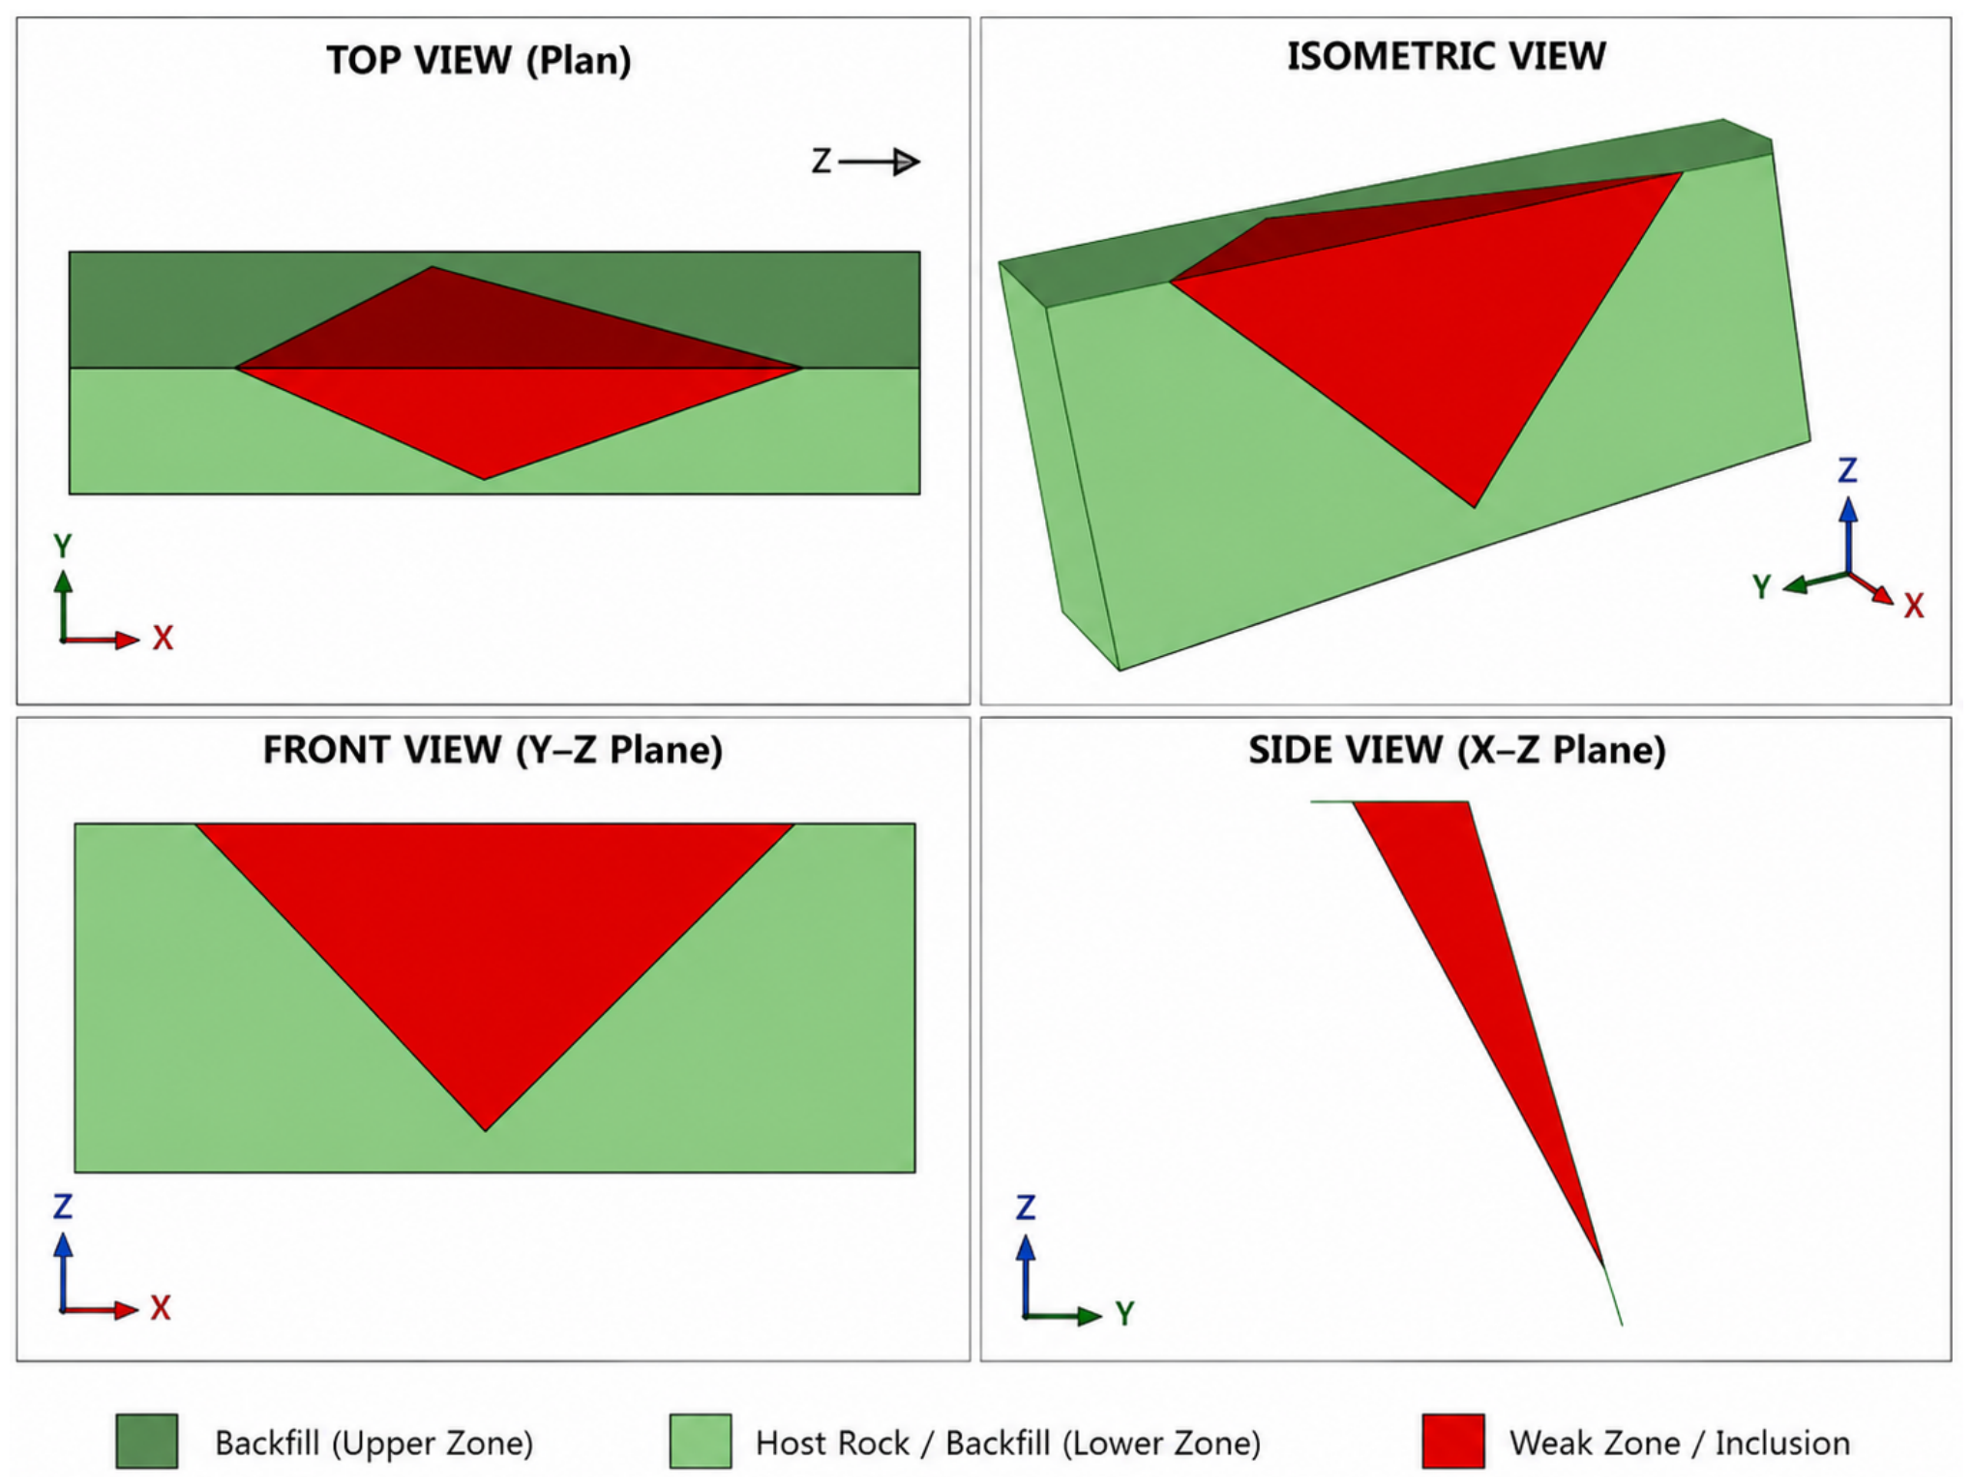
The SWedge analysis of a surface wedge in Sector 7 is presented in Figure 23.
Figure 23.
SWedge stability analysis of a surface wedge in Sector 7 for a slope dip direction of 085°.
The relationship between wedge-failure probability and bench angle for Sector 7 is shown in Figure 24; the SWedge results indicate a rational bench angle of approximately 70°.
Figure 24.
Wedge-failure probability versus bench angle from SWedge analysis for Sector 7.
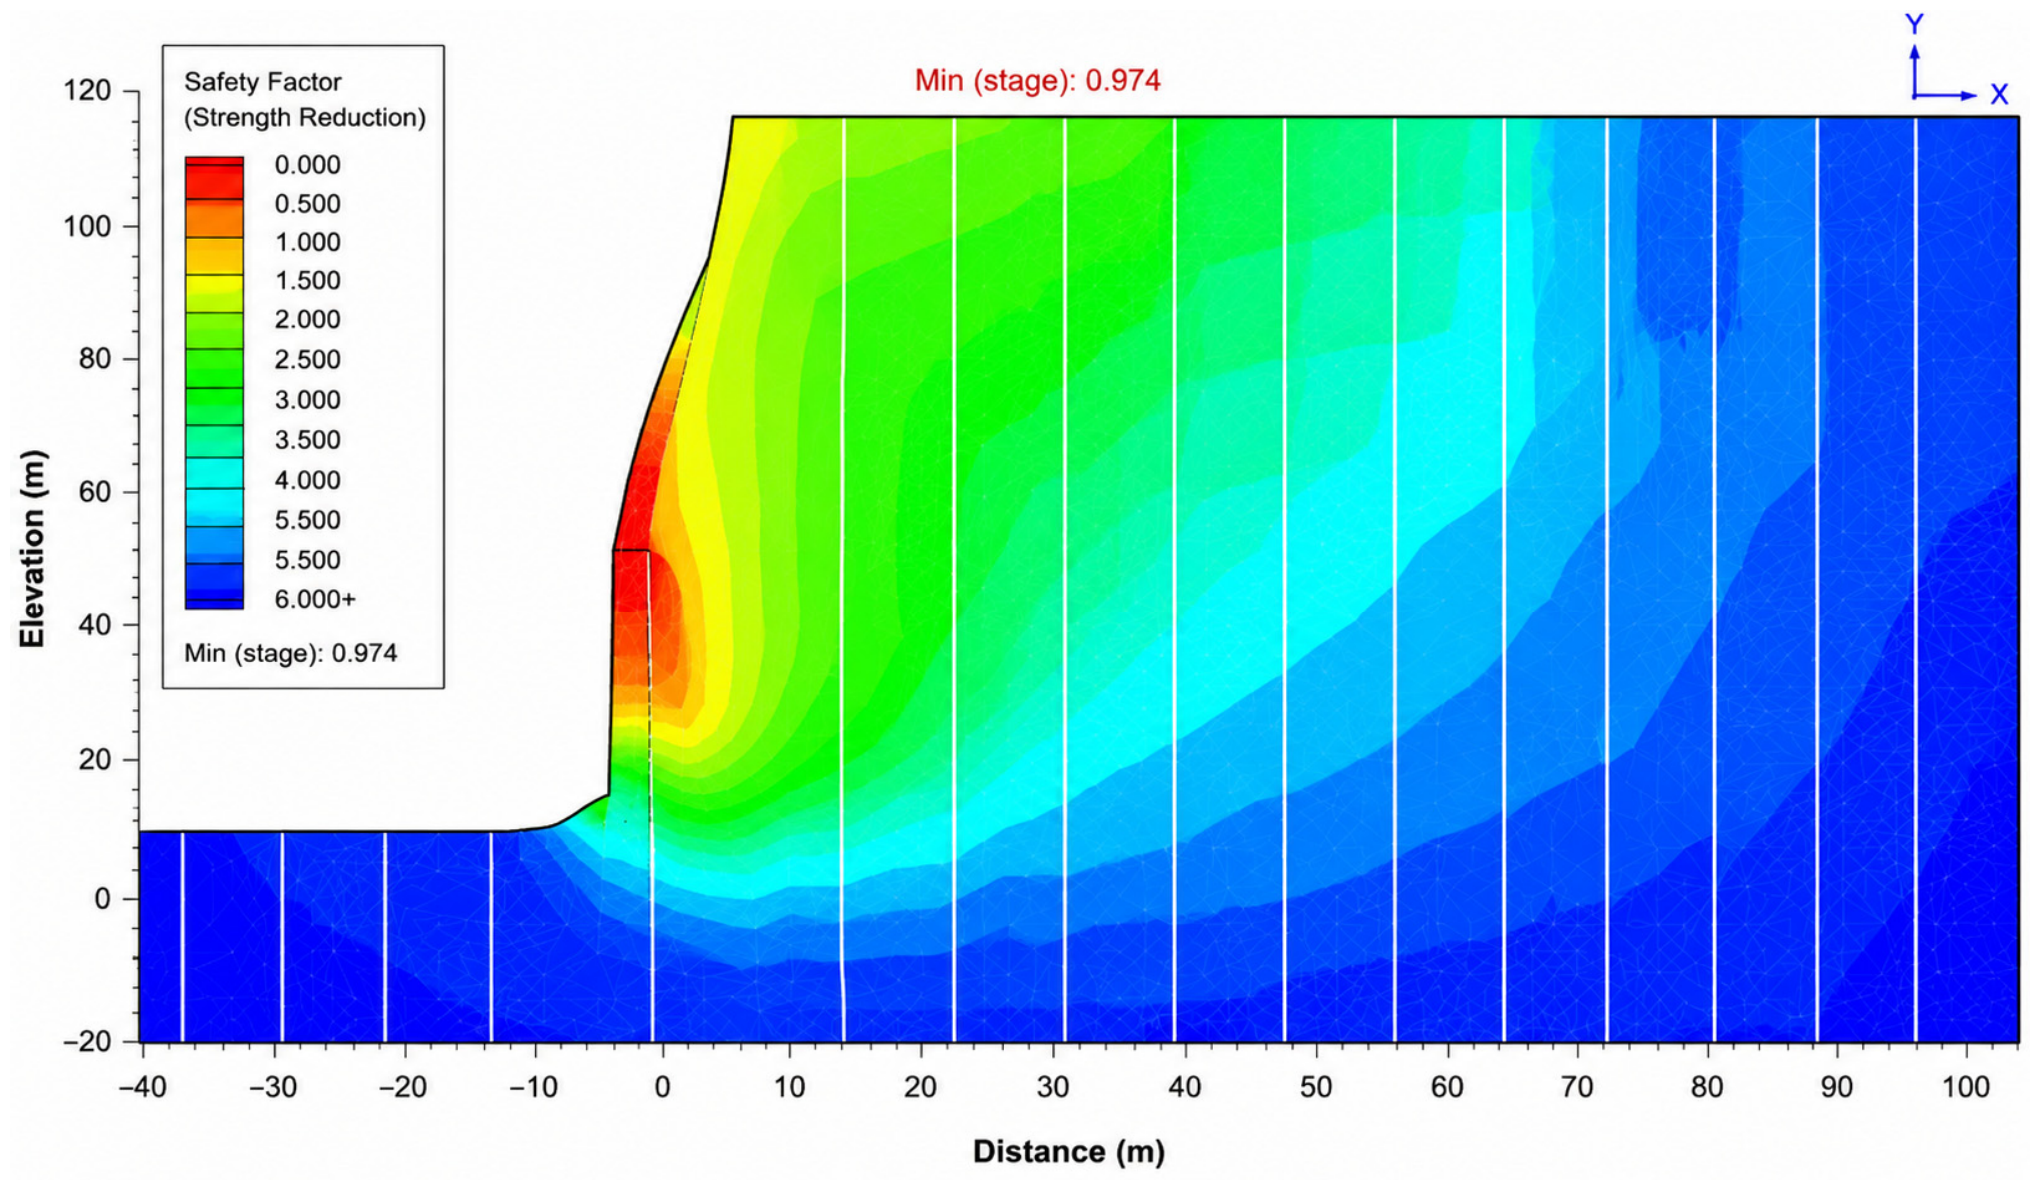
Overall stability of the design slope was checked for potential deep-seated and rotational failure mechanisms using the limit-equilibrium method (Slide) and finite-element analysis (RS2). Calculations were performed for several hydrogeological scenarios to evaluate the sensitivity of overall stability to pore-pressure conditions and drainage efficiency. The analyzed design configurations remained stable, although the scenario analysis confirms the need for continuous hydrogeological control.
Overall-slope stability modeling in RS2 under the conservative hydrogeological scenario is shown in Figure 25.
Figure 25.
RS2 analysis of overall open-pit slope stability under conservative hydrogeological conditions.
The overall-stability analyses indicate that no critical deep-seated failure mechanism involving multiple benches was identified for the design configurations considered. Nevertheless, calculated reliability depends on the hydrogeological scenario, the spatial position of major structures, and the parameters of the corresponding geotechnical domain. The final assessment should therefore be based on a set of sector-specific 2D analyses together with spatial 3D verification rather than on a single design section.
The combined analysis reveals two clear trends. First, introducing a subvertical fault under dry conditions reduces the FoS of quartz/mixed diorite from 2.80 to 2.50, or by approximately 10.7%. Second, hydrogeological deterioration has a stronger effect: under Scenario C, the reduction relative to the dry state reaches 37.5–38.3%. Thus, for the cases considered, adverse groundwater conditions have a greater impact on overall stability than a single subvertical fault, although structural mechanisms remain dominant locally.
Extended results of overall-slope stability assessment for different hydrogeological conditions and geotechnical domains are presented in Table 10.
Table 10.
Extended results of overall-slope stability analysis.
Comparison of Calculation Methods and Key Stability Factors
Comparison of the results allows the controlling factors to be ranked by scale. At bench scale, the orientation and combination of joint sets are decisive; at inter-ramp scale, the properties of the corresponding geotechnical domain and slope geometry are dominant; and at overall-slope scale, hydrogeological conditions and major structures govern stability. Independent calculations show acceptable consistency: Slide and RS2 give FoS values of 2.32 and 2.14, respectively, for strongly weathered rock under Scenario C, while RocPlane and RS2 give 1.60 and 1.80 for the planar mechanism in Sector 2. This does not imply equivalence of the methods, but it confirms a consistent engineering interpretation under different modeling assumptions.
3.5. Sensitivity Analysis and Engineering Uncertainty
The more-than-two-order-of-magnitude spread in UCS, differences in joint-set orientation, and reduction of FoS by up to 38.3% under adverse drainage conditions indicate that uncertainty in the input parameters is comparable in importance to the choice of calculation method. The results suggest the following sensitivity hierarchy: (1) hydrogeological condition is the main systematic control on overall stability; (2) adverse orientation of joints and major structures is the main control on local and sector-scale mechanisms; and (3) variability in UCS/GSI and estimated JCS values are the principal sources of parametric uncertainty within domains. The results are therefore interpreted as a set of scenarios rather than as a single universal deterministic stability value.
The relation JCS = 0.25·UCS was retained from the project model only for intervals without direct JCS measurements. It represents degradation of joint-wall strength relative to intact core by weathering, alteration, and near-surface damage and is not proposed as a universal relationship for granodiorite or quartz diorite. Its applicability is therefore limited to preliminary domain-scale analysis and must be replaced by direct joint-wall testing when design decisions are sensitive to discontinuity strength.
A one-at-a-time sensitivity check was completed by multiplying each estimated JCS value by 0.5 and 1.5 while holding geometry, groundwater, JRC, and friction parameters constant. For the Sector 2 structurally controlled RS2 case, the critical SRF changed from 1.80 at the base estimate to 1.68 and 1.88 (−6.7% and +4.4%). For the strongly weathered Scenario C case, SRF changed from 2.14 to 2.06 and 2.20 (−3.7% and +2.8%). The response is nonlinear because the mobilized roughness contribution decreases with normal stress. Within the tested range, JCS uncertainty affects the calculated margin but is smaller than the approximately 38% reduction associated with the hydrogeological scenarios; nevertheless, estimated JCS domains should be prioritized for direct testing.
The two cases were selected because they represent the configurations in which uncertainty in estimated JCS is most likely to affect the engineering interpretation. The Sector 2 case combines adverse discontinuity orientation with explicitly represented joint interfaces at bench scale, whereas the strongly weathered Scenario C case combines degraded joint-wall conditions with the highest analyzed pore pressure at a larger slope scale. Together, they bracket a structurally controlled local mechanism and a hydrogeologically aggravated weathered-domain mechanism. The cases are therefore representative critical estimated JCS conditions, but they do not constitute an exhaustive global uncertainty analysis. The one-at-a-time design was retained to isolate the effect of JCS; interactions among JCS, JRC, persistence, and pore pressure should be addressed in future probabilistic or global sensitivity analyses. The numerical results are summarized in Table 11.
Table 11.
Sensitivity of calculated SRF to uncertainty in estimated JCS.
From an engineering perspective, the highest-priority areas are those where three conditions coincide: adverse orientation of discontinuity sets relative to the slope, weakened or weathered material, and elevated pore pressure. More conservative geometry, enhanced drainage, and instrumental deformation monitoring are recommended for such zones.
3.6. Three-Dimensional Verification of Overall Stability
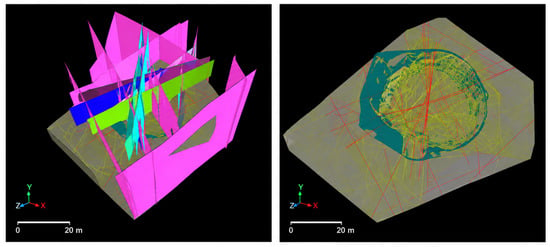
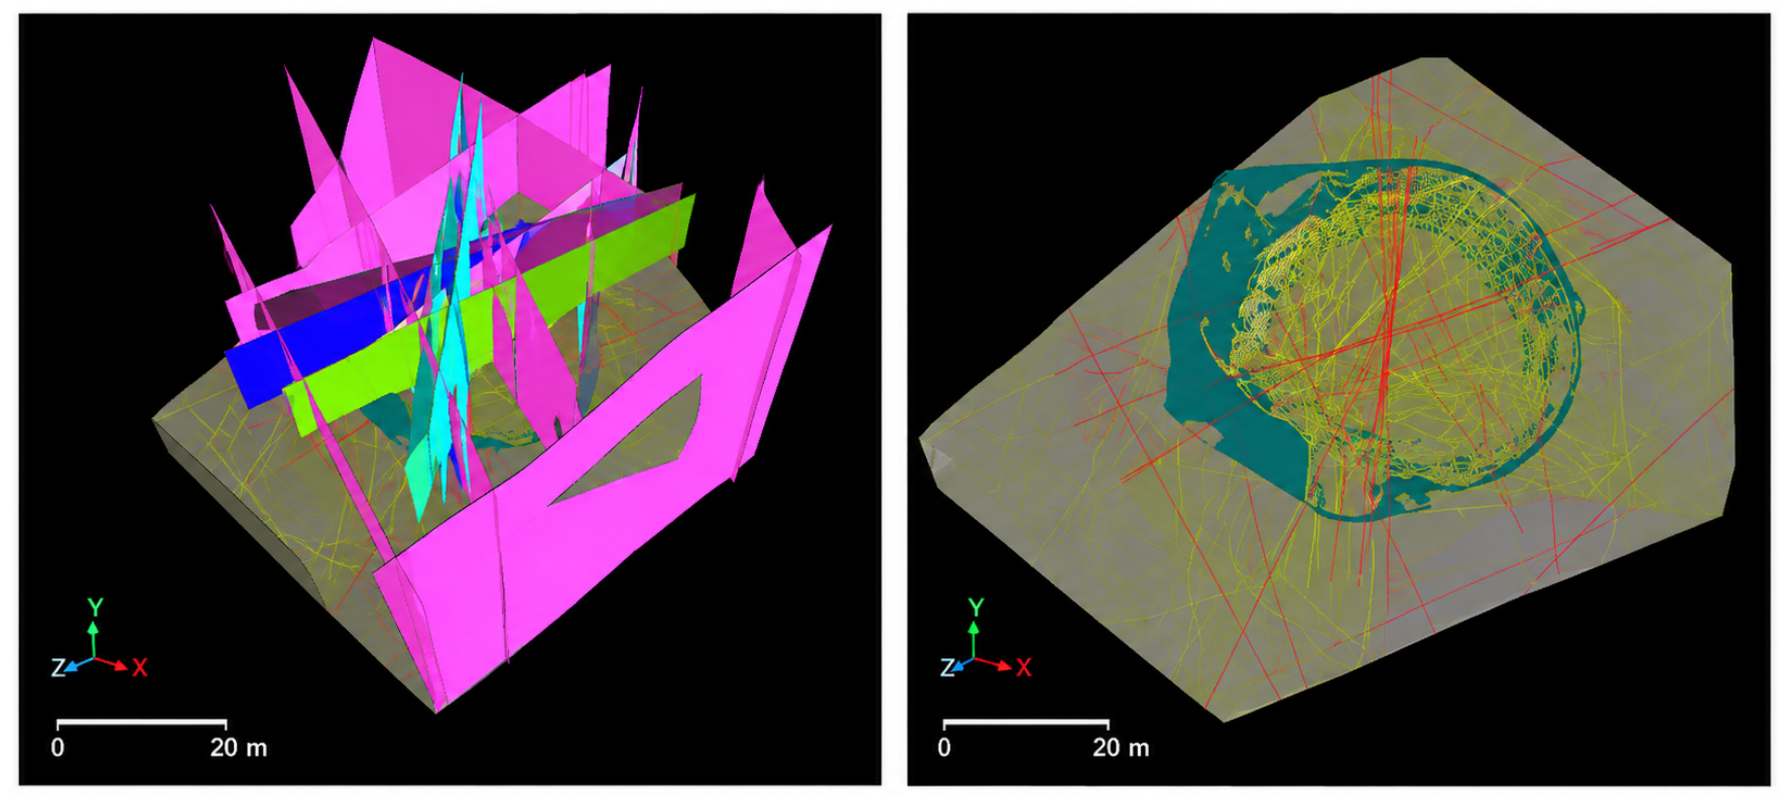
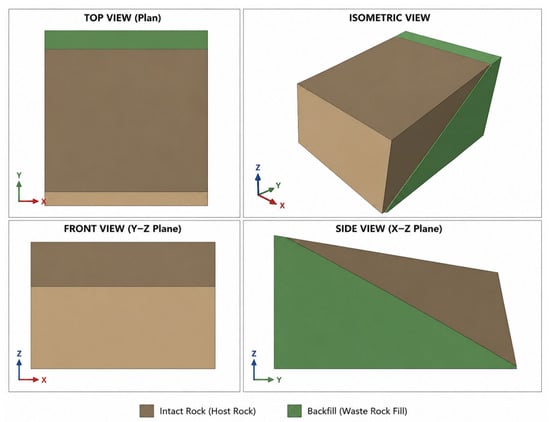
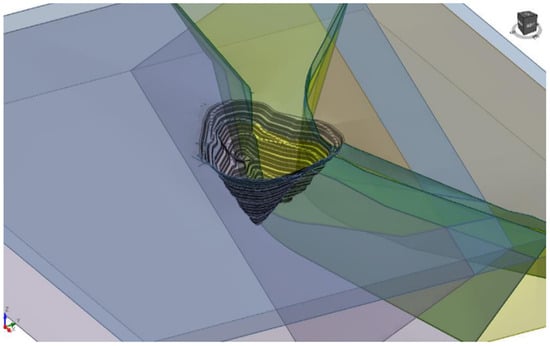
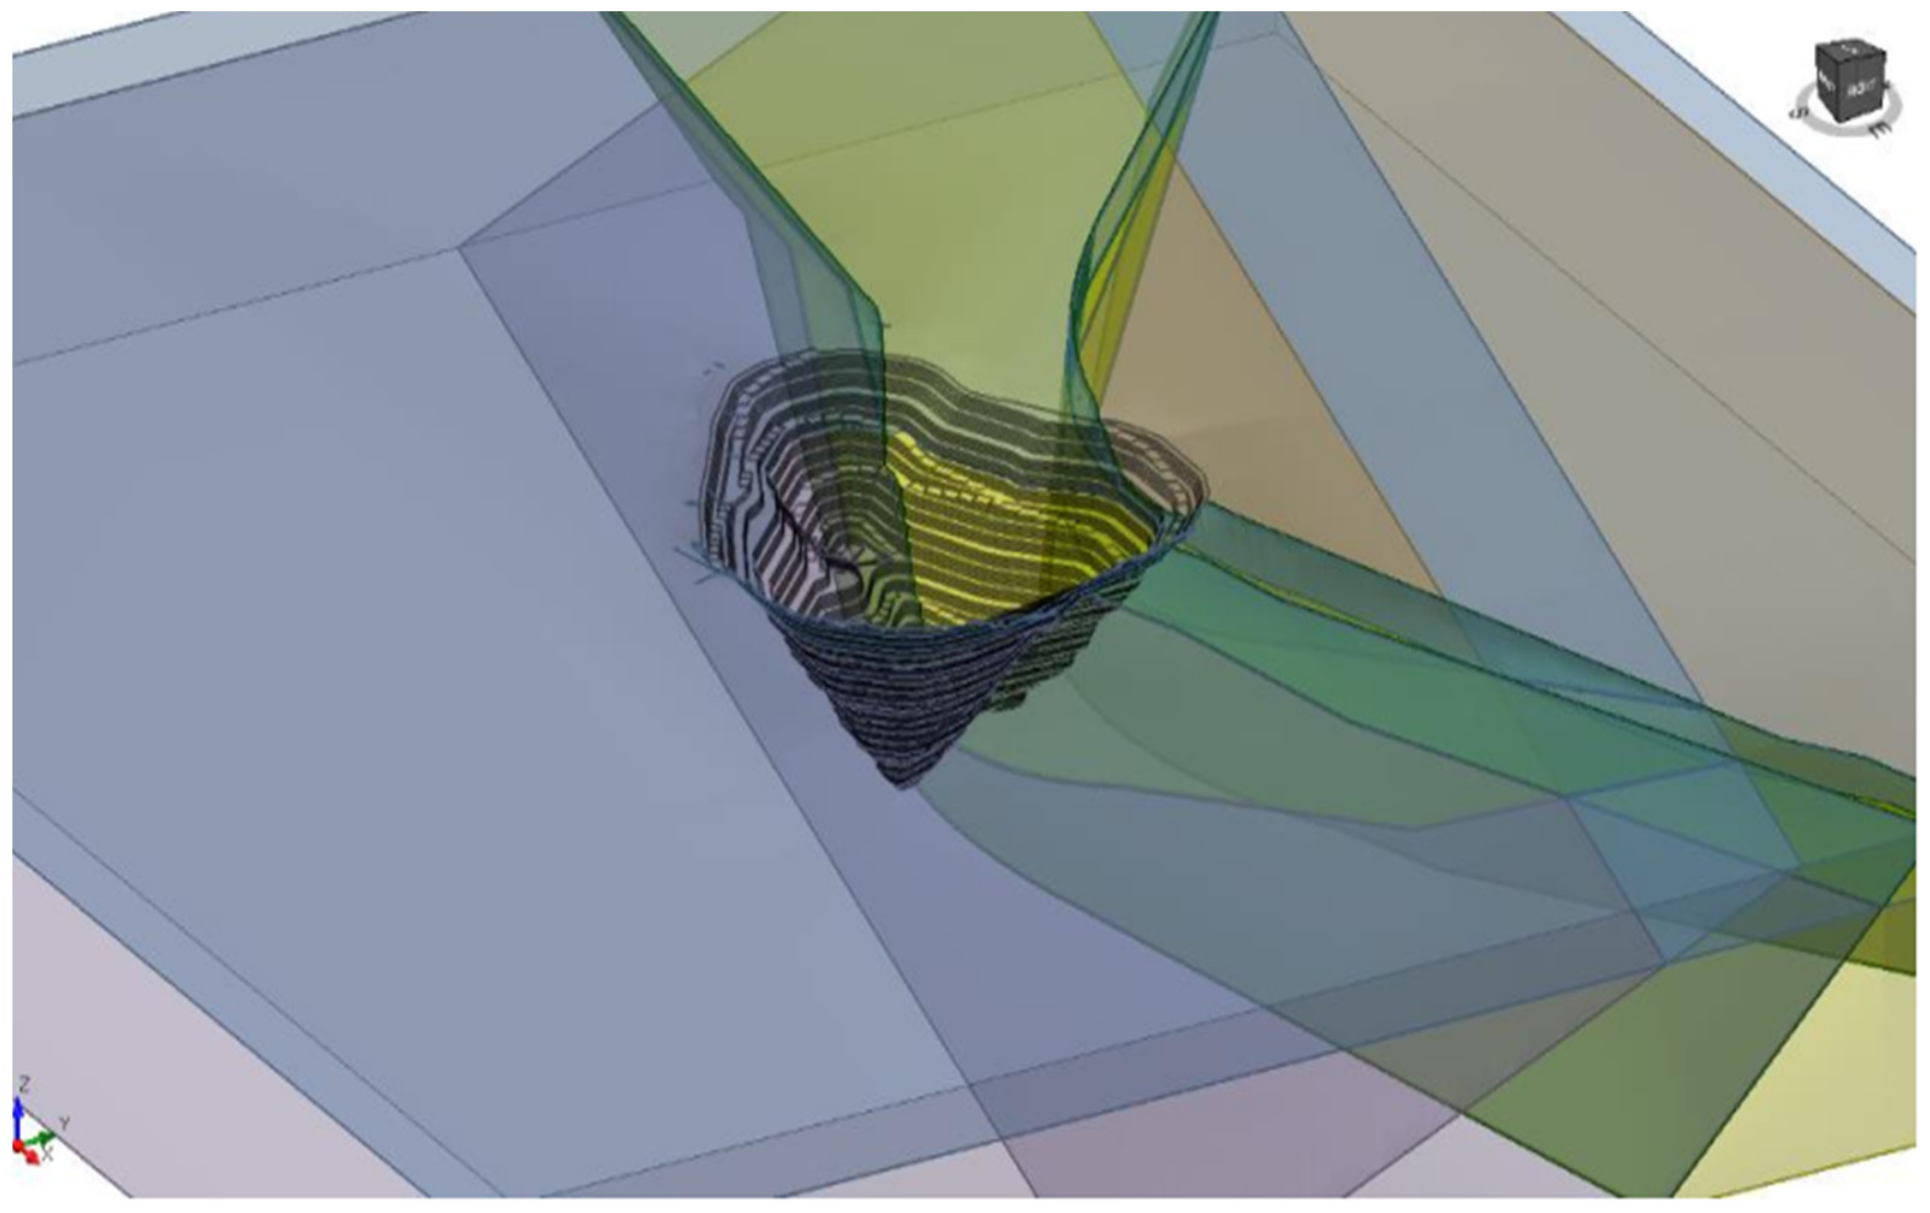
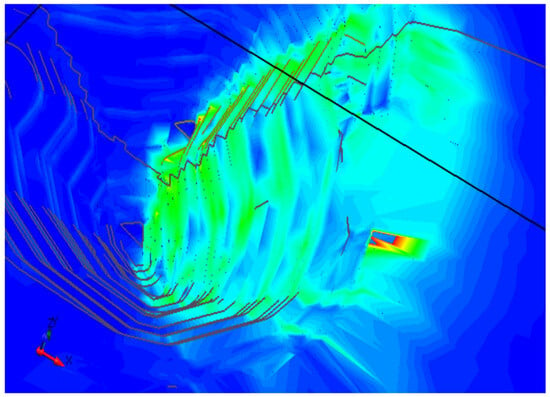
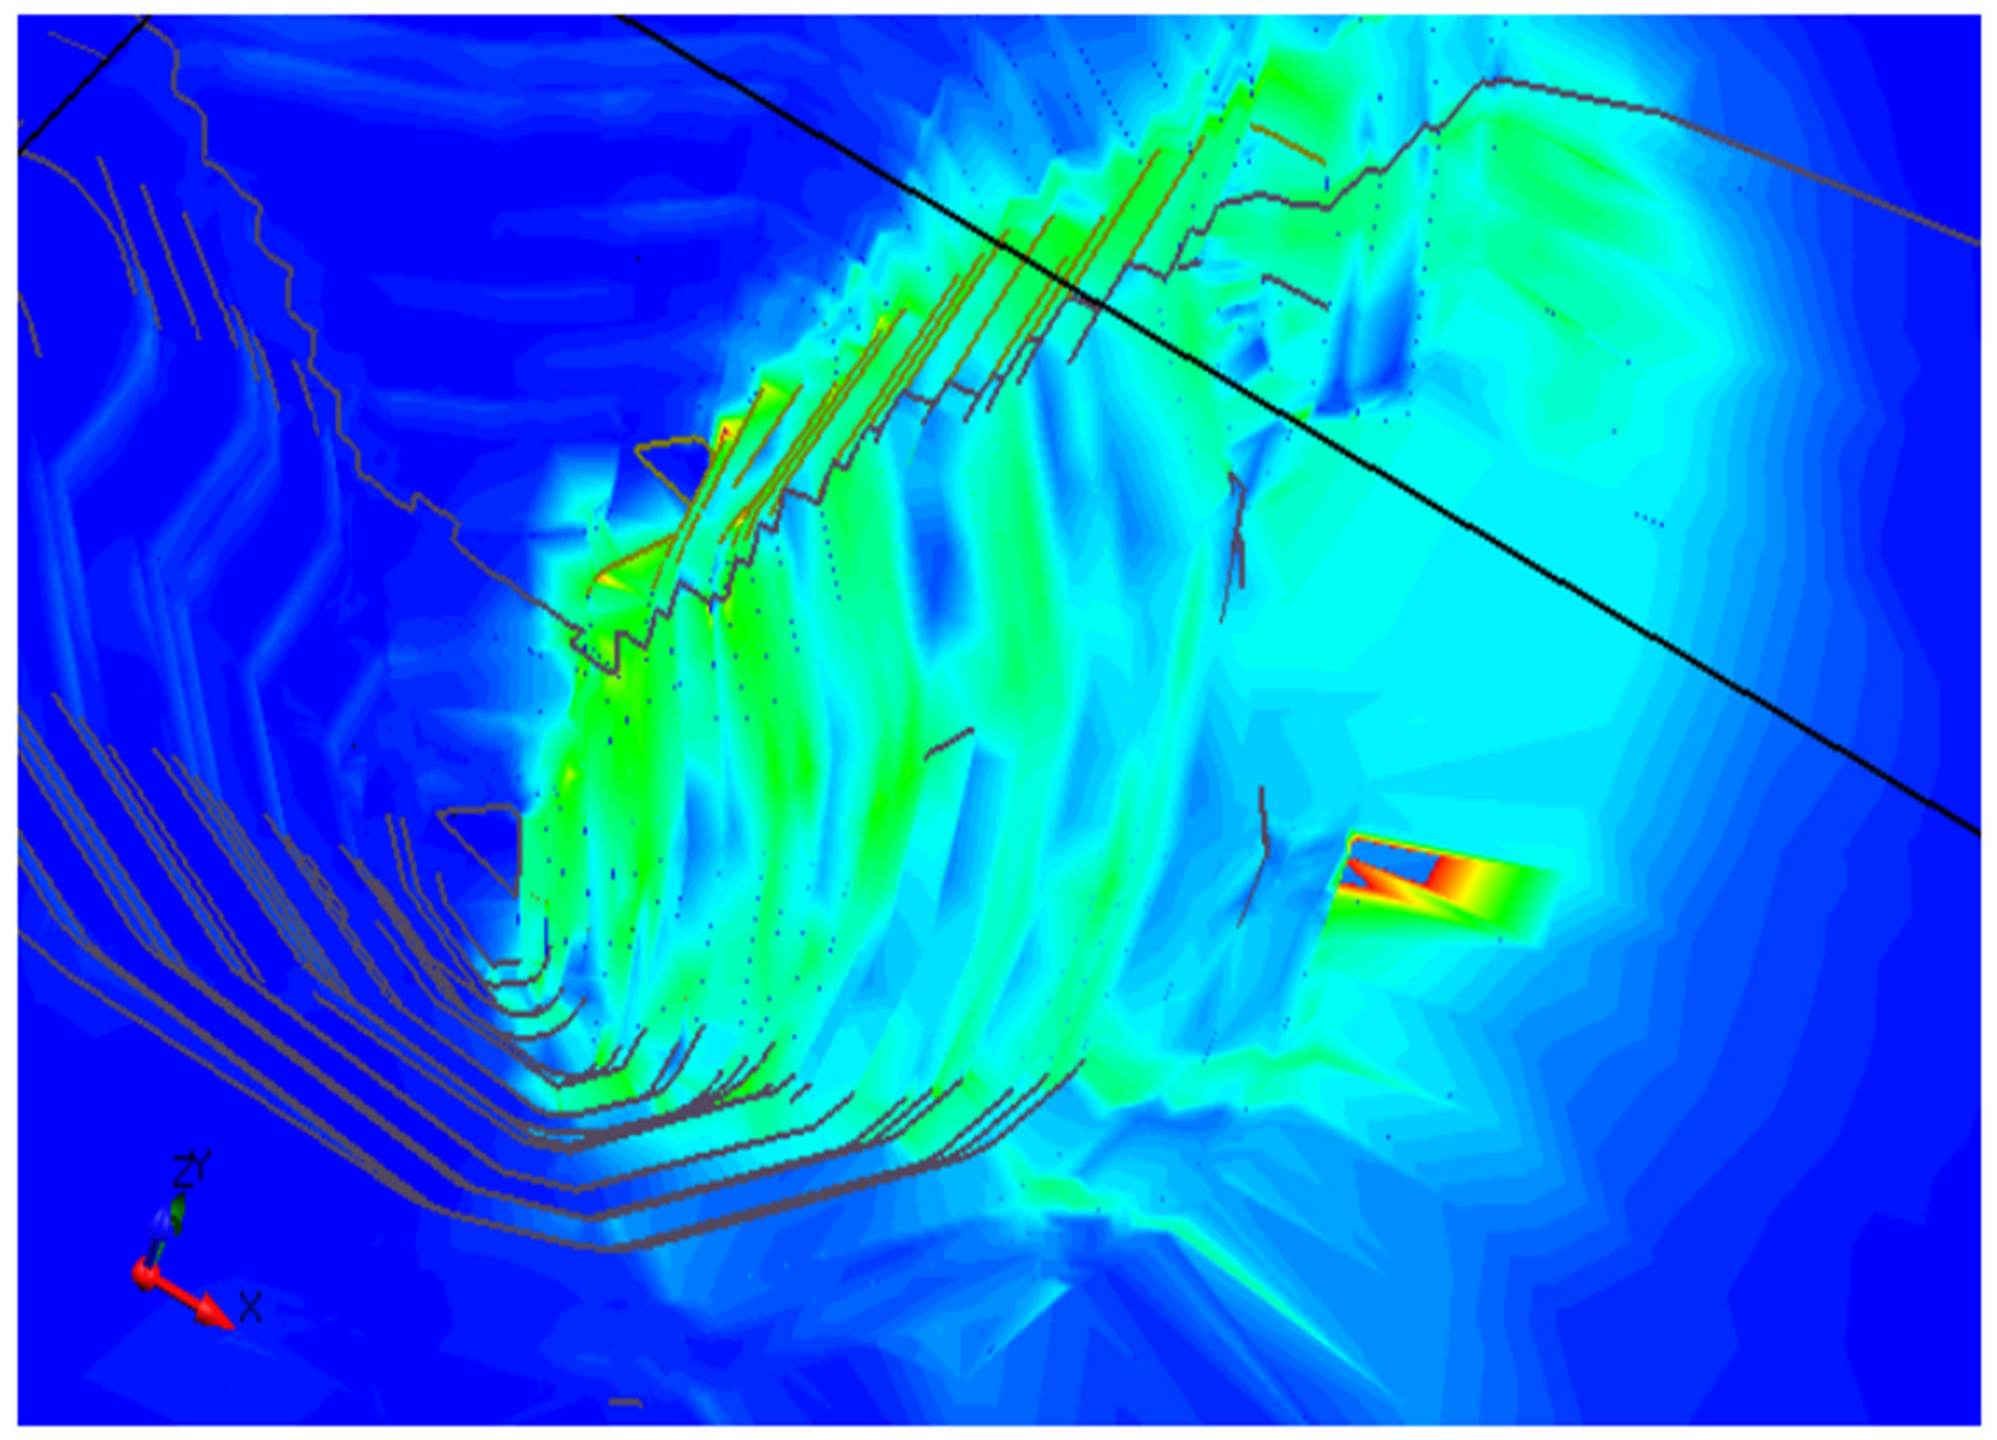
Two-dimensional design sections do not always adequately represent the spatial position of geological structures, lithological contacts, and the complex topography of the pit shell. Therefore, three-dimensional modeling in RS3, the spatial analogue of RS2, was used to verify overall stability and assess areas associated with major faults. The model geometry is shown in Figure 26, and an example of calculated parameter distribution and deformation localization outside the design contour is shown in Figure 27.
Figure 26.
Three-dimensional geometric model of the open pit and major structural discontinuities in RS3.
Figure 27.
Results of three-dimensional numerical modeling in RS3 showing calculated parameter distribution around the design contour.
The RS3 verification used the same domain parameters and Scenario C groundwater state as the controlling RS2 overall-slope model. The three-dimensional critical SRF was 1.58, compared with 1.63 for the controlling granodiorite RS2 section, a difference of 3.1% relative to RS2. The maximum displacement at the last converged pre-failure stage was approximately 0.18 m in RS3 and 0.16 m in the corresponding RS2 section. Both models localized maximum shear strain from the lower slope toward the same major structural corridor; RS3 additionally showed lateral confinement and curvature of the localization zone around the fault termination.
This comparison is scenario-based numerical evidence, not field validation. Agreement in critical SRF, displacement order of magnitude, and localization position supports internal consistency between the selected 2D section and the 3D geometry, but it does not demonstrate actual field performance. Effective validation requires calibration against piezometric heads and observed deformation vectors and rates. Until such data are available, the RS3 result is used to identify spatially critical zones and to test whether the 2D section is conservative, rather than as an independently verified prediction.
The combined results identify three levels of stability control: local structural control at bench scale, domain-dependent stability at inter-ramp scale, and hydrogeologically sensitive overall-slope stability. This hierarchy integrates field observations, laboratory testing, and numerical modeling within a single analytical framework and reduces the risk of applying local parameters to the entire pit without regard to their spatial applicability (Table 12).
Table 12.
Summary of methodological contributions and key quantitative results of the study.
4. Discussion
The discussion below evaluates the results against published open-pit case studies and advanced discontinuity-resolving numerical research, and separates transferable methodological findings from site-specific design parameters.
Interpretation must follow the scale of the modeled mechanism. Bench-scale planar and wedge failures are governed primarily by discontinuity orientation and connectivity, whereas inter-ramp and overall-slope responses integrate rock-mass strength, geometry, faults, and groundwater. The software results are therefore used as complementary evidence for a mechanism, not as interchangeable FoS values.
The reported stability indices are method specific and are not treated as directly interchangeable. RocPlane calculates force equilibrium for a prescribed planar block sliding on a single discontinuity. SWedge evaluates a geometrically defined wedge and may additionally report probability of failure. Slide computes limit equilibrium along a searched slip surface under an assumed interslice–force relationship. RS2 and RS3 identify the strength-reduction factor at numerical loss of stability in deformable two- and three-dimensional continua containing explicit or equivalent discontinuities. Consequently, differences among values may arise from failure geometry, dimensionality, constitutive law, stress redistribution, pore-pressure representation, and the numerical definition of failure. Cross-method comparison is used only to determine whether independent models support the same qualitative mechanism and risk ranking.
In the comparison below, discrete fracture network (DFN), limit-equilibrium method (LEM), finite-element method (FEM), and discrete-element method (DEM) are written in full at first use.
The key result is a scale-dependent shift in the governing stability factor. Bench stability is primarily controlled by the orientation, persistence, connectivity, and infill condition of discrete discontinuities; inter-ramp slope stability by domain-scale strength and geometry; and overall-slope stability by hydrogeological conditions and major structures [14,15,16,17,18,19,20,21,22,23,24,25,26,27]. This interpretation is consistent with DFN-based probabilistic block analysis, which demonstrates the sensitivity of bench-scale failure to discontinuity geometry [6], and with recent discontinuity-resolving approaches. The hybrid cohesive phase-field method of Wang et al. explicitly captures tensile-shear fracture along persistent and non-persistent discontinuities and the stabilizing role of rock bridges [3,7,28,29,30,31,32,33]. Hydro-mechanical compression–shear experiments by Liu et al. show that hydraulic pressure promotes crack initiation and coalescence while reducing peak and residual strength [34]. Comparative LEM-FEM-DEM research further shows that explicitly represented joints may change both the predicted mechanism and the stability margin in highly jointed slopes [35]. These independent experimental and numerical results corroborate the present kinematic, laboratory, and RS2 evidence that joint orientation is a first-order control at bench scale, while also showing that orientation must be interpreted together with persistence, connectivity, rock bridges, infill, and water pressure.
A more explicit mechanistic interpretation is provided by the hydromechanical coupling constitutive model of Wang et al. [36], developed from compression–shear–seepage tests across different joint roughness coefficients, confining pressures, and water pressures. The model describes the progression from elastic compaction through shear dilation to shear wear and links the evolving mechanical response to hydraulic changes along the joint. In the context of Vasilkovskoye, this framework indicates that adverse orientation and connectivity determine whether a bench-scale release mechanism is kinematically feasible, whereas the mobilized resistance and its degradation depend on JRC, JCS, normal stress, persistence, aperture evolution, water pressure, and drainage. This provides a physical basis for interpreting the stronger stability reduction under elevated pore pressure and supports joint-specific monitoring and parameter calibration. The constitutive model was not implemented directly in the present RS2 or RS3 analyses and is therefore used as independent mechanistic support rather than as a description of the current numerical formulation.
For Sector 2, RocPlane represents sliding of a predefined rigid block, whereas RS2 allows deformation, stress redistribution, and progressive localization. Their values of 1.60 and 1.80 support the same stability ranking for the analyzed case, but the difference reflects model formulation rather than measurement error. Agreement is interpreted qualitatively: both approaches identify the same structurally controlled sector and show a positive calculated margin.
Three-dimensional verification is particularly important in sectors with a complex pit contour, major faults, and spatially variable lithological contacts, where 2D sections may not reproduce actual failure kinematics. RS3 was therefore used as an additional verification level for the most critical areas, consistent with modern spatial analyses of open-pit slopes and fault-controlled numerical studies [9,10,11,12,37,38,39,40].
The sector-based geometry follows directly from the observed heterogeneity. Weathered and highly fractured intervals require flatter faces because their strength is controlled by degraded rock mass and discontinuity condition; steeper benches are reasonable only in less weathered domains after kinematic checks confirm that persistent joints do not daylight adversely. The recommended angles are therefore outputs of the Vasilkovskoye domain model, not universal design values.
The approximately 38% FoS reduction under Scenario C is explained by the expansion of elevated pore pressure through the potential failure zone. Higher water pressure lowers effective normal stress, reduces frictional resistance along joints and faults, and allows a larger portion of the slope to mobilize simultaneously [40,41]. The similar relative reduction in quartz/mixed diorite and granodiorite indicates that groundwater deterioration acts as a systematic control despite different dry-state margins. Practically, pit deepening should proceed only when drawdown performance is confirmed by piezometers; drainage capacity should be reviewed where pore pressures remain above the Scenario B trend; and radar or survey monitoring frequency should increase when rising pressure coincides with accelerating deformation.
The Kazakhstan comparison clarifies both transferability and limits. Aktogay is a large porphyry-copper open pit in which slope design is managed through sector-based geotechnical models, structural interpretation, three-dimensional analysis, and iterative risk control [13]. Vasilkovskoye is a gold deposit in an intrusive granodiorite–quartz diorite setting with strong UCS variability, weathered upper domains, and locally adverse joint sets. The common, generalizable finding is methodological: both sites require domain- and sector-specific parameterization, 3D updating, and monitoring-led design review. The principal differences are ore-deposit setting, lithological architecture, structural network, weathering distribution, hydrogeological response, and analyzed slope geometry. Severny Katpar similarly demonstrates that lithology and tectonic disturbance must be represented explicitly in geomechanical models [14]. Consequently, the Vasilkovskoye FoS values, 70–80° bench face angles, and 53.8–60.0° inter-ramp slope angles are site-specific outputs and must not be transplanted directly to Aktogay, Severny Katpar, or any other mine [42,43].
This interpretation establishes an operational priority: groundwater and deformation trends should be reviewed together before steepening or deepening a sector. Adverse joint orientation controls where local failure can occur, while drainage deterioration controls how much of the slope becomes mobilized. Sectors combining both conditions require conservative geometry, maintained drains, and predefined trigger–action–response thresholds.
The principal limitations remain the two deep oriented boreholes, empirically estimated JCS values in several intervals, assumed permeability ranges, and the absence of long-term co-located piezometric and deformation calibration. Accordingly, the calculated margins represent defined scenarios and should be updated as new drilling, mapping, hydraulic testing, and monitoring data become available.
All FoS, SRF, displacement, and sensitivity values reported here are calculated scenario results. They have not been calibrated against a documented full-scale slope failure or a sufficiently long, co-located series of pore-pressure and deformation measurements. Available geological mapping, core logging, and laboratory data constrain the model inputs, but they do not demonstrate field performance. Accordingly, terms such as stable, validation, and confirmation refer only to the analyzed model configurations unless field evidence is explicitly stated.
Global Navigation Satellite System (GNSS) measurements are included as an independent displacement-control method.
Future calibration should pair vibrating-wire piezometer heads with radar, prism, GNSS, and mine-survey displacement vectors for the same sectors and time intervals. Back-analysis should update hydraulic conductivity, stiffness, GSI, discontinuity strength, and boundary conditions, after which the predicted and measured deformation rates and directions should be compared. Until this cycle is completed, the design recommendations should be implemented through a trigger–action–response plan and reviewed whenever excavation geometry, drainage behavior, or monitoring trends depart from the modeled assumptions.
Further verification should update geotechnical domains using new oriented boreholes, face mapping, piezometers, radar, and mine-survey data, and should include probabilistic analysis of UCS, GSI, JCS, discontinuity persistence, and hydrogeological parameters. Where sufficient data are available, FoS, probability of failure Pf, and reliability index β should be reported jointly using Monte Carlo simulation or response-surface methods for the most sensitive variables [15,16,17,18,41]. The transferable outcome of this study is the model–monitor–calibrate–update workflow; the numerical slope angles and FoS values remain specific to the investigated Vasilkovskoye sectors.
5. Conclusions
The following conclusions can be drawn from this study:
- Oriented drilling, ABI40 data, core logging, and laboratory testing defined sector-specific domains based on lithology, weathering, discontinuities, and mechanical properties.
- UCS varies from 4.11 to 247.27 MPa in quartz diorite and from 1.11 to 278.76 MPa in granodiorite, demonstrating that one averaged strength set is not representative of the pit rock mass.
- From the dry reference to the very-slow-drainage scenario, FoS decreases from 2.80 to 1.75 in quartz/mixed diorite and from 2.64 to 1.63 in granodiorite, equivalent to reductions of 37.5% and 38.3%. Drainage performance and pore pressure must therefore be controlled during pit deepening.
- The multi-method workflow provides complementary, not equivalent, stability indicators. RocPlane and SWedge address prescribed discontinuity-controlled blocks and wedges; Slide evaluates searched limit-equilibrium surfaces; and RS2/RS3 calculate numerical strength-reduction factors for deformable continua and explicit structures. The reported values therefore support a consistent scenario ranking but do not establish field performance or direct numerical equivalence among methods.
- For unweathered rock, a sector-based approach was justified with bench face angles of approximately 70–80° and inter-ramp slope angles of 53.8–60.0°; strongly weathered rock requires flatter geometry. These values are specific to the investigated Vasilkovskoye domains and must not be applied at other mines without site-specific verification. Further deepening should be supported by vibrating-wire piezometers installed in the principal rock domains and across major faults, with baseline and seasonal pore-pressure trends used to verify drainage performance. Ground-based radar should provide continuous line-of-sight deformation surveillance of active and high-consequence sectors, supplemented by prisms or GNSS control points and routine visual inspections. Trigger–action–response thresholds should combine displacement velocity and acceleration, inverse-velocity trends, pore-pressure change, rainfall or snowmelt, and blasting history. Exceedance of a site-calibrated threshold should initiate data validation, increased sampling frequency, field inspection, access control where required, and re-analysis of the affected 2D/3D model before design or operational changes are approved.
Taken together, the calculations show that a multi-level, domain- and sector-based framework can organize structural, mechanical, and hydrogeological controls at the scale of the relevant failure mechanism. The numerical results are conditional on the adopted geometry, material parameters, and groundwater scenarios and should be updated through additional investigation and monitoring-based calibration before being treated as demonstrated field performance.
Author Contributions
Conceptualization, Z.A., D.K., B.K., and M.R.; methodology, Z.A., D.K., A.K., and K.K.; validation, B.K., M.R., A.A., and S.R.; formal analysis, Z.A., A.T., A.A., and N.K.; investigation, Z.A., A.K., K.K., and A.T.; resources, B.K., M.R., K.K., and S.R.; data curation, D.K., A.K., A.T., and N.K.; writing—original draft preparation, Z.A., D.K., A.A., and N.K.; writing—review and editing, B.K., M.R., A.A., and S.R.; visualization, Z.A., A.K., A.T., and N.K.; supervision, D.K., B.K., and M.R.; project administration, Z.A., B.K., and A.T.; funding acquisition, Z.A. and B.K. All authors have read and agreed to the published version of the manuscript.
Funding
This research received no external funding.
Institutional Review Board Statement
Not applicable.
Informed Consent Statement
Not applicable.
Data Availability Statement
The original contributions presented in the study are included in the article, further inquiries can be directed to the corresponding author.
Acknowledgments
The authors gratefully acknowledge Abylkas Saginov Karaganda Technical University for scientific, methodological, and technical support of the study.
Conflicts of Interest
Author Kaiyrbek Kulzhanov was employed by the company LLP «Kazakhmys Corporation»—G. Omarov Mine Trest. Author Azamat Tuyenbayev was employed by the company Astana Design and Research Center «APITS Engineering LLP». The remaining authors declare that the research was conducted in the absence of any commercial or financial relationships that could be construed as a potential conflict of interest.
References
- Li, J.; Yang, T.; Liu, F.; Zhao, Y.; Liu, H.; Deng, W.; Gao, Y.; Li, H. Modeling spatial variability of mechanical parameters of layered rock masses and its application in slope optimization at the open-pit mine. Int. J. Rock Mech. Min. Sci. 2024, 181, 105859. [Google Scholar] [CrossRef] [Scilit]
- Wang, S.; Cao, B.; Bai, R.; Liu, G. Dynamic optimization design of open-pit mine full-boundary slope considering uncertainty of rock mass strength. Sci. Rep. 2024, 14, 19710. [Google Scholar] [CrossRef] [Scilit] [PubMed]
- Valdivia, M.; Macciotta, R. Rock mass strength variability for probabilistic open-pit slope stability analysis. CIM J. 2025, 16, 2–24. [Google Scholar] [CrossRef] [Scilit]
- Obregon, C.; Mitri, H. Probabilistic approach for open pit bench slope stability analysis—A mine case study. Int. J. Min. Sci. Technol. 2019, 29, 629–640. [Google Scholar] [CrossRef] [Scilit]
- Liu, W.; Sheng, G.; Kang, X.; Yang, M.; Li, D.; Wu, S. Slope Stability Analysis of Open-Pit Mine Considering Weathering Effects. Appl. Sci. 2024, 14, 8449. [Google Scholar] [CrossRef] [Scilit]
- Yan, J.; Xing, X.; Li, Z.; Ni, W.; Zhao, L.; Zhu, C.; He, Y. Development of a DFN-based probabilistic block theory approach for bench face angle design in open pit mining. J. Rock Mech. Geotech. Eng. 2024, 16, 3047–3062. [Google Scholar] [CrossRef] [Scilit]
- Steiakakis, E.; Xiroudakis, G.; Lazos, I.; Vavadakis, D.; Bazdanis, G. Stability Analysis of a Multi-Layered Slope in an Open Pit Mine. Geosciences 2023, 13, 359. [Google Scholar] [CrossRef] [Scilit]
- Jia, L.; Wang, J.; Fang, L.; Cui, Y.; Chen, J.; Cao, L. Study on numerical simulation of groundwater flow field and slope stability in multi-aquifer open pit mine. Sci. Rep. 2024, 14, 31088. [Google Scholar] [CrossRef] [Scilit] [PubMed]
- McQuillan, A.; Bar, N. The necessity of 3D analysis for open-pit rock slope stability studies: Theory and practice. J. South. Afr. Inst. Min. Metall. 2023, 123, 63–70. [Google Scholar] [CrossRef] [Scilit]
- Li, Z.; Xu, T.; Zhao, L.; Liu, Y.; Xu, Y.; Heap, M.J.; Utili, S.; Liu, B.; Su, B. Enhancing stability analysis of open-pit slopes via integrated 3D numerical modeling and data monitoring. Eng. Fail. Anal. 2024, 163, 108495. [Google Scholar] [CrossRef] [Scilit]
- Jia, L.; Wang, J.; Cai, X.; Fang, L.; Ma, Y.; Wang, Z. Study on morphology optimization of open-pit mine slope based on section and spatial morphology effect. Sci. Rep. 2024, 14, 2603. [Google Scholar] [CrossRef] [Scilit] [PubMed]
- Li, S.; Zhao, Z.; Hu, B.; Yin, T.; Chen, G.; Chen, G. Three-Dimensional Simulation Stability Analysis of Slopes from Underground to Open-Pit Mining. Minerals 2023, 13, 402. [Google Scholar] [CrossRef] [Scilit]
- Bar, N.; Zlobin, G.A. Geotechnical design of slopes and risk control in Aktogay open pit mine. Gorn. Zhurnal 2024, 1, 89–94. [Google Scholar] [CrossRef] [Scilit]
- Akhmatnurov, D.; Zamaliyev, N.; Mussin, R.; Demin, V.; Tolovkhan, B.; Ganyukov, N.; Skrzypkowski, K.; Korzeniowski, W.; Stasica, J.; Rak, Z. Geomechanical Modeling of the Northern Katpar Deposit (Kazakhstan): Assessing the Impact of Rock Mass Disturbance on Stability Safety Factor. Mining 2025, 5, 73. [Google Scholar] [CrossRef] [Scilit]
- Abdulai, M.; Sharifzadeh, M. Probability Methods for Stability Design of Open Pit Rock Slopes: An Overview. Geosciences 2021, 11, 319. [Google Scholar] [CrossRef] [Scilit]
- Nguyen, P.M.V.; Marciniak, M. Stochastic Rock Slope Stability Analysis: Open Pit Case Study with Adjacent Block Caving. Geotech. Geol. Eng. 2024, 42, 5827–5845. [Google Scholar] [CrossRef] [Scilit]
- Lyu, J.; Hu, T.; Liu, G.; Cao, B.; Wang, W.; Li, S. Stability evaluation of open-pit mine slope based on Bayesian optimization 1D-CNN. Sci. Rep. 2024, 14, 13995. [Google Scholar] [CrossRef] [Scilit] [PubMed]
- Ma, G.; Liang, Z.; Ou, S.; Tao, Z.; Huang, B.; Cao, H. Stability analysis and optimization of open pit mine slopes based on the improved Sarma method with nonhomogeneous hydraulic boundary conditions. Sci. Rep. 2025, 15, 32326. [Google Scholar] [CrossRef] [Scilit] [PubMed]
- Read, J.; Stacey, P. (Eds.) Guidelines for Open Pit Slope Design; CSIRO Publishing: Collingwood, Australia, 2009. [Google Scholar]
- Hoek, E.; Bray, J.W. Rock Slope Engineering, 3rd ed.; Institution of Mining and Metallurgy: London, UK, 1981. [Google Scholar]
- Wyllie, D.C.; Mah, C.W. Rock Slope Engineering: Civil and Mining, 4th ed.; Spon Press: London, UK, 2004. [Google Scholar]
- Barton, N.; Choubey, V. The shear strength of rock joints in theory and practice. Rock Mech. 1977, 10, 1–54. [Google Scholar] [CrossRef] [Scilit]
- Martin, D.; Stacey, P. (Eds.) Guidelines for Open Pit Slope Design in Weak Rocks; CSIRO Publishing: Clayton South, Australia, 2018. [Google Scholar] [CrossRef] [Scilit]
- Yakovlev, V.L.; Yakovlev, A.V.; Shimkiv, E.S. Open pit mine slope stability: Methodological framework. J. Min. Sci. 2023, 59, 877–884. [Google Scholar] [CrossRef] [Scilit]
- Hoek, E.; Carranza-Torres, C.; Corkum, B. Hoek-Brown failure criterion—2002 edition. In Proceedings of the NARMS-TAC 2002, Toronto, ON, Canada, 7–10 July 2002; pp. 267–273. [Google Scholar]
- Du, S.-G.; Saroglou, C.; Chen, Y.; Lin, H.; Yong, R. A new approach for evaluation of slope stability in large open-pit mines: A case study at the Dexing Copper Mine, China. Environ. Earth Sci. 2022, 81, 102. [Google Scholar] [CrossRef] [Scilit]
- Zhang, Y.; Zhang, J.; Ma, J. Stability Analysis of a Steep Rock Slope in a Large Open-Pit Mine in a High-Intensity Area: A Case Study of the Yejiagou Boron Iron Mine. Geofluids 2022, 2022, 9113173. [Google Scholar] [CrossRef] [Scilit]
- Zhang, L.; Chen, Z.; Bao, M.; Nian, G.; Zhou, Z.; Zhu, T. Stability analysis and move-ment process determination of rock masses under open-pit to underground mining conditions. Geomech. Geophys. Geo-Energy Geo-Resour. 2022, 8, 148. [Google Scholar] [CrossRef] [Scilit]
- Morales, M.; Panthi, K.K.; Botsialas, K. Slope stability assessment of an open pit mine using three-dimensional rock mass modeling. Bull. Eng. Geol. Environ. 2019, 78, 1249–1264. [Google Scholar] [CrossRef] [Scilit]
- Aladejare, A.E.; Akeju, V.O. Design and Sensitivity Analysis of Rock Slope Using Monte Carlo Simulation. Geotech. Geol. Eng. 2020, 38, 573–585. [Google Scholar] [CrossRef] [Scilit]
- Yuan, L.; Li, C.; Li, S.; Ma, X.; Zhang, W.; Liu, D.; Wang, G.; Chen, F.; Hou, X. Mine Slope Stability Based on Fusion Technology of InSAR Monitoring and Numerical Simulation. Sci. Program. 2022, 2022, 8643586. [Google Scholar] [CrossRef] [Scilit]
- Yang, G.; Chen, Y.; Liu, X.; Yang, R.; Zhang, Y.; Zhang, J. Stability analysis of a slope containing water-sensitive mudstone considering different rainfall conditions at an open-pit mine. Int. J. Coal Sci. Technol. 2023, 10, 64. [Google Scholar] [CrossRef] [Scilit]
- Wang, F.; Zhai, W.; Man, J.; Huang, H. A hybrid cohesive phase-field numerical method for the stability analysis of rock slopes with discontinuities. Can. Geotech. J. 2025, 62, 1–16. [Google Scholar] [CrossRef] [Scilit]
- Liu, T.; Sheng, Y.; Yu, Z.; Cui, M.; Li, Q.; Huang, W. Compression-shear fracture and energy evolution in rock-like materials under hydraulic-mechanical coupling effect. Geomech. Geophys. Geo-Energy Geo-Resour. 2026, 12, 68. [Google Scholar] [CrossRef] [Scilit]
- Melentijević, S.; Gutiérrez-Ch., J.G.; Berisavljević, Z.; Graterol, E.; Berisavljević, D. Application of LEM, FEM and DEM in stability analysis of highly jointed rock slopes. Transp. Infrastruct. Geotechnol. 2025, 12, 135. [Google Scholar] [CrossRef] [Scilit]
- Wang, F.; Ding, X.; Song, C.; Liu, D. A Novel Hydromechanical Coupling Constitutive Model for Jointed Rock Masses Informed by Compression-Shear-Seepage Tests. Int. J. Geomech. 2026, 26, 04026033. [Google Scholar] [CrossRef] [Scilit]
- Liu, K.; Tao, Z.; Li, X.; Yin, J. Comprehensive evaluation of fault-controlled open-pit mine stability classification analysis and numerical simulation. Bull. Eng. Geol. Environ. 2024, 83, 471. [Google Scholar] [CrossRef] [Scilit]
- Beale, G.; Read, J. (Eds.) Guidelines for Evaluating Water in Pit Slope Stability; CSIRO Publishing: Collingwood, Australia, 2013. [Google Scholar]
- Su, P.; Qiu, P.; Liu, B.; Chen, W.; Su, S. Stability prediction and optimal angle of high slope in open-pit mine based on two-dimension limit equilibrium method and three-dimension numerical simulation. Phys. Chem. Earth Parts A/B/C 2022, 127, 103151. [Google Scholar] [CrossRef] [Scilit]
- Chen, T.; Shu, J.; Han, L.; Tovele, G.S.V.; Li, B. Landslide mechanism and stability of an open-pit slope: The Manglai open-pit coal mine. Front. Earth Sci. 2023, 10, 1038499. [Google Scholar] [CrossRef] [Scilit]
- Devy, S.D.; Hutahayan, P.P. Groundwater Effect on Slope Stability in Open Pit Mining: A Case of West Kutai Regency, East Kalimantan, Indonesia. J. Geosci. Eng. Environ. Technol. 2021, 6, 192–205. [Google Scholar] [CrossRef] [Scilit]
- Sharon, R.; Eberhardt, E. (Eds.) Guidelines for Slope Performance Monitoring; CSIRO Publishing: Clayton South, Australia, 2020. [Google Scholar]
- Nizametdinov, F.; Nizametdinov, R.; Akhmatnurov, D.; Zamaliyev, N.; Mussin, R.; Ganyukov, N.; Skrzypkowski, K.; Korzeniowski, W.; Stasica, J.; Rak, Z. Geomechanical Basis for Assessing Open-Pit Slope Stability in High-Altitude Gold Mining. Appl. Sci. 2025, 15, 8372. [Google Scholar] [CrossRef] [Scilit]

Disclaimer/Publisher’s Note: The statements, opinions and data contained in all publications are solely those of the individual author(s) and contributor(s) and not of MDPI and/or the editor(s). MDPI and/or the editor(s) disclaim responsibility for any injury to people or property resulting from any ideas, methods, instructions or products referred to in the content. |
© 2026 by the authors. Licensee MDPI, Basel, Switzerland. This article is an open access article distributed under the terms and conditions of the Creative Commons Attribution (CC BY) license.