


Abstract
Safe drinking water remains an issue all around the world, especially in arid countries that require seawater desalination to obtain safe water. This research seeks to analyze water quality at the major stages of an SWRO plant, i.e., raw seawater intake, RO permeate, reject brine, and distribution network water. For the study, conventional physicochemical methods of water quality analysis, as well as electrochemical impedance spectroscopy, were used. Four water samples were taken at different stages of the treatment process: raw seawater (feed water), RO permeate, reject brine, and distribution network water. Physicochemical parameters, such as pH, electrical conductivity, total dissolved solids (TDS), major ions (Na+, Cl−, Ca2+, and Mg2+), and heavy metals (Zn, Cu, Cr, and Hg) concentrations, were evaluated. Electrochemical impedance spectroscopy was used to investigate ionic transport, dielectric relaxation, and interfacial polarization mechanisms within the tested solutions. It has been shown that RO membranes are capable of rejecting major ions up to 95–99%, as can be seen in the low values of conductivity and TDS of RO permeate. EIS analysis also allowed for identifying specific electrochemical characteristics of all four types of water, with brine being characterized by the highest polarization rates and relaxation times.
1. Introduction
The world faces growing water scarcity in the 21st century, especially in arid and semi-arid areas with scarce freshwater. In these regions, seawater desalination is an essential measure to address the increasing demand for freshwater. Reverse osmosis (RO) is one of the most efficient, energy-saving, and high-quality seawater desalination technologies. Recent developments in membrane materials, highly efficient energy recovery systems, and process optimization have helped decrease the specific energy usage of state-of-the-art SWRO plants to about 2–4 kWh/m3, thereby ensuring that SWRO has become the predominant method of desalination throughout the world. The commercial SWRO membranes exhibit a salt rejection rate in excess of 99%, which ensures that the water produced through the process contains very low salt content and meets drinking water standards when treated properly [1,2]. However, several factors influence the operation of desalination systems and the quality of desalinated water, such as the physicochemical properties of the feed water, the operation of RO membranes, and the characteristics of the post-treatment and distribution systems [3,4].
To guarantee the efficiency and safety of desalinated water, the treatment process should be monitored and water quality assessed at various steps. With this in mind, this study assesses a seawater reverse osmosis (SWRO) desalination process and the distribution of desalinated water [5]. Four water samples were taken at critical locations: the seawater fed to the desalination plant, the reverse osmosis permeate, the brine (reject water) generated by the process, and the water delivered to consumers from the distribution network. This approach allows an overview of water quality changes from intake to delivery to the consumer.
The key aim of this study is to track and assess the desalination process using conventional water quality analyses and impedance spectroscopy. Traditional water quality parameters such as total dissolved solids (TDS), electrical conductivity (EC), pH, and concentrations of major ions and trace elements, including heavy metals such as zinc, copper, chromium, and mercury, were measured to evaluate treatment effectiveness and the conformance of desalinated water to drinking water quality standards [6,7]. In the seawater desalination field, good-quality SWRO permeate is typically defined as having TDS less than 500 mg/L and boron concentration less than 1.0 mg/L, which have been established as critical parameters in measuring the quality of desalinated drinking water. These criteria are usually set as key standards in commercial SWRO systems due to the excellent rejection of RO membranes used [1]. Recently, electrochemical impedance spectroscopy (EIS) has become a new, interesting alternative approach for the investigation of ion transport, membrane processes, and water quality issues in desalination processes. Previous research has been devoted mostly to membrane fouling detection, membrane characterization, electrode polarization, and ion transport characteristics of reverse osmosis and electrodialysis systems. Nevertheless, only a few papers have considered the utilization of EIS as a method for monitoring water quality changes during all successive stages of the whole-sea water reverse osmosis (SWRO) desalination process. The novelty of the present paper is the combination of the classical physicochemical analysis with electrochemical impedance spectroscopy as a tool for monitoring the electrochemical characteristics of water sampled during four important stages of the functioning SWRO desalination process: raw seawater, RO permeate, reject brine, and post-treated distribution water. Contrary to previous research, the electrical behavior of water rather than membrane properties or membrane fouling was investigated in the present study [8,9].
The scientific hypothesis of this study is that electrochemical impedance spectroscopy can provide complementary information on ionic mobility, dielectric relaxation, and polarization mechanisms that reflect water quality changes throughout the desalination process and therefore represents a rapid monitoring tool alongside conventional physicochemical analyses [10,11,12].
Through the combination of conventional and electrochemical measurements, this research seeks a better understanding of the desalination treatment process, to detect sources of potential water quality variations in the network, and to assist in the optimization of water quality monitoring strategies for desalination systems. This research is anticipated to support the implementation of sustainable and efficient desalination processes to produce safe, quality water for consumers.
2. Materials and Methods
2.1. Sampling and Study Area
Sampling was conducted at a coastal seawater reverse osmosis (RO) desalination plant. The plant employs thin-film composite (TFC) spiral-wound reverse osmosis membranes, which are widely used in seawater desalination systems. The sampling strategy aimed to monitor changes in water quality during the major treatment and distribution stages.
Four sampling locations were identified:
S1: RO permeate collected directly from the reverse osmosis unit.
S2: Raw seawater (feed water).
S3: RO reject brine discharged from the reverse osmosis unit.
S4: Post-treated drinking water collected from the municipal distribution network after remineralization and distribution.
The water samples were collected in polyethylene bottles that were previously cleaned and rinsed in order to prevent contamination. The bottles were then sealed, labeled, and taken to the laboratory in an ice chest at 4 °C. Water samples meant for major ion analysis were stored in a refrigerator at 4 °C and were analyzed in accordance with the holding time recommendations. Trace metal samples were acidified with ultrapure nitric acid (HNO3) to pH < 2 [13].
2.2. Measurement Instrumentation
Table 1 provides a comprehensive list of monitoring and control instruments with the variables measured, instrument model, precision, accuracy, and measurement ranges [3].
Table 1.
Characteristics of the measurement and control instruments.
Analysis of major ions (Na+, Cl−, Ca2+, and Mg2+) and metal traces was performed through standard analytical techniques normally used by the certified lab of the desalination plant. Analysis of heavy metals was performed through ICP Optical Emission Spectroscopy (ICP-OES). Analysis of physicochemical properties such as pH, electrical conductivity, and total dissolved solids was performed using lab apparatus calibrated according to Standard Methods for the Examination of Water and Wastewater [14].
2.3. Complex Electrical Conductivity
Electrical properties and ionic transport of the water samples were investigated using electrochemical impedance spectroscopy (EIS). The measurements were performed using a two-electrode conductivity cell made from stainless steel with parallel circular electrodes. The diameter of the electrodes, surface area, separation between the electrodes, and the cell constant were kept the same for all experiments. The value of the cell constant was measured by calibration using standard solutions of potassium chloride. The measurement was performed in the frequency range of 100 Hz to 1 MHz with a 10 mV amplitude of the AC voltage [15].
The impedance spectra were fitted to equivalent circuit models to extract values of electrolyte resistance, ionic conduction, interfacial polarization, and double-layer capacitance, which enable the study of ion mobility and conduction at various stages of water treatment. Three replicate measurements were taken to confirm the results. Analysis and plots were made using ZView and OriginPro, enabling correlation studies and sample comparisons to assess the desalination efficiency, impact of brine concentration, and potential changes in water quality following distribution [16].
2.4. Statistical Analysis
Three separate impedance readings were performed for each sample of the water for assessment of repeatability in the measurement process. The electrical characteristics stated represent mean values derived from the three replicate readings, and the standard deviations were calculated. As the current study was conceptual in nature, using data from a single sampling event at a single site, inferential statistics such as ANOVA or t-test were deemed unsuitable. Further studies will incorporate multiple sampling events to enable the conduct of more detailed statistical analysis.
3. Results and Discussions
3.1. Physicochemical Characterization
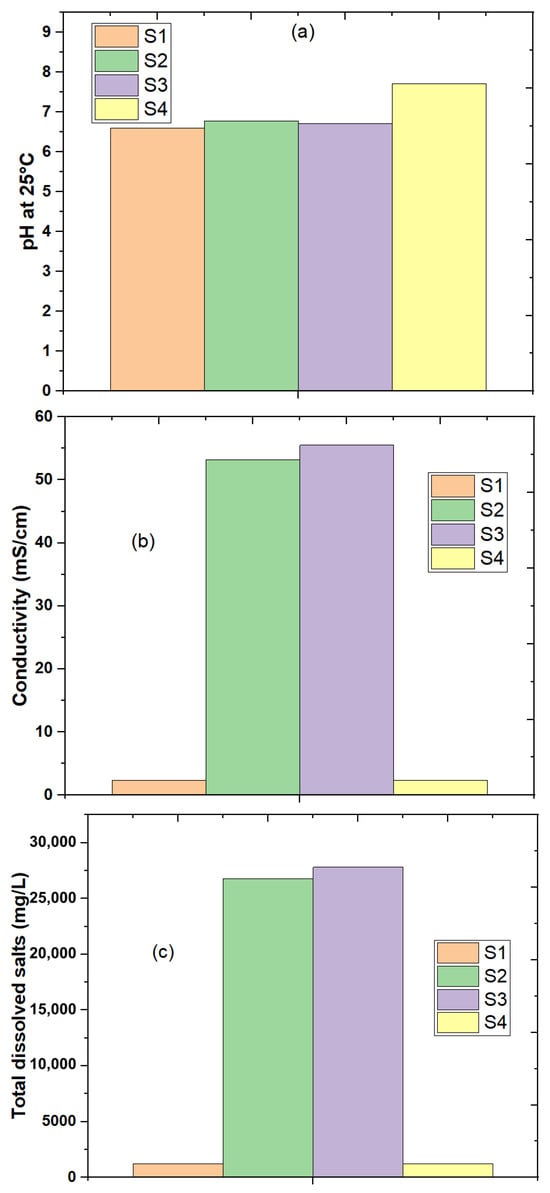
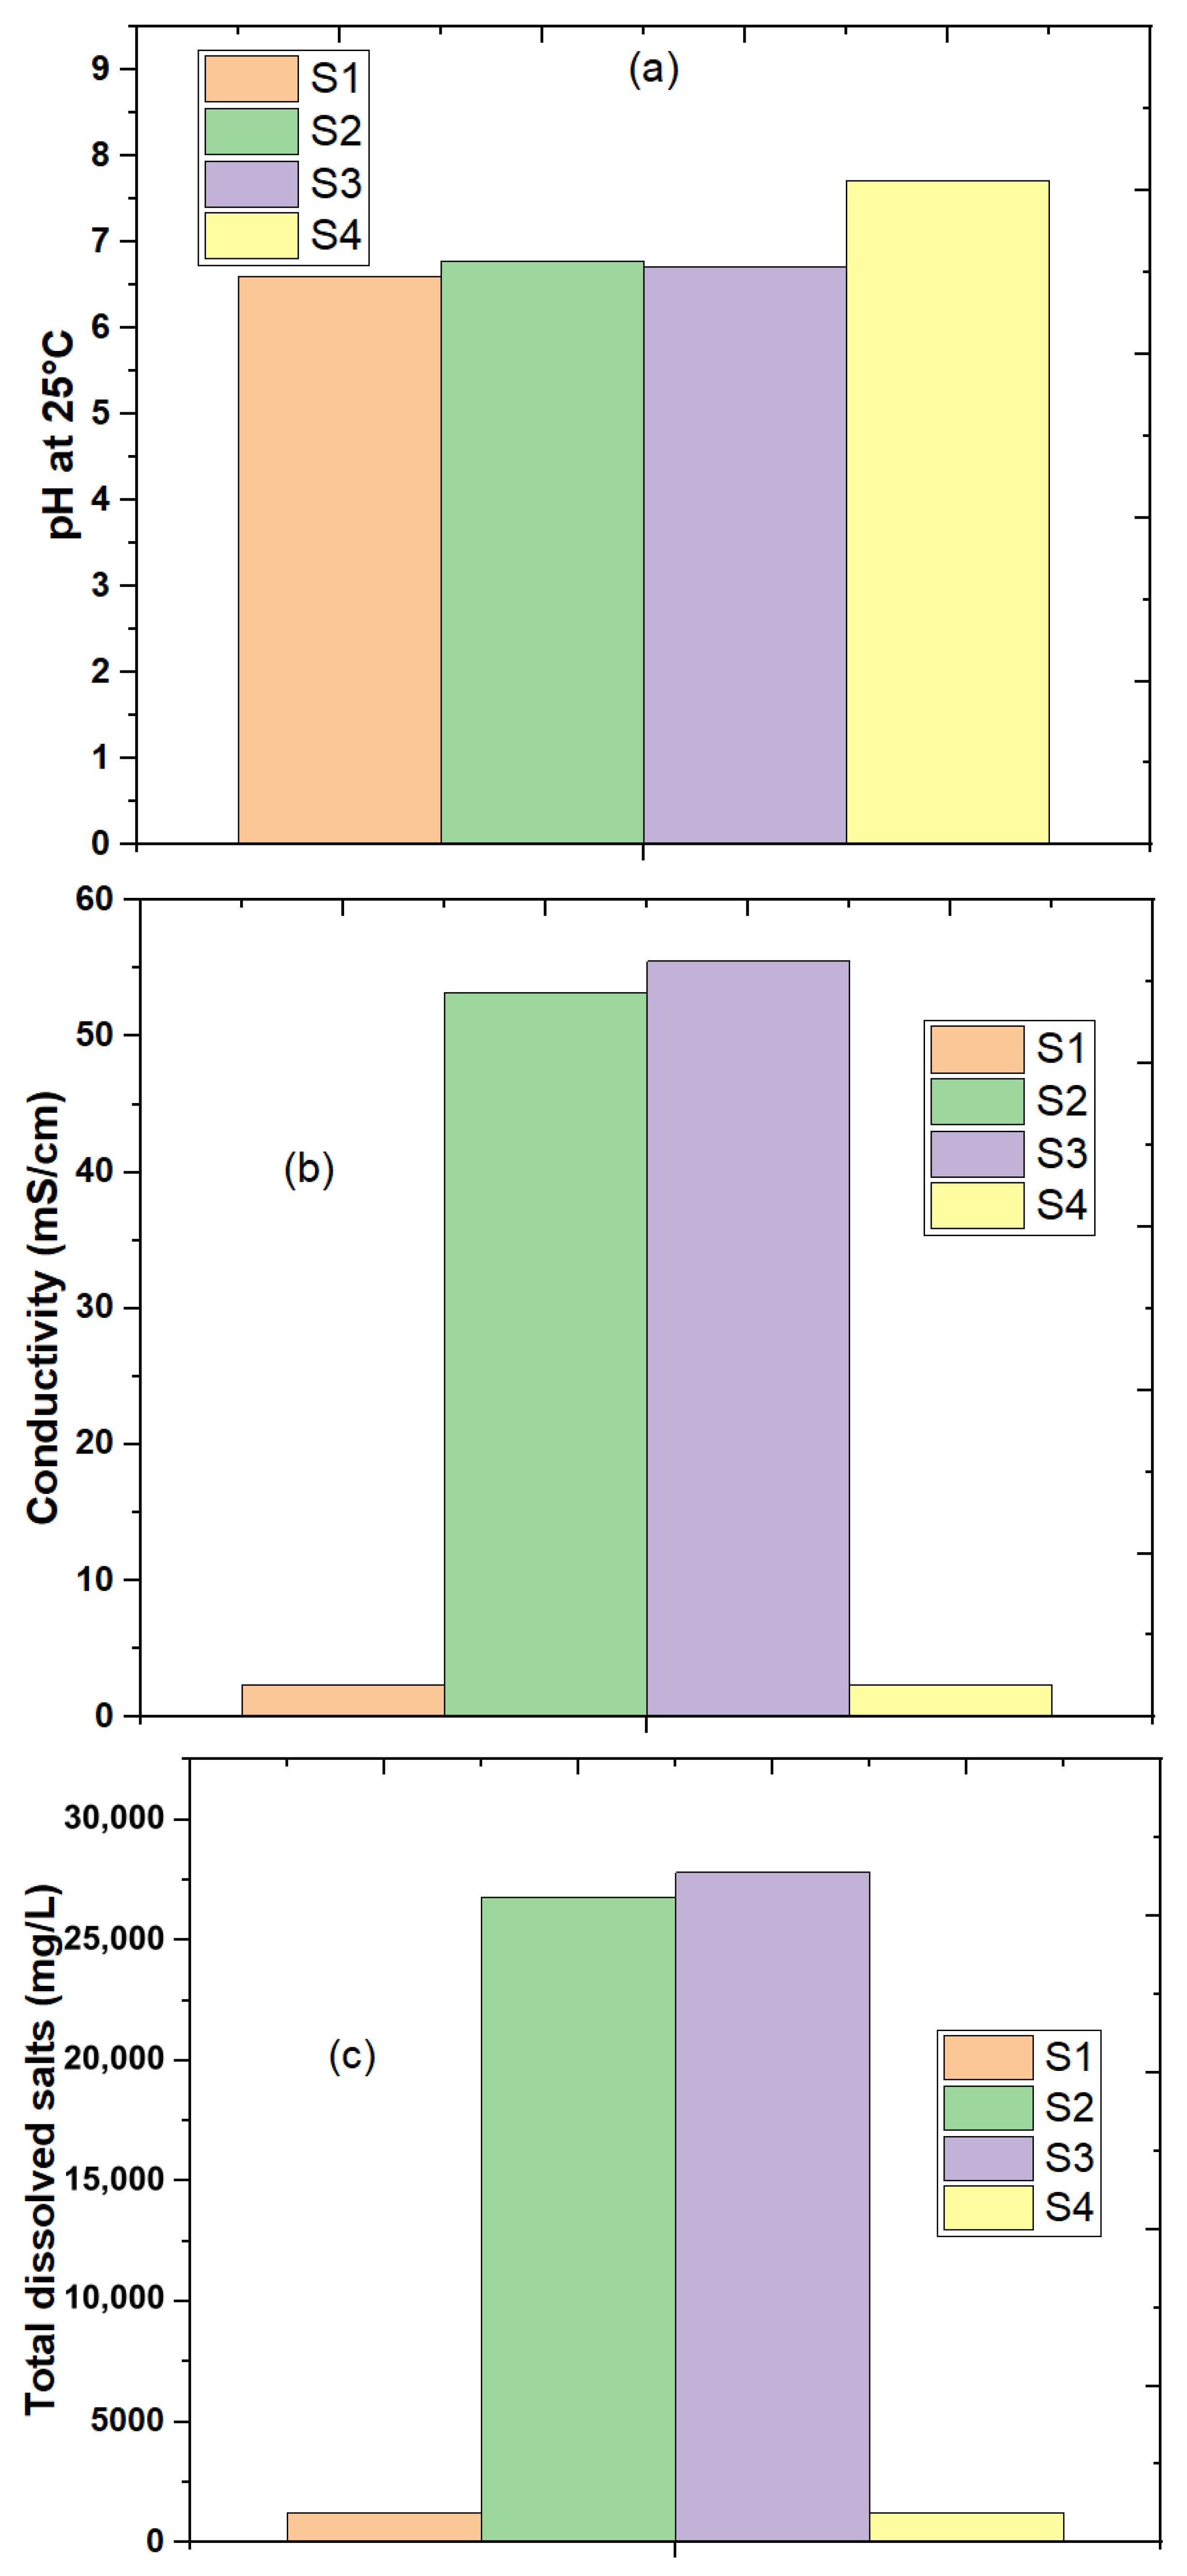
The physicochemical analysis of the four collected water samples, raw seawater (feed water), RO permeate, RO reject brine, and drinking water from the distribution network, provides a comprehensive evaluation of desalination efficiency and water quality evolution throughout treatment and distribution (Figure 1a–c and Table 2).
Figure 1.
(a) pH values of raw seawater, RO permeate, RO reject brine, and distribution network water. (b) Electrical conductivity (µS/cm) of raw seawater, RO permeate, RO reject brine, and distribution network water. (c) Total dissolved solids (TDS) of raw seawater, RO permeate, RO reject brine, and distribution network water.
Table 2.
The physicochemical traits of water samples taken at various points in the desalination and distribution process.
There was little variation in the temperatures of the water samples, which ranged from 24 to 25 °C, indicating that temperature was not a determining factor for the physicochemical properties of the samples. The pH was also slightly variable and remained within the desirable level of drinking water following treatment. The RO permeate contained a pH of 6.60, while the feed water, or raw seawater, and RO reject brine contained pH values of 6.77 and 6.71, respectively. The distribution network water contained a slightly higher pH of 7.71.
In contrast, substantial differences were observed in electrical conductivity (EC) and total dissolved solids (TDS). The raw seawater exhibited a high conductivity of 53.2 mS/cm and a TDS concentration of 26,800 mg/L, which are characteristic of seawater. Following reverse osmosis treatment, the RO permeate showed a dramatic reduction in both parameters, with an EC of 2.34 mS/cm and a TDS of 1250 mg/L, demonstrating the high desalination efficiency of the RO membranes. Conversely, the RO reject brine exhibited the highest salinity, with an EC of 55.5 mS/cm and a TDS of 27,800 mg/L, owing to the concentration of salts rejected by the membrane. The distribution network water maintained values similar to those of the RO permeate (EC = 2.34 mS/cm, TDS = 1200 mg/L), indicating that water quality remained stable during post-treatment and distribution.
The nearly constant temperature (24–25 °C) confirms that thermal effects did not contribute significantly to the observed differences in water quality. Therefore, the variations in physicochemical parameters can be primarily attributed to the reverse osmosis desalination process.
The slight increase in pH observed in the distribution network water compared with the RO permeate is likely the result of post-treatment conditioning, such as remineralization and pH adjustment, which are commonly applied to improve water stability and reduce corrosiveness before distribution. In contrast, the relatively low pH of the RO permeate is mainly due to the removal of bicarbonate alkalinity and dissolved minerals during membrane separation, leaving the water weakly buffered and more susceptible to pH changes through interaction with atmospheric CO2 [17].
The significant decrease in EC and TDS of the RO permeate is because of the excellent salt rejection property of reverse osmosis membranes. Ions like Na+, Cl−, Ca2+, Mg2+, and other inorganic ions are retained inside the membrane by the processes of size exclusion and electrostatic repulsion, resulting in the production of low-salinity permeate. The decrease in salt concentration is in line with the salt rejection efficiency of commercial seawater RO membranes, which is more than 99% [18,19].
The high values of EC and TDS observed for the reject brine in the RO process arise due to the occurrence of the concentration polarization effect and build-up of the reject salt on the feed side of the membrane. During the process of water filtration through the membrane, the amount of salts becomes increasingly concentrated in the brine, which causes increased electrical conductivity. This is a natural feature of RO processes, when the feed stream becomes split into the brine and the low-salinity permeate [20].
The close resemblance between the physicochemical properties of the RO permeate and those of the water distributed through the distribution network implies that there was no mineral dissolution or contamination of any kind after treatment, storage, and during distribution. It is clear that the water underwent chemical stability during distribution and is evidence of the success of the desalination and conditioning treatment process. All these observations are in agreement with the basic principles of reverse osmosis, such as ion rejection and salt accumulation in the reject [21].
The results indicate that the ion concentrations confirm the effectiveness of reverse osmosis desalination technology. Raw seawater had 12,000 mg/L Na+, which was significantly reduced to 12.1 mg/L for RO permeate and 15 mg/L for distribution network water. However, RO reject brine had the highest Na+ concentration of 15,000 mg/L due to the accumulation of the salts that were being rejected through the membrane. For chloride ions, the concentration significantly reduced from 21,000 mg/L in the feed water to 21 mg/L in RO permeate and 20 mg/L in the distribution network water. The highest concentration for this ion was in RO reject brine at 20,000 mg/L.
Calcium and magnesium showed the same trend. Calcium was lowered from 971 mg/L in the feed water to 450 mg/L in the RO permeate and 34 mg/L in the distribution network water, but the reject stream had 960 mg/L of calcium content. Magnesium showed a reduction from 316 mg/L in the feed water to 96 mg/L in the RO permeate and 24 mg/L in the distribution network water; however, the reject stream showed an increase to 431 mg/L. Potassium content showed a very low concentration in all samples, between 0.01 and 0.02 mg/L.
The concentrations of the trace metals were found to be low in all the water samples. Zinc, copper, and chromium concentrations were found to be in the range of 0.01–0.04 mg/L, which is well within the limit set by Morocco for drinking water. The concentrations of barium were also low, which varied from 0.07 to 0.08 mg/L in the feed water, RO permeate, and reject brine, and decreased to 0.01 mg/L in the distribution water sample. Concentrations of fluoride were also constant at 0.01 mg/L in all samples. These results demonstrate from the above observations that the process of desalination has helped in controlling the trace element concentrations without violating the drinking water quality standard, with the exception of mercury, whose concentration (0.01 mg/L) has exceeded the Moroccan value (0.001 mg/L) in all the samples.
The significant decrease in the salt content, electrical conductivity, and dissolved ion concentration in the RO concentrate is largely due to the separation principles of the process of reverse osmosis, which include size exclusion, solution-diffusion transport, and electrostatic Donnan exclusion via the semipermeable membrane [22]. This ensures that hydrated ions like Na+, Cl−, Ca2+, and Mg2+ do not pass through the membrane, whereas water passes through [23].
Electrostatic interactions between the charged membrane surface and dissolved ions further enhance ion rejection. Multivalent ions, such as Ca2+ and Mg2+, are generally rejected more efficiently than monovalent ions because of their higher charge and larger hydrated radius. Consequently, salts accumulate in the concentrate stream, producing the elevated ion concentrations observed in the RO reject brine [24].
The decrease in ionic concentration directly explains the reduction in electrical conductivity, as conductivity depends on both the concentration and mobility of dissolved ions. Therefore, the low conductivity measured in the RO permeate reflects efficient desalination, whereas the high conductivity of the reject brine results from the concentration of retained salts [25].
The close agreement between the chemical composition of the RO permeate and the distribution network water indicates that post-treatment and distribution introduced only minor changes to water quality. The slight increase in sodium and the decrease in calcium and magnesium observed in the distribution network water are consistent with normal stabilization and conditioning processes, while the overall low ion concentrations confirm that the treated water remained chemically stable throughout storage and distribution [21].
The dramatic decrease in conductivity and TDS proves the high effectiveness of the desalination procedure during the process of reverse osmosis. Nowadays, modern commercial SWRO units usually should provide permeate with TDS lower than 500 mg L−1, and the amount of boron lower than 1.0 mg L−1 is required to comply with drinking water quality standards. Even though the content of boron was not evaluated in the current research, the dramatic decrease in the amount of dissolved salts in the solution following RO treatment correlates with the excellent salt rejection properties of modern commercial SWRO membranes, which were revealed in several previous studies [1,2].
These findings confirm that reverse osmosis is based on selective rejection of ions and concentration of solutes, resulting in low-salinity permeate and brine streams; hence, there is a decline in conductivity and concentration of major ions in the reverse osmosis product water.
3.2. Electrical Conductivity Measurements
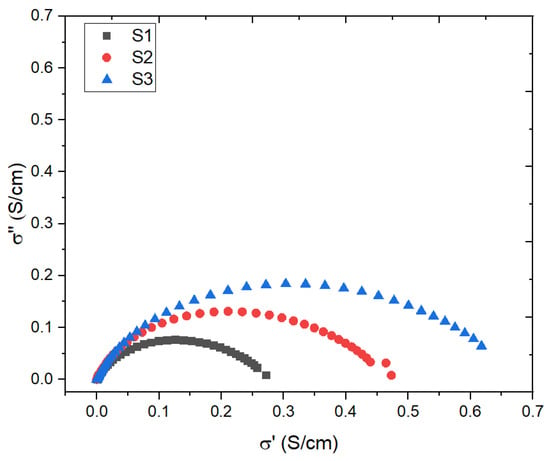
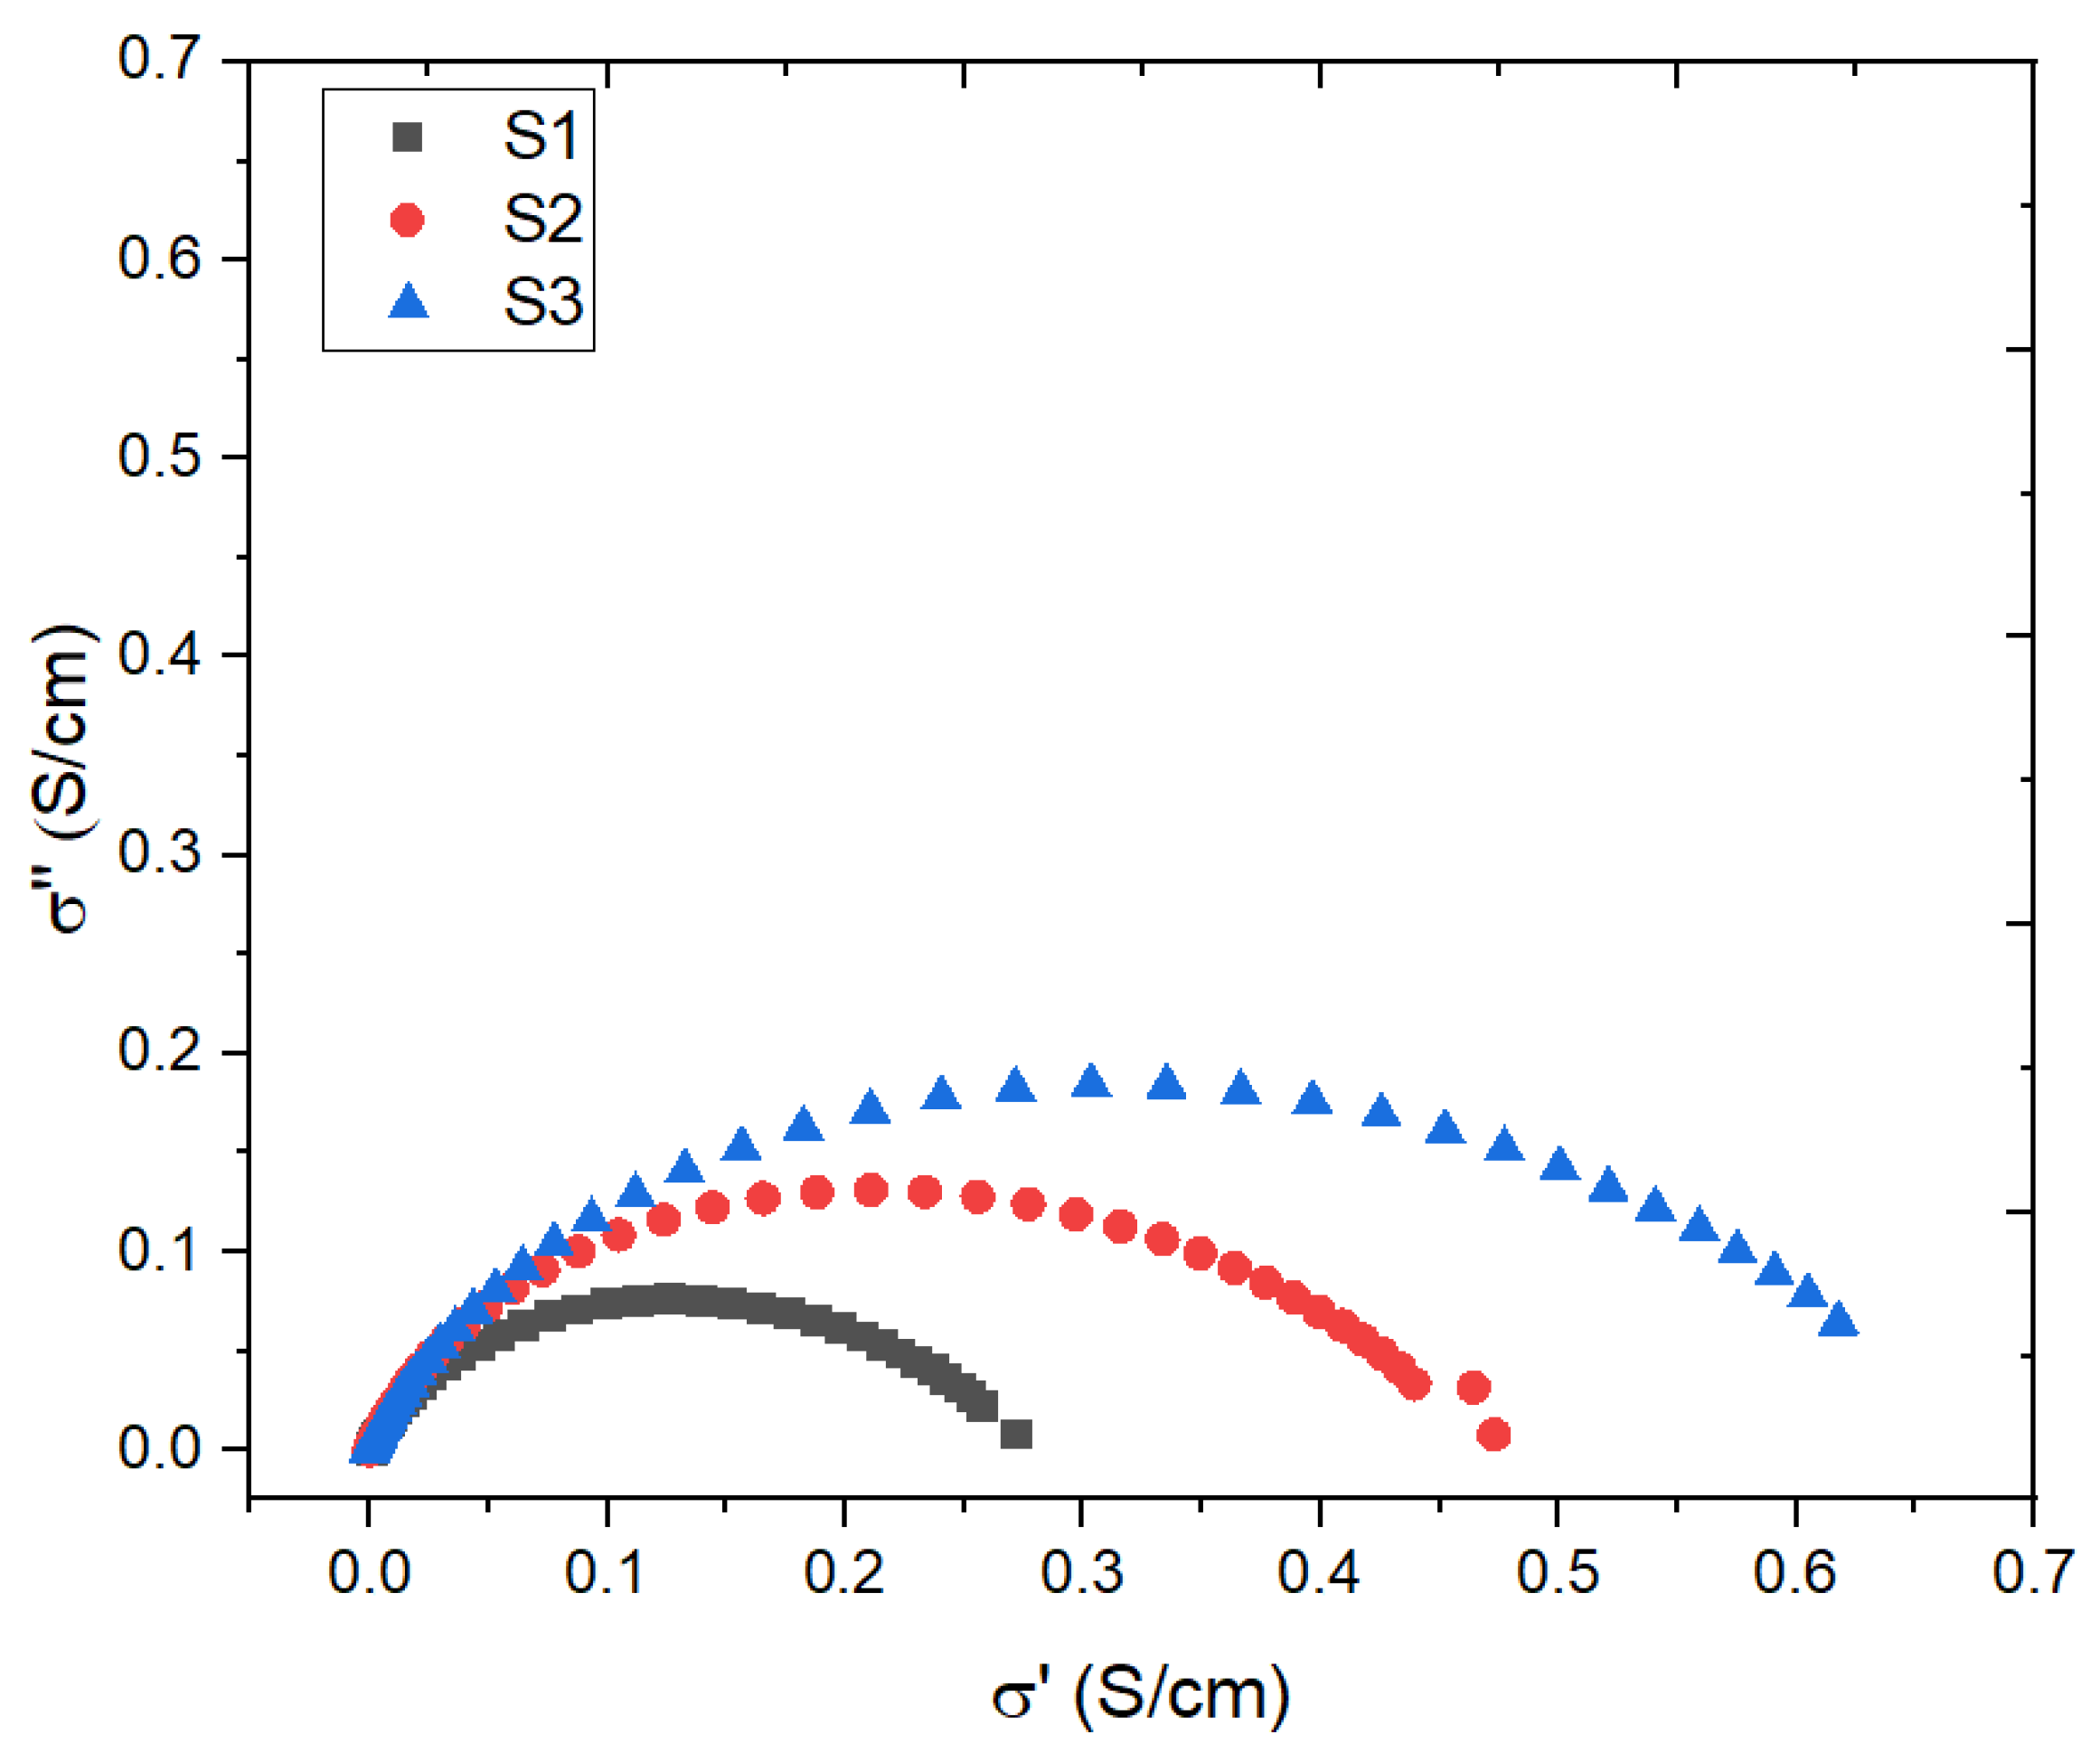
Electrical conductivity (EC) is an important physicochemical indicator of the total ionic concentration in water and a quick assessment of salinity changes during the desalination process. Assuming that S1 is the RO permeate, S2 the feed seawater, and S3 the RO reject brine, the plot of σ″ versus σ′ (Figure 2) reveals a conductivity gradient in accordance with the ionic concentration of the samples. S1 is close to the origin and displays the smallest and most compact semicircle, reflecting a very low σ′ and σ″, typical of the high desalination level with a low ionic concentration and low polarization effects. S2 has a wider arc, showing more evident polarization effects and a higher ionic content. S3 has the largest arc and the highest σ′ and σ″ values, which confirms the high salinity and ionic conductivity. The shift of S3 towards higher σ′ values indicates the presence of higher bulk resistance and stronger ionic interactions [26].
Figure 2.
The Nyquist plot: Imaginary part σ″ as a function of the real part σ′ of different samples.
These behaviors are controlled by ionic transport and polarization processes in electrolytes. At low frequencies, the increase in σ″ is explained by interfacial (Maxwell–Wagner) polarization through charge accumulation at interfaces, which is enhanced at higher ion concentrations, as is the case for S3. At higher frequencies, ionic transport prevails, resulting in an increase in σ′ and a decrease in σ″. The wide arc observed for S3 is attributed to slow relaxation and strong ion-ion interaction, whereas the narrow arc of S1 is due to fast relaxation and low interfacial polarization (low ionic strength) [27,28].
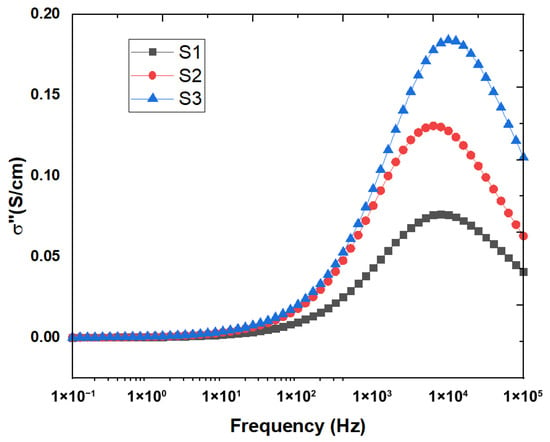
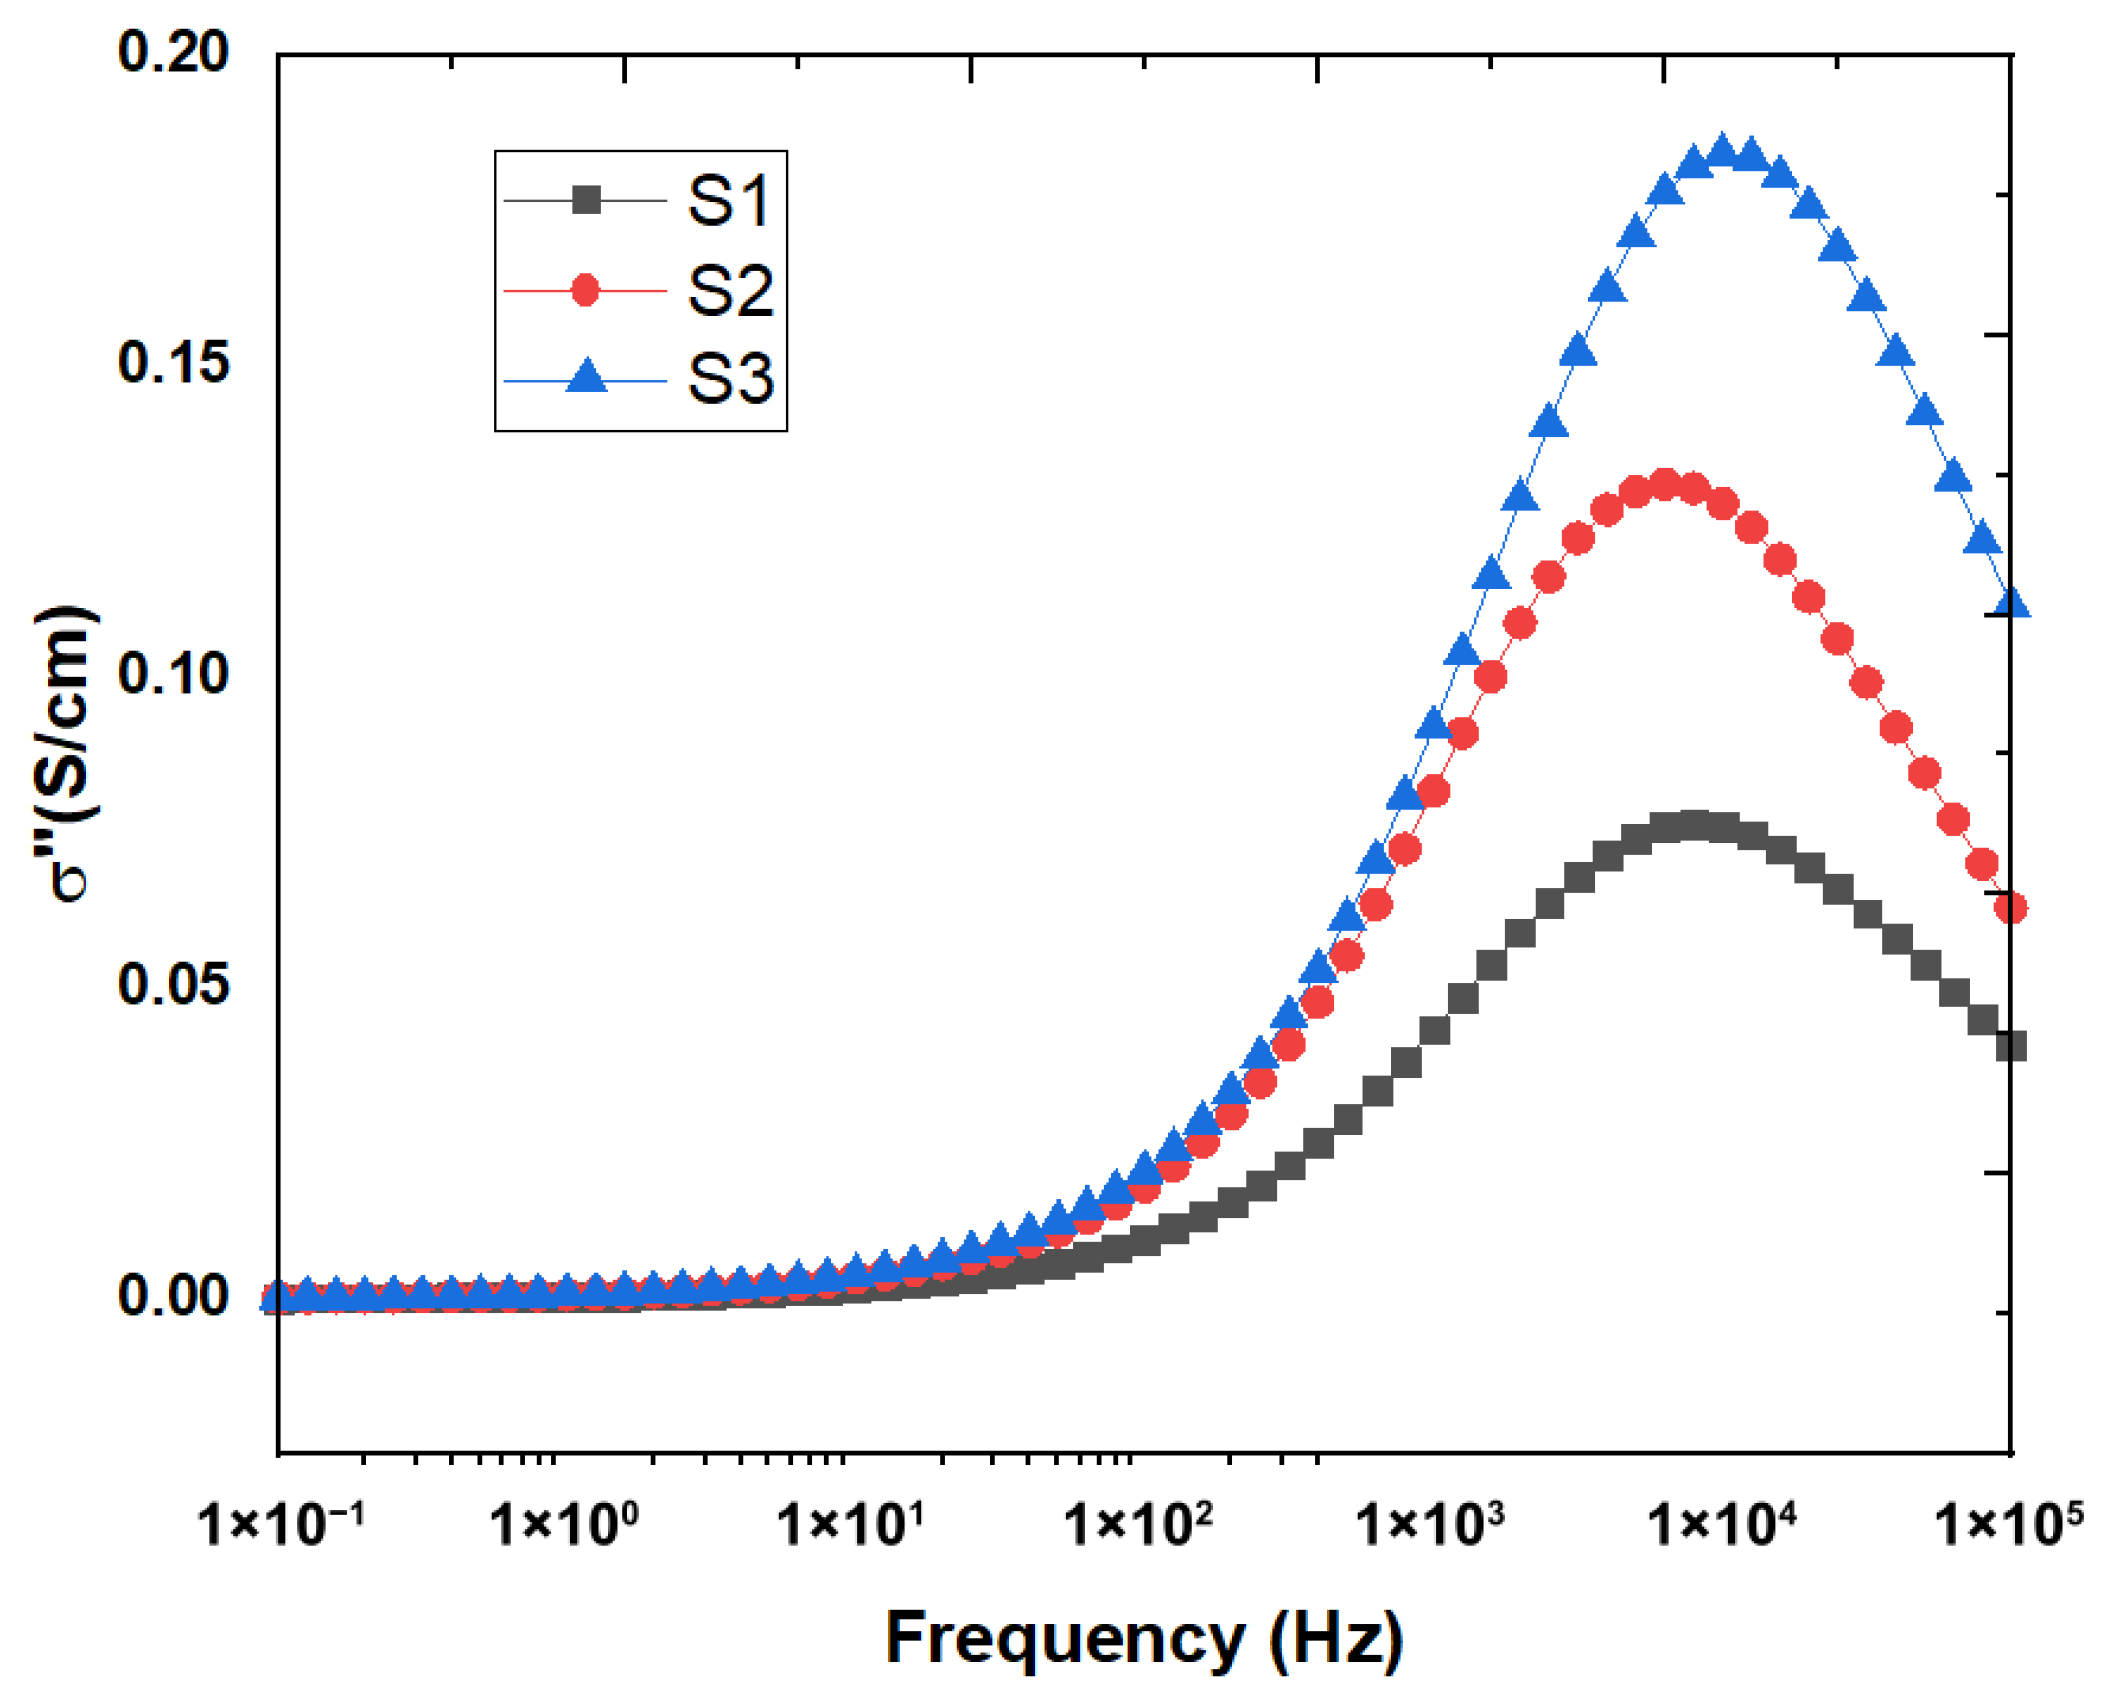
The frequency dependence of the imaginary part of the AC conductivity (σ″) is shown in Figure 3, revealing different dielectric relaxation responses of the three water samples (S1: RO permeate; S2: Raw seawater (feed water); S3: RO brine). Each curve shows a clear relaxation peak, which occurs at the frequency where charge carriers are unable to keep up with the electric field. The peak intensity rises from S1 to S3, which is correlated with the increase in ionic concentration: S1 has the smallest σ″ response due to its low salinity, S2 has a higher response that matches seawater conductivity, and S3 has the highest peak (corresponding to its high salinity). Furthermore, the peak in S2 and particularly in S3 is wider and slightly shifted to a higher frequency, suggesting a slower process of polarization and depolarization, probably due to a stronger interaction between ions and a higher charge buildup at the interface. This indicates that brine (S3) has the strongest polarization and the longest relaxation processes [29].
Figure 3.
Frequency dependence of the imaginary part of the AC conductivity (σ″) for the three water samples.
The σ″ response is attributable to the contribution of interfacial polarization, dipolar relaxation, and ion hopping. At lower frequencies, σ″ approaches zero as the mobile ions are able to keep pace with the slowly changing electric field, dissipating little energy. At higher frequencies, ions do not follow the electric field, and large dielectric losses are observed as a peak in σ″. For S3, the higher and wider peak reflects greater space-charge polarization and sluggish ionic motion due to enhanced interactions in the highly concentrated solution. By contrast, the narrower and less intense peak for S1 is due to faster relaxation and low ionic hindrance, which can be attributed to the low-conductivity water. At higher frequencies, σ″ recedes for all samples since the electric field varies too quickly for ionic motion to keep pace, resulting in local dipolar or vibrational responses [30,31].
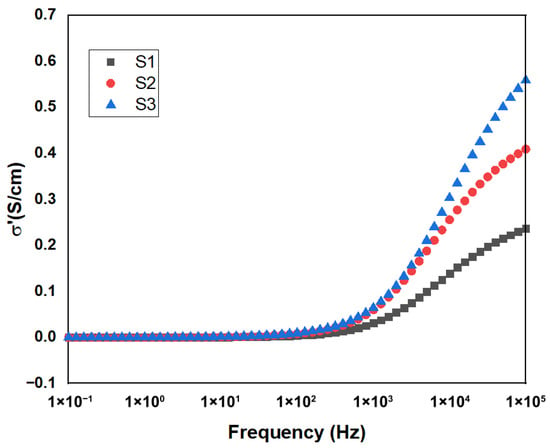
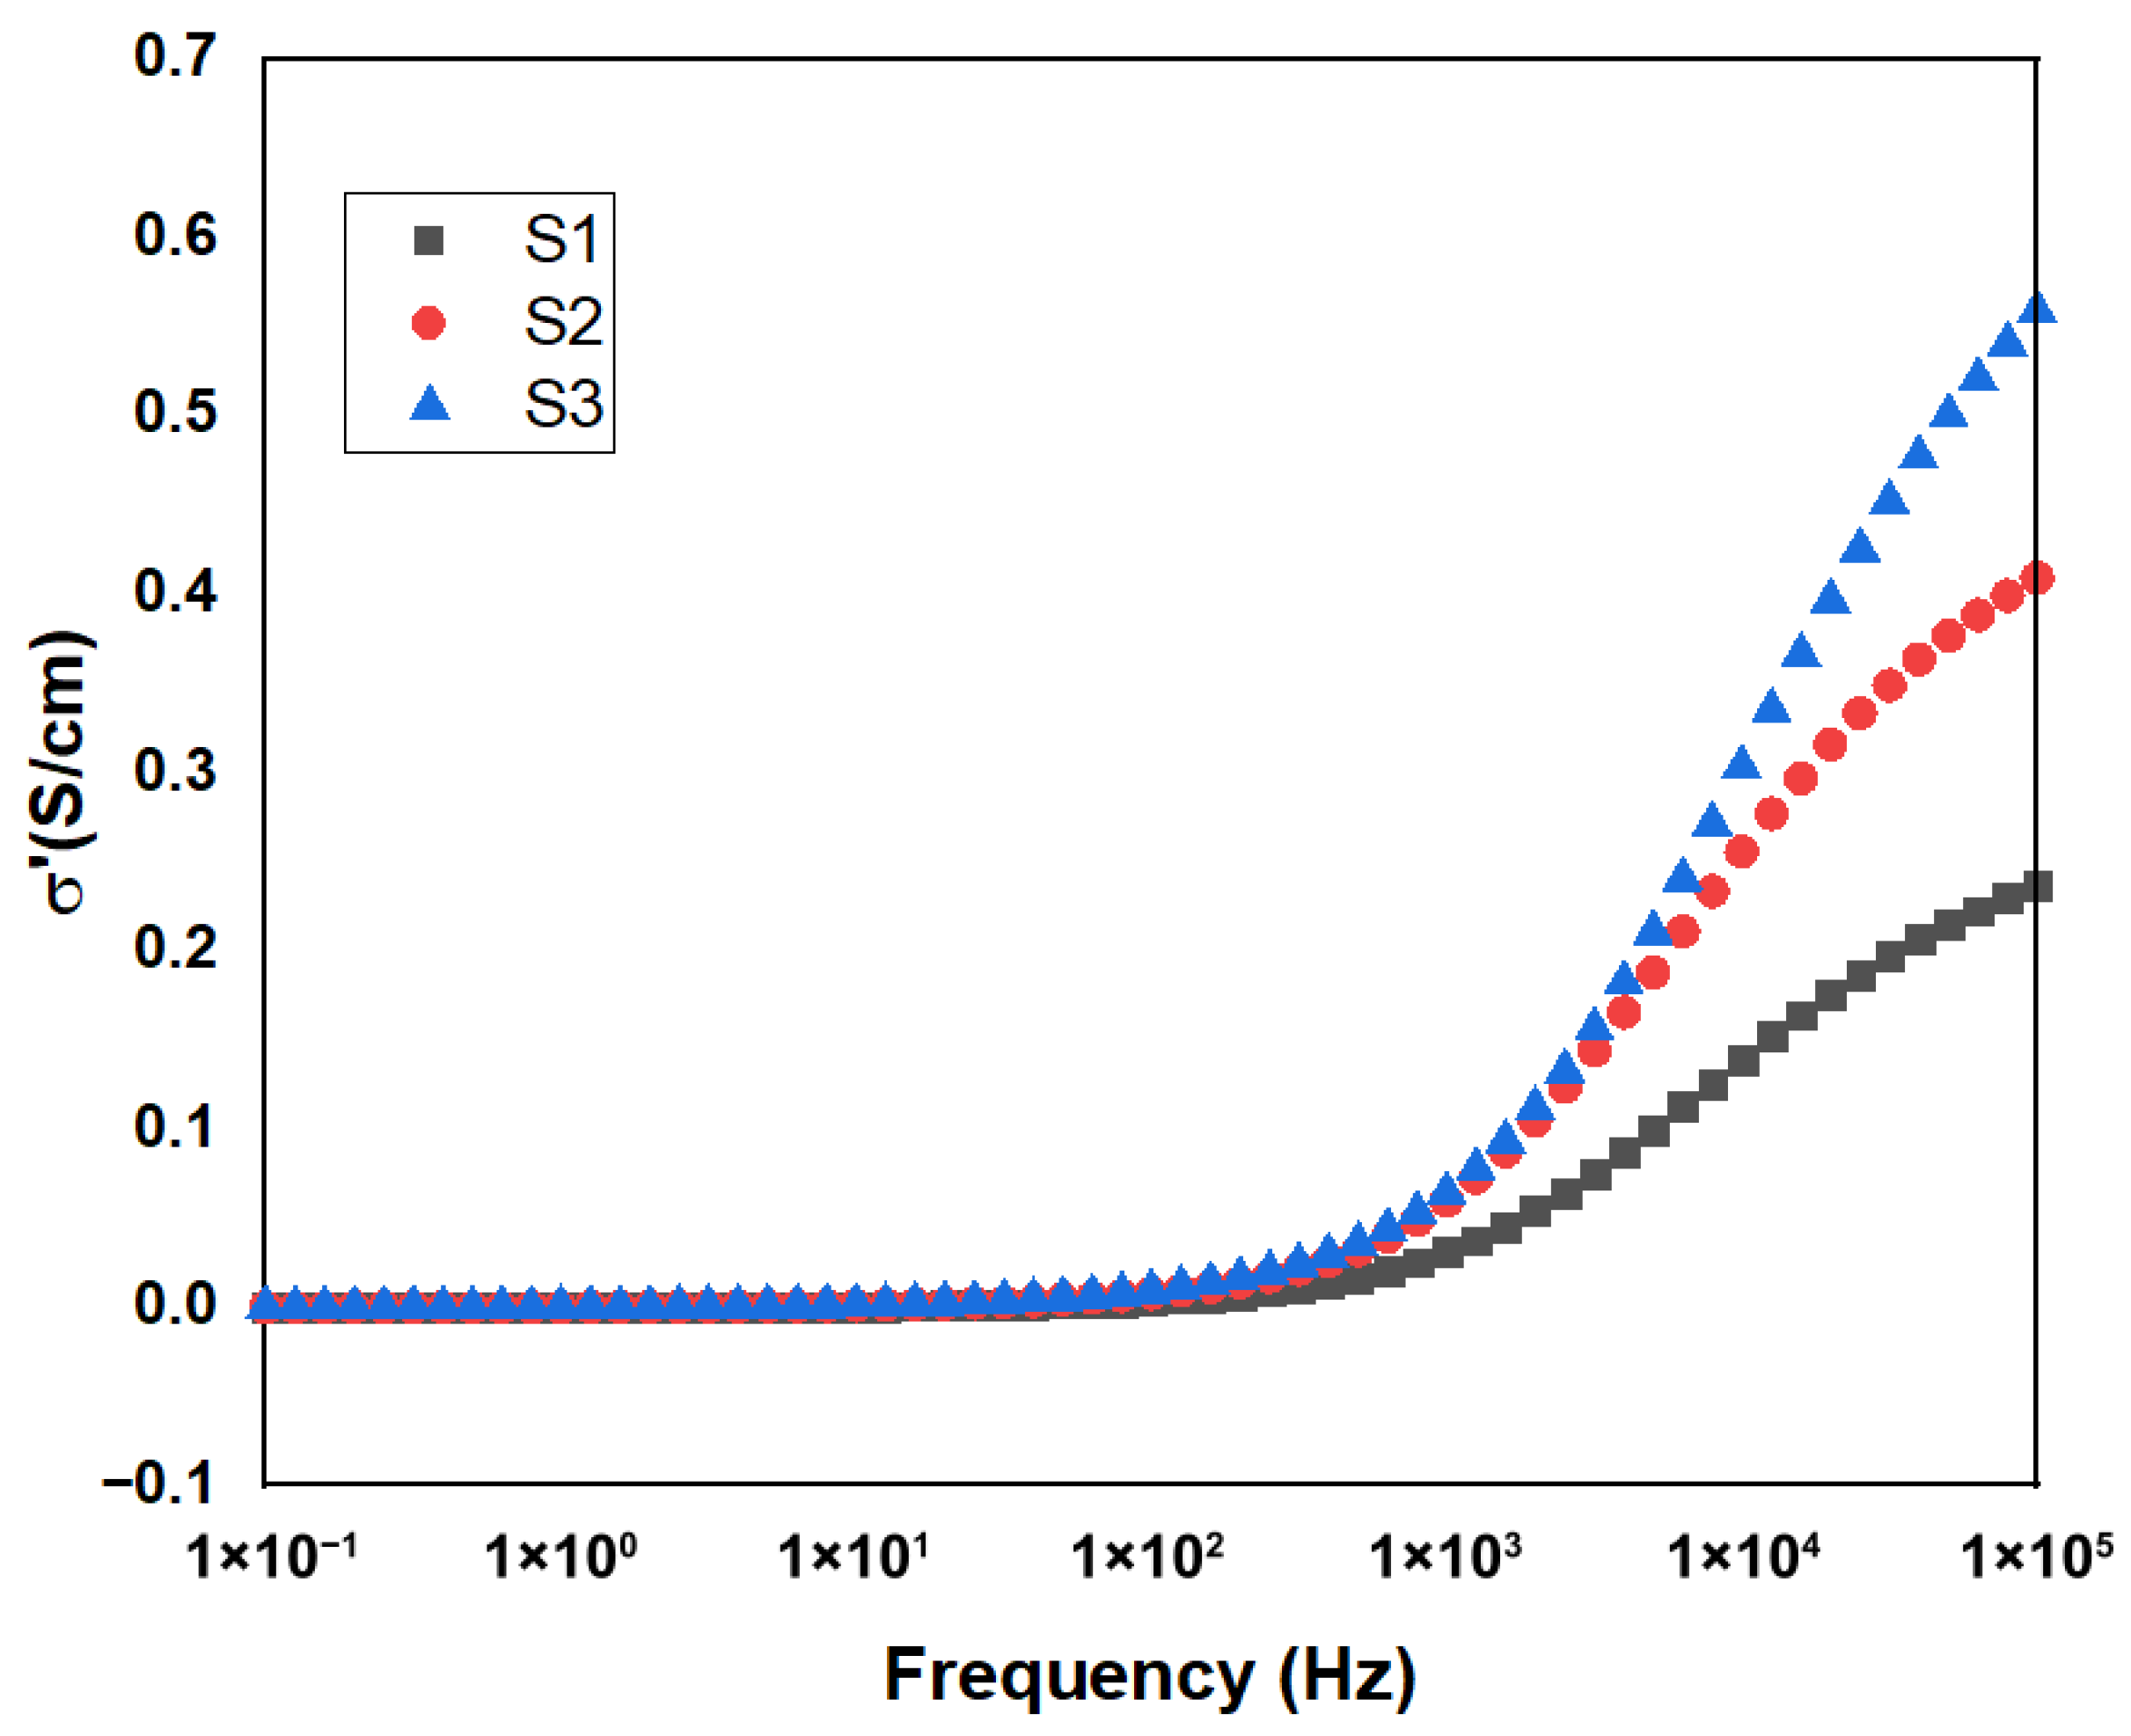
The AC conductivity (σ′) of the three water samples as a function of frequency is shown in Figure 4, where the samples’ conductivity ranking is clearly evident. S1 (RO permeate) has the lowest σ′ across the frequency spectrum, followed by S2 (raw seawater (feed water)), while S3 (RO reject brine) has the highest. This hierarchy is consistent with their ionic concentrations: S1 has a low concentration of ions, S2 is natural seawater, and S3 is a high-concentration brine generated by the RO process [32].
Figure 4.
Frequency dependence of AC conductivity (σ′) for RO permeate, raw seawater (feed water), and RO brine.
At very low frequencies (100–102 Hz), σ′ is almost constant for all samples, showing a plateau that suggests poor long-range charge transport associated with electrode polarization. In this range, ions accumulate at the electrode–electrolyte interface, limiting their involvement in charge transport. At higher frequencies (103–106 Hz), σ′ increases significantly as the speed of the electric field oscillations prevents charge accumulation, allowing bulk conduction to prevail [33].
This rise is more significant for S3 due to its large number of mobile charge carriers and high ionic mobility under alternating electric fields. The shallower increase for S1 confirms its low charge carrier concentration. The much higher σ′ values for S3 at high frequencies also indicate stronger ion-ion interactions and hopping conduction, in line with the dielectric relaxation observed in σ″ [34].
The observation of two relaxation regimes (low-frequency (LF) and high-frequency (HF) relaxations) is a signature of the presence of both different types of polarization processes ruled by ion transport and interfacial effects.
The relaxation seen at low frequencies (LF) is mostly due to interfacial (Maxwell–Wagner–Sillars) polarization. This is the case where ions can travel long distances and accumulate at interfaces (electrode–electrolyte) or in micro-regions with different conductivities. These result in the formation of space-charge layers, which lead to a strong polarization and high dielectric losses (large σ″). The LF relaxation is thus very sensitive to concentration and conductivity gradients, which explains its enhancement in S3 (RO brine), where ion-ion interactions and charge accumulation are the largest. In contrast, the low LF response in S1 is explained by a lack of interfacial polarization due to very low ionic concentrations [35].
The HF relaxation is related to the bulk ionic motion and short-range polarization. Here, the frequency of the electric field is too high to allow long-range ion migration or interfacial polarization. Rather, the local dynamics of ions (hopping conduction) and possibly the dipolar relaxation of water and hydrated ions are dominant. Thus, the HF relaxation is related to intrinsic charge carrier mobility in the bulk solution. The low-frequency shift and broadening of the HF relaxation in sample S3 reflect the slower dynamics due to strong electrostatic interactions, ion pairing, and higher viscosity of concentrated brine. S1 shows a quicker HF relaxation due to the weaker hindrance to the ions’ motion [36].
The observation of both LF and HF relaxations proves the coupling between the low-frequency interfacial charge build-up and high-frequency, bulk ion transport in the electrical response of the samples. The evolution from S1 to S3 illustrates how salinity enhances space-charge effects and ion-ion interactions and transforms the dynamics from weak, fast ionic interactions to strong, slow ionic interactions.
3.3. Impedance Spectroscopy Analysis of Treated Water Samples
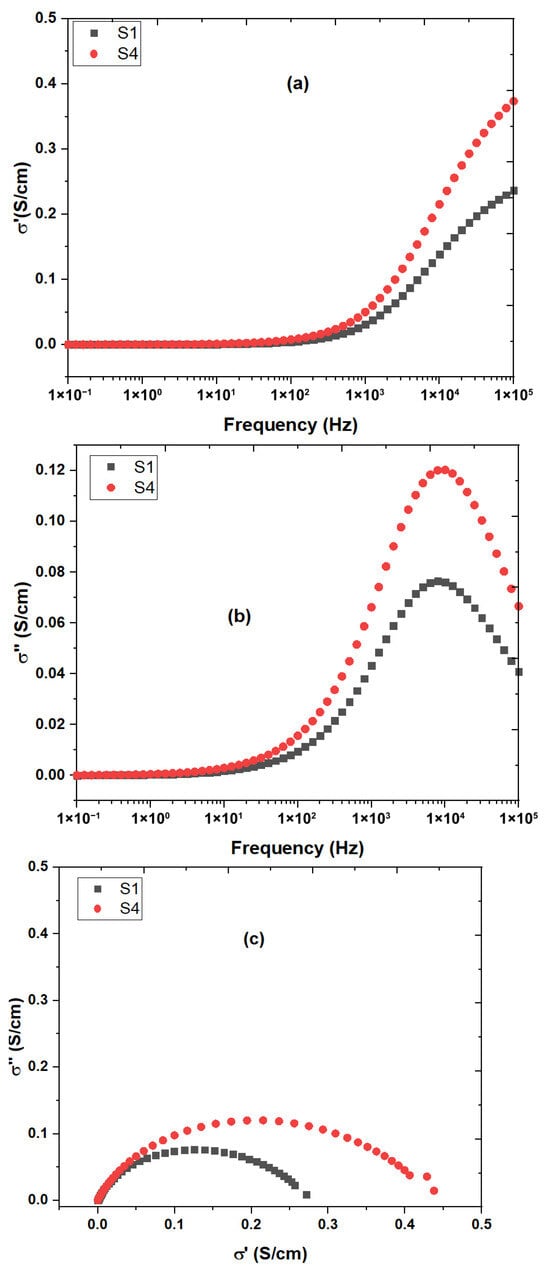
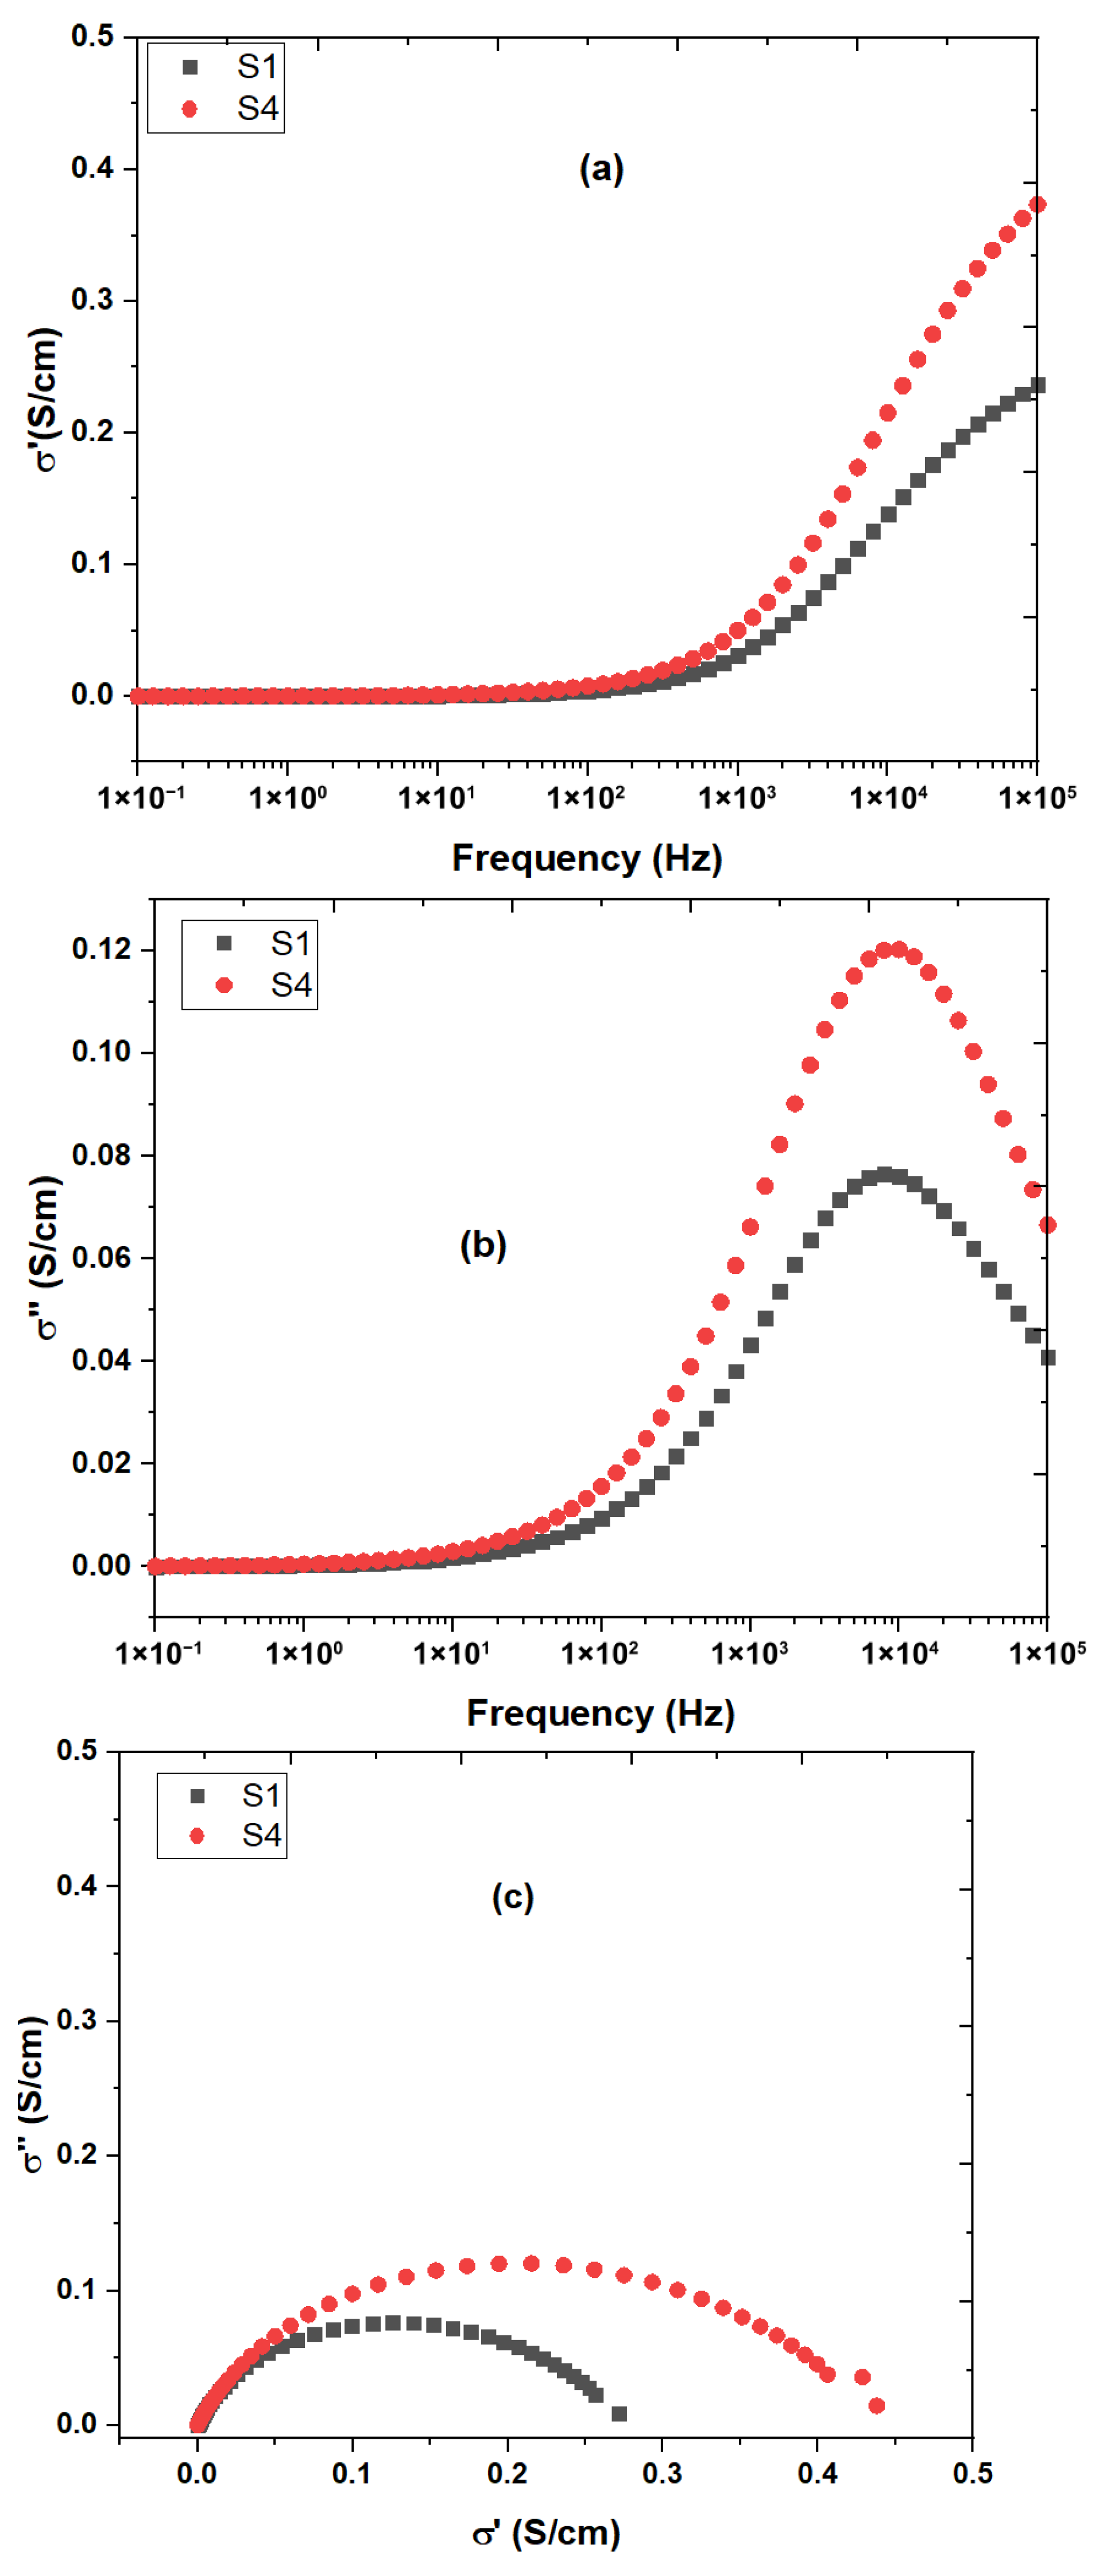
In Figure 5, Bode plots (a-b) and the Nyquist diagram (c) for impedance spectroscopy data obtained from two water samples, S1 (RO-permeate) and S4 (drinking water sample from the distribution), are shown. All three diagrams together provide an insightful overview of the properties of both water samples within the analyzed frequency range. In particular, their electrochemical and dielectric properties show distinctive differences stemming from dissimilar ionic composition and processing of the samples [16].
Figure 5.
Bode (a,b) and Nyquist (c) plots of RO-treated permeate (S1) and distribution network drinking water (S4).
The increase in the real component of conductivity (σ′) versus frequency clearly shows a monotonically increasing function in the case of both water samples studied. The gap between S4 and S1 remains apparent at all frequencies considered, with S4 showing considerably larger values of σ′. This is explained by the fact that the amount of ions contained in S4 is relatively high due to the traditional treatment process employed and, thus, less effective than RO, as it retains the mineral ions. Conversely, S1, being the result of treatment using a membrane filter, lacks ions and is characterized by low values of conductivity due to its high purity. For low frequencies, both specimens tend to approach zero conductivity, implying that the system predominantly exhibits capacitive behavior at the electrode-electrolyte interface, where the mobility of ions is not enough to influence conductive transport [37].
The imaginary part of conductivity (σ″), on the other hand, demonstrates a unique bell curve for both specimens, with a clear peak at a specific relaxation frequency associated with the dynamics of ions in the aqueous phase of each specimen. The peak value observed for S4 is much higher than that of S1 because of the higher concentration of mobile ions in S4. In contrast, the peak for S1 is smaller and broader since the ionic density is low. The relaxation peak frequency of S4 is also lower than that of S1, in line with the existing theory that higher ionic strength leads to lower relaxation frequencies [38].
The Nyquist plot consists of two separate semicircles, wherein S4 shows a much larger semicircle compared to S1 because of its smaller bulk resistance value. The shape of both semicircles is slightly concave, which means that the capacitance of both samples is not ideal and there is a range of relaxation times instead of one unique relaxation time. The larger concavity for S4 suggests that there is a higher electrochemical heterogeneity in the sample’s ionic environment [39].
3.4. Equivalent Electrical Circuit Modeling
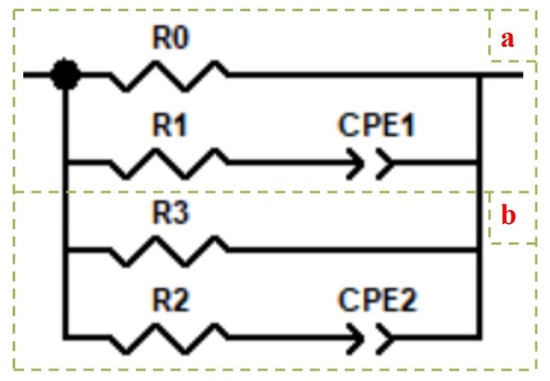
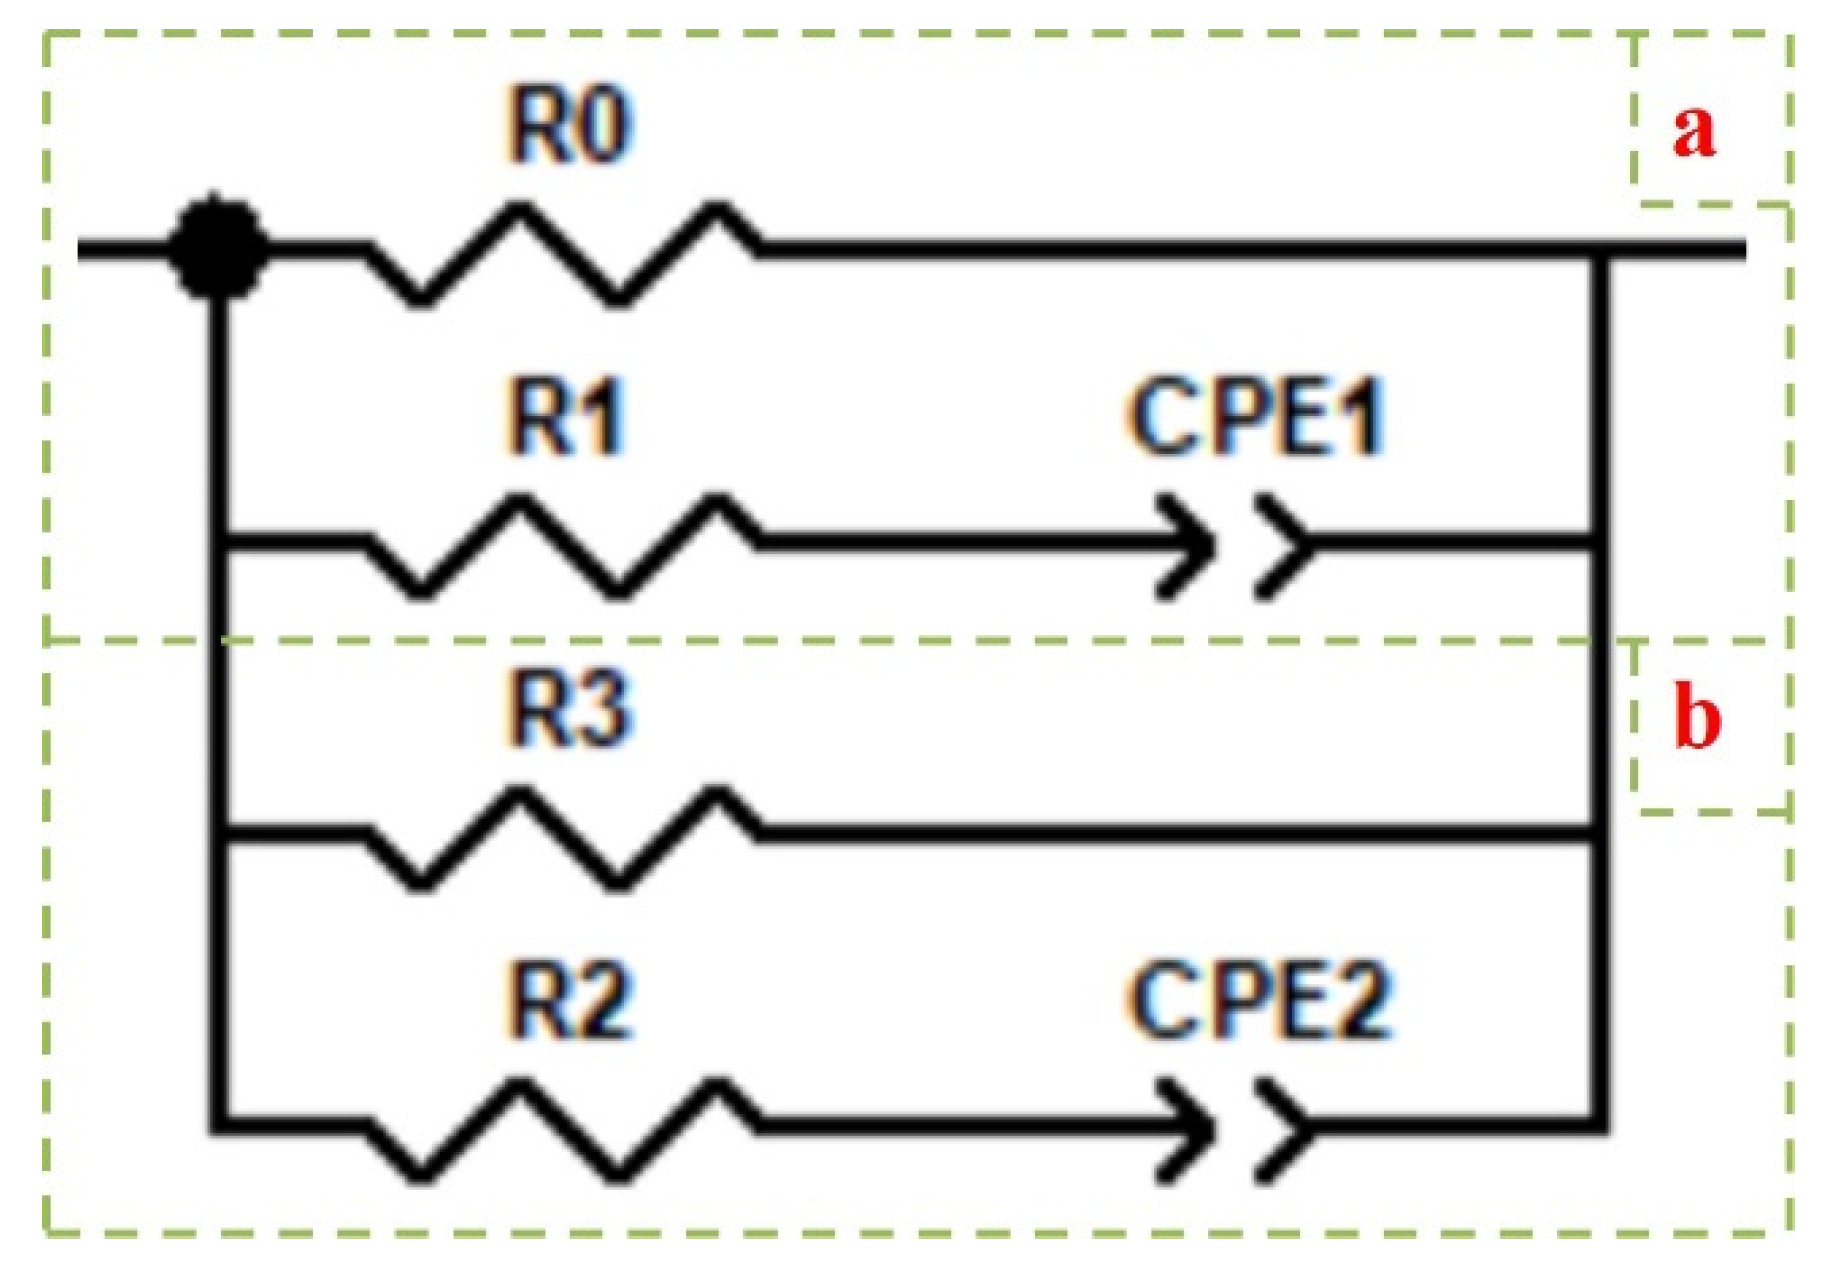
An equivalent electrical circuit approach, combined with the powerful capabilities of ZView software (version 3.1c), offers a valuable technique for the analysis and interpretation of complex conductivity data. The proposed electrical circuit, as shown in Figure 6, comprises two main components selected to model the entire electrical response of all samples. This combined approach (circuit modeling and ZView analysis) allows for correct and precise data interpretation and provides better insight into the conductivity mechanisms [40].
Figure 6.
Equivalent circuit for complex conductivity: (a) Cole–Cole relaxation branch associated with the high-frequency (HF) conductivity response; (b) electrode-polarization branch representing relaxation effects at the electrode–electrolyte interface.
Branch (a) shows the complicated Cole–Cole relaxation that goes along with the high-frequency (HF) conductivity response. This allows us to perform a precise analysis of frequency-dependent conductivity that has been fine-tuned. Branch (b) shows how electrode polarization can cause relaxation effects, which are very important for figuring out how the electrode-electrolyte interface will respond to electricity.
Branch (a) and branch (b) add up to make the complex conductivity.
You can use the following formula to figure out the complex conductivity expression for samples:
The complex admittance that describes the equivalent circuit in Figure 6 is as follows:
Such as: R = (R0//R3)
As shown in Figure 6, the complicated admission for branch (a) can be written like this:
The equation below shows the admission function for a constant phase element
Or and
As shown in Figure 6, the complex admittance for branch (b) can be written as follows:
Or and
The equation shows how the complex admittance and the complex conductivity are related. The letter “T” stands for a parameter that does not change with frequency, and the exponent “p” can be any number between 0 and 1.
Whit is a constant cell.
So, we can write the formula for complex conductivity (σ*) like this:
You can write the complex conductivity of branch (a) like this:
You can write the complex conductivity of branch (b) like this:
The following equation shows how to find the complex conductivity of branches (a) and (b):
Here, ω is the angular frequency, and τ1 and τ2 are the relaxation times for the two respective polarization phenomena. Also, σHF indicates the conductivity at high frequencies, σLF is the conductivity at low frequencies, whereas the last term in the above expression describes the influence of the ionic strength of the medium.
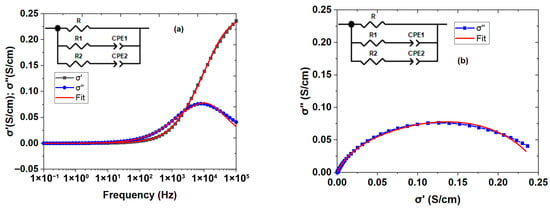
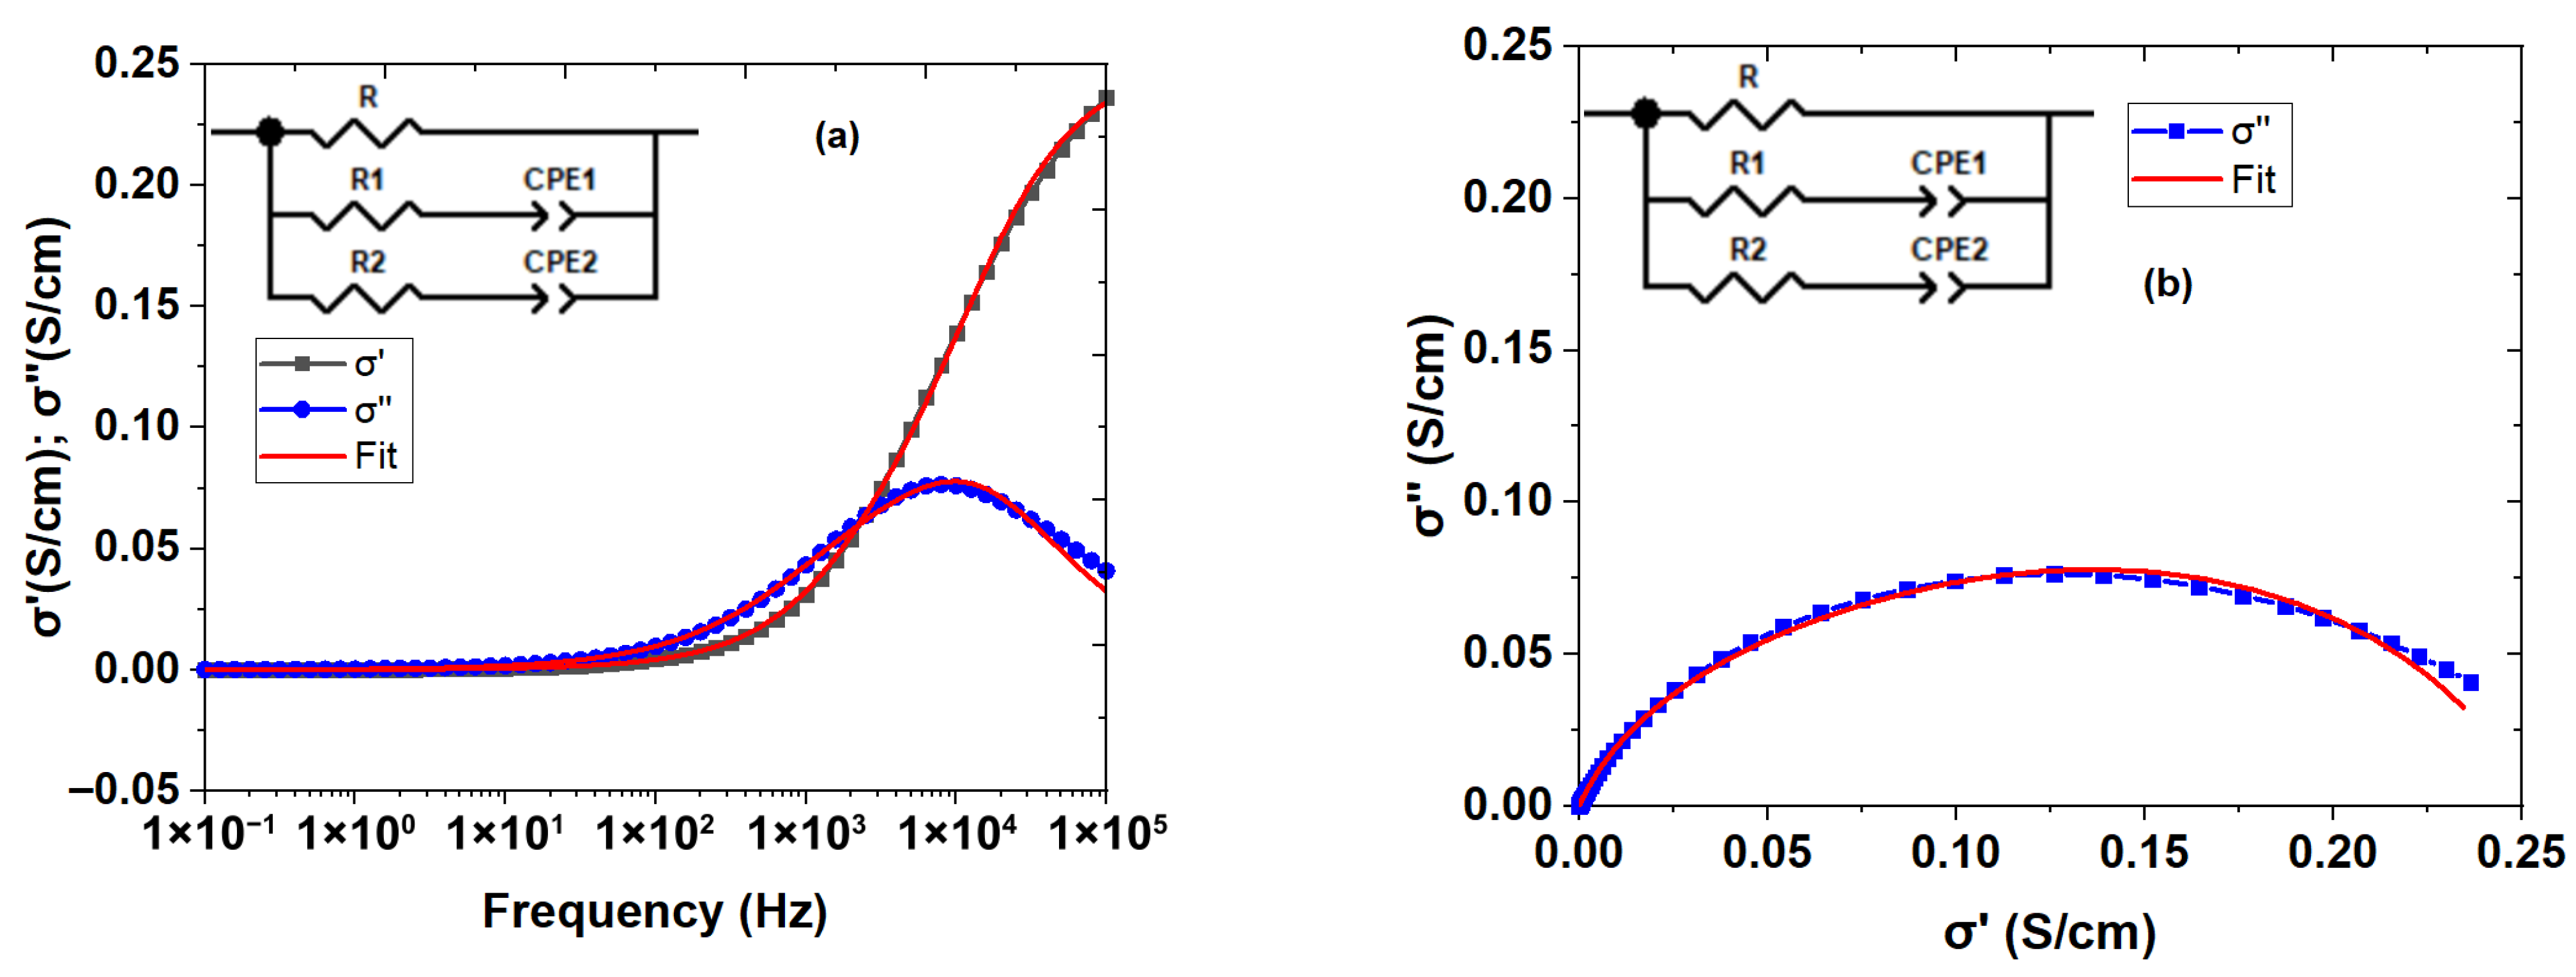
Figure 6 below shows the result achieved from modeling the electrical conductivity data of the distilled water using an equivalent electrical circuit. It should be noted that, in this case, the distilled water sample was selected because all the other samples were similar with respect to their electrical response. Indeed, as illustrated in Figure 7, there is a very high correlation between the observed data and the theoretical predictions of the model (R2 = 0.99) [41].
Figure 7.
Fit of the complex conductivity data for Sample S1 using the equivalent electrical circuit: (a) frequency dependence of the real (σ′) and imaginary (σ″) components of complex conductivity, with the experimental data and fitted curves; (b) Nyquist plot (σ″ versus σ′) showing the experimental data and corresponding equivalent-circuit fit.
In Table 3, a summary of the parameters of the equivalent electrical circuit has been obtained through impedance spectroscopy measurements of the following water samples: sample S1 is RO permeate, S2 is raw seawater, S3 is reject brine, and S4 is treated network water. The measurement technique has provided useful data on the electrical and electrochemical properties of different waters based on parameters such as bulk resistance R (ohms), constant phase elements CPE1 and CPE2, exponents P1 and P2, secondary resistances R1 and R2, relaxation times τ1 and τ2, and relaxation frequencies F1 and F2 [42].
Table 3.
Parameters obtained from equivalent electrical circuit fitting of water samples.
Through the application of impedance spectroscopy analysis to four water samples (S1, S2, S3, and S4), it has not only been possible to completely describe their electrochemical properties, but it has also been possible to understand the complex interactions of water quality throughout the different steps in the reverse osmosis desalination process [43].
There is an obvious duality of the parameter R (Ω). High resistance is observed in samples S1 (permeate water, 7.86 × 10¹⁷ Ω) and S2 (seawater, 1.00 × 10²⁰ Ω), while a comparatively low value is observed for samples S3 (brine, 1.15 × 10¹³ Ω) and S4 (network water, 1.14 × 10⁷ Ω). This hierarchy corresponds to the dependence of resistance on the ionic content of the electrolyte; hence, the more ionized electrolytes of brine and network water display relatively low resistance to electric current passing through the sample, while almost pure permeate and seawater cause quasi-insulating resistance [44].
With respect to the CPE (Constant Phase Element) parameters, the range of CPE1 values goes from 4.57 × 10⁻⁵ (S4) to 9.97 × 10⁻⁵ (S1), and CPE2 varies from 2.55 × 10⁻⁵ (S4) to 7.31 × 10⁻⁵ (S2). CPE1 and CPE2 values describe the non-ideal behavior of electrodes at an interface with electrolytes and the complexity of ionic composition. The higher CPE values observed in S1 and S2 indicate more complex interface dynamics, respectively, due to the trace ions in purified water and the varying mineral content of raw seawater. The values of the exponents P1 and P2 (all around 0.78–0.79) confirm a non-ideal but stable capacitive behavior in all samples, suggesting distributed relaxation mechanisms rather than a single process.
The relaxation times τ1 (s) and τ2 (s) are very informative of the electrochemical kinetics of the samples. S3 (brine) exhibits the longest τ1 value (2.63 × 10⁻⁴ s), followed by S2 (raw seawater, 1.09 × 10⁻⁴ s), S4 (network water, 8.12 × 10⁻⁵ s), and S1 (permeate, 6.76 × 10⁻⁵ s). This trend of increasing relaxation time with increasing ionic load and salinity is in agreement with the research of Mortadi et al. (2025) and El Hafidi et al. (2025), who showed that the higher the ionic strength and the amount of pollutants, the shorter the relaxation times, and the longer the relaxation times for pure waters and low-conductivity waters [3,11]. The long relaxation time of the brine is indicative of the slow molecular reorientation of the large ionic population under the influence of the electric field, while the short relaxation time of the permeate is in line with the quasi-pure, low-ionic environment.
Relaxation frequencies F1 and F2 also confirm the same trend. For S1 (permeate), both F1 (2354.4 Hz) and F2 (14,276.1 Hz) are the highest, whereas S3 (brine) has the lowest F1 (605.76 Hz) and F2 (9003.52 Hz). These values represent the frequencies corresponding to the peak values in the imaginary part of conductivity and represent the frequencies where electrochemical processes such as ionic migration, polarization phenomena, and charge separation at the interfaces achieve maximum efficiency. As seen from these results, a high degree of mineralization reduces the relaxation frequencies; thus, the increased presence of ions impedes the dynamic process of charge reorientation. This corresponds to the results of Hilmi et al. (2025), Bharati and Saroj (2023), and He et al. (2023), demonstrating that the higher ionic strength and conductivity of the medium correspond to higher electrostatic interactions between ions, resulting in slowed relaxation processes and, therefore, decreased relaxation frequencies [45,46,47]. In contrast, the higher relaxation frequencies are caused by the rapid ionic processes occurring in the samples with low conductivity, i.e., highly purified water, as shown in the results by reference values for distilled water (F1 = 148.36 Hz and F2 = 2985.38 Hz).
These results collectively show that impedance spectroscopy is a sensitive and effective technique to distinguish water samples along the desalination process stream. The progressive changes in resistance, CPE parameters, relaxation times, and relaxation frequencies from seawater, through permeate and brine to reticulated water reflect the effects of the RO process on the fundamental electrochemical properties of the system and highlight the promise of this approach for real-time monitoring and process optimization in desalination plant operations.
This current study can therefore be considered a case study carried out on an actual SWRO plant over one sampling campaign only. Even though it is evident from the results that the electrochemical impedance spectroscopy technique has the potential to differentiate between waters treated under various processes, more sampling campaigns under varying operational conditions will be necessary before generalizing to other desalination plants.
4. Conclusions
The combined analysis of physicochemical parameters and electrochemical impedance spectroscopy provides a comprehensive understanding of the seawater desalination process and its impact on the quality of water delivered to consumers. The reverse osmosis unit demonstrated high efficiency in removing dissolved ions, as reflected by the significant reduction in electrical conductivity, salinity, and major cation and anion concentrations in the permeate. Impedance spectroscopy further revealed strong contrasts in ionic mobility and relaxation behavior among the samples, with the reject brine exhibiting pronounced polarization effects due to its high ionic strength. The excellent agreement between the experimental impedance data and the equivalent electrical circuit model confirms the validity of the proposed R–CPE configuration for describing AC conductivity mechanisms in saline systems. The distribution network water exhibited physicochemical characteristics that remained very close to those of the RO permeate, indicating that post-treatment and distribution introduced only minor changes under the investigated operating conditions. These findings demonstrate that the desalinated water maintained its chemical stability throughout the distribution network. These findings highlight the necessity of monitoring both the desalination process and the distribution infrastructure to ensure consistent delivery of safe, high-quality drinking water.
Author Contributions
N.K. and E.M.E.H. were primarily responsible for sample collection and selection, data curation, analysis, methodology development, interpretation, manuscript writing, and initial project conceptualization. A.M. and B.L. were involved in the design and improvement of tables and figures, whereas R.M., M.T., R.E.M., A.A., M.M., S.L., E.M.E., A.H. and E.G.C. contributed to the review and revision process. All authors have read and agreed to the published version of the manuscript.
Funding
This research received no external funding.
Institutional Review Board Statement
Not applicable.
Informed Consent Statement
Not applicable.
Data Availability Statement
The data supporting the findings of this study are available from the corresponding author upon reasonable request.
Acknowledgments
The authors would like to express their sincere gratitude to Reddad El Moznine from the Laboratory of Physics of Condensed Matter (LPMC), Chouaib Doukkali University, El Jadida, for his valuable assistance and support in conducting the impedance spectroscopy measurements.
Conflicts of Interest
The authors declare no conflicts of interest.
References
- Lim, Y.J.; Nadzri, N.; Xue, Q.; Li, C.; Liang, Y.; Wang, R. Quantifying the potential of high-performance RO membranes for seawater and hypersaline brine desalination: From module-scale modelling to experimental evaluation. Desalination 2025, 616, 119394. [Google Scholar] [CrossRef] [Scilit]
- Ahmed, S.; Al Ghamdi, A.S.; Mahmoud, A.M.; Abdalrhman, A.S. Pressure retarded osmosis (PRO) as an option for Energy Recovery and cost reduction during seawater reverse osmosis (SWRO) desalination process by utilizing treated wastewater: A technical and feasibility evaluation. Energy Rep. 2026, 16, 109449. [Google Scholar] [CrossRef] [Scilit]
- El Hafidi, E.M.; Chahid, E.G.; Mortadi, A.; Laasri, S. Study on a new solar-powered desalination system to alleviate water scarcity using impedance spectroscopy. Mater. Today Proc. 2024, S2214785324001019. [Google Scholar]
- Rosa, L.; Gabrielli, P.; Sangiorgio, M. Global energy, costs, and emissions from reverse osmosis desalination under future water scarcity. Water Res. 2026, 289, 124825. [Google Scholar] [CrossRef] [Scilit]
- Nada, A.; Ibrahim, M.G.; Elshemy, M.; Fujii, M.; Sharaan, M. Integrated water quality and performance assessment of seawater desalination plants along two coasts in Egypt. Desalination 2024, 586, 117844. [Google Scholar] [CrossRef] [Scilit]
- Nya, E.D.B.; Akono, D.F.; Belinga, C.B.; Nsangou, D.; Ekomane, E.; Bordeleau, G. Assessment of physico and chemical properties and quality indices of trace metals of surface waters in the shallows of the city of Bafoussam (Central–Africa): Implications for health risks and suitability for irrigation. Environ. Sci. Pollut. Res. 2025, 32, 18226–18247. [Google Scholar] [CrossRef] [Scilit] [PubMed]
- Zou, Y.; Lou, S.; Zhang, Z.; Liu, S.; Zhou, X.; Zhou, F.; Radnaeva, L.D.; Nikitina, E.; Fedorova, I.V. Predictions of heavy metal concentrations by physiochemical water quality parameters in coastal areas of Yangtze river estuary. Mar. Pollut. Bull. 2024, 199, 115951. [Google Scholar] [CrossRef] [Scilit] [PubMed]
- Sin, P.P.S.; Yadai, T.; Yamamura, H.; Suzuki, Y.; Ota, Y.; Nishioka, K. Effect of Water Quality Produced at Each Stage of the Seawater Desalination Process on Hydrogen Production in Water Electrolysis. Appl. Sci. 2026, 16, 2622. [Google Scholar] [CrossRef] [Scilit]
- Chenoufi, L.; Mericq, J.-P.; Sistat, P.; Benac, S.; Heran, M. Wetting monitoring of hydrophobic hollow fiber membrane in real time by electrochemical impedance spectroscopy. Desalination 2026, 628, 120037. [Google Scholar] [CrossRef] [Scilit]
- Mortadi, A.; El Hafidi, E.; Nasrellah, H.; Mghaiouini, R.; Chahid, E.; Monkade, M.; El Moznine, R. Assessing the efficacy of polyaluminium chlorides in improving pool water quality using impedance spectroscopy. Results Eng. 2024, 21, 101911. [Google Scholar] [CrossRef] [Scilit]
- Mortadi, A.; El Hafidi, E.; Labjar, N.; Nasrellah, H.; Chahid, E.; Monkade, M.; El Moznine, R. Monitoring the coagulation mechanism and aluminum sulfate impact on textile wastewater treatment: Insights from impedance spectroscopy. J. Indian Chem. Soc. 2025, 102, 101501. [Google Scholar] [CrossRef] [Scilit]
- El Hafidi, E.M.; Mortadi, A.; Lizoul, B.; Hairch, Y.; Mghaiouini, R.; Sabor, A.; Mnaouer, K.; Chahid, E.G.; Jebbari, S.; El Moznine, R.; et al. Assessment of sand and hearth ash filtration for wastewater treatment and novel monitoring via complex conductivity. Euro-Mediterr. J. Environ. Integr. 2025, 10, 1137–1148. [Google Scholar] [CrossRef] [Scilit]
- Das, S. Basic Physicochemical Properties of Water. In An Introduction to Water Quality Science; Springer International Publishing: Cham, Switzerland, 2023; pp. 39–69. [Google Scholar]
- Chebbi, G.; Elaoud, A.; Trigui, M. Physico-chemical characterization of water obtained by condensation of moisture from an atmospheric water generator. Euro-Mediterr. J. Environ. Integr. 2026, 11, 96. [Google Scholar] [CrossRef] [Scilit]
- Ikani, N.; Pu, J.H.; Cooke, K. Analytical modelling and electrochemical impedance spectroscopy (EIS) to evaluate influence of corrosion product on solution resistance. Powder Technol. 2024, 433, 119252. [Google Scholar] [CrossRef] [Scilit]
- Yao, L.; Xu, X.; Gui, Y.; Li, Y.; Chen, Z.; Han, J.; Liao, Y. An electrochemical impedance spectroscopy study on ion-fouling of forward osmosis membranes. Desalination 2024, 578, 117466. [Google Scholar] [CrossRef] [Scilit]
- Chen, H.; Zou, M.; Dong, H.; SenGupta, A.K. 2026 CO2-driven hybrid ion exchange: A resilient reverse osmosis pretreatment for high-recovery wastewater reuse. Water Res. 2026, 292, 125332. [Google Scholar] [CrossRef] [Scilit] [PubMed]
- Huang, J.; Li, S.; Dalagah, S.; Stone, S.; Ahles, D.; Mouawad, J.; Sharbatmaleki, M. Closed-Circuit Reverse Osmosis Performance Evaluation in a High-Recovery-Rate Water Reclamation Pilot Project. Sustainability 2025, 17, 3388. [Google Scholar] [CrossRef] [Scilit]
- Thu, N.T.; Patra, S.; Pranudta, A.; Nguyen, T.T.; El-Moselhy, M.M.; Padungthon, S. Desalination of brackish groundwater using self-regeneration hybrid ion exchange and reverse osmosis system (HSIX-RO). Desalination 2023, 550, 116378. [Google Scholar] [CrossRef] [Scilit]
- Cho, M.; Han, S.; Lee, S.; Kim, J.B.; Kim, B. Enhanced Salt Removal of Fresh Water by Recovery-Reduced Ion Concentration Polarization Desalination. Membranes 2024, 14, 56. [Google Scholar] [CrossRef] [Scilit] [PubMed]
- Derakhshani, E.; Miri, M.R.; Arab-Zozani, M.; Gholamzadeh, M.; Naghizadeh, A. Sustainable household water treatment systems based on reverse osmosis (RO) in ensuring safe drinking water: A systematic review of assessing physicochemical water quality changes and future outlook. Phys. Chem. Earth Parts ABC 2025, 141, 104131. [Google Scholar] [CrossRef] [Scilit]
- Ozkul, S.; Van Daal, J.J.; Kuipers, N.J.M.; Bisselink, R.J.M.; Bruning, H.; Dykstra, J.E.; Rijnaarts, H.H.M. Transport mechanisms in electrodialysis: The effect on selective ion transport in multi-ionic solutions. J. Membr. Sci. 2023, 665, 121114. [Google Scholar] [CrossRef] [Scilit]
- Du, Y.; Wang, L.; Belgada, A.; Younssi, S.A.; Gilron, J.; Elimelech, M. A mechanistic model for salt and water transport in leaky membranes: Implications for low-salt-rejection reverse osmosis membranes. J. Membr. Sci. 2023, 678, 121642. [Google Scholar] [CrossRef] [Scilit]
- Xu, S.; Zheng, R.; Li, Z.; Tong, X.; Yu, X.; Zhao, Y. Deciphering the overlooked role of dielectric exclusion in the ion selectivity of nanofiltration membranes. J. Membr. Sci. 2025, 733, 124342. [Google Scholar] [CrossRef] [Scilit]
- Rivero-Falcón, A.; López-López, Y.; Peñate-Suárez, B.; Melián-Martel, N. Pilot-scale evaluation and optimization of osmotically assisted reverse osmosis (OARO) for concentrating real SWRO brine. Sep. Purif. Technol. 2026, 394, 137358. [Google Scholar] [CrossRef] [Scilit]
- Kang, H.; Koo, B.; Chai, H.; Jung, S.P. Impedance characteristics and polarization behaviors of microbial reverse-electrodialysis cells with changes in effective membrane area, intermembrane distance, and flow rates of salinity gradient waters. J. Environ. Chem. Eng. 2024, 12, 114313. [Google Scholar] [CrossRef] [Scilit]
- Bengi, S.; Çetinkaya, H.G.; Altındal, Ş.; Durmuş, P. Investigation of the frequency effect on electrical modulus and dielectric properties of Al/p-Si structure with %0.5 Bi:ZnO interfacial layer. Ionics 2024, 30, 3651–3659. [Google Scholar] [CrossRef] [Scilit]
- Guo, M.; Jia, H.; Gao, F.; Wang, J. Concentration polarization and membrane fouling characteristics in ultrafiltration based on electrical impedance analysis: Synergistic or translational? Desalination 2025, 611, 118922. [Google Scholar] [CrossRef] [Scilit]
- Popov, I.; Ishai, P.B.; Khamzin, A.; Feldman, Y. The mechanism of the dielectric relaxation in water. Phys. Chem. Chem. Phys. 2016, 18, 13941–13953. [Google Scholar] [CrossRef] [Scilit] [PubMed]
- El Hafidi, E.M.; Mortadi, A.; Chahid, E.G.; Laasri, S. Effect of trichloroisocyanuric acid concentration on the electrical properties of swimming pool water. Sci. Rep. 2025, 15, 5223. [Google Scholar] [CrossRef] [Scilit] [PubMed]
- Hota, S.B.; Nandy, S.; Das, K.; Biswas, D.; Mittal, V.; Pramanik, D.; Mondal, R.; Roy, D. Effect of Bi2O3 addition on the mechanical and dielectric properties of Bi2O3-BaO-P2O5-V2O5 glasses with improved thermal stability. J. Mater. Sci. Mater. Electron. 2025, 36, 1248. [Google Scholar] [CrossRef] [Scilit]
- Antony, A.; Chilcott, T.; Coster, H.; Leslie, G. In situ structural and functional characterization of reverse osmosis membranes using electrical impedance spectroscopy. J. Membr. Sci. 2013, 425–426, 89–97. [Google Scholar] [CrossRef] [Scilit]
- Chaudhary, N.A.; Shah, K.N.; Vaja, C.R.; Rana, V.A.; Kumar, D.; Prajapati, A.N. Electrode polarization and ionic conduction relaxation in n-Hexanol and DMF Mixtures at 303.15 K: Insights into molecular dynamics. Ionics 2024, 30, 7607–7619. [Google Scholar] [CrossRef] [Scilit]
- Wang, W.; Shi, J.; Yang, H.; Li, X.; Zheng, Z.; Huang, L. Curved-Electrode Conductivity Sensor for Real-Time Salinity Monitoring in Shipboard Desalination Systems. In Proceedings of the 7th Advanced Information Management, Communicates, Electronic and Automation Control Conference (IMCEC); IEEE: Chongqing, China, 2025; pp. 484–487. [Google Scholar]
- Capaccioli, S.; Lucchesi, M.; Casalini, R.; Rolla, P.A.; Bona, N. Effect of water inclusions on charge transport and polarization in porous media. IEEE Trans. Dielectr. Electr. Insul. 2001, 8, 454–460. [Google Scholar] [CrossRef] [Scilit]
- Korb, J.-P. Nuclear magnetic relaxation of liquids in porous media. New J. Phys. 2011, 13, 035016. [Google Scholar] [CrossRef] [Scilit]
- Sing, M.; Marangoni, A.G.; Pensini, E. Mixing behavior and electrical conductivity of diisopropyl amine-water surfactantless emulsions: Implications for the electrokinetic purification of water. Colloids Surf. C Environ. Asp. 2024, 2, 100026. [Google Scholar] [CrossRef] [Scilit]
- El Hafidi, E.M.; Chahid, E.G.; Laasri, S. General Overview of Wastewater Types, Treatment Processes, and Sludge Valorization. In Breakthroughs in Water Engineering, Treatment, and Hydraulics Through Nanomaterial Innovation; Saleh, T.A., Ed.; IGI Global Scientific Publishing: Hershey, PA, USA, 2026; pp. 121–166. [Google Scholar]
- Hardianto, Y.P.; Shah, S.S.; Mohamed, M.M.; Sarker, S.; Aziz Md, A. Fundamentals of electrochemical impedance spectroscopy in energy storage devices: Principles and innovative curve fitting approaches. Discov. Electron. 2026, 3, 9. [Google Scholar] [CrossRef] [Scilit]
- Awayssa, O.; Ismail, R.A.; Hilal-AlNaqbi, A.; Al Ahmad, M. Electrical Circuit Model for Sensing Water Quality Analysis. Water 2025, 17, 2345. [Google Scholar] [CrossRef] [Scilit]
- El Hafidi, E.M.; Mortadi, A.; Lizoul, B.; Chahid, E.G.; Laasri, S. Valorization of Industrial Wastewater Treatment Sludge in Eco-Friendly Mortars: Enhancing Thermal Insulation and Sustainability. Recycling 2025, 10, 192. [Google Scholar] [CrossRef] [Scilit]
- Huo, X.; Shan, G.; Yang, L.; Gao, L.; Wang, Y.; Zhang, M.; Fu, Y.; Li, W.; Zhang, J. Impedance analysis of alkaline water electrolysis based on distribution of relaxation time. Int. J. Hydrogen Energy 2024, 53, 684–697. [Google Scholar] [CrossRef] [Scilit]
- Wang, X.; Kong, W.; Zhai, X.; Wang, Z.; Epsztein, R.; Li, X. Direct Quantification of Ion Partitioning and Diffusion Resistances in Reverse Osmosis Membranes via Electrochemical Impedance Spectroscopy. Environ. Sci. Technol. 2025, 59, 11353–11364. [Google Scholar] [CrossRef] [Scilit] [PubMed]
- Avci, A.H.; Lipnizki, F. Salinity gradient power from synthetic river water, brackish water, seawater and brine by reverse electrodeionization. Electrochim. Acta 2025, 537, 146873. [Google Scholar] [CrossRef] [Scilit]
- Hilmi, D.; Zaim, S.; Mortadi, A.; Nmila, R.; ElMoznine, R. Synergy between precipitation and adsorption in phosphate removal using fly ash: Complex conductivity and relaxation time analysis for optimal dosage. J. Mol. Liq. 2025, 438, 128779. [Google Scholar] [CrossRef] [Scilit]
- Bharati, D.; Saroj, A. Plasticization effect of ionic liquid on structural, thermal and ion transport properties of CS-PVA-NaI based bio-polymer electrolyte membranes. Polym.-Plast. Technol. Mater. 2023, 62, 989–1007. [Google Scholar] [CrossRef] [Scilit]
- He, F.; Xue, B.; Zhao, X.; Yin, J. Electrorheological effect and dielectric properties of Poly(ionic liquid) microspheres with different length of alkyl chain spacer between ion pair and backbone. Polymer 2023, 268, 125714. [Google Scholar] [CrossRef] [Scilit]

Disclaimer/Publisher’s Note: The statements, opinions and data contained in all publications are solely those of the individual author(s) and contributor(s) and not of MDPI and/or the editor(s). MDPI and/or the editor(s) disclaim responsibility for any injury to people or property resulting from any ideas, methods, instructions or products referred to in the content. |
© 2026 by the authors. Licensee MDPI, Basel, Switzerland. This article is an open access article distributed under the terms and conditions of the Creative Commons Attribution (CC BY) license.