


Abstract
Various explanatory factors for perceived happiness have been identified in cross-country comparisons, but their relative importance and causal relationships remain unknown. Associations and causality were studied between 17 societal, economic, and religious variables contributing to happiness scores on the World Happiness Report (WHR) in 147 countries. In a correlation analysis, the strongest association with national happiness scores was observed for the median gross domestic product (GDP)/capita (r squared 0.69), followed by the mean GDP/capita (0.65), tertiary education (0.42), corruption (−0.41), democracy index (0.35), religious non-affiliation (0.31), and consanguinity (−0.25). Bayesian statistical analysis indicated strong causal cascades originating from democracy (a positive effect) and, to a lesser degree, corruption (a negative effect) during the years 1945–1985 to subsequent national happiness levels, with a delay of several decades. The results were confirmed to have good reproducibility with Bootstrap resampling, indicating robust findings. Although the median GDP/capita had the strongest association with happiness in the cross-sectional analysis, it was not identified as a primary causal factor in the Bayesian analysis, in which high levels of democracy and low levels of corruption were entangled with median GDP/capita as apparent prerequisites for perceived happiness. Our results suggest that the median GDP should be used as an indicator of the economic prosperity of citizens instead of the currently established mean GDP when studying the links between economy, democracy, and well-being across countries.
1. Introduction
Since time immemorial, humankind has striven for happiness and well-being. Definitions of happiness have differed from the time of the ancient Greeks to the medieval Christian world, the modern era, and the present. Individuals’ struggle for happiness in particular has increased in postmodern society, where they need to form a basis for and determine the meaning of their own lives themselves.
Various studies have measured happiness in different ways. Happiness is a crucial human disposition that denotes a construct characterizing positive feelings and overall well-being in individuals. Happiness can be perceived as a relatively stable state of overall well-being linked to diverse facets of an individual’s life, distinguished from more transient emotions like joy or sadness [1]. There are several potential pathways leading to increasing well-being and happiness in human societies. The widely acknowledged Welzel and Inglehart human development sequence framework suggests that in poor and underdeveloped societies, survival is a priority, ensured by strict control and order [2]. When living conditions improve, individuals can start to pursue non-materialistic goals, such as independence, self-expression, and freedom of choice. Higher income, and better education and healthcare enable empowerment of people, and when emancipated individuals value greater autonomy, societies develop towards democracy. However, since economic development and democratic rights are entangled and interact with each other, it is difficult to differentiate if economic growth predominantly leads to democratization or vice versa.
The World Happiness Report (WHR) calculates the perceived happiness of citizens of each country and has become the established indicator of comparative well-being in over 140 countries. Because it is the most widely referenced dataset for country-specific perceived happiness, it was used in this study. The WHR uses the Cantril Ladder as its measurement method [3]: individuals evaluate both their life and life satisfaction on a scale from 0 to 10, with 0 referring to the worst possible life and 10 to the best possible life. Preceding research has proposed factors underlying happiness scores in different countries. Happiness has mostly been explained by economic, social, and health-related factors, personal rights, and freedom, as well as low levels of corruption. These studies [3,4,5,6,7,8,9,10,11,12,13,14,15,16,17,18,19,20,21,22] are summarized in Table 1. Only five studies included more than 100 countries, which may have been the reason for many contradictory findings between studies, such as a positive [3,9,14,17,18,22], negative [5,8,19], or neutral [4] associations between mean gross domestic product (GDP) per capita. These results possibly depend on which particular countries were included, since the mean GDP per capita does not reflect the income level of ordinary people if the wealth is concentrated to few individuals of the elite. The most consistent finding has been the association between low corruption level and happiness [3,4,7,9,16,18,21,22]. In the WHR, variance in national happiness is primarily explained by social support from friends and family, followed by the log mean gross domestic product (GDP) per capita, health and life expectancy, the freedom to make life choices, generosity, and perceptions of corruption. One of the proposed explanations for Nordic countries scoring highest in the World Happiness Report has been mutual trust in other people and authorities [23,24,25,26]. Concerning these variables, the first comprehensive data were published in 2006 with the Gallup World Poll on social support conducted by the WHO in 2000, regarding healthy life expectancy, and in 2010 with the Gallup World Poll on generosity. Since the aim of our study was to investigate long-term causal cascades originating more than 30 years prior to the outcome, these variables were not included in our analyses. Religions have been found to have positive [4,12,13,18], negative [10], or mixed [6,11] associations with perceived happiness. Therefore, we also included religions as variables in our study. No previous studies have investigated the comparative importance of the contributing factors, including the median income instead of mean income per capita, or used time-series data to investigate the causal temporal evolution in perceived happiness.
Table 1.
Review of the literature.
Several cross-sectional happiness studies have examined the correlation of explanatory variables and happiness, but causality cannot be analyzed by investigating associations only. To the best of our knowledge, no previous study has attempted to examine the causal cascade underlying differences in comparative happiness among countries. Therefore, in this study, we used Bayesian causal inference to discover which variables contribute most significantly to national happiness levels. Ultimately, the variables identified in the aforementioned 20 studies were included, plus one additional variable, the median GDP per capita. This variable was included because the mean GDP does not reflect the income level of common people if the income per capita has a skewed distribution. In contrast, the Gini coefficient shows the relative distribution of income but not the absolute level of median income. Therefore, median GDP per capita can be considered a good indicator of the materialistic prerequisite for empowerment in the aforementioned Welzel–Inglehart human development sequence framework. No a priori hypothesis was set concerning the comparative importance of the variables for perceived happiness, i.e., we had a hypothesis that any variable could be the most important factor associated with the WHR happiness outcome, and the comparative contributions and interactions of all specific variables were studied in the same analysis. Therefore, the issue of multiple comparisons was addressed with appropriate statistical methods.
2. Methods
2.1. Data Sources
To facilitate time-series analysis with a reasonable amount of data, information on the variables was gathered at 5-year intervals. Data were retrieved from the following public databases: country happiness rankings from the World Happiness Reports 2012 [27], 2018 [28], and 2025 [3]; religion percentages from the Pew Research Center [29]; annual Gini index data from GapMinder [30]; median GDP and mean GDP per capita from Our World in Data [31]; democracy indexes from Our World in Data [32]; timelines of world religions from Schultz et al. [33]; corruption indexes from Our World in Data [34]; education statistics from BarroLeeData (the latest data was available from the year 2010 [35]); the number of Christian denominations (countries classified as Protestant, Orthodox, or Roman Catholic) from the U.S. Department of State Office of International Religious Freedom [36]; and consanguinity statistics from World Population Review [37]. Each annual World Happiness Report includes data from three previous years; therefore, the 2025 report covers the years 2022, 2023, and 2024 retrospectively but not the year 2025 itself.
The associations between the newest variables available for the Gini index; median GDP/capita; mean GDP/capita; corruption; democracy index; primary education; tertiary education; consanguinity; percentages of Christians, Buddhists, Hindus, Muslims, and non-affiliated individuals; and the religion timeline (duration of practiced religion in each country) and WHR 2025 results were investigated using Spearman correlation analysis with SPSS version 29.0.2.0. The level of significance was set at p = 0.05:14 = 0.00357 with Bonferroni correction. The causality between all time-series variables was then studied using Bayesian statistics.
2.2. Bayesian Analysis
2.2.1. Purpose and Principles
A Bayesian analytical framework [38,39] was employed to examine how countries’ religious background and contemporary socio-economic status relate to national happiness levels, measured with the WHR Happiness Index. Bayesian analysis (BA)—implemented through Bayesian networks (BNs)—provides a powerful and flexible approach to investigating complex systems, especially when data are limited, uncertain, or contain missing values. Unlike traditional frequentist methods, BA can effectively handle non-linear relationships and small sample sizes by incorporating prior knowledge and uncertainty directly into the modeling process [40,41,42,43,44].
A key strength of BA lies in its ability to incorporate causal assumptions from observational data, offering a structured framework for reasoning about potential cause–effect relationships [45,46]. This makes BA particularly suitable for social and political research, where data are often observational and confounding factors are difficult to control. Consequently, Bayesian approaches have become increasingly popular in empirical political science and the social sciences as they allow researchers to address data challenges in a more transparent and principled manner than competing methods [47,48]. Although temporal ordering rules out reverse causation, residual bias due to unmeasured factors cannot be eliminated even in the Bayesian approach.
BNs are represented as Directed Acyclic Graphs (DAGs) composed of nodes that represent random variables and arcs that denote conditional dependencies between them. Each node is associated with a conditional probability distribution, quantifying the strength and direction of dependencies between connected variables. The directionality of arcs—from “parent” to “child” nodes—enables the modeling of both causal and non-causal (predictive or explanatory) relationships, depending on the research context.
Moreover, BNs allow researchers to control or manipulate variables within the model to test the impact of specific factors while holding others constant. By setting particular variable states or combinations, it is possible to explore “what-if” scenarios—a valuable feature for assessing the potential influence of religion-related factors on socio-economic outcomes [40,41,42,46,47].
2.2.2. Implementation Steps
The first step in the analysis involved constructing a fully connected network of manifest (observed) variables using the Maximum Spanning Tree algorithm with the Minimum Description Length (MDL) score. The Maximum Spanning Tree (MST) algorithm was used only as an initial exploratory step to identify groups of strongly associated variables for subsequent cluster construction. Since the objective at this stage was not to infer the final BN structure but to reveal the strongest dependency patterns among variables, the default BayesiaLab parameter settings were considered appropriate. The resulting MST served solely as the basis for defining clusters, after which the latent variable model was estimated independently. Variables Hap12, Hap18, and Hap25 (“Hap” refers to happiness, and the numbers refer to the years 2012, 2018, and 2025) were excluded at this stage to ensure they remained outside the clusters. After validating the clusters through multiple clustering procedures in Probabilistic Structural Equation Modeling (PSEM), a set of latent variables representing each cluster was obtained, with a purity of approximately 85% [38,49].
PSEM in BayesiaLab extends traditional Structural Equation Modeling (SEM) and factor analysis into a fully probabilistic framework. In this approach, relationships among variables—both manifest (observed) and latent (unobserved)—are expressed as conditional probabilities rather than fixed linear equations. Leveraging BayesiaLab’s clustering and structure learning algorithms, latent variables are automatically inferred as hidden nodes that group together religious and socio-economic characteristics of countries exhibiting similar patterns. These latent nodes function analogously to factors in conventional factor analysis, representing unobserved dimensions that account for shared variance among observed indicators [38,50].
In the next phase, Hap12, Hap18, and Hap25 were reintroduced into the model, and the latent variables were temporally ordered using Temporal Indexes (TIs). The latent variables were then classified into seven time-based groups, beginning with religious background factors, to reflect temporal causality. The outcome variable, Hap2025, represented the final observed state. Each latent variable was defined according to the manifest variables exerting the strongest influence upon it [38].
Finally, an unsupervised learning algorithm, Taboo Order, was applied to construct a causal BN that identified dependencies among latent variables and their connections to the outcome. A Taboo Order search was performed with a list size of 10 and a post-processing list size of 71, parameters that control the number of candidate solutions retained during the main search and the subsequent refinement stage, respectively. Larger values enable a broader exploration of the search space at the expense of increased computation time. No forbidden or forced arcs were in use.
In the graphical representation, all manifest (observed) variables were integrated with the latent variables. The resulting model is visualized as a Directed Acyclic Graph (DAG), where both manifest and latent variables are interconnected and converge on the outcome variable—the Happiness Index (2025). We analyzed the amount of mutual information shared between the explanatory factors and the target node, as well as total effects on the target (Happiness 2025).
A robustness assessment of the arcs connecting the remaining variables through the implementation of the Bootstrap resampling method was carried out within BayesiaLab version 11.7.4 (Bayesia, Changé, France, 2023). Bootstrapping was performed using the Taboo Order algorithm, using a list size of 10 and 100 tests. This assessment exclusively incorporated arcs that were consistently present across all networks derived from the Bootstrap resampling, thereby ensuring that a 70% presence criterion was met.
3. Results
3.1. Correlation Analysis
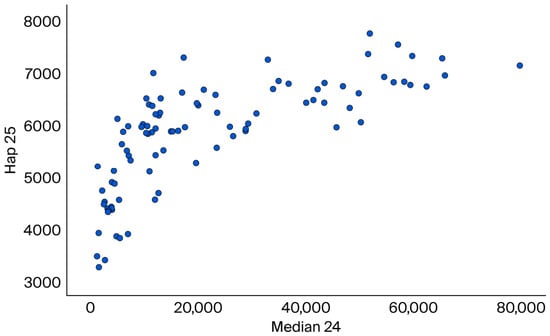
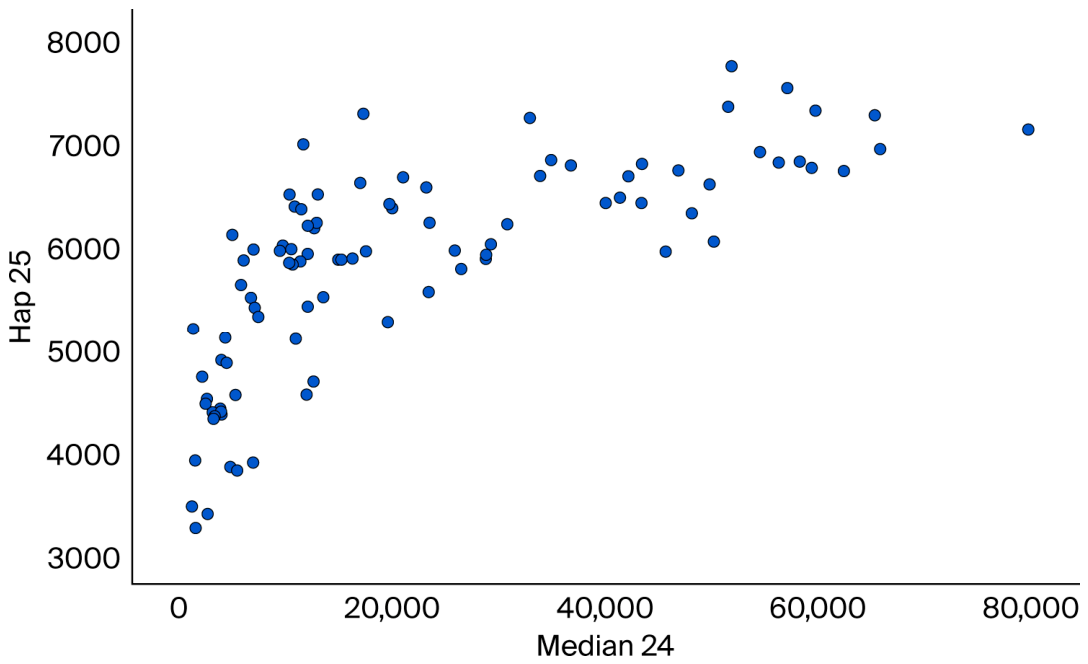
Table 2 shows the Spearman correlations between the latest national happiness scores and 14 explanatory continuous variables. The three remaining categorical variables related to subtypes of Christianity (Catholic, Protestant, and Orthodox) were included in the BA only. The strongest positive correlation with the Happiness 2025 score was observed for the median GDP/capita (r squared 0.69), followed by the mean GDP/capita, (0.65), tertiary education 2010 (0.42), democracy (0.35), belonging to an Unaffiliated religious group (0.31), and Christianity (0.08). Alternatively, a negative association was observed for corruption 2023 (−0.41), consanguinity (−0.25), Islam (−0.15), and the Gini index 2025 score (−0.08). Religion timeline, Buddhism, Hinduism, and primary education each had weaker associations (r-squared values of less than 0.05), and their associations with happiness were not statistically significant. Strong collinearity (r > 0.8) was observed between the mean and median GDP/capita (r = 0.85), and the median GDP/capita had the strongest association with most positive outcomes. Concerning democracy, the r-squared was 0.58 (r = 0.76, 95% CI 0.66–0.83), while it was only 0.23 for the mean GDP/capita (r = 0.48, 95% CI 0.35–0.59). The correlation between median GDP and happiness is shown in Figure 1. Among countries with a median GDP/capita above 30.000 USD, 27 of 27 (100%) had a national happiness score above the median happiness score (5.868), but among those countries with a median GDP/capita below 10.000 USD, only 4 of 31 (13%) countries had a happiness score above the median happiness score. In the partial correlation analysis including the variables with the strongest associations with Happiness 2025, median GDP/capita retained a moderate correlation with the Happiness 2025 score (r = 0.36, p < 0.001, df = 83, r2 = 0.13), with an r-squared value of 0.13 when controlling for democracy, corruption, and tertiary education. In contrast, democracy (r = 0.16, p = 0.13, df = 83, r2 = 0.03), tertiary education (r = 0.16, p = 0.14, df = 83, r2 = 0.03), and corruption (r = −0.02, p = 0.87, df = 83, r2 = 0.00) had negligible correlations with happiness when the other three variables were controlled for (controlling for the median GDP/capita had the strongest diluting effect).
Table 2.
Associations between explanatory variables and the WHR 2025 happiness score. Spearman correlations between the WHR happiness score and 14 explanatory variables. The level of statistical significance with Bonferroni correction is set at p < 0.00357. Gin 25 = Gini index 2025; Median 24 = median GDP/capita 2024; GDP/cap24 = mean GDP/capita 2024; Cor 23 = corruption 2023; Demo 24 = democracy 2024; Edu Prim 10 = primary education 2010; Edu Tert 10 = tertiary education 2010; Hap 25 = Happiness 2025; Consang = consanguinity; Christ perc = percentage of Christians; Buddh perc = percentage of Buddhists; Hindu perc = percentage of Hindus; Unaffiliat perc = percentage of Unaffiliated individuals; Islam perc = percentage of Muslims; and Relig tim = religion timeline.
Figure 1.
The association between the national median GDP/capita 2024 (in US dollars) and the WHR 2025 happiness score (scale 0–10). Correlation between median GDP/capita 2024 and the WHR happiness score 2025 (Spearman r = 0.833, p < 0.001, N = 94). Among countries with a median GDP/capita above 30.000 USD, 27 of 27 (100%) had a national happiness score above the median happiness score (5.868), but among those countries with a median GDP/capita below 10.000 USD, only 4 of 31 (13%) countries had a happiness score above the median happiness score.
3.2. Bayesian Analysis
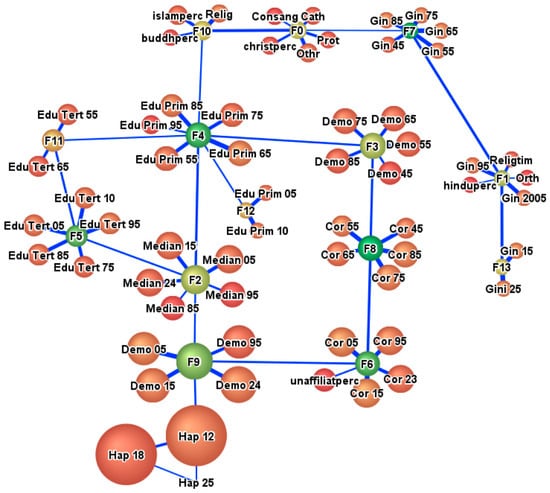
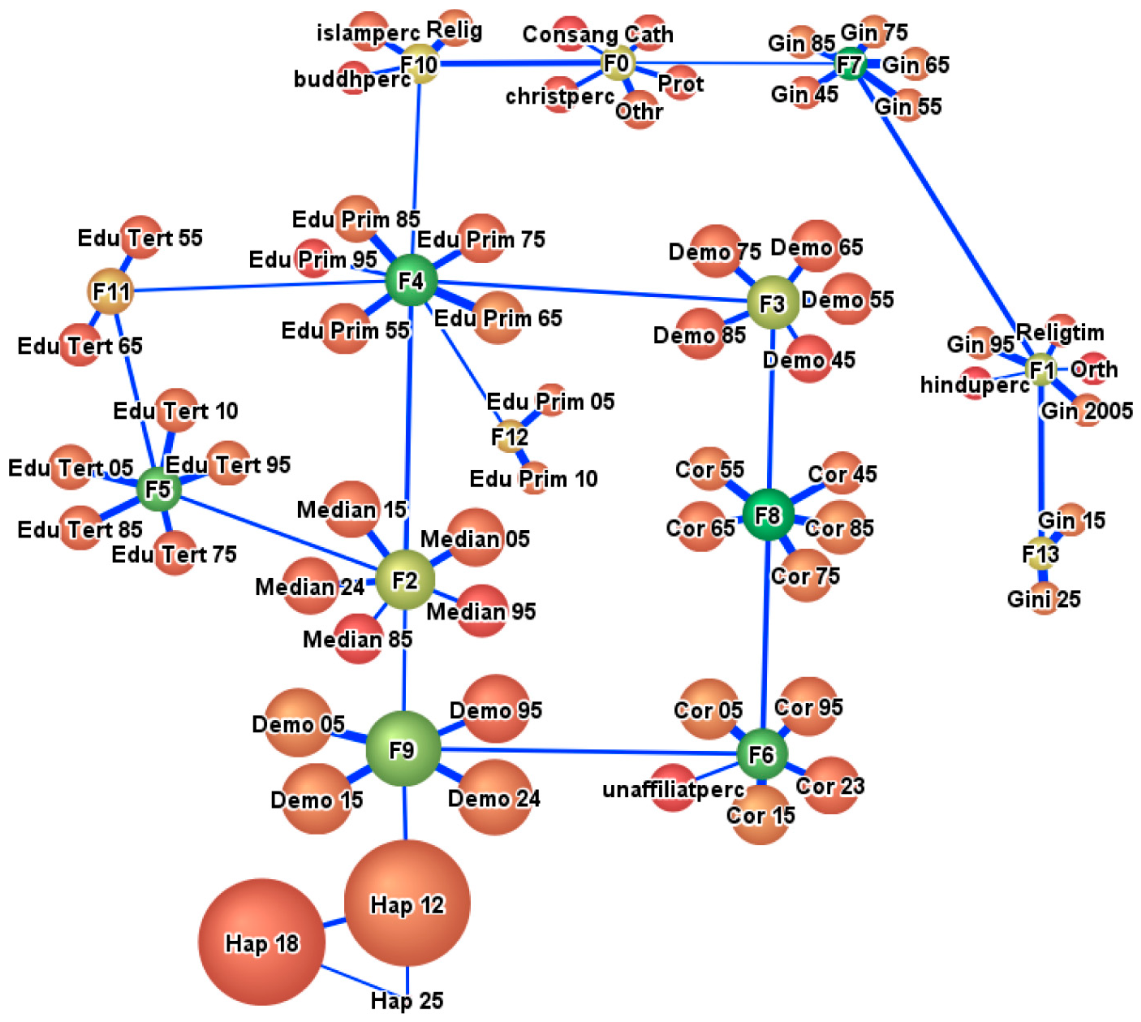
Descriptions of the discretization of variables and the content of clusters in the BA are provided in Supplementary Tables S1 and S2. Because a limited number of countries were included, rough discretization of continuous variables (low vs. moderate vs. high) was employed instead of a more granular analysis. Numerical variables were discretized into three categories using the R2-GenOpt algorithm in the BayesiaLab package. Continuous variables were discretized using the BayesiaLab R2-GenOpt algorithm, which automatically determines cut-points that maximize the amount of information retained from the original continuous variable with respect to the target variable, thereby minimizing the information loss caused by discretization. The Bayesian results for the comparative contributions (standardized total effect on the target) of explanatory factors to the 2025 national happiness scores, indicated by the size of each factor, are shown in Figure 2. This figure is based on a Bootstrap analysis, in which only the causal links replicated in more than 70% of iterations are shown. The sole causal link to happiness was observed from the democracy cluster for 1995–2024 to the happiness score of 2012, which was subsequently linked to the happiness score of 2025. While the causality between the 1995–2024 democracy cluster and happiness in 2012–2025 is slightly spurious due to partial temporal overlapping, the causal cascades leading to the democracy 1995–2024 cluster are more explicit. This cluster receives input from the democracy 1945–1985 cluster through the corruption 1945–1985 and 1995–2023 clusters (democracy and corruption antagonizing each other). The democracy 1945–1985 cluster is also entangled with cluster F10 (related to religions) and the primary education 1955–1995 cluster, which subsequently contributes directly and via the tertiary education loop to the median GDP/capita 1985–2024 cluster and subsequently to the democracy 1995–2024 cluster, which impacts happiness outcomes. The most robust corresponding numerical results of the analysis are shown in Table 3. Among clusters, the greatest standardized effects on Happiness 2025 were observed for cluster F9 (democracy 1995–2024), cluster F2 (median GDP/capita 1985–2024), and cluster F3 (democracy 1945–1985). Concerning single factors, the strongest standardized effects on Happiness 2025 were observed for democracy 2024, 2015, 1995, and 2005 (positive effects), followed by corruption 2005, 2015, and 1995 (negative effects) and median GDP/capita 2005 (a positive effect). Among the single factors within each cluster preceding the 2025 happiness outcome at least by 5 years, the most important ones were democracy 2015 in cluster F9 (standardized total effect on Happiness 2025 0.26), corruption 2005 in cluster F6 (−0.19), and median GDP/capita 2005 in cluster F2 (0.17). Within the democracy 1995–2024 cluster, even the earliest factors in the years 1995 (0.24) and 2005 (0.24) made substantially greater contributions to Happiness 2025 than any factors in other clusters. The results for mutual shared information with the target node (Happiness 2025) are reported in Supplementary Table S3, showing the highest values of normalized mutual information. The highest relative significance was observed for cluster 9; democracy 2024, 2015, 2005, and 1995; cluster 6; and corruption 2005. These findings were consistent with those on the total standardized effect, as shown in Figure 2 and Table 3. The variable abbreviations are defined in Supplementary Table S4.
Figure 2.
The causal networks contributing to the WHR 2025 happiness score. The relative importance of factors contributing to the WHR happiness scores 2012–2025 are indicated by the size and color of each factor. Size represents the importance of the factor in the entire model and color in the pairwise effect on the target (Hap25). Node colors indicate the variables’ total effect on the outcome variable, including both direct and indirect effects. Green signifies the highest impact, yellow indicates intermediate effects, and red signifies the lowest impact. The blue lines (arcs) between nodes depict the relationships between variables, with line thickness corresponding to Kullback–Leibler’s divergence. Only the Bayesian causal links surviving 70% replication in Bootstrap resampling analysis are shown. The democracy cluster 1945–1985 (a positive effect), corruption clusters 1945–1985 and 1995–2015 (negative effects), cluster F10 (a negative effect), primary education 1955–1985 and tertiary education 1975–2010 clusters (positive effects), and median GDP/capita cluster 1985–2024 (positive effect) contribute to happiness outcomes via the democracy 1995–2005 cluster. The greatest standardized total effects on Happiness 2025 were observed for the democracy 1995–2024 (F9), median GDP/capita 1995–2024 (F2), and democracy 1945–1985 (F3) clusters. The detailed numerical results are shown in Table 2. Node abbreviations are as follows: Hap for happiness, Demo for democracy, Cor for corruption, Unaffiliated perc for the percentage of Unaffiliated individuals, Median for the median GDP, EduTert for tertiary education, EduPrim for primary education, Gini for the Gini index, Hindu perc for the percentage of Hindus, Orth for Eastern Orthodox, Religtim for religion timeline, Consang for consanguinity, Cath for Roman Catholic, Prot for Protestantism, Othr for religions other than Christian denominations, Christ perc for the percentage of Christians, Relig for religion, Buddh perc for the percentage of Buddhists, and Islam perc for the percentage of Muslims.
Table 3.
Numerical results for standardized total effects on the target (WHR Happiness 2025 score). The unit in the analysis of the total effect on the target indicates the amount of change as standard deviations (SDs) in the target, corresponding to change of one SD in an explanatory factor. Abbreviations of nodes are Demo for democracy, Cor for corruption, Median for median GDP/capita, and EduPrim for primary education; F9 is the cluster consisting of Demo1995–2024, F2 consists of Median1985–2024, F8 consists of Cor1945–1985, F3 consists of Demo1945–1985, and F4 consists of EduPrim1955–1995.
4. Discussion
In a cross-sectional analysis, the strongest positive correlations with happiness scores were observed for the median GDP, mean GDP, tertiary education, and democracy. The Unaffiliated and Christianity variables were also associated with happiness in a positive way. On the contrary, high corruption, consanguinity, and Muslim religion had a negative correlation with happiness levels. Our results on the mean GDP per capita, democracy, Christianity, and Unaffiliated religion/world view, as well as the corruption and Muslim variables, align with those of previous studies [7,10,13,51]. However, previous studies did not report that the median GDP per capita has the strongest association with happiness. As shown in Figure 1, the association was somewhat non-linear: a steep correlation showing that the national happiness is low if the median GDP/capita is below 10.000 USD. Since the Gini coefficient had only a weak correlation with happiness, the results suggest that the absolute income level, rather than equally distributed poverty, is important. In addition to having a greater overall impact on happiness than the mean GDP per capita, the median GDP also showed substantially stronger associations with a high democracy index and low corruption level than any other variable, including the mean GDP. The causality between prosperity and democracy has been studied by several researchers, including the recent Nobel laureate Daron Acemoğlu, who showed with his collaborators that extractive institutions prevent economic development [52]. Countries with this type of institution do not respect political and civil rights such as property rights, which is typical for undemocratic countries with excessive corruption. In these studies, the mean GDP per capita has been used as the indicator of national income levels instead of the median GDP per capita. Our results show that the mean GDP explained only 23% of the variance in democracy, while the median GDP explained 58% of the variance. This may be referred to as the “Qatar effect”, revealing that a high mean GDP per capita does not necessarily mean a high median GDP per capita as well. This indicates that both average economic well-being and within-population distribution of income is important. Our results suggest that increasing the median GDP per capita in countries where it is below 10.000 USD would have the greatest beneficial effect on happiness, as can be seen from the non-linear relationship shown in Figure 1. Our results suggest that the median GDP per capita should be used as the indicator of the economic prosperity of ordinary citizens instead of the currently established mean GDP per capita when studying the links between economy, democracy, and well-being across countries. Our results suggest that median GDP per capita is a suitable indicator of the materialistic prerequisite for empowerment in the Welzel–Inglehart human development sequence framework.
Since correlation does not imply causation, our aim was also to observe causal links using BN analysis. To the best of our knowledge, this is the first cross-country causal model study of the factors affecting perceived happiness. We observed causal links from the democracy index cluster 1945–1985 to subsequent national democracy, corruption, and happiness levels 50 to 80 years later. The robustness of the results was confirmed with Bootstrap resampling analysis at a 70% reproducibility level. This suggests that the causal effect of democracy on national happiness levels is observed with a delay of up to two generations. Our cross-sectional analysis was well in line with the WHR reports showing that national log mean GDP/capita plays a crucial role in perceived happiness. Although the median GDP/capita had the strongest association with happiness in the cross-sectional analysis, it did not appear as a primary causal factor in the BA. As seen in Figure 2, the democracy cluster 1945–1985 (F3) contributed via education clusters to median GDP cluster F2, which subsequently contributed to democracy cluster F9, which further contributed to happiness. This implies that economy and democracy are entangled, with continuous interaction with each other. Therefore, our results only partly support the Welzel–Inglehart human development sequence framework, which suggests a predominantly one-way causal pathway from economic development to democracy via emerged emancipatory values. Our results suggest that both cultural (mass values following increasing safety and economic growth) and institutional (democratic institutions enhancing economic growth) are equally plausible explanations for welfare and happiness.
There are multiple possible explanations for the scores achieved by the happiest nations in the world. The happiest countries according to the WHR are mostly parliamentary democracies where women’s and minorities’ rights and equality are upheld and citizens enjoy a high degree of other liberties. Many of the happiest listed countries were also Protestant countries, which were leaders in the industrial revolution [53]. It has also been speculated that growing respect for women and children during the early modern period contributed to the rise of natural science in Europe [54] and, subsequently, prosperity and happiness in the Western world. The most democratic nations can be found in Europe, where democracy first flourished in ancient Greece and Rome, Venice, and the Netherlands in the early modern era; a long history of democracy seems to have paved the way for functional democracies which, in turn, have promoted happiness and prosperity.
The world’s happiest countries share two worldview or religious variables: Unaffiliated and Christianity. This is supported by World Happiness Report results showing that the top-scoring nations are secular societies in which the state is separated from both institutional religion and religion altogether. In these countries, citizens may or may not hold an institutional or individualistic worldview of their own, which is in line with the idea of empowerment and emancipation in the Welzel–Inglehart framework [2]. Protestant Christianity was associated with the happiest and wealthiest countries. This was in line with the results of previous studies, which have indicated low corruption rates as a possible way to explain the happiness rankings [55,56]. The individualistic and non-hierarchical nature of Protestantism has facilitated individuals’ own activity and economic freedom, with less involvement on the behalf of government in comparison to nations with more hierarchical religions [33]. It has even been suggested that Western Christianity has bolstered the progress of its surrounding society by prohibiting cousin marriages and inhibiting the formation of tribal and clan societies, thereby increasing mutual trust within large and diverse populations [33]. However, it must be acknowledged that although most of the happiest nations were Northern European Protestant Christian countries, many African countries with a Christian majority were among the least happy. This underlines the role of other factors, such as colonial legacy and ethnic fragmentation; these factors may also be important for countries with Muslim, Hindu, and Buddhist majorities.
Our results suggest that there is a minor causal cascade from a high national proportion of Muslim citizens to low democracy indexes and low national happiness scores; the unhappiest countries in the world, such as Afghanistan, Syria, and Somalia, are Muslim-majority nations. This may be explained by corruption [55,56], religious hierarchy [33], a close bond between the state and religion [56], authoritarian forms of government, Islam’s problematic relationship to the concepts of democracy and rights [51,57,58,59,60], and stagnation, especially in regard to economics, science, and freedom of thought [61]. Since the proportion of Muslims in the world populations has changed very little during preceding decades, reverse causality between Islam and national happiness is unlikely [62]. However, this may be the case concerning the relationship between religiously Unaffiliated individuals and happiness because the proportion of people belonging to Unaffiliated groups has increased over recent decades, especially in high-income countries with high happiness scores [62]. Political turmoil, conflicts, and their effects over the past few decades may have also affected the happiness scores of Muslim countries. However, wars and civil wars are largely attributable to a lack of democracy, as democratic countries rarely start wars [63]. In addition to Islam, many Muslim-majority countries and their surrounding regions have a large variety of both religious minorities and ethnic groups that have tightly knit, clan-based communities and links to consanguinity. However, we acknowledge that our results showed that neither Muslim, Christian, or any other religious affiliation (non-affiliated) made any major contribution to happiness in the Bayesian causal analysis, and in the cross-sectional analysis, only religious non-affiliation had a substantial association with happiness.
The low levels of both happiness and democracy and the high corruption scores of the unhappiest countries may also be explained by different cultural factors (such as tolerance to corruption and a long history of authoritarian governance) and their status as former colonies. The exploitation of former colonies by colonial powers has also hampered the development of the former. However, it can be argued that previous colonial status does not explain all poor scores for the unhappiest countries, given that nations such as Liberia, Ethiopia, Afghanistan, and Iran were able to retain their independence during the colonial period.
5. Strengths and Limitations
The primary aim of our analysis, the standardized total effect on the target, is considered a good measure of causality, but it may overlook subtle effects. Therefore, we also conducted shared mutual information analysis, which is more sensitive but implies associations more so than causality. We observed fairly consistent results between the analyses, indicating that we had not missed important connections between explanatory factors and happiness. There were only 147 countries in the analysis, which forced us to use a rough three-grade discretization (low vs. moderate vs. high) of the continuous variables, since a more granular discretization of countries would have made subgroups too small for the BA. Discretization inevitably involves some loss of information, and alternative approaches are available. However, discretization is a well-established practice in BN modeling, particularly when the objective is to identify probabilistic dependency structures rather than to estimate continuous functional relationships. In this study, the variables were discretized into three states using the R2-GenOpt algorithm implemented in BayesiaLab, which optimizes the predictive information retained with respect to the target variable. The objective of the present study was to describe the structure of dependency among the variables rather than to model precise continuous response functions. Future work will extend this framework using causal BNs and intervention-based analyses.
The strength of our study was that it was free of a specific hypothesis, making it possible to study all potential variables in one analysis. The downside of this approach was that we had to use strict statistical procedures to control for type 1 errors by using Bonferroni correction and Bootstrap resampling. This may have led to a type 2 error, i.e., only the most robust results remained statistically significant, and weaker signals may have remained undetected. Due to the number of countries and limited amount of data, only the strongest phenomena were identified. For instance, nothing may be stated about the reliability of any potential effects of Hinduism because the study included only one country with a Hindu majority. Differentiating the subgroups of Christianity, Islam, and Buddhism was not possible because it would have led to overwhelming complexity in the analyses. Therefore, the aggregation of these subgroups may have diluted the findings if the different subgroups had opposite types of associations with happiness. These limitations of our study may have led to an inability to detect subtle causal cascades between variables. Our study utilized 17 different variables, and some of the data were insufficient and did not encompass every single country. Therefore, the results may be partly explained by hidden unknown factors.
6. Conclusions
Our results suggest that median GDP should be utilized as the indicator of the economic prosperity of citizens instead of the currently established mean GDP when studying the links between economy, democracy, and well-being across countries. In light of this study’s results, it would be beneficial to invest in fostering democracy and combatting corruption. These two factors do not completely explain happiness levels on their own, but they form a basis to increase perceived happiness. Increasing democracy and reducing corruption may be difficult in the least happy countries, as many have harsh authoritarian governments, and dictatorship is typically based on a lack of democratic rights and corruption, with advantages for civil servants and the army. However, governments in semi-authoritarian countries might be willing to promote anti-corruption efforts to increase the well-being of their citizens.
Supplementary Materials
The following supporting information can be downloaded at https://www.mdpi.com/article/10.3390/world7090145/s1, Table S1: Discretization of the variables; Table S2: Content of clusters; Table S3: Results for mutual information shared with the target node (WHR Happiness 2025 score); and Table S4: Variable abbreviations.
Author Contributions
Conceived and designed the experiments: I.T., O.L., J.K., J.T. and O.-P.R. Performed the experiments: I.T. and O.-P.R. Analyzed the data: I.T. and O.-P.R. Contributed the materials/analysis tools: J.T. Wrote the paper: all authors. All authors have read and agreed to the published version of the manuscript.
Funding
This research received no external funding.
Institutional Review Board Statement
Not applicable.
Informed Consent Statement
Not applicable.
Data Availability Statement
All data used in our study are available from publicly available datasets. We reported all of the data sources in Section 2 and provided links to the datasets in the references.
Acknowledgments
We thank Pekka Kekolahti for his help with the Bayesian analysis.
Conflicts of Interest
The authors declare no conflicts of interest.
References
- Tuna, E.; Evren, A.A.; Şahinbaşoğlu, Z.Z.; Veznikli, M. Examination of the effects of COVID-19 on happiness in different geographical regions with piecewise linear panel data models. Sustainability 2023, 15, 8569. [Google Scholar] [CrossRef] [Scilit]
- Inglehart, R.; Welzel, C. Modernization, Cultural Change, and Democracy: The Human Development Sequence; Cambridge University Press: Cambridge, UK, 2005. [Google Scholar]
- Helliwell, J.F.; Layard, R.; Sachs, J.D.; De Neve, J.-E.; Aknin, L.; Wang, S. World Happiness Report 2025; University of Oxford: Oxford, UK; Wellbeing Research Centre: Oxford, UK, 2025; Available online: https://files.worldhappiness.report/WHR25.pdf?_gl=1*4r7y36*_gcl_au*MTc0NjgyNzc5Mi4xNzUzMjU0Mjg2 (accessed on 15 April 2026).
- Mookerjee, R.; Beron, K. Gender, religion and happiness. J. Socio-Econ. 2005, 34, 674–685. [Google Scholar] [CrossRef] [Scilit]
- Di Telia, R.; MacCulloch, R. Some Uses of Happiness Data in Economics. J. Econ. Perspect. 2006, 20, 25–46. [Google Scholar] [CrossRef] [Scilit]
- Bjørnskov, C.; Dreher, A.; Fischer, J.A.V. Cross-country determinants of life satisfaction: Exploring different determinants across groups in society. Soc. Choice Welf. 2008, 30, 119–173. [Google Scholar] [CrossRef] [Scilit]
- Helliwell, J.F.; Huang, H. How’s Your Government? International Evidence Linking Good Government and Well-Being. Br. J. Political Sci. 2008, 38, 595–619. [Google Scholar] [CrossRef] [Scilit]
- Easterlin, R.A.; McVey, L.A.; Switek, M.; Sawangfa, O.; Zweig, J.S. Happiness-income paradox revisited. Proc. Natl. Acad. Sci. USA 2010, 107, 22463–22468. [Google Scholar] [CrossRef] [Scilit]
- Kahneman, D.; Deaton, A. High income improves evaluation of life but not emotional well-being. Proc. Natl. Acad. Sci. USA 2010, 107, 16489–16493. [Google Scholar] [CrossRef] [Scilit]
- Heukamp, F.H.; Ariño, M.A. Does Country Matter for Subjective Well-Being? Soc. Indic. Res. 2011, 100, 155–170. [Google Scholar] [CrossRef] [Scilit]
- Brulé, G.; Veenhoven, R. Freedom and happiness in nations: Why the Finns are happier than the French. Psychol. Well-Being 2014, 4, 17. [Google Scholar] [CrossRef] [Scilit]
- Florea, A.I.; Caudill, S.B. Happiness, religion and economic transition. Econ. Transit. 2014, 22, 1–12. [Google Scholar] [CrossRef] [Scilit]
- Ngamaba, K.H.; Soni, D. Are Happiness and Life Satisfaction Different Across Religious Groups? Exploring Determinants of Happiness and Life Satisfaction. J. Relig. Health 2018, 57, 2118–2139. [Google Scholar] [CrossRef] [Scilit]
- Jebb, A.T.; Tay, L.; Diener, E.; Oishi, S. Happiness, income satiation and turning points around the world. Nat. Hum. Behav. 2018, 2, 33–38. [Google Scholar] [CrossRef] [Scilit]
- Dominguez, R.; Lopez-Noval, B. Religiosity and Life Satisfaction Across Countries: New Insights from the Self-Determination Theory. J. Happiness Stud. 2021, 22, 1165–1188. [Google Scholar] [CrossRef] [Scilit]
- Li, Q.; An, L. Corruption Takes Away Happiness: Evidence from a Cross-National Study. J. Happiness Stud. 2020, 21, 485–504. [Google Scholar] [CrossRef] [Scilit]
- Muresan, G.M.; Ciumas, C.; Achim, M.V. Can Money Buy Happiness? Evidence for European Countries. Appl. Res. Qual. Life 2020, 15, 953–970. [Google Scholar] [CrossRef] [Scilit]
- Hamzaoğlu, N.M. BEYOND MONEY: A SOCIAL ANALYSIS OF HAPPINESS. Beykoz Akad. Derg. 2022, 10, 374–389. [Google Scholar] [CrossRef] [Scilit]
- Kudrna, L.; Kushlev, K. Money Does Not Always Buy Happiness, but Are Richer People Less Happy in Their Daily Lives? It Depends on How You Analyze Income. Front. Psychol. 2022, 13, 883137. [Google Scholar] [CrossRef] [Scilit]
- Sánchez-Rodríguez, Á.; Górski, M.R.; Joshanloo, M.; Krys, K.; Tønnessen, M.; Li, L.M.W.; Akaliyski, P.; Haas, B.W.; Hussain, M.A.; Guemaz, F.; et al. Mind the Gap: Perceived Economic Inequality and the Well-Being Gap around the Globe. Soc. Psychol. Personal. Sci. 2026, 17, 383–399. [Google Scholar] [CrossRef] [Scilit]
- Araki, S. The Societal Determinants of Happiness and Unhappiness: Evidence From 152 Countries Over 15 Years. Soc. Psychol. Personal. Sci. 2024, 15, 603–615. [Google Scholar] [CrossRef] [Scilit]
- Behera, D.K.; Rahut, D.B.; Padmaja, M.; Dash, A.K. Socioeconomic determinants of happiness: Empirical evidence from developed and developing countries. J. Behav. Exp. Econ. 2024, 109, 102187. [Google Scholar] [CrossRef] [Scilit]
- Helliwell, J.F.; Layard, R.; Sachs, J.; De Neve, J.-E. World Happiness Report 2020; Sustainable Development Solutions Network: New York, NY, USA, 2020. [Google Scholar]
- Nordic Council of Ministers. Trust—The Nordic Gold. Nordic Council of Ministers, Analysis Report. 2017. Available online: https://norden.diva-portal.org/smash/get/diva2:1095959/fulltext02.pdf (accessed on 15 April 2026).
- Guo, Q.; Zheng, W.; Shen, J.; Huang, T.; Ma, K. Social trust more strongly associated with well-being in individualistic societies. Pers. Indiv. Dif. 2022, 188, 111451. [Google Scholar] [CrossRef] [Scilit]
- Martela, F.; Greve, B.; Rothstein, B.; Saari, J. The Nordic exceptionalism: What explains why the Nordic countries are constantly among the happiest in the world. In World Happiness Report 2020; Helliwell, J.F., Layard, R., Sachs, J., De Neve, J.-E., Eds.; Sustainable Development Solutions Network: New York, NY, USA, 2020. [Google Scholar]
- Helliwell, J.F.; Layard, R.; Sachs, J. World Happiness Report 2012; UN Sustainable Development Solutions Network: New York, NY, USA, 2012. [Google Scholar]
- Helliwell, J.F.; Layard, R.; Sachs, J.D. World Happiness Report 2018; Sustainable Development Solutions Network: New York, NY, USA, 2018. [Google Scholar]
- Wormald, B. Religious Composition by Country 2010–2020. Pew Research Center. 2024. Available online: https://www.pewresearch.org/religion/feature/religious-composition-by-country-2010-2020/ (accessed on 15 April 2026).
- Rosling, O. Gini Data V3 by Gapminder. 2018. Available online: https://docs.google.com/spreadsheets/d/1g3x_nUa9lFyu1SlKSmq8YB2ZknGco-jTQU80Jz3Reok/edit?gid=176703676#gid=176703676 (accessed on 15 April 2026).
- Our World in Data. Median Income or Consumption per Day vs. GDP per Capita, 1985 to 2025. 2025. Available online: https://ourworldindata.org/grapher/median-daily-per-capita-expenditure-vs-gdp-per-capita?tab=table&time=1985..latest (accessed on 15 April 2026).
- Our World in Data. Democracy. 2025. Available online: https://ourworldindata.org/democracy (accessed on 15 April 2026).
- Schulz, J.F.; Bahrami-Rad, D.; Beauchamp, J.P.; Henrich, J. The Church, intensive kinship, and global psychological variation. Science 2019, 366, eaau5141. [Google Scholar] [CrossRef] [Scilit]
- Our World in Data. Political Corruption Index. 2025. Available online: https://ourworldindata.org/grapher/political-corruption-index?tab=table&time=1945..latest (accessed on 15 April 2026).
- Barro, R.J.; Lee, J.-W. Primary/Tertiary Education. Barrolee/BarroLeeDataSet. 2013. Available online: https://barrolee.github.io/BarroLeeDataSet/BLv3.html (accessed on 15 April 2026).
- U.S. Department of State. Office of International Religious Freedom: Our Mission. 2018. Available online: https://www.state.gov/bureaus-offices/under-secretary-for-foreign-assistance-humanitarian-affairs-and-religious-freedom/office-of-international-religious-freedom/ (accessed on 15 April 2026).
- World Population Review. Inbreeding by Country. 2025. Available online: https://worldpopulationreview.com (accessed on 15 April 2026).
- Conrady, S.; Jouffe, L. Bayesian Networks and BayesiaLab—A Practical Introduction for Researchers, 1st ed.; Bayesia: Franklin, TN, USA, 2015. [Google Scholar]
- Kekolahti, P. Bayesian Network Analysis of Mobile Service and Device Usage. Doctoral Dissertations, Aalto University, Espoo, Finland, 2019. [Google Scholar]
- Darwiche, A. Modeling and Reasoning with Bayesian Networks, 1st ed.; Cambridge University Press: Cambridge, UK, 2010. [Google Scholar]
- Arora, P.; Boyne, D.; Slater, J.J.; Gupta, A.; Brenner, D.R.; Druzdzel, M.J. Bayesian networks for risk prediction using real-world data: A tool for precision medicine. Value Health 2019, 22, 439–445. [Google Scholar] [CrossRef] [Scilit]
- Van de Schoot, R.; Broere, J.J.; Perryck, K.H.; Zondervan-Zwijnenburg, M.; Van Loey, N.E. Analyzing small data sets using Bayesian estimation: The case of posttraumatic stress symptoms following mechanical ventilation in burn survivors. Eur. J. Psychotraumatol 2015, 6, 25216. [Google Scholar] [CrossRef] [Scilit]
- Van de Schoot, R.; Miočević, M. Small Sample Size Solutions: A Guide for Applied Researchers and Practitioners; Taylor & Francis: Abingdon, UK, 2020. [Google Scholar]
- Taylor, P.A.; Aggarwal, H.; Bandettini, P.; Barilari, M.; Bright, M.G.; Caballero-Gaudes, C.; Calhoun, V.; Chakravarty, M.; Devenyi, G.; Evans, J.; et al. Go figure: Transparency in neuroscience images preserves context and clarifies interpretation. arXiv 2025, arXiv:2504.07824. [Google Scholar] [CrossRef] [Scilit]
- Elwert, F. Graphical causal models. In Handbook of Causal Analysis for Social Research; Morgan, S.L., Ed.; Springer Science & Business Media: Berlin/Heidelberg, Germany, 2013; pp. 245–273. [Google Scholar]
- Pearl, J.; Mackenzie, D. The Book of Why: The New Science of Cause and Effect; Basic Books: New York, NY, USA, 2018. [Google Scholar]
- Wagenmakers, E.-J.; Marsman, M.; Jamil, T.; Ly, A.; Verhagen, J.; Love, J.; Selker, R.; Gronau, Q.F.; Šmíra, M.; Epskamp, S.; et al. Bayesian inference for psychology. Part I: Theoretical advantages and practical ramifications. Psychon. Bull. Rev. 2018, 25, 35–57. [Google Scholar] [CrossRef]
- Wasif, K.; Gill, J. Bayesian analyses of political decision making. In Oxford Research Encyclopedia of Politics; Oxford University Press: Oxford, UK, 2020. [Google Scholar] [CrossRef] [Scilit]
- Silvera, G.; Smail, L. Relationships between teamwork and suicidal behavior in juvenile detention facilities using Bayesian networks. Cogent Soc. Sci. 2019, 5, 1652984. [Google Scholar] [CrossRef] [Scilit]
- Pearl, J.; Russell, S. Bayesian Networks; University of California: Oakland, CA, USA, 2000. [Google Scholar]
- Paldam, M. Corruption and religion: Adding to the economic model. Kyklos Wiley Blackwell 2001, 54, 383–413. [Google Scholar] [CrossRef] [Scilit]
- Acemoğlu, D.; Johnson, S.; Robinson, J.A. The colonial origins of comparative development: An empirical investigation. Am. Econ. Rev. 2001, 91, 1369–1401. [Google Scholar] [CrossRef] [Scilit]
- Beaudreau, B.C. Protestant refugees, the Calvinist ethic and the industrial revolution. Atl. Econ. J. 2021, 49, 273–291. [Google Scholar] [CrossRef] [Scilit]
- Latvus, P. Ymmärryksen Siivet. Miksi Tiede on Länsimaista? 2nd ed.; Omega Kirjat: Vaasa, Finland, 2002. [Google Scholar]
- Zelekha, Y.; Avnimelech, G. Cultural and personal channels between religion, religiosity, and corruption. Heliyon 2023, 9, e16882. [Google Scholar] [CrossRef] [Scilit]
- Borlea, S.N.; Achim, M.V.; Rus, I.D. Behavioural determinants of corruption. A cross-country survey. Stud. Univ. Vasile Goldiş Arad—Econ Ser. 2019, 29, 21–39. [Google Scholar] [CrossRef] [Scilit]
- Abou El Fadl, K.; Cohen, J.; Chasman, D. Islam and the Challenge of Democracy; Princeton University Press: Princeton, NJ, USA, 2004. [Google Scholar]
- Oh, I. The Rights of God Islam, Human Rights, and Comparative Ethics; Georgetown University Press: Washington, DC, USA, 2007. [Google Scholar]
- Rohne, M. On the foundations of human rights. In Tensions Within and Between Religions and Human Rights; Van Der Ven, J.A., Ziebertz, H.-G., Eds.; Brill: Leiden, The Netherlands; Boston, MA, USA, 2012. [Google Scholar]
- Van Der Ven, J.A.; Ziebertz, H.-G. Tensions Within and Between Religions and Human Rights; Brill: Leiden, The Netherlands; Boston, MA, USA, 2012; 255p. [Google Scholar]
- Noland, M. Arab Economies in a Changing World, 2nd ed.; Peterson Institute for International Economics: Washington, DC, USA, 2011. [Google Scholar]
- Hackett, C.; Stonawski, M.; Tong, Y.; Kramer, S.; Shi, A.; Fahmy, D. Factors Driving Religious Change, 2010–2020. Pew Research Center. 2025. Available online: https://www.pewresearch.org/religion/2025/06/09/factors-driving-religious-change-2010-2020/ (accessed on 15 April 2026).
- Russett, B.; Oneal, J. Triangulating Peace: Democracy, Interdependence, and Institutional Organizations, 1st ed.; W.W. Norton: New York, NY, USA, 2001; pp. 81, 101, 110, 113, 116, 122–123, 125. [Google Scholar]

Disclaimer/Publisher’s Note: The statements, opinions and data contained in all publications are solely those of the individual author(s) and contributor(s) and not of MDPI and/or the editor(s). MDPI and/or the editor(s) disclaim responsibility for any injury to people or property resulting from any ideas, methods, instructions or products referred to in the content. |
© 2026 by the authors. Licensee MDPI, Basel, Switzerland. This article is an open access article distributed under the terms and conditions of the Creative Commons Attribution (CC BY) license.