


Abstract
Achieving the Sustainable Development Goals (SDGs) by 2030 remains highly uneven across countries, while the structural factors associated with this heterogeneity are still insufficiently understood. This study aims to classify 154 countries according to their full 17-dimensional SDG achievement profiles and to identify the structural indicators statistically associated with the observed typological differences. A two-stage analytical approach was applied. First, k-means cluster analysis based on the scores of all 17 SDGs was used to identify homogeneous groups of countries. Second, canonical discriminant analysis was performed for 64 countries with complete data for 17 indicators selected from international sources according to the “one indicator–one goal” principle. The cluster analysis identified three typologically homogeneous groups of countries that broadly correspond to differences in development level but are not reducible to them. The discriminant model achieved apparent classification accuracy of 90.63% (p < 0.0001), while the first canonical function explained 90.3% of the between-group variation. LOO cross-validation yielded an accuracy of 71.43%, confirming that the model retains meaningful discriminatory power beyond the estimation sample, while the difference between apparent and cross-validated accuracy reflects the constraints of a small sample relative to the number of predictors. The strongest differentiating indicators were the proportion of the urban population living in slums, the Global Peace Index, access to sanitation, and poverty. Overall, the results show that SDG achievement profiles constitute an independent analytical characteristic of countries and that typological differences are primarily associated with basic human development and institutional stability.
1. Introduction
The number of armed conflicts is increasing, the climate crisis is deepening, and the pandemic experience has exposed the fragility of global health and food security systems. These converging challenges require not merely ambitious goals, but effective instruments for achieving them [1,2,3,4,5,6]. In response to these challenges, in 2015, the 193 UN Member States adopted the 17 Sustainable Development Goals (SDGs)—an ambitious but non-binding agreement on a shared future encompassing all dimensions of human well-being and the condition of the planet [7].
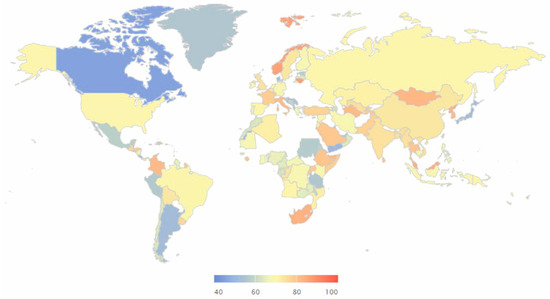
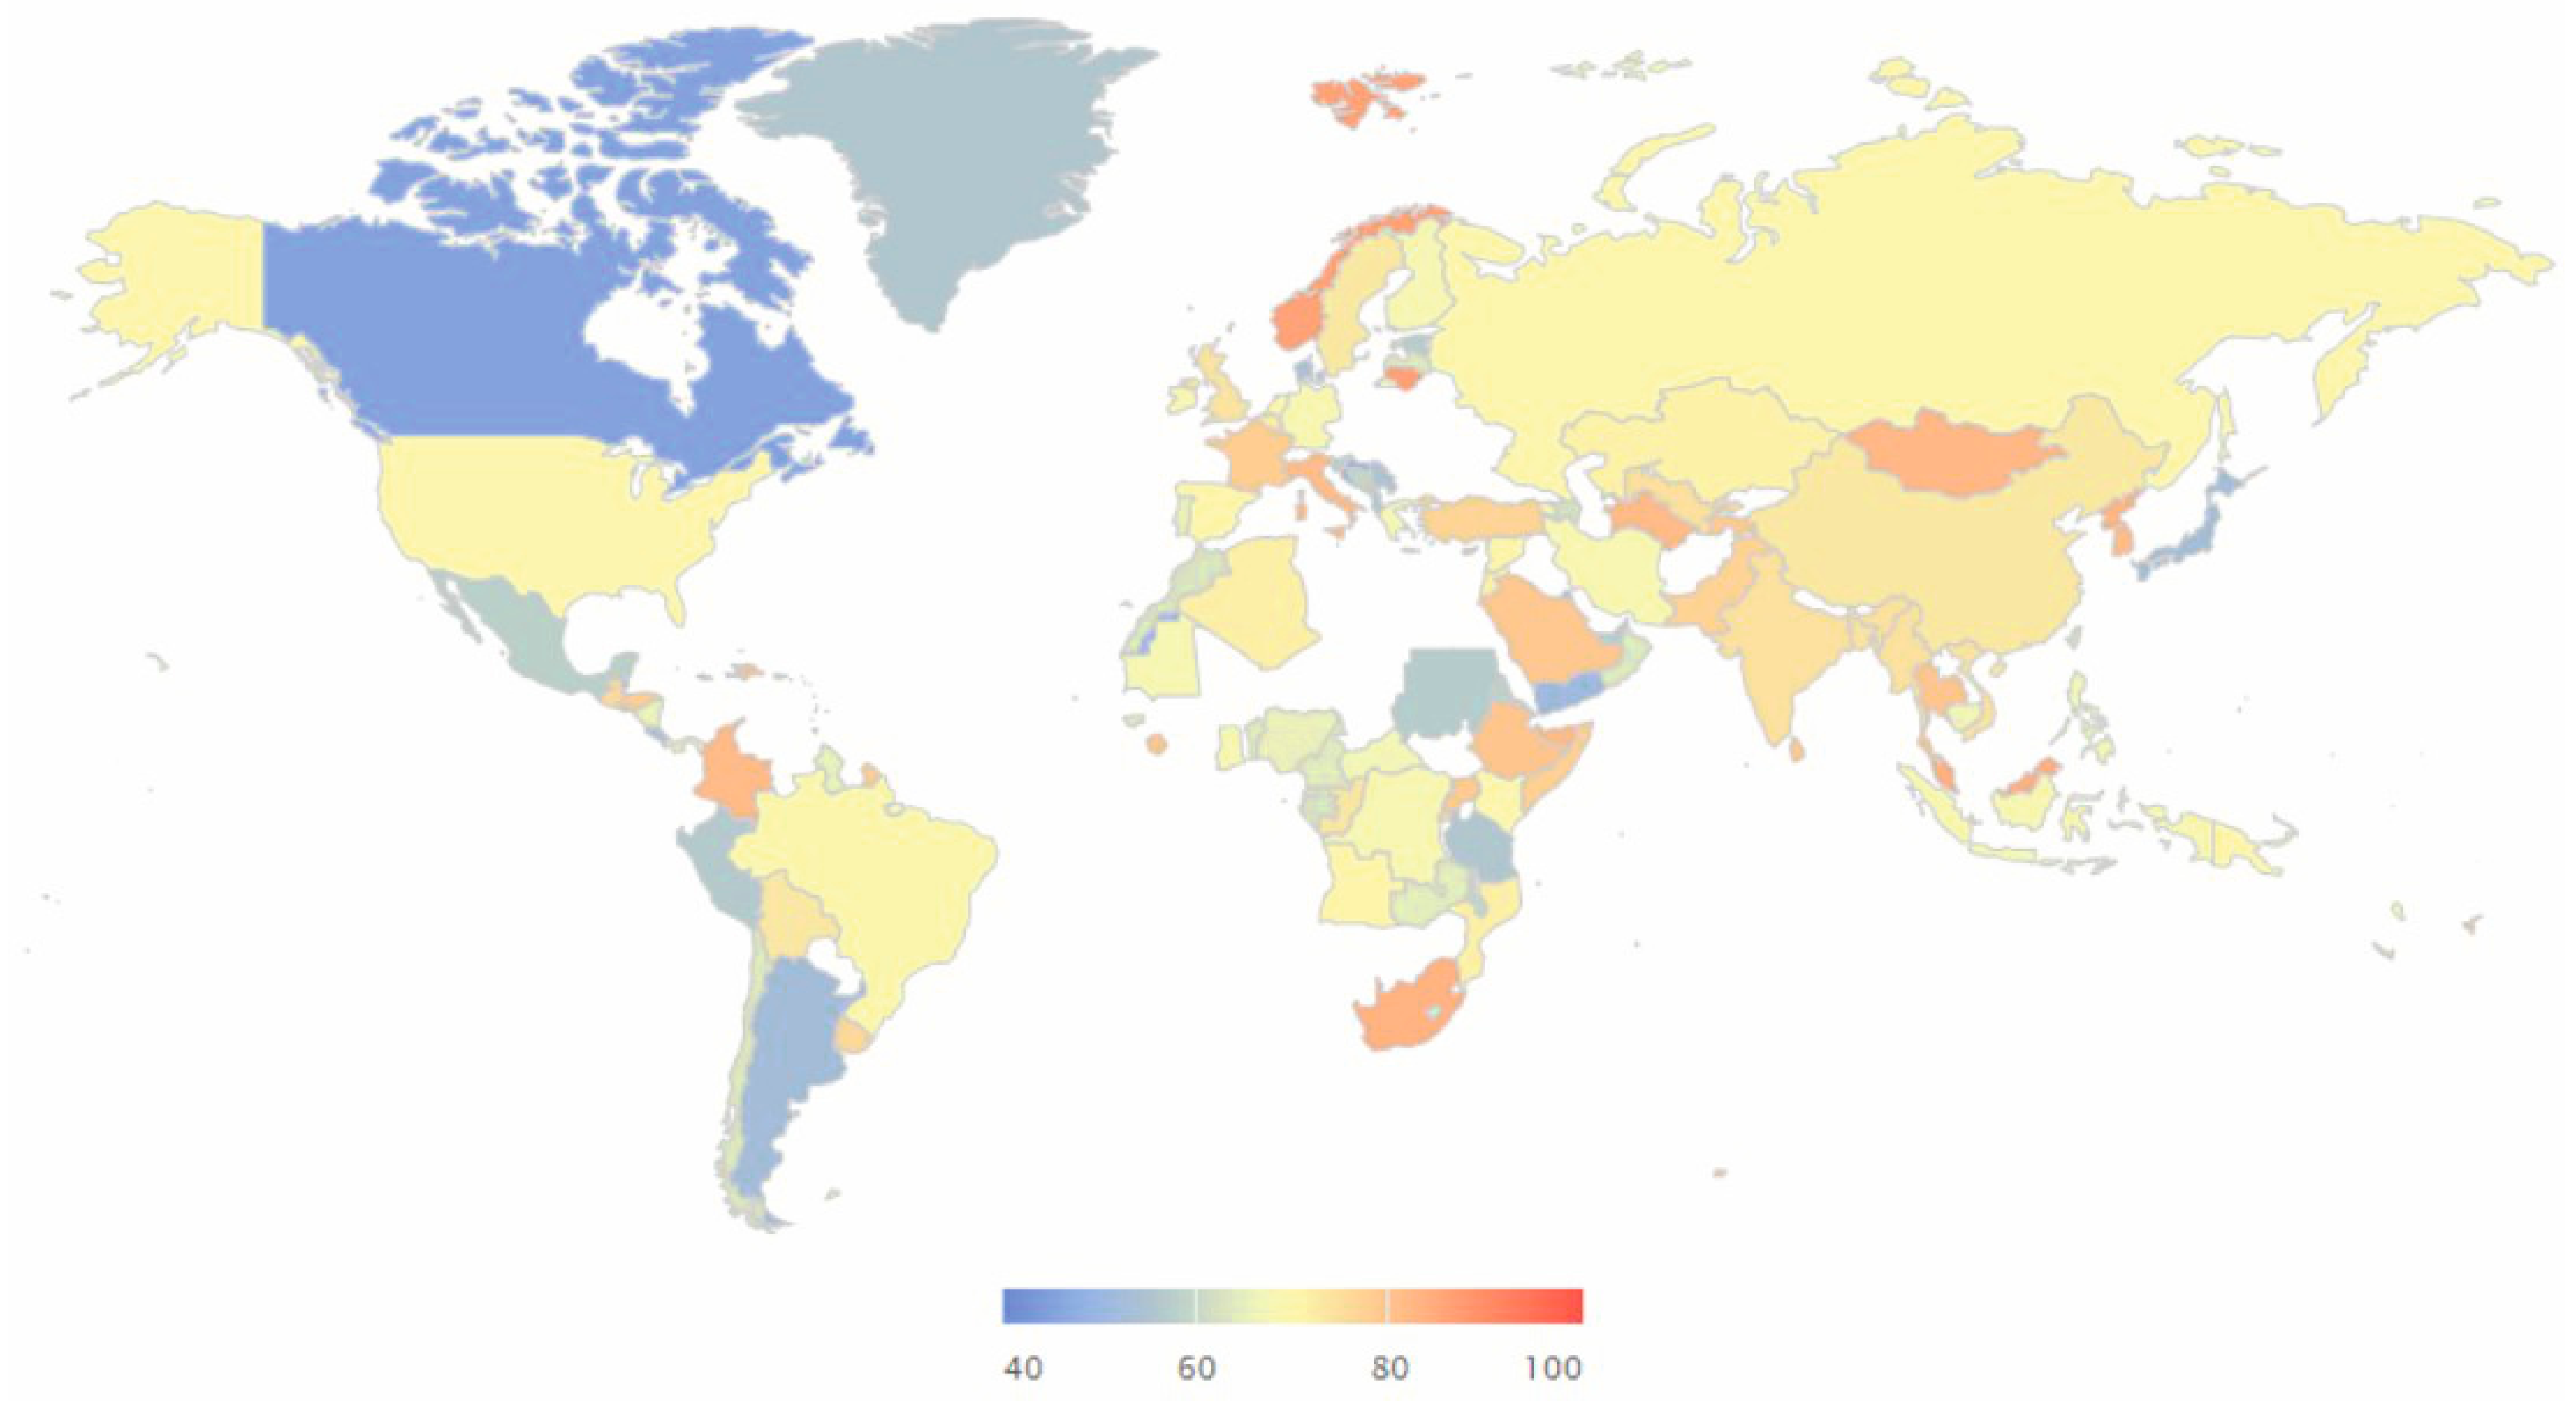
Although ten years have already passed since the adoption of the Agenda, the global picture of progress remains highly heterogeneous [8]. As shown by the aggregated Sustainable Development Goals Index (SDGI), countries of the world differ substantially in their overall level of SDG achievement (Figure 1). The leading positions are concentrated mainly in Northern and Western Europe, whereas the countries of Sub-Saharan Africa consistently record the lowest values.
Figure 1.
Choropleth map of SDGI. Developed by the authors based on [7].
However, while an aggregated index reflects the overall position of a country, it conceals fundamentally important information: what the achievement profile looks like for each of the 17 goals separately, and whether countries with similar overall scores distribute their achievements and setbacks in the same way across different dimensions of sustainable development. Recent global reports present an alarming picture: the vast majority of countries are not on a trajectory toward achieving the full spectrum of goals, and the gap between leaders and laggards is in some cases even widening [7]. The paradox is that even countries with similar income levels or geographic locations demonstrate strikingly different performance profiles [9,10,11]. The aggregated index captures this unevenness, but does not reveal its nature: the same overall score may conceal fundamentally different combinations of achievements and gaps across individual goals, and therefore different structural correlates underlying such a distribution.
Without understanding which structural indicators most strongly discriminate among countries according to their typological SDG achievement profiles, policy recommendations risk remaining universal in form but ineffective in practice. Under conditions of limited resources and growing pressure for evidence-based policy decisions, the central research question is: which structural indicators most substantially differentiate countries according to their typological profiles of SDG achievement?
This study aims to identify the key structural indicators statistically associated with SDG achievement through the typological classification of 154 countries according to their performance profiles across all 17 goals, and to identify the external indicators that most substantially differentiate the resulting groups.
The study contributes to the literature in three interrelated ways. First, the classification of countries is carried out on the basis of individual scores for each of the 17 SDGs rather than an aggregated index, which makes it possible to preserve the full multidimensional information on the sustainable development profile. Second, discriminant analysis is applied to identify the structural indicators most strongly associated with group separation, as it models between-group differentiation itself rather than merely establishing the existence of relationships. Third, the principle of “one indicator–one goal”, implemented through the selection of indicators from recognized international indices, ensures conceptual symmetry and methodological reproducibility. The identified structural indicators may help define priority directions for systemic reforms rather than isolated interventions in individual goals. This is of practical relevance for international organizations, national governments, and policymakers.
The article is structured as follows. Section 2 contains a review of the literature on the measurement of SDG progress, interactions between the goals, and determinants of performance. Section 3 describes the data used and the methodology of the two-stage analysis. Section 4 presents the results of the cluster and discriminant analyses and their discussion. Section 5 sets out the conclusions and practical implications of the study.
2. Literature Studies
2.1. Measuring SDG Progress: From Aggregated Indices to Multidimensional Profiles
The contemporary academic discussion on methods for measuring SDG progress has developed simultaneously along two lines: the critique of aggregated indices and the development of alternative approaches. Analyzing over 3000 scientific studies on the SDGs published between 2016 and 2021, F. Biermann et al. concluded that the impact of the goals on actual policy proved predominantly discursive and only limitedly transformational. The authors noted that changes in legislation, resource allocation, and institutional restructuring remain rare [12].
This fundamental discrepancy between declared commitments and real consequences underscores the need to study the structural conditions associated with the ability of countries to move along the path of sustainable development and calls into question the sufficiency of aggregated indicators for diagnosing these conditions. As the 2030 deadline approaches, this concern has become increasingly prominent in the literature. Shao et al. argue that the SDGs represent a rare and fragile achievement in global governance. Despite insufficient progress, fundamentally revising or replacing the SDG framework would jeopardize a hard-won international consensus; accelerating implementation within the existing framework through targeted structural priorities remains the more viable path [13]. Similarly, E. Ordonez-Ponce, using non-parametric trend analysis across all 17 SDGs, found that most sustainability indicators have not significantly improved since 2015, with performance remaining particularly poor in developing countries—a finding that underscores the need for more context-specific and structurally informed approaches to SDG implementation [14].
Applying the product space methodology, F. Ma et al. compared global SDG progress across 166 countries, identified different development trajectories and disproportions, and highlighted dimensions of sustainable development that receive insufficient attention in current measurement approaches [9]. This study demonstrates that countries develop along qualitatively different trajectories that cannot be captured by any aggregated index. Xu et al. extended this line of inquiry by assessing global sustainability performance, imbalance, and coordination across space and time, confirming that spatial heterogeneity in SDG achievement is persistent and structural rather than transitory [15]. Understanding the interconnections between the goals is a necessary prerequisite for the analysis of such profiles. A. Komarulzaman et al. applied network theory and economic complexity methods to data spanning 54 indicators across 13 SDGs in 514 Indonesian districts and demonstrated that SDG interlinkage networks enable district-specific prioritization strategies—a finding that both validates the multidimensional profiling approach and illustrates how cross-sectional heterogeneity in SDG achievement operates not only across countries but within them [16]. Complementing this perspective, E. Rusdiyanto and E. Pariyanti, in a bibliometric analysis of 327 studies on slum upgrading published between 2015 and 2024, showed that aligning upgrading strategies with SDG 11 (Sustainable Cities and Communities) is essential for sustainable urban development and that research in this domain clusters around distinct thematic priorities—a finding methodologically consistent with the case for typological rather than aggregated analysis [17]. A. Warchold et al. conducted a cross-sectional analysis of SDG interactions by income level, region, and population size and showed that the nature of synergies and trade-offs between the goals differs substantially depending on the country context. This calls into question the possibility of any universal ranking of the goals and methodologically justifies the use of disaggregated analysis over synthetic indices [10]. C. Kroll et al. carried out the first prospective assessment of future interactions between the SDGs and found that for several goals—particularly SDGs 1, 3, 7, 8, and 9—persistent synergies are projected, whereas SDGs 11, 13, 14, 16, and 17 will continue to be characterized by pronounced trade-offs and weak links with other goals [18]. These findings explain why different countries demonstrate fundamentally different performance profiles even under similar overall progress indicators and highlight the limitations of approaches that reduce the multidimensional structure of the SDGs to a single numerical value.
An important contribution to understanding the transboundary dimension is provided by the study of H. Xiao et al. The authors quantitatively assessed transboundary SDG interactions through the channels of trade, river flows, ocean currents, and air masses across 768 pairs of SDG indicators. The results showed that high-income countries, while accounting for only 14.18% of the world’s population, generate 60.60% of the total volume of SDG interactions worldwide, and that the synergistic effect of international trade was 14.94% stronger with partners outside immediate geographical proximity [19]. This indicates that the SDG achievement profile of an individual country is not solely its internal characteristic, but is also shaped by external structural linkages, which further justifies the need for comparative cross-national analysis. Yet identifying which internal structural conditions most strongly differentiate countries in their SDG performance requires moving beyond profile description toward the empirical analysis of correlates—the focus of the following subsection.
2.2. Structural Correlates of SDG Performance: Economic, Institutional, and Contextual Factors
Empirical analysis of the structural correlates of SDG performance is one of the most dynamically developing directions in this field. Analyzing 83 countries over 2016–2021 using GMM estimation, M. D. Guillamón et al. found that the income level, education, and prior SDG performance are positively associated with progress; a higher percentage of women in parliament is associated with better performance, whereas a higher unemployment rate and a lower budget deficit are associated with lower SDG scores [20]. The role of governance quality as a systemic factor was confirmed in a larger-scale study. Using a balanced panel of 145 countries for 2016–2023 and a two-step system GMM estimator, A. M. Ros et al. showed that all six World Bank governance dimensions—control of corruption, government effectiveness, political stability, regulatory quality, rule of law, and accountability—have a significant positive impact on SDG performance [21]. These results are consistent with the findings of E. B. Barbier and J. C. Burgess, who, by evaluating changes in inclusive wealth as an indicator of progress across the 17 SDGs for 99 emerging market countries over 2000–2019, found that SDG progress is often accompanied by adverse environmental consequences and depletion of natural capital—particularly in low- and lower-middle-income countries, where institutional weakness exacerbates the structural constraints on development [22]. Institutional weakness thus emerges not only as an economic constraint but also as a security and governance dimension—a connection examined in the following evidence.
The peace-sustainability nexus constitutes a further structural dimension that aggregated SDG indices tend to obscure. Drawing on the Global Peace Index, the Positive Peace Index, and the Environmental Performance Index across a large cross-national sample, D. Simangan et al. demonstrated that environmental performance—particularly regarding air quality, sanitation, and drinking water—is more closely associated with positive peace (equitable resource distribution and high human capital) than with negative peace (militarization). Critically, some low-income countries score high in negative peace yet fall short on positive peace outcomes, illustrating how countries may appear similarly positioned on aggregate metrics while exhibiting structurally distinct sustainability profiles [23]. This finding reinforces the case for multidimensional typological analysis and suggests that peace-related institutional characteristics should be treated as structural predictors of SDG performance.
The structural role of urban slum prevalence as a barrier to SDG achievement has received growing empirical attention. Using the Alkire–Foster counting approach, U. M. Ozughalu and J. N. Ozughalu documented pervasive multidimensional child poverty across health, housing, and sanitation dimensions in an urban slum in Enugu State, Nigeria, demonstrating that slum residence concentrates deprivation across multiple SDG domains simultaneously [24]. A. Vidhyadharan carried out comparative analysis of water and sanitation disparities in urban slums in Kerala, India, and reached a complementary conclusion: deprivation levels in slum areas substantially exceed those in rural areas, and addressing these disparities requires a systematic institutional framework with proper governance—a finding that directly links slum conditions to both SDG 6 (clean water and sanitation) and SDG 11 (sustainable cities) and underscores the governance dimension of SDG underperformance [25]. K. Kanmodi et al., reviewing the state of global poverty research since the SDG declaration in 2015, confirmed that poverty remains a fundamental barrier to SDG attainment and that adequate scientific and policy contributions are necessary to inform implementation—a conclusion consistent with the view that structural disadvantage, rather than policy choice alone, drives cross-national heterogeneity in SDG outcomes [26].
The regional dimension of this issue is represented by the study of A. Hamid and R. O. H. AlObaid. The authors analyzed a balanced panel of 56 countries in Sub-Saharan Africa and the Middle East and North Africa over the period 2000–2022. The scientists found that governance and foreign direct investment contribute positively to the achievement of overall and economic SDGs, whereas their effect on environmental sustainability is positive but statistically insignificant [27]. These results indicate that the influence of institutional factors is not uniform across different groups of goals—an observation that is methodologically important for any study seeking to cover the full spectrum of the SDGs simultaneously. This variation in institutional effects across goal dimensions is compounded by heterogeneity in governance capacity at the subnational level, as the evidence below illustrates.
The importance of context-specific implementation is further highlighted by S. D. Sever et al. The authors demonstrated that SDG localization is not merely a top-down process but a dynamic interaction between global frameworks and local governance structures. Cities and subnational entities act as active drivers of SDG adaptation rather than passive sites of implementation [28]. S. Murtyas et al., analyzing residents of newly renovated slum housing in Surakarta, Indonesia, identified four distinct behavioral clusters characterized by divergent sustainability beliefs and pro-environmental engagement, reinforcing the argument that within-country heterogeneity in governance capacity and living conditions compounds the structural differences observed at the cross-national level [29]. This finding is particularly relevant for interpreting cross-national heterogeneity in SDG profiles, as it suggests that structural differences between countries are compounded by variation in institutional capacity and governance arrangements at the subnational level.
An important comparative framework is provided by the analysis of the factors of success in achieving the Millennium Development Goals (MDGs). Reviewing 316 articles published between 2009 and 2018, T. Hickmann et al. identified six factors that facilitated or hindered MDG achievement and showed that these goals catalyzed change only in countries where sufficient resources, administrative capacity, and economic development were present, where external donor support existed, and where there was national ownership of implementation [30]. This pattern of path-dependence explains why even identical international commitments lead to fundamentally different outcomes in different countries and indicates that the correlates of performance are structural in nature rather than reducible to individual policy decisions. Against this background, a complementary line of inquiry has emerged that examines not only the structural determinants of SDG performance, but also how countries select goals for priority implementation and which methodological approaches are best suited to capturing the full structure of such differentiation.
2.3. SDG Prioritization and Methodology for Their Analysis
A separate line of research is devoted to how countries select goals for priority implementation and which methodological approaches are applied to analyze their interrelationships. Based on a content analysis of the voluntary national reviews of 19 countries with different income levels, O. Forestier and R. E. Kim showed that governments tend to adopt a selective approach to SDG implementation: SDG 1 (“No Poverty”) and SDG 8 (“Decent Work and Economic Growth”) are unequivocally the most prioritized in national policies [31]. The authors argue that such selectivity contradicts the “integrated and indivisible” nature of the SDGs and may negatively affect overall progress in sustainable development. This phenomenon of “cherry-picking” complicates the comparative analysis of progress and underscores the importance of studying the full spectrum of goals rather than only selected groups of them, which directly justifies the methodological choice of this study.
From a methodological point of view, R. B. Swain and S. Ranganathan applied network analysis to SDG target interrelationships based on IAEG-SDG data for 2000–2017 and found that trade-offs between goals are substantially weaker than synergies. The authors argue that a universal ranking of the SDGs is counterproductive; instead, identifying specific priority clusters of goals for different regions is more appropriate [32]. This conclusion confirms that any analytical approach seeking to preserve the full structure of the SDGs should operate not with aggregated indicators, but with differentiated profiles of individual goals. L. Di Lucia et al. complemented this methodological perspective by evaluating the decision-making fitness of existing methods for SDG interaction analysis, finding that decision-makers prioritize approaches that are simple, flexible, and capable of producing directly actionable results—a criterion that further supports the use of cluster-based typological classification as an analytically accessible and policy-relevant framework [33].
Thus, the literature review shows that substantial knowledge has accumulated in the scientific field regarding synergies and trade-offs between the SDGs, the role of governance, and the economic correlates of progress. Recent studies confirm that spatial and structural heterogeneity in SDG achievement is persistent, that localization and institutional context shape performance trajectories, and that the 2030 deadline has intensified calls for more targeted and structurally grounded analytical frameworks. The evidence reviewed here also demonstrates that urban slum prevalence constitutes a measurable structural barrier to SDG attainment across health, housing, and sanitation domains, and that peace-related institutional characteristics—as captured by indices such as the Global Peace Index—are systematically associated with sustainability performance in ways that aggregate SDG scores fail to reveal. At the same time, few studies have simultaneously classified countries according to the full 17-dimensional structure of performance profiles without aggregation, applied discriminant analysis to model between-group differentiation, and ensured conceptual correspondence between predictors and individual SDGs. Filling these gaps constitutes the scientific novelty of the present study. To address them, the present study applies a two-stage analytical framework that combines k-means cluster analysis with canonical discriminant analysis and implements the “one indicator–one goal” selection principle. This approach is specifically designed to preserve the full 17-dimensional SDG profile, directly model between-group differentiation, and ensure conceptual symmetry between the structural predictors and the individual goals.
3. Materials and Methods
To achieve the research objective, a two-stage analytical approach was applied. At the first stage, cluster analysis was conducted for 154 countries worldwide using the scores of all 17 SDGs in order to identify typologically homogeneous groups of countries according to their sustainable development profiles. At the second stage, canonical discriminant analysis was performed using the values of the selected international indicators to identify the structural indicators statistically associated with countries’ membership in the identified clusters. This approach overcomes the limitations of each method when used separately: cluster analysis identifies the typological structure but does not explain it, whereas discriminant analysis models between-group differentiation but requires predefined groups. The combination of both methods into a unified analytical system makes it possible to move from the description of typological differences to the identification of structural indicators statistically associated with group separation. The analysis was conducted in the Statistica 10 software environment.
3.1. Data Sources
The information base of the study was formed using data from international organizations and global indices. The dating of the indicators varies within the period 2022–2025 in accordance with the update cycles of international statistics [34,35,36,37,38,39,40,41,42,43,44,45,46,47,48,49,50]. For each of the 17 SDGs, one representative indicator was selected according to three criteria: conceptual correspondence to the content of the goal, broad country coverage, and methodological authority of the source. The implementation of the principle of “one indicator–one goal” ensures conceptual symmetry between the predictors and the individual SDGs and prevents the double counting of related indicators.
Due to differences in the country coverage of various international indices, observations with incomplete data were excluded from the analysis. As a result, the discriminant analysis was conducted for 64 countries for which complete data were available for all 17 indicators. The reduced sample retains representation of all three clusters; the ratio of observations to variables is 64:17 ≈ 3.8:1, which corresponds to acceptable methodological standards. However, its representativeness may be affected by the systematic exclusion of countries with incomplete data. As shown in Table 1, low-income countries are disproportionately underrepresented in the discriminant analysis sample (28% of low-income countries included, compared to 47–48% for other income groups), and Sub-Saharan Africa accounts for the largest share of excluded observations (21 out of 90 excluded countries). This pattern is consistent with known limitations of global statistical coverage and constitutes a form of survivorship bias that should be taken into account when interpreting the discriminant results.
Table 1.
Comparison of countries included and excluded from the discriminant analysis by income group and region.
The systematic nature of the missing values, caused by the limited statistical capacity of low-income countries, is a known structural problem of global statistics and is consistent with the practice of similar cross-national studies [52].
Table 2 presents the list of indicators and the corresponding variable names included in the discriminant analysis, together with their association with each of the 17 SDGs.
Table 2.
System of Indicators for Assessing SDG Achievement by Key Dimensions and Corresponding International Indices.
The selected indicators cover all 17 SDGs and represent a broad range of dimensions of sustainable development—from basic infrastructure and social protection to institutional quality and environmental responsibility—thus ensuring the comprehensiveness of the analytical basis of the study.
3.2. Methods
The choice of methods was determined by the nature of the research objective. Cluster analysis was selected as a method that makes it possible to objectively identify the typological structure of countries without a priori assumptions regarding the number and composition of groups, in contrast to approaches that require prior specification of group membership. Canonical discriminant analysis was selected as a method that directly models between-group differentiation and makes it possible to assess the relative contribution of each indicator to the separation of the identified groups.
3.2.1. Cluster Analysis
Cluster analysis was employed to identify relatively homogeneous groups of countries based on the selected set of indicators. This method was chosen because it enables the detection of an underlying typological structure in the data without imposing any a priori assumptions regarding the number or composition of groups [53].
Before clustering, all variables were standardized to ensure comparability, as the indicators were measured in different units and exhibited different scales of variation. Standardization was performed using the z-score transformation:
where denotes the value of variable j for country i, is the mean of variable j, and is its standard deviation.
The similarity between countries was assessed using the Euclidean distance measure:
where is the distance between countries i and k, and p is the number of variables included in the analysis.
At the initial stage, hierarchical cluster analysis was applied in order to examine the internal structure of the sample and to determine a plausible number of clusters. Under the agglomerative procedure, each country initially forms a separate cluster, and the most similar clusters are then merged step by step until all objects are combined into a single hierarchy.
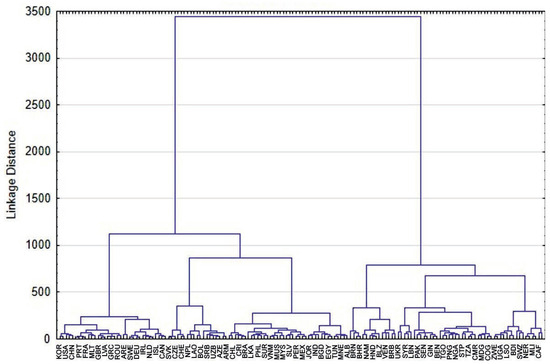
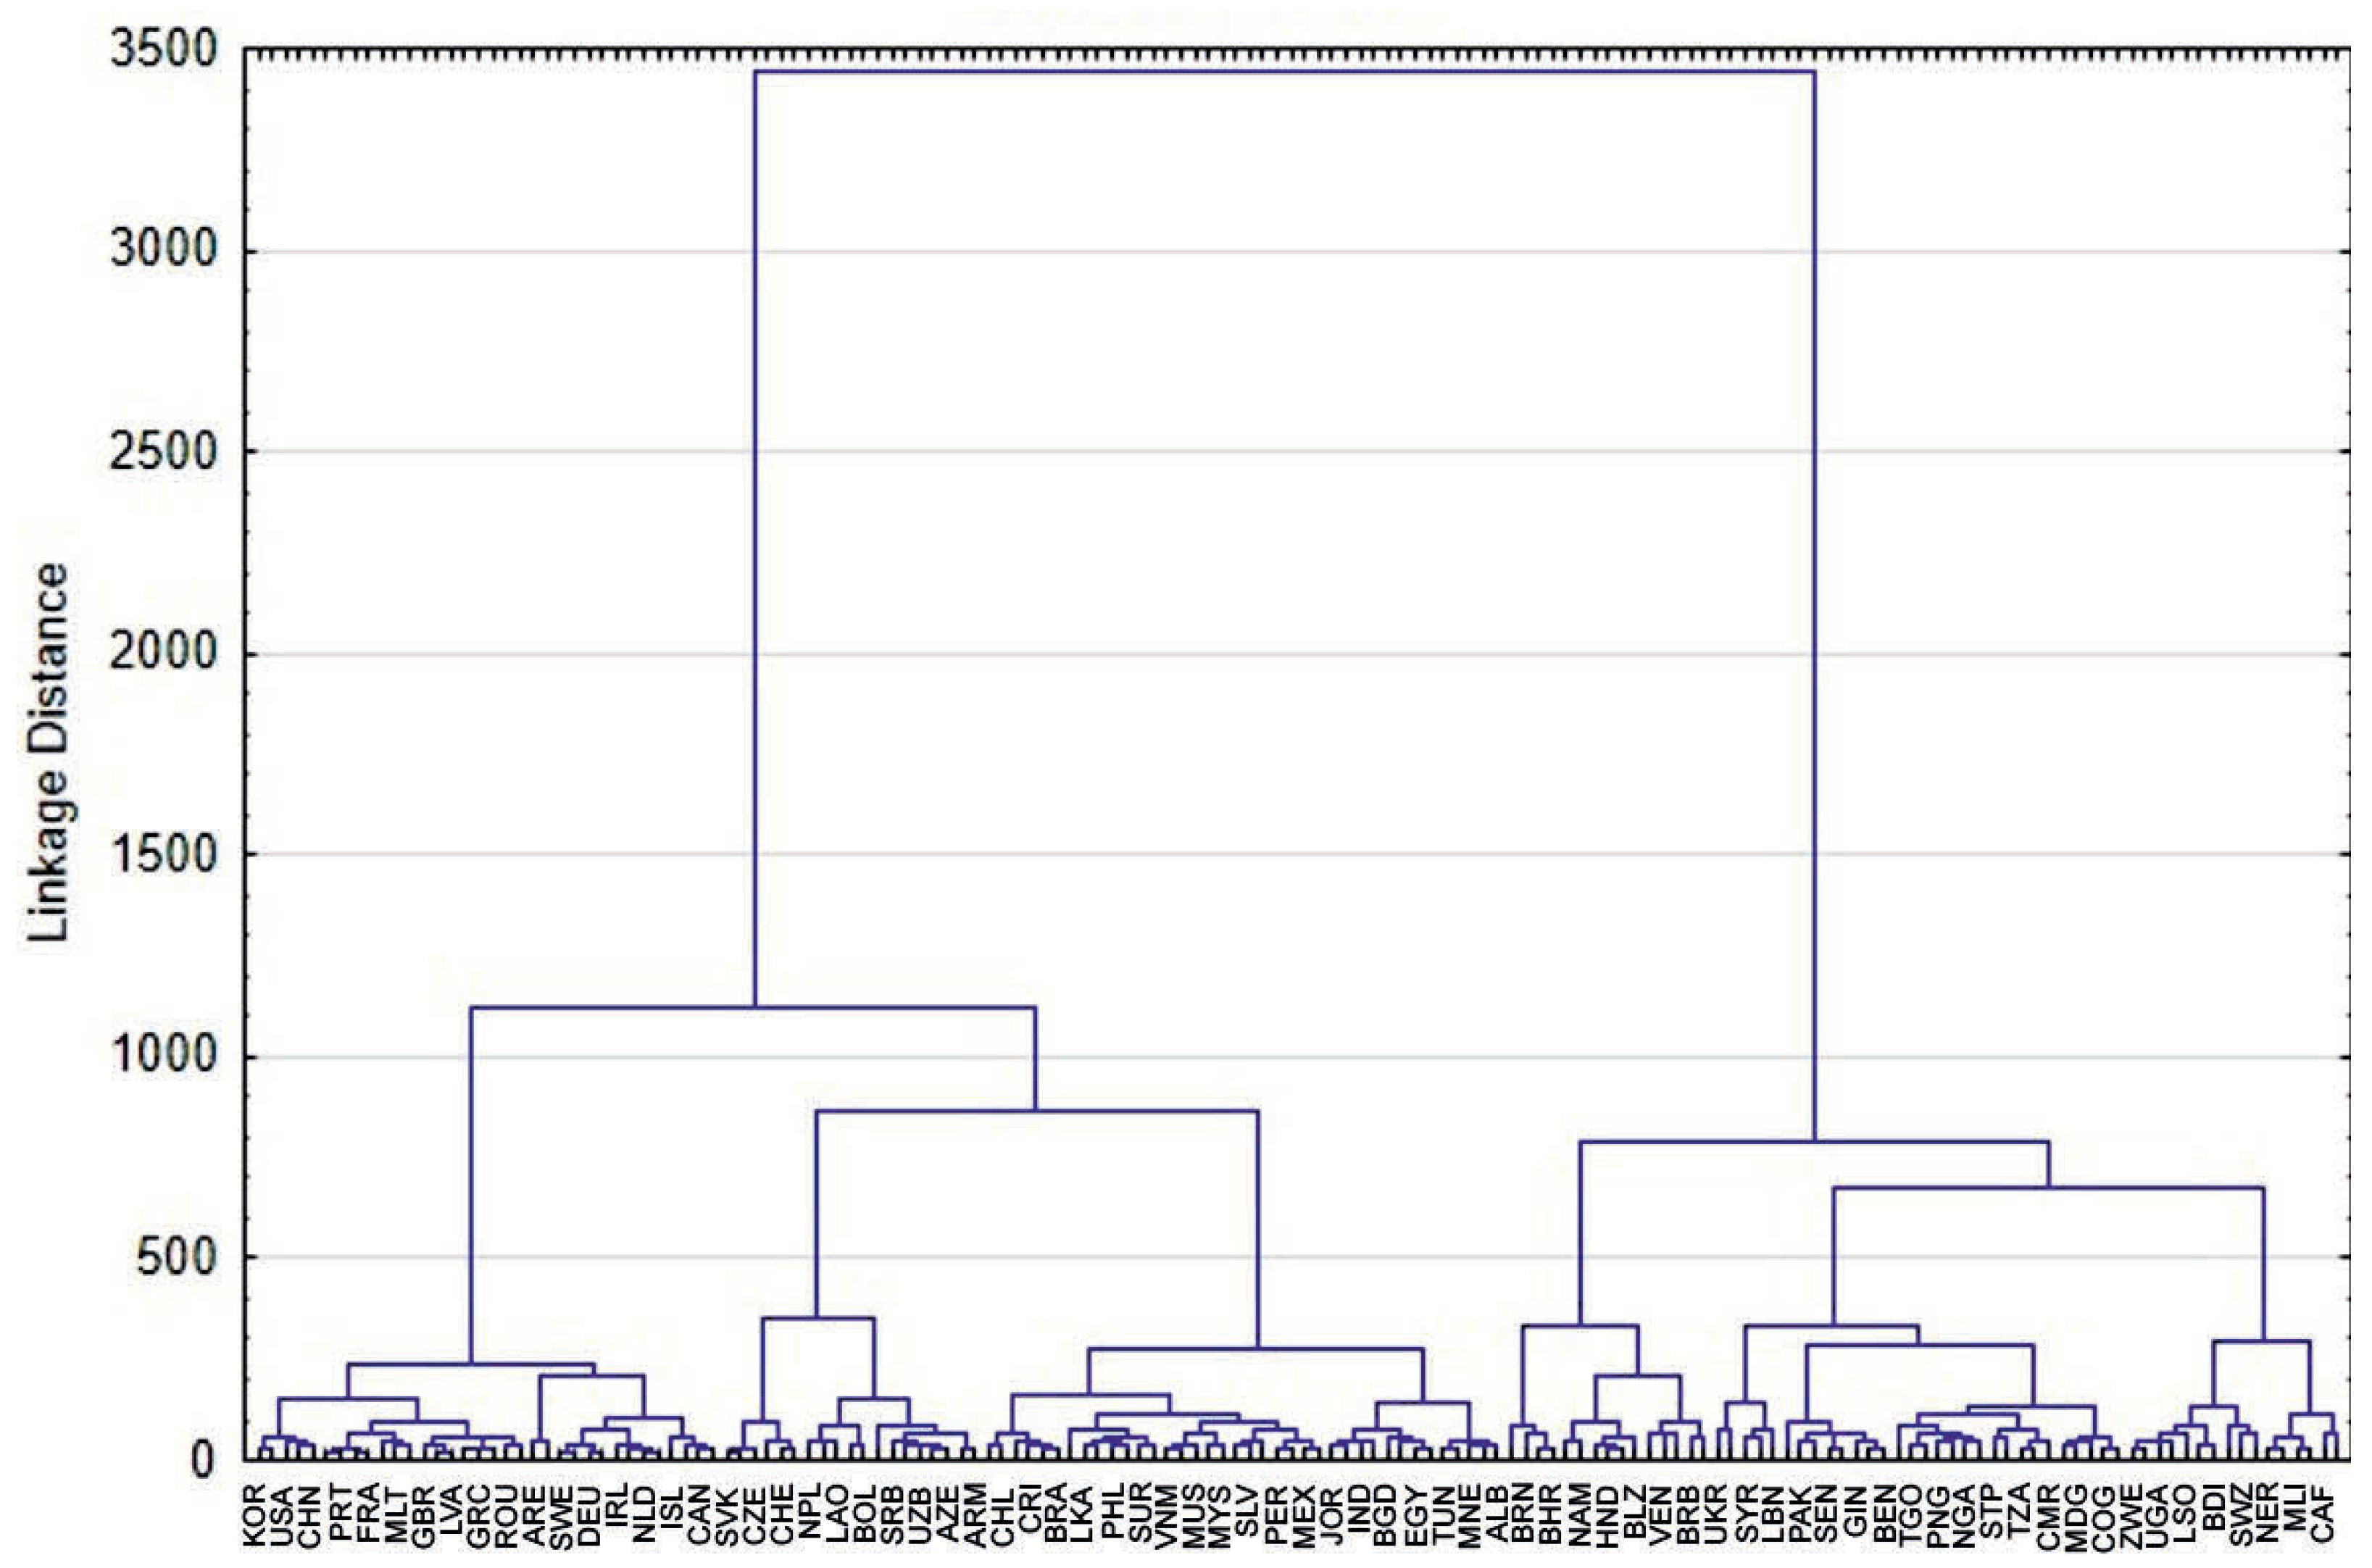
To support the selection of three clusters, the dendrogram produced by Ward’s hierarchical clustering method (Figure 2) and two quantitative validity criteria were examined.
Figure 2.
Tree Diagram for 154 Cases (Ward’s Method, Euclidean Distances).
The dendrogram revealed two principal macrostructures in the data, as evidenced by the largest increase in linkage distance at the final agglomeration step (from approximately 1100 to 3400 distance units). This configuration is consistent with the highest silhouette coefficient observed for k = 2 (S = 0.294). However, visual inspection of the dendrogram identified pronounced internal substructure within one of the two macroclusters, indicating the presence of a meaningful additional partition. This observation is corroborated by the elbow criterion: the within-cluster sum of squares showed the steepest decline when moving from k = 2 (WCSS = 1655) to k = 3 (WCSS = 1349), after which the rate of improvement decreased substantially (k = 4: WCSS = 1213; k = 5: WCSS = 1137). For k > 4, silhouette values declined, and no distinct linkage distance gaps were observed in the dendrogram, indicating a transition toward excessive fragmentation.
The three-cluster solution was therefore selected as a methodologically justified compromise between statistical compactness and analytical differentiation: a two-cluster solution would obscure the substantively important distinction between least developed countries and middle-income countries, while solutions with k > 3 produce partitions unsupported by clear structural breaks in the data. The moderate silhouette value for k = 3 (S = 0.231) is consistent with the overlapping nature of development trajectories in cross-national comparative research.
After the preliminary number of clusters had been identified, the k-means clustering algorithm was used to refine the final partition. This method assigns observations to K clusters in such a way that the within-cluster sum of squares is minimized:
where K is the number of clusters, Cl is the set of observations assigned to cluster l, and μl is the centroid of cluster l.
The adequacy of the clustering results was evaluated in terms of within-group homogeneity and between-group heterogeneity. The resulting clusters were interpreted based on the mean values of the indicators within each group, which made it possible to characterize typical profiles of countries and to identify substantive differences among the detected clusters.
3.2.2. Discriminant Analysis
Following cluster formation, discriminant analysis was applied to validate the obtained classification and to identify the variables that contributed most strongly to the separation of the groups.
The purpose of discriminant analysis is to construct linear combinations of explanatory variables, referred to as discriminant functions, that maximize the separation between groups [54]. The general form of the discriminant function is as follows:
where Dm is the value of the m-th discriminant function, am is a constant term, bjm is the coefficient associated with variable xj, and p is the number of predictors.
The maximum number of discriminant functions is equal to the lesser of two values: the number of groups minus one or the number of predictors. The first function explains the largest share of between-group variation, whereas each subsequent function captures the remaining discriminatory information under the condition of orthogonality to the previous functions.
The statistical significance of the discriminant functions was assessed using Wilks’ lambda:
where W denotes the within-group sum of squares and cross-products matrix, and T is the total sum of squares and cross-products matrix. Lower values of Wilks’ lambda indicate greater discriminatory power of the model. The significance of the functions was tested using the corresponding chi-square approximation.
Interpretation of the results was based on standardized discriminant coefficients and structure coefficients, i.e., correlations between the original variables and the discriminant functions. These measures allow the identification of the indicators that make the greatest contribution to group separation. In addition, classification accuracy was evaluated by examining the proportion of correctly classified observations, which serves as an important criterion for assessing the robustness of the derived typology.
Thus, the combined use of cluster and discriminant analysis ensures methodological consistency in the study design. Before interpreting the discriminant results, the key assumptions of canonical discriminant analysis were examined. Multicollinearity among predictors was assessed using variance inflation factors (VIF). All VIF values remained below the conventional threshold of 10 (maximum VIF = 5.483 for JMP_SAN; mean VIF = 3.383), indicating that severe multicollinearity is absent from the model. Box’s M test of covariance matrix homogeneity across groups yielded a statistically significant result (M = 3058.93, χ2 = 1638.86, df = 306, p < 0.001), indicating that the within-group covariance matrices differ across clusters. However, Box’s M is known to be highly sensitive to departures from multivariate normality and tends to reject the null hypothesis in applied research settings even when violations are moderate. Given the robustness of linear discriminant analysis to moderate violations of this assumption and reasonably balanced group sizes, the results are interpreted with appropriate caution. At the first stage, cluster analysis reveals the latent grouping structure of the countries under study, whereas at the second stage, discriminant analysis verifies the stability of this structure and identifies the key variables responsible for intergroup differentiation.
This two-step approach makes it possible not only to classify countries but also to provide a meaningful interpretation of the observed typology.
4. Results
4.1. Cluster Analysis Results
The cluster analysis of 154 countries worldwide based on the scores of all 17 SDGs, using the k-means method, made it possible to identify three typologically homogeneous groups that differ substantially in their sustainable development profiles. Between-group differences were examined using one-way analysis of variance. It should be noted that, since the same variables were used both to form the clusters and to compute the ANOVA statistics, these tests do not constitute independent confirmatory evidence and should be interpreted as descriptive rather than inferential. With this caveat in mind, statistically significant between-group differences were observed for 16 out of 17 variables (p < 0.001). This indicates the high discriminatory power of the proposed classification. The only exception is Goal 14 (F = 1.92, p = 0.157), which does not reach statistical significance, suggesting relative homogeneity across countries in marine ecosystem conditions regardless of overall development level. This finding is itself substantively meaningful: the absence of between-group differentiation on Goal 14 (OHI) indicates that the state of marine ecosystems does not constitute a distinguishing characteristic of the identified typological groups. Goal 14 was nonetheless retained in the discriminant analysis to preserve the conceptual completeness of the “one indicator–one goal” framework, which is a stated methodological principle of the study. As shown by the subsequent discriminant analysis, its coefficients are close to zero, which is consistent with the ANOVA result and indicates its minimal contribution to group separation. The highest between-group differentiation was observed for Goal 3 (), Goal 7 (), and Goal 9 (), indicating the strong statistical association of health, access to energy, and infrastructure with the observed typological differences among groups of countries.
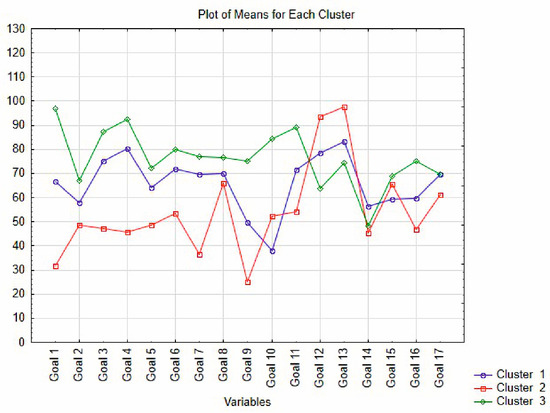
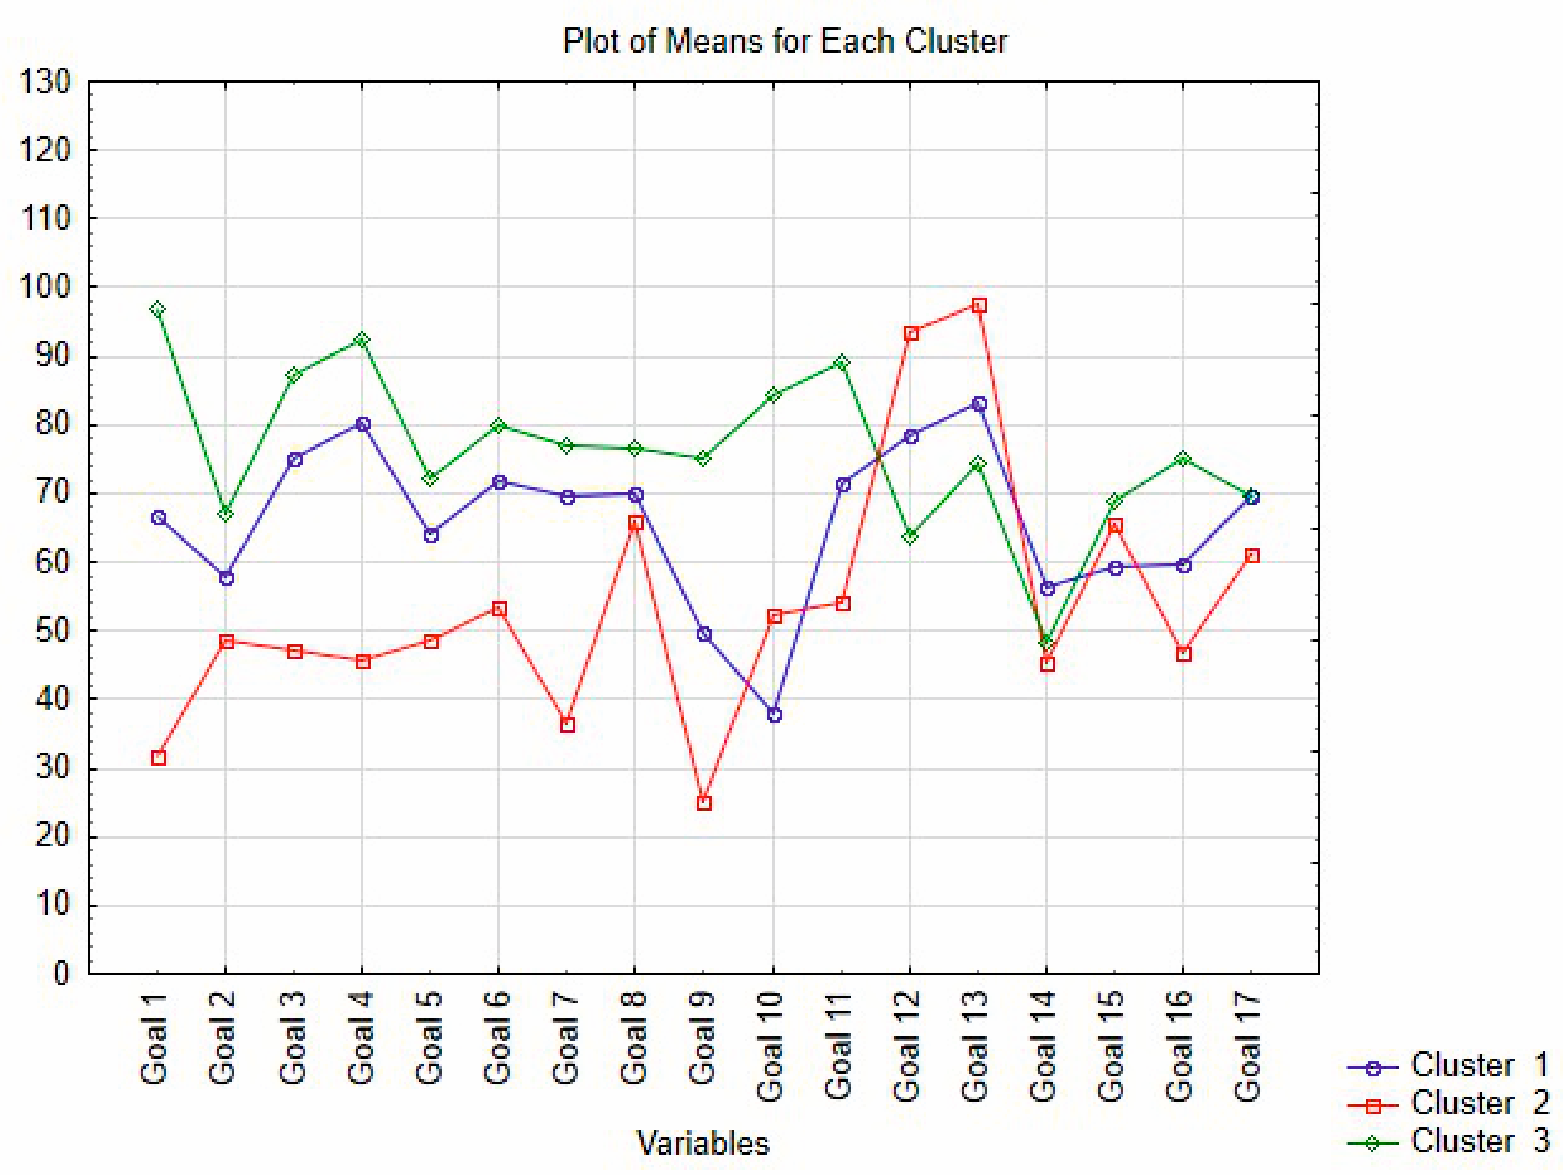
The composition of the clusters is presented in Table 3, the distribution of countries across clusters by World Bank region and income group is shown in Table 4, the mean scores by goal for each cluster are shown in Table 5, and the graphical interpretation is provided in Figure 3.
Table 3.
Cluster Composition.
Table 4.
Distribution of Countries across Clusters by World Bank Region and Income Group (n = 154).
Table 5.
Mean Goal Scores by Cluster.
Figure 3.
Plot of Means for Each Cluster.
The internal heterogeneity of Cluster I warrants particular attention. Despite sharing a medium-level SDG achievement profile, the 52 countries span highly diverse geographical and economic contexts: Latin America (Brazil, Mexico, Argentina), South and Southeast Asia (India, Indonesia, Philippines), the Middle East (Egypt, Iran, Jordan), Sub-Saharan Africa (Ghana, South Africa, Botswana), and high-income Gulf states (Bahrain, Kuwait, Saudi Arabia, Singapore) whose SDG profiles nonetheless place them in this intermediate group rather than Cluster III. This confirms that the SDG achievement profile is an independent analytical characteristic not reducible to income level.
The distances between the cluster centroids (Table 6) confirm that Clusters II and III are the most dissimilar (Euclidean distance = 32.99), whereas Clusters I and III are the closest to each other (17.73). This distance structure is consistent with the pattern of classification errors identified at the stage of discriminant analysis and discussed in detail in the following subsection.
Table 6.
Euclidean Distances between Cluster Centroids.
Cluster I includes 52 countries with predominantly medium levels of SDG achievement—countries of Latin America, South and Southeast Asia, the Middle East, and Sub-Saharan Africa with relatively higher income levels (including Brazil, Mexico, India, Indonesia, South Africa, and Ukraine). The cluster is characterized by relatively high scores for Goal 12 (78.63) and Goal 13 (83.23), which is consistent with moderate consumption levels and relatively low CO2 emissions per capita, typical of middle-income countries where industrialization has not yet reached the level of developed economies. In contrast, the lowest scores were recorded for Goal 10 (reduced inequalities, 38.04) and Goal 9 (industry, innovation, and infrastructure, 49.84), consistent with structural characteristics in the areas of economic inclusiveness and technological development.
Cluster II includes 42 countries—predominantly the least developed countries of Sub-Saharan Africa, as well as several countries in Asia and the Middle East (Haiti, Myanmar, Pakistan, Syria, and Yemen). This cluster demonstrates the lowest mean scores for most social and institutional goals, in particular Goal 1 (no poverty, 31.84), Goal 3 (good health and well-being, 47.27), Goal 4 (quality education, 45.84), and Goal 16 (peace, justice, and strong institutions, 46.91). At the same time, this cluster stands out for the highest scores for Goal 12 (93.72) and Goal 13 (97.46)—a pattern that appears not to reflect environmental responsibility, but rather to be associated with an extremely low level of consumption and industrial activity.
The described paradox of Goals 12 and 13 is a methodologically important caveat: the highest scores on the environmental goals are demonstrated by the poorest countries solely as a result of their low level of economic activity, rather than targeted environmental policy. This indicates the limitations of certain SDG indicators outside the economic context of a country and constitutes an important signal for the developers of the global monitoring system.
Cluster III is the largest (60 countries) and includes predominantly high-income countries—states of Western and Central Europe, North America, Australia, New Zealand, Japan, and South Korea—as well as some upper-middle-income countries that demonstrate steady progress in the field of sustainable development (China, Vietnam, the Baltic states, and the countries of Central Asia). The cluster is characterized by the highest scores for most social, economic, and institutional goals: Goal 1 (96.97), Goal 4 (92.51), Goal 10 (84.44), Goal 11 (89.25), and Goal 16 (75.24). At the same time, relatively lower scores for Goals 12 (63.79) and 13 (74.47) reflect higher levels of consumption and greater per capita emissions—a structural characteristic of developed economies that remains one of the key challenges of global sustainability.
Overall, the identified clusters correspond to the gradation of countries by level of economic development, but do not coincide with it completely. It is noteworthy that countries such as Singapore, Kuwait, Bahrain, and Saudi Arabia, despite their high income level, were assigned to Cluster I rather than Cluster III. This confirms that the SDG achievement profile is an independent analytical characteristic of a country that cannot be reduced to traditional indicators of economic well-being.
The graphical analysis (Figure 3) visually confirms the identified patterns. The greatest dispersion among the three profiles is observed for Goal 1, Goal 9, and Goal 10, which is consistent with the highest values of the F-statistic for these variables. A pronounced inter-cluster gap is also observed for Goal 3, Goal 4, and Goal 16, where Cluster III consistently outperforms the other two, while Cluster II records the lowest values. In contrast, for Goal 14 and Goal 17, the cluster profiles converge, which is consistent with the statistically weakest differentiation across these variables. The characteristic crossing of the lines in the area of Goal 12 and Goal 13, where Cluster II sharply exceeds the others, graphically confirms the methodological paradox of the environmental goals described above.
The obtained results indicate that the countries of the world form three clearly differentiated typological groups according to their SDG achievement profiles. To deepen the analysis and move from the description of typological differences to the identification of structural indicators statistically associated with group separation, discriminant analysis was applied at the next stage.
4.2. Discriminant Analysis Results
To identify the structural indicators statistically associated with countries’ membership in the identified clusters, canonical discriminant analysis was performed for 64 countries for which the values of the 17 indicators selected for the analysis are available (Table 2).
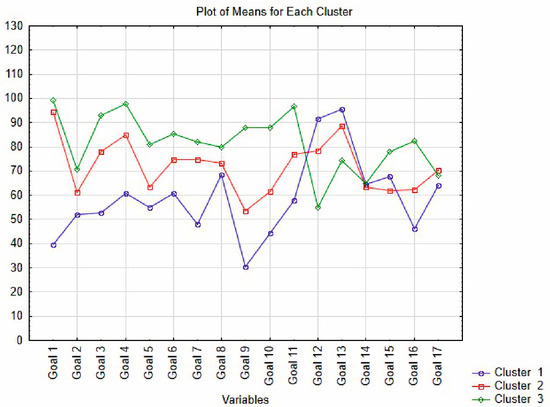
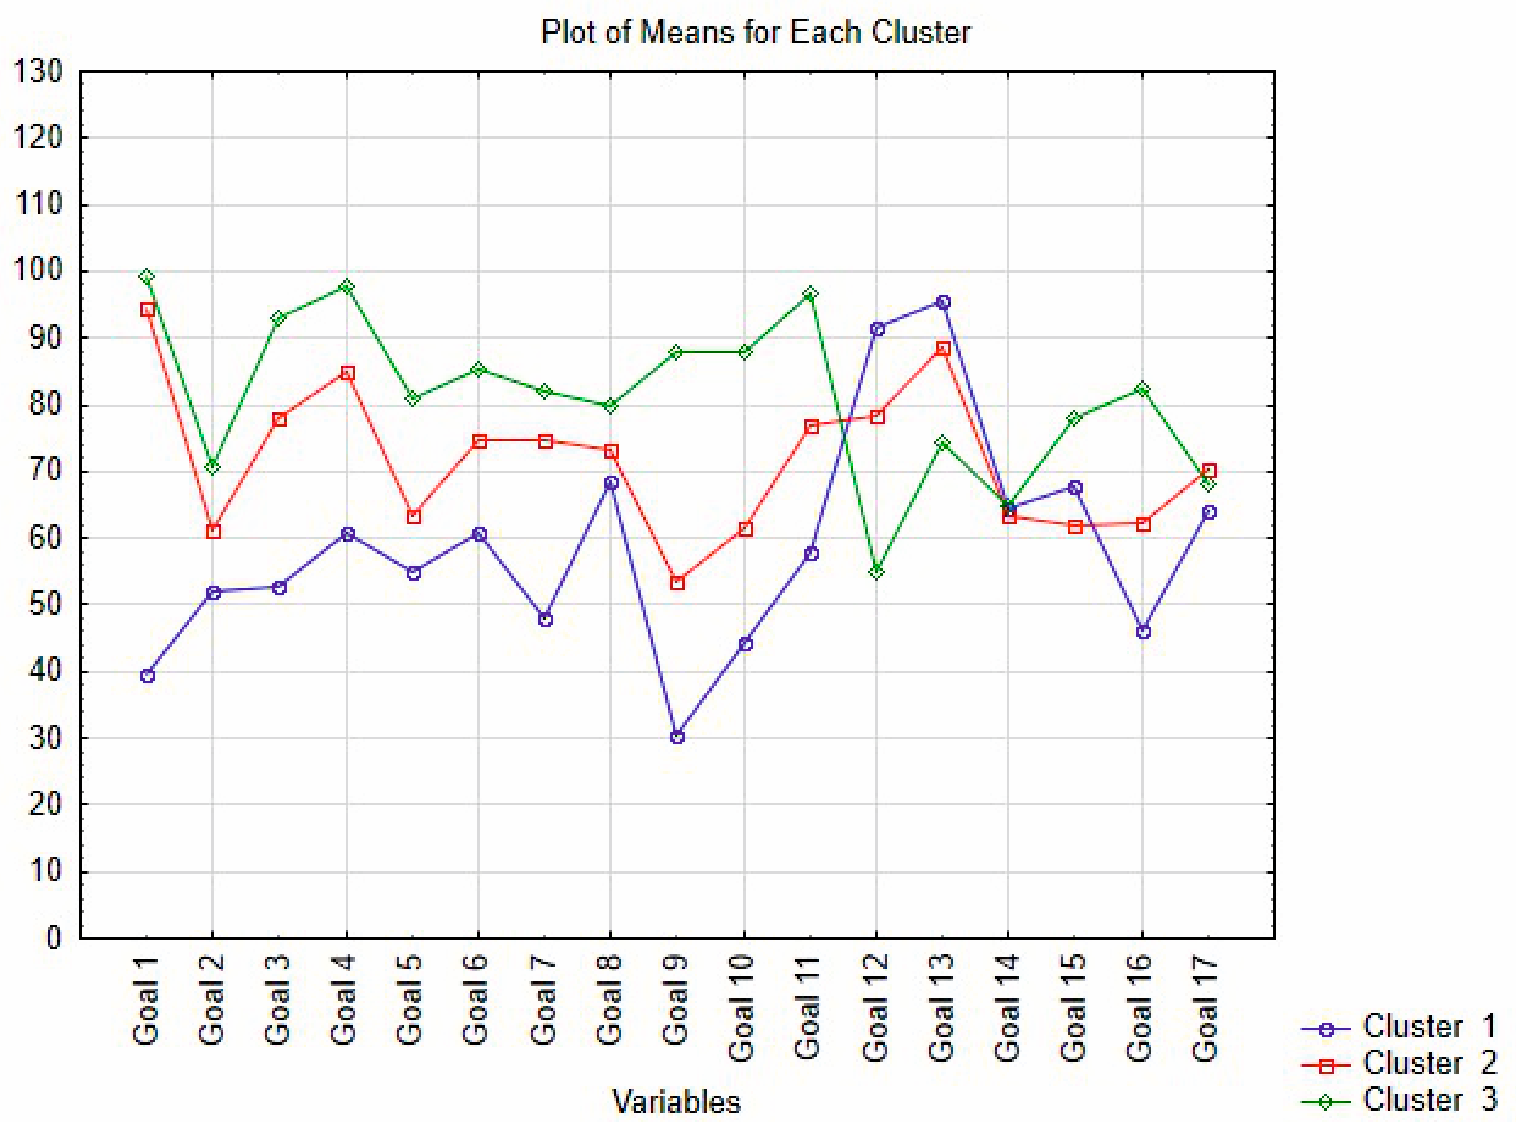
To ensure consistency of group membership between the two stages of the study, cluster analysis was conducted on the sample of 64 countries. The cluster profiles reproduce the same hierarchy and pattern of between-group differences as in the full sample (154 countries). This is clearly confirmed by the graph of mean values (Figure 4) and indicates the representativeness of the reduced sample.
Figure 4.
Plot of Means for Each Cluster for the Discriminant Analysis Sample (64 Countries).
Table 7.
Classification Matrix.
Table 8.
Leave-One-Out Cross-Validated Classification Matrix (n = 64).
Table 7 presents the classification matrix, which reflects the accuracy of assigning countries to clusters based on the constructed discriminant functions.
The overall classification accuracy was 90.63%, indicating a high discriminatory power of the constructed model within the estimation sample. To assess the stability of the classification, leave-one-out (LOO) cross-validation was performed for the 64 countries with complete data across all 17 indicators. The LOO cross-validated accuracy was 71.43% (Table 8), which is substantially above the level expected by chance for a three-group classification (33.3%) and confirms that the model retains meaningful discriminatory power beyond the estimation sample. The difference between apparent and cross-validated accuracy is partly attributable to the high predictor-to-observation ratio (17 predictors, 64 observations), which is known to produce optimistic resubstitution estimates in small samples. The cross-validated results indicate that Cluster III is classified most stably (86.21% correct), while Clusters I and II show greater overlap under LOO conditions, consistent with their closer centroid distances reported in Table 5.
The highest level of correct classification was achieved for Cluster III (93.33%) and Cluster II (92.31%), whereas for Cluster I it was somewhat lower (85.71%). Notably, the classification errors were exclusively of a “neighboring” nature: countries from Cluster I were misclassified only into Cluster II or Cluster III, but no misclassification occurred directly between the extreme groups. This confirms that the identified clusters form a developmental continuum between the distinguished types.
No reassignment of misclassified observations was performed, since the group membership of countries was determined at the first stage by cluster analysis and is substantively justified; changing the group membership of individual observations would contradict the logic of the two-stage approach and would reduce the interpretability of the results.
Table 9 presents the classification functions of discriminant analysis—linear combinations of predictors that make it possible to assign each country to one of the three clusters based on the values of the selected indicators.
Table 9.
Classification Functions of Discriminant Analysis.
The analysis of the classification functions (Table 9) makes it possible to identify the indicators with the greatest discriminatory power. The highest absolute coefficient values are observed for LPI and GPI, highlighting the strong statistical association of infrastructure development and institutional stability with typological differences between countries. It should be noted that the high absolute values of the LPI and GPI coefficients in the classification functions are driven by the scale of the original variables and are not directly comparable with standardized coefficients. Substantial differences between the clusters are also observed for the coefficients of CO2 and FLII. In particular, the considerably higher CO2 coefficient for Cluster III (1.903 versus 1.122 and 1.181) is consistent with the structurally higher emission levels of developed economies, whereas the higher FLII coefficient for Cluster III is consistent with greater forest landscape integrity observed in countries with more developed environmental protection systems. By contrast, the coefficients for UEM and OHI are close to zero in all three functions, indicating their minimal contribution to cluster differentiation.
Table 10 presents the results of the significance test of the canonical roots of the discriminant model.
Table 10.
Test of Significance of Canonical Roots (Chi-Square Tests with Successive Roots Removed).
The test results indicate that the first discriminant function is statistically significant at the level of and explains the predominant share of between-group variation, as evidenced by the high eigenvalue (5.803) and canonical correlation of 0.924. This means that the first function separates the three clusters of countries in the discriminant space with very high power. The second function, by contrast, does not reach statistical significance (), indicating that the additional differentiation between the clusters contributed by this function is marginal. Thus, the distribution of countries across clusters is primarily accounted for by one dominant discriminant function, which simplifies the interpretation of the model and increases its practical value for classification purposes.
Table 11 presents the standardized coefficients of the canonical variables, which make it possible to assess the relative contribution of each indicator to the formation of the discriminant functions.
Table 11.
Standardized Coefficients of Canonical Variables.
The first discriminant function (Root 1) explains 90.3% of the between-group variation, confirming its dominant role in the distribution of countries across clusters. The greatest contribution to this function is made by PUP (proportion of urban population living in slums, 0.608) and GPI (Global Peace Index, 0.589) with positive coefficients, as well as JMP_SAN (access to sanitation, −0.402) and WBPHR (poverty, 0.402), which together define the first axis of differentiation as an axis of “basic human development and institutional stability”. The second function (Root 2) explains the remaining 9.7% of the variation. As it does not reach conventional levels of statistical significance (p = 0.059), it should be interpreted only cautiously and descriptively. Descriptively, it is associated primarily with POU (−0.592), CO2 (−0.482), and REC (−0.422), which may tentatively suggest an axis of “environmental and food-related pressure”; however, this interpretation is not statistically supported and should not be treated as a substantive finding.
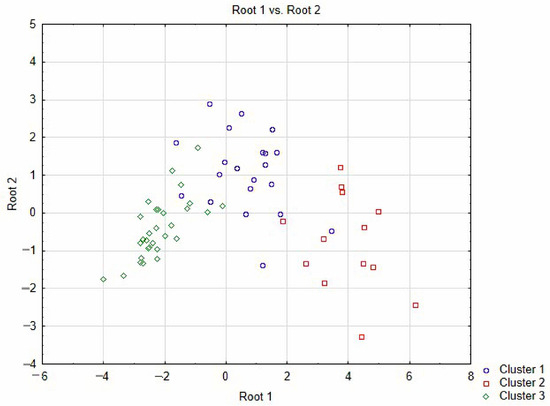
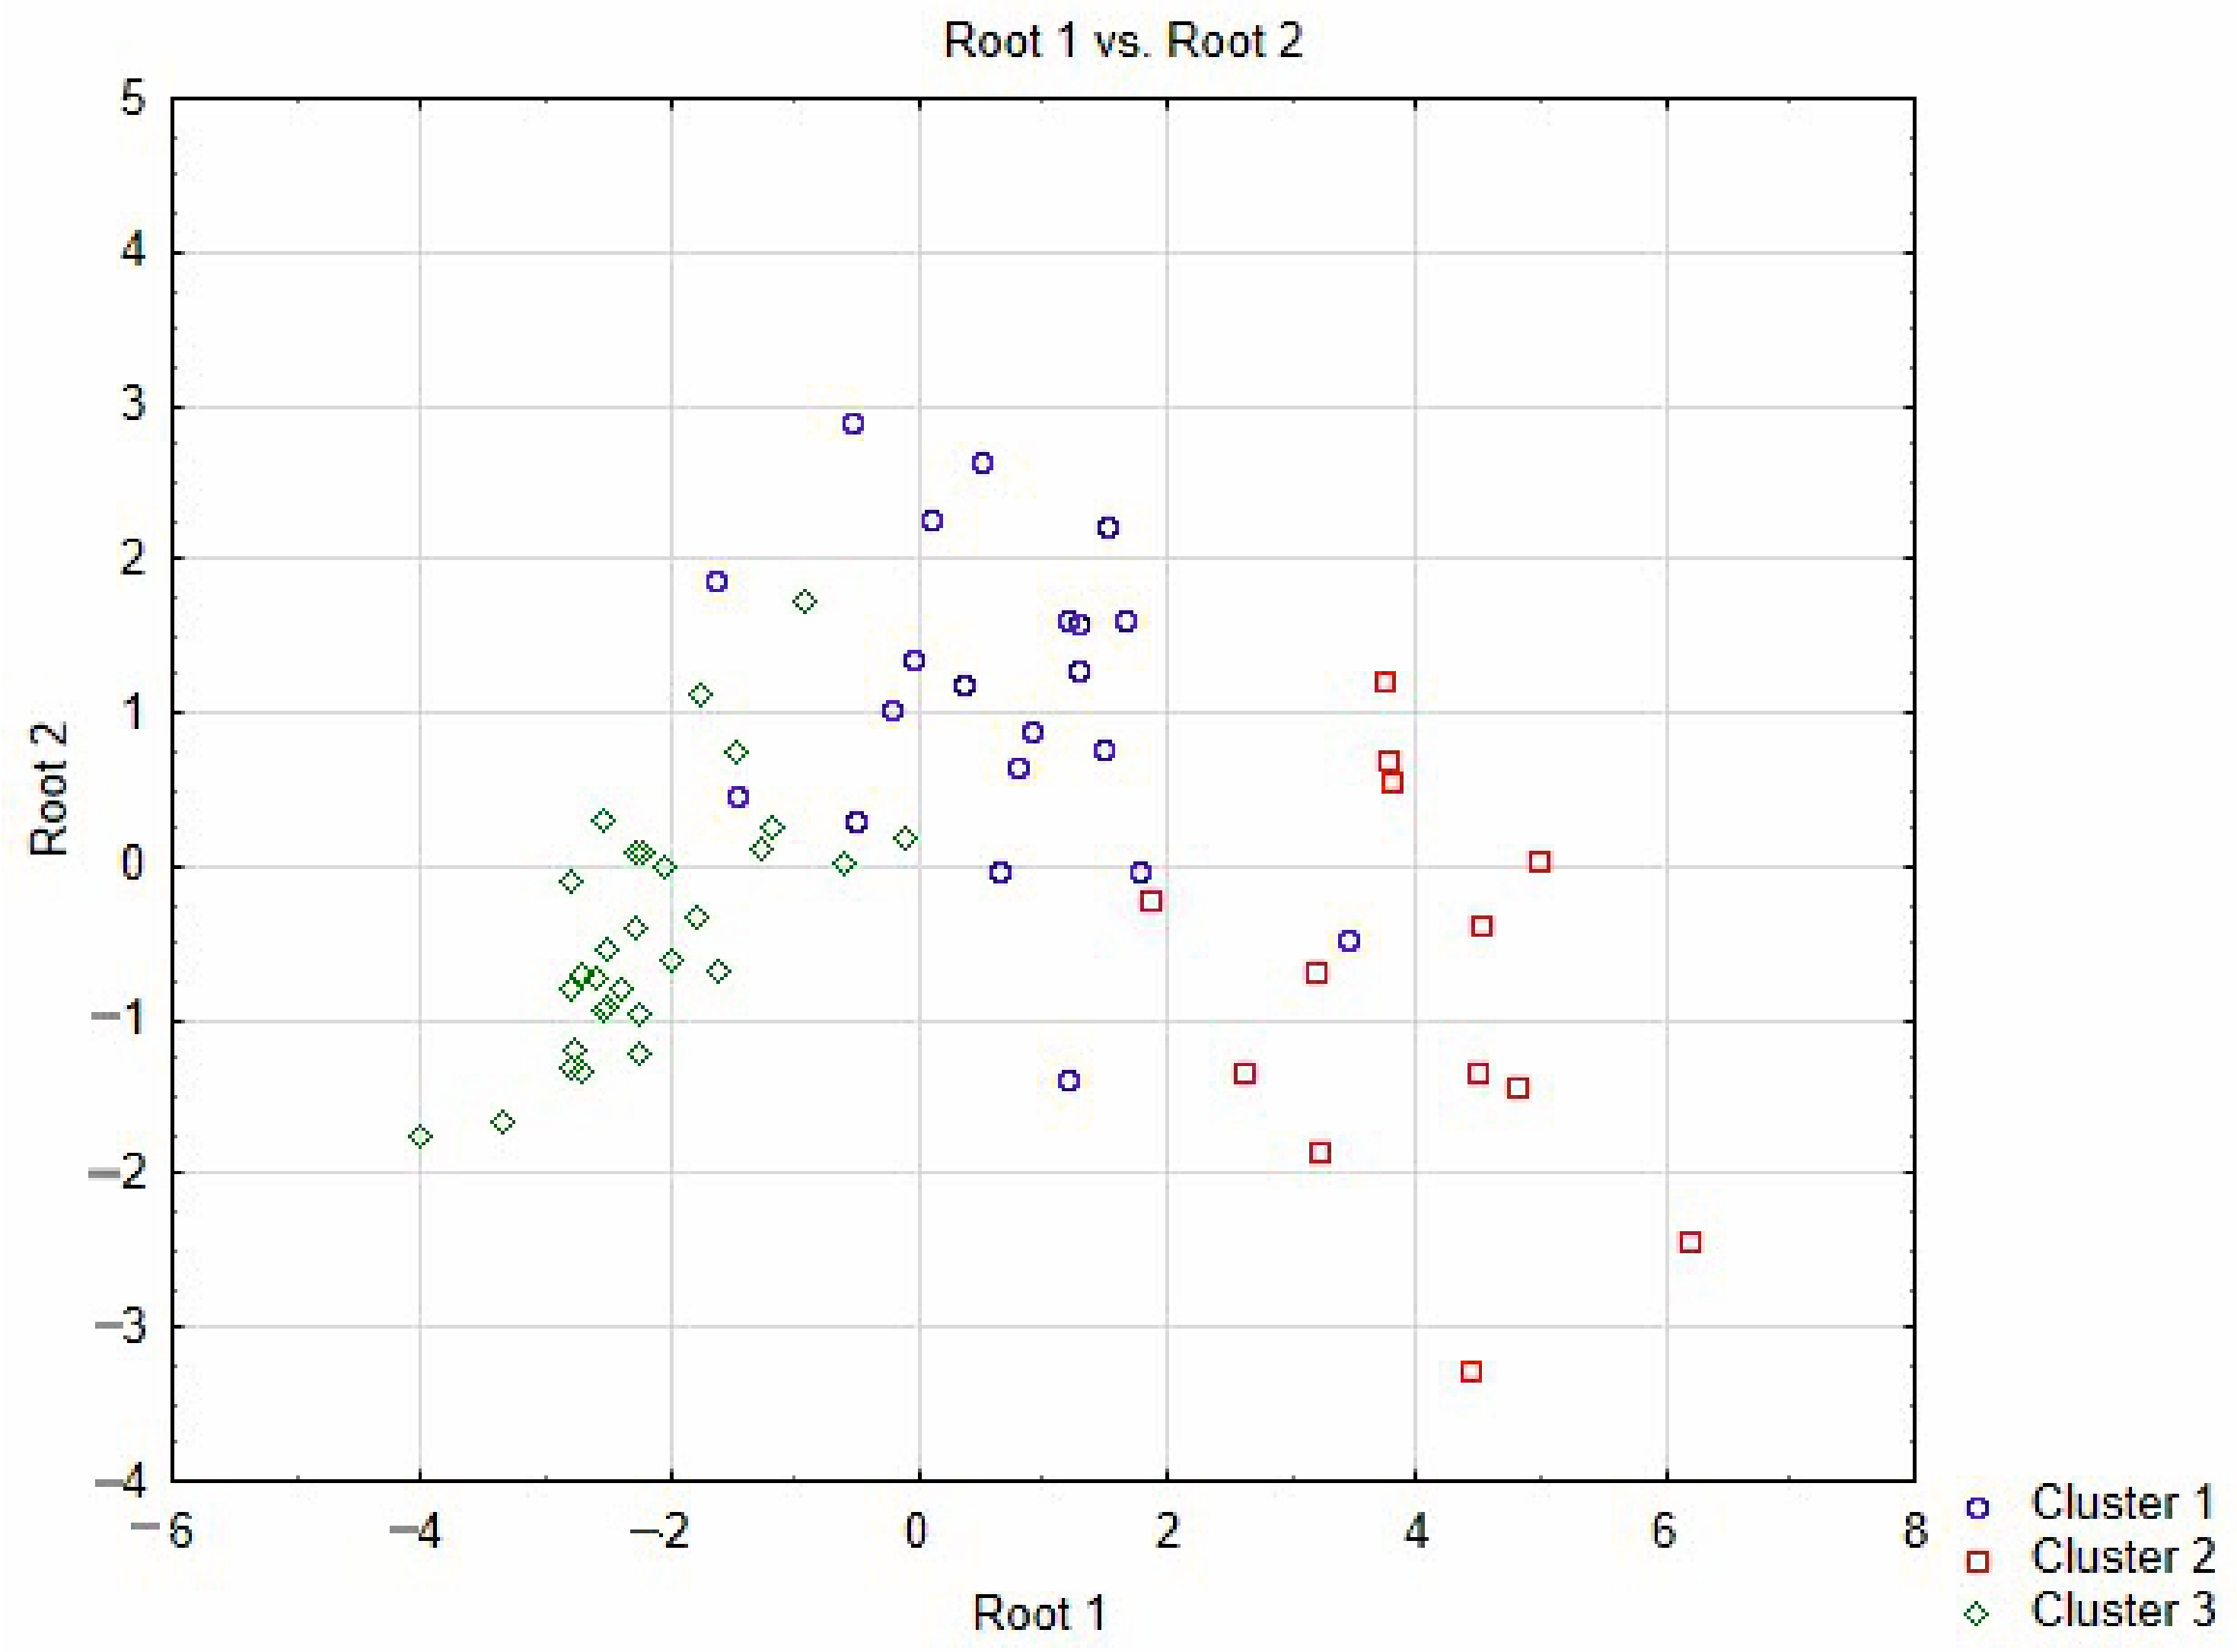
The graphical interpretation of the discriminant analysis results in the space of two canonical functions (Figure 5) confirms the quality of the constructed model: the points corresponding to the countries of the three clusters form clearly separated clouds with limited overlap. This indicates that the selected 17 indicators, taken together, ensure a high degree of linear separation of the identified typological groups in the canonical space, and that the boundaries between the clusters are statistically substantiated and robust.
Figure 5.
Distribution of Countries in the Space of Two Canonical Discriminant Functions (Root 1 vs. Root 2).
Summarizing the results of the discriminant analysis, it should be noted that the constructed model demonstrates high classification accuracy (90.63%; ) and LOO cross-validated accuracy of 71.43%, which confirms its validity for the typologization of countries according to their SDG achievement profiles. The main structural indicators associated with inter-cluster differentiation were found to be indicators of basic human development and institutional stability—primarily access to sanitation (JMP_SAN), financial inclusion (AO), the level of peace (GPI), and CO2 emissions (CO2)—which together form the first and most powerful axis of the distribution of countries in the discriminant space.
Overall, the results of the two-stage analysis indicate that the trajectories of sustainable development are associated not with isolated individual factors but with a combination of infrastructural, institutional, and environmental correlates acting in concert. The identified patterns may have practical relevance: for countries seeking to change their typological position, the identified patterns suggest that the structural correlates most clearly associated with typological positioning concern basic infrastructure, financial accessibility, and institutional quality—precisely those dimensions that most consistently differentiate country groups on the path to 2030.
5. Conclusions
This study is devoted to identifying the key structural indicators statistically associated with SDG achievement profiles through the typological classification of 154 countries worldwide based on the full 17-dimensional performance profile without aggregation. The two-stage analytical approach combines k-means cluster analysis and canonical discriminant analysis, making it possible not only to describe typological differences among countries but also to identify the external structural indicators most strongly associated with them. The information base was formed using data from international organizations (latest available data, 2022–2025) according to the principle of “one indicator–one goal”. The discriminant analysis was conducted for 64 countries with complete data; the exclusion of observations was due to the limited statistical capacity of low-income countries, while the robustness of the results was confirmed by the convergence of cluster profiles in the full and reduced samples.
According to the results of the cluster analysis, three typologically homogeneous groups of countries were identified, the statistical significance of which was confirmed for 16 out of 17 variables (). Cluster I (52 countries) includes states with a medium level of SDG achievement and structural characteristics associated with lower performance in economic inclusiveness and infrastructure development. Cluster II (42 countries) comprises predominantly the least developed countries with critically low performance in social and institutional goals. Cluster III (60 countries) is represented mainly by high-income countries that demonstrate the highest scores for most social, economic, and institutional goals. At the same time, for Goals 12 and 13, the traditional hierarchy of clusters is inverted. The highest scores on the environmental goals are demonstrated by the poorest countries, a pattern associated with their low level of economic activity rather than targeted environmental policy. This indicates the conceptual limitations of certain SDG indicators outside the economic context of a country.
Canonical discriminant analysis confirmed the high classification accuracy of the constructed model (90.63%, ). The first discriminant function explains 90.3% of the between-group variation and is defined primarily by the proportion of the urban population living in slums (PUP, 0.608), the level of peace (GPI, 0.589), access to sanitation (JMP_SAN, −0.402), and the level of poverty (WBPHR, 0.402). This defines the main axis of inter-cluster differentiation as an axis of basic human development and institutional stability. The second function does not reach conventional levels of statistical significance (p = 0.059) and should therefore be interpreted only cautiously and descriptively. It explains the remaining 9.7% of the variation and is tentatively associated with an axis of environmental and food-related pressure.
From a theoretical point of view, the study demonstrates that the SDG achievement profile is an independent analytical characteristic of a country that cannot be reduced to traditional indicators of economic development. The methodological contribution of the study lies in the combination of cluster and discriminant analysis into a unified analytical system that enables the identification of structural indicators statistically associated with typological differences. This framework also incorporates the implementation of the principle of “one indicator–one goal”, which ensures conceptual symmetry and reproducibility of the results. From a practical point of view, the structural correlates most strongly associated with typological positioning concern basic infrastructure and institutional quality for Cluster II countries, economic inclusiveness and technological development for Cluster I countries, and consumption intensity and emissions levels for Cluster III countries. The constructed classification model with an accuracy of 90.63% (cross-validated: 71.43%) may serve as an exploratory tool for rapid diagnosis of a country’s position and for identifying areas that may require policy attention.
The present study has three principal limitations: (1) the cross-sectional design of the analysis precludes causal inference; (2) the operationalization of each SDG through a single indicator inevitably simplifies the multidimensional content of each goal; (3) the exclusion of countries with incomplete data introduces systematic bias toward higher-income countries with more developed statistical systems.
First, the analysis was conducted on a sample of 64 countries due to the uneven coverage of international indices, which may limit the representativeness of the results with respect to the least developed countries. Second, the cross-sectional nature of the data makes it impossible to establish causal relationships; the identified structural indicators should therefore be considered structural correlates rather than causes of typological membership. Third, the application of listwise deletion for missing values may introduce systematic bias in favor of countries with more developed statistical systems. Furthermore, the indicator selected for Goal 14 (Ocean Health Index) did not reach statistical significance in the cluster analysis (F = 1.92, p = 0.157) and showed near-zero coefficients in the discriminant model. This variable was retained to preserve the conceptual integrity of the “one indicator–one goal” framework. However, its inclusion in the full 17-dimensional profile should be interpreted with caution, as it contributes minimally to typological differentiation. Fourth, the systematic exclusion of 90 countries from the discriminant analysis due to missing data introduces survivorship bias: low-income countries comprise only 28% of the included sample, compared to their substantially larger share in the full 154-country dataset. Fifth, the indicators used in the analysis were drawn from sources covering different reference years within the period 2022–2025, in accordance with the update cycles of international statistics. Most structural indicators reflect relatively stable country-level conditions. However, some variables may be sensitive to recent shocks or policy changes. This may affect the comparability of observations across countries. It limits the generalizability of the discriminant results, particularly with respect to the least developed countries.
Additionally, the operationalization of SDG 10 (Reduced Inequalities) through the proportion of adults with a financial institution account (AO) represents a suboptimal proxy, as financial inclusion does not fully capture the core concept of inequality as measured by the Gini coefficient or Palma ratio. This substitution was necessitated by substantial data gaps for the Gini coefficient across a significant number of countries in the sample, including missing or severely outdated observations for low- and middle-income countries. The authors acknowledge this as a conceptual limitation that may affect the interpretation of results related to SDG 10. Similarly, the operationalization of SDG 16 (Peace, Justice and Strong Institutions) through the Global Peace Index (GPI) captures only the conflict and security dimension of this goal. The dimensions of justice and institutional quality—such as rule of law, judicial independence, and control of corruption—are not reflected. This substitution was driven by the broader country coverage of GPI compared to available indices of rule of law or governance quality.
As a further conceptual limitation of the study, the principle of “one indicator–one goal”, while ensuring conceptual symmetry and methodological reproducibility, inevitably simplifies the multidimensional content of each SDG. A single indicator cannot fully capture the conceptual complexity of a goal. This limitation is particularly relevant for SDG 4 (Quality Education), SDG 8 (Decent Work and Economic Growth), SDG 12 (Responsible Consumption and Production), SDG 13 (Climate Action), and SDG 17 (Partnerships for the Goals), each of which encompasses multiple distinct dimensions that a single proxy cannot adequately represent.
Future research should focus on the investigation of causal mechanisms underlying the observed associations between structural indicators and a country’s typological position, the investigation of factors driving transitions of countries between clusters, and the assessment of the impact of specific policy interventions on changes in SDG achievement profiles across different groups of countries.
Author Contributions
Conceptualization, O.K. and O.B.; methodology, O.K. and K.B.; software, O.K. and O.T.; validation, O.B. and O.T.; formal analysis, K.B. and O.T.; investigation, O.K. and O.B.; resources, O.K. and O.T.; data curation, K.B.; writing—original draft preparation, O.K. and K.B.; writing—review and editing, O.K. and O.B.; visualization, K.B. and O.T.; supervision, O.B.; project administration, O.B. and O.K.; funding acquisition, O.B. All authors have read and agreed to the published version of the manuscript.
Funding
This research received no external funding.
Institutional Review Board Statement
Not applicable.
Informed Consent Statement
Not applicable.
Data Availability Statement
The datasets used in this manuscript are publicly available. Detailed information about these datasets is provided in the Section 3 of this manuscript.
Acknowledgments
During the preparation of this manuscript/study, the authors used ChatGPT-5 for the purposes of improving English. The authors have reviewed and edited the output and take full responsibility for the content of this publication.
Conflicts of Interest
The authors declare no conflicts of interest. The funders had no role in the design of the study; in the collection, analyses, or interpretation of data; in the writing of the manuscript; or in the decision to publish the results.
Abbreviations
The following abbreviations are used in this manuscript:
| SDG | Sustainable Development Goal |
| SDGI | Sustainable Development Goal Index |
| MDG | Millennium Development Goal |
Appendix A. Justification for Indicator Selection
Table A1 presents the rationale for selecting each indicator used in the discriminant analysis. For each SDG, the justification describes the main reason for preferring the chosen indicator over available alternatives, primarily based on cross-national data availability and measurement standardization.
Table A1.
Justification for Indicator Selection by SDG.
References
- Jiang, D.; Zhuo, J.; Fan, P.; Ding, F.; Hao, M.; Chen, S.; Dong, J.; Wu, J. Assessing the Transformation of Armed Conflict Types: A Dynamic Approach. Big Data Cogn. Comput. 2025, 9, 123. [Google Scholar] [CrossRef] [Scilit]
- Kovalchuk, O.; Berezka, K.; Karpyshyn, N. Model of Security-Economic Transformations: The Context of Contemporary International Conflicts. Preliminary Evaluations. Folia Oeconomica Stetin. 2025, 25, 172–189. [Google Scholar] [CrossRef] [Scilit]
- Kovalchuk, O.; Karpinski, M.; Babala, L.; Kasianchuk, M.; Shevchuk, R. The Canonical Discriminant Model of the Environmental Security Threats. Complexity 2023, 2023, 5584750. [Google Scholar] [CrossRef] [Scilit]
- Berezka, K.; Kovalchuk, O. The Application of Association Rules to Detect the Effects of Vaccinations against COVID-19 in the EU-27. Preliminary Estimates. Econom. Ekonom. Adv. Appl. Data Anal. 2023, 27, 1–16. [Google Scholar] [CrossRef]
- Emami, S.G.; Lorenzoni, V.; Turchetti, G. Towards Resilient Healthcare Systems: A Framework for Crisis Management. Int. J. Environ. Res. Public Health 2024, 21, 286. [Google Scholar] [CrossRef] [Scilit]
- Arghiroiu, G.A.; Bobeică, M.; Beciu, S.; Mann, S. From Crisis to Resilience: A Bibliometric Analysis of Food Security and Sustainability Amid Geopolitical Challenges. Sustainability 2025, 17, 8423. [Google Scholar] [CrossRef] [Scilit]
- United Nations. The Sustainable Development Goals Report 2025; United Nations: New York, NY, USA, 2025; Available online: https://unstats.un.org/sdgs/report/2025/The-Sustainable-Development-Goals-Report-2025.pdf (accessed on 24 October 2025).
- United Nations. The Sustainable Development Goals; United Nations: New York, NY, USA, 2025; Available online: https://www.un.org/sustainabledevelopment/development-goals/ (accessed on 12 January 2026).
- Ma, F.; Wang, H.; Tzachor, A.; Hidalgo, C.A.; Schandl, H.; Zhang, Y.; Zhang, J.; Chen, W.-Q.; Zhao, Y.; Zhu, Y.-G.; et al. The Disparities and Development Trajectories of Nations in Achieving the Sustainable Development Goals. Nat. Commun. 2025, 16, 1107. [Google Scholar] [CrossRef] [Scilit]
- Warchold, A.; Pradhan, P.; Kropp, J.P. Variations in Sustainable Development Goal Interactions: Population, Regional, and Income Disaggregation. Sustain. Dev. 2021, 29, 285–299. [Google Scholar] [CrossRef] [Scilit]
- Kovalchuk, O.; Berezka, K.; Zomchak, L.; Ivanytskyy, R. An Integrated Approach to Modeling the Key Drivers of Sustainable Development Goals Implementation at the Global Level. World 2026, 7, 2. [Google Scholar] [CrossRef] [Scilit]
- Biermann, F.; Hickmann, T.; Sénit, C.-A.; Beisheim, M.; Bernstein, S.; Chasek, P.; Grob, L.; Kim, R.E.; Kotzé, L.J.; Nilsson, M.; et al. Scientific Evidence on the Political Impact of the Sustainable Development Goals. Nat. Sustain. 2022, 5, 795–800. [Google Scholar] [CrossRef] [Scilit]
- Shao, C.; Chen, S.; Zhan, X. Sustainable Development Agenda: Historical Evolution, Goal Progression, and Future Prospects. Sustainability 2026, 18, 948. [Google Scholar] [CrossRef] [Scilit]
- Ordonez-Ponce, E. Exploring the Impact of the Sustainable Development Goals on Sustainability Trends. Sustainability 2023, 15, 16647. [Google Scholar] [CrossRef] [Scilit]
- Xu, Z.; Chen, X.; Jiang, Q.; Wu, X.; Bhattarai, N.; Mullen, J.; Li, Z.B.; Gurney, G.G.; Li, S.; Li, C.; et al. Assessing Global Sustainability Performance, Imbalance, and Coordination over Space and Time. Nat. Commun. 2025, 16, 9186. [Google Scholar] [CrossRef] [Scilit]
- Komarulzaman, A.; Andoyo, R.; Anna, Z.; Ghina, A.A.; Halim, P.R.; Napitupulu, H.; Karunia, M.R.; Andriani, A. Achieving Zero Stunting: A Sustainable Development Goal Interlinkage Approach at District Level. Sustainability 2023, 15, 8890. [Google Scholar] [CrossRef] [Scilit]
- Rusdiyanto, E.; Pariyanti, E. Mapping the Field of Sustainable Slum Upgrading: A Comprehensive Bibliometric Analysis of Global Practices. Eur. J. Sustain. Dev. Res. 2025, 9, em0330. [Google Scholar] [CrossRef] [Scilit]
- Kroll, C.; Warchold, A.; Pradhan, P. Sustainable Development Goals (SDGs): Are We Successful in Turning Trade-Offs into Synergies? Palgrave Commun. 2019, 5, 140. [Google Scholar] [CrossRef] [Scilit]
- Xiao, H.; Bao, S.; Ren, J.; Xu, Z.; Xue, S.; Liu, J. Global Transboundary Synergies and Trade-Offs among Sustainable Development Goals from an Integrated Sustainability Perspective. Nat. Commun. 2024, 15, 500. [Google Scholar] [CrossRef] [Scilit]
- Guillamón, M.D.; Ríos, A.M.; Benito, B. Understanding the Factors Influencing SDG Achievement Across Nations. Sustain. Dev. 2025, 33, 5336–5350. [Google Scholar] [CrossRef] [Scilit]
- Ríos, A.M.; Raimo, N.; Benito, B.; Vitolla, F.; Guillamón, M.D. Governing for the Goals: How Governance Quality Shapes the Achievement of the Sustainable Development Goals. Sustain. Dev. 2026, 34, 422–436. [Google Scholar] [CrossRef] [Scilit]
- Barbier, E.B.; Burgess, J.C. Natural Capital, Institutional Quality and SDG Progress in Emerging Market and Developing Economies. Sustainability 2023, 15, 3055. [Google Scholar] [CrossRef] [Scilit]
- Simangan, D.; Lee, C.Y.; Sharifi, A.; Candelaria, J.L.; Kaneko, S. A Global Analysis of Interactions between Peace and Environmental Sustainability. Earth Syst. Gov. 2022, 14, 100152. [Google Scholar] [CrossRef] [Scilit]
- Ozughalu, U.M.; Ozughalu, J.N. Child Deprivation and Multidimensional Child Poverty among Children under Five Years in an Urban Slum in Enugu State, Nigeria: Evidence Based on Health, Housing and Sanitation Dimensions and Indicators. Child Indic. Res. 2026, 19, 631–663. [Google Scholar] [CrossRef] [Scilit]
- Vidhyadharan, A. Disparities in Drinking Water and Sanitation in the Urban Slums of Kerala, India. Sustainability 2023, 15, 7559. [Google Scholar] [CrossRef] [Scilit]
- Kanmodi, K.K.; Amzat, J.; Nnyanzi, L.A. The State of Global Research on Poverty after SDG Declaration. Public Health Chall. 2023, 2, e110. [Google Scholar] [CrossRef] [Scilit]
- Hamid, A.; AlObaid, R.O.H. Achieving Sustainable Development Goals: Do Governance and Foreign Direct Investment Matter? Humanit. Soc. Sci. Commun. 2025, 12, 1727. [Google Scholar] [CrossRef] [Scilit]
- Sever, S.D.; Tok, E.; Sellami, A.L. Sustainable Development Goals in a Transforming World: Understanding the Dynamics of Localization. Sustainability 2025, 17, 2763. [Google Scholar] [CrossRef] [Scilit]
- Murtyas, S.; Handayani, K.N.; Sho, K.; Hagishima, A. Exploring Pro-Environmental Behaviors and Health-Oriented Mindsets in Urban Slum Upgrading Projects: A Case Study of Surakarta City, Indonesia. Urban Sci. 2025, 9, 131. [Google Scholar] [CrossRef] [Scilit]
- Hickmann, T.; Biermann, F.; Spinazzola, M.; Ballard, C.; Bogers, M.; Forestier, O.; Kalfagianni, A.; Kim, R.E.; Montesano, F.S.; Peek, T.; et al. Success Factors of Global Goal-Setting for Sustainable Development: Learning from the MDGs. Sustain. Dev. 2023, 31, 1214–1225. [Google Scholar] [CrossRef] [Scilit]
- Forestier, O.; Kim, R.E. Cherry-Picking the Sustainable Development Goals: Goal Prioritization by National Governments and Implications for Global Governance. Sustain. Dev. 2020, 28, 1269–1278. [Google Scholar] [CrossRef] [Scilit]
- Swain, R.B.; Ranganathan, S. Modeling Interlinkages between Sustainable Development Goals Using Network Analysis. World Dev. 2021, 138, 105136. [Google Scholar] [CrossRef] [Scilit]
- Di Lucia, L.; Slade, R.; Khan, J. Decision-Making Fitness of Methods to Understand Sustainable Development Goal Interactions. Nat. Sustain. 2022, 5, 131–138. [Google Scholar] [CrossRef] [Scilit]
- World Bank. Poverty Headcount Ratio at National Poverty Lines (% of Population). Available online: https://data.worldbank.org/indicator/SI.POV.NAHC (accessed on 31 January 2026).
- Food and Agriculture Organization of the United Nations. Suite of Food Security Indicators; FAOSTAT: Rome, Italy, 2020; Available online: https://www.fao.org/faostat/en/#data/FS (accessed on 31 January 2026).
- World Health Organization. Dying Between the Exact Ages 30 and 70 Years from Cardiovascular Diseases, Cancer, Diabetes, or Chronic Respiratory Diseases, Probability (SDG 3.4.1). Available online: https://www.who.int/data/gho/data/indicators/indicator-details/GHO/probability-of-dying-between-exact-ages-30-and-70-from-any-of-cardiovascular-disease-cancer-diabetes-or-chronic-respiratory-%28-%29? (accessed on 22 March 2026).
- UNESCO Institute for Statistics. Government Expenditure on Education as a Percentage of GDP (SDG 4 Monitoring). Available online: https://databrowser.uis.unesco.org/browser/EDUCATION/UIS-SDG4Monitoring (accessed on 31 January 2026).
- World Bank. Methodology: Women, Business and the Law. Available online: https://wbl.worldbank.org/en/data/methodology (accessed on 22 March 2026).
- World Bank. People Using at Least Basic Sanitation Services (% of Population) (SH.STA.BASS.ZS). Available online: https://data.worldbank.org/indicator/SH.STA.BASS.ZS (accessed on 22 March 2026).
- World Bank. Renewable Energy Consumption (% of Total Final Energy Consumption) (EG.FEC.RNEW.ZS). Available online: https://data.worldbank.org/indicator/EG.FEC.RNEW.ZS (accessed on 31 January 2026).
- World Bank. Unemployment, Total (% of Total Labor Force) (Modeled ILO Estimate) (SL.UEM.TOTL.ZS). Available online: https://data.worldbank.org/indicator/SL.UEM.TOTL.ZS (accessed on 31 January 2026).
- Arvis, J.-F.; Wiederer, C.; Herrera Dappe, M.; Ulybina, D. Connecting to Compete 2025: The New Logistics Performance Indicators 2.0; World Bank: Washington, DC, USA, 2026; Available online: https://documents.worldbank.org/en/publication/documents-reports/documentdetail/099042226142014971 (accessed on 22 March 2026).
- World Bank. Account Ownership at a Financial Institution or with a Mobile-Money-Service Provider (% of Population Ages 15+) (FX.OWN.TOTL.ZS). Available online: https://data.worldbank.org/indicator/FX.OWN.TOTL.ZS (accessed on 31 January 2026).
- United Nations Sustainable Development Solutions Network. Sustainable Development Report 2024; SDSN: Paris, France, 2024; Available online: https://files.unsdsn.org/sustainable-development-report-2024.pdf (accessed on 31 January 2026).
- Horizon Group; Vantage Research. Future Possibilities Index 2024. Available online: https://futurepossibilitiesindex.com/ (accessed on 31 January 2026).
- Our World in Data. CO2 Emissions per Capita. Available online: https://ourworldindata.org/grapher/co-emissions-per-capita (accessed on 31 January 2026).
- Ocean Health Index. Methodology Overview. Available online: https://oceanhealthindex.org/methodology/ (accessed on 31 January 2026).
- Forest Landscape Integrity Index. Available online: https://www.wcs.org/our-work/forest-landscape-integrity-index (accessed on 31 January 2026).
- Institute for Economics and Peace. 2025 Global Peace Index Map and Data. Available online: https://www.visionofhumanity.org/maps/#/ (accessed on 31 January 2026).
- World Bank. Statistical Performance Indicators (SPI): Overall Score (Scale 0–100) (IQ.SPI.OVRL). Available online: https://data.worldbank.org/indicator/IQ.SPI.OVRL (accessed on 31 January 2026).
- World Bank. Understanding Country Income: World Bank Group Income Classifications for FY26 (July 1, 2025–June 30, 2026). Available online: https://blogs.worldbank.org/en/opendata/understanding-country-income--world-bank-group-income-classifica (accessed on 31 January 2026).
- Martin, A.R.; Adamov, T.C.; Merce, I.; Brad, I.; Gordan, M.-I.; Iancu, T. A Beta Regression Approach to Modelling Country-Level Food Insecurity. Foods 2025, 14, 2997. [Google Scholar] [CrossRef] [Scilit]
- Ikotun, A.M.; Ezugwu, A.E.; Abualigah, L.; Abuhaija, B.; Heming, J. K-Means Clustering Algorithms: A Comprehensive Review, Variants Analysis, and Advances in the Era of Big Data. Inf. Sci. 2023, 622, 178–210. [Google Scholar] [CrossRef] [Scilit]
- Qu, L.; Pei, Y. A Comprehensive Review on Discriminant Analysis for Addressing Challenges of Class-Level Limitations, Small Sample Size, and Robustness. Processes 2024, 12, 1382. [Google Scholar] [CrossRef] [Scilit]

Disclaimer/Publisher’s Note: The statements, opinions and data contained in all publications are solely those of the individual author(s) and contributor(s) and not of MDPI and/or the editor(s). MDPI and/or the editor(s) disclaim responsibility for any injury to people or property resulting from any ideas, methods, instructions or products referred to in the content. |
© 2026 by the authors. Licensee MDPI, Basel, Switzerland. This article is an open access article distributed under the terms and conditions of the Creative Commons Attribution (CC BY) license.