


Abstract
Critical raw materials are important inputs for the energy, digital, and industrial transformation of the European Union, while the supply chains of several raw materials remain geographically concentrated. This study aimed to analyze the development of trading-partner concentration for selected critical and strategic raw materials in the EU27 and Slovakia over the period 2014–2025. Based on Eurostat COMEXT data, selected product groups of aluminum, lithium, copper, baryte, antimony, natural graphite, nickel, and cobalt were analyzed, representing different stages of their value chains. Trading partner concentration was assessed using CR1, CR3, and the Herfindahl–Hirschman Index (HHI), while temporal trends were evaluated using the Mann–Kendall test and Sen’s slope. Correlations between import quantities and their changes were assessed with multiple-testing correction and sensitivity analyses. The results reveal substantial differences among individual raw materials, processing stages, and between the EU27 and Slovakia. At the EU27 level, considering extra-EU imports, statistically significant decreases in concentration were observed, for example, for selected aluminum products, lithium carbonates, and both analyzed nickel product groups, whereas other product groups remained highly concentrated or showed no statistically significant monotonic trend. Three correlations remained significant after false discovery rate correction, but two were sensitive to individual observations or anomalous trade records. The Slovak import structure, encompassing intra- and extra-EU trade, was characterized, for several products, by a smaller number of trading partners, higher concentration, and greater year-to-year variability. Changes in dominant trading partners also showed that a change in the leading partner was not necessarily accompanied by a reduction in overall concentration. The results highlight the need to assess trading partner concentration in the context of the specific raw material and the relevant stage of the value chain. They provide an empirical basis for discussing supply chain diversification and resilience in the context of the Critical Raw Materials Act.
1. Introduction
The European Union’s transition toward a low-carbon and resource-efficient economy is increasing the importance of stable access to mineral raw materials required for energy, digital, and industrial technologies. The European Green Deal identified access to resources as a strategic issue and the secure and sustainable supply of critical raw materials as one of the prerequisites for the green transition [1]. Particular emphasis is placed on diversifying both primary and secondary sources of supply.
In recent decades, interest in assessing raw material criticality has increased, reflecting the growing emphasis on security of supply, particularly in economies that are highly dependent on imports of mineral raw materials, as well as growing concerns about the geographical concentration of global supply chains [2]. Criticality is a multidimensional concept that may encompass supply risk, vulnerability to supply disruptions, and other economic or environmental factors [3]. At the global level, there is no single approach to identifying and classifying critical and strategic raw materials. Different countries and institutions use methodologies that vary in their scope of assessment, selection of indicators, aggregation methods, and terminology [4,5,6]. In the European context, raw material criticality is assessed primarily based on economic importance and supply risk, while the EU methodology has been progressively refined to maintain comparability across assessments and to monitor changes in criticality over time [7,8].
Securing access to critical and strategic raw materials is also part of the economic and industrial strategies of countries outside the EU, including the United States and Canada [9,10]. Their measures focus on diversifying supply sources, developing domestic extraction and processing capacities, and strengthening supply chains. Related research also addresses the recovery of critical metals associated with coal, as examined by Zhang et al. [11], and the current state and development prospects of China’s tin industry, as analyzed by Chu et al. [12].
In recent years, European raw materials policy has gradually shifted from identifying critical raw materials toward strengthening the resilience of entire value chains. The 2020 Action Plan on Critical Raw Materials emphasized the need to develop resilient industrial value chains, reduce dependence on primary critical raw materials, support domestic extraction and processing, and diversify supplies from third countries [13]. This policy direction was further developed through Regulation (EU) 2024/1252—the Critical Raw Materials Act—which established a regulatory framework for secure, resilient, and sustainable supplies of critical raw materials in the EU [14].
Assessing raw material criticality is a methodologically complex task. In their comparison of 15 approaches to supply risk assessment, Achzet and Helbig [15] highlighted substantial heterogeneity in the indicators used, their weighting, and aggregation methods. Supply risk assessment includes, among other factors, production concentration, import dependence, substitution possibilities, recycling, and the characteristics of countries of origin [16]. Supply concentration therefore represents one of the key components in assessing the vulnerability of raw material supply chains, and it is commonly quantified using the Herfindahl–Hirschman Index (HHI) or the shares of the largest producers or suppliers [17].
Previous research on critical raw materials has largely focused on assessing supply risk, import dependence, the criticality of individual metals, and future demand associated with the energy transition. Building on this foundation, a growing number of studies have applied criticality assessment methodologies to specific green-transition technologies, linking indicators of supply concentration, import dependence, and economic importance with expected demand trends and the objectives of European raw materials policy [18,19]. Attention has also been given to options for reducing supply risk in the context of EU policies, including assessments of the potential to achieve the benchmarks established by the Critical Raw Materials Act and the need for differentiated strategies for individual raw materials [20].
Existing analyses document the high geographical concentration of critical raw material supplies to the EU and highlight differences across individual stages of the value chain, particularly between extraction and processing [21]. Empirical studies have also examined the long-term development of EU trade flows and import relationships for selected critical raw materials [22]. In this context, there is scope to complement existing approaches by jointly assessing import concentration among trading partners, its temporal development, and changes in the leading trading partner countries across multiple raw materials and value-chain stages, including a comparison between the EU27 and an individual Member State.
The aim of this study is to analyze the development of trading-partner concentration for selected critical and strategic raw materials in the EU27 and Slovakia over the period 2014–2025. The analysis covers selected product groups representing different stages of the raw material value chains of aluminum, lithium, copper, baryte, antimony, natural graphite, nickel, and cobalt. Concentration is assessed using the concentration ratio for the largest trading partner (CR1), the concentration ratio for the three largest trading partners (CR3), and the Herfindahl–Hirschman Index (HHI), while its temporal development is evaluated using the Mann–Kendall test and Sen’s slope. Attention is given to changes in the leading trading partners and to comparing developments between the EU27 and Slovakia. The contribution of this study lies in the combined assessment of trading-partner concentration, its temporal trends, and changes in the leading trading partners across multiple raw materials and stages of their value chains within a unified analytical framework. The results are subsequently interpreted in the context of the EU regulatory framework for critical raw materials and changes in the structure of supplier relationships.
2. Materials and Methods
This study analyzes the development of supplier-country concentration for selected raw materials in three consecutive steps. In the first step, relevant legislative, strategic, scientific, and professional materials were analyzed. The second step involved the selection of the raw materials to be examined and data collection. In the third step, the data were processed and analyzed, and the results were subsequently interpreted within a broader scientific and regulatory context.
2.1. Policy and Regulatory Framework
2.1.1. European Union Legislative Framework for Critical Raw Materials
EU policy on critical raw materials has its roots in the 2008 Raw Materials Initiative [23], which established a framework for addressing issues related to the availability of raw materials for the European economy. Building on this framework, the European Commission adopted the first list of 14 critical raw materials in 2011 [24] and introduced its regular update at least every three years [25]. The number of raw materials identified as critical has gradually changed across successive assessments (Table 1).
Table 1.
Development of the EU list of critical raw materials.
This development may also be related to the growing importance of critical raw materials for energy and digital transition technologies and to increased attention to risks arising from the geographical concentration of their extraction and processing in a limited number of countries [28,29,30].
A key legislative instrument of current EU raw materials policy is Regulation (EU) 2024/1252 of the European Parliament and of the Council of 11 April 2024, known as the Critical Raw Materials Act (CRMA) [14], which establishes a framework for ensuring secure, resilient, and sustainable supplies of critical raw materials in the EU. The Regulation focuses on strengthening EU capacities for extraction, processing, and recycling, diversifying external supplies, and monitoring risks in supply chains, while also supporting circularity and the sustainable use of critical raw materials. Within these objectives, the CRMA sets 2030 benchmarks for strategic raw materials, aiming for overall EU capacities to approach or reach levels corresponding to at least 10% of annual consumption through extraction, 40% through processing, and 25% through recycling, while no more than 65% of the EU’s annual consumption of each strategic raw material at any relevant stage of processing should originate from a single third country [31].
2.1.2. Slovakia Within the European Critical Raw Materials Strategy
At the national level, the Slovak Republic addresses the requirements of the CRMA through the National Programme for the Exploration of Critical Mineral Raw Materials of the Slovak Republic [32]. The programme establishes a framework for the systematic acquisition and updating of geological information on occurrences of critical raw materials and was subsequently further developed through the Action Plan for the Exploration of Critical Mineral Raw Materials for 2026–2030 [33].
The importance of secure raw material supplies is also reflected in the Programme Statement of the Government of the Slovak Republic, which identifies the availability and security of energy and raw material supplies as one of the basic prerequisites for sustainable development and economic competitiveness. The document also anticipates increasing demand for strategic raw materials and emphasizes the role of economic policy and economic diplomacy in ensuring their availability [34].
2.2. Data Collection
The second step of the methodology involved selecting the raw materials for analysis, identifying the corresponding product groups using Harmonized System (HS) and Combined Nomenclature (CN) product codes, and collecting international trade data. Based on a review of relevant EU and national documents concerning critical and strategic raw materials, eight raw materials were selected: aluminum, lithium, copper, baryte, antimony, natural graphite, nickel, and cobalt. The selection considered their classification as critical and/or strategic raw materials under the EU regulatory framework, their relevance to energy transition technologies, and their geological or economic relevance in Slovakia. For each raw material, product groups corresponding to selected stages of the value chain were identified, with a focus on raw materials and products of primary processing.
Import data were obtained from the Eurostat COMEXT database [35] (dataset “EU trade since 1988 by HS2-4-6 and CN8”, ds-045409) for the period 2014–2025 using HS and CN product codes according to the product classification available in the dataset. The data were extracted between 13 and 24 September 2026 using an annual frequency, the IMPORT trade flow, and the indicators VALUE_IN_EUROS and QUANTITY_IN_100KG. For unwrought, non-alloyed aluminum (HS 760110), the six-digit HS subheading was used to ensure comparability over the period 2014–2025, as the former CN code 76011000 was subdivided into CN 76011010 and CN 76011090 in 2023. The selected raw materials, corresponding codes, product groups, and their assignment to individual stages of the supply value chain are presented in Appendix A (Table A1). The 2014–2025 period was selected to capture developments in trade concentration from the publication of the second EU list of critical raw materials in 2014, through the adoption and entry into force of the Critical Raw Materials Act (CRMA) in 2024, to 2025, the first full calendar year following its entry into force.
For the EU27, imports from individual non-EU countries were analyzed using the EU27_2020 geographical aggregate throughout the entire study period. To maintain a consistent geographical composition, the United Kingdom was therefore treated as an external trading partner throughout the analysis. For Slovakia, imports from all individual partner countries were included, covering both intra-EU and extra-EU trade, while aggregated or otherwise unspecified partner categories were excluded from the analysis.
This distinction reflects the different analytical focus at the two levels. The EU27 analysis assesses the concentration of the Union’s external trading partners, whereas the analysis of Slovakia captures the concentration of its direct trading partners, including imports within the EU internal market. Accordingly, the objective is not to directly compare dependence on third-country suppliers between the EU27 and Slovakia, but to assess trading-partner concentration within differently defined trade structures at the Union and Member State levels. Consequently, the resulting indicators should not be interpreted as directly comparable measures of dependence on third countries.
For each year, product group, and partner country, data on import quantity and value were obtained. Quantities reported in the Eurostat database in units of 100 kg were converted to tonnes by multiplying by a factor of 0.1, while value data were retained in euros. Concentration indicators were calculated based on import quantities, including only records with positive reported import quantities. Blank entries were excluded from aggregation and were not automatically interpreted as confirmed zero imports. Concentration indicators were not calculated for years in which no positive reported import quantity was available.
2.3. Data Processing and Analysis
In the third step, the data were processed to quantify trading-partner concentration and assess its temporal development over the period 2014–2025. For the individual product groups, the Concentration Ratio (CR1 and CR3) and the Herfindahl–Hirschman Index (HHI) were calculated. The temporal development of these indicators was subsequently evaluated using the Mann–Kendall test and Sen’s slope. The statistical analysis also included the estimation of 95% confidence intervals for Sen’s slope and accounted for the availability of valid annual observations. Correlation analysis was performed to assess relationships among import quantities across individual product categories and the co-movement of their year-on-year changes. All statistical calculations were performed using Microsoft Excel.
2.3.1. Concentration Ratio (CR)
The CR is one of the basic indicators used to assess market concentration and expresses the combined share of a specified number of the largest participants in the total market [36]. In the context of this study, the participants are individual trading partner countries, and the CR therefore represents the share of the largest trading partners in the total import quantity of the analyzed raw material or product (Equation (1)). The advantage of this indicator is its straightforward interpretation, as it directly captures the extent to which the import structure is concentrated among a limited number of the largest trading partners. Its limitation is that it does not account for the distribution of shares among the remaining trading partners [37].
The concentration ratio (CR) is defined as follows [36]:
where k represents the number of the largest trading partner countries included in the calculation, m is the total number of countries with positive reported import quantities, and si is the percentage share of the i-th country in the total import quantity, with countries ranked in descending order of their shares.
In this study, CR1 and CR3 were calculated, representing the shares of the largest trading partner country and the three largest trading partner countries, respectively, in total imports. Where fewer than three countries reported positive import quantities in a given year, CR3 was calculated using all available suppliers and therefore equalled 100%. For years without any positive reported import quantity, concentration indicators were not calculated. CR values range from 0 to 100%, with higher values indicating greater import concentration among a limited number of trading partners, whereas lower values indicate a more diversified import structure.
2.3.2. Herfindahl–Hirschman Index (HHI)
The Herfindahl–Hirschman Index (HHI) is one of the standard indicators used to assess market concentration. The index builds on concentration measures introduced by Hirschman [38] in the context of foreign trade and Herfindahl [39] in the context of industrial concentration.
To calculate the share of individual trading partner countries, the general market-share formula was adapted to the import context (Equation (2)).
where si represents the percentage share of the i-th trading partner country in total import quantity, Mi is the quantity imported from country i, and M is the total quantity imported from all trading partner countries with positive reported import quantities included in the analysis.
The calculated si values were subsequently used to compute the concentration indicators. The HHI was calculated as the sum of the squared shares of all trading partners included in the analysis (Equation (3)) [37].
where m represents the total number of trading partner countries with positive reported import quantities included in the analysis.
A higher share of an individual trading partner indicates greater concentration of imports from that country and may imply greater exposure to disruptions affecting the corresponding trade flow [15,40].
In this study, trading partner shares were expressed as percentages; therefore, the HHI ranges from values close to 0 for a highly diversified import supply structure to 10,000 in the case of complete concentration of imports on a single trading partner. Unlike CR1 and CR3, the HHI accounts for the shares of all trading partner countries included in the analysis and, because the shares are squared, assigns greater weight to the largest trading partners. Higher HHI values therefore indicate greater import concentration, whereas lower values indicate a more diversified import structure.
The HHI is also used to assess the concentration of mineral production and trade flows based on the shares of individual countries. Cehlár and Šimková [41] applied it to the concentration of producing countries for several critical raw materials, including baryte, while its use in assessing the geopolitical supply risk of metals was also documented by Habib et al. [42]. In the European Commission methodology for assessing raw material criticality, an extended form of the HHI is used, combining supply concentration with indicators of country governance quality and trade restrictions [14,43].
2.3.3. Trend Analysis
To assess the temporal development of the concentration indicators, the nonparametric Mann–Kendall test [44,45] was applied. This test enables the detection of a monotonic trend in a time series without assuming a normal distribution of the data. Its application has also been documented in analyses of time series of economic and commodity indicators related to metals and mineral raw materials [46]. The test was applied to the annual CR1, CR3, and HHI values for the period 2014–2025, using only years with valid concentration indicator values. The number of valid observations (n) was determined separately for each time series.
The Mann–Kendall statistic S was calculated using the following equation (Equation (4)).
where xi and xj represent the values of the analyzed indicator in individual years, and n is the number of valid observations. A positive value of S indicates a predominance of increasing changes in the analyzed indicator, whereas a negative value indicates a predominance of decreasing changes. A value of (S = 0) indicates the absence of a clear predominance of either increasing or decreasing changes.
The variance of S was calculated using a correction for tied values, accounting for groups of identical observations within each time series. The standardized test statistic Z was subsequently determined using the variance of S and a continuity correction. For constant time series, where the variance of S was zero, the p-value was considered undefined.
The direction and magnitude of the trend were quantified using Sen’s slope [47], which is defined as the median of all pairwise slopes calculated between pairs of valid observations in the time series (Equation (5)).
where xi and xj represent the values of the analyzed indicator at time points ti and tj, respectively, with (j > i). The slope was calculated using the actual difference between the corresponding calendar years, including cases with missing intermediate observations. A positive value of β indicates an increasing trend, whereas a negative value indicates a decreasing trend.
The statistical significance of the trend was assessed using a two-sided p-value calculated from the standard normal approximation of the standardized Mann–Kendall test statistic Z, at a significance level of α = 0.05.
For time series subjected to trend analysis, the variance of the Mann–Kendall statistic S is calculated with a correction for tied observations (Equation (6)).
where n is the number of valid observations, q is the number of groups of tied observations, and tp represents the number of observations in the p-th tied group.
The standardized test statistic Z was calculated using a continuity correction (Equation (7)).
where S is the Mann–Kendall test statistic and Var(S) is its variance. For constant time series with Var(S) = 0, the p-value was considered undefined.
When (p < 0.05), the null hypothesis of no monotonic trend was rejected, and the trend was considered nominally statistically significant at the 5% significance level. When (p ≥ 0.05), the null hypothesis could not be rejected, and the trend was interpreted as statistically non-significant. No adjustment for multiple testing was applied; therefore, statistical significance refers to unadjusted p-values. To minimize floating-point precision artifacts, indicator values were rounded to ten decimal places for the identification of tied observations in the calculation of the Mann–Kendall statistic and its variance. Time series with insufficient valid observations were excluded from trend analysis and identified separately from statistically non-significant trends.
To quantify the uncertainty associated with the estimated trend magnitude, 95% confidence intervals (CIs) for Sen’s slope were estimated from the ordered pairwise slopes using a normal approximation based on the variance of the Mann–Kendall statistic, including the correction for tied observations [48]. For each time series, all pairwise slopes between valid annual observations were calculated and arranged in ascending order. The lower and upper confidence limits were determined using the corresponding rank positions derived from the Mann–Kendall variance and the critical value of 1.96 for a 95% confidence level. The resulting rank positions were rounded up to the nearest integer and restricted to the range of available pairwise slopes, without interpolation between adjacent values. For constant time series, Sen’s slope and both confidence limits were equal to zero. Cases in which the Mann–Kendall test indicated a statistically significant trend (p < 0.05), while the 95% confidence interval for Sen’s slope included zero, were interpreted with caution. Such discrepancies may arise from the discrete rank-based determination of confidence limits, particularly in borderline cases.
2.3.4. Correlation Analysis
Correlation analysis was performed on annual extra-EU import quantities into the EU27 for the period 2014–2025 to assess relationships among the analyzed product categories. The analysis included 18 product categories identified by Harmonized System (HS) and Combined Nomenclature (CN) codes, representing different raw materials and stages of processing. CN code 25309040 was excluded from the analysis due to its incomplete time series (2023–2025). A total of 153 unique pairs of product categories were evaluated.
Four analytical approaches were used to assess the relationships: (i) Pearson correlation of annual import quantities (n = 12), (ii) Spearman rank correlation of annual import quantities (n = 12), (iii) Pearson correlation of year-on-year relative changes, and (iv) Pearson correlation of logarithmic year-on-year changes (n = 11 in both cases). Relative year-on-year changes were calculated as (Qt/Qt − 1) − 1, and logarithmic changes as ln(Qt/Qt − 1), where Qt represents the import quantity of the respective product category in year t. All input import quantities were positive, ensuring that both transformations were defined. For Spearman correlation, tied values were assigned average ranks.
The statistical significance of correlation coefficients was assessed using two-sided tests at a significance level of α = 0.05. The p-values were calculated based on the t-distribution with n − 2 degrees of freedom; for Spearman correlation, a t-distribution approximation was applied. Given the simultaneous testing of 153 pairs, the Benjamini–Hochberg correction was applied separately within each of the four analytical approaches to control the false discovery rate (FDR) [49]. Results with an adjusted q-value < 0.05 were considered statistically significant.
The robustness of associations that remained statistically significant after FDR correction, as well as a selected borderline association between copper product categories, was assessed by comparing results across different correlation approaches and by sequentially excluding individual observations (leave-one-out analysis). For annual import quantities, each of the 12 yearly observations was omitted in turn, while for logarithmic year-on-year changes, each of the 11 observations was omitted in turn. For each evaluated pair, the range of correlation coefficients obtained from the leave-one-out analysis was subsequently determined.
During the examination of the source data, an exceptionally high reported import quantity of natural graphite (CN 25049000) was identified for 2023, largely influenced by a single import record from Norway to Denmark. To assess its influence, a sensitivity analysis was performed in which this record was excluded from an alternative calculation. For the pair of bauxite (CN 26060000) and natural graphite (CN 25049000), Pearson correlation coefficients for annual import quantities and logarithmic year-on-year changes, the Spearman correlation coefficient for annual import quantities, and the corresponding p-values were subsequently recalculated. The original Eurostat COMEXT data remained unchanged.
Correlation analysis was used to identify statistical associations between import quantities and to assess the co-movement of their year-on-year changes. The observed correlations do not provide evidence of causal relationships or directly measure changes in global demand for the analyzed raw materials.
3. Results
The results are presented for the selected raw materials and corresponding product groups, focusing on the development of import quantities and values, trading-partner concentration volume and its temporal evolution at the EU27 and Slovak levels. The concentration indicators CR1, CR3, and HHI for 2014 and 2025 are provided in Appendix B, in Table A2 for the EU27 and Table A3 for Slovakia. The results of the trend analysis, including the number of valid observations, calculated Mann–Kendall p-values, Sen’s slope, and its 95% confidence interval, are reported in Table A4 and Table A5 for the EU27 and Slovakia, respectively.
3.1. Aluminum Supply Chain
Within the aluminum supply chain, three product groups representing the raw material and processed stages of the chain were analyzed.
For the first group, CN 26060000, the concentration of external EU27 suppliers remained high throughout the 2014–2025 period, while no statistically significant monotonic trend was identified for CR1, CR3, or HHI. CR1 ranged approximately between 63% and 76%. In Slovakia, no statistically significant monotonic trend was identified for any of the analyzed indicators either, although the concentration indicators exhibited greater year-to-year variability.
For CN 28182000, by contrast, the Mann–Kendall test indicated decreasing concentration trends. At the EU27 level, CR1 decreased from 68.42% to 37.78% and HHI from 4952.06 to 2475.11, with all three indicators showing statistically significant downward trends according to the Mann–Kendall test. However, the CR1 result was close to the significance threshold (p = 0.047), and its 95% confidence interval for Sen’s slope included zero. A similar pattern was observed in Slovakia, where CR1 decreased from 61.16% to 45.63% and HHI from 4660.59 to 2685.41. At the same time, the volume of Slovak imports of aluminum oxide declined markedly after 2021, from approximately 313,081 tonnes in 2021 to 14,180 tonnes in 2025.
Different developments in supplier concentration were observed for CN 760110 at the EU27 and Slovak levels. In the EU27, concentration decreased: CR1 fell from 43.07% to 18.43%, CR3 from 77.92% to 47.59%, and HHI from 2521.95 to 981.10, with all three trends being statistically significant (p < 0.001). In Slovakia, CR1 and CR3 followed increasing trends: CR1 increased from 34.21% to 75.57% and CR3 from 77.99% to 96.90%, with both upward trends being statistically significant. HHI also increased between 2014 and 2025, although its monotonic trend was not statistically significant.
3.2. Lithium Supply Chain
For lithium, three product groups were analyzed according to the Combined Nomenclature: CN 25309040—Spodumene, petalite, lepidolite, amblygonite, hectorite, jadarite and similar minerals, suitable for the extraction of lithium; CN 28252000—lithium oxide and hydroxide; and CN 28369100—lithium carbonates. Due to a revision of the Combined Nomenclature, product group CN 25309040 became available as a separate item only from 2023 onward [50]. It was therefore analyzed only for the period 2023–2025 and was not included in the trend analysis.
For CN 25309040, the concentration of external EU27 suppliers was very high during 2023–2025, with CR1 exceeding 92% in all three years. Import volume decreased from approximately 21.0 thousand t in 2023 to 9.7 thousand t in 2025. In Slovakia, positive import quantities were reported only in 2023 and 2024, with no positive reported import quantity in 2025.
For CN 28252000, no statistically significant monotonic trend was identified at the EU27 level for CR1, CR3, or HHI. CR1 was 37.50% in 2014 and 36.35% in 2025. Import volume increased from approximately 2.8 thousand t to 3.4 thousand t, with a maximum of approximately 6.0 thousand t recorded in 2022. In Slovakia, imports of lithium oxide and hydroxide were very low and irregular, and no positive import quantity was reported in 2023. No statistically significant monotonic trend was identified for CR1, CR3, or HHI.
For CN 28369100, the concentration of external EU27 suppliers was higher than for lithium oxide and hydroxide but showed statistically significant decreasing trends over the study period. CR1 decreased from 83.95% in 2014 to 64.98% in 2025, CR3 from 97.26% to 87.81%, and HHI from 7154.81 to 4573.51. The downward trend was statistically significant for all three indicators. In Slovakia, the concentration of lithium carbonate suppliers remained high, with no statistically significant monotonic trend. CR1 was 98.99% in 2014 and 92.95% in 2025, while CR3 remained close to 100% during most of the study period. Import volume remained low, with a maximum of approximately 42.8 t recorded in 2022.
3.3. Copper Supply Chain
For copper, three product groups representing the ore, intermediate, and refined forms of copper were analyzed.
For CN 26030000, the composition of the three largest external trading partners of the EU27 remained largely unchanged during 2014–2025, and no statistically significant monotonic trend was identified for CR1, CR3, or HHI. CR1 decreased from 29.42% to 23.51%, while CR3 increased from 60.57% to 65.98%. In Slovakia, imports of copper ores and concentrates were practically negligible throughout the study period. A positive import quantity was reported only in 2015 (0.2 t), with no positive reported quantity in the remaining years, with only one valid annual observation (n = 1), no concentration trend analysis was performed for Slovakia for this product group.
For CN 74020000, concentration at the EU27 level showed greater year-to-year variability; however, no statistically significant monotonic trend was identified for CR1, CR3, or HHI. CR1 was 55.66% in 2014 and 62.09% in 2025, while HHI increased from 3992.15 to 5037.53. Import volume decreased over the study period from approximately 86.2 thousand t to 15.0 thousand t. In Slovakia, supplier concentration showed substantial year-to-year fluctuations, with no statistically significant trend in CR1, CR3, or HHI. Import volume was also highly variable and generally declined after 2019, apart from a temporary increase to approximately 604.6 t in 2022, reaching only 0.028 t in 2025.
For CN 74031100, no statistically significant concentration trend was identified at the EU27 level. Between 2014 and 2025, CR1 decreased from 45.12% to 39.58%, CR3 from 75.69% to 70.91%, and HHI from 2664.51 to 2347.68. In Slovakia, concentration for CN 74031100 was high. CR1 increased from 63.96% in 2014 to 89.12% in 2025, and HHI from 4720.76 to 8043.74; however, neither indicator exhibited a statistically significant monotonic trend. A statistically significant upward trend was confirmed only for CR3 (p = 0.034). At the same time, import volume decreased from approximately 16.9 thousand t in 2014 to 1.9 thousand t in 2025.
3.4. Baryte
For baryte, only one product group was analyzed.
At the EU27 level, the concentration of external trading partners remained high throughout the 2014–2025 period, with no statistically significant monotonic trend. CR1 ranged approximately between 44% and 64%, CR3 exceeded 93% throughout the period, and HHI ranged approximately between 3800 and 4900. In Slovakia, the concentration indicators exhibited greater year-to-year variability. CR1 decreased from 63.07% in 2014 to 39.10% in 2025, and HHI from 4761.15 to 3367.39; however, no statistically significant monotonic trend was identified for CR1, CR3, or HHI. CR3 remained very high during most of the period, exceeding 90% in seven of the twelve years, indicating that imports were concentrated among a limited number of major trading partners.
3.5. Antimony
In this case, three product groups representing the ore, oxide, and metallic forms of antimony were analyzed.
For antimony ores and concentrates (CN 26171000), the concentration of external EU27 trading partners increased over the study period. CR1 rose from 65.18% in 2014 to 88.90% in 2025, while HHI increased from 4722.76 to 7950.08; statistically significant upward trends were confirmed for both indicators (p = 0.007). Import volume ranged from approximately 1.1 to 2.4 thousand t per year. In Slovakia, imports of antimony ores and concentrates were very low and irregular. No positive import quantities were reported in 2022 or 2024, while in the remaining years import volumes generally remained below 20 t. The trend analysis was therefore based on ten valid annual observations. No statistically significant monotonic trend was identified for CR1 or HHI, while CR3 remained constant at 100% in all valid years.
For CN 28258000—Antimony oxides, the concentration of external EU27 trading partners decreased between 2014 and 2025, with CR1 falling from 57.28% to 36.72% and HHI from 3952.89 to 2650.07. However, the Mann–Kendall test did not confirm a statistically significant monotonic trend for any of the three concentration indicators. Import volume ranged from approximately 3.2 to 6.3 thousand t per year. In Slovakia, the concentration of antimony oxide trading partners remained very high. CR1 decreased from 98.49% in 2014 to 90.08% in 2025, while CR3 ranged approximately between 92% and 100% throughout the study period. No statistically significant monotonic trend was identified for CR1, CR3, or HHI. Import volumes were substantially lower than at the EU27 level and generally declined after 2020, although year-to-year fluctuations remained.
The most pronounced decrease in concentration at the EU27 level was observed for CN 81101000—Unwrought antimony, antimony powders. CR1 decreased from 90.67% in 2014 to 57.02% in 2025, CR3 from 96.83% to 81.71%, and HHI from 8243.67 to 3635.39. A statistically significant downward trend was confirmed for CR3 (p < 0.001) and HHI (p = 0.034), whereas the decline in CR1 was not statistically significant (p = 0.064). In Slovakia, concentration for this product group was also high and showed substantial year-to-year fluctuations, but no statistically significant monotonic trend was identified. CR3 remained very close to 100% in eight of the twelve years, indicating that imports were concentrated among a limited number of trading partner countries.
3.6. Natural Graphite
For natural graphite, two product groups belonging to the Extraction/Mining stage were analyzed.
For CN 25041000, the share of the largest external EU27 trading partner decreased from 63.56% in 2014 to 33.80% in 2025. The Mann–Kendall test indicated a borderline downward trend in CR1 (p = 0.047), although the 95% confidence interval for Sen’s slope included zero. No statistically significant monotonic trend was identified for CR3 or HHI. Import volume reached a maximum of approximately 121.4 thousand t in 2022. In Slovakia, the concentration indicators for this product group showed greater year-to-year variability. CR1 increased from 39.91% to 73.43% and HHI from 2529.06 to 5604.49 between 2014 and 2025; however, no statistically significant monotonic trend was identified for any of the analyzed indicators. Import volume ranged from approximately 0.9 to 2.2 thousand t per year over the study period.
For CN 25049000, the concentration indicators for extra-EU imports varied substantially over the study period, although the composition of the main trading partners remained relatively stable. No statistically significant monotonic trend was identified for CR1, CR3, or HHI. The year 2023 was particularly notable, when imports increased to approximately 86.7 thousand t, and concentration reached an exceptionally high level; in the following years, both import volume and concentration declined again. However, the 2023 peak was largely attributable to a potentially anomalous trade record in which Denmark reported imports of 84,089.146 t from Norway with a declared value of EUR 3. In a sensitivity analysis excluding this record, the 2023 import volume decreased to approximately 2.65 thousand t, CR1 from 96.95% to 59.96%, CR3 from 99.66% to 98.76%, and HHI from 9403.02 to 4523.79. Madagascar replaced Norway as the largest external trading partner in this scenario. Although the estimated Sen’s slopes changed, including a reversal from 24.39 to −18.90 index points per year for HHI, the Mann–Kendall test remained statistically non-significant for all three indicators in both scenarios (p ≥ 0.05). The original COMEXT data were retained in the primary analysis. The sensitivity of the correlation between bauxite and natural graphite import volumes to this record is further examined in Section 3.9. In Slovakia, concentration for CN 25049000 remained high and showed substantial year-to-year fluctuations, with no statistically significant monotonic trend. CR1 was 97.61% in 2014 and 99.48% in 2025. At the same time, import volume declined markedly from approximately 239.2 t in 2014 to 2.1 t in 2025.
3.7. Nickel and Cobalt
For nickel and cobalt, four product groups were analyzed. For both raw materials, the analysis covered the Extraction/Mining and Processing/Refining stages.
For CN 26040000, the concentration of external EU27 trading partners showed a statistically significant decrease over the 2014–2025 period. CR1 declined from 73.27% to 45.17%, CR3 from 97.32% to 87.64%, and HHI from 5670.64 to 3149.18. The downward trend was statistically significant for CR1 (p = 0.034), CR3 (p = 0.016), and HHI (p = 0.024). Import volume ranged from approximately 161 to 422 thousand t per year. In Slovakia, imports of nickel ores and concentrates were practically negligible. Positive import quantities were reported only in 2015 (0.96 t), 2020 (0.50 t), and 2023 (0.001 t). Due to the insufficient number of valid annual observations (n = 3), no concentration trend analysis was performed for this product group, and the results were evaluated descriptively only.
For CN 75021000, a statistically significant decrease in concentration was also confirmed at the EU27 level. CR1 decreased from 42.83% in 2014 to 30.07% in 2025, CR3 from 76.73% to 66.79%, and HHI from 2609.39 to 1791.29. The downward trend was statistically significant for CR1 (p = 0.007), CR3 (p = 0.002), and HHI (p = 0.003). In Slovakia, although concentration indicators exhibited year-to-year variability, no statistically significant monotonic trend was identified. CR1 ranged approximately between 37% and 72%, CR3 remained predominantly above 86%, and HHI ranged approximately between 2899 and 5677.
For CN 26050000, the concentration of external EU27 trading partners varied considerably during 2014–2025, with no statistically significant monotonic trend. CR1 decreased from 98.16% in 2014 to 72.26% in 2025, while HHI declined from 9639.43 to 5678.27. Import volume fluctuated considerably and, after reaching approximately 1.9 thousand t in 2014, remained substantially lower in subsequent years. In Slovakia, imports of cobalt ores and concentrates were negligible and irregular. No positive import quantities were reported in 2016, 2019, or 2020, while concentration generally reached very high levels in the remaining years. Based on nine valid annual observations, no statistically significant monotonic trend was identified for CR1 or HHI, whereas CR3 remained constant at 100%.
For CN 81052000, the pattern at the EU27 level was different. CR1 decreased from 90.46% in 2014 to 28.67% in 2025, HHI from 8195.32 to 1523.78, while CR3 reached 57.34% in 2025. Despite the substantial difference between the initial and final years, the Mann–Kendall test did not confirm a statistically significant monotonic trend for any of the three indicators. In Slovakia, concentration for CN 81052000 remained high. CR1 was 99.04% in 2014 and 90.22% in 2025, while no statistically significant monotonic trend was identified for CR1, CR3, or HHI.
3.8. Changes in Suppliers
During the 2014–2025 period, the analyzed product groups differed in the stability of their main external EU27 suppliers. For some groups, the dominant supplier remained stable throughout all or most of the study period, whereas others experienced more pronounced changes, particularly in the latter part of the time series. Detailed information on the main supplier countries and changes in their dominance is provided in Appendix B, in Table A6 for the EU and Table A7 for Slovakia.
3.8.1. EU
The analysis of external EU27 suppliers during 2014–2025 revealed differences in the stability of leading trading partners across the examined product groups. While some CN codes were characterized by a stable position of the dominant supplier, others exhibited changes in supplier rankings over time. Figure 1 illustrates these developments for four selected product groups, representing aluminum, nickel, copper, and natural graphite.
Figure 1.
Changes in the ranking of selected major external suppliers to the EU27 during 2014–2025: (a) unwrought non-alloyed aluminum (CN 760110); (b) unwrought non-alloyed nickel (CN 75021000); (c) copper ores and concentrates (CN 26030000); (d) natural graphite (CN 25049000). Rankings are based on import quantity, with rank 1 indicating the largest external supplier. Gaps indicate years in which the respective supplier ranked outside the top five.
Aluminum: Within the aluminum supply chain, the stability of the dominant external supplier varied considerably across individual product groups. For CN 26060000, the position of the main supplier remained stable throughout the entire 2014–2025 period, with Guinea as the dominant supplier. For CN 28182000, the supplier structure was more variable: Jamaica dominated until 2021, after which Australia, Bosnia and Herzegovina, Jamaica again, and Indonesia in 2025 successively occupied the leading position. The most pronounced change occurred for CN 760110, where Russia was the largest external supplier until 2022, while India, Mozambique, and Canada successively became the leading suppliers during 2023–2025 (Figure 1a).
Lithium: For CN 25309040, the position of the main external supplier remained stable during 2023–2025, with Australia dominating in all three years. For CN 28252000, the dominant supplier changed repeatedly over the study period: Chile held the leading position in 2014, followed by alternating dominance of Russia and Switzerland; China dominated in 2023–2024, and Australia in 2025. For CN 28369100, Chile remained the largest external supplier throughout the entire 2014–2025 period, while the United States and Argentina were among the other major suppliers.
Copper: For CN 26030000, Chile remained the largest external EU27 supplier from 2014 to 2021, was replaced by Brazil during 2022–2024, and returned to the leading position in 2025. Peru and Brazil were among the other major suppliers (Figure 1c). For CN 74020000, the dominant supplier changed mainly during the first part of the study period: Chile held the leading position in 2014–2015, Zambia in 2016, and Namibia from 2017 through 2025. For CN 74031100, the leading position alternated mainly between Chile and Russia. Russia dominated in 2016–2019, 2021, and 2022, whereas Chile held the leading position in 2014–2015, 2020, and 2023–2024. In 2025, the Democratic Republic of the Congo became the largest external supplier.
Baryte: At the EU27 level, the supplier structure remained stable during most of the study period. China was the largest external supplier in all years except 2023, when Morocco took the leading position. China, Morocco, and Türkiye consistently ranked among the three main suppliers throughout the entire period.
Antimony: For CN 26171000, Türkiye remained the largest external EU27 supplier throughout the entire period, with the sole exception of 2019, when Bolivia moved into the leading position. For CN 28258000, China dominated throughout the entire period, while South Korea and Bolivia were among the other major suppliers. For CN 81101000, China was the largest supplier from 2014 to 2019, whereas Tajikistan took over the leading position from 2020 onward.
Natural graphite: For CN 25041000, China remained the largest external EU27 supplier throughout the entire 2014–2025 period. Brazil, Norway, Mozambique, and Madagascar were among the other major suppliers. For CN 25049000, China dominated from 2014 to 2020, was replaced by Madagascar in 2021, and returned to the leading position in 2022. A pronounced shift occurred in 2023, when Norway became the dominant supplier. Norway’s leading position in 2023 should be interpreted with caution, as it was substantially influenced by a potentially anomalous import record identified in the COMEXT data (Section 3.9). China again became the largest supplier in 2024, while Madagascar held the leading position in 2025. Brazil also ranked among the three largest external suppliers in several years, including 2024–2025 (Figure 1d).
Nickel: For CN 26040000, Canada was the largest external EU27 supplier in most years. Exceptions were 2014, when South Africa dominated, 2021, when Côte d’Ivoire held the leading position, and 2023, when Brazil became the largest supplier. For CN 75021000, Russia dominated during most of the 2014–2022 period, except in 2017, when Norway held the leading position. From 2023 to 2025, Norway remained the largest external supplier (Figure 1b).
Cobalt: For CN 26050000, the supplier structure was highly variable: Russia dominated in 2014, Japan in 2015–2017, South Korea in 2018, China in 2019, the United Kingdom in 2020, and the United States in 2021–2022. In 2023, the United Kingdom temporarily returned to the leading position, while the United States again dominated in 2024–2025. For CN 81052000, the Democratic Republic of the Congo dominated in 2014–2015. The leading position subsequently changed several times, but from 2020 through 2025 the United States consistently remained the largest supplier.
3.8.2. Slovakia
At the national level, the analysis revealed considerable differences in the composition and stability of Slovakia’s main import partners across the examined product groups.
Aluminum: In Slovakia, the supplier structure within the aluminum supply chain was more variable than at the EU27 level. For CN 26060000, the dominant supplier changed over the study period, with Hungary taking the leading position from 2021 onward. For CN 28182000, the Netherlands dominated until 2022, Germany in 2023–2024, and the Netherlands again in 2025. The greatest variability was observed for CN 760110, where several suppliers successively held the leading position, including Belgium, Poland, the United Kingdom, Czechia, and Italy. Poland dominated in 2022–2024, while Italy became the leading supplier in 2025.
Lithium: For CN 25309040, almost all recorded imports in 2023 originated from Hungary, Germany was the sole supplier in 2024, and no imports of this product group were recorded in 2025. For CN 28252000, imports were low and irregular, and the dominant supplier changed frequently over the study period. Poland, China, Germany, Russia, the United Kingdom, and, in 2025, Chile successively appeared in the leading position, while no imports were recorded in 2023. For CN 28369100, Czechia dominated in 2014–2018, Austria in 2019–2022, and Germany from 2023 onward.
Copper: For CN 26030000, Slovak imports were practically negligible throughout the study period. A nonzero volume was recorded only in 2015, when Italy was the sole supplier, while in 2025 only a very low import value was recorded with zero reported quantity. For CN 74020000, the dominant supplier changed repeatedly over the study period. Czechia, the Democratic Republic of the Congo, Belgium, Kazakhstan, South Africa, Austria, Germany, Romania, and Israel successively held the leading position, indicating a highly variable supplier structure. For CN 74031100, Austria dominated in 2015–2016, while Germany remained the largest supplier consistently from 2017 through 2025.
Baryte: In Slovakia, the supplier structure was more variable. Germany was the largest supplier from 2014 to 2020, China took the leading position in 2021, Czechia in 2022, and China again from 2023 to 2025.
Antimony: For CN 26171000, imports were very low and irregular. Poland dominated from 2014 to 2020, while Czechia was the main supplier from 2021 onward in most years. No imports were recorded in 2022 or 2024. For CN 28258000, Czechia dominated from 2014 to 2020, Poland in 2021–2022, Czechia again in 2023–2024, and Poland in 2025. For CN 81101000, the dominant supplier changed during the first part of the period, with Sweden prevailing from 2017 onward, except in 2022, when the Netherlands dominated, and in 2025, when Czechia took the leading position.
Natural graphite: For CN 25041000, the dominant supplier changed several times over the study period. Until 2021, the leading position alternated mainly among Germany, Russia, and Ukraine; Madagascar dominated in 2022, while Germany was the largest supplier from 2023 to 2025. For CN 25049000, the supplier structure was also variable. Poland dominated in most years between 2014 and 2022, except in 2015 and 2017, when Russia and Hungary, respectively, held the leading position. Germany dominated in 2023–2024, and Czechia in 2025.
Nickel: For CN 26040000, imports were practically negligible. Nonzero imports were recorded only in 2015, 2020, and 2023, with Germany as the dominant supplier in 2015 and Czechia in 2020 and 2023. For CN 75021000, Germany was the largest supplier in most years. Exceptions were 2014, when the United Kingdom dominated, 2018 with Czechia, and 2019 with Luxembourg. From 2020 through 2025, Germany remained the dominant supplier.
Cobalt: For CN 26050000, imports were highly irregular. During 2014–2018, the United Kingdom dominated in years with nonzero imports, while no imports were recorded in 2016. No imports were recorded in 2019 or 2020 either. The United Kingdom again dominated in 2021, followed by Germany in 2022–2023, Türkiye in 2024, and Australia in 2025. For CN 81052000, the dominant supplier changed more frequently: Germany in 2014, France in 2015, Belgium in 2016, France in 2017–2018, Germany in 2019, the United Kingdom in 2020–2023, and France in 2024–2025.
3.9. Correlation Analysis of Import Volumes
The correlation analysis of annual import quantities for 18 product categories identified by HS and CN codes over the period 2014–2025 included 153 unique pairs. Pearson correlation of annual import quantities identified 15 nominally statistically significant pairs (p < 0.05), of which two remained significant after Benjamini–Hochberg false discovery rate (FDR) correction. Spearman correlation of annual quantities identified 19 nominally significant pairs, while Pearson correlation of year-on-year relative changes identified 20 nominally significant pairs; however, none remained significant after FDR correction. For Pearson correlation of logarithmic year-on-year changes, 20 pairs were nominally significant, of which one remained significant after correction (Table 2).
Table 2.
Summary of the correlation analysis results for EU27 import quantities over the period 2014–2025.
Pearson correlation of annual import quantities identified a positive association between the cobalt product categories CN 26050000 and CN 81052000 (r = 0.975; q < 0.001). However, the robustness analysis revealed a substantial influence of the 2014 observation. After excluding this observation, the correlation coefficient changed to r = −0.63, whereas excluding any of the other years resulted in coefficients ranging from 0.97 to 0.98. Neither Spearman correlation of annual quantities (ρ = −0.27; p = 0.39) nor Pearson correlation of logarithmic year-on-year changes (r = 0.29; p = 0.39) supported the positive association identified by the original Pearson correlation.
The second association that remained statistically significant after FDR correction was identified between baryte (CN 25111000) and nickel (CN 75021000), with a Pearson correlation coefficient of r = 0.867 for annual quantities (q = 0.020). Positive correlations were also identified using Spearman correlation (ρ = 0.64; p = 0.024) and Pearson correlation of logarithmic year-on-year changes (r = 0.75; p = 0.008), although these results did not remain statistically significant after FDR correction. In the leave-one-out analysis, the correlation coefficients remained positive, ranging from 0.77 to 0.90 for Pearson correlation of annual quantities, from 0.54 to 0.77 for Spearman correlation, and from 0.55 to 0.82 for correlation of logarithmic changes.
For the copper product categories CN 74020000 and CN 74031100, a positive Spearman correlation of annual import quantities was identified (ρ = 0.85), which did not reach statistical significance after FDR correction (q = 0.064). Pearson correlation of logarithmic year-on-year changes was low (r = 0.12; p = 0.73). Both product categories also exhibited negative Spearman correlations with time (ρ = −0.77 and −0.73, respectively).
For the correlation of logarithmic year-on-year changes, a negative association was identified between bauxite (CN 26060000) and natural graphite (CN 25049000; r = −0.936; q = 0.0035). In the leave-one-out analysis, the correlation coefficient ranged from −0.95 to −0.83.
However, examination of the COMEXT data revealed an unusual reported import quantity of natural graphite in 2023. Of the total imports of approximately 86,738 t, approximately 84,089 t were attributable to a single import record from Norway to Denmark, for which a trade value of EUR 3 was reported. In the sensitivity analysis, this record was excluded from an alternative calculation, reducing the total graphite import quantity for 2023 to approximately 2648 t.
After excluding this record, the Pearson correlation of logarithmic year-on-year changes between bauxite and natural graphite changed from r = −0.936 to r = −0.458 and was no longer nominally statistically significant (p = 0.156). The absolute values of the correlations between annual import quantities also decreased (Table 3).
Table 3.
Sensitivity analysis of correlations between bauxite and natural graphite import quantities after excluding the potentially anomalous trade record from 2023.
The sensitivity analysis showed a decrease in the absolute values of all three correlation coefficients. Pearson correlations of annual import quantities and logarithmic year-on-year changes were no longer nominally statistically significant, whereas Spearman correlation of annual import quantities remained nominally significant (p = 0.0358). The negative association between bauxite and natural graphite was therefore sensitive to the identified trade record.
4. Discussion
The results presented in this study indicate that the development of trading-partner concentration was not uniform across the analyzed raw materials or across individual stages of the value chain. For some product groups, the Mann–Kendall test indicated statistically significant decreases in concentration, whereas for others it remained highly concentrated or showed no statistically significant monotonic trend. Changes in the leading extra-EU trading partners were observed for several product groups during 2020–2023, including in 2023. This pattern suggests changes in the composition of trading partners rather than a uniform shift across all analyzed raw materials. The observed differences also indicate that developments in trading-partner concentration should be assessed not only in relation to the CRMA regulatory framework, but also in the context of the specific characteristics of individual raw material value chains and the national conditions of individual Member States.
Caution is required when interpreting concentration indicators. HHI, like CR1 and CR3, captures the degree of concentration in the trading-partner structure, but not the overall level of supply risk. Supply diversity is an important component of assessing the risk and criticality of mineral raw materials, but its relevance should be considered together with other characteristics of the market and supply chain [51]. The meaning of a particular HHI value also depends on the structure of the market being analyzed, and concentration thresholds developed for horizontal merger analysis cannot be automatically applied to raw material supply-risk assessments [52]. In the case of strategic metals, Bucciarelli et al. [53] likewise highlighted the limited explanatory power of HHI alone and of universal concentration thresholds. The dominant position of a single trading partner therefore cannot, by itself, be interpreted as evidence of high supply risk; however, it represents one factor that, in combination with other conditions, may increase the potential vulnerability of the supply chain. This distinction is particularly relevant to Slovakia, where some product groups exhibited low or irregular import quantities, and high trading-partner concentration may therefore reflect a small number of reported trading partners and limited import volumes rather than substantial economic dependence.
The risk of multiple testing should be considered when interpreting the statistical results. Therefore, the Benjamini–Hochberg false discovery rate (FDR) correction was applied in the correlation analysis [49]. No multiple-testing correction was applied to the temporal trend analysis. The results of the Mann–Kendall test were evaluated alongside Sen’s slope and its 95% confidence interval. Trends with p-values close to the 0.05 threshold should be interpreted with caution, particularly given the number of tests performed and the relatively short time series (2014–2025). Potential serial dependence among annual observations should also be considered. No correction for serial autocorrelation was applied in the analysis, which may affect the assessment of the statistical significance of trends.
The results of the correlation analysis indicate limited robustness of some of the identified associations between import quantities across product categories. Although two Pearson correlations of annual import quantities and one correlation of logarithmic year-on-year changes remained statistically significant after FDR correction, the sensitivity analyses revealed a substantial influence of individual observations. The positive correlation between the two cobalt product categories was substantially influenced by the 2014 observation, whereas the negative correlation between bauxite and natural graphite was sensitive to a potentially anomalous trade record from 2023. In contrast, the positive association between baryte and nickel exhibited greater stability in the leave-one-out analysis. The observed correlations therefore represent statistical associations between developments in import quantities rather than evidence of common causal factors or interdependence among the analyzed product categories.
An example illustrating the need for a broader interpretation of concentration indicators is the development of the aluminum trading-partner structure. For unwrought, not alloyed aluminum (HS 760110), the EU27 recorded statistically significant decreases in CR1, CR3, and HHI over the study period, while a change in the dominant external trading partner occurred after 2022. This development overlapped in time with a period of substantial changes in the European primary aluminum market.
In September 2022, European Aluminum reported that approximately 50% of Europe’s primary aluminum production (1.1 million tonnes) had been curtailed or halted since October 2021 due to high energy prices [54]. In Slovakia, Slovalco decided in August 2022 to terminate primary aluminum production, citing high electricity prices and unfavourable framework conditions as the main reasons [55]. These developments provide relevant market context for the observed changes in trading-partner concentration and dominant trading partners, although the trade data do not establish a direct causal relationship between production curtailments and changes in individual trading-partner positions.
The development of trading-partner concentration for lithium and copper should also be considered in the context of changes in global demand associated with transport electrification, battery technologies, and the expansion of electricity grids. According to the IEA [2], global lithium demand increased by nearly 30% in 2024, while growth in copper demand was driven particularly by investments in electricity grid infrastructure, especially in China. At the same time, mining and processing capacities were expanding, which may have influenced the geographical structure of supply.
The results of our analysis indicate different developments in trading-partner concentration across individual lithium product groups. For lithium carbonates (CN 28369100), Chile remained the dominant external trading partner of the EU27, although its share decreased from 85.6% in 2022 to 65.0% in 2025. In contrast, for lithium oxide and hydroxide (CN 28252000), the leading trading partner changed over the study period. These differences indicate that the development of trading-partner concentration also depends on the characteristics of the traded product and its position within the value chain. Therefore, increasing global lithium demand does not necessarily lead to similar concentration trends across all product groups.
Similar differences were identified for copper. For copper ores and concentrates (CN 26030000), the share of the largest external trading partner of the EU27 decreased from 29.4% in 2014 to 23.5% in 2025, whereas for unrefined copper and anodes (CN 74020000), it increased from 55.7% to 62.1%. For refined copper in the form of cathodes (CN 74031100), the leading trading partner also changed. Differences in concentration trends across product groups should be interpreted in the context of the geographical distribution of mining and processing capacities and international trade relationships. The results therefore suggest that changes in trading-partner concentration should not be considered solely in relation to demand growth, but also in the context of supply-side conditions. Recent studies have pointed to differences between the geographical concentration of extraction and processing and to the need to assess vulnerability across individual stages of the value chain [56,57].
The development of trading-partner relationships during the study period should also be interpreted within a broader political and geopolitical context. The European Green Deal of 2019 and the subsequent adoption of the Critical Raw Materials Act (CRMA) in 2024 established a policy and regulatory framework aimed, among other objectives, at diversifying critical raw material supplies and developing domestic EU capacities [1,14].
At the same time, trade relationships evolved in the context of other economic and geopolitical factors, particularly disruptions to international supply chains during the COVID-19 pandemic, the energy crisis, and geopolitical tensions following the beginning of Russia’s invasion of Ukraine in 2022 [30]. These events provide relevant context for interpreting the changes in the leading external trading partners of the EU27 identified during 2020–2023. However, temporal coincidence alone does not establish a causal relationship. Similarly, changes in trading-partner concentration preceding the adoption of the CRMA cannot be attributed to the effects of this Regulation. The study results therefore indicate changes in trading-partner structures amid concurrent economic, political, and geopolitical factors, whose individual effects cannot be quantified using the concentration indicators applied in this study.
For some product groups, the Slovak market was characterized by a small number of suppliers, high concentration, or more pronounced year-to-year changes in dominant partners. The concentration indicators for the EU27 and Slovakia describe different trade structures, as the EU27 analysis covers extra-EU imports, whereas the Slovak analysis includes both intra-EU and extra-EU imports. When interpreting the results for Slovakia, the size of the national market, its industrial structure, and its integration into the EU internal market should be considered. High concentration values for certain product groups may also be associated with low or irregular import volumes and the use of intermediary trade relationships within the EU.
A further consideration is the distinction between the country of the trading partner and the country of origin of the raw material. In intra-EU trade, the trading partner may represent the Member State of dispatch, which is not necessarily the country where the raw material was originally extracted or processed. Imports from several EU Member States therefore do not necessarily indicate diversification of the original sources of supply. The concentration indicators calculated for Slovakia thus characterize the structure of direct trading relationships but cannot identify potential dependence on common sources at earlier stages of the supply chain. This interpretation should also take into account the domestic geological and raw material context, as well as the broader conditions affecting the use of critical raw materials, including import dependence, material consumption, and recycling [58]. Among the raw materials analyzed, Slovakia has recorded resources or historically exploited deposits of antimony, copper, baryte, and graphite [59], while historical nickel and cobalt-bearing mineralization has also been documented in the Dobšiná area [60]. The existence of domestic deposits or reserves does not, by itself, establish their technical or economic feasibility. The results of this study therefore cannot be interpreted as evidence that recorded Slovak resources represent a direct alternative to current imports. Assessing their potential contribution to domestic supply would require a separate feasibility analysis considering geological, technological, environmental, and economic conditions.
Several limitations of this study should be acknowledged. The analysis focuses on selected HS/CN product categories and therefore does not provide a comprehensive assessment of all critical raw materials or the individual stages of their value chains. It is based on reported COMEXT trade data, where low or irregular import quantities and potentially anomalous trade records may affect the results of concentration and statistical analyses. The relatively short time series (2014–2025) also limits the assessment of long-term trends and the stability of identified associations. The indicators used do not account for all factors affecting security of supply, particularly production and processing capacities, reserves, or the availability of secondary raw materials. The analysis is retrospective and does not allow the causal effects of economic, political, and geopolitical events to be quantified or future developments in trading-partner concentration to be predicted.
From the perspective of implementing the CRMA, the results of the trading-partner concentration analysis may help identify product groups for which dependence on individual trading partners warrants further assessment. However, the CRMA benchmark stipulating that, by 2030, no single third country should account for more than 65% of the EU’s annual consumption of a strategic raw material at any relevant stage of processing is not directly comparable to CR1 values calculated from imports of individual HS/CN product categories [14]. The development of domestic extraction, processing, and recycling capacities, along with monitoring risks at different stages of the value chain, therefore represents complementary aspects of assessing security of supply. The study results thus provide a basis for identifying concentrated trading relationships, while a comprehensive assessment of supply chain resilience also requires data on raw material origin, processing capacities, and the economic importance of import flows.
5. Conclusions
The main findings of the study can be summarized as follows:
- Trading-partner concentration differed substantially across the analyzed raw materials and individual stages of the value chain. Statistically significant decreases in concentration were identified for selected product groups of aluminum, lithium, antimony, and nickel based on the unadjusted Mann–Kendall test. For natural graphite, the decline in CR1 for CN 25041000 was borderline, with the 95% confidence interval for Sen’s slope including zero. Other product groups remained highly concentrated or showed no statistically significant monotonic trend. By contrast, concentration increased for antimony ores and concentrates.
- The development of trading-partner concentration in Slovakia differed from the EU27 pattern for several product groups. The Slovak import structure was often characterized by a smaller number of trading partners, higher concentration, and more pronounced year-to-year changes in dominant partners. However, the EU27 and Slovak indicators represent different trade structures, as the former cover extra-EU imports and the latter include both intra-EU and extra-EU imports. Aggregated EU-level trends therefore cannot be directly transferred to individual Member States.
- A change in the dominant trading partner country was not always accompanied by a decrease in overall concentration. CR1, CR3, and HHI should therefore be interpreted in the context of the specific raw material, processing stage, and broader supply chain structure.
- The correlation analysis identified several statistically significant associations between import quantities, but sensitivity analyses showed that some were substantially influenced by individual observations or potentially anomalous trade records. The results therefore do not provide sufficient evidence of common causal mechanisms underlying changes in the analyzed product groups.
- The comparison between the EU27 and Slovakia showed that aggregated EU-level trends cannot be directly transferred to individual Member States, where market size, import structure, and the composition of supplier countries may differ.
- In the Slovak context, trade-related results should also be considered in relation to domestic geological and raw material potential. However, the mere existence of recorded or historically exploited resources does not imply their economic viability or their direct ability to replace current imports.
- The findings indicate that trading-partner concentration indicators can support the identification of potentially vulnerable trade structures but are insufficient for a comprehensive assessment of supply security. Their application in the context of EU raw material policy should be complemented by information on the origin of raw materials, processing capacities, and the economic significance of import flows.
Future research could link trading-partner concentration analysis with assessments of the economic feasibility of domestic resources, extraction and processing costs, trends in unit import prices, and the potential of secondary raw materials and recycling. Given Slovakia’s mining history, the reassessment of mining waste and historical residues may also be relevant, as these may, under certain geological, technological, and economic conditions, represent supplementary sources of selected critical raw materials [61].
Author Contributions
Conceptualization, Z.K., S.K., D.B., M.R., M.S.V. and L.B.; methodology, Z.K., S.K. and D.B.; software, Z.K.; validation, Z.K. and S.K.; formal analysis, Z.K., S.K. and D.B.; investigation, S.K., D.B., M.R. and M.S.V.; resources, Z.K.; data curation, Z.K., S.K. and D.B.; writing—original draft preparation, Z.K., S.K., D.B., M.R., M.S.V. and L.B.; writing—review and editing, S.K.; visualization, Z.K., S.K. and D.B. All authors have read and agreed to the published version of the manuscript.
Funding
This research received no external funding.
Institutional Review Board Statement
Not applicable.
Informed Consent Statement
Not applicable.
Data Availability Statement
The trade data analyzed in this study are publicly available from the Eurostat COMEXT database (dataset ds-045409). The product classifications and derived analytical results supporting the findings are presented in Appendix A and Appendix B.
Acknowledgments
The authors acknowledge the Technical University of Kosice, Faculty of Mining, Ecology, Process Control and Geotechnologies, for its support during the preparation of this study. During the preparation of this manuscript, the authors used ChatGPT (GPT-6, OpenAI) for language refinement, improving the clarity and readability of the text, and checking its consistency. The authors have reviewed and edited the output and take full responsibility for the content of this publication.
Conflicts of Interest
The authors declare no conflicts of interest.
Abbreviations
The following abbreviations are used in this manuscript:
| CRM | Critical Raw Materials |
| CRMA | Critical Raw Materials Act |
| CR1 | Concentration Ratio of the largest supplier |
| CR3 | Concentration Ratio of the three largest suppliers |
| HHI | Herfindahl–Hirschman Index |
| EU27 | European Union, 27 Member States |
| EU27_2020 | Eurostat geographical aggregate for the European Union with 27 Member States |
| HS | Harmonized System |
| CN | Combined Nomenclature |
| COMEXT | Eurostat database for international trade in goods |
Appendix A
Table A1.
Selected raw materials, CN codes, product groups and supply chain stages.
Appendix B
Table A2.
Concentration indicators and trend results for EU27.
Table A3.
Concentration indicators and trend results for Slovakia.
Table A4.
Trend analysis of concentration indicators for EU27 (2014–2025).
Table A5.
Trend analysis of concentration indicators for Slovakia (2014–2025).
Table A6.
Dominant supplier countries for the EU27 in selected years.
Table A7.
Dominant supplier countries for Slovakia in selected years.
References
- European Commission. Communication from the Commission to the European Parliament, the European Council, the Council, the European Economic and Social Committee and the Committee of the Regions: The European Green Deal; COM(2019) 640 Final; European Commission: Brussels, Belgium, 2019; Available online: https://eur-lex.europa.eu/legal-content/EN/TXT/?uri=celex:52019DC0640 (accessed on 27 September 2026).
- International Energy Agency (IEA). Global Critical Minerals Outlook 2025; IEA: Paris, France, 2025; Available online: https://www.iea.org/reports/global-critical-minerals-outlook-2025 (accessed on 29 October 2026).
- Graedel, T.E.; Harper, E.M.; Nassar, N.T.; Nuss, P.; Reck, B.K. Criticality of metals and metalloids. Proc. Natl. Acad. Sci. USA 2015, 112, 4257–4262. [Google Scholar] [CrossRef] [Scilit] [PubMed]
- Schicho, M.; Tercero Espinoza, L. Criticality Assessment for Raw Materials: Perspectives and Focuses. Miner. Econ. 2026, 39, 93–110. [Google Scholar] [CrossRef] [Scilit]
- Jin, Y.; Kim, J.; Guillaume, B. Review of critical material studies. Resour. Conserv. Recycl. 2016, 113, 77–87. [Google Scholar] [CrossRef] [Scilit]
- Schrijvers, D.; Hool, A.; Blengini, G.A.; Chen, W.Q.; Dewulf, J.; Eggert, R.; van Ellen, L.; Gauss, R.; Goddin, J.; Habib, K.; et al. A Review of Methods and Data to Determine Raw Material Criticality. Resour. Conserv. Recycl. 2020, 155, 104617. [Google Scholar] [CrossRef] [Scilit]
- Blengini, G.A.; Nuss, P.; Dewulf, J.; Nita, V.; Talens Peirò, L.; Vidal-Legaz, B.; Latunussa, C.; Mancini, L.; Blagoeva, D.; Pennington, D.; et al. EU Methodology for Critical Raw Materials Assessment: Policy Needs and Proposed Solutions for Incremental Improvements. Resour. Policy 2017, 53, 12–19. [Google Scholar] [CrossRef] [Scilit]
- Mancini, L.; Benini, L.; Sala, S. Characterization of raw materials based on supply risk indicators for Europe. Int. J. Life Cycle Assess. 2018, 23, 726–738. [Google Scholar] [CrossRef] [Scilit]
- U.S. Department of Energy. Critical Minerals and Materials: U.S. Department of Energy’s Strategy to Support Domestic Critical Mineral and Material Supply Chains (FY 2021–FY 2031); U.S. Department of Energy: Washington, DC, USA, 2021. Available online: https://www.energy.gov/documents/doe-critical-minerals-and-materials-strategypdf (accessed on 4 November 2026).
- Natural Resources Canada. The Canadian Critical Minerals Strategy: From Exploration to Recycling: Powering the Green and Digital Economy for Canada and the World; Natural Resources Canada: Ottawa, ON, Canada, 2022. Available online: https://www.canada.ca/en/campaign/critical-minerals-in-canada/canadian-critical-minerals-strategy.html (accessed on 4 November 2026).
- Zhang, Q.; Cheng, W.; Zhang, T.; Liu, H.; Yuan, J.; Chen, A.; Wang, T.; Liu, Q.; Wang, J. Occurrence modes and comprehensive utilization of critical metal resources associated with coal: A review. Int. J. Min. Sci. Technol. 2026, 36, 277–293. [Google Scholar] [CrossRef] [Scilit]
- Chu, Y.; Liu, M.; Jiang, M.; Lei, Y.; Wang, X. Analysis of China’s tin industry: Current state and developmental recommendations. Green Smart Min. Eng. 2025, 2, 278–284. [Google Scholar] [CrossRef] [Scilit]
- European Commission. Critical Raw Materials Resilience: Charting a Path Towards Greater Security and Sustainability; COM(2020) 474 Final; European Commission: Brussels, Belgium, 2020; Available online: https://eur-lex.europa.eu/legal-content/EN/TXT/?uri=celex:52020DC0474 (accessed on 28 September 2026).
- European Parliament; Council of the European Union. Regulation (EU) 2024/1252 of the European Parliament and of the Council of 11 April 2024 Establishing a Framework for Ensuring a Secure and Sustainable Supply of Critical Raw Materials and Amending Regulations (EU) No 168/2013, (EU) 2018/858, (EU) 2018/1724 and (EU) 2019/1020. 2024. Available online: http://data.europa.eu/eli/reg/2024/1252/oj (accessed on 28 September 2026).
- Achzet, B.; Helbig, C. How to Evaluate Raw Material Supply Risks-an Overview. Resour. Policy 2013, 38, 435–447. [Google Scholar] [CrossRef] [Scilit]
- Glöser-Chahoud, S.; Tercero Espinoza, L.; Walz, R.; Faulstich, M. Taking the Step towards a More Dynamic View on Raw Material Criticality: An Indicator Based Analysis for Germany and Japan. Resources 2016, 5, 45. [Google Scholar] [CrossRef] [Scilit]
- Brezina, I.; Pekár, J.; Čičková, Z.; Reiff, M. Herfindahl–Hirschman Index Level of Concentration Values Modification and Analysis of Their Change. Cent. Eur. J. Oper. Res. 2016, 24, 49–72. [Google Scholar] [CrossRef] [Scilit]
- Schreiber, A.; Zapp, P.; Wulf, C.; Reitz, L. Analyzing Germany’s Current and Future Critical Raw Material Situation for Water Electrolysis and Offshore Wind Turbines. Int. J. Hydrogen Energy 2025, 128, 511–522. [Google Scholar] [CrossRef] [Scilit]
- Gianvincenzi, M.; Marconi, M.; Mosconi, E.M.; Tola, F. Toward a Resilient European Battery Ecosystem by 2030: Strategic Pathways to Meet EU Regulatory Targets. J. Energy Storage 2025, 132, 117851. [Google Scholar] [CrossRef] [Scilit]
- Santillán-Saldivar, J.; Koyamparambath, A.; Sonnemann, G.; Monfort Climent, D. Assessing the Potential Supply Risk Mitigation Due to Public Policies: Application of the GeoPolRisk Method to Critical Raw Materials in the EU. Resour. Policy 2026, 118, 105952. [Google Scholar] [CrossRef] [Scilit]
- European Commission. Commission Staff Working Document—Impact Assessment Report Accompanying the Document Proposal for a Regulation of the European Parliament and of the Council Establishing a Framework for Ensuring a Secure and Sustainable Supply of Critical Raw Materials and Amending Regulations (EU) No 168/2013, (EU) 2018/858, (EU) 2018/1724 and (EU) 2019/1020; SWD(2023) 161 Final; European Commission: Brussels, Belgium, 2023. [Google Scholar]
- Fojtíková, L.; Pekarčíková, K.; Sousedíková, R.; Vaněk, M.; Dvořáček, J. Determinants of Critical Raw Material Imports: The Case of the European Union and China. Miner. Econ. 2026, 39, 169–191. [Google Scholar] [CrossRef] [Scilit]
- European Commission. Communication from the Commission to the European Parliament and the Council—The Raw Materials Initiative: Meeting Our Critical Needs for Growth and Jobs in Europe; COM(2008) 699 Final; European Commission: Brussels, Belgium, 2008; Available online: https://eur-lex.europa.eu/legal-content/EN/TXT/?uri=celex:52008DC0699 (accessed on 28 September 2026).
- European Commission. Communication from the Commission to the European Parliament, the Council, the European Economic and Social Committee and the Committee of the Regions—Tackling the Challenges in Commodity Markets and on Raw Materials; COM(2011) 25 Final; European Commission: Brussels, Belgium, 2011; Available online: https://eur-lex.europa.eu/legal-content/EN/TXT/?uri=CELEX:52011DC0025 (accessed on 28 September 2026).
- European Commission. Communication from the Commission to the European Parliament, the Council, the European Economic and Social Committee and the Committee of the Regions—On the Review of the List of Critical Raw Materials for the EU and the Implementation of the Raw Materials Initiative; COM(2014) 297 Final; European Commission: Brussels, Belgium, 2014; Available online: https://eur-lex.europa.eu/legal-content/EN/TXT/?uri=CELEX:52014DC0297 (accessed on 28 September 2026).
- European Commission. Communication from the Commission to the European Parliament, the Council, the European Economic and Social Committee and the Committee of the Regions—On the 2017 List of Critical Raw Materials for the EU; COM(2017) 490 Final; European Commission: Brussels, Belgium, 2017; Available online: https://eur-lex.europa.eu/legal-content/EN/TXT/?uri=CELEX:52017DC0490 (accessed on 28 September 2026).
- European Commission, Directorate-General for Internal Market, Industry, Entrepreneurship and SMEs; Grohol, M.; Veeh, C. Study on the Critical Raw Materials for the EU 2023—Final Report; Publications Office of the European Union: Luxembourg, 2023; Available online: https://data.europa.eu/doi/10.2873/725585 (accessed on 28 September 2026).
- Vai, A.; Colucci, G.; Nicoli, M.; Savoldi, L. May the Availability of Critical Raw Materials Affect the Security of Energy Systems? An Analysis for Risk-Aware Energy Planning with TEMOA-Italy. Mater. Today Energy 2025, 48, 101805. [Google Scholar] [CrossRef] [Scilit]
- European Commission: Directorate-General for Internal Market, Industry, Entrepreneurship and SMEs; Bobba, S.; Carrara, S.; Huisman, J.; Mathieux, F.; Pavel, C. Critical Raw Materials for Strategic Technologies and Sectors in the EU—A Foresight Study; Publications Office: Luxembourg, 2020; Available online: https://data.europa.eu/doi/10.2873/58081 (accessed on 30 October 2026).
- European Commission. Proposal for a Regulation of the European Parliament and of the Council Establishing a Framework for Ensuring a Secure and Sustainable Supply of Critical Raw Materials; COM(2023) 160 Final; European Commission: Brussels, Belgium, 2023; Available online: https://eur-lex.europa.eu/legal-content/EN/TXT/?uri=CELEX:52023PC0160 (accessed on 28 September 2026).
- European Commission. European Critical Raw Materials Act. Available online: https://commission.europa.eu/topics/competitiveness/green-deal-industrial-plan/european-critical-raw-materials-act_en (accessed on 30 September 2026).
- Ministry of Environment of the Slovak Republic. National Programme for the Exploration of Critical Mineral Raw Materials of the Slovak Republic: Proposal; Material No. UV-18157/2025; Resolution of the Government of the Slovak Republic No. 314/2025; Ministry of Environment of the Slovak Republic: Bratislava, Slovakia, 2025. Available online: https://rokovania.gov.sk/RVL/Material/30880/1 (accessed on 28 September 2026).
- Ministry of Environment of the Slovak Republic. Action Plan for the Exploration of Critical Mineral Raw Materials in the Slovak Republic for 2026–2030: Proposal; Material No. UV-15840/2026; Departmental No. 29636/2026; Ministry of Environment of the Slovak Republic: Bratislava, Slovakia, 2026. Available online: https://rokovania.gov.sk/RVL/Material/31952/2 (accessed on 28 September 2026).
- Office of the Government of the Slovak Republic. Programme Statement of the Government of the Slovak Republic for 2023–2027: “Lepšie, Pokojnejšie a Bezpečnejšie Žiť”; Office of the Government of the Slovak Republic: Bratislava, Slovakia, 2023. Available online: https://www.vlada.gov.sk/site/assets/files/1694/programove_vyhlasenie_vlady_sr.pdf (accessed on 29 September 2026).
- Eurostat. COMEXT Database—International Trade in Goods; European Commission: Luxembourg, 2026; Available online: https://ec.europa.eu/eurostat/web/international-trade-in-goods/database (accessed on 29 September 2026).
- Kvålseth, T.O. Relationship between Concentration Ratio and Herfindahl–Hirschman Index: A Re-Examination Based on Majorization Theory. Heliyon 2018, 4, e00846. [Google Scholar] [CrossRef] [Scilit] [PubMed]
- OECD. Methodologies to Measure Market Competition; OECD Competition Committee Issues Paper; Organisation for Economic Co-Operation and Development: Paris, France, 2021; Available online: https://oe.cd/mmmc (accessed on 17 September 2026).
- Hirschman, A.O. National Power and the Structure of Foreign Trade; Expanded ed. Published in 1980; University of California Press: Berkeley, CA, USA, 1945; ISBN 0-520-04082-1. [Google Scholar]
- Herfindahl, O.C. Concentration in the Steel Industry. Ph.D. Dissertation, Columbia University, New York, NY, USA, 1950. [Google Scholar]
- Kannan, S.G.; Fleming, M.; Hirwa, J.; Castillo, E.; Eggert, R. Critical Materials and Manufacturing: Comparing China, the European Union, Japan, and the United States. Resour. Conserv. Recycl. Adv. 2025, 25, 200250. [Google Scholar] [CrossRef] [Scilit]
- Cehlár, M.; Šimková, Z. Critical Raw Materials as a Part of Sustainable Development. Multidiszcip. Tudományok 2021, 11, 12–23. [Google Scholar] [CrossRef] [Scilit]
- Habib, K.; Hamelin, L.; Wenzel, H. A Dynamic Perspective of the Geopolitical Supply Risk of Metals. J. Clean. Prod. 2016, 133, 850–858. [Google Scholar] [CrossRef] [Scilit]
- European Commission. Critical Raw Materials for the EU. Report of the Ad-hoc Working Group on Defining Critical Raw Materials; European Commission: Brussels, Belgium, 2010; Available online: https://ec.europa.eu/docsroom/documents/5662/attachments/1/translations (accessed on 17 September 2026).
- Mann, H.B. Nonparametric tests against trend. Econometrica 1945, 13, 245–259. [Google Scholar] [CrossRef] [Scilit]
- Kendall, M.G. Rank Correlation Methods, 4th ed.; Charles Griffin: San Francisco, CA, USA, 1975. [Google Scholar]
- Shang, Y.; Chen, Y.; Zhao, B. From black gold to green bond: The structural shift in pricing power of non-ferrous metals. Financ. Res. Lett. 2026, 99, 109935. [Google Scholar] [CrossRef] [Scilit]
- Sen, P.K. Estimates of the Regression Coefficient Based on Kendall’s Tau. J. Am. Stat. Assoc. 1968, 63, 1379–1389. [Google Scholar] [CrossRef]
- Gilbert, R.O. Statistical Methods for Environmental Pollution Monitoring; John Wiley & Sons: New York, NY, USA, 1987. [Google Scholar]
- Benjamini, Y.; Hochberg, Y. Controlling the False Discovery Rate: A Practical and Powerful Approach to Multiple Testing. J. R. Stat. Soc. Ser. B Methodol. 1995, 57, 289–300. [Google Scholar] [CrossRef] [Scilit]
- Georgitzikis, K. Trade Codes of Non-Food, Non-Fuel Raw Materials and Their Products: An Analysis for the Raw Materials Information System (RMIS); JRC136041; Publications Office of the European Union: Luxembourg, 2023. [Google Scholar] [CrossRef] [PubMed]
- Brown, T. Measurement of Mineral Supply Diversity and Its Importance in Assessing Risk and Criticality. Resour. Policy 2018, 58, 202–218. [Google Scholar] [CrossRef] [Scilit]
- Nocke, V.; Whinston, M.D. Concentration Thresholds for Horizontal Mergers. Am. Econ. Rev. 2022, 112, 1915–1948. [Google Scholar] [CrossRef] [Scilit]
- Bucciarelli, P.; Hache, E.; Mignon, V. Evaluating Criticality of Strategic Metals: Are the Herfindahl–Hirschman Index and Usual Concentration Thresholds Still Relevant? Energy Econ. 2025, 143, 108208. [Google Scholar] [CrossRef] [Scilit]
- European Aluminium. Energy Prices Crisis: Short-Term & Mid-Term Measures to Navigate the Crisis Ahead of Next Winter; European Aluminium: Brussels, Belgium, 2022; Available online: https://european-aluminium.eu/wp-content/uploads/2022/10/2022-09-05-european-aluminium-on-measures-to-adress-high-energy-prices.pdf (accessed on 30 September 2026).
- Hydro. Slovalco Will Stop Primary Aluminium Production. Available online: https://www.hydro.com/en/global/media/news/2022/slovalco-will-stop-primary-aluminium-production/ (accessed on 30 September 2026).
- Ucok, M.D. Midstream Concentration and Geopolitical Risk in Critical Mineral Supply Chains: A Scenario-Based Assessment of Refining Chokepoints in the Energy Transition. Resour. Policy 2026, 126, 105996. [Google Scholar] [CrossRef] [Scilit]
- Zhou, L. Understanding Resilience in Critical Raw Material Supply Systems. Ore Geol. Rev. 2026, 197, 107522. [Google Scholar] [CrossRef] [Scilit]
- Domaracka, L.; Matuskova, S.; Tausova, M.; Senova, A.; Kowal, B. Efficient Use of Critical Raw Materials for Optimal Resource Management in EU Countries. Sustainability 2022, 14, 6554. [Google Scholar] [CrossRef] [Scilit]
- Šoltés, S.; Španek, P.; Kúšik, D.; Mižák, J.; Kubač, A. Nerastné Suroviny SR 2022/Slovak Minerals Yearbook 2022; Štátny Geologický ústav Dionýza Štúra: Bratislava, Slovakia, 2023; ISBN 978-80-8174-072-5. Available online: https://www.geology.sk/wp-content/uploads/2025/12/NS-2022_w.pdf (accessed on 30 September 2026).
- Kiefer, S.; Majzlan, J.; Chovan, M.; Števko, M. Mineral Compositions and Phase Relations of the Complex Sulfarsenides and Arsenides from Dobšiná (Western Carpathians, Slovakia). Ore Geol. Rev. 2017, 89, 894–908. [Google Scholar] [CrossRef] [Scilit]
- Ubaldini, S.; Luptakova, A.; Paciucci, M.; Caschera, D.; Toro, R.G.; Nogues, I.; Pinon, V.; Balintova, M.; Estokova, A.; Luptak, M.; et al. From Mining Residues to Potential Resources: A Cross-Disciplinary Strategy for Raw Materials Recovery and Supply. Metals 2026, 16, 133. [Google Scholar] [CrossRef] [Scilit]
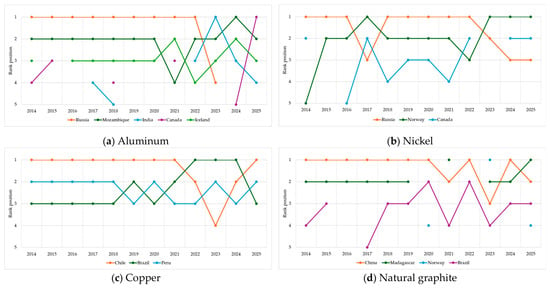
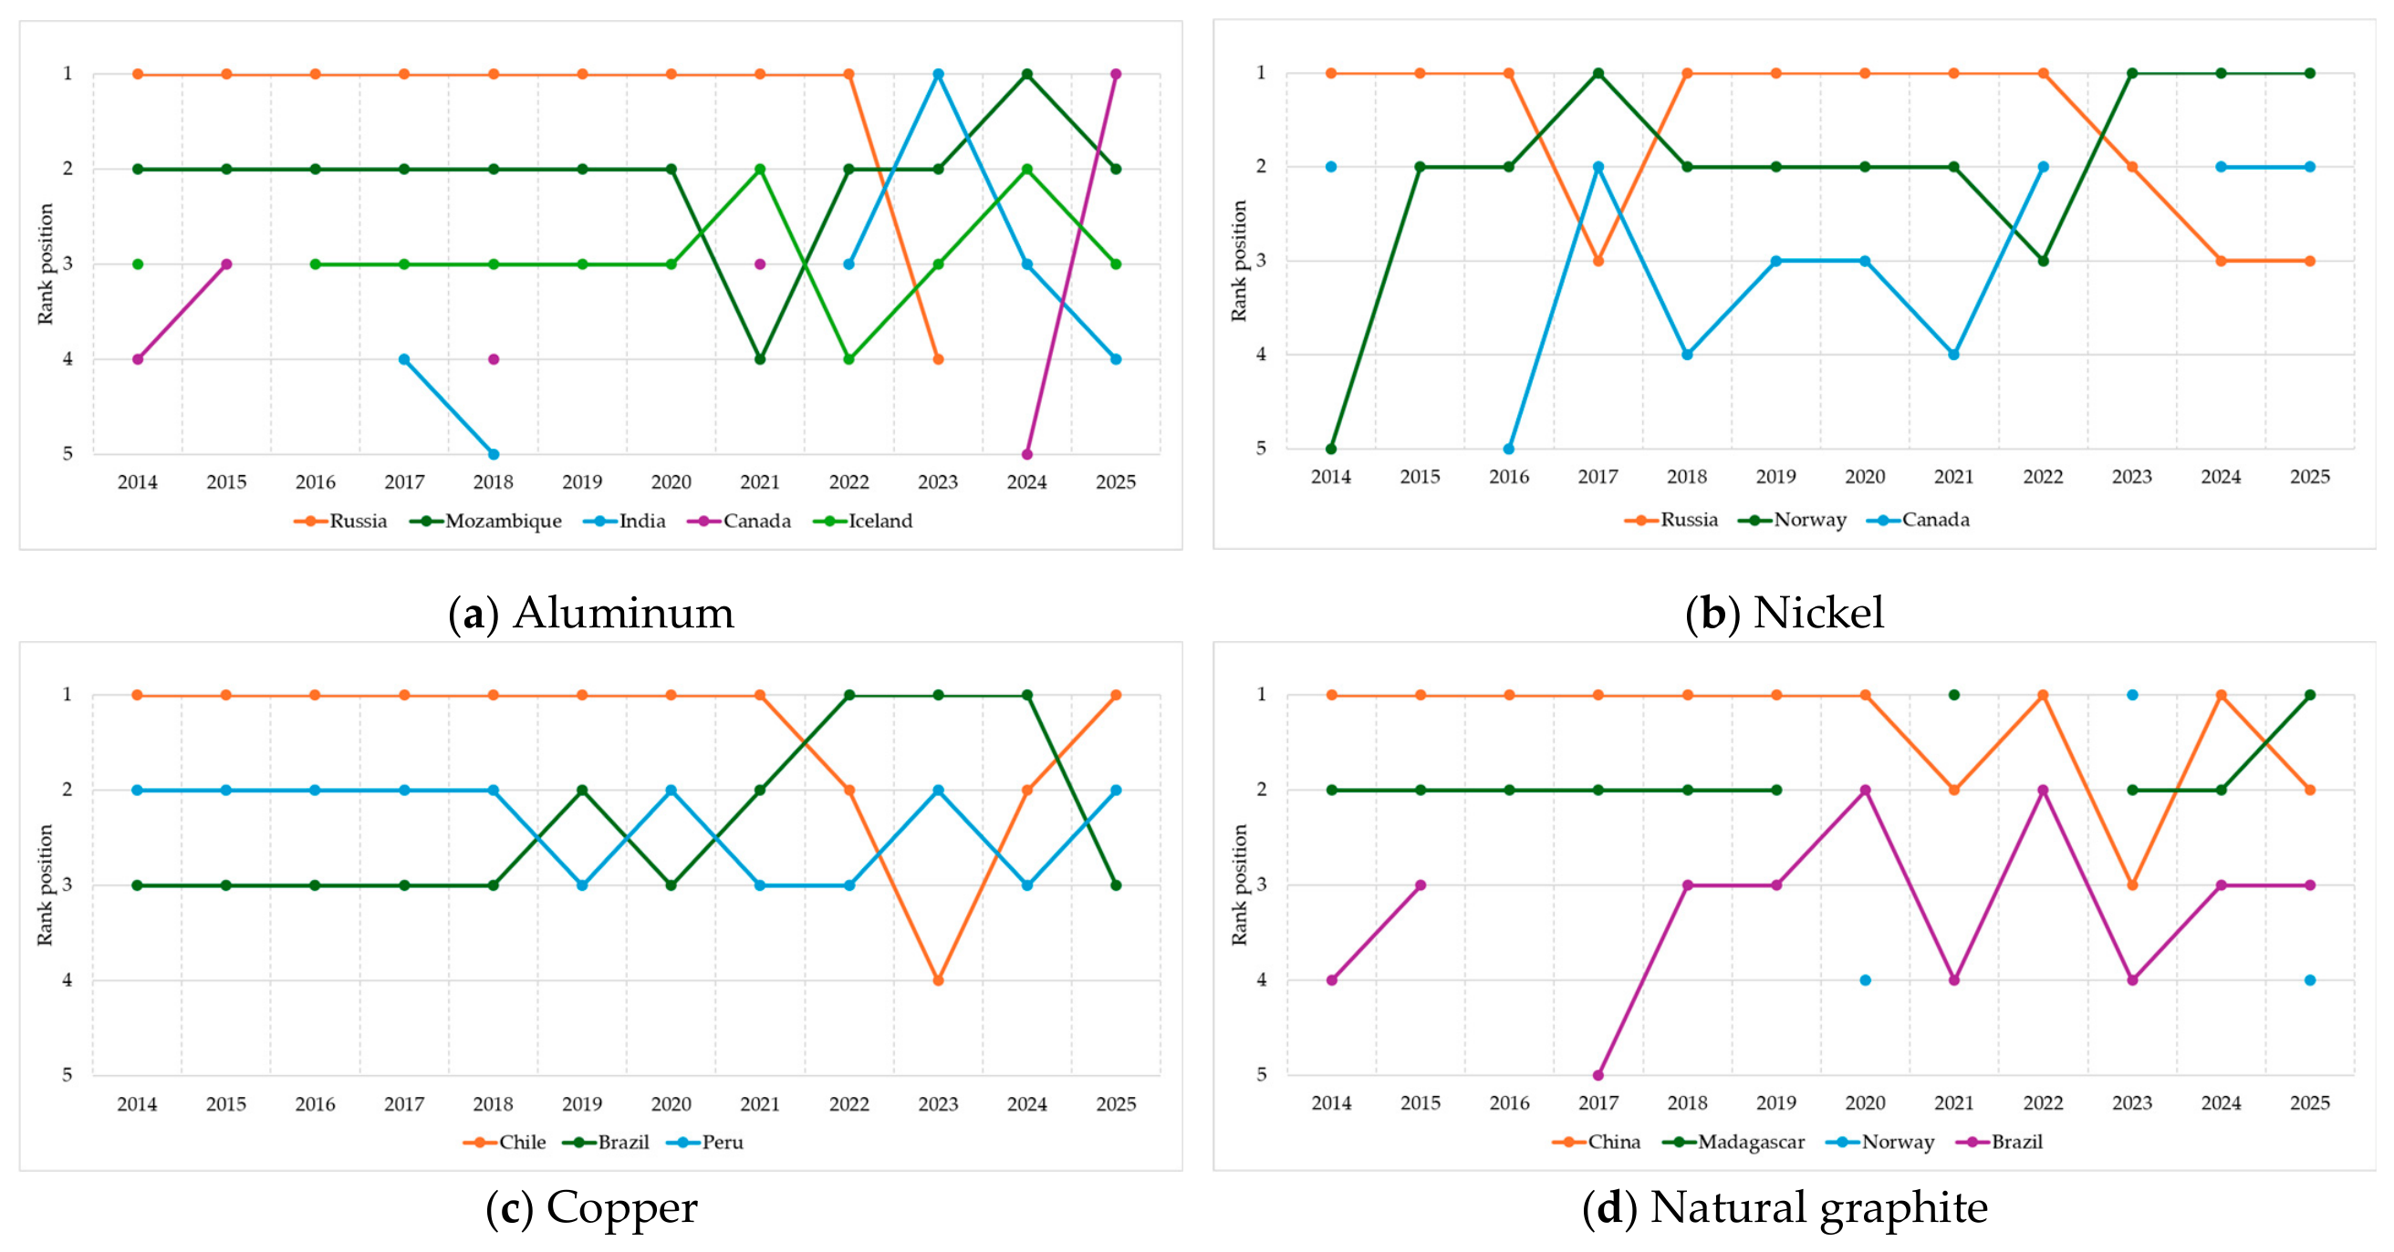

Disclaimer/Publisher’s Note: The statements, opinions and data contained in all publications are solely those of the individual author(s) and contributor(s) and not of MDPI and/or the editor(s). MDPI and/or the editor(s) disclaim responsibility for any injury to people or property resulting from any ideas, methods, instructions or products referred to in the content. |
© 2026 by the authors. Licensee MDPI, Basel, Switzerland. This article is an open access article distributed under the terms and conditions of the Creative Commons Attribution (CC BY) license.