


Abstract
Reliable cement crack inspection is essential for structural health monitoring, particularly under challenging illumination conditions such as nighttime and low-light environments. Existing detection-based methods often require extensive bounding-box annotations, high computational resources, and show limited robustness in poor visibility conditions. This paper presents a lightweight RGB-thermal framework that integrates a MobileNetV4 classifier with a Convolutional Block Attention Module (CBAM) and an Enhanced Scale-Invariant Feature Transform (SIFT) localization algorithm for day–night crack inspection. Unlike conventional object detection approaches, the proposed method enables crack classification and localization without manual bounding-box annotation. The framework is evaluated using RGB and thermal images from three datasets, including the GYU-DET benchmark and two newly developed thermal crack datasets. On GYU-DET, the proposed classifier achieves a weighted F1-score of 83.16% using only region-of-interest-level labels, in contrast to the bounding-box-supervised YOLOv11n baseline on the same benchmark (mAP@0.5 = 0.568). Because the two approaches solve different sub-problems–joint detection-and-localization versus region-level classification–their results are reported as a capability comparison rather than a numerical improvement. Notably, crack, one of the two most difficult categories for the bounding-box detector, becomes one of the most reliably recognized categories once localization ambiguity is removed by the proposed decoupled design. For thermal morphology recognition, the original ROI-level evaluation yields weighted F1-scores of 92.25% and 92.69% on Datasets 2 and 3, respectively, within the collected crack set. A five-run crack-disjoint evaluation on Dataset 2, restricted to six morphology classes with sufficient numbers of independent physical cracks, yields an accuracy of % and a macro-F1 of %. End-to-end localization and classification from raw thermograms yields micro-F1 scores of 78.62% and 75.24% on Datasets 2 and 3, respectively. The Enhanced SIFT localization method, which requires no training, achieves F1-scores of 0.888 and 0.867 under passive and active thermal conditions, respectively, while operating within a 200 MB memory footprint on an entry-level 4 GB GPU. The lightweight and illumination-robust design enables reliable nighttime crack inspection and supports UAV-assisted and edge-based structural health monitoring applications.
1. Introduction
Structural Health Monitoring of different civil structures mainly focuses on automated detection of defects on concrete surfaces, which acts as a critical factor to assess safety and further service life [1]. Early studies at the beginning used classical image processing analysis methods like handcrafted texture descriptors, edge detection and thresholding [2]. With the recent advancements in deep learning, CNNs have revolutionized the paradigm of learning hierarchical feature representations from data and significant improvements in accuracy of detection with respect to handcrafted methods in the field of defect recognition have been achieved [3]. In recent years, the research has been mainly oriented toward the detection of defects in the form of objects, like the family of one-stage object detectors, YOLO, that can localize and classify objects in a single forward pass, allowing the detection of several defects simultaneously [4]. These changes have resulted in various changes with respect to the tasks in different YOLO generations. Some examples are linear models that have oriented bounding boxes (OBB) for a better fit to the diagonal cracks applied in YOLOv4 variants [5] and lightweight models based on YOLOv8 that involved multi-scale feature fusion and attention mechanisms in the detection of bridge defects [6,7]. The development of YOLO11 that followed continued this trend with the incorporation of segmentation heads and specially fine-tuned backbones for the ability of fine crack detection in low-contrast images on edge devices [8,9]. Even with the state-of-the-art benchmark Guiyang University Defect Dataset (GYU-DET), the reported YOLOv11n baseline has only claimed moderate performance, with only mAP@0.5 = 0.568 on six defect categories [10]. But there are two basic shortcomings in these advances. Firstly, the detection method based on the bounding box is intrinsically limited when it is used for crack detection that may contain pixels around the crack. This is not only due to the imprecision of localization for thin and irregular cracks, but also because this method does not offer meaningful shape vectors, including length, width, morphology or branching structure of cracks, to assess the severity at the engineering level. Second, it is common practice to augment lightweight detectors by adding more attention blocks, feature fusion layers and/or expert modules, resulting in a significant increase in the amount of computation. Recent studies reveal that such modifications can cause significant over-parameterization and flops [11] and, in some cases, the over-parameterization and redundant feature aggregation can actually cause a decline in lower-complexity crack patterns [12]. This creates a trade-off between predictive performance and real-time computational requirements in edge-based inspection systems. In parallel, a different approach to crack detection has established itself where crack detection is considered a classification problem. This formulation requires no bounding-box annotations and decouples classification quality from localization error; on mobile platforms, a MobileNet-based model outperformed YOLOv8 on road-damage recognition (91.1% versus 86.4%) at one-third of the memory [13]. This makes use of lightweight backbones, especially those built with depthwise separable convolutions to separate spatial and channel-wise filtering, reducing computational cost without compromising the representational capacity in the backbone [14]. Among lightweight architectures, the MobileNet family has shown strong performance under constrained computational resources. To this end, MobileNetV3-Large outperformed VGG16, GoogLeNet, EfficientNetB0, and EfficientNetV2-S on four-class crack classification (94.70–95.70% accuracy, 16.2 MB, shortest training time) [15], and knowledge distillation raised a MobileNetV3 student to 99.84% on a three-class bridge-crack task, within 0.08% of its ResNeXt101 teacher [16]. Recent vision-based SHM research has also moved beyond static surface-defect recognition toward robust motion and displacement measurement under noise, platform motion, and heterogeneous sensing. Zhang et al. developed multi-objective log-Gabor filtering and threshold denoising for phase-based vibration measurement from noisy video [17]. Zhu et al. proposed a targetless full-field dynamic displacement monitoring system based on computer vision [18]. Gou et al. demonstrated radar–camera fusion for full-field three-dimensional localization and displacement measurement [19], while Luo et al. used UAV video and an improved Lucas-Kanade optical-flow method for cable-vibration measurement [20]. In a related condition-monitoring setting, Zhang et al. combined dynamic modeling with a physics-guided decomposition procedure to recover weak bearing-crack signatures under strong masking effects [21]. These studies address different SHM tasks, yet they share a common requirement: measurements should remain interpretable when the sensing condition is noisy, mobile, or only partially observable. The present study focuses on the narrower problem of lightweight surface-defect recognition and thermal crack localization under day–night inspection conditions.
These results, however, hinge on heavy external stages—a VGG16-U-Net segmentation preprocessor in the former, without which accuracy drops to 86.5–86.8%, and a 35×-larger teacher network in the latter. This exposes the underlying gap: existing solutions refine features through stages external to the deployed model, rather than an end-to-end lightweight design that discriminates features within it. Beyond architectural cost, current evaluation practice obscures where improvements originate: joint metrics such as mAP entangle localization and classification quality, so a gain in one cannot be separated from a loss in the other. The available data compound this limitation—most public collections consist of visible-light images, which cannot capture subsurface structural anomalies, and their labels are predominantly coarse and binary (crack versus no crack), leaving fine-grained morphological differences largely unexplored. Instance-level crack characterization, relating shape and structure to the thermal response, therefore remains insufficiently addressed.
The main contributions of this work are threefold:
- A lightweight inspection framework is proposed by combining MobileNetV4-CBAM classification with Enhanced SIFT localization. The classifier is evaluated separately on the GYU-DET RGB benchmark and on passive and active thermal data, while the localization branch operates on thermal images; no paired RGB–thermal fusion is performed.
- A comprehensive thermal crack benchmark dataset is created with a custom-designed thermal imaging platform. It includes eight representative crack patterns, which are Angle, Branch, Diagonal, Horizontal, L-shape, Network, Vertical and X-shape, with 64 fine-grained crack patterns defined by variations in crack width, length and depth. This data set offers a different, realistic and challenging set-point for the evaluation of thermal-based crack inspection methods.
- To overcome the limitations of conventional visible-light imaging, a dual-mode thermographic acquisition protocol combining passive and active thermography is introduced. Advantages of conducting inspections at night include fewer traffic disruptions and increased operational safety when assessing the condition of the infrastructure. The framework is evaluated at the region level under both acquisition conditions, and its lightweight design makes it a candidate for UAV-based inspection platforms operating in difficult-to-access or complex environments.
- The proposed decoupled classification–localization design is benchmarked against the publicly reported YOLOv11n baseline on GYU-DET. Although AP@0.5 and F1-score are not directly comparable in magnitude, the comparison shows that defect classes limited by localization difficulty under the bounding-box paradigm–most notably Crack–are recognized substantially more reliably once localization is decoupled from classification, while requiring only region-level rather than bounding-box annotation.
The proposed framework provides a common lightweight inspection approach for evaluation under RGB, passive-thermal, and active-thermal imaging conditions. These modalities are evaluated as separate domains rather than as fused multimodal inputs, allowing the same classification architecture to be assessed under different imaging conditions. The lightweight design further motivates future investigation of UAV-assisted deployment for inspection of large-scale and difficult-to-access structures.
The remainder of this paper is organized as follows. Section 2 presents the proposed framework and overall workflow, including ROI extraction and aspect-preserving preprocessing for the classification branch and the role of the Enhanced SIFT localization branch. Section 3 describes the methodology, including the RGB and thermal datasets, the task-adapted MobileNetV4–CBAM classification architecture, the Enhanced SIFT localization method, and the evaluation metrics. Section 4 presents the experimental configuration and results, including the GYU-DET classification benchmark [10], passive and active thermal classification, instance-level thermal-signature identification, crack-disjoint morphology evaluation, computational performance, crack-localization results, and the end-to-end localization-plus-classification evaluation. Section 5 summarizes the main findings, limitations, and directions for future work.
2. Proposed Framework and Overall Workflow
The proposed framework consists of two complementary branches: a MobileNetV4–CBAM classification branch and an enhanced SIFT-based localization branch. Since the localization module operates directly on the original thermal images, no image resizing is required for this stage. In contrast, the classification network requires fixed-size images containing a single crack instance. Therefore, all datasets undergo a preprocessing stage before training, which includes single-label Regions of Interest (ROIs) extraction and aspect-preserving image resizing. As shown in Figure 1, the RGB benchmark is evaluated using ROIs extracted from the bounding-box annotations provided with GYU-DET. For the thermal data, predefined crack locations on the engineered panels are used to prepare single-crack ROIs for classifier training and testing. The Enhanced SIFT method is evaluated separately on original thermal images. This design isolates the behavior of each stage and allows the classifier architecture to be studied without conflating its errors with localization errors. The workflow is lightweight in the sense that the learned component uses a MobileNetV4-medium backbone and the localization component requires no training. The reported computational measurements were obtained on a GTX 1650 GPU with 4 GB of VRAM. They characterize the tested desktop implementation and should not be interpreted as a measured UAV or embedded-system throughput. UAV integration is a prospective deployment direction rather than an experiment reported in this study.
Figure 1.
Overall workflow of the proposed MCS (MobileNetV4–CBAM/SIFT) framework.
2.1. Single-Label ROI Extraction
Original images may contain multiple defects or large background regions that are not relevant to the ROI classifier. Single-label ROIs are therefore extracted so that each classification sample contains one target defect. For Dataset 1, the ground-truth bounding boxes supplied with GYU-DET are used as crop references. GYU-DET contains 11,123 RGB images distributed by the dataset authors as training, validation, and test archives at an approximately 8:1:1 image-level ratio [10]. That public split is retained. ROI extraction is performed independently inside each archive, producing 37,632 training, 4929 validation, and 5886 test ROIs, or 48,447 single-defect crops in total. Because the number of defects per source image varies, the ROI counts do not preserve the original image-level ratio exactly; nevertheless, all ROIs from a given GYU-DET image remain inside the source archive assigned by the benchmark authors. DSTCD2026.Ver01 contains 6226 raw thermograms: 1581 passive images and 4645 actively heated images. ROI cropping yields 4332 and 16,254 classification samples, respectively. The original study partitioned these ROIs at 70:15:15, giving 3040/646/646 samples for Dataset 2 and 11,400/2383/2471 for Dataset 3. The ROI-level partition preserves representation of rare labels but does not ensure physical independence among the training, validation, and test subsets. Multiple views, heights, or acquisition conditions associated with the same physical crack may therefore occur in different subsets. The resulting 8-class and 64-instance ROI-level results are interpreted only as performance within the collected crack set. Generalization to previously unseen physical cracks is assessed separately through the crack-disjoint morphology evaluation described in Section 4.3.3. The 64-label experiment is retained as an instance-level identification task and is not used as an unseen-crack generalization test.
2.2. Aspect-Preserving Image Resizing
ROIs that are extracted are found to have varying aspect ratios. Making them square images would directly alter their geometric features like crack length, width and orientation, which are important. In order to keep such characteristics, various preprocessing methods are used for various data sets. In thermal data, each thermal ROI is resized to 224 × 224 pixels using letterbox resizing, which scales the larger dimension of the image while replacing the other with padding to maintain the image’s aspect ratio. For the RGB images in the GYU-DET dataset, the images are rescaled to a size of pixels and then fed to a Random Resized Crop with a range of scaling factors from 0.85 to 1.0. This augmentation allows increasing scalability without off-targeting the MobileNetV4–CBAM architecture. In this way, the data is equally split, providing an even comparison of the performance of the model. The proposed framework, which is presented in Figure 1, is divided into two phases. In the first step, the MobileNetV4–CBAM model is trained and tested on the three datasets. The model with the best validation accuracy will be chosen as the final model for classification, and the optimized parameters will be used in the next step of localization. Original thermal images are then used in the second stage, in which the improved SIFT algorithm is used to precisely pinpoint a crack area. These detected crack locations are then fused with prediction results generated by the trained MobileNetV4–CBAM (classifier) to get final output. This integration facilitates the localization within the proposed framework to be attained simultaneously with crack identification (crack type), which is essential for getting precise localization and reliable classification in a single inspection framework.
3. Methodology
3.1. Dataset Description
The framework is evaluated using the public GYU-DET RGB benchmark and the author-developed DSTCD2026.Ver01 thermal acquisition. RGB and thermal data are treated as separate evaluation domains; no paired RGB–thermal fusion is performed. Dataset 1 (GYU-DET) contains 11,123 high-resolution RGB images. DSTCD2026.Ver01 (Dataset2 Part A and B) contains 6226 raw thermograms obtained from four concrete panels containing 64 engineered crack configurations. The thermal acquisition is divided into passive and active conditions. Table 1 summarizes the parameters that are available in the study record.
Table 1.
The used Dataset 1: GYU-DET (2025) and DSTCD2026.Ver01 dataset (2026) specification. Width (W), Length (L), Depth (D), Distance (D), Angles (A), Varry (Var), Not specified (NS).
(1) Dataset 1 (GYU-DET): This data set [10] is a public bridge-surface benchmark released in 2025. It contains 11,123 high-resolution real-world RGB images annotated for six categories: Crack, Breakage, Honeycomb, Hole, Seepage, and Exposed Reinforcement (Figure 2A). The variety of defect types, backgrounds, and imaging conditions makes it useful as an independent external dataset for testing whether the proposed MobileNetV4-CBAM configuration transfers beyond the laboratory thermal specimens.
(2) Datasets 2 and 3—(DSTCD2026.Ver01): The proposed dataset comprises 6226 thermal images acquired from four concrete panels containing 64 engineered crack configurations as illustrated in Figure 2B–E. Images were captured with a FLIR C5 thermal camera at a fixed 60 cm stand-off distance. The dataset is divided into two acquisition parts:
- (A)
- Dataset 2: Passive Thermal Images were acquired under controlled laboratory ambient lighting (300–500 lux) without external thermal excitation, allowing only the intrinsic thermal characteristics of the cement surface and cracks to be observed, as illustrated in Figure 2G.
- (B)
- Dataset 3: Active Thermal Images were collected from the same concrete specimens using active thermography, where a 1000 W tungsten-halogen lamp provided thermal excitation from two illumination positions at three power levels (0%, 50%, and 100%). Depending on the lamp power and observation angle (from 0 to 180 degrees), the surface illuminance varied from approximately 0 to 17,300 lux, thereby enhancing the thermal contrast of subsurface and fine cracks, as shown in Figure 2. The stored data consist of colour-mapped thermograms rather than raw radiometric arrays. Emissivity, reflected apparent temperature, atmospheric transmission, heating duration, and a uniform post-heating acquisition delay were not recorded consistently during acquisition. The thermal images are therefore treated as spatial-contrast images for morphology recognition, and no quantitative inference of absolute surface temperature is made. The reported crack depths are manufactured specimen properties and are not estimated from the thermal images.
Figure 2.
Dataset description. (A) Dataset 1 (GYU-DET): 1–3 Breakage, 4–6 Crack, 7–9 Honeycomb, 10–11 Holes, 12–13 Seepage, 14–16 Exposed Reinforcement. (B–E) Crack distribution and numbering of the four concrete panels. (B) 1: Vertical; 2: Branch; 3: Branch; 4: Horizontal; 5: Diagonal; 6: Network; 7: Branch; 8: Diagonal; 9: L-shape; 10: Network; 11: Horizontal; 12: Horizontal; 13: X-shape; 14: Vertical. (C) 1: Branch; 2: X-shape; 3: Branch; 4: Network; 5: Angle; 6: Diagonal; 7: Diagonal; 8: Diagonal; 9: Vertical; 10: Horizontal; 11: Vertical; 12: Branch; 13: Diagonal; 14: Branch. (D) 1: X-shape; 2: Branch; 3: Diagonal; 4: Horizontal; 5: X-shape; 6: Diagonal; 7: Diagonal; 8: Angle; 9: Horizontal; 10: Diagonal; 11: Angle; 12: Network; 13: Horizontal; 14: Horizontal; 15: X-shape; 16: Diagonal. (E) 1: Horizontal; 2: Diagonal; 3: Diagonal; 4: Vertical; 5: Vertical; 6: Branch; 7: Horizontal; 8: Branch; 9: Diagonal; 10: Branch; 11: Diagonal; 12: Horizontal; 13: Diagonal; 14: Diagonal; 15: Network; 16: X-shape; 17: Diagonal; 18: Diagonal; 19: X-shape; 20: Diagonal. (G) Dataset 2 (passive) and (F) Dataset 3 (active) thermal images; labels give panel and crack index (e.g., B-7).
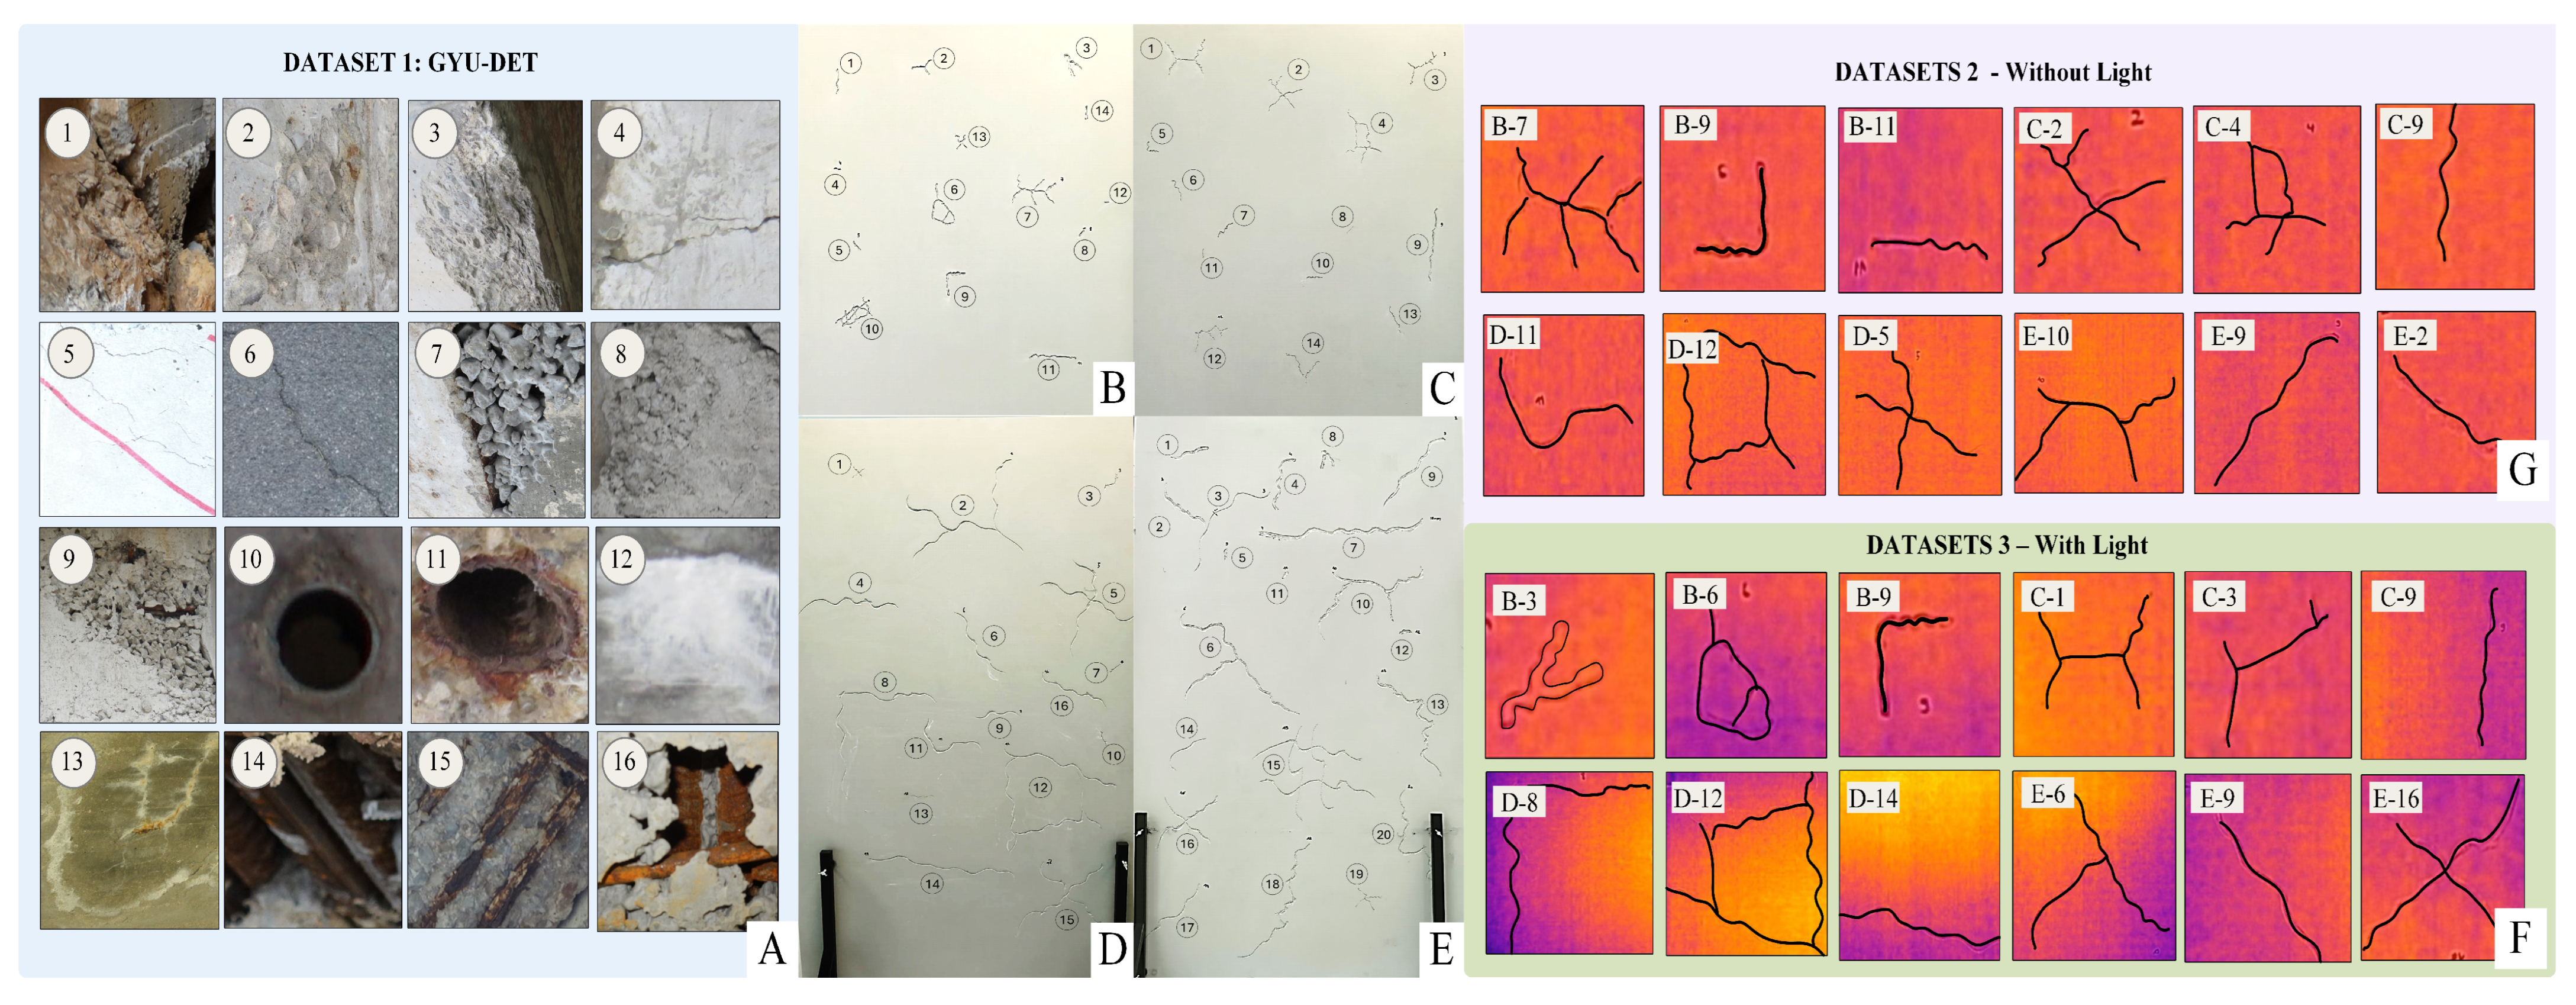
The thermal labels have hierarchical relationships. There are 8 classes of task-group samples by morphology—Angle, Branch, Diagonal, Horizontal, L-shape, Network, Vertical, and X-shape. For the 64-label task, individual engineered crack configurations are used. Geometric details of all specimens are provided in the subsection describing the 64-label thermal classification task. Accordingly, this task is referred to here as instance-level thermal-signature identification, because each label corresponds to a specific engineered physical crack rather than a general class of unseen cracks.
The DSTCD2026.Ver01 dataset is organized into two hierarchical levels. At the first level, cracks are categorized into eight representative morphological classes: Angle, Branch, Diagonal, Horizontal, L-shape, Network, Vertical, and X-shape, called coarse-grained. At the second level, each morphological class is further divided into a total of 64 fine-grained labels according to crack geometry and physical characteristics, called fine-grained. Across all classes, the cracks have widths ranging from 1 to 10 mm, lengths from 1.5 to 50 cm, and depths from 1 to 10 mm. Thermal images were acquired with a thermal camera positioned at a fixed stand-off distance of 60 cm. Data collection was performed from five viewing angles (, , , , and ) and multiple camera heights ranging from 20 to 175 cm to capture diverse inspection perspectives. Finally, the dataset is divided into two complementary subsets, enabling comprehensive evaluation of crack detection and classification algorithms under both passive and active thermographic inspection conditions. To support reproducibility and future research, the DSTCD2026.Ver01 dataset, along with the preprocessing scripts, will be open-sourced via a public repository upon acceptance of this manuscript.
3.2. Proposed Crack Classification Model Architecture
The classification branch maps a single-defect image to one of N labels through three stages: a pretrained MobileNetV4 (conv_medium) backbone, a channel-attention module, and a compact regularized classifier head (Figure 3, Table 2). Inputs are for Dataset 1 and for Datasets 2 and 3. The full forward pass, including the channel-attention gating and classifier head, is given in Algorithm 1; here we describe the stages and the role of each parameter. MobileNetV4 builds on Universal Inverted Bottleneck (UIB) blocks, which arrange depthwise and pointwise convolutions to balance spatial and channel transformations efficiently [22].
| Algorithm 1 MobileNetV4–CBAM Crack Classification |
|
Figure 3.
MnV4-CBAM architecture.
Table 2.
MobileNetV4–CBAM architecture and training configuration.
Each UIB block chains a depthwise convolution, a pointwise expansion, a second depthwise convolution, and a pointwise projection, closed by a residual connection. denotes the block input; , , , and the successive intermediate tensors; and the depthwise and pointwise convolutions; and / the layer/batch normalization steps. The backbone outputs a feature tensor , where C is the channel count and the spatial resolution. is then reweighted by the channel branch of CBAM [23] (Algorithm 1, lines corresponding to and ). We omit the spatial CBAM branch: since the input is already a cropped single-defect patch, the region of interest is effectively pre-isolated, so a spatial mask adds little discriminative value. The module pools with both global average pooling (GAP) and global max pooling (GMP); the two C-dimensional descriptors are passed through a shared two-layer MLP with bottleneck reduction ratio (a linear layer , a ReLU, and a linear layer ), summed, and gated by a sigmoid to produce the channel weights , which are applied to by channel-wise multiplication to give the attended tensor . Sharing one MLP across both pooling paths keeps the added parameter cost to a single projection.
The attended tensor is collapsed to a channel descriptor , then passed through a two-block MLP head () rather than a single linear layer. and are the weights and biases of the three linear layers, and the resulting hidden activations. Batch normalization and dropout, at rates and after the first and second layers respectively, counter overfitting on the small, imbalanced crack classes–a design recent crack-recognition work links to improved macro-F1 at negligible parameter cost [24]. The resulting logits are converted to the predicted class posteriors via softmax. The network is optimized with AdamW under cosine annealing with warm restarts, minimizing label-smoothed cross-entropy (smoothing ), with rare classes upweighted by an inverse-square-root WeightedRandomSampler.Training runs for up to 120 epochs with early stopping after 20 epochs without validation macro-F1 improvement. GYU-DET uses batch size 24; the thermal datasets use batch size 16. Thermal data are augmented with flipping, rotation, jitter, and affine transforms; GYU-DET uses RandomResizedCrop plus offline class balancing. The complete hyperparameter set is reported in Table 2.
The model is not a direct, unmodified application of MobileNetV4. Five task-specific modifications distinguish the final classifier used here: (1) the CBAM channel branch described above; (2) an MLP head with batch normalization and dropout, replacing the default terminal classifier; (3) an inverse-square-root WeightedRandomSampler instead of aggressive inverse-frequency weighting for class imbalance; (4) cross-entropy with label smoothing of ; (5) and AdamW with weight decay and cosine annealing with warm restarts, replacing the fixed-learning-rate optimizer used in earlier variants.
These choices were selected through the V1–V5 configuration study presented in the experimental results section, rather than assumed a priori. Focal-loss variants combined with aggressive weighting and augmentation degraded validation behavior on GYU-DET; reverting to cross-entropy, reducing augmentation severity, and using a moderate sampling strategy restored stable convergence. The final CBAM configuration achieved the best test macro-F1 among the reported configurations. The contribution is therefore a task-adapted MobileNetV4-CBAM classifier and training protocol, not a new MobileNetV4 backbone.
3.3. Crack Localization Model
The MobileNetV4–CBAM classifier described in the previous subsection identifies the type of a cropped crack image but does not determine the location of cracks within the original cement panel. An Enhanced SIFT localizer is introduced to detect crack regions directly from the full thermal image, without prior segmentation or manual annotation. Its core is the Scale-Invariant Feature Transform (SIFT) [25], extended with contrast enhancement, ridge filtering, ridge-guided keypoint gating, geometric clustering, and spatial quantization, which can localize the crack position in the image. Unlike the classification branch, which is trained using labeled crack patches, the Enhanced SIFT localizer is entirely training-free and relies solely on image features. This training-free and label-free localization stage works in parallel with the proposed classification model by generating bounding boxes around individual crack regions, which are then cropped and provided as input to the classifier. The outputs of the two branches are subsequently integrated to form the proposed hybrid framework, which performs both crack localization and classification. SIFT is selected because its scale- and rotation-invariant keypoint detector naturally responds to high-gradient structures characteristic of crack boundaries. Consequently, it can robustly localize thin, elongated thermal crack patterns with varying widths, lengths, and orientations while remaining insensitive to changes in viewing angle and image scale.
- A.
- Image enhancement and ridge filtering. Algorithm 2 details each stage, specifically designed for thermal crack localization. First, the input thermal image is enhanced using Contrast Limited Adaptive Histogram Equalization (CLAHE) [26] to improve local contrast and reveal low-contrast crack patterns (Equation (10)). The enhanced image is subsequently denoised using the Non-Local Means (NLM) filter [27], which suppresses thermal sensor noise while preserving fine crack boundaries (Equation (11)). A Frangi vesselness filter [28] is then applied to enhance elongated ridge-like structures corresponding to cracks while suppressing homogeneous background regions (Equation (12)).
- B.
- Keypoint detection. The denoised image is processed by SIFT, which detects scale- and rotation-invariant keypoints within a Gaussian scale space. The scale space is obtained by convolving with a Gaussian kernel (Equations (13) and (14)), and the Difference-of-Gaussian (DoG) image follows as in Equation (15). Candidate keypoints correspond to local extrema of across both image space and adjacent scales. Low-contrast responses and unstable edge points are removed using the standard DoG contrast threshold together with the Hessian principal-curvature criterion. Each remaining keypoint is represented by its image coordinates and characteristic scale. Unlike conventional SIFT applications, descriptor extraction and feature matching [29] are intentionally omitted. Since crack localization is performed on a single thermal image rather than image matching between multiple views, the 128-dimensional SIFT descriptor provides no additional localization benefit while substantially increasing computational cost. Consequently, only the detector stage is retained.
- C.
- Ridge-guided keypoint filtering. Although SIFT detects numerous stable keypoints, many originate from surface texture, specimen boundaries, or imaging artifacts. To suppress these false detections, the Frangi vesselness response is employed as a ridge confidence map. A detected keypoint is retained only if its vesselness exceeds the ridge threshold (Equation (16)), where denotes the ridge threshold. Keypoints located near the image borders or belonging to long Hough-line structures corresponding to the specimen frame are additionally removed.
- D.
- Geometric clustering. The remaining ridge-aligned keypoints are grouped into crack candidates using a Breadth-First Search (BFS) clustering algorithm [30]. Two keypoints are connected whenever their Euclidean distance satisfies Equation (17), where pixels.
- E.
- Spatial quantization. Finally, each detected bounding box is projected onto a fixed grid rather than preserving its original pixel coordinates. This quantization reduces localization uncertainty caused by keypoint jitter, improves robustness to small geometric variations, and provides a standardized spatial representation for the subsequent MobileNetV4–CBAM classifier. Compared with pixel-level localization, the lattice achieves an effective balance between localization precision and robustness by avoiding excessive sensitivity to noisy keypoints while preventing the merging of neighbouring crack regions. For each quantized frame, the geometric centroid is computed in pixel coordinates (Equation (19)) and exported to a plain-text file, so that every detection is reduced to a single machine-readable reference point. Once the physical panel dimensions are known, these centroids map directly back to positions on the specimen, converting a qualitative visual detection into a quantitative position measurement without re-inspecting the image. The complete localization pipeline, including CLAHE enhancement, Frangi ridge filtering, SIFT keypoint detection, ridge-guided filtering, BFS clustering, padded bounding-box generation, centroid extraction, and spatial quantization, is illustrated in Figure 1 and summarized in Algorithm 2. The corresponding implementation parameters are summarized in Table 3.Table 3. Parameters of the SIFT-based localization pipeline.
| Algorithm 2 Enhanced SIFT-Based Crack Localization |
|
The parameters in Table 3 fall into two groups. The SIFT detector settings (nfeatures, nOctaveLayers, contrast and edge thresholds, Gaussian ) retain the established OpenCV/ Lowe defaults, since the detector operates upstream of the task-specific stages; the CLAHE and Frangi settings (, black ridges) likewise follow their original formulations. The remaining task-specific parameters—the ridge threshold , clustering gap , minimum cluster size m, box padding, and the grid size—were fixed by a coarse grid search on the thermal validation subset that maximized localization F1 at a cell-IoU threshold of 0.5. Their values reflect the physical scale of the specimens: px bridges the typical spacing between ridge keypoints along a single crack without merging adjacent cracks; rejects isolated noise responses, as a genuine crack yields at least three ridge-aligned keypoints; and the lattice balances localization precision against robustness, since a coarser grid would merge neighbouring cracks while a finer one would fragment a single crack.
3.4. Evaluation Metrics
Both classification and localization metrics were performed on the proposed framework. The Accuracy, Precision, Recall, F1-score, Macro-F1 and Weighted-F1 metrics were used to measure classification performance. Precision, Recall and F1-score assess how well the model can identify the correct defect class, whereas Accuracy is used to measure the overall performance of the model. To take class imbalance into consideration, MacroF1 and Weighted-F1 were also included. The proposed cell-based IoU was employed in measuring the IoU of the predicted and ground-truth crack regions for localization. Moreover, the number of detected keypoints (KPT) and number of retained keypoints after ridge gating (KPA), detection time (DT), processing time (PT) and the peak memory usage (MU) were also recorded to evaluate the computational efficiency of the localization pipelining. Together, these metrics provide a balanced evaluation of the proposed framework in terms of recognition accuracy, localization quality, and processing efficiency [31]. The spatial quantization provides robust, hardware-friendly localization. Localization quality is therefore reported as a cell-based Intersection over Union (cell-IoU) at a threshold of 0.5, defined as the ratio between the number of grid cells shared by the predicted and ground-truth regions and the number of cells covered by their union.
4. Experiments and Results
As mentioned previously, the proposed MobileNetV4–CBAM model is evaluated using three datasets: the public GYU-DET bridge-defect benchmark, consisting of 6 classes, which serves as a reference dataset for comparison with existing methods to show the proposed model’s performance and compare with previous researchers’ results, and the DSTCD2026.Ver01 (Datasets 2 and 3) consists of 8 and 64 labels, namely the without-light (passive) dataset and the with-light (active) dataset. For whole datasets 2 and 3, the model is evaluated under two labeling schemes: an eight-class taxonomy, in which cracks are grouped according to their morphological characteristics, and a sixty-four-class taxonomy, in which each individual crack instance is treated as a separate class. Performance is evaluated on the testing set, while model selection is based on the validation set. All experiments were carried out on a single-GPU workstation running Microsoft Windows 11, equipped with an entry-level NVIDIA GeForce GTX 1650 graphics card limited to 4 GB of VRAM.The software stack was built on Python 3.11.0 with PyTorch 2.5.1 compiled against CUDA 12.1, which exposes GPU-accelerated tensor algebra and cuDNN-backed convolution kernels to the training loop. The restricted 4 GB memory budget directly constrained the admissible batch size and reinforced the selection of a lightweight MobileNetV4-medium backbone; rather than a limitation, this setup substantiates that the proposed classifier remains fully trainable on commodity hardware and does not depend on high-end accelerators. The classification results for each class are described as follows.
4.1. Classification Model Parameter Setting
The final configuration was selected through iterative experiments on the GYU-DET validation set; the 5886-ROI test set was used only for the reported final comparison. All V1–V5 variants (Table 4) used the same ImageNet-pretrained MobileNetV4 conv_medium backbone and a 512 -> 256 -> 6 MLP head with learning rate and weight decay , while attention, loss weighting, resolution, augmentation, and scheduling were varied. V2–V4 combined focal loss with stronger weighting and augmentation and performed worse. V5 restored a cross-entropy protocol and recovered stable performance. The final version replaced SE with channel-only CBAM and used label smoothing, inverse-square-root sampling, AdamW, cosine warm restarts, moderate dropout, and 384-pixel input. Table 4 summarizes the iterative configuration search used during model development and is not treated as a controlled ablation. To examine the effect of individual design choices with less confounding, a separate one-factor sensitivity analysis is reported below. Each variant changes one component of the final configuration, while the previously reported final-model result is retained as a reference.
Table 4.
Configuration variants (V1–V5) and test results on Dataset 1. Acc: overall accuracy; F1: macro-F1.
In this sensitivity analysis, each new variant is derived from the final configuration by changing one component: the CBAM channel branch is replaced by an identity mapping, the MLP head by a single linear layer, label-smoothed cross-entropy by standard cross-entropy, and cosine annealing with warm restarts by AdamW at a fixed learning rate of . The ablated variants use the same public GYU-DET split, input resolution, augmentation, batch size, optimiser, maximum epoch count, early-stopping patience, checkpoint-selection criterion, and test procedure. Each ablated variant was trained once using the same random seed. The full-model row reports the previously published result of the final configuration and was not rerun as part of the post-review sensitivity analysis. The inverse-square-root sampler is retained in all variants and is therefore not isolated in this analysis.
Table 5 shows that each of the four isolated components contributes positively, and that the largest contribution is not architectural. Removing cosine annealing with warm restarts costs the most ( macro-F1, weighted F1), followed by the MLP head ( macro-F1), label smoothing () and the CBAM channel branch (); the last two differ by 0.14 points and are not separable at a single seed. Every isolated component contributes and none is redundant, which supports describing the classifier as a task-adapted configuration rather than an unmodified backbone. Two of the four contributions, the learning-rate schedule and label smoothing, add no parameters at all, and the two architectural additions together account for 0.74 M parameters, under 10% of the model. The selected configuration therefore improves recognition without materially enlarging the network.
Table 5.
One-factor sensitivity analysis of the final MobileNetV4–CBAM configuration. Final MobileNetV4–CBAM classifier (full model), without (w/o).
4.2. Classification on the Public GYU-DET Dataset
The performance of the proposed model on Dataset 1 is summarized in Table 6, with the corresponding confusion matrix presented in Figure 4.
Table 6.
Per-class results on the dataset 1. Acc: Accuracy; P: Precision; R: Recall; F1: F1-score; n: support.
Figure 4.
Confusion matrix of the proposed model on the six-class GYU-DET benchmark.
As the results show, Table 6 presents the detailed classification performance of the proposed framework on Dataset 1. The model achieves an overall weighted F1-score of 83.16%, demonstrating its effectiveness in recognizing different cement surface defect categories. Among individual classes, Breakage achieves the highest F1-score of 85.89%, followed by Crack (85.09%) and Reinforcement (80.66%), indicating strong recognition capability for common structural defects. The model also maintains satisfactory recall values for most classes, which is important for practical crack inspection where missing potential defects should be minimized. Due to the imbalanced distribution of the dataset, the macro-average and weighted-average results provide complementary performance evaluations. The macro-average F1-score reaches 74.78%, reflecting the model’s ability to handle different defect categories equally, including minority classes such as Holes and Seepage. In comparison, the weighted-average F1-score of 83.16% represents the overall performance considering the number of samples in each category. The difference between these two metrics highlights the influence of class imbalance, while still demonstrating that the proposed framework provides reliable classification performance across diverse cement defect types.
4.3. Classification on Dataset 2 and Dataset 3
4.3.1. Coarse-Grained Morphology Classification (8 Classes)
Table 7 presents the classification performance of the proposed framework on the 8-class crack taxonomy under passive thermal imaging (Dataset 2) and active thermal imaging (Dataset 3), with the corresponding confusion matrices shown in Figure 5.
Table 7.
Per-class results on the 8-class taxonomy for Dataset 2 (passive, without-light) and Dataset 3 (active, with-light). Acc: accuracy; P: precision; R: recall; F1: F1-score; n: support.
Figure 5.
Confusion matrices for the 8-class taxonomy. (A) Dataset 2 (passive, without light) and (B) Dataset 3 (active, with light).
The ROI-level results in Table 7 characterize classification performance within the 64 engineered cracks of DSTCD2026.Ver01 under passive and active thermal acquisition. Because ROIs of the same physical crack appear in both the training and test subsets of this partition, these results do not support conclusions about generalization to unseen physical cracks; that question is addressed by the crack-disjoint evaluation in Section 4.3.3. In the case of Dataset 2, with the various distributions of the samples, the F1 score of the framework is 92.25% weighted and 91.13% macro-average, which shows that despite the differences in the various crack geometries, the performance of the framework in both cases is pretty good. The best F1 scores are achieved for the Vertical (98.41%), Horizontal (95.65%), and Diagonal (94.15%) cracks, showing the capability of the model for recognizing the clearly defined crack structures. It may be observed that even though the image shows some more complicated geometric shapes of X-shape and Angle cracks, the F1 score is still satisfactory, which is 82.88% for X-shape cracks and 85.71% for Angle cracks.
The proposed framework also boosts its performance under active thermal imaging conditions (Dataset 3) with a WF1-score of 92.69% and a macro-average F1-score of 93.10%. The recognition accuracy for L-shape (99.21%), Network (96.75%) and Branch (93.99%) cracks achieved by the model is excellent due to the active illumination (enhanced thermal contrast). These five morphologies with cracks all show an increase in configurations with active junctions, and the three classes without any cracks show a decrease in configurations with imposed heat flow, and we have a separation of classes as expected: imposed heat flow accumulates at the intersection of cracks, creating topological cues that are not available in a single-segment straight crack. The RGB-thermal framework proposed for crack inspection revealed good consistency between the passive thermal dataset and active thermal dataset, implying its resisting performance in the condition of various thermal imaging conditions. Both the macro-average and weighted-average F1 scores achieve very close scores, suggesting that the model has equal classification ability for each of the crack types and it is not overly biased toward the most dominant types of cracks. These results show that the same classifier configuration can operate under both passive and active thermal image conditions. The data do not, however, isolate the causal effect of heating, because the acquisition pools differ in size and contain repeated views of engineered cracks.
4.3.2. Instance-Level Thermal-Signature Identification (64 Labels)
The classification performance of the model on Dataset 2 under the 64-class fine-grained taxonomy (passive acquisition) is presented in Table 8. It is a more difficult experiment, as the model is required to differentiate among crack categories, which have similar geometric patterns and various crack widths, lengths, and crack depths. Compared with previous classification problems, the data classified through the proposed framework achieve a weighted average F1-score of 86.67%, precision of 88.66%, and recall of 87.46%, which shows the capacity of the proposed framework to perform the recognition of the subtle variations of crack classes with the thermal data even without the presence of active illumination. The overall macro-average F1-score of 83.70% suggests that the model can generally be used to classify between various categories of cracks, including the smaller classes. Multiple categories of cracks show a good recognition performance, and several classes have F1-scores greater than 95%, such as Diagonal [0.2_4_0.2], Diagonal [0.6_5_0.4], Horizontal [0.1_2_0.2], Horizontal [0.3_1.5_1], Network [0.5_10_0.3], and several Vertical crack categories. These results demonstrate the effectiveness of the proposed attention-based feature extraction strategy in capturing thermal patterns associated with different crack characteristics. The tables reveal a relatively lower performance of some categories, which is primarily attributed to the small sample size to the right of the table, and also the high similarity in the appearance of fine-grained cracks. For instance, a few subclasses such as Branch and X-shape have only a few samples, and thus they are more vulnerable to intra-class variations and classification uncertainty. However, their gap is not too significant, meaning the model does not face a problem of being dominated by the high-occurring classes and can have a balance between different types of crack patterns. These results show that in a passive thermal situation (no external heating source), the proposed lightweight RGB-thermal framework approach is able to distinguish cracks in detail. In fact, in a practical nighttime inspection, low-disruption thermal imaging would be useful in providing additional information relating to cracks when a conventional RGB image is insufficient.
Table 8.
Per-label results for passive 64-instance identification under passive (without-light) acquisition. Acc: accuracy; Pre: precision; Re: recall; F1-sc: F1-score; n: support.
Table 9 presents the detailed classification performance of the proposed framework on the 64-class fine-grained crack taxonomy under active thermal imaging conditions. Compared with passive thermal acquisition, active thermography provides enhanced thermal contrast by introducing an external illumination source, allowing the model to capture more discriminative features related to crack geometry and severity variations. Despite the increased difficulty of distinguishing 64 fine-grained categories, the proposed framework achieves a weighted average F1-score of 84.66%, with a precision of 87.51% and recall of 84.42%, demonstrating its capability for detailed crack classification under active thermal conditions. The macro-average F1-score reaches 76.28%, reflecting the model’s ability to recognize diverse crack categories while considering the influence of minority classes. Several crack categories achieve excellent classification performance, including Angle [0.4_33.1_0.4], Branch [0.4_6_0.3], Branch [0.9_21_0.2], Network [0.5_10_0.3], Network [0.5_33.5_0.4], L-shape [0.4_7_0.2], and several Vertical and X-shape subclasses, with F1-scores above 95%. These results indicate that active thermal imaging provides valuable information for distinguishing crack patterns with different geometric characteristics. Some fine-grained categories still present classification challenges, particularly those with limited samples or similar thermal responses. For example, several Diagonal and X-shape subclasses achieve lower F1-scores due to their small sample size and visual similarity with other crack patterns. Nevertheless, the overall weighted performance remains high, demonstrating that the proposed framework can effectively extract thermal features under active illumination conditions. The close relationship between precision, recall, and F1-score indicates stable classification behavior across the dataset. The results confirm that the proposed lightweight RGB-thermal framework is capable of performing fine-grained crack recognition using active thermal imaging, providing a reliable solution for nighttime and low-illumination structural inspection where enhanced thermal contrast can improve defect visibility.
Table 9.
Per-label results for active 64-instance identification fine-grained taxonomy under active (with-light) acquisition. Acc: accuracy; P: precision; R: recall; F1: F1-score; n: support.
4.3.3. Crack-Disjoint Morphology Evaluation
To evaluate morphology recognition on previously unseen physical cracks, an additional grouped evaluation was performed using physical crack ID as the grouping variable. The dataset contains 64 physical cracks distributed unevenly among the eight morphology classes: Angle (3), Branch (11), Diagonal (20), Horizontal (11), L-shape (1), Network (5), Vertical (6), and X-shape (7), as summarized in Table 10. Since L-shape is represented by only one physical crack and Angle by only three, a reliable grouped evaluation of all eight classes cannot be formed from the available specimens. The crack-disjoint analysis was therefore restricted to the six classes represented by at least five independent physical cracks: Branch, Diagonal, Horizontal, Network, Vertical, and X-shape.
Table 10.
Number of physical cracks and ROI images per morphology class in Dataset 2.
For each grouped run, physical crack IDs were assigned exclusively to the training, validation, or test subset, with zero crack-ID overlap among the three subsets. Five such runs were generated by repeating the crack-level assignment with different random draws; because the same crack may be held out in more than one run, the runs are not statistically independent and are reported as repeated evaluations rather than as folds of a cross-validation. Table 11 reports the overall result of each run and Table 12 reports the corresponding per-class means and standard deviations.
Table 11.
Overall results of the five crack-disjoint evaluation runs on Dataset 2 (six classes).
Table 12.
Per-class results across the five crack-disjoint runs on Dataset 2, mean ± SD (%).
Across five crack-disjoint evaluation runs on Dataset 2, the classifier achieved an accuracy of % and a macro-F1 of %. The variation among runs and classes indicates sensitivity to the physical cracks selected for testing, but the results demonstrate that morphology recognition remains feasible when observations of the test cracks are excluded from model development.
4.4. Cross-Dataset Performance Interpretation and External-Benchmark Scope
Although YOLOv11n performs joint localization and classification, whereas the proposed model classifies ground-truth defect regions, the comparison between the two results remains informative when interpreted with appropriate caveats. YOLOv11n receives a full image and must both locate and classify defects; its AP@0.5 metric integrates precision–recall behavior over detections and is conditioned on bounding-box localization overlap. The proposed MobileNetV4-CBAM result in Table 6 instead assumes that a defect ROI is already available and reports class-wise precision, recall, and F1-score under this assumption. Because the two metrics quantify different tasks, a direct percentage-point or relative-improvement comparison between them would be methodologically misleading; the two results are therefore reported separately rather than combined into a single comparative figure.
Table 13 situate these per-class results against the YOLOv11n baseline reported on the same benchmark by Li et al. [10], which achieved an overall mAP@0.5 of 0.568 across the six defect categories using full bounding-box supervision. Three comparisons remain valid and are summarized below. First, the proposed classifier reaches a weighted F1 of 0.8316 while requiring only region-level labels rather than the bounding-box annotations needed to train YOLOv11n—a meaningful reduction in annotation cost for a benchmark of this scale. Second, the relative difficulty ranking of defect classes shifts once localization is decoupled from classification: Crack, reported as one of YOLOv11n’s two lowest-scoring categories (AP@0.5 = 0.455, attributed by the original authors to blurred boundaries and irregular shapes), becomes the proposed classifier’s second-best category (F1 = 0.8509), while Seepage remains the weakest class under both approaches (AP@0.5 = 0.465 vs. F1 = 0.5318). This divergence supports the design motivation for separating classification from localization: irregular, thin defects that are hard to localize precisely with a bounding box can still be classified reliably once a region proposal is supplied. Third, the proposed classifier achieves this recognition performance while training on a single entry-level 4 GB GPU, without the heavier feature-fusion or multi-scale attention stages used by several recent bridge-defect detectors (see Introduction). Beyond the GYU-DET comparison, the proposed classifier’s behavior on the thermal datasets follows a consistent pattern with respect to class imbalance and taxonomy granularity. All weighted F1 values in the thermal eight-class experiments exceed 0.92 and are similar for the two acquisition conditions, indicating stable performance regardless of passive or active illumination. Larger differences appear in the 64-instance experiment, with passive data reaching a weighted F1 of 0.8667 and active data reaching 0.8466, and macro-F1 values of 0.8370 and 0.7628, respectively; weak performance on a small number of minority instance labels is what drives the lower macro-F1 under active acquisition. This 64-instance split is not physically grouped by crack or panel and is not intended as a definitive measure of generalization, but rather as a descriptive characterization of instance-level distinguishability.
Table 13.
Class-wise comparison between YOLOv11n detection (AP@0.5, test set, [10]) and the proposed MobileNetV4-CBAM classifier (Precision, Recall, F1-score) on GYU-DET. AP@0.5 and F1-score are not numerically commensurable; class-wise ranking and relative difficulty are the intended takeaways.
Figure 6 presents the training and validation cross-entropy losses for the thermal experiments. All four configurations show decreasing and bounded loss trajectories. The transient increases observed near the scheduled warm-restart epochs are followed by further reductions in validation loss. Dataset 3 reaches its early-stopping criterion in fewer epochs than Dataset 2, while each epoch requires more time because of the larger training set. These convergence curves describe optimization behavior on the reported partitions and do not address the statistical dependence introduced by ROI-level splitting. Figure 6 traces the cross-entropy loss across epochs for both taxonomies on the two thermal datasets. In every configuration, the training and validation curves descend jointly and settle without divergence, confirming that the AdamW optimiser under cosine annealing with warm restarts recalibrates the weights toward a stable minimum. The fine-grained tasks start from a higher entropy floor (≈3.4–4.0 vs. ≈1.6–1.9 for the 8-class case), a direct consequence of the 64 overlapping instance classes.
Figure 6.
Convergence behaviour of the proposed MobileNetV4–CBAM model, showing training and validation loss versus epoch. (A) 8-class and (B) 64-class taxonomies on Dataset 2; (C) 8-class and (D) 64-class taxonomies on Dataset 3.
The wider train–validation margin under 64-class labelling reflects the heavier imbalance and near-identical crack dimensions reported in Table 8 and Table 9, while the bounded validation loss, showing no sustained increase, confirms that the regularized head batch normalization, dropout, and label smoothing (0.05) preserve convergence stability without overfitting. The transient bumps near epochs 10 and 30, visible in all four panels, coincide with the scheduled warm restarts of the learning rate and are followed by deeper minima, rather than indicating instability. Dataset 3 reaches its early-stopping plateau within ≈45 epochs, compared with ≈90 epochs for the smaller Dataset 2, since its larger training pool (11,400 vs. 3040 images) yields more gradient updates per epoch and an earlier validation optimum. To assess the practical deployability of the proposed classifier on entry-level hardware, Table 14 summarises the wall-clock training and inference costs measured on the two thermal datasets under the coarse-grained (8-class) and fine-grained (64-class) protocols. On the passive dataset (Dataset 2), the network converged in 86 and 89 epochs for the coarse- and fine-grained tasks, respectively, at a near-constant 41 s per epoch, bounding the total training time to roughly one hour in each case. The active dataset (Dataset 3), which contains a substantially larger augmented training pool, demanded about 150 s per epoch yet converged in markedly fewer epochs (44–45); the denser per-epoch gradient signal accelerated convergence in epoch count while keeping the total budget below two hours. At inference, every prediction aggregates three test-time augmentation passes—the original frame together with its horizontal and vertical reflections. Measured over the larger 2471-image partition, the model sustains 14.3–14.5 ms per image; on the smaller 646-image partitions, the per-image latency rises to 21–33 ms as fixed kernel-launch and synchronization overhead is amortized over fewer samples together with run-to-run measurement variability on the entry-level GPU. Even under the worst-case 33 ms figure, the pipeline processes approximately 30 images per second on a 4 GB GPU, a throughput adequate for batch screening of thermographic inspection imagery. Table 14 presents the training time and the inference time of the classifiers on GTX 1650. This passive training takes about 59–61 min and the active training takes approximately 110–114 min. Test time augmentation of 3 passes allows the inference of classifiers to vary starting from 14 to 33 ms per ROI. The above values indicate that the learned classifiers are not very complex on the tested GPU.
Table 14.
Training and classifier inference cost on the thermal datasets (NVIDIA GTX 1650, 4 GB). Inference latency includes TTA×3 and is not an end-to-end pipeline time.
4.5. Crack Localization
The classifier presented in this section assumes that each input image contains a single isolated crack. In practice, however, a raw thermographic panel may contain multiple crack regions that must first be separated before classification. Manually annotating bounding boxes for all 6226 thermograms is labor-intensive and impractical. Therefore, as the second stage of the proposed framework, an Enhanced SIFT-based crack localization method is introduced to automatically identify crack regions from the thermal response. Following the separate localization evaluation, a complete end-to-end experiment was performed in which regions predicted by Enhanced SIFT from the raw thermograms were cropped and passed directly to MobileNetV4–CBAM without using ground-truth localization. The matching protocol and combined localization-plus-classification results are reported in Section 4.6.
Table 15 shows the performance of the proposed Enhanced SIFT localization method under both passive (without-light) and active (with-light) image acquisition. The results were, overall, slightly better for the passive dataset, with average values of 0.860, 0.919 and 0.888 for the precision, recall and F1 scores, respectively, compared with 0.846, 0.890 and 0.867 for the active dataset. The F1 scores were over 0.90 for most types of crack in a passive acquisition setting, with L-shape, Horizontal and Diagonal performing best (0.947, 0.943, and 0.940, respectively). The results in terms of localization under active illumination were most promising for L-shape (0.984) and Network (0.981); F1-scores of all the other cracks were also well above 0.84, with only minor fluctuations. The passive mean IoU values were between 0.733 and 0.794, while in most cases the mean IoU scores increased under active acquisition, with a score of up to 0.875 for L-shape and 0.866 for Network Class cracks. On top of that, the localization process took about 1.3–4.6 msec per crop to detect SIFT features and less than 111 msec for the entire localization pipeline, and consumed almost constant memory of about 200 MB during the localization process, showing that the proposed method is accurate and time/efficient in both imaging conditions for the crack localization process.
Table 15.
Unsupervised localization per crack type under passive and active acquisition. P/R/F1 and mean cell-IoU at a threshold; KPT/KPA: keypoints per image/crack; DT/PT: SIFT-detection and full-pipeline time per crop; MU: memory.
Figure 7 illustrates the successive stages of the Enhanced SIFT localization pipeline for representative passive and active thermograms. Green points indicate keypoints retained after ridge-guided filtering, whereas red points indicate rejected keypoints. Distinct colours distinguish the BFS crack clusters, and the corresponding grid-mapped regions use the same colours. Figure 8 illustrates the final frame-based localization output on one panel from each thermal dataset. Each crack region produced by the training-free SIFT stage is snapped to its enclosing integer cell of the grid, referred to as a frame, converting a purely visual detection into an explicit numerical statement of crack position. The panel is displayed in grayscale while the original radiometric appearance is preserved only inside the detected frames, drawing attention to the damaged areas; the grid is overlaid as a spatial reference with pixel-annotated axes. For every frame, the geometric centroid is projected onto both axes by dashed guide lines, yielding a single representative coordinate pair per crack, which is simultaneously written to a plain-text file so the same information is available in machine-readable form. Because the frames are obtained from the annotation-free SIFT clustering, these localization outputs require neither labeled data nor a trained detector, and can be reported, stored, and reused without re-inspecting the image.
Figure 7.
Enhanced SIFT localisation pipeline on one thermogram from each condition: (A) Dataset 2 (passive) and (B) Dataset 3 (active). Left to right: original thermogram; stage 1, CLAHE and Frangi ridge filtering; and stages 2–3, SIFT keypoints with ridge-guided gating (retained in green, rejected in red); stage 4, BFS clustering with each candidate in a distinct colour; stage 5, boxes quantized onto the lattice and compared against the ground-truth cells; rightmost, the detected frames overlaid on the panel.The grid-mapped regions use the same colours as their corresponding BFS clusters.
Figure 8.
Frame-based localization on the grid: (A) Dataset 2 (passive) and (B) Dataset 3 (active). The panel is rendered in grayscale with the radiometric appearance preserved only inside the detected frames; dashed guides project each frame centroid onto the pixel axes (origin at the bottom-left corner).
4.6. End-to-End Localization and Classification
The complete thermal inspection pipeline was evaluated from the raw thermogram to the final morphology prediction. Enhanced SIFT first generated candidate crack regions, which were cropped and passed directly to MobileNetV4–CBAM for classification. Predicted and ground-truth instances were matched one-to-one using a cell-IoU threshold of 0.5 on the grid. A true positive required both a valid spatial match and the correct morphology label. Unmatched predictions were counted as false positives, unmatched ground-truth instances as false negatives, and a spatially matched prediction with an incorrect class contributed a false positive for the predicted class and a false negative for the ground-truth class.
The resulting end-to-end micro-F1 scores are 78.62% for Dataset 2 and 75.24% for Dataset 3. Classification accuracy on spatially matched regions is 88.50% and 86.77%, respectively. The reduction relative to the separate classification results reflects the combined effect of localization misses and classification errors. Boundary-truncated cracks remain difficult because the predicted crop may not contain the complete morphology required for reliable classification. Table 16 presents the end-to-end performance for each crack type, while Table 17 summarizes the evaluation counts and classification accuracy on spatially matched regions.
Table 16.
End-to-end performance for the eight crack types (%).
Table 17.
Evaluation counts and classification accuracy on spatially matched regions.
5. Conclusions
This work presented a framework that pairs a task-adapted MobileNetV4-CBAM classifier with a training-free Enhanced SIFT localization method for lightweight cement-defect inspection. It delivers measurable improvements across three fronts: recognition reliability on an independent public benchmark, consistent behaviour across two thermal acquisition conditions, and a lightweight computational footprint compatible with resource-constrained platforms. The main research achievements, limitations, and directions for future work are summarized below.
5.1. Research Achievements
- (a)
- The classifier delivers strong region-level recognition without a heavy training footprint. On the independent public GYU-DET RGB benchmark, it reached a weighted F1-score of 0.8316 and a macro-F1-score of 0.7478, achieved using only region-level labels rather than the full bounding-box annotations required to train the YOLOv11n baseline reported on the same benchmark (mAP@0.5 = 0.568)—a meaningful reduction in annotation cost at this dataset scale.
- (b)
- The original ROI-level eight-morphology evaluation reached weighted F1-scores of 0.9225 and 0.9269 under passive and active acquisition, respectively; these values characterize performance within the collected set of physical cracks. In the crack-disjoint evaluation on six morphology classes with sufficient physical-crack diversity, Dataset 2 achieved % accuracy and % macro-F1 across five grouped runs, providing a more conservative estimate of morphology recognition on previously unseen physical cracks.
- (c)
- The 64-label thermal experiment reached weighted F1-scores of 0.8667 and 0.8466 under passive and active acquisition, respectively. Since each label corresponds to a specific engineered physical crack, these results are interpreted only as within-dataset instance-level thermal-signature identification and not as generalization to unseen physical cracks. The Enhanced SIFT localizer achieved stage-wise F1-scores of 0.888 and 0.867 under passive and active acquisition. When localization and classification were evaluated jointly from the raw thermogram, the end-to-end micro-F1 scores were 0.7862 and 0.7524 for Datasets 2 and 3, respectively.
- (d)
- The complete framework was trained and evaluated on a single entry-level 4 GB GPU (NVIDIA GTX 1650), without reliance on high-end accelerators. The Enhanced SIFT localization stage requires no training data, completes in under 111 ms per crop, and consumes approximately 200 MB of memory–a footprint compatible with the payload and power constraints of UAV-mounted or edge-computing hardware. Combined with the removal of bounding-box annotation requirements, this indicates that the framework is a strong candidate for UAV-assisted inspection, although UAV-mounted validation itself remains future work.
5.2. Limitations and Future Work
- (a)
- RGB and thermal data were evaluated as separate domains, and no paired RGB–thermal fusion was performed. Future work will examine paired acquisition and explicit multimodal fusion strategies.
- (b)
- The number of independent physical cracks is limited and highly uneven among morphology classes. In particular, L-shape is represented by one physical crack and Angle by three, preventing a reliable crack-disjoint evaluation of all eight morphology classes. The grouped analysis is therefore restricted to classes with sufficient physical-crack diversity.
- (c)
- Emissivity, reflected apparent temperature, atmospheric transmission, heating duration, and a uniform post-heating acquisition delay were not recorded consistently, and the stored images are colour-mapped thermograms rather than raw radiometric arrays. The present thermal analysis is therefore limited to spatial image contrast and morphology rather than quantitative temperature estimation.
- (d)
- The end-to-end evaluation shows lower performance than the separately evaluated localization and classification stages, particularly for boundary-truncated cracks whose complete morphology is not visible in the detected crop. Future work will investigate context-aware region expansion and handling of partially visible crack instances.
- (e)
- UAV-mounted implementation was not evaluated experimentally. Future work will assess onboard latency, memory use, power consumption, and complete inspection throughput on embedded and UAV-mounted hardware.
Author Contributions
A.J.M.: conceptualization, methodology, validation, formal analysis, investigation, writing—original draft, writing—review and editing, visualization, supervision, project administration. B.T.P.: conceptualization, methodology, software, formal analysis, investigation, writing—original draft, writing—review and editing, visualization. A.S.K.: methodology, validation, formal analysis, investigation, writing—review and editing, visualization. Q.N.: software, validation, formal analysis, resources, data curation. S.A.E.: validation, formal analysis, investigation, writing—original draft, writing—review and editing, project administration. A.K.: validation, formal analysis, investigation, writing—review and editing, visualization. D.B.: conceptualization, methodology, software, validation, formal analysis, investigation, resources, data curation, writing—review and editing, visualization, supervision, project administration. All authors have read and agreed to the published version of the manuscript.
Funding
This research was funded by the Guangdong Province Science and Technology Department under the International Collaboration Program, grant numbers 2023A0505050094 (“Structural Damage Detection Methods Based on Digital Twins and Transfer Learning”, 2023–2026) and 252025061952800006 (“Monitoring Cracks in Bridge Infrastructure Using Fourier-Expert Mixture (FMOE-YOLO) and Digital Twin Models”, 2026–2028), and by the PHC PARROT Programme, grant number 48992SA, jointly funded by the French Ministry for Europe and Foreign Affairs, the French Ministry for Higher Education and Research, and the Estonian Research Council (2022–2024).
Institutional Review Board Statement
Not applicable.
Informed Consent Statement
Not applicable.
Data Availability Statement
Data collected for this study are available by request through the corresponding author.
Acknowledgments
The Authors thank Robotics & Automation Research Lab (RARL Lab, https://rarl-lab.com/ (accessed on 13 September 2026)) and Smart Structural Health Monitoring and Control for resilient, safe infrastructure (SSHMC: https://www.sshmc.org/ (accessed on 13 September 2026)) for their help and support.
Conflicts of Interest
The authors declare no conflicts of interest. The funders had no role in the design of the study; in the collection, analyses, or interpretation of data; in the writing of the manuscript; or in the decision to publish the results.
Abbreviations
The following abbreviations are used in this manuscript:
| BFS | Breadth-First Search |
| CBAM | Convolutional Block Attention Module |
| CLAHE | Contrast Limited Adaptive Histogram Equalization |
| CNN | Convolutional Neural Network |
| DoG | Difference of Gaussian |
| GAP | Global Average Pooling |
| GMP | Global Max Pooling |
| IoU | Intersection over Union |
| NLM | Non-Local Means |
| ROI | Region of Interest |
| SHM | Structural Health Monitoring |
| SIFT | Scale-Invariant Feature Transform |
| TTA | Test-Time Augmentation |
| UIB | Universal Inverted Bottleneck |
References
- Zinno, R.; Haghshenas, S.S.; Guido, G.; Vitale, A. Artificial intelligence and structural health monitoring of bridges: A review of the state-of-the-art. IEEE Access 2022, 10, 88058–88078. [Google Scholar] [CrossRef] [Scilit]
- Khlifati, O.; Baba, K.; Tayeh, B.A. Survey of automated crack detection methods for asphalt and concrete structures. Innov. Infrastruct. Solut. 2024, 9, 438. [Google Scholar] [CrossRef] [Scilit]
- Amirkhani, D.; Allili, M.S.; Hebbache, L.; Hammouche, N.; Lapointe, J.-F. Visual concrete bridge defect classification and detection using deep learning: A systematic review. IEEE Trans. Intell. Transp. Syst. 2024, 25, 10483–10505. [Google Scholar] [CrossRef] [Scilit]
- Bassir, D.; Chang, H.; Majak, J. Real-time crack detection on concrete using non-destructive approaches based on YOLO series: Review. In Advances in Machinery, Materials Science and Engineering Application X; IOS Press: Amsterdam, The Netherlands, 2024. [Google Scholar] [CrossRef] [Scilit]
- He, Z.; Su, C.; Deng, Y. A novel MO-YOLOv4 for segmentation of multi-class bridge damages. Adv. Eng. Inform. 2024, 62, 102586. [Google Scholar] [CrossRef] [Scilit]
- Zhang, J.; Chen, Z.; Zou, H.; Xue, S.; He, J.; Li, J. GBC-BCD: An improved bridge crack detection method based on bidirectional Laplacian pyramid structure with lightweight attention mechanism convolution. Nondestruct. Test. Eval. 2025, 40, 1053–1073. [Google Scholar] [CrossRef] [Scilit]
- Bai, Y.; Xu, Q.; Miao, S. Efficient crack detection algorithm for concrete bridges based on improved YOLOv8n. J. Real.-Time Image Process. 2026, 23, 50. [Google Scholar] [CrossRef] [Scilit]
- Deng, J.; Chen, X.; Hua, L.; Lu, Y.; Che, J.; Chen, X.; Shen, Y.; Chen, Y. Attentive sparsity and bidirectional fusion for efficient crack instance segmentation in UAV-based bridge inspection. Results Eng. 2026, 30, 110890. [Google Scholar] [CrossRef] [Scilit]
- Dong, X.; Yuan, J.; Dai, J. Study on lightweight bridge crack detection algorithm based on YOLO11. Sensors 2025, 25, 3276. [Google Scholar] [CrossRef] [Scilit]
- Li, R.; Zhao, L.; Wei, H.; Hu, G.; Xu, Y.; Ouyang, B.; Tan, J. Multi-defect type beam bridge dataset: GYU-DET. Sci. Data 2025, 12, 1101. [Google Scholar] [CrossRef] [Scilit]
- Xia, H.; Li, Q.; Qin, X.; Zhuang, W.; Ming, H.; Yang, X.; Liu, Y. Bridge crack detection algorithm designed based on YOLOv8. Appl. Soft Comput. 2025, 171, 112831. [Google Scholar] [CrossRef] [Scilit]
- Chang, H.; Bassir, D.; Barrios, A.; Chen, G. Fourier-mixture of experts YOLO for concrete crack segmentation with visual interpretability. Autom. Constr. 2025, 179, 106452. [Google Scholar] [CrossRef] [Scilit]
- Dharma, A.S.; Pardosi, C.N.S.; Silaen, Z.P. Comparative performance of YOLOv8 and SSD-MobileNet algorithms for road damage detection in mobile applications. Sink. J. Penelit. Tek. Inform. 2025, 9, 1159–1169. [Google Scholar] [CrossRef] [Scilit]
- Xu, H.; Su, X.; Wang, Y.; Cai, H.; Cui, K.; Chen, X. Automatic bridge crack detection using a convolutional neural network. Appl. Sci. 2019, 9, 2867. [Google Scholar] [CrossRef] [Scilit]
- Chen, L.; Yao, H.; Gan, K.; Huang, Z.; Zhang, J.; Ng, C.-T.; Fu, J. Evaluation of MobileNetV3-Large for crack classification across low- and high-resolution images. Front. Built Environ. 2025, 11, 1724879. [Google Scholar] [CrossRef] [Scilit]
- Fan, Q.; Xie, J.; Xia, Z.; Tan, Y.; Zhu, S.; Wang, J. A novel high-precision lightweight concrete bridge crack image recognition method based on knowledge distillation. Struct. Health Monit. 2024, 24, 3441–3453. [Google Scholar] [CrossRef] [Scilit]
- Zhang, W.; Sun, S.; Huang, J.; Hong, Y.; Li, H.; Meng, G. Multi-objective optimal log-Gabor filtering and threshold denoising for phase-based vibration measurement from noisy video. Mech. Syst. Signal Process. 2025, 236, 113003. [Google Scholar] [CrossRef] [Scilit]
- Zhu, W.; Luo, R.; Jiang, T.; OuYang, Q.; Hua, Y.; Zhu, J.; Frøseth, G.T. SFDM: Structural full-field dynamic displacement monitoring utilizing computer vision-enhanced targetless monitoring system. Mech. Syst. Signal Process. 2026, 259, 114843. [Google Scholar] [CrossRef] [Scilit]
- Gou, Y.; Xiong, Y.; Hong, S.; Zhang, Y.; Tian, W.; Liang, X.; Peng, Z. 3D fusion meter: Enabling accurate full-field 3D localization and displacement measurement with a fused radar-camera sensor. Mech. Syst. Signal Process. 2026, 254, 114205. [Google Scholar] [CrossRef] [Scilit]
- Luo, K.; Deng, H.; Kong, X.; Hu, J.; Zhang, H.; Hua, X. Cable vibration measurement based on UAV and improved Lucas-Kanade optical flow method. Eng. Struct. 2026, 367, 123593. [Google Scholar] [CrossRef] [Scilit]
- Zhang, G.; Shi, Z.; Wang, Y.; Yan, C.; Li, X.; Liu, J. Unveiling the masking effect of unbalance force on incipient bearing cracks in flexible rotor systems: Dynamic modeling and physics-guided VMD-TEO diagnosis. Mech. Syst. Signal Process. 2026, 251, 114238. [Google Scholar] [CrossRef] [Scilit]
- Qin, D.; Leichner, C.; Delakis, M.; Fornoni, M.; Luo, S.; Yang, F.; Wang, W.; Banbury, C.; Ye, C.; Akin, B.; et al. MobileNetV4: Universal models for the mobile ecosystem. In Computer Vision–ECCV 2024; Leonardis, A., Ricci, E., Roth, S., Russakovsky, O., Sattler, T., Varol, G., Eds.; Springer: Cham, Switzerland, 2025; Volume 15098, pp. 78–96. [Google Scholar]
- Woo, S.; Park, J.; Lee, J.-Y.; Kweon, I.S. CBAM: Convolutional block attention module. In Computer Vision–ECCV 2018; Ferrari, V., Hebert, M., Sminchisescu, C., Weiss, Y., Eds.; Springer: Cham, Switzerland, 2018; Volume 11211, pp. 3–19. [Google Scholar]
- Raza, A.; Hanif, F.; Mohammed, H.A. Efficient crack and surface-type recognition via CNN-block development mechanism and edge profiling. Sci. Rep. 2025, 15, 40073. [Google Scholar] [CrossRef] [Scilit]
- Lowe, D.G. Distinctive image features from scale-invariant keypoints. Int. J. Comput. Vis. 2004, 60, 91–110. [Google Scholar] [CrossRef] [Scilit]
- Agaian, S.; Ayunts, H.; Trongtirakul, T.; Hovhannisyan, S. A new method for judging thermal image quality with applications. Signal Process. 2025, 229, 109769. [Google Scholar] [CrossRef] [Scilit]
- Buades, A.; Coll, B.; Morel, J.-M. A non-local algorithm for image denoising. In Proceedings of the 2005 IEEE Computer Society Conference on Computer Vision and Pattern Recognition (CVPR’05), San Diego, CA, USA, 20–25 June 2005; Volume 2, pp. 60–65. [Google Scholar] [CrossRef] [Scilit]
- Frangi, A.F.; Niessen, W.J.; Vincken, K.L.; Viergever, M.A. Multiscale vessel enhancement filtering. In Medical Image Computing and Computer-Assisted Intervention—MICCAI’98; Lecture Notes in Computer Science; Springer: Berlin/Heidelberg, Germany, 1998; Volume 1496, pp. 130–137. [Google Scholar]
- Lu, Y.; Ma, J.; Mei, X.; Huang, J.; Zhang, X.-P. Feature matching via topology-aware graph interaction model. IEEE/CAA J. Autom. Sin. 2024, 11, 113–130. [Google Scholar] [CrossRef] [Scilit]
- Cormen, T.H.; Leiserson, C.E.; Rivest, R.L.; Stein, C. Introduction to Algorithms, 4th ed.; MIT Press: Cambridge, MA, USA, 2022. [Google Scholar]
- Moshayedi, A.J.; Haoren, D.; Khan, A.S.K.; Eftikhari, S.A.; Zhang, M.; Bassir, D. Hybrid AI and computer vision framework for PCB/SMD defect detection with GUI-enabled IoT deployment. In Proceedings of the 2026 3rd International Conference on Big Data Science and Engineering (IEEE ICBDSE), Kunming, China, 12–14 June 2026. [Google Scholar]
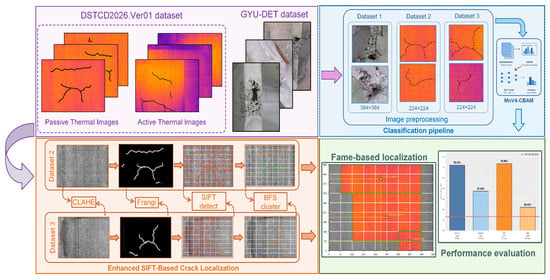
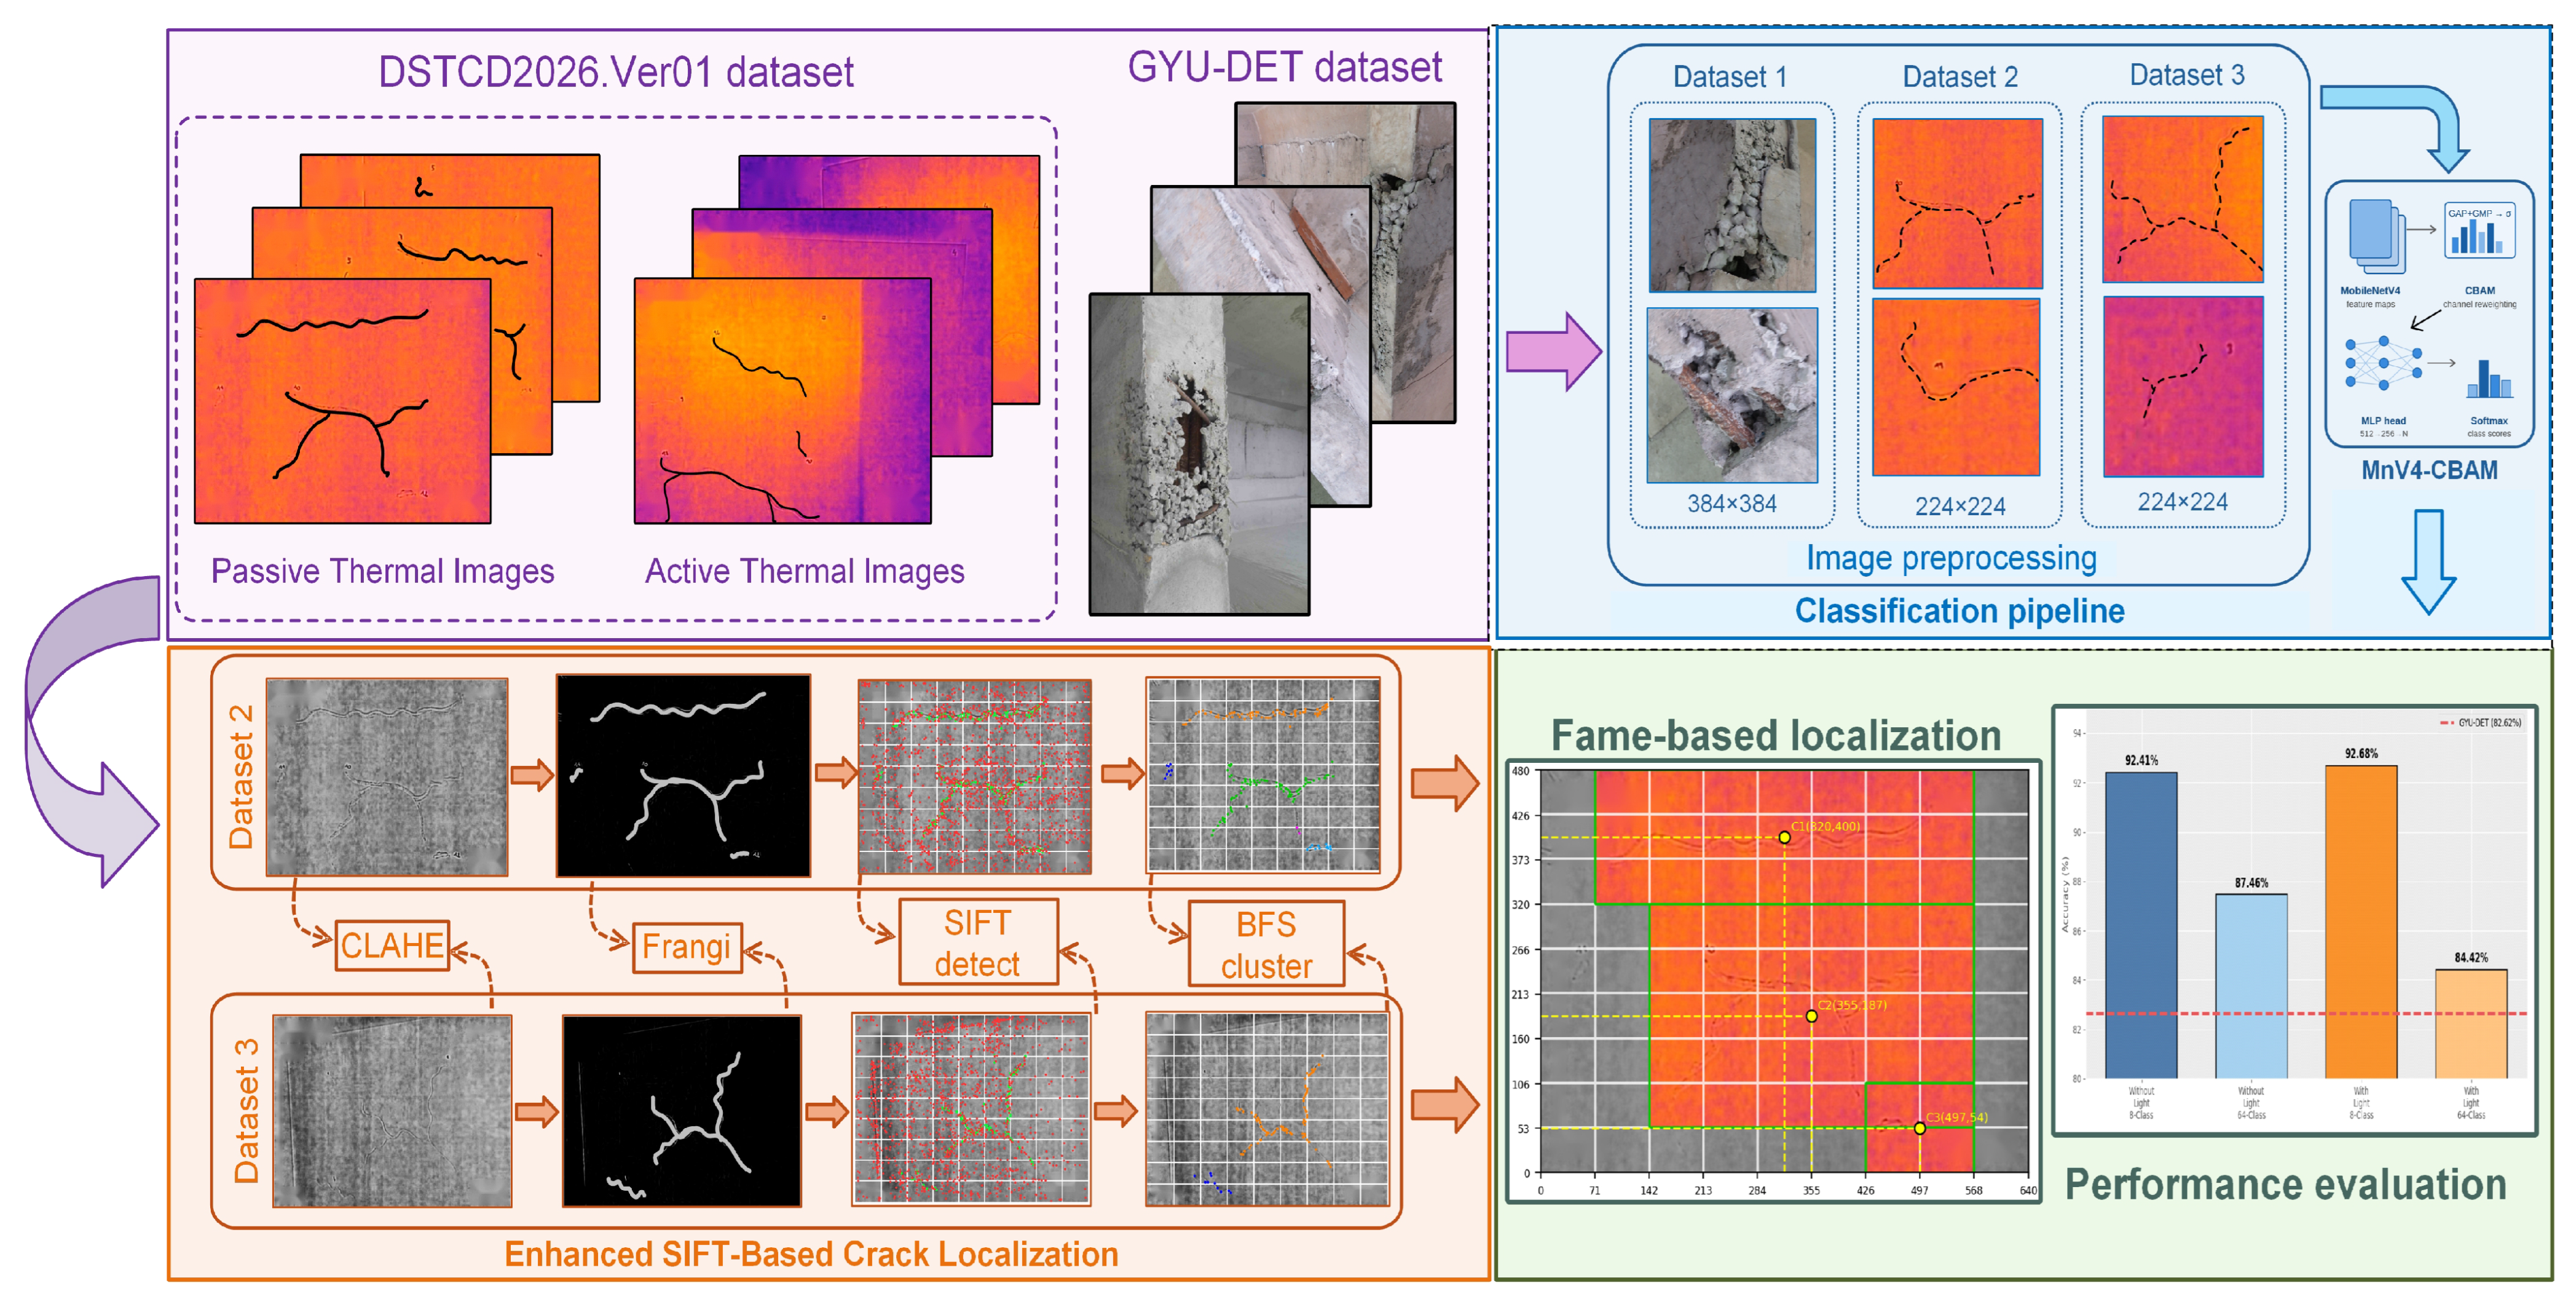
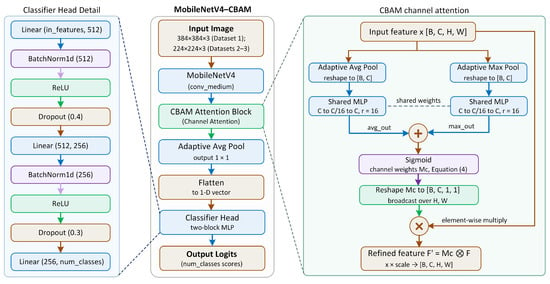
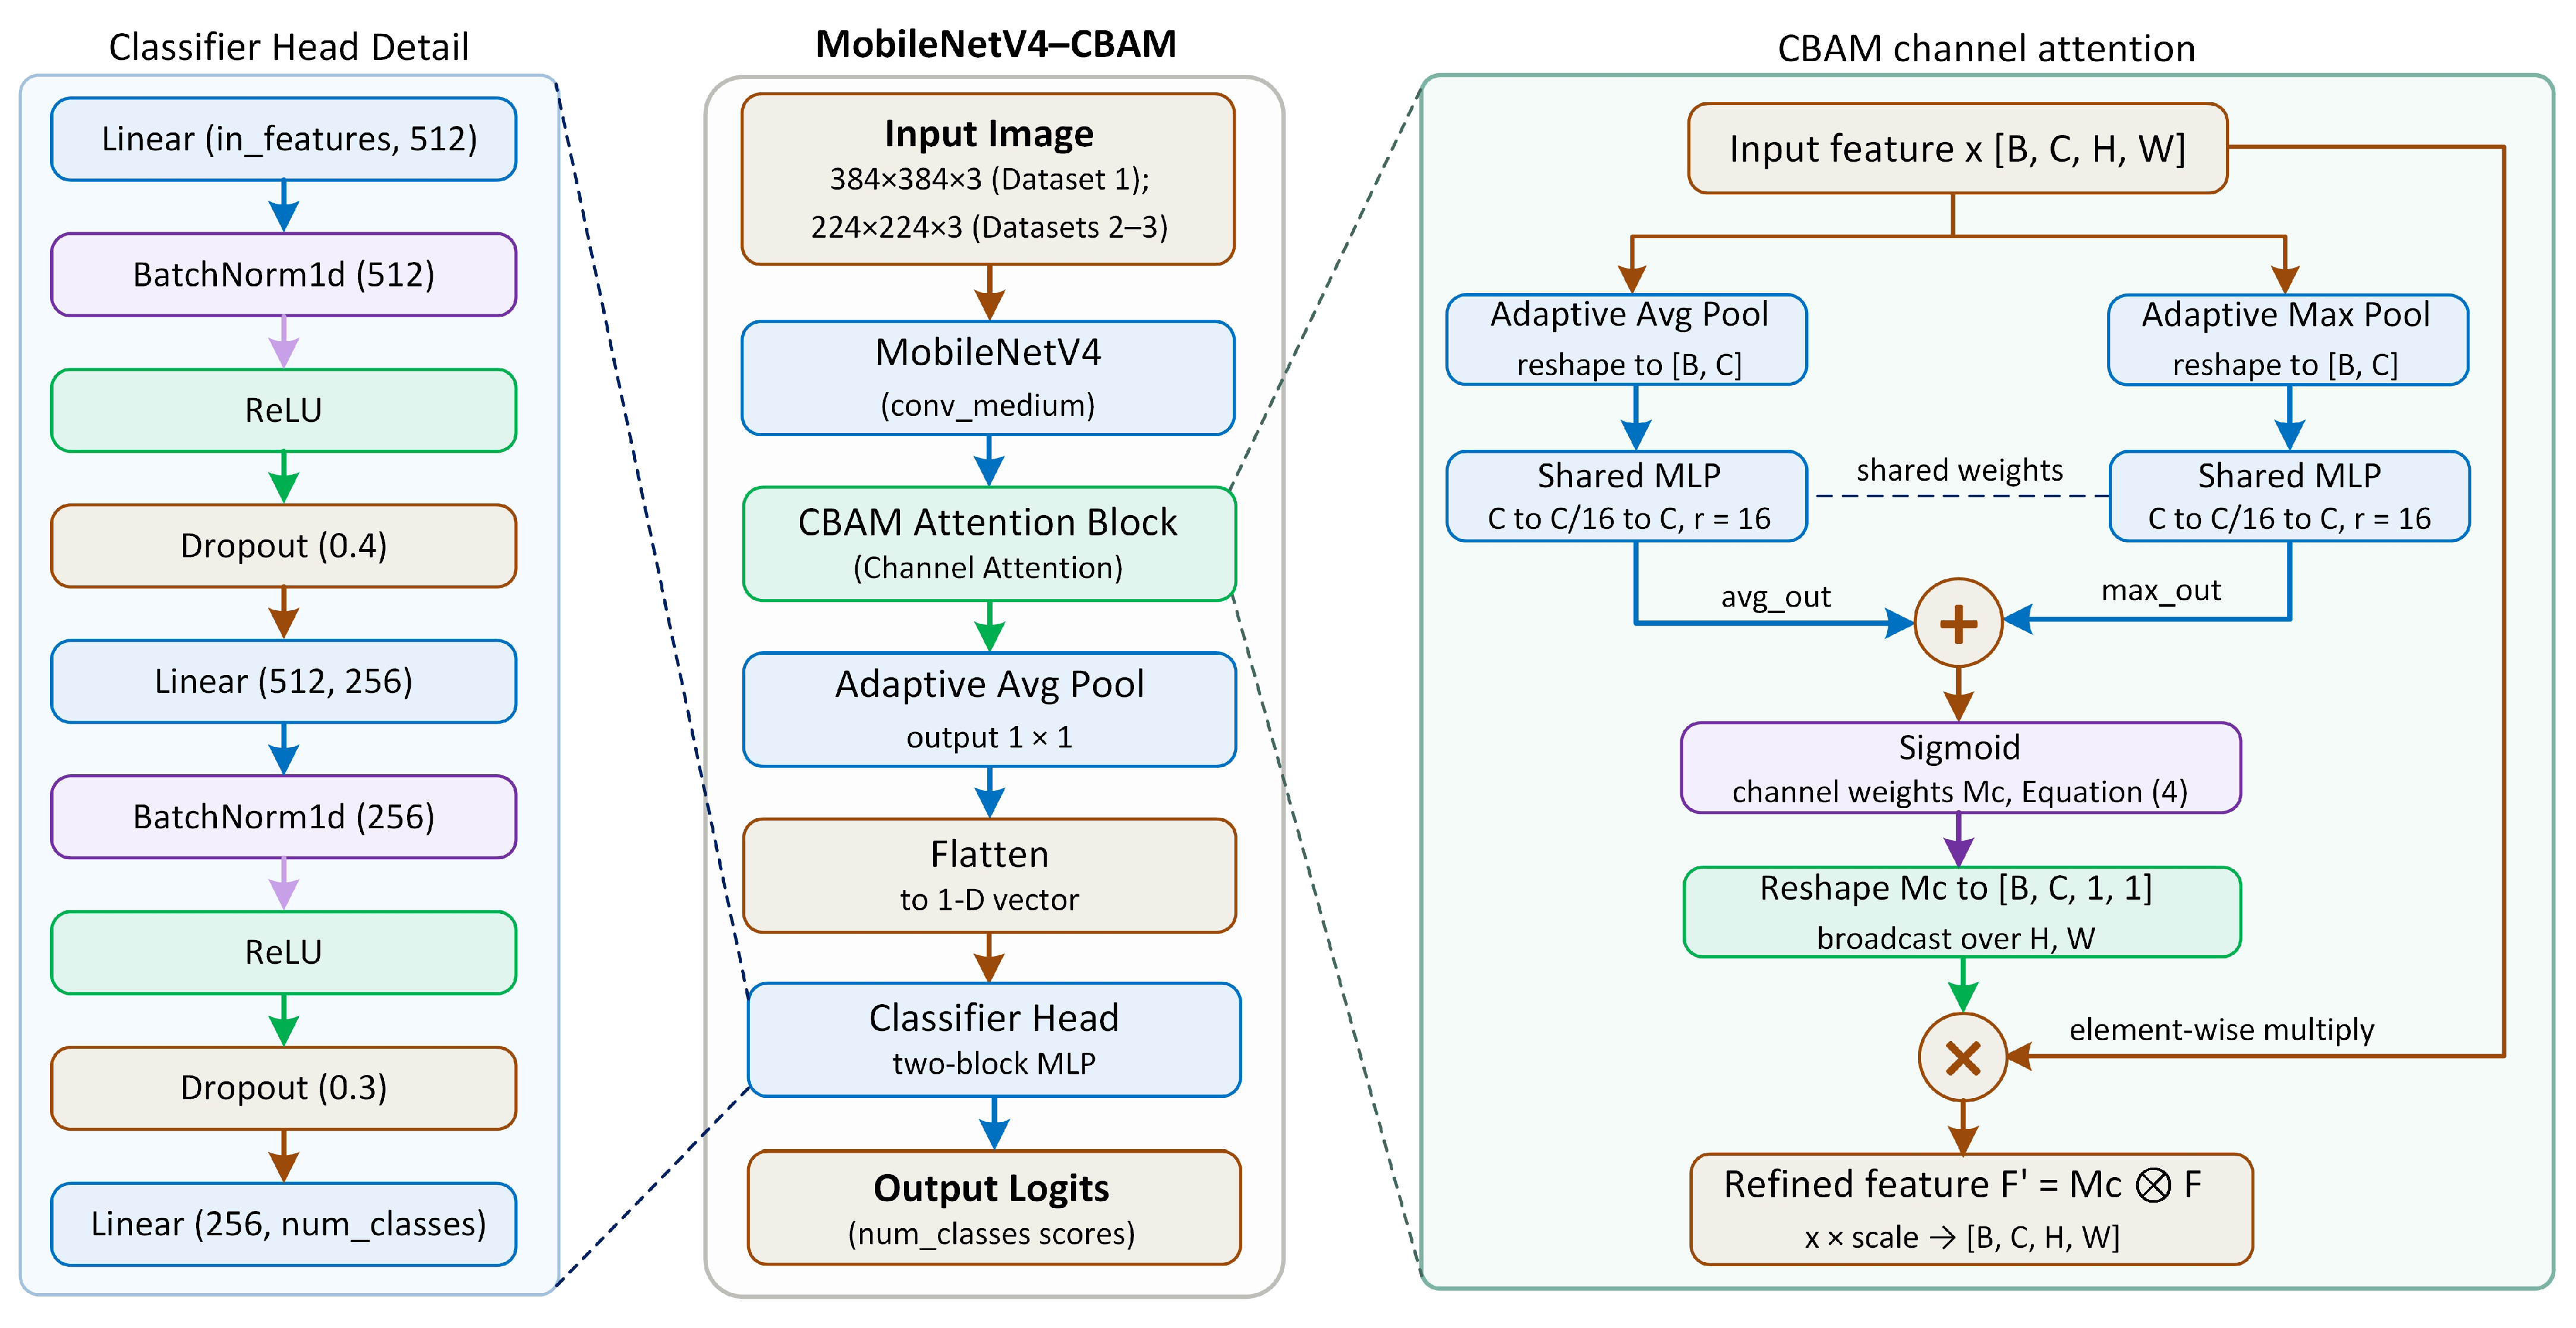
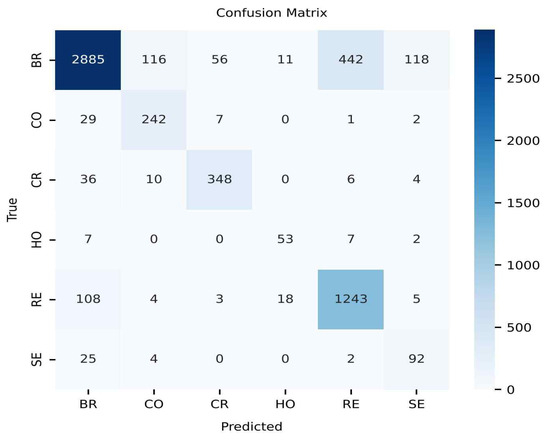
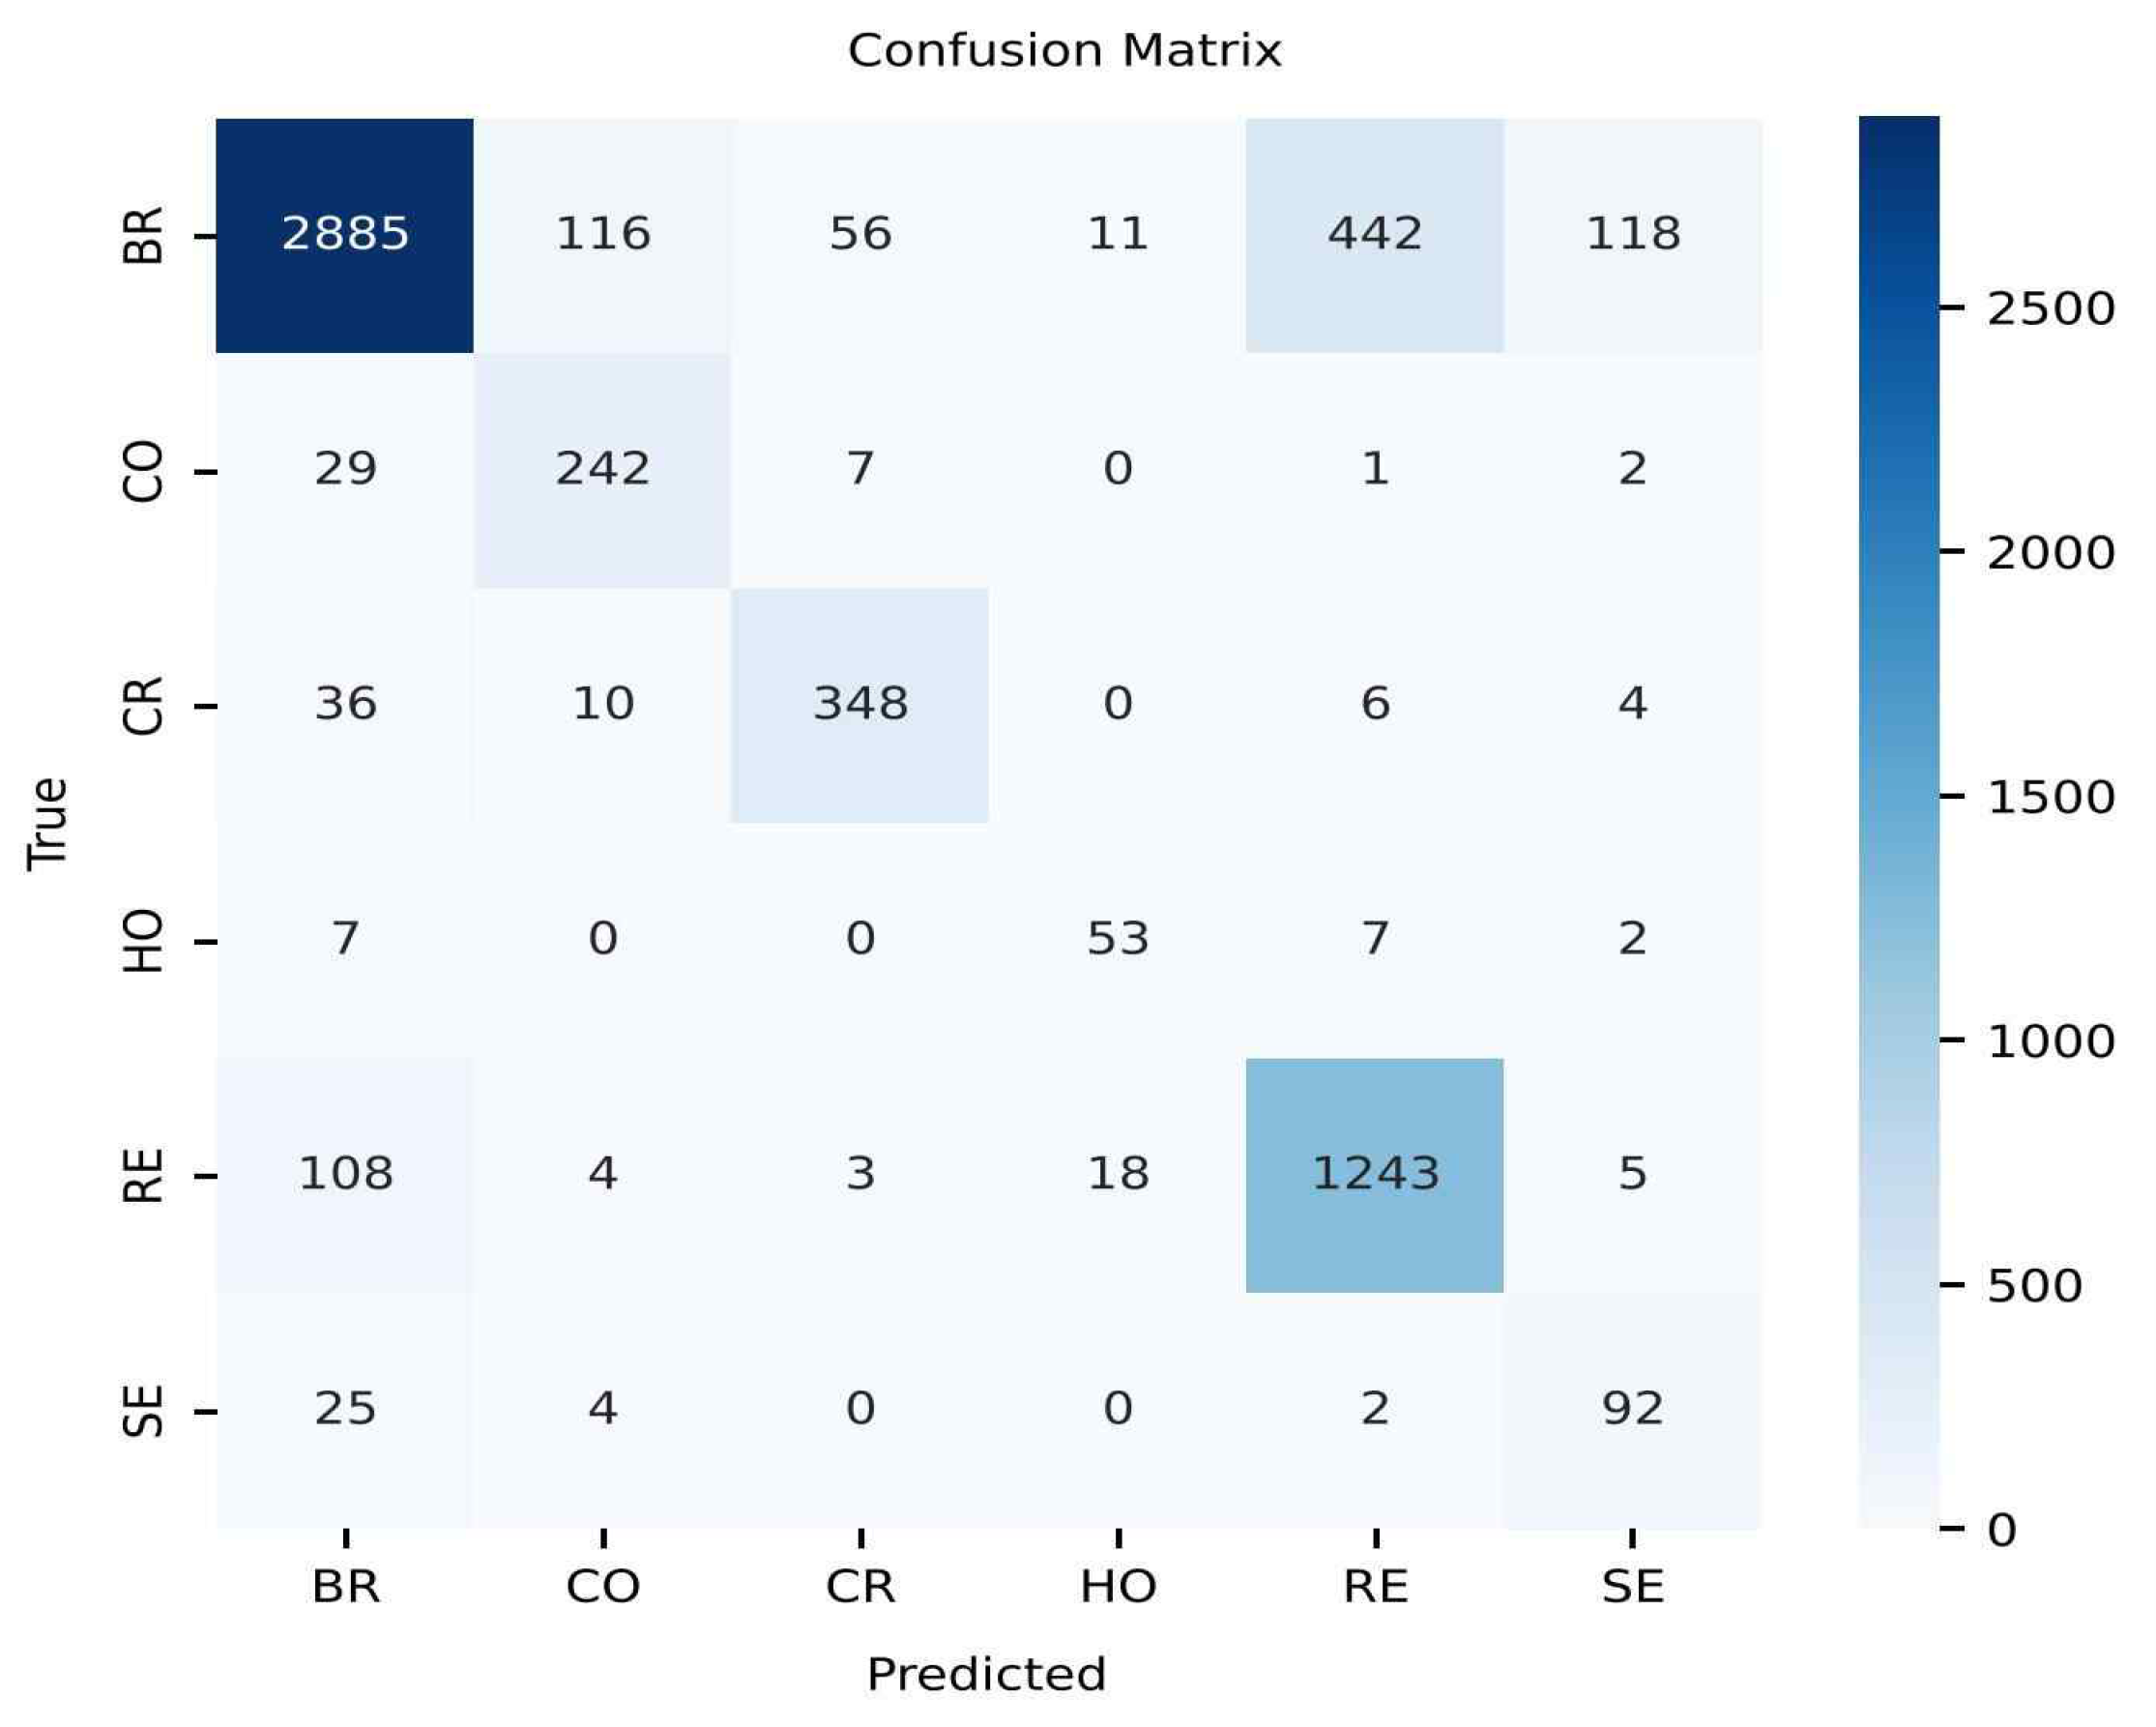
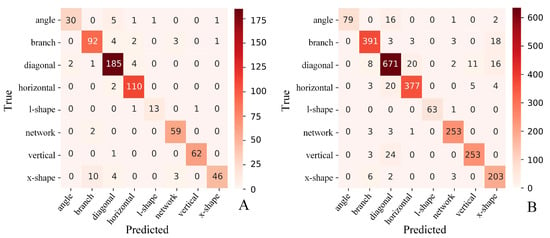
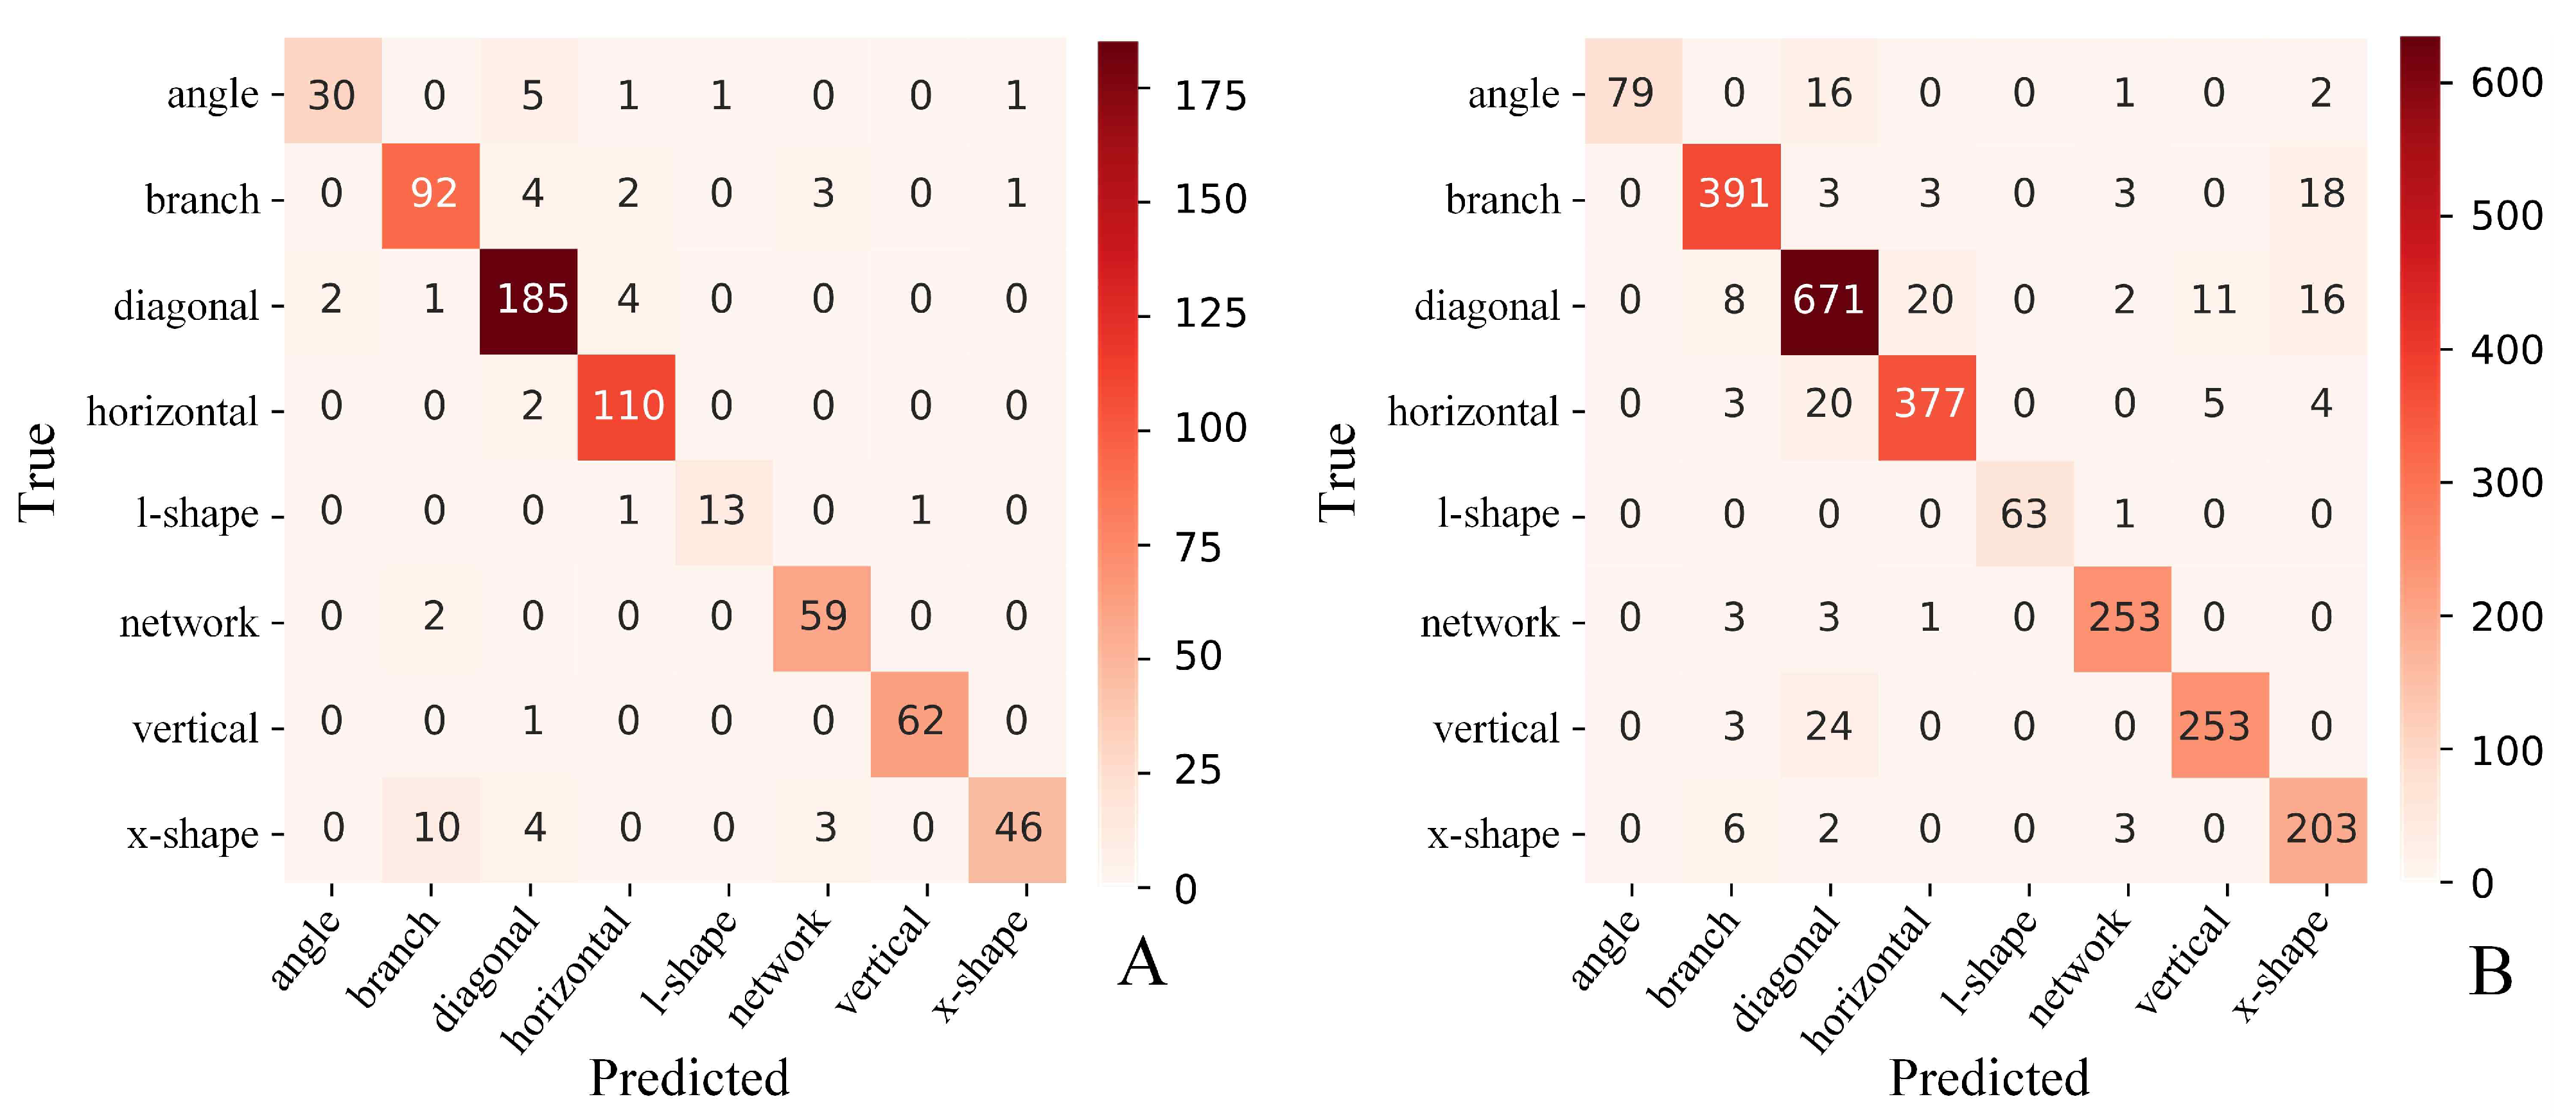
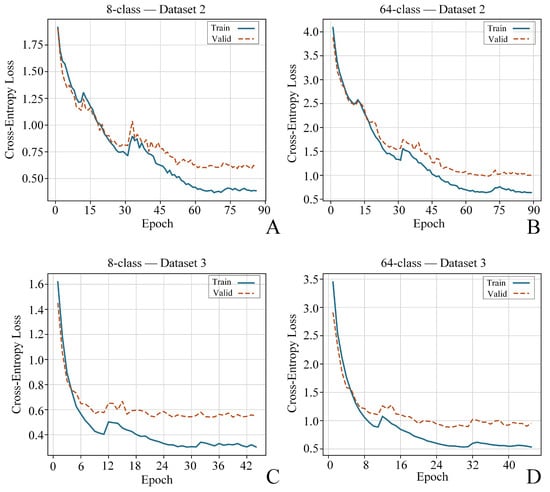
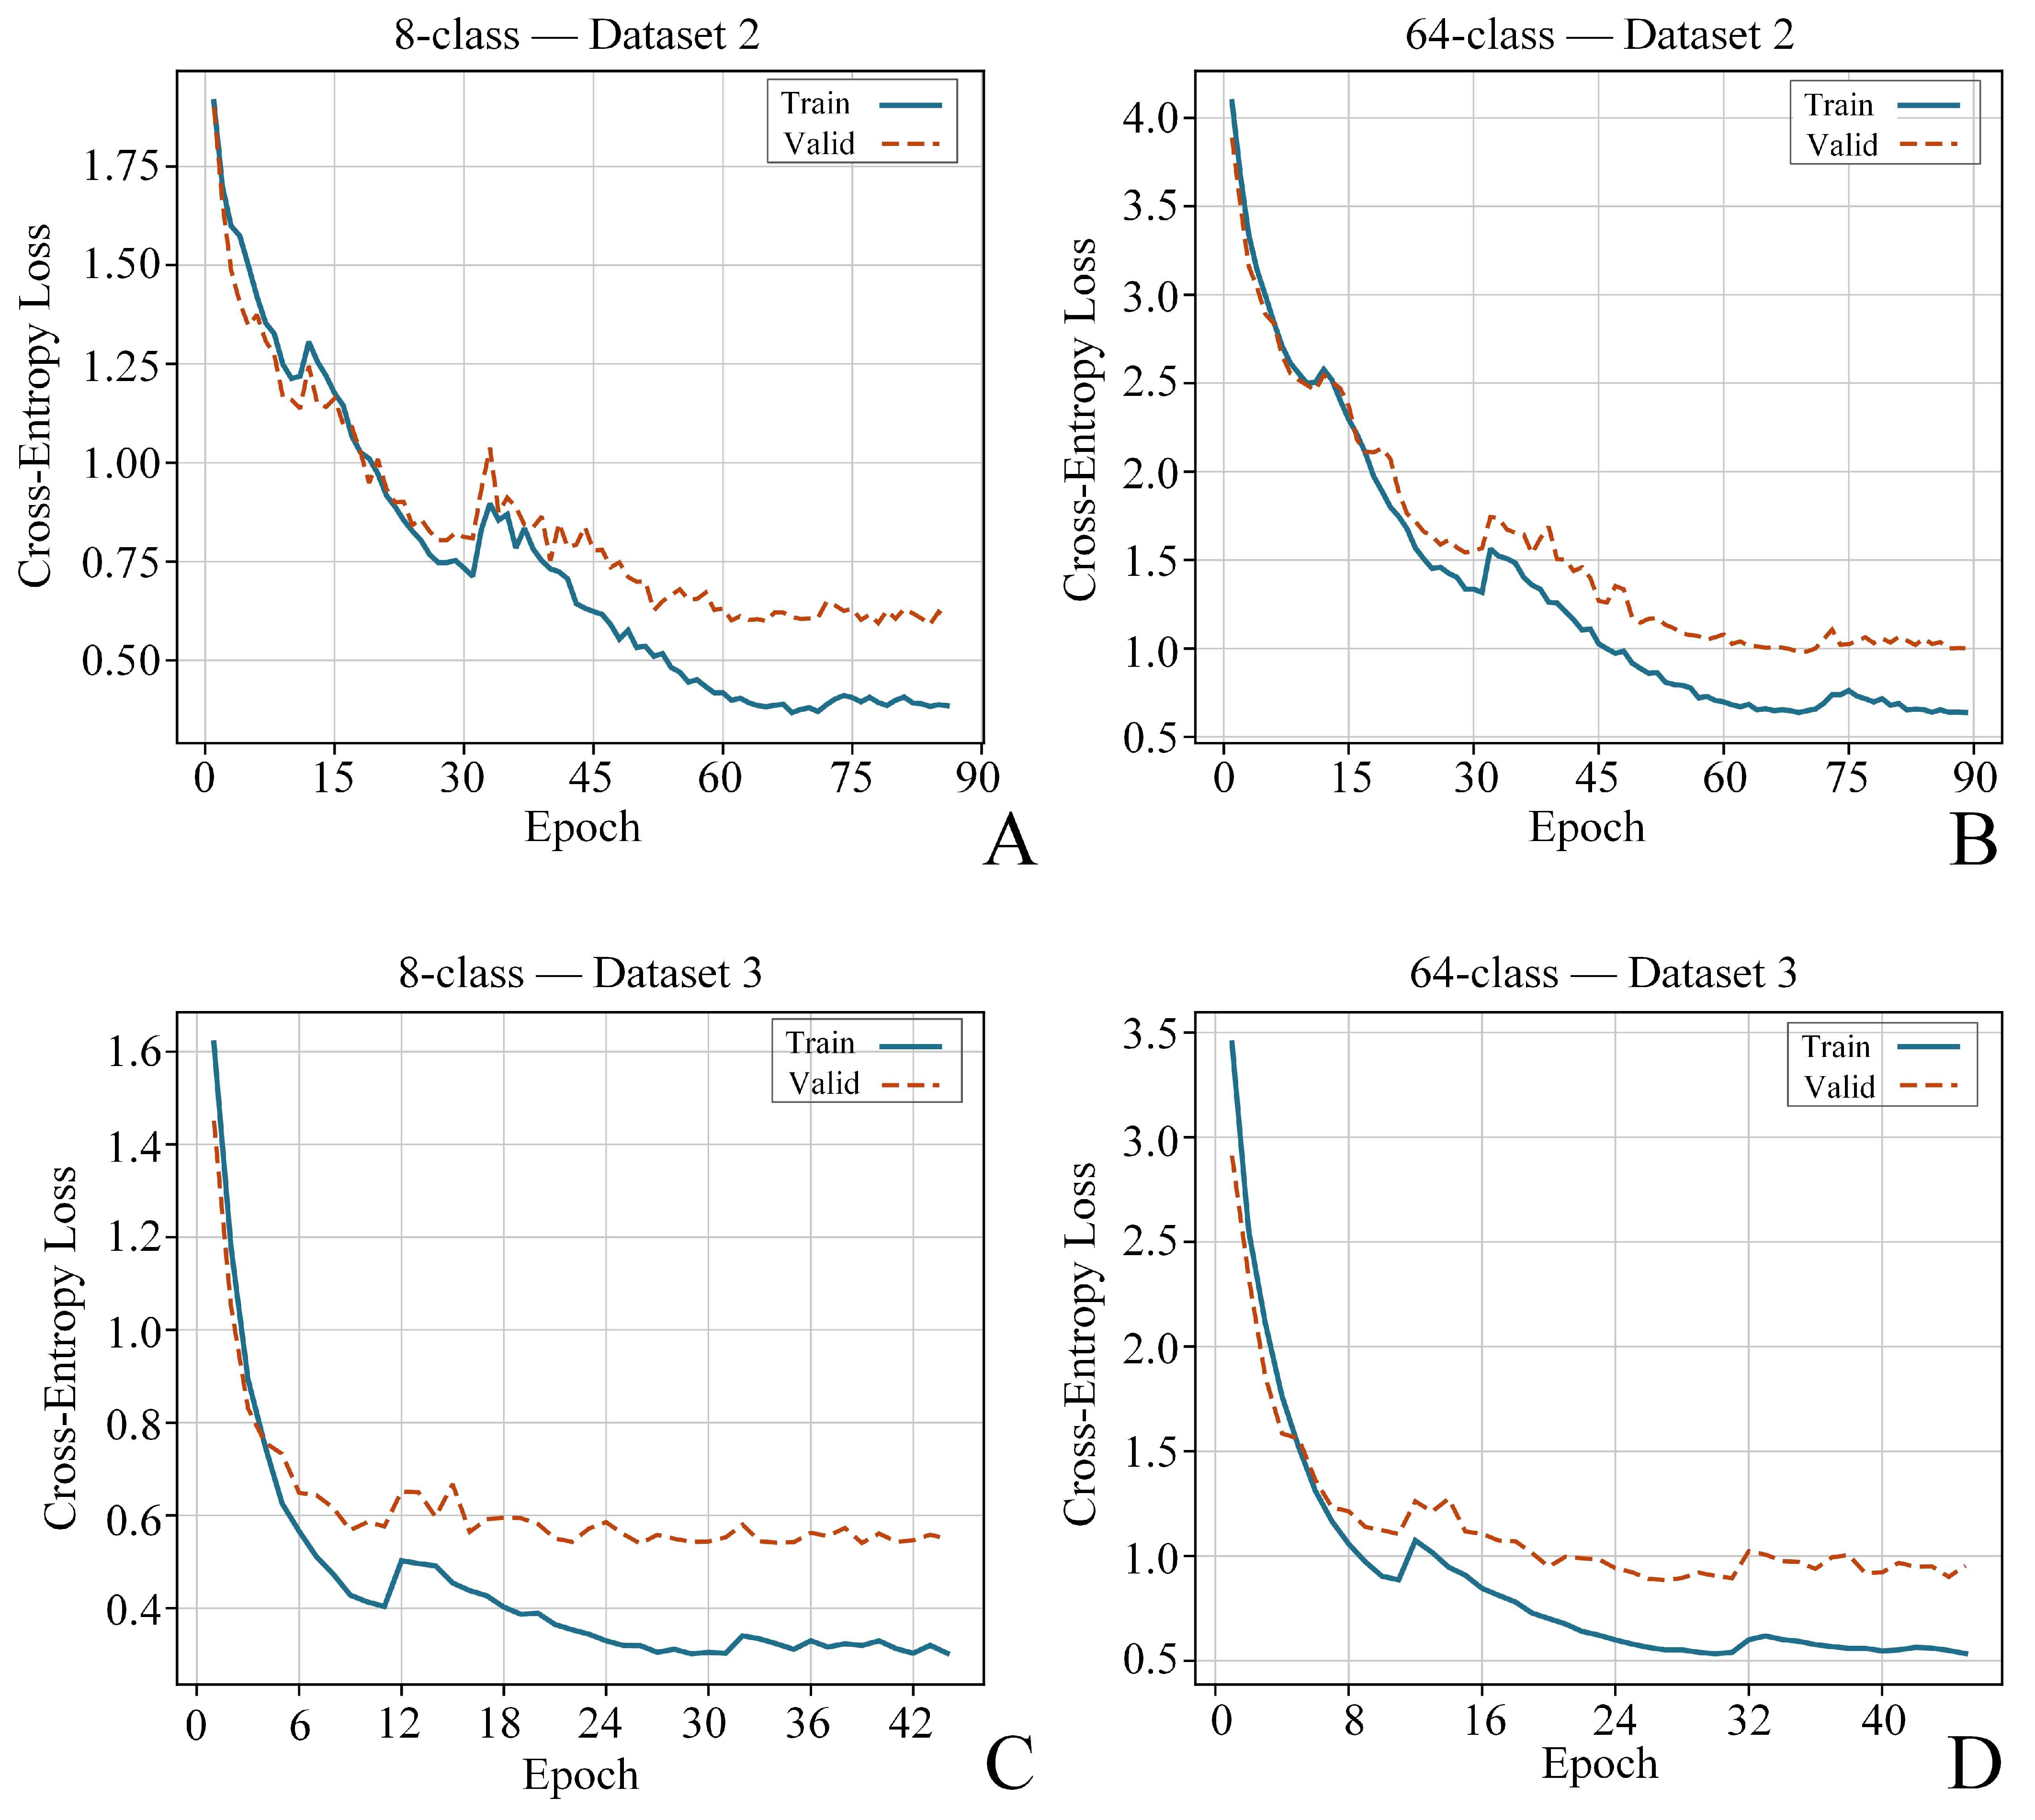
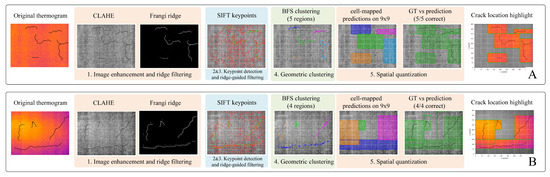
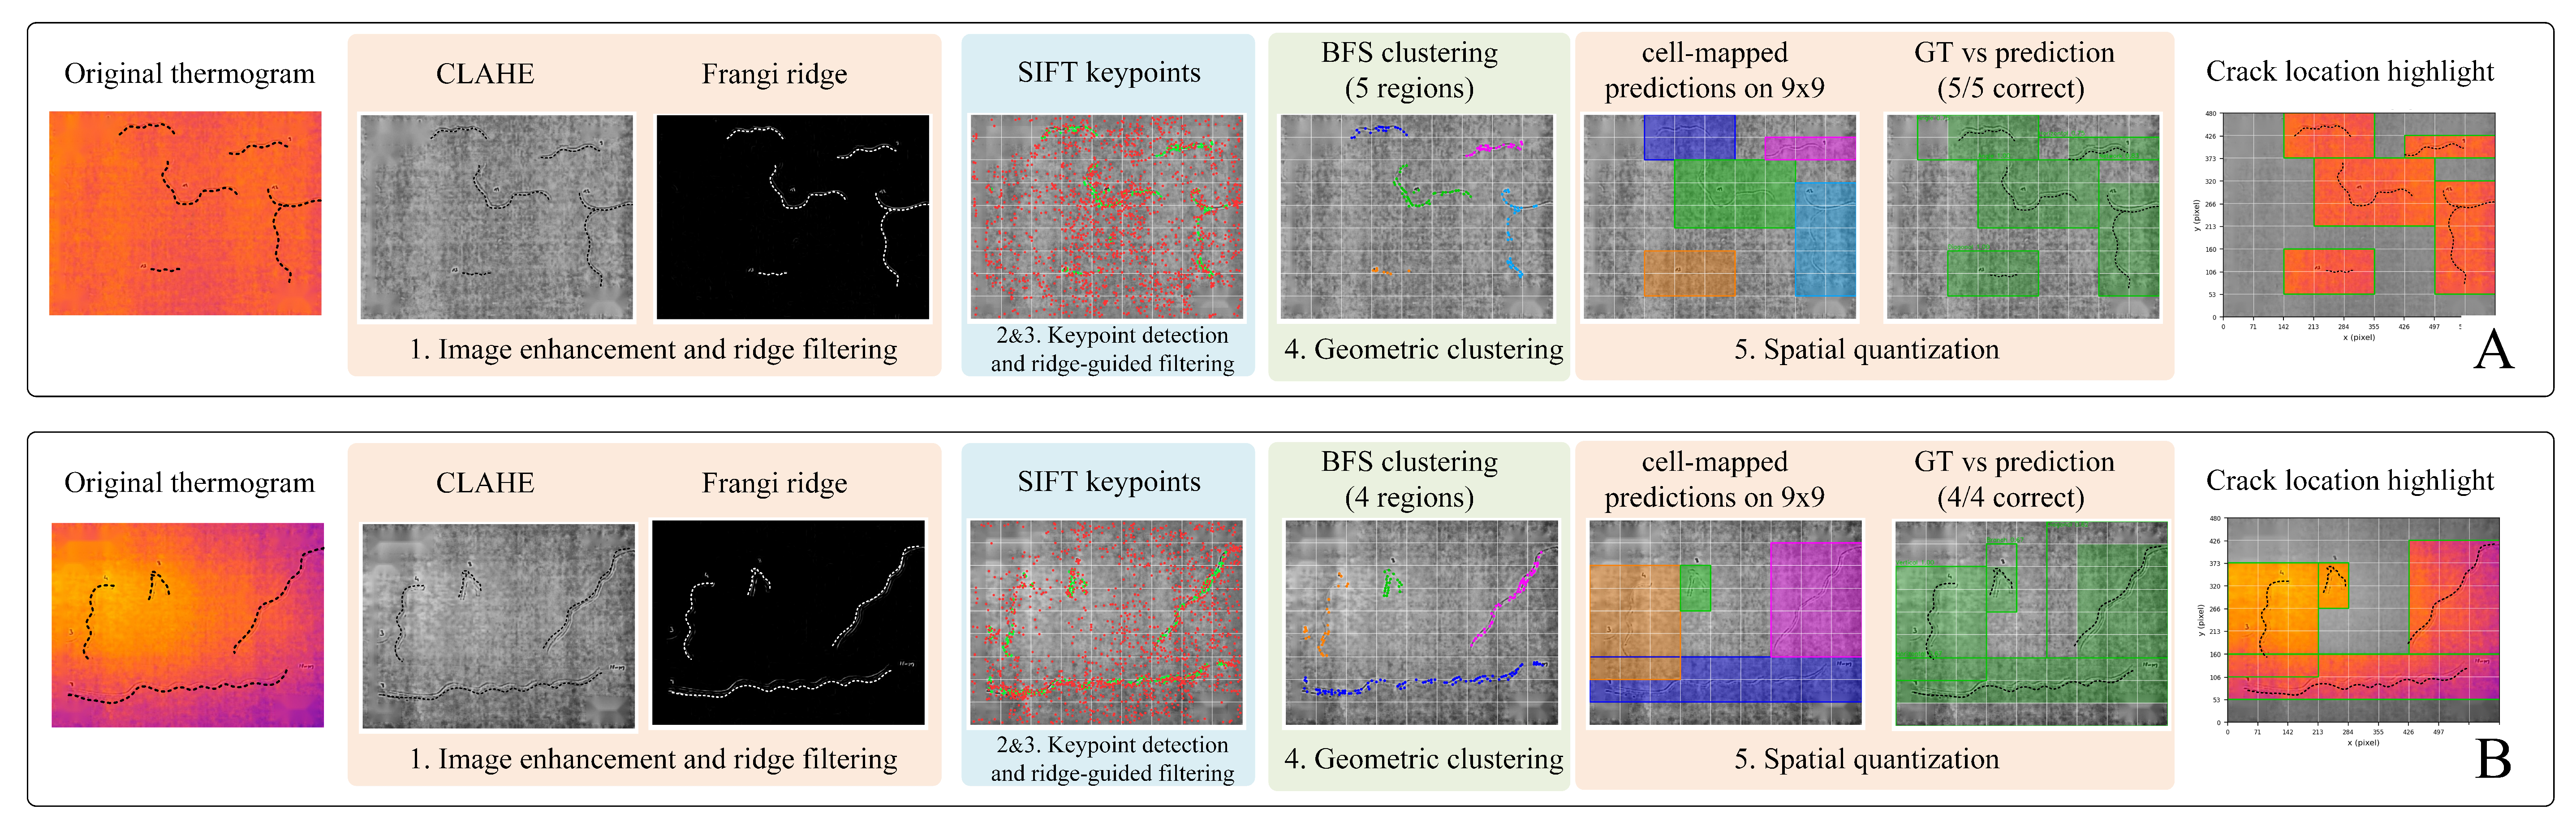
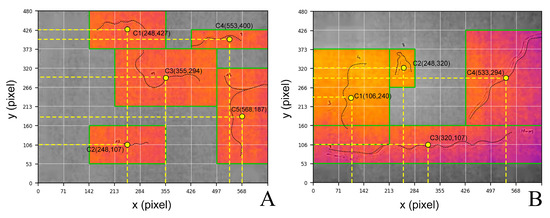
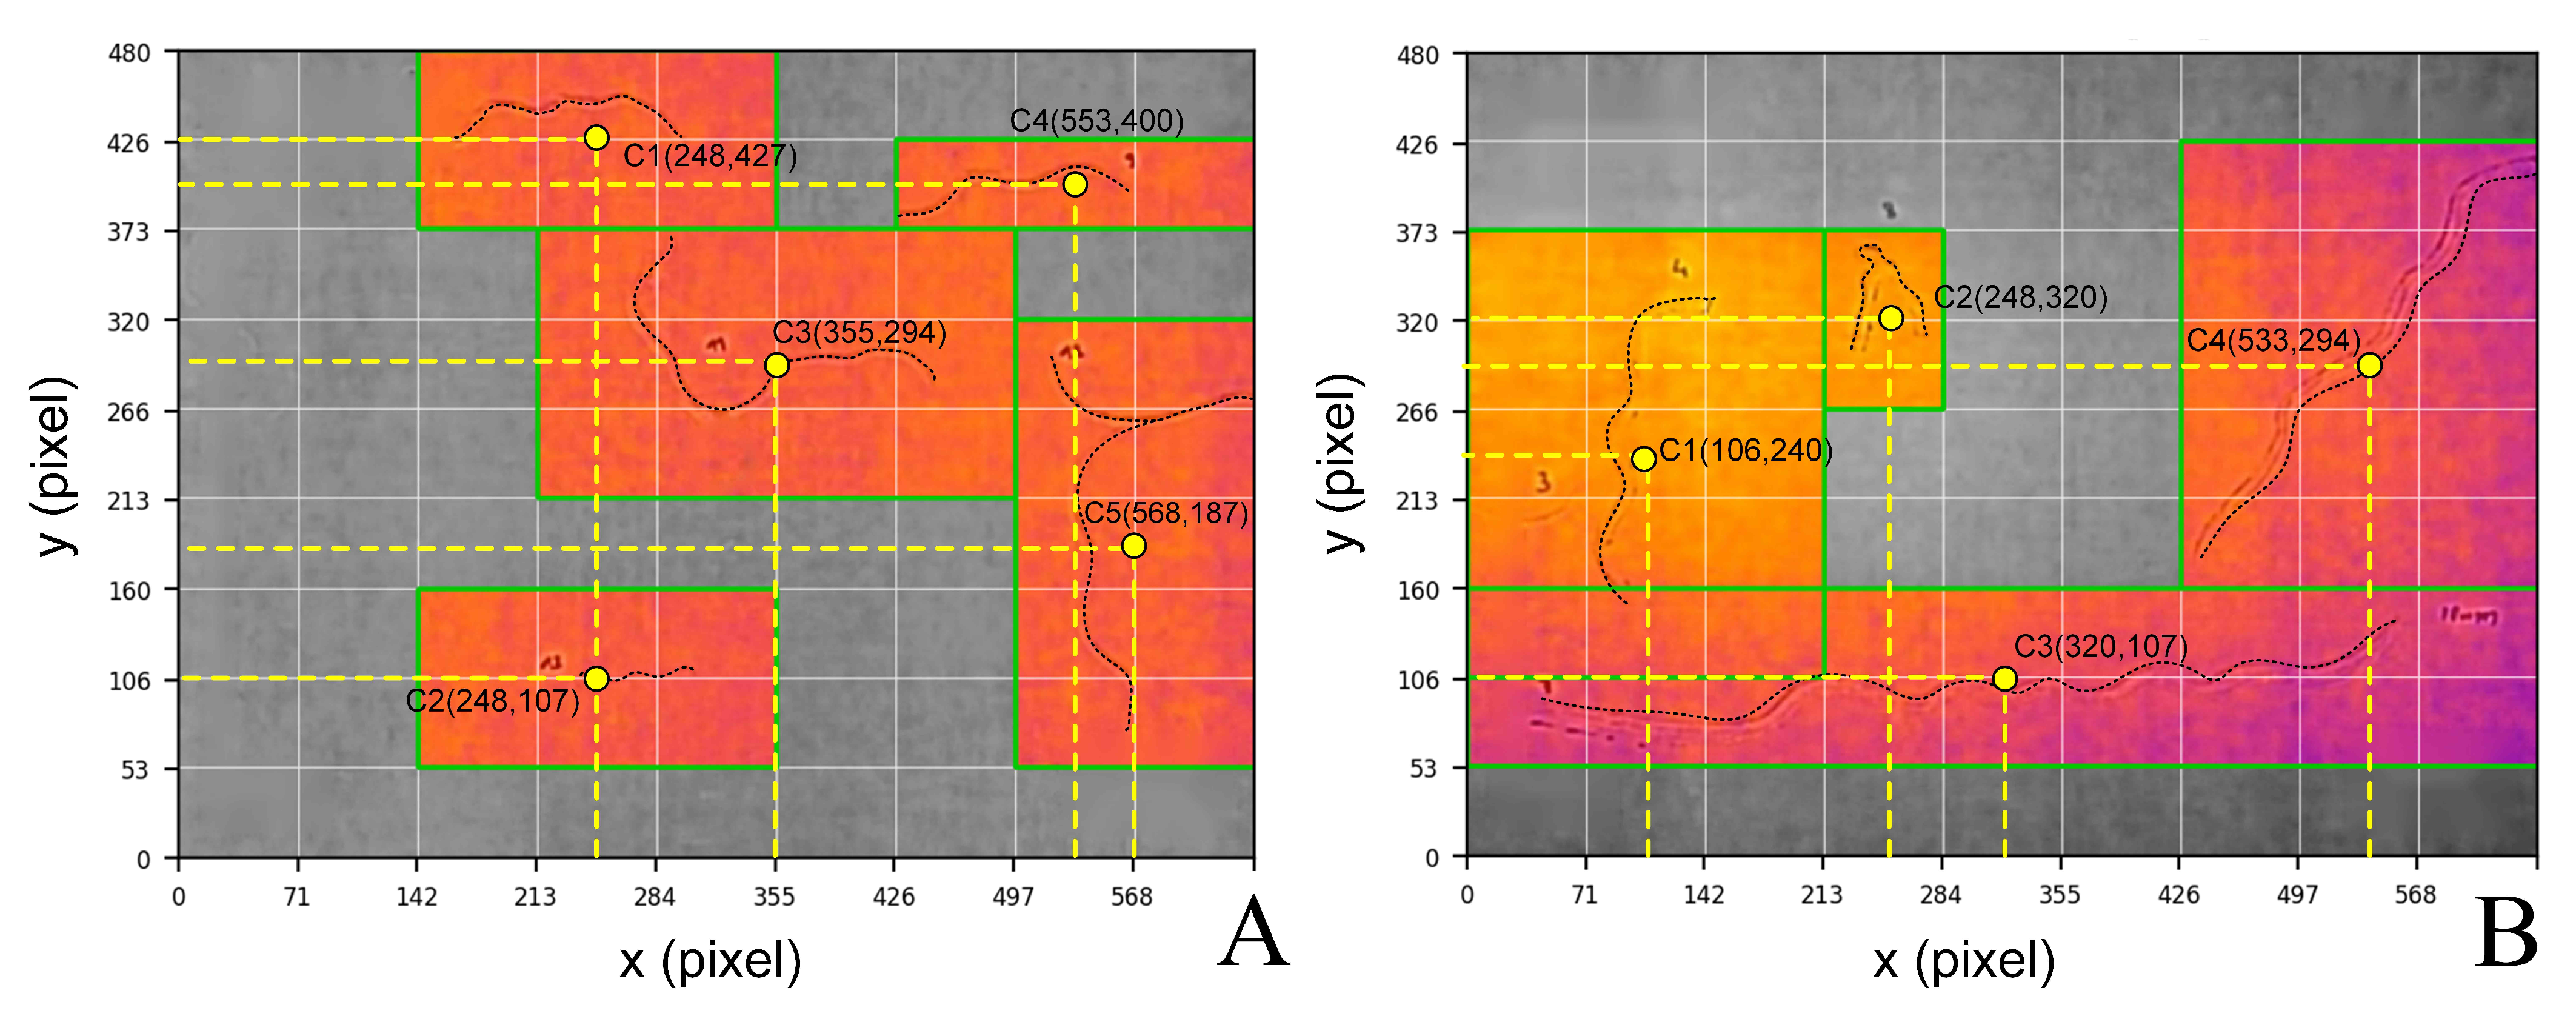

Disclaimer/Publisher’s Note: The statements, opinions and data contained in all publications are solely those of the individual author(s) and contributor(s) and not of MDPI and/or the editor(s). MDPI and/or the editor(s) disclaim responsibility for any injury to people or property resulting from any ideas, methods, instructions or products referred to in the content. |
© 2026 by the authors. Licensee MDPI, Basel, Switzerland. This article is an open access article distributed under the terms and conditions of the Creative Commons Attribution (CC BY) license.