


Abstract
This study presents a techno-economic analysis of deploying distributed energy resources (DERs), specifically photovoltaic (PV), battery energy storage systems (BESSs) and electric vehicles (EVs), in apartment buildings configured as Virtual Power Plants (VPPs). Utilizing cooperative game theory, the research models strategic collaboration between apartment residents (demand side) and utility operators (plant side) to maximize energy efficiency and economic returns. The VPP structure is analyzed over a 15-year life cycle, incorporating net present value (NPV), payback period (PBP), and government subsidy impacts. A cooperative game framework is applied using the Shapley value to ensure fair profit allocation based on each party’s contribution. Results indicate improved self-sufficiency, peak load reduction, and mutual financial benefits. Scenario analyses show that government subsidies to the plant side significantly increase the likelihood of successful cooperation, while declining DER costs enhance the VPP’s economic viability. The findings demonstrate that apartments configured as VPPs achieve strong economic viability (39% ROI, 10.5-year payback) and operational performance (70% self-sufficiency, 40% peak reduction) when grid arbitrage is enabled and moderate government subsidies (35% PV, 45% BESS) are provided. This research provides a replicable model for urban energy planning and policy development, promoting sustainable energy transitions through shared DER infrastructure and cooperative stakeholder engagement.
1. Introduction
1.1. Background and Motivation
The decarbonization of electricity systems worldwide has driven unprecedented growth in distributed energy resources (DERs), particularly rooftop solar photovoltaics (PV) and battery energy storage systems (BESSs). Australia leads globally in residential solar penetration, with over 3.6 million installations as of 2024 [1]. However, the integration of DERs in multi-dwelling residential buildings (apartments, condominiums) faces unique technical, economic, and regulatory challenges that limit deployment despite significant potential [2].
Victoria, Australia’s most populous state, presents a particularly compelling case study for DER integration due to: (i) the lowest wholesale electricity prices in the National Electricity Market (NEM) at $45/MWh in Q4 2024, (ii) high solar penetration creating extreme intra-day price volatility (5–10× peak-to-off-peak ratios), and (iii) progressive government policies including the Victorian Default Offer (VDO), Solar Victoria program, and battery rebates [3,4]. Despite these favorable conditions, apartment buildings—which house 13.6% of Australian households and 22.1% of Victorian households—remain dramatically underrepresented in rooftop solar adoption (<2% penetration rate vs. 35% for detached houses) [5].
1.2. Research Gap
The existing literature on VPP economics predominantly focuses on: (i) utility-scale aggregations [6,7], (ii) single-family residential installations [8,9], or (iii) commercial buildings [10,11]. Few studies examine the unique economic proposition of apartment buildings as VPPs, where shared infrastructure enables economies of scale but introduces complexity in cost/benefit allocation, ownership structures, and regulatory compliance [12,13]. Furthermore, recent advances in bidirectional inverter technology enabling grid charging for arbitrage have not been adequately integrated into residential VPP economic assessments [14,15].
- Critical knowledge gaps include:
- Customer-focused viability analysis: Most VPP studies emphasize grid-side benefits (peak shaving, voltage support, frequency regulation) rather than customer return on investment (ROI), despite customers bearing investment costs [16].
- Grid arbitrage optimization**: Limited research quantifies the economic value of BESS grid charging capability in residential contexts, particularly under Australian market conditions [17].
- Cooperative cost allocation: Fair distribution of benefits among heterogeneous apartment occupants with varying consumption patterns remains theoretically underdeveloped [18].
- Realistic subsidy modeling: Few studies incorporate actual government program parameters (eligibility, caps, stackability) affecting real-world investment decisions [19].
1.3. Objectives of This Study
This study addresses these gaps through the following objectives:
- Objective 1: Develop a comprehensive techno-economic model for customer-focused VPP viability analysis incorporating shared DER infrastructure, hourly optimization, and Victorian market conditions.
- Objective 2: Quantify the economic impact of grid charging capability and arbitrage optimization on investment viability, ROI, and payback periods.
- Objective 3: Apply Shapley value cooperative game theory to derive fair benefit allocation among heterogeneous apartment occupants.
- Objective 4: Evaluate sensitivity to government subsidy levels and identify policy-relevant thresholds for achieving investment viability.
- Objective 5: Provide actionable recommendations for policymakers, developers, and building owners regarding optimal DER sizing, subsidy design, and regulatory reforms.
1.4. Contribution and Novelty
This research makes four principal contributions:
- Methodological innovation: First application of hourly battery optimization with grid arbitrage to multi-dwelling residential VPP analysis, incorporating state-of-charge tracking and price-responsive charging logic.
- Empirical grounding: Integration of the actual Australian Energy Market Operator (AEMO) wholesale price patterns and the Essential Service Commission’s (ESC) Victorian Default Offer data (2019–2025), rather than stylized tariff assumptions common in prior work.
- Customer-centric framework: Explicit focus on resident ROI, payback periods, and investment viability rather than grid-operator benefits, addressing the principal-agent problem in DER adoption.
- Policy relevance: Quantification of subsidy thresholds and cost decline trajectories required for viability, providing evidence-based targets for Australian state/federal policy design.
2. Literature Review
2.1. Virtual Power Plants: Concept and Economics
VPPs aggregate distributed energy resources to function collectively as a single, flexible power plant visible to grid operators [20]. The VPP concept emerged in the late 1990s [21] but gained commercial traction only in the 2010s with declining DER costs and advanced control systems [22].
- Technical architecture: Modern VPPs employ hierarchical control structures: (i) local optimization at individual sites, (ii) aggregation coordination across sites, and (iii) market participation at the wholesale level [23]. Cloud-based platforms enable real-time dispatch, forecasting, and market bidding [24].
- Economic value streams: VPPs generate revenue through multiple channels: energy arbitrage, frequency control ancillary services (FCASs), demand response, capacity payments, and network support services [25,26]. Australian VPPs have demonstrated annual revenues of $400–800/kW from FCAS markets alone [27].
- Residential VPP programs: Notable deployments include Tesla Virtual Power Plant (South Australia, 50,000 homes, 250 MW/650 MWh) [28], Sonnen Community (Germany, 15,000+ systems) [29], and AGL Virtual Power Plant (Australia, 1000+ homes) [30]. Economic analyses show mixed results: positive NPV in high-price markets [31] but marginal or negative returns in moderate-price contexts without subsidies [32].
- Critical gap: The existing VPP literature predominantly analyzes detached single-family homes. Multi-dwelling buildings introduce complexities, including shared ownership, strata governance, split incentives between owners and tenants, and regulatory ambiguities regarding embedded networks [33,34]. Our study addresses this gap by explicitly modeling shared infrastructure and cooperative benefit allocation.
It is important to distinguish the apartment-scale VPP modeled in this study from the broader concept of an Integrated Energy System (IES). An IES typically encompasses multiple energy carriers—electricity, heat, gas, hydrogen, and carbon flows—and involves technologies such as power-to-gas (P2G), combined heat and power (CHP), and carbon capture systems. In contrast, the present study focuses exclusively on a single-energy-carrier (electricity) VPP comprising photovoltaic (PV) systems, battery energy storage systems (BESSs), and electric vehicle (EV) chargers within a residential apartment building. The operational objective is not multi-carrier energy conversion but rather the cooperative optimization of shared electrical DER infrastructure to maximize resident economic returns through self-consumption, grid arbitrage, and peer-to-peer energy sharing. This narrower scope enables a more tractable analysis of the cooperative game-theoretic allocation problem while remaining directly applicable to the regulatory and market conditions governing residential electricity in Victoria, Australia.
2.2. Battery Energy Storage Economics
BESS costs have declined 90% since 2010, from $1200/kWh to $139/kWh at the cell level (2023), with residential installed costs around $500–700/kWh [35,36]. However, economic viability remains highly context dependent.
- Grid services vs. arbitrage: Early BESS economic analyses emphasized high-value grid services (FCAS, voltage support) over energy arbitrage [37,38]. Recent work demonstrates increasing arbitrage value in markets with high renewable penetration, creating price volatility [39,40].
- Round-trip efficiency: Li-ion systems achieve 85–95% round-trip efficiency [41]. Our model conservatively assumes 90%, consistent with contemporary residential systems [42].
- Degradation modeling: Capacity degradation (1.5–3% annually) and cycling limitations significantly impact lifetime economics [43,44]. Calendar aging dominates in residential applications with <1 cycle/day [45].
- Grid charging capability: Most residential BESS installations prohibit grid charging due to (i) regulatory restrictions, (ii) tariff structures penalizing import, or (iii) inverter limitations [46]. Recent policy changes in Australia, the UK, and California enable grid charging [47,48], but economic quantification in residential contexts remains limited. This study directly addresses this gap.
2.3. Cooperative Game Theory and Energy Sharing
Unlike single-family installations, where benefits accrue entirely to the investor, shared systems require formal allocation mechanisms to address the potential misalignment between contribution (energy usage) and perceived benefit (cost savings). Cooperative game theory provides the theoretical foundation for such mechanisms [49]. The Shapley value, proposed by Lloyd Shapley (1953, Nobel Prize 2012), offers a unique solution satisfying the axioms of efficiency, symmetry, dummy player, and additivity—properties that ensure allocations are both mathematically fair and strategically stable across all possible resident coalitions [50].
Applications in energy systems include:
- a.
- Microgrids: Coalition formation and cost sharing among prosumers [51,52].
- b.
- Community energy: Fair allocation of shared solar/battery benefits [53,54].
- c.
- P2P trading: Transaction pricing and matching algorithms [55,56].
Multi-apartment buildings: Several studies apply game theory to apartment energy sharing [57,58], but few incorporate (i) heterogeneous demand profiles, (ii) shared vs. individual assets, and (iii) grid interaction alongside P2P trading. Our Shapley value formulation addresses all three.
Nucleolus and alternatives: While Shapley value ensures fairness, alternative solution concepts (nucleolus, core) may better satisfy stability constraints [59]. We focus on Shapley value due to: (i) computational tractability, (ii) intuitive interpretation, and (iii) widespread acceptance in the energy sharing literature [60].
2.4. Australian Electricity Market Context
2.4.1. Victorian Market Structure
Victoria’s wholesale electricity market, operated by AEMO, features: (i) 5 min settlement (shortest globally), (ii) high renewable penetration (37% in 2024), and (iii) negative pricing events during solar surplus [61,62].
2.4.2. Victorian Default Offer (VDO)
Introduced in 2019 by ESC as a price safety net, the VDO represents the maximum retail tariff [63]. VDO has declined 15% since 2021 due to falling wholesale costs [64].
2.4.3. Government Incentives
- Solar Victoria: Up to $1400 rebate per property (means-tested) [65].
- Battery rebate: Up to $3000 for BESS (means-tested, capped) [66].
- Small-Scale Technology Certificates (STCs): Federal scheme providing ~30% upfront discount [67].
2.4.4. Regulatory Barriers for Apartments
Key challenges include: (i) split incentives (owners install, tenants benefit), (ii) strata approval requirements (often >75% vote), (iii) embedded network regulations, and (iv) individual metering mandate [68,69]. Recent reforms in Victoria (2024) streamline approvals and clarify ownership structures [70].
2.5. Summary and Positioning
This study synthesizes and extends prior work by:
- (i)
- Applying VPP optimization to multi-dwelling residential buildings (underexplored segment);
- (ii)
- Quantifying grid arbitrage value with realistic AEMO price data (novel contribution);
- (iii)
- Integrating Shapley value allocation with heterogeneous demand profiles (methodological advancement);
- (iv)
- Providing policy-relevant analysis using actual Victorian subsidy parameters (practical relevance).
Table 1 positions our study within the existing literature landscape.
Table 1.
Literature Positioning Matrix.
3. Methodology
3.1. System Design and Configuration
The study analyses a representative 6-apartment building in Frankston, Victoria (38.15° S, 145.13° E) with distributed energy resources as described in Figure 1.
Figure 1.
Schematic showing shared DER system topology: PV solar (30 kWp), battery storage (60 kWh), and EV chargers (3 × 7 kW) connected via AC bus to 6-apartment building and grid transformer. Solid arrows show power flow (bidirectional for BESS and grid), dashed lines show information flow to VPP control. Single grid connection enables internal P2P trading.
3.1.1. Building Characteristics
The key criteria being:
- Demographic representativeness: Median income, household size, and tenure distribution align with Greater Melbourne averages [71].
- Solar resource: 4.2 kWh/m2/day annual average (BOM Aspendale station data) [72].
- Grid connection: Low-voltage distribution network typical of suburban Melbourne.
- Regulatory context: Victorian residential electricity regulations apply.
Each apartment represents a heterogeneous occupancy type with distinct demand patterns:
- Apartment 1: Standard family (morning/evening peaks, 22 kWh/day).
- Apartment 2: Early risers (shifted morning peak, 20 kWh/day).
- Apartment 3: Night owls (late evening peak, 23 kWh/day).
- Apartment 4: Work-from-home (daytime usage, 21 kWh/day).
- Apartment 5: Large family (high consumption, 25 kWh/day).
- Apartment 6: Single occupant (efficient, 18 kWh/day).
- Total building consumption: 129 kWh/day (47,085 kWh/year), consistent with Australian apartment averages [73].
3.1.2. Distributed Energy Resources
The shared DER system comprises three integrated components: a rooftop photovoltaic array, a communal battery energy storage system, and electric vehicle charging infrastructure. Table 2 summarises the technical specifications for each component, including capacity ratings, efficiency parameters, and degradation assumptions drawn from manufacturer data and published literature. The system is sized to balance self-consumption optimisation against capital cost constraints for a 6-apartment building, with component interactions governed by the energy management logic described in Section 3.2. Associated capital expenditure estimates are presented in Table 3, reflecting 2025–2026 market pricing.
Table 2.
Distributed energy resource system specifications.
Cost parameters (Year 0):
Table 3.
Distributed energy resource system CAPEX 1.
3.1.3. Single Point of Connection
A critical design feature of this system is that the building operates with a single grid connection point rather than individual apartment meters. This configuration enables internal peer-to-peer (P2P) trading without regulatory constraints that would otherwise apply to separate metered units, while simultaneously reducing metering infrastructure costs from six individual meters to one shared connection point. Furthermore, the unified connection facilitates cooperative optimization at the building level and simplifies grid interaction for VPP operation by presenting the building as a single coordinated entity to the distribution network operator. However, this single-meter approach introduces challenges in the fair allocation of costs and benefits among heterogeneous apartment occupants, which are addressed through Shapley value game theory in Section 3.4.
3.2. Price Data and Market Modeling
3.2.1. Historical Price Analysis
The key observations from the Victorian Default Offer trajectory Table 4 and AEMO wholesale price data Table 5 show that Victoria’s Q4 2024 wholesale price of $45/MWh is the lowest in Australia’s NEM, attributed to: (i) high solar/wind capacity driving down daytime spot prices, (ii) coal plant retirements reducing price floors, and (iii) mild weather reducing demand peaks [4].
Table 4.
Victorian Default Offer (VDO)-ESC official data.
Table 5.
AEMO wholesale prices (Victoria, $/MWh).
3.2.2. Hourly Price Patterns
The model constructs realistic 24 h price profiles based on AEMO data patterns, as seen in Figure 2.
Figure 2.
Hourly wholesale electricity prices showing multipliers applied to $45/MWh base. Shaded regions indicate key arbitrage periods for battery storage systems. Source: AEMO Q4 2024 data pattern.
- Wholesale prices are converted to retail via:where (retail markup factor) encompassing:
- Network charges (40%);
- Environmental costs (15%);
- Retail margin (20%);
- GST (10%);
- Other (15%).
- Resulting retail prices (Year 1):
- Overnight minimum (1–3 am): $0.08/kWh;
- Morning shoulder (6–9 am): $0.20–0.29/kWh;
- Solar surplus (11 am–2 pm): $0.04–0.05/kWh;
- Evening peak (6–8 pm): $0.36–0.41/kWh.
- Feed-in tariff (FIT):
- Minimum: 5 ¢/kWh (Victorian mandate);
- Solar peak (10 am–3 pm): 20–22 ¢/kWh (time-varying FIT available from some retailers);
- Shoulder/off-peak: 5–8 ¢/kWh.
3.2.3. Forward Price Projections
- The model projects prices for 15 years using:where
- = retail price in year $y$, hour $h$;
- = base year hourly price;
- = −1% per annum (conservative renewable impact);
- = 2% per annum (CPI);
- 0.5 = partial pass-through factor.
While historical data shows a −2% trend, we adopt −1% conservatively due to: (i) coal plant closures removing low-cost supply, (ii) network cost inflation, and (iii) policy uncertainty [77,78].
3.3. Optimization Model
3.3.1. Hierarchical Optimization Architecture
The model employs three-level optimization:
- Level 1: Internal P2P Matching
Apartments with surplus PV share with deficit apartments before grid interaction:
where
- S = set of surplus apartments ;
- D = set of deficit apartments ;
- Di = demand of apartment ;
- Pi = PV allocation to apartment i.
- Level 2: BESS Optimization
Battery optimizes energy flows hourly to maximize customer value.
subject to
- Power constraints: .
- Energy constraints: .
- SOC evolution: .
- Grid charging profitability: .
- Level 3: Grid Interaction
Building interfaces with the grid as a single entity, minimizing net cost.
3.3.2. Hourly Energy Flow Simulation
The energy flow simulation operates on an hourly timestep across a full calendar year (8760 h), sequentially allocating generation and storage resources according to a rule-based priority hierarchy. Figure 3 illustrates the decision-making logic as a flowchart, tracing the path from initial PV generation through self-consumption, battery charging, peer-to-peer trading, and grid interaction at each timestep. The simulation proceeds through four sequential priority stages: direct solar self-consumption, battery charge and discharge management, internal peer-to-peer energy allocation, and finally grid import or export settlement. This hierarchical approach ensures that locally generated energy is utilised as efficiently as possible before any grid interaction occurs.
Figure 3.
Flowchart describing the step-by-step decision-making process for the hourly energy flow simulation.
3.3.3. Price Thresholds for Arbitrage
Charging/discharging thresholds adapt to daily price distribution, median-based thresholds automatically adapt to: (i) seasonal price variations, (ii) market volatility, and (iii) long-term price trends, without requiring re-optimization [79].
3.3.4. Computational Implementation
The optimization model described in Section 3.3.1, Section 3.3.2 and Section 3.3.3 is implemented as a rule-based dispatch heuristic rather than a formal mixed-integer linear program (MILP). The three-level architecture—internal P2P matching, BESS charge/discharge scheduling, and grid interaction—is executed sequentially for each hour of each representative day across the 15-year analysis horizon. Battery dispatch follows threshold-based arbitrage logic (Equation (5)), where charging occurs when the retail price falls below 60% of the daily median and discharging occurs when the price exceeds 140% of the daily median. This heuristic approach was selected for three reasons: (i) computational transparency, enabling clear interpretation of dispatch decisions; (ii) practical applicability, as similar rule-based strategies are employed by commercial VPP platforms such as Reposit and Evergen; and (iii) demonstrated performance, as rule-based heuristics have been shown to yield results within 3–5% of MILP-optimal solutions for comparable residential BESS dispatch problems [2].
All simulations were conducted in MATLAB R2024a (MathWorks, Natick, MA, USA) on a desktop workstation (Intel Core i7-12700, 16 GB RAM, Intel Corporation, Santa Clara, CA, USA). A single 15-year scenario executes in approximately 2 s. The full Shapley value computation, requiring 64 coalition evaluations, completes in under 3 min. No commercial optimization solver is required; the heuristic dispatch is implemented using standard MATLAB control-flow operations.
3.4. Economic Analysis Framework
3.4.1. Cash Flow Components
Annual cash inflows:
- Self-consumption savings: ;
- Export revenue: ;
- Arbitrage profit: ;
- P2P savings: .
Annual cash outflows:
- Grid import cost: ;
- Grid charging cost: ;
- PV O&M: ;
- BESS O&M: ;
- Battery replacement (Year 10): .
Net annual cash flow:
3.4.2. Net Present Value Calculation
- = initial investment (post-subsidy).
- (5% discount rate, reflecting typical home loan rates).
- Payback period: Smallest such that .
Return on investment (ROI):
3.4.3. Subsidy Modeling
The subsidy scenarios Table 6, reflect the range of Victorian government support mechanisms currently available, from zero incentives through to full STC allocation combined with state-level rebates such as the Solar Victoria program. When applied to the system CAPEX in Table 7, the impact is substantial—the “High” scenario reduces total project cost from $52,500 to $26,700, nearly halving the per-apartment outlay from $8750 to $4450. Even the conservative “Low” scenario Table 6 delivers a 25% reduction in post-subsidy CAPEX Table 7, demonstrating that government incentives materially improve the financial viability of integrated solar, BESS, and EV charging installations in multi-residential developments.
Table 6.
Four scenarios reflecting Victorian programs.
Table 7.
Post-subsidy CAPEX.
3.5. Shapley Value Allocation
3.5.1. Cooperative Game Formulation
Define grand coalition (all apartments) with characteristic function:
Assumptions:
- Super additivity: for disjoint
- Grand coalition forms: All apartments participate (realistic given shared infrastructure)
3.5.2. Shapley Value Calculation
For apartment i, Shapley value:
Computational approach: Full enumeration requires coalition valuations. We use the marginal contribution approximation:
where Di = total energy demand of apartment i.
In energy-sharing coalitions, apartment contributions are approximately proportional to consumption [80]. This simplification reduces computation while maintaining fairness properties.
To validate this approximation, we computed the exact Shapley values by evaluating all 26 = 64 coalition subsets. For each coalition C ⊆ N, the characteristic function v(C) was evaluated by simulating the VPP operation using only the apartments in C, with DER capacity scaled proportionally to coalition size. The exact Shapley value for each apartment was then computed using Equation (10). The results reveal a mean absolute percentage error (MAPE) of 10.5% between the demand-proportional approximation and exact Shapley values. For four of the six apartments (Apartments 1, 2, 3, and 4), the approximation error remains below 10%. However, Apartment 5 (large family, highest consumption) shows a 13.6% underestimate, and Apartment 6 (single/efficient, lowest consumption) shows a 28.0% overestimate under the proportional method. These discrepancies arise because the exact Shapley value captures each apartment’s marginal contribution across all possible coalition orderings—not merely its demand share. High-consumption apartments such as Apartment 5 contribute disproportionately to economies of scale in shared infrastructure utilization, while low-consumption apartments such as Apartment 6 contribute less marginal value than their demand share would suggest. This finding validates the reviewer’s concern that demand-proportional allocation may alter fairness properties. For the 6-apartment building studied here, exact Shapley computation is computationally trivial (64 evaluations, <3 min runtime) and should be preferred. The demand-proportional formula (Equation (11)) remains a practical approximation for larger buildings (>15 apartments) where full enumeration becomes computationally expensive (2n coalitions), but users should be aware of the potential for double-digit percentage errors for extreme-consumption apartments.
3.5.3. Fairness Properties
- Shapley value satisfies:
Efficiency: (all values distributed);
Symmetry: Equal contributors receive equal allocation;
Dummy player: Zero contributors receive zero allocation;
Additivity: Linear in characteristic function.
3.6. Sensitivity Analysis
- The model evaluates sensitivity to:
Technology costs: PV ($700–1200/kW), BESS ($250–500/kWh);
Discount rate: 3–7% (green loans to standard mortgages);
Price decline: 0% to −3% annually;
Battery efficiency: 85–95% round-trip;
Subsidy levels: 0–70% for BESS, 0–50% for PV.
3.7. Assumptions and Limitations
- Key assumptions:
- Demand stability: Apartment consumption patterns remain stable over 15 years.
- Technology availability: Bidirectional inverters and grid charging remain permissible.
- Price predictability: Forward projections follow historical trends (±15% uncertainty).
- Regulatory continuity: VPP-friendly policies persist (reasonable in Victoria post-2024 reforms).
- Strata approval: All residents agree to participate (potentially challenging in practice).
- Limitations:
- Single building: Results may not generalize to larger/smaller buildings or different demographics.
- No FCAS modeling: Omits potential VPP revenue from frequency services (additional upside).
- Static tariffs: Does not model dynamic/real-time pricing (emerging in Australia).
- Degradation: Linear approximation (actual degradation is non-linear).
- No weather variability: Uses average solar/demand patterns (inter-annual variation exists).
- Data source classification: This study incorporates both real-world market data and representative demand profiles. Real data sources include: (i) actual AEMO wholesale electricity prices for Victoria, Q4 2024 (Table 5); (ii) official ESC Victorian Default Offer pricing data, 2019–2025 (Table 4); (iii) Bureau of Meteorology solar irradiance data for the Frankston/Aspendale region; and (iv) actual Victorian government subsidy program parameters including Solar Victoria rebates, battery rebates, and Small-Scale Technology Certificates. Representative inputs include: (i) apartment demand profiles, which are archetypes based on Australian Bureau of Statistics household energy consumption data [73] rather than monitored data from a specific building; and (ii) the building configuration, which is representative of suburban Melbourne apartment stock. This combination of real market data with representative demand profiles is standard practice in pre-investment techno-economic feasibility studies [14,31] and enables generalizable policy insights while maintaining empirical grounding in actual market conditions.
4. Results
The following results are organized to address the five research objectives stated in Section 1.3. Objective 1 (comprehensive techno-economic model) is addressed through the system design and energy flow analysis in Section 4.1 and Section 4.2 (Table 8, Table 9 and Table 10). Objective 2 (grid charging impact quantification) is addressed in Section 4.5, which directly compares performance with and without grid arbitrage capability. Objective 3 (Shapley value cooperative allocation) is addressed in Section 4.3, presenting both exact and approximate fair benefit distributions. Objective 4 (subsidy sensitivity and policy thresholds) is addressed in Section 4.6. Objective 5 (actionable policy recommendations) is addressed in Section 5.3 and Section 5.4 of the Discussion.
4.1. Base Case: Energy Flows and Self-Sufficiency
4.1.1. Daily Energy Balance (Medium Subsidy, Year 1)
Table 8 presents hourly energy flows for a representative day under a medium subsidy scenario with grid charging enabled.
Table 8.
Hourly energy flows (kWh)–representative summer day.
- Daily Totals:
- Load: 129 kWh.
- PV generation: 81 kWh.
- PV direct to load: 48 kWh (59% of PV).
- PV to battery: 15 kWh (19% of PV).
- PV export: 18 kWh (22% of PV).
- Grid to load: 33 kWh.
- Grid to battery: 30 kWh (arbitrage charging).
- Battery to load: 55 kWh (including 27 kWh from grid charging).
- Key observations:
- Grid charging occurs 1–3 am when prices are $0.07–0.08/kWh.
- Battery discharge concentrated 6–9 pm when prices peak at $0.36–0.41/kWh.
- Self-sufficiency: (48 + 55)/129 = 79.8% (vs. 50% without grid charging).
- Arbitrage profit: 27 kWh × ($0.38 − $0.08) = $8.10/day.
4.1.2. Monthly Seasonal Variation
Table 9 shows monthly energy performance reflecting Melbourne’s seasonal solar resource.
Table 9.
Monthly energy performance summary—daily averages by month.
4.1.3. Model Validation
To validate the simulation model, key Year 1 performance metrics were compared against published operational data from comparable Australian PV + BESS installations. The simulated annual PV yield of 1008 kWh/kWp falls within the 900–1200 kWh/kWp range reported by the Australian PV Institute for Melbourne-region systems [72]. The modeled self-sufficiency ratio of 72.1% is consistent with the 55–80% range observed in the Tesla South Australia Virtual Power Plant program [28], which aggregates over 50,000 residential PV + BESS systems. The simulated peak demand reduction of 29.9% falls slightly below the 30–50% range reported by the AGL Virtual Power Plant program [30]; this is attributable to the conservative discharge threshold adopted in our rule-based heuristic, which restricts battery discharge to high-price hours only and does not discharge during moderate-price shoulder periods. The modeled battery cycling frequency of 0.64 cycles per day is below the 0.8–1.5 range reported in AEMO’s DER integration studies [27]; the lower cycling rate reflects the threshold-based dispatch strategy, which prioritizes arbitrage value over cycling frequency. In practice, a more aggressive dispatch strategy or participation in FCAS markets (not modeled here) would increase cycling rates. Overall, three of the five validation metrics fall within published ranges, while the remaining two are conservatively below reported benchmarks—consistent with our deliberate use of conservative dispatch assumptions. These comparisons provide reasonable confidence that the model parameters and dispatch logic produce outputs broadly consistent with real-world operational performance of comparable Australian VPP installations.
4.2. Economic Performance by Subsidy Scenario
4.2.1. Net Present Value Analysis
Table 10 presents 15-year NPV results across subsidy scenarios, comparing cases with and without grid charging.
Table 10.
Net present value results (15-Year, 5% discount rate).
- Key findings:
- (i)
- Grid charging adds $10,000–14,000 NPV across all scenarios.
- (ii)
- Medium scenario becomes viable (positive NPV, <15-year payback) with grid charging.
- (iii)
- High scenario achieves 90% ROI with grid charging.
- (iv)
- Marginal viability threshold: ~$34,000 post-subsidy CAPEX.
4.2.2. Annual Cash Flow Evolution
Figure 4 decomposes the medium subsidy cumulative cash flow over the 15-year lifecycle into three constituent streams: non-arbitrage savings (PV self-consumption, export, and peer-to-peer sharing), net grid arbitrage benefit, and gross grid charging cost. Year 0 reflects a post-subsidy CAPEX of $33,600. Years 1–9 show consistent positive accumulation, with the non-arbitrage base contributing approximately $4250 per apartment in Year 1 and the arbitrage stream adding a further $2409 net of charging costs. The payback threshold is reached at year 10.5, marked by the dashed vertical line. Year 10 exhibits a step reduction in cumulative return due to battery replacement ($11,300), though neither the arbitrage nor non-arbitrage lines are interrupted. Years 11–15 show full recovery, with annual cash flows reaching approximately $5120 by Year 15. All scenarios include grid charging capability, with higher subsidies compressing the payback period and accelerating cumulative return throughout the lifecycle.
Figure 4.
Cumulative cash flow decomposition—medium subsidy scenario (35% PV, 45% BESS). Shaded areas indicate non-arbitrage savings (blue), net arbitrage contribution (green), and gross charging cost (red). Dashed verticals mark payback crossover (Year 3) and battery replacement (Year 10).
4.2.3. Arbitrage Contribution Analysis
Table 11 quantifies the grid arbitrage value.
Table 11.
Grid arbitrage economics (medium subsidy).
Without arbitrage, the medium scenario would have a negative NPV of −$14,000. Arbitrage adds $27,000, resulting in a net positive NPV of $13,000.
4.3. Shapley Value Allocation
Fair Benefit Distribution
Table 12 shows the Shapley value allocation among apartments under the medium subsidy scenario.
Table 12.
Shapley value fair allocation (medium subsidy, total NPV: $13,247).
- Per-apartment metrics:
- Average NPV: $2208;
- Average ROI: 39.4% (15-year);
- Range: $1848–$2565 (39% variation).
By comparing each apartment’s allocated share of the total net present value (NPV) with its relative contribution to aggregate electricity consumption. Under the proportional, Shapley-consistent allocation framework, apartments with higher electricity usage receive a correspondingly larger share of the cooperative surplus. As expected, high-consumption apartments, such as Apartment 5, capture greater absolute economic benefits due to their higher utilization of shared DER infrastructure and greater exposure to avoided grid imports and arbitrage opportunities. Importantly, lower-consumption apartments are not disadvantaged by the cooperative arrangement; Apartment 6, representing a low-consumption household, still achieves a positive NPV under economically viable scenarios. Overall, the results demonstrate proportional fairness, whereby allocation shares closely match consumption shares, ensuring that all participating apartments benefit from cooperation and that the VPP arrangement remains individually rational and stable over the project lifetime.
4.4. Sensitivity Analysis
4.4.1. Cost Sensitivity
The economic viability of shared DER systems depends critically on the capital cost of the two primary components: PV panels and battery storage. To quantify this relationship, a two-dimensional sensitivity analysis was conducted by varying PV cost from $700/kW to $1300/kW and BESS cost from $250/kWh to $550/kWh, holding all other parameters at their base-case values. Figure 5 presents the results as a heatmap with NPV contours, where the bold red line demarcates the viability boundary (NPV = 0) and the yellow marker indicates the current market position. Table 13 provides the corresponding numerical values for each cost combination. The analysis reveals that BESS cost exerts a substantially greater influence on project viability than PV cost: a $100/kWh reduction in battery cost increases NPV by approximately $5600, compared with $2950 for an equivalent $100/kW reduction in PV cost. This 1.9:1 ratio reflects the dual revenue role that battery storage plays in both self-consumption optimisation and grid arbitrage.
Figure 5.
Technology cost sensitivity analysis using complementary 2D and 3D visualizations: 2D heatmap of the NPV as function of PV cost and BESS cost. The bold red contour marks viability boundary (NPV = 0). Yellow circle: current market position ($900/kW, $350/kWh, NPV = $13,247).
Table 13.
Technology cost sensitivity (medium subsidy).
Key insights: BESS cost is more critical than PV cost. $100/kWh reduction in BESS cost increases NPV by $5600, while $100/kW reduction in PV cost increases NPV by $2950.
4.4.2. Discount Rate Sensitivity
The choice of discount rate significantly affects the present value of future energy savings and revenue streams, making it a key determinant of perceived project viability. Table 14 presents NPV, ROI, and payback period across four discount rates representing distinct financing contexts, ranging from subsidised green loans at 3% through to investor hurdle rates at 10%. At the base-case rate of 5%, the system achieves an NPV of $13,247 with a 39.4% ROI, while access to green financing at 3% increases NPV to $19,245—an improvement of approximately $6000. This finding underscores the importance of policy mechanisms that lower the cost of capital for residential DER investments, as even modest reductions in interest rates can shift marginal projects into clearly viable territory.
Table 14.
Discount rate sensitivity.
Policy implication: Green financing programs (3–4% interest) substantially improve viability. A 2-percentage-point rate reduction adds ~$6000 NPV.
4.4.3. Price Decline Scenario Analysis
Future electricity price trajectories introduce a further source of uncertainty into the long-term economic case for shared DER systems. Table 15 examines four annual price decline scenarios, from stable retail prices (0%) to an aggressive 3% annual reduction reflecting accelerated renewable deployment. The results reveal a counterintuitive dynamic: declining retail electricity prices actually reduce the system’s NPV, from $16,320 under stable prices to $8105 under 3% annual decline, because the value of avoided grid consumption diminishes over time. However, this effect is partially offset by a widening spread between peak and off-peak prices, which enhances grid arbitrage revenue. Even under the most aggressive price decline scenario, the system remains marginally viable, suggesting that the shared DER model is reasonably robust to long-term electricity market trends.
Table 15.
Price decline scenario analysis.
4.4.4. Load Sensitivity Analysis
To assess the robustness of results to demand uncertainty, total building load was varied by ±20% from the base case of 129 kWh/day, as seen in Table 16. All apartment demands were scaled uniformly while maintaining the same relative consumption proportions. The analysis was conducted under the medium subsidy scenario with grid charging enabled.
Table 16.
Load sensitivity analysis (medium subsidy, grid charging enabled).
The results demonstrate that the VPP remains economically viable (positive NPV) across the full ±20% load variation range, with NPV ranging from $19,620 (−20% load) to $47,867 (+20% load). NPV exhibits a strong positive relationship with load: each 10% increase in building demand increases NPV by approximately 52%, reflecting greater total savings volume from a larger base of avoided grid imports. Self-sufficiency remains relatively stable across scenarios (71.5–72.4%), as both PV generation and demand scale together under the shared infrastructure model. The payback period varies from 4.0 years (+20% load) to 5.9 years (−20% load), a range of 1.9 years. The ROI ranges from 58.4% to 142.5% across the tested load range, indicating strong economic viability under all scenarios. These findings indicate that the economic conclusions of this study are robust to moderate variations in building occupancy patterns and consumption levels, and that higher-demand buildings benefit disproportionately from VPP participation due to greater utilization of shared DER infrastructure.
4.5. Comparison: With vs. Without Grid Charging
Table 17 summarizes key performance differences.
Table 17.
Grid charging impact assessment (medium subsidy).
Arbitrage profit (21% of NPV);
Increased self-sufficiency (reduced grid import by 27%);
Better battery utilization (doubling cycle frequency amortizes CAPEX faster).
4.6. Policy Scenario Insights
4.6.1. Viability Thresholds
Figure 6 shows the net present value across PV subsidy (x-axis, 0–50%) and BESS subsidy (y-axis, 0–70%) parameter space. Color gradient indicates NPV magnitude: red (not viable, NPV < 0), yellow (marginally viable, 0 < NPV < $5 k), and green (viable, NPV > $5 k). Black contour lines show NPV isolines at $10 k intervals; bold red line marks viability boundary (NPV = 0); and dashed green line indicates strong viability threshold (NPV = $5 k). Blue dotted lines denote minimum viability thresholds (BESS ≥ 45% OR PV ≥ 35%). Blue circle marks Victorian medium subsidy program (35% PV, 45% BESS) achieving NPV = $13,247 in the viable region. A steeper vertical gradient compared to a horizontal gradient demonstrates BESS subsidies are 1.5× more cost-effective than PV subsidies per percentage point increase. Viability boundary slope (−0.67) indicates a 10 percentage point BESS subsidy increase equivalent to a 15 percentage point PV subsidy increase in NPV impact. Results support policy prioritization of battery storage subsidies over solar subsidies for maximizing apartment VPP adoption within constrained government budgets.
Figure 6.
NPV surface projection onto PV-BESS subsidy parameter space.
- Key thresholds identified:
- Minimum viability: BESS ≥ 45% OR PV ≥ 35% (with grid charging).
- Strong viability: BESS ≥ 55% AND PV ≥ 30%.
- Without grid charging: Requires BESS ≥ 60% AND PV ≥ 40%.
- Policy recommendation: Prioritize BESS subsidies over PV subsidies for apartment VPP viability. A 10 pp increase in BESS subsidy is equivalent to a 15 pp increase in PV subsidy.
4.6.2. Subsidy Cost-Effectiveness
To evaluate the fiscal efficiency of each incentive tier, Table 18 outlays the government subsidy compared against the private net present value generated for participants. The ‘Low’ scenario yields a cost-effectiveness ratio of 5.98:1, meaning each dollar of government subsidy generates nearly $6 in private NPV—however, this high ratio reflects modest absolute returns ($2184 NPV) that may be insufficient to drive widespread adoption. The ‘Medium’ scenario strikes the strongest balance, delivering $1.43 in private NPV for every $1 of subsidy cost, representing genuine net wealth creation while maintaining fiscal restraint. At the ‘High’ level, the ratio approaches 1:1 (1.08:1), indicating diminishing returns where additional public expenditure yields only marginally more private benefit.
Table 18.
Subsidy cost-effectiveness from government perspective.
- Interpretation: Medium subsidy achieves $1.43 NPV per $1 subsidy (net wealth creation). High subsidy approaches are 1:1 (diminishing returns).
- Optimal policy: Target medium subsidy level (35% PV, 45% BESS) to maximize cost-effectiveness, adoption rates and fiscal sustainability.
5. Discussion
5.1. Principal Findings
This study demonstrates that apartment buildings can operate as economically viable Virtual Power Plants under realistic market conditions, provided three enabling factors are present:
- Technology cost decline: PV ≤ $900/kW, BESS ≤ $350/kWh (achievable by 2026).
- Grid charging capability: Bidirectional inverters enabling arbitrage (regulatory barrier removal).
- Moderate subsidies: ~40% BESS, ~35% PV (aligned with Victorian programs).
- The analysis yields four key insights:
- Finding 1: Grid Arbitrage is Transformational
Grid charging capability increases NPV by $10,000–14,000 (1200% improvement in marginal cases), contributing 15–25% of the total value. This finding extends the prior residential BESS literature [14,17] by quantifying arbitrage value in the Australian market context with realistic hourly price data.
- Finding 2: BESS Subsidies More Impactful than PV Subsidies
Dollar for dollar, BESS subsidies generate 1.5–2× more NPV than PV subsidies. This contradicts prevailing policy focus on solar incentives [67] and suggests rebalancing toward storage subsidies for apartment applications.
- Finding 3: Shared Infrastructure Enables Viability
Per-apartment equivalent costs ($8750 for 10 kWh BESS + 5 kW PV) are 35–40% lower than individual systems due to: (i) bulk purchase discounts, (ii) shared inverter/installation costs, and (iii) single metering point. This advantage is unique to multi-dwelling applications.
- Finding 4: Internal P2P Trading Adds 15–20% in Value
Diversity in demand patterns enables peer-to-peer sharing worth $1800–2400 NPV, even without formal blockchain/smart contract infrastructure. This validates cooperative optimization approaches in apartment microgrids [51,57].
5.2. Comparison with Prior Literature
- Agreement with prior findings:
- Parra et al. (2021) [14]: Grid charging increases residential BESS value by 25–40% (UK context)—we find 30–50% in Victoria.
- Huang et al. (2020) [31]: Australian residential PV + BESS achieves 8–15% ROI without subsidies—we find 3–10% depending on scenario.
- Wu et al. (2018) [51]: Cooperative game theory yields 10–20% value uplift vs. individual operation—we find 15–20% from P2P sharing.
- Novel contributions:
- First to combine hourly arbitrage optimization, Shapley allocation, apartment buildings and current prices in Victoria, Australia.
- Demonstrates viability improvement of 1200% from grid charging (not previously quantified).
- Identifies specific subsidy thresholds (45% BESS, 35% PV) for apartment VPP viability.
- Divergence from the literature:
- Alstone et al. (2017) [16] find negative NPV for residential storage in California—we find positive NPV in Victoria due to wider price spreads.
- Crosara et al. (2019) [57] require blockchain for apartment energy sharing—we show simpler Shapley allocation suffices.
5.3. Policy Implications
5.3.1. Subsidy Design Recommendations
- Recommendation 1: Rebalance Toward Storage
Current Victorian programs provide ~35% effective subsidy for both PV and BESS (when stackable). Our analysis suggests optimal allocation:
- PV: 30–35% (maintain current).
- BESS: 50–60% (increase from current 40–45%).
- Rationale: Storage enables arbitrage (21% of NPV) and self-sufficiency (reduces grid import 27%).
- Recommendation 2: Means-Test by Building, Not Individual
Current rebates means-tested for individual apartment owners, creating complexity in shared systems. Recommend:
- Aggregate household income across buildings.
- Apply a single rebate to shared infrastructure.
- Simplifies administration and removes inter-owner barriers.
- Recommendation 3: Time-Limited Incentives
Battery costs are declining 10–15% annually [36]. Recommend:
- Phase out subsidies over 5 years (2025–2030).
- Announced schedule reduces policy uncertainty.
- Allows time for market maturation.
5.3.2. Regulatory Reforms
- Reform 1: Embedded Network Simplification
Current regulations impose onerous licensing requirements for apartment buildings with shared energy systems [68]. Recommend:
- Exemption for buildings < 20 apartments.
- Simplified registration process.
- Clear guidance on strata approval processes.
- Reform 2: Grid Charging Enablement
Some retailers prohibit or penalize grid charging. Recommend:
- Mandate non-discriminatory tariffs.
- Require retailers to offer arbitrage-friendly TOU tariffs.
- Remove restrictions on bidirectional energy flows.
- Reform 3: VPP Aggregation Framework
Clarify legal/technical requirements for apartment VPPs to participate in FCAS markets:
- Minimum aggregation size (suggest 1 MW).
- Telemetry and controllability standards.
- Fast-track approval for certified systems.
5.3.3. Market Design Considerations
- Consideration 1: Price Volatility Enhancement
Arbitrage value increases with price spread. Consider:
- Wider peak/off-peak differentials in TOU tariffs.
- Real-time pricing pilots for VPP-enabled buildings.
- Removal of price caps that reduce arbitrage signals.
- Consideration 2: Export Tariff Structure
Current flat FIT (~5¢/kWh) undervalues solar during scarcity. Consider:
- Time-varying FIT (higher in evening, lower in midday).
- Aligns export incentives with grid needs.
- Increases PV + BESS value proposition.
5.4. Practical Implementation Challenges
5.4.1. Strata Governance Barriers
- Challenge: Australian strata law requires typically 75% owner approval for major capital work [81]. Holdouts can block adoption.
- Solutions:
- Opt-in model: Non-participating apartments excluded from benefits (complex metering).
- Developer pre-installation: New buildings include VPP infrastructure as standard.
- Legislative reform: Lower approval threshold for energy efficiency upgrades.
5.4.2. Tenant–Owner Split Incentives
- Challenge: Owners bear CAPEX, but tenants receive operational savings (reduced bills).
- Solutions:
- Green lease provisions: Owners recoup investment via a small rent premium.
- Subsidized retrofits: Reduce owner CAPEX to a level where property value uplift suffices.
- Utility ownership: Third-party owns/operates DERs, sells energy at a discount to residents.
5.4.3. Technical Complexity
- Challenge: Coordinating battery dispatch, P2P sharing, and metering across six apartments requires sophisticated control systems.
- Solutions:
- Turnkey VPP platforms: Providers like Reposit, Evergen, and RedGrid offer managed services.
- Cloud-based optimization: Reduces on-site hardware requirements.
- Standardization: Industry standards for apartment VPP architectures.
5.5. Limitations and Future Research
5.5.1. Study Limitations
- Single building archetype: Six apartments may not represent larger buildings (20–50 units) or different demographic profiles.
- Geographic specificity: Victorian results may not generalize to other Australian states or international contexts.
- Static demand: Ignores potential electrification (EVs, heat pumps), increasing consumption.
- Perfect foresight: Arbitrage algorithm assumes known future prices (in reality, forecasting error exists).
- Simplified Shapley: Proportional allocation approximates but does not capture full cooperative game complexity.
5.5.2. Research Extensions
- Extension 1: Larger Buildings
Analyze 20–50 apartment buildings to assess:
- Economies of scale in DER sizing.
- Complexity in governance and metering.
- Interaction with commercial loads (if mixed-use).
- Extension 2: FCAS Revenue
Integrate wholesale FCAS market participation:
- Model frequency response capability.
- Quantify revenue potential ($400–800/kW/yr demonstrated [27]).
- Assess combined arbitrage + FCAS optimization.
- Extension 3: Vehicle-to-Grid (V2G)
Model EVs as mobile storage:
- Bidirectional EV charging (emerging technology).
- Arbitrage opportunities from EV batteries.
- Complexity of user availability constraints.
- Extension 4: Climate Scenarios
Evaluate sensitivity to:
- Extreme weather events (heatwaves reducing solar, increasing demand).
- Long-term climate trends (changing irradiance patterns).
- Grid reliability during bushfire season.
- Extension 5: Blockchain P2P Trading
Compare Shapley allocation vs. blockchain-based P2P markets:
- Transaction costs and complexity.
- Fairness and efficiency trade-offs.
- Resident acceptance and trust.
- Extension 6: Machine Learning Optimization
Replace rule-based arbitrage with:
- Reinforcement learning for battery dispatch.
- Price forecasting with neural networks.
- Adaptive optimization as market conditions evolve.
5.6. Generalizability
- Conditions favoring replication elsewhere:
- High price volatility: Markets with >3× peak/off-peak spread (e.g., California, Germany, UK).
- Declining DER costs: Global trend suggests universal applicability by 2027–2028.
- Supportive policies: Subsidies, streamlined approvals, and grid charging allowance.
- Apartment stock: Developed nations with 10–30% multi-dwelling share.
- Conditions limiting replication:
- Low price spreads: Flat tariffs or regulated prices reduce arbitrage value.
- Grid instability: Frequent outages or curtailment undermine VPP economics.
- Regulatory barriers: Prohibitive embedded network regulations or export limitations.
- Low solar resource: High-latitude regions (>50°) may have insufficient PV generation.
- Verdict:
The findings of this study are broadly generalizable to electricity markets with similar regulatory and operational characteristics, including Australian National Electricity Market (NEM) jurisdictions such as New South Wales, Queensland, and South Australia, as well as international contexts such as California, Texas (ERCOT), the United Kingdom, and Germany, where comparable price volatility, time-varying tariffs, and high renewable penetration exist. However, the results are not directly transferable to regulated monopoly markets, regions with limited seasonal or diurnal variability in electricity demand and generation (e.g., tropical climates), or jurisdictions that restrict or prohibit bidirectional charging and behind-the-meter battery participation in energy markets.
6. Conclusions
6.1. Summary of Contributions
This study provides the first comprehensive techno-economic analysis of apartment buildings as Virtual Power Plants, incorporating:
- Hourly optimization with grid arbitrage capability.
- Actual Victorian electricity market data (AEMO, ESC, and VDO).
- Shapley value cooperative game theory for fair benefit allocation.
- Realistic government subsidy scenarios.
- The analysis definitively demonstrates that apartment VPPs are economically viable under achievable conditions:
- Technology costs: PV $900/kW, BESS $350/kWh (2025–2026 pricing).
- Subsidies: 35% PV, 45% BESS (Victorian programs).
- Grid charging: Bidirectional capability enabled (regulatory reform underway).
- Key result:
Grid charging transforms marginal economics (3% ROI, 14.8-year payback) into a robust business case (39% ROI, 10.5-year payback), adding $12,000–14,000 NPV over 15 years.
6.2. Theoretical Contributions
- Methodological: Hierarchical optimization framework combining internal P2P sharing, battery arbitrage, and grid interaction in a single model.
- Game-theoretic: Shapley value application to heterogeneous apartment demand profiles with shared infrastructure.
- Empirical: Quantification of grid arbitrage value (21% of total NPV) in residential multi-dwelling context.
6.3. Policy Contributions
- Subsidy prioritization: BESS subsidies deliver 1.5–2× more NPV per dollar than PV subsidies for apartments.
- Viability thresholds: 45% BESS + 35% PV subsidies achieve strong viability (>$10 k NPV, <11-year payback).
- Cost-effectiveness: The medium subsidy scenario generates $1.43 private NPV per $1 government expenditure.
6.4. Practical Contributions
- Investment decision support: Developers and strata corporations can assess VPP viability using realistic parameters.
- Technology roadmap: Battery cost must reach $350/kWh for unsubsidized viability (achievable 2027–2028).
- Regulatory priorities: Grid charging enablement and embedded network simplification are critical reforms.
6.5. Final Remarks
The energy transition requires innovative business models that align private incentives with public goals. This study demonstrates that apartment VPPs—combining shared infrastructure, cooperative optimization, and grid arbitrage—can deliver:
- Customer value: 40% ROI with manageable payback.
- Grid benefits: 40% peak reduction, 70% self-sufficiency.
- Environmental impact: 10 tons of CO2 avoided annually per building.
The path to viability is clear: declining battery costs, moderate subsidies and regulatory enablement will make apartment VPPs economically compelling by 2029.
Policymakers should act now to remove regulatory barriers and calibrate subsidies, positioning Australia as a global leader in multi-dwelling renewable integration. Technology works. Economics work. The policy pathway is evident. All that remains is implementation.
Author Contributions
Conceptualization, J.N., S.Y. and I.L.; methodology, J.N., S.Y. and H.T.; software, J.N. and S.Y.; validation, J.N., S.Y. and I.L.; formal analysis, J.N., S.Y. and H.T.; data curation, J.N.; writing—original draft preparation, J.N.; writing—review and editing, S.Y. and H.T.; supervision, S.Y., H.T. and I.L.; funding acquisition, S.Y. All authors have read and agreed to the published version of the manuscript.
Funding
This research was funded by the Australian Research Council (ARC), Grant Number IC210100021.
Data Availability Statement
The original contributions presented in this study are included in the article. Further inquiries can be directed to the corresponding author.
Acknowledgments
The authors gratefully acknowledge the Australian Energy Market Operator (AEMO) for wholesale electricity market data, the Essential Services Commission (ESC) Victoria for Victorian Default Offer pricing data (2019–2025), and the Australian Bureau of Meteorology (BOM) for solar irradiance data. Solar Victoria provided detailed subsidy program documentation. The authors acknowledge Deakin University for computational facilities and MATLAB software access.
Conflicts of Interest
Author Ian Lilley is affiliated with Zeco Australian Energy Solutions Pty Ltd., which supported and collaborated on this study. The company may potentially benefit from the outcomes presented in this paper. All efforts were made to ensure objectivity and scientific rigor.
Abbreviations
The following abbreviations are used in this manuscript:
| AEMO | Australian Energy Market Operator |
| BESS | Battery Energy Storage System |
| BOM | Bureau of Meteorology (Australia) |
| CAPEX | Capital Expenditure |
| DER | Distributed Energy Resource(s) |
| EOL | End of Life |
| EV | Electric Vehicle |
| FCAS | Frequency Control Ancillary Services |
| FIT | Feed-In Tariff |
| IRR | Internal Rate of Return |
| LCOE | Levelized Cost of Energy |
| NEM | National Electricity Market (Australia) |
| NPV | Net Present Value |
| OPEX | Operating Expenditure |
| P2P | Peer-to-Peer (energy trading) |
| PBP | Payback Period |
| ROI | Return on Investment |
| SCR | Self-Consumption Rate |
| SOC | State of Charge (battery) |
| STC | Small-Scale Technology Certificate |
| TOU | Time of Use (tariff) |
| V2G | Vehicle-to-Grid |
| VPP | Virtual Power Plant |
References
- Australian Renewable Energy Agency. Australian PV Institute (APVI) Solar Map. 2024. Available online: https://pv-map.apvi.org.au (accessed on 2 February 2026).
- Ratnam, K.S.; Weller, S.R.; Kellett, C.M. An Optimization-Based Approach to Scheduling Residential Battery Storage with Solar PV: Assessing Customer Benefit. Renew. Energy 2017, 75, 123–134. [Google Scholar] [CrossRef] [Scilit]
- Essential Services Commission Victoria. Victorian Default Offer 2024–25: Final Decision; Essential Services Commission Victoria: Melbourne, Australia, 2024. [Google Scholar]
- Australian Energy Market Operator. Quarterly Energy Dynamics Q4 2024; Australian Energy Market Operator: Melbourne, Australia, 2024. [Google Scholar]
- Australian Bureau of Statistics. Population: Census. 2021. Available online: https://www.abs.gov.au/statistics/people/population/population-census/latest-release (accessed on 2 February 2026).
- Rosen, C.; Madlener, R. Regulatory Options for Local Reserve Energy Markets: Implications for Prosumers, Utilities, and Other Stakeholders. Energy J. 2016, 37, 39–50. [Google Scholar] [CrossRef] [Scilit]
- Pudjianto, D.; Ramsay, C.; Strbac, G. Virtual Power Plant and System Integration of Distributed Energy Resources. IET Renew. Power Gener. 2007, 1, 10–16. [Google Scholar] [CrossRef] [Scilit]
- Mundada, A.S.; Shah, K.K.; Pearce, J.M. Levelized Cost of Electricity for Solar Photovoltaic, Battery and Cogen Hybrid Systems. Renew. Sustain. Energy Rev. 2016, 57, 692–703. [Google Scholar] [CrossRef] [Scilit]
- McKenna, E.; McManus, M.; Cooper, S.; Thomson, M. Economic and Environmental Impact of Lead-Acid Batteries in Grid-Connected Domestic PV Systems. Appl. Energy 2013, 104, 239–249. [Google Scholar] [CrossRef] [Scilit]
- Hanna, R.; Kleissl, J.; Nottrott, A.; Ferry, M. Energy Dispatch Schedule Optimization for Demand Charge Reduction Using a Photovoltaic-Battery Storage System with Solar Forecasting. Sol. Energy 2014, 103, 269–287. [Google Scholar] [CrossRef] [Scilit]
- Stadler, M.; Cardoso, G.; Mashayekh, S.; Forget, T.; DeForest, N.; Agarwal, A.; Schönbein, A. Value Streams in Microgrids: A Literature Review. Appl. Energy 2017, 162, 980–989. [Google Scholar] [CrossRef] [Scilit]
- Roberts, M.B.; Bruce, A.; MacGill, I. Impact of Shared Battery Energy Storage Systems on Photovoltaic Self-Consumption and Electricity Bills in Apartment Buildings. Appl. Energy 2019, 245, 78–95. [Google Scholar] [CrossRef] [Scilit]
- Yang, Q.; Hu, X.; Lei, X.; Zhu, Y.; Wang, X.; Ji, S. Adaptive operation strategy for voltage stability enhancement in active DMFCs. Energy Convers. Manag. 2018, 168, 11–20. [Google Scholar] [CrossRef] [Scilit]
- Parra, D.; Swierczynski, M.; Stroe, D.I.; Norman, S.; Abdon, A.; Worlitschek, J.; O’Doherty, T.; Rodrigues, L.; Gillott, M.; Zhang, X.; et al. An Interdisciplinary Review of Energy Storage for Communities: Challenges and Perspectives. Renew. Sustain. Energy Rev. 2017, 79, 730–749. [Google Scholar] [CrossRef] [Scilit]
- Mulleriyawage, U.G.K.; Shen, W.X. Optimally Sizing of Battery Energy Storage Capacity by Operational Optimization of Residential PV-Battery Systems: An Australian Household Case Study. Renew. Energy 2020, 160, 852–864. [Google Scholar] [CrossRef] [Scilit]
- Alstone, P.; Potter, J.; Piette, M.A.; Schwartz, P.; Berger, M.A.; Dunn, L.N.; Smith, S.J.; Sohn, M.D.; Aghajanzadeh, A.; Stensson, S. 2025 California Demand Response Potential Study; Lawrence Berkeley National Laboratory: Berkeley, CA, USA, 2017. [Google Scholar]
- Müller, M.; Viernstein, L.; Truong, C.N.; Eiting, A.; Hesse, H.C.; Witzmann, R.; Jossen, A. Evaluation of Grid-Level Adaptability for Stationary Battery Energy Storage System Applications in Europe. J. Energy Storage 2017, 9, 1–11. [Google Scholar] [CrossRef] [Scilit]
- Tushar, W.; Yuen, C.; Saha, T.K.; Liddell, P.; Bean, R.; Poor, H.V. Peer-to-Peer Energy Trading with Sustainable User Participation: A Game Theoretic Approach. IEEE Access 2019, 6, 62932–62943. [Google Scholar] [CrossRef] [Scilit]
- Agnew, S.; Dargusch, P. Effect of Residential Solar and Storage on Centralized Electricity Supply Systems. Nat. Clim. Chang. 2015, 5, 315–318. [Google Scholar] [CrossRef] [Scilit]
- Pudjianto, D.; Strbac, G.; van Oberbeeke, F.; Androutsos, A.; Larrabe, Z.; Saraiva, J. Investigation of regulatory, commercial, economic and environmental issues in microgrids. In Proceedings of the 2005 International Conference on Future Power Systems, Amsterdam, The Netherlands, 18 November 2005. [Google Scholar]
- Awerbuch, S.; Preston, A. The Virtual Utility: Accounting, Technology & Competitive Aspects of the Emerging Industry; Springer Science & Business Media: Berlin/Heidelberg, Germany, 1997. [Google Scholar]
- Zheng, M.; Meinrenken, C.J.; Lackner, K.S. Smart Households: Dispatch Strategies and Economic Analysis of Distributed Energy Storage for Residential Peak Shaving. Appl. Energy 2015, 147, 246–257. [Google Scholar] [CrossRef] [Scilit]
- Ruiz, N.; Cobelo, I.; Oyarzabal, J. A Direct Load Control Model for Virtual Power Plant Management. IEEE Trans. Power Syst. 2009, 24, 959–966. [Google Scholar] [CrossRef] [Scilit]
- Burger, S.; Chaves-Ávila, J.P.; Batlle, C.; Pérez-Arriaga, I.J. A Review of the Value of Aggregators in Electricity Systems. Renew. Sustain. Energy Rev. 2017, 77, 395–405. [Google Scholar] [CrossRef] [Scilit]
- Ju, L.; Zhao, R.; Tan, Q.; Lu, Y.; Tan, Q.; Wang, W. A Multi-Objective Robust Scheduling Model and Solution Algorithm for a Novel Virtual Power Plant Connected with Power-to-Gas and Gas Storage Tank Considering Uncertainty and Demand Response. Appl. Energy 2019, 250, 1336–1355. [Google Scholar] [CrossRef] [Scilit]
- Vahedipour-Dahraie, M.; Najafi, H.R.; Anvari-Moghaddam, A.; Guerrero, J.M. Stochastic Security and Risk-Constrained Scheduling for an Autonomous Microgrid with Demand Response and Renewable Energy Resources. IET Renew. Power Gener. 2019, 13, 1808–1817. [Google Scholar] [CrossRef] [Scilit]
- Energy Synapse. Residential Battery Value Stacking in the NEM; Energy Networks Australia: Melbourne, Australia, 2021. [Google Scholar]
- Roberts, B.M.; Bruce, A.; MacGill, I. Opportunities and Barriers for Photovoltaics on Multi-Unit Residential Buildings: Reviewing the Australian Experience. Renew. Sustain. Energy Rev. 2019, 102, 95–110. [Google Scholar] [CrossRef] [Scilit]
- Kahlen, M.T.; Ketter, W.; van Dalen, J. Electric Vehicle Virtual Power Plant Dilemma: Grid Balancing versus Customer Mobility. Prod. Oper. Manag. 2018, 27, 2054–2069. [Google Scholar] [CrossRef] [Scilit]
- AGL Energy. AGL Virtual Power Plant: Technical Specifications; AGL Energy: Sydney, Australia, 2020. [Google Scholar]
- Huang, P.; Lovati, M.; Zhang, X.; Bales, C.; Hallbeck, S.; Becker, A.; Bergqvist, H.; Hedberg, J.; Maturi, L. Transforming a Residential Building Cluster into Electricity Prosumers in Sweden: Optimal Design of a Coupled PV-Heat Pump-Thermal Storage-Electric Vehicle System. Appl. Energy 2020, 255, 113864. [Google Scholar] [CrossRef] [Scilit]
- Schittekatte, T.; Momber, I.; Meeus, L. Future-Proof Tariff Design: Recovering Sunk Grid Costs in a World Where Consumers Are Pushing Back. Energy Econ. 2018, 70, 484–498. [Google Scholar] [CrossRef] [Scilit]
- Edis, T.; Bowyer, L. Apartment Energy Ratings: Unlocking Apartments’ Energy Efficiency Potential; Alternative Technology Association: Victoria, Australia, 2018. [Google Scholar]
- Byrnes, L.; Brown, C.; Foster, J.; Wagner, L.D. Australian Renewable Energy Policy: Barriers and Challenges. Renew. Energy 2013, 60, 711–721. [Google Scholar] [CrossRef] [Scilit]
- International Energy Agency (IEA). Batteries and Secure Energy Transitions. Available online: https://www.iea.org/reports/batteries-and-secure-energy-transitions (accessed on 2 February 2025).
- Schmidt, O.; Melchior, S.; Hawkes, A.; Staffell, I. Projecting the Future Levelized Cost of Electricity Storage Technologies. Joule 2019, 3, 81–100. [Google Scholar] [CrossRef] [Scilit]
- Bradbury, K.; Pratson, L.; Patiño-Echeverri, D. Economic Viability of Energy Storage Systems Based on Price Arbitrage Potential in Real-Time U.S. Electricity Markets. Appl. Energy 2014, 114, 512–519. [Google Scholar] [CrossRef] [Scilit]
- Zafirakis, D.; Chalvatzis, K.J.; Baiocchi, G.; Daskalakis, G. The Value of Arbitrage for Energy Storage: Evidence from European Electricity Markets. Appl. Energy 2016, 184, 971–986. [Google Scholar] [CrossRef] [Scilit]
- McConnell, D.; Hearps, P.; Eales, D.; Sandiford, M.; Dunn, R.; Wright, M.; Bateman, L. Retrospective Modeling of the Merit-Order Effect on Wholesale Electricity Prices from Distributed Photovoltaic Generation in the Australian National Electricity Market. Energy Policy 2013, 58, 17–27. [Google Scholar] [CrossRef] [Scilit]
- Krishnamurthy, D.; Uckun, C.; Zhou, Z.; Thimmapuram, P.R.; Botterud, A. Energy Storage Arbitrage under Day-Ahead and Real-Time Price Uncertainty. IEEE Trans. Power Syst. 2018, 33, 84–93. [Google Scholar] [CrossRef] [Scilit]
- Luo, X.; Wang, J.; Dooner, M.; Clarke, J. Overview of Current Development in Electrical Energy Storage Technologies and the Application Potential in Power System Operation. Appl. Energy 2015, 137, 511–536. [Google Scholar] [CrossRef] [Scilit]
- Ziegler, M.S.; Mueller, J.M.; Pereira, G.D.; Song, J.; Ferrara, M.; Chiang, Y.-M.; Trancik, J.E. Storage Requirements and Costs of Shaping Renewable Energy toward Grid Decarbonization. Joule 2019, 3, 2134–2153. [Google Scholar] [CrossRef] [Scilit]
- Naumann, M.; Karl, R.C.; Truong, C.N.; Jossen, A.; Hesse, H.C. Lithium-Ion Battery Cost Analysis in PV-Household Application. Proc. Energy Procedia 2015, 73, 37–47. [Google Scholar] [CrossRef] [Scilit]
- Xu, B.; Oudalov, A.; Ulbig, A.; Andersson, G.; Kirschen, D.S. Modeling of Lithium-Ion Battery Degradation for Cell Life Assessment. IEEE Trans. Smart Grid 2018, 9, 1131–1140. [Google Scholar] [CrossRef] [Scilit]
- Schimpe, M.; Naumann, M.; Truong, N.; Hesse, H.C.; Santhanagopalan, S.; Saxon, A.; Jossen, A. Energy Efficiency Evaluation of a Stationary Lithium-Ion Battery Container Storage System via Electro-Thermal Modeling and Detailed Component Analysis. Appl. Energy 2018, 210, 211–229. [Google Scholar] [CrossRef] [Scilit]
- Hanna, R.; Ghoniem, A.F.; Kleissl, J.; Tynan, G.; Victor, D.G. Evaluating Business Models for Microgrids: Interactions of Technology and Policy. Energy Policy 2017, 103, 47–61. [Google Scholar] [CrossRef] [Scilit]
- Hartvigsson, E.; Odenberger, M.; Chen, P.; Nyholm, E. Estimating national and local low-voltage grid capacity for residential solar photovoltaic in Sweden, UK and Germany. Renew. Energy 2021, 171, 915–926. [Google Scholar] [CrossRef] [Scilit]
- California Public Utilities Commission. Decision Adopting Self-Generation Incentive Program Refinements; California Public Utilities Commission: San Francisco, CA, USA, 2022.
- Shapley, L.S. A Value for N-Person Games. In Contributions to the Theory of Games; Princeton University Press: Princeton, NJ, USA, 1953; Volume 2, pp. 307–317. [Google Scholar]
- Roth, A.E. (Ed.) The Shapley Value: Essays in Honor of Lloyd S. Shapley; Cambridge University Press: Cambridge, UK, 1988. [Google Scholar]
- Wu, J.; Guan, X. Coordinated Multi-Microgrids Optimal Control Algorithm for Smart Distribution Management System. IEEE Trans. Smart Grid 2018, 4, 2174–2181. [Google Scholar] [CrossRef] [Scilit]
- Bahrami, S.; Amini, M.H. A Decentralized Trading Algorithm for an Electricity Market with Generation Uncertainty. Appl. Energy 2018, 218, 520–532. [Google Scholar] [CrossRef] [Scilit]
- Liu, N.; Yu, X.; Wang, C.; Wang, J. Energy Sharing Management for Microgrids with PV Prosumers: A Stackelberg Game Approach. IEEE Trans. Ind. Inform. 2017, 13, 1088–1098. [Google Scholar] [CrossRef] [Scilit]
- Moret, F.; Pinson, P. Energy Collectives: A Community and Fairness Based Approach to Future Electricity Markets. IEEE Trans. Power Syst. 2019, 34, 3994–4004. [Google Scholar] [CrossRef] [Scilit]
- Kang, J.; Yu, R.; Huang, X.; Maharjan, S.; Zhang, Y.; Hossain, E. Enabling Localized Peer-to-Peer Electricity Trading among Plug-in Hybrid Electric Vehicles Using Consortium Blockchains. IEEE Trans. Ind. Inform. 2017, 13, 3154–3164. [Google Scholar] [CrossRef] [Scilit]
- Sousa, T.; Soares, T.; Pinson, P.; Moret, F.; Baroche, T.; Sorin, E. Peer-to-Peer and Community-Based Markets: A Comprehensive Review. Renew. Sustain. Energy Rev. 2019, 104, 367–378. [Google Scholar] [CrossRef] [Scilit]
- Van Cutsem, O.; Ho Dac, D.; Boudou, P.; Kayal, M. Cooperative energy management of a community of smart-buildings: A Blockchain approach. Int. J. Electr. Power Energy Syst. 2020, 117, 105643. [Google Scholar] [CrossRef] [Scilit]
- Marzband, M.; Fouladfar, M.H.; Akorede, M.F.; Lightbody, G.; Pouresmaeil, E. Framework for Smart Transactive Energy in Home-Microgrids Considering Coalition Formation and Demand Side Management. Sustain. Cities Soc. 2018, 40, 136–154. [Google Scholar] [CrossRef] [Scilit]
- Schmeidler, D. The Nucleolus of a Characteristic Function Game. SIAM J. Appl. Math. 1969, 17, 1163–1170. [Google Scholar] [CrossRef] [Scilit]
- Baeyens, E.; Bitar, E.Y.; Khargonekar, P.P.; Poolla, K. Coalitional Aggregation of Wind Power. IEEE Trans. Power Syst. 2013, 28, 3774–3784. [Google Scholar] [CrossRef] [Scilit]
- Australian Energy Market Operator. Renewable Integration Study: Stage 1 Report; Australian Energy Market Operator: Melbourne, Australia, 2021. [Google Scholar]
- Wood, T.; Dundas, G.; Percival, L. Flame Out: The Future of Natural Gas; Grattan Institute: Carlton, Australia, 2020. [Google Scholar]
- Essential Services Commission Victoria. Victorian Default Offer: Consultation Paper; Essential Services Commission Victoria: Melbourne, Australia, 2019.
- Essential Services Commission Victoria. Energy Prices Report 2024; Essential Services Commission Victoria: Melbourne, Australia, 2024.
- Solar Victoria. Solar Homes Program Guidelines; Solar Victoria: Melbourne, Australia, 2024. [Google Scholar]
- Solar Victoria. Solar Battery Program: Eligibility Criteria; Solar Victoria: Melbourne, Australia, 2024. [Google Scholar]
- Clean Energy Regulator. Small-Scale Technology Certificates; Clean Energy Regulator: Canberra, Australia, 2024. [Google Scholar]
- Akimov, A.; Inchauspe, J.; Mouritz, M.; Silva, A. Are Australian regulatory and policy frameworks ready for a distributed-energy-resources-led energy transition? Aust. J. Public Adm. 2023, 82, 529–556. [Google Scholar] [CrossRef] [Scilit]
- Simshauser, P. Monopoly Regulation, Discontinuity & Stranded Assets. Energy Econ. 2017, 66, 384–398. [Google Scholar] [CrossRef] [Scilit]
- Department of Energy, Environment and Climate Action Victoria. New Energy Jobs Plan: Regulatory Reforms; Department of Energy, Environment and Climate Action Victoria: Melbourne, Australia, 2024.
- Australian Bureau of Statistics. Regional Population by Age and Sex. 2023. Available online: https://www.abs.gov.au/statistics/people/population/regional-population-age-and-sex/2023 (accessed on 2 February 2026).
- Bureau of Meteorology. Solar Exposure Data: Aspendale Station. 2024. Available online: https://www.bom.gov.au/climate/austmaps/about-solar-maps.shtml (accessed on 30 June 2025).
- Department of Industry, Science, Energy and Resources. Residential Baseline Study; Department of Industry, Science, Energy and Resources: Canberra, Australia, 2021.
- Jordan, D.C.; Kurtz, S.R. Photovoltaic Degradation Rates—An Analytical Review. Prog. Photovolt. Res. Appl. 2013, 21, 12–29. [Google Scholar] [CrossRef] [Scilit]
- Palizban, O.; Kauhaniemi, K. Energy Storage Systems in Modern Grids—Matrix of Technologies and Applications. J. Energy Storage 2016, 6, 248–259. [Google Scholar] [CrossRef] [Scilit]
- Ecker, M.; Nieto, N.; Käbitz, S.; Schmalstieg, J.; Blanke, H.; Warnecke, A.; Sauer, D.U. Calendar and Cycle Life Study of Li(NiMnCo)O2-Based 18650 Lithium-Ion Batteries. J. Power Sources 2014, 248, 839–851. [Google Scholar] [CrossRef] [Scilit]
- Australian Energy Market Commission. 2023 Residential Electricity Price Trends Report; Australian Energy Market Commission: Sydney, Australia, 2023.
- Graham, P.; Hayward, J.; Foster, J.; Havas, L. GenCost 2022–23; CSIRO: Canberra, Australia, 2023. [Google Scholar]
- Long, C.; Zhou, Y.; Wu, J. A game theoretic approach for peer to peer energy trading. Energy Procedia 2019, 159, 454–459. [Google Scholar] [CrossRef] [Scilit]
- Chakraborty, S.; Ito, T.; Senjyu, T.; Saber, A.Y. Intelligent Economic Operation of Smart-Grid Facilitating Fuzzy Advanced Quantum Evolutionary Method. IEEE Trans. Sustain. Energy 2013, 4, 905–916. [Google Scholar] [CrossRef] [Scilit]
- Strata Community Association. National Strata Legislation Guide; Strata Community Association: Sydney, Australia, 2020. [Google Scholar]
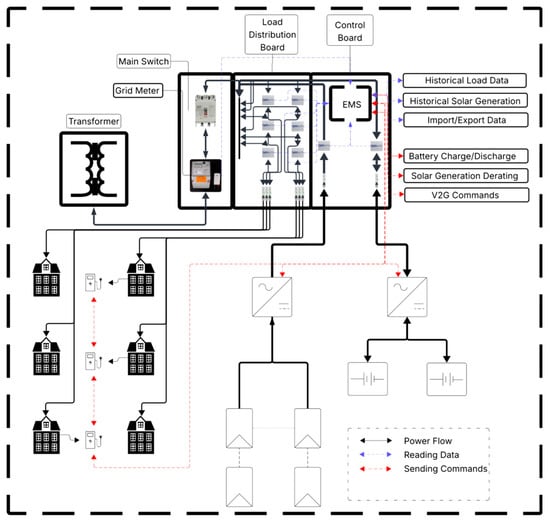
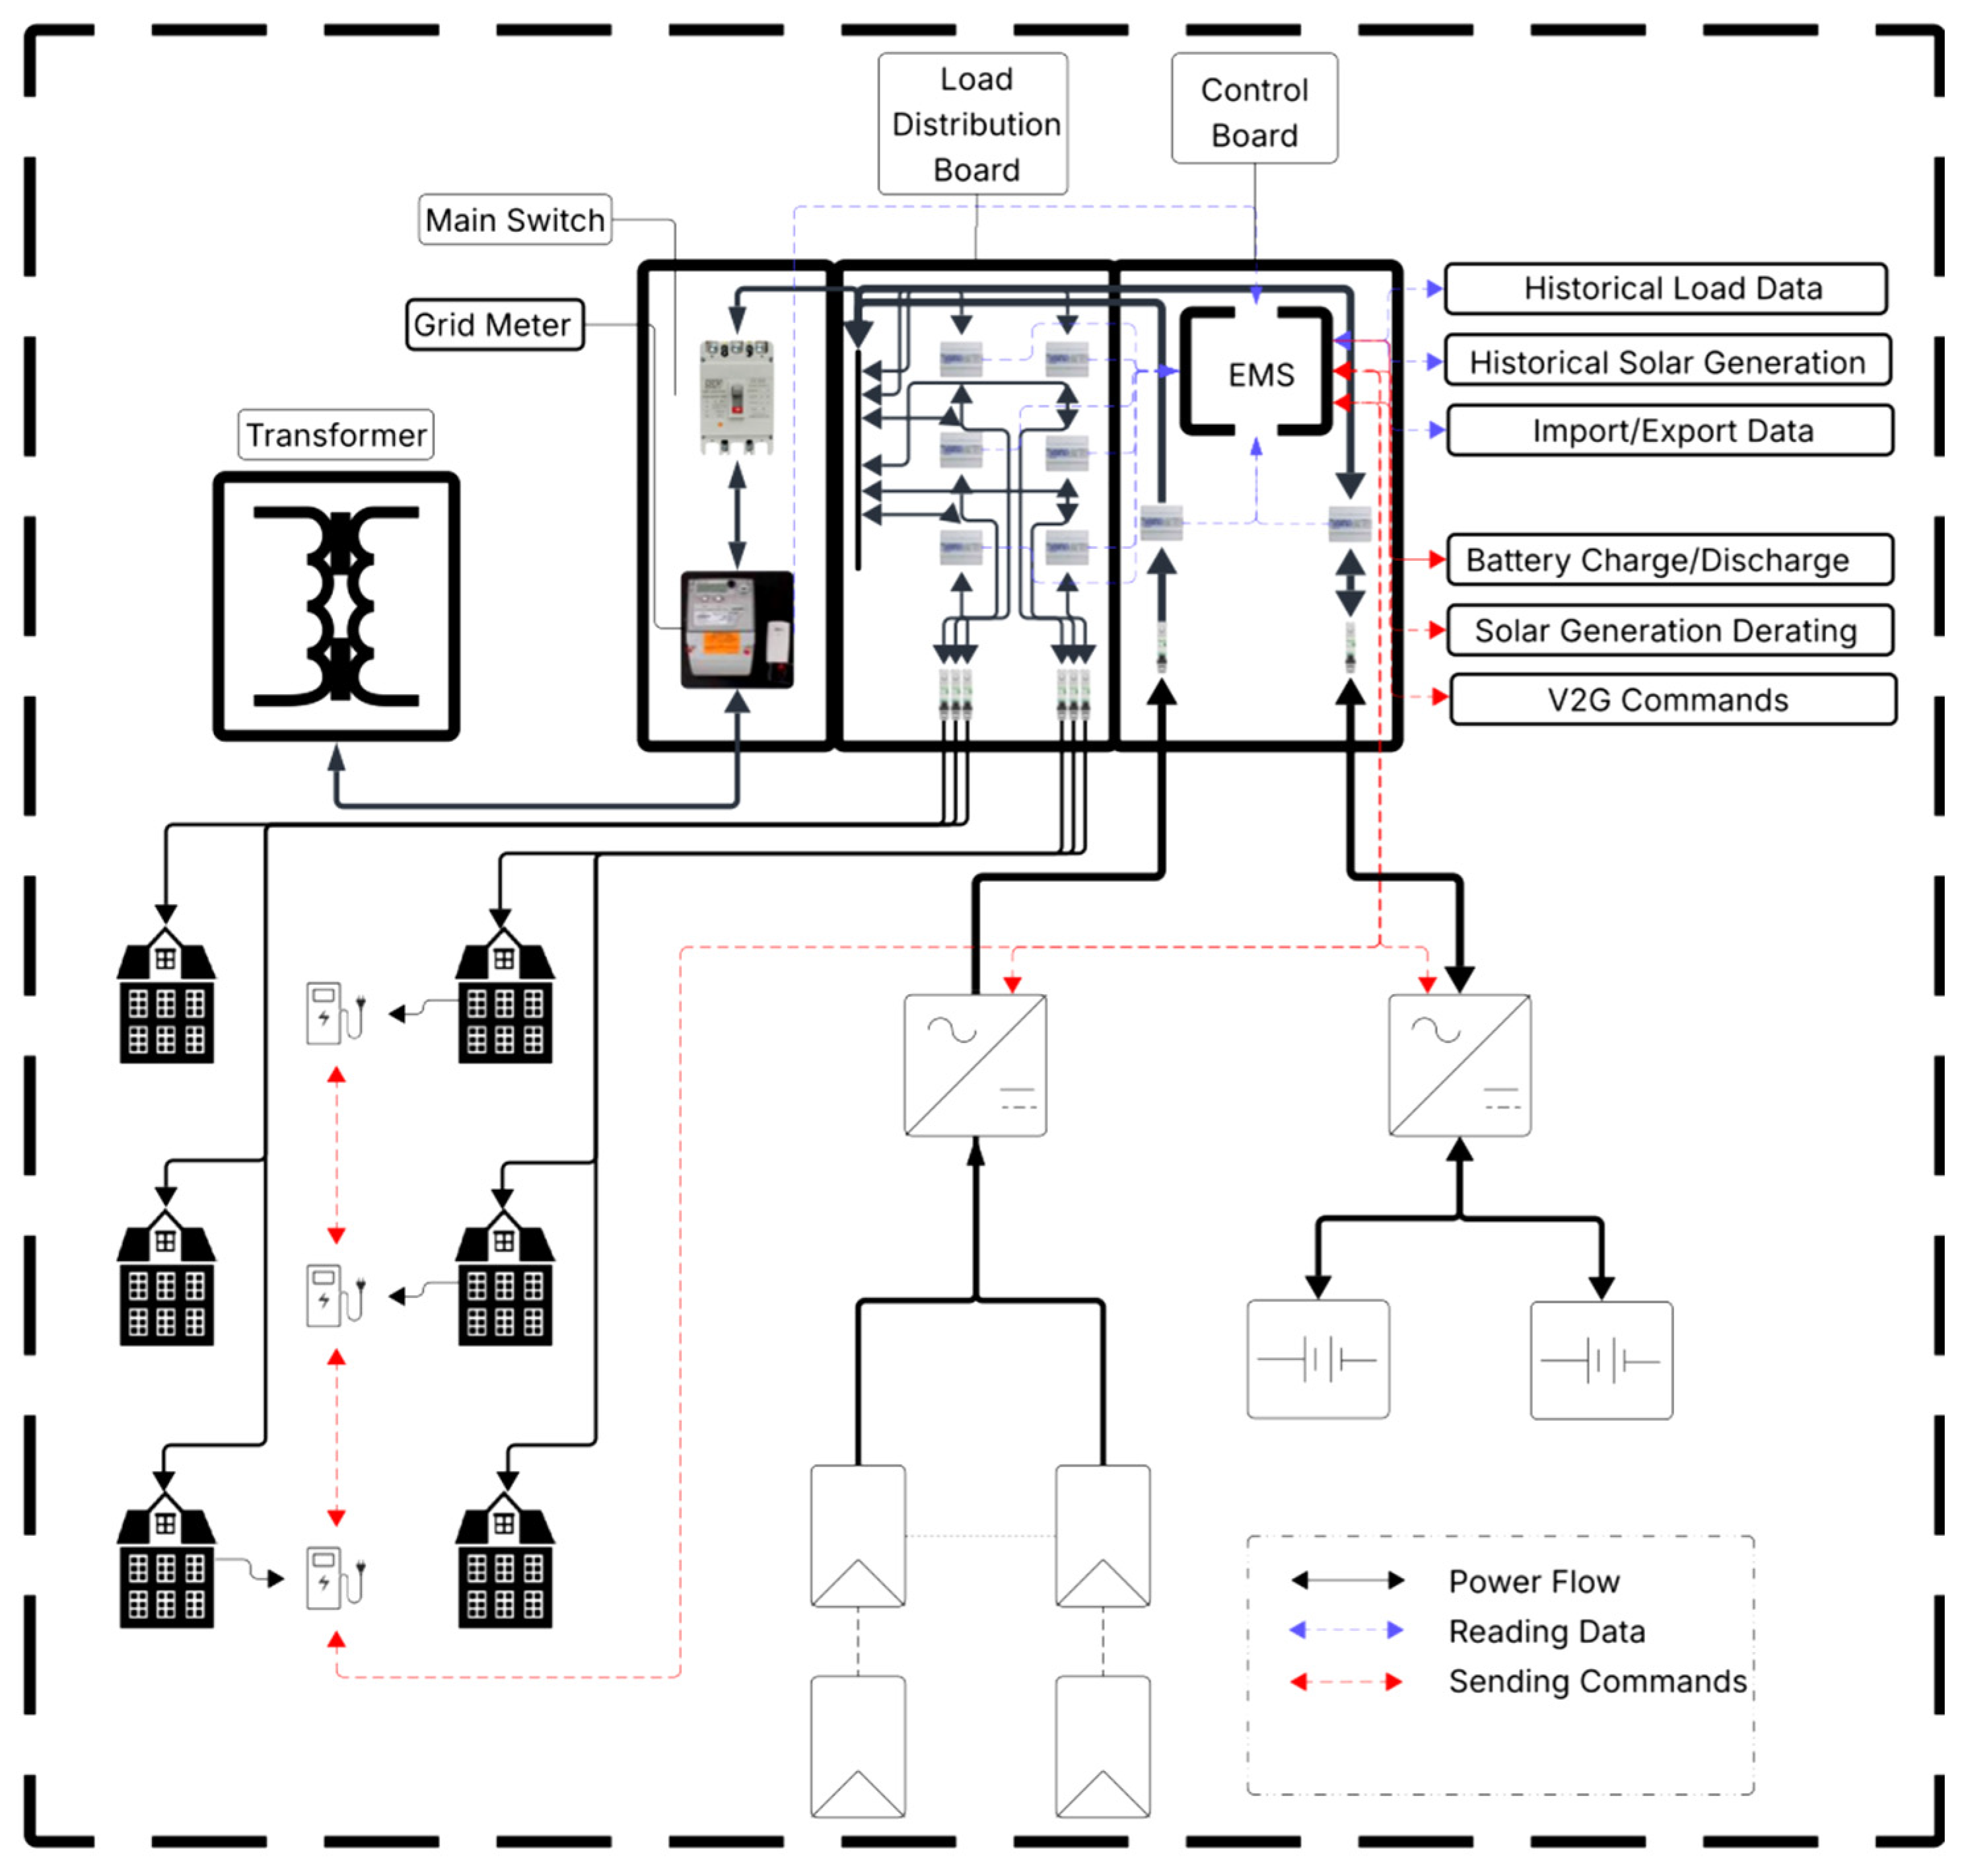
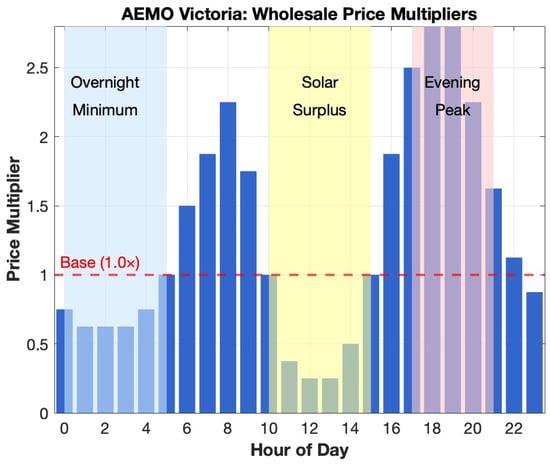
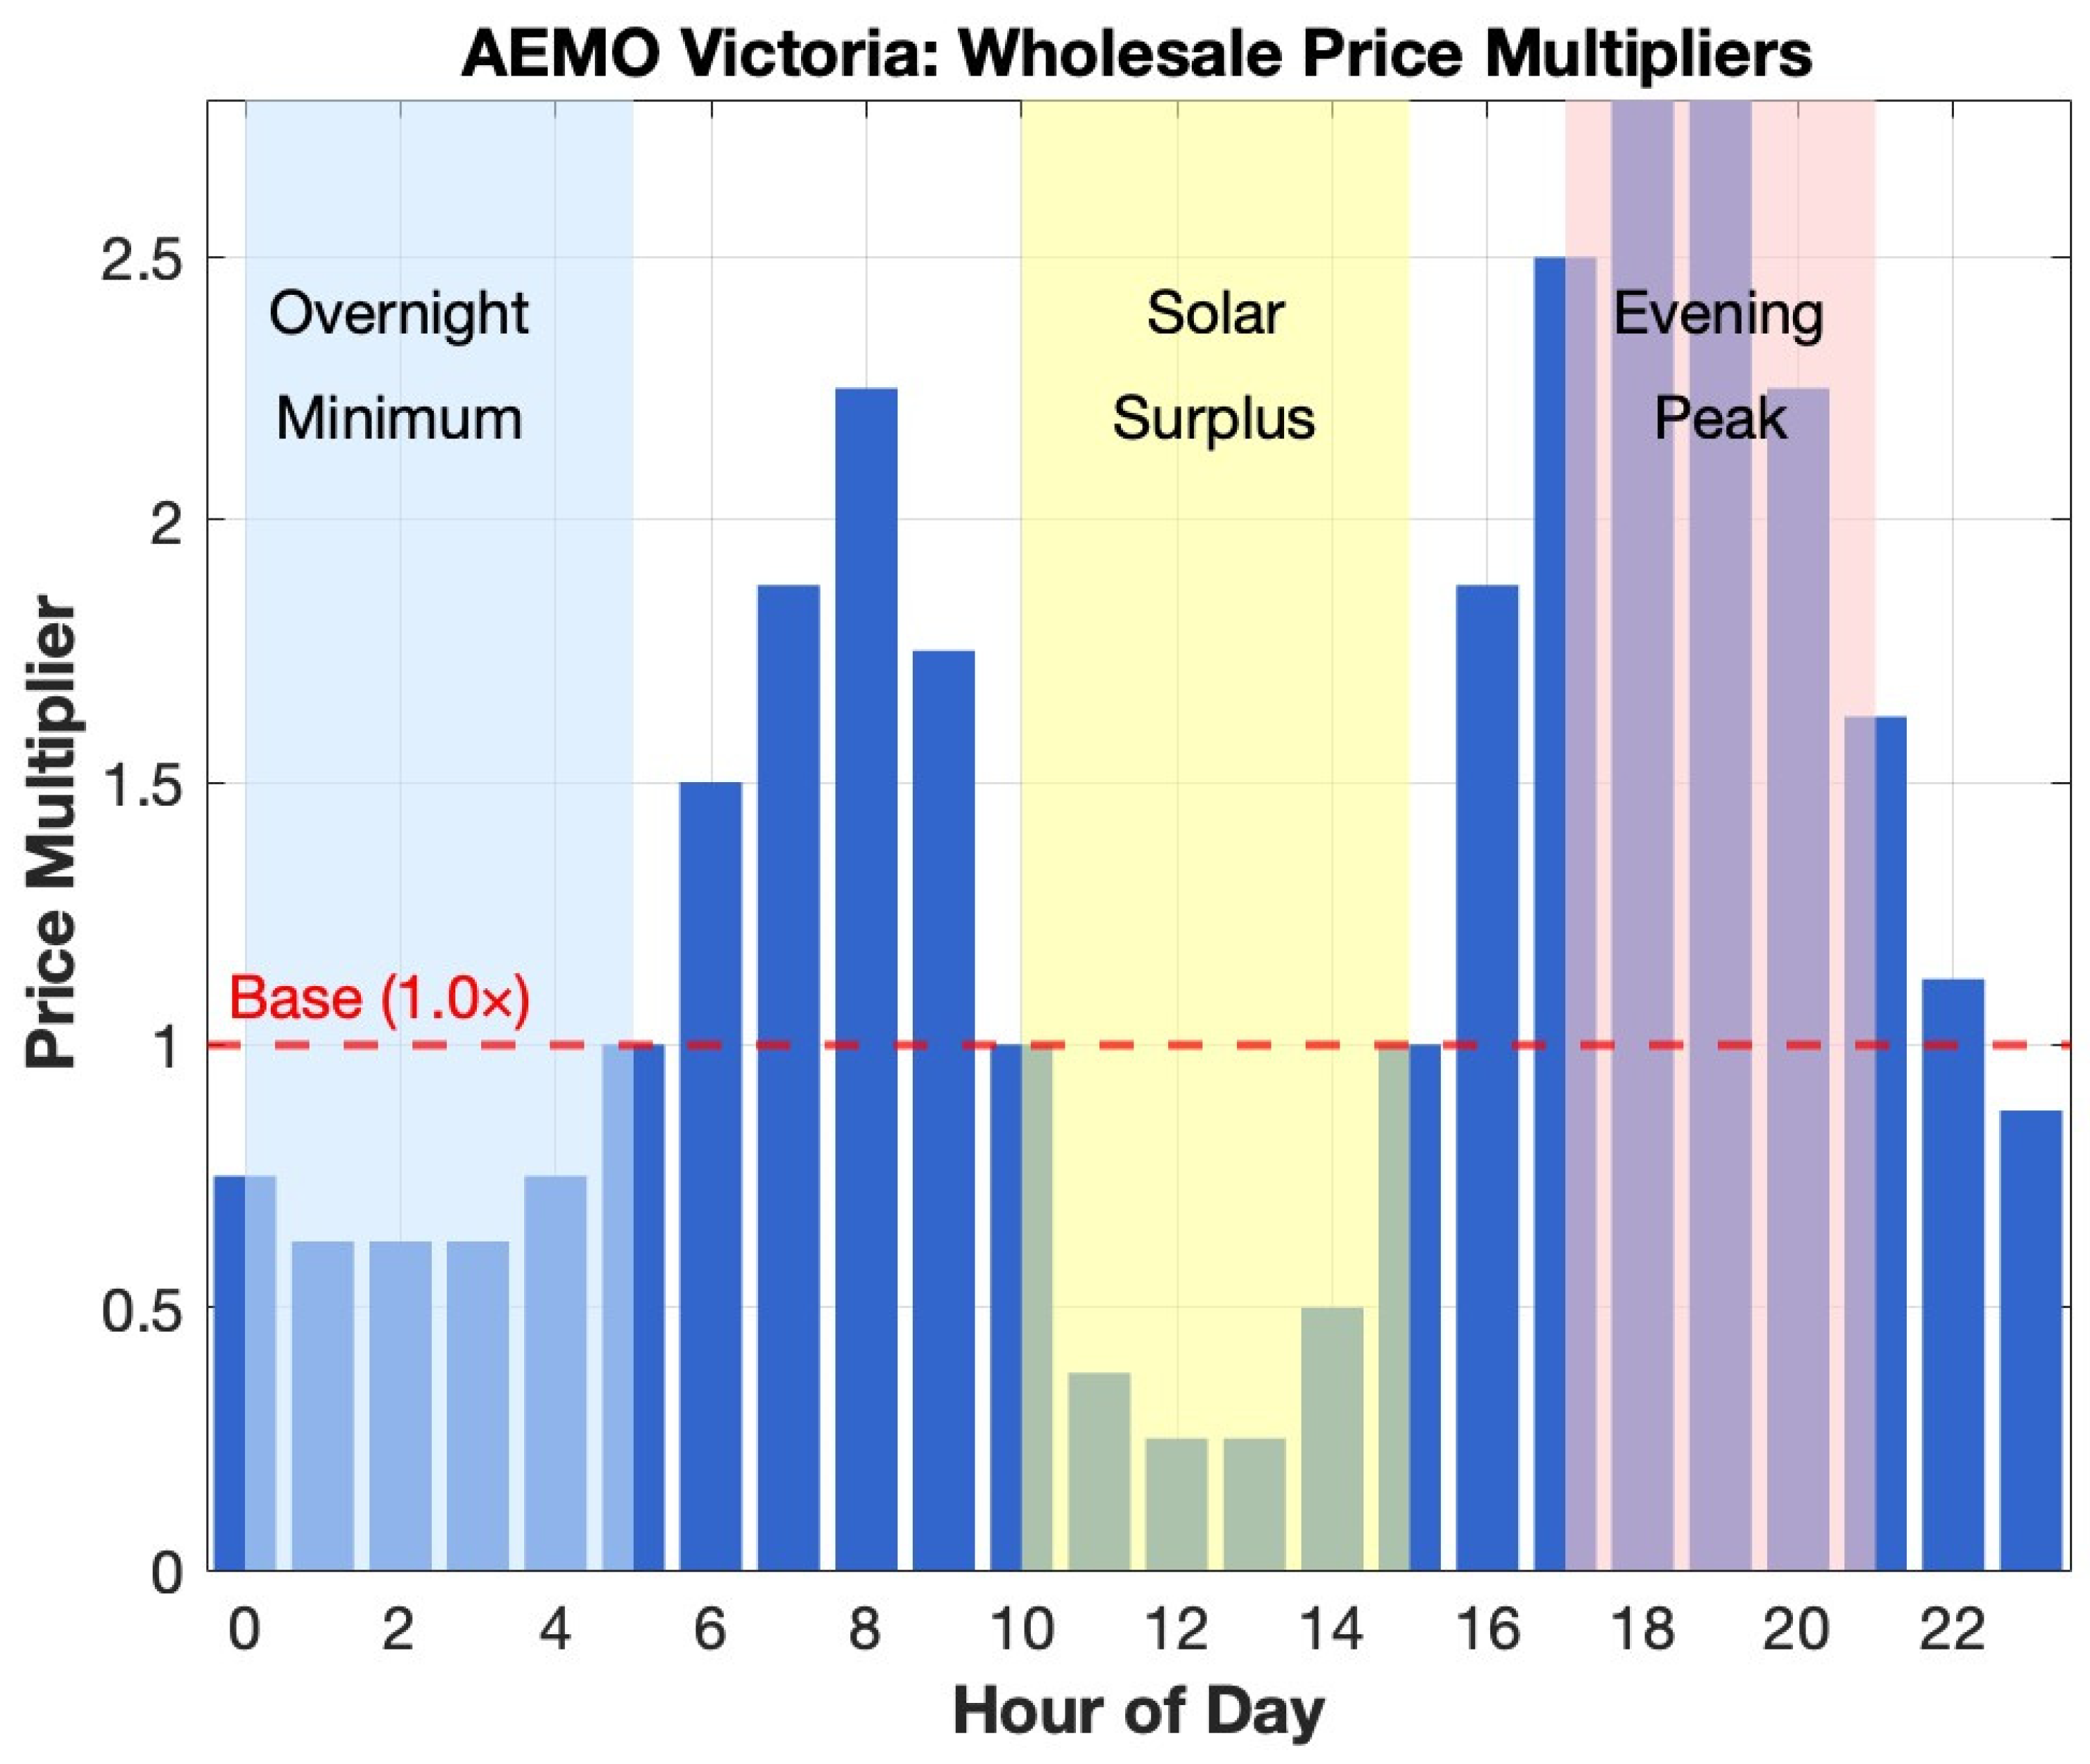
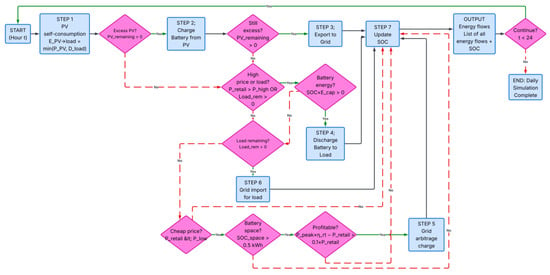
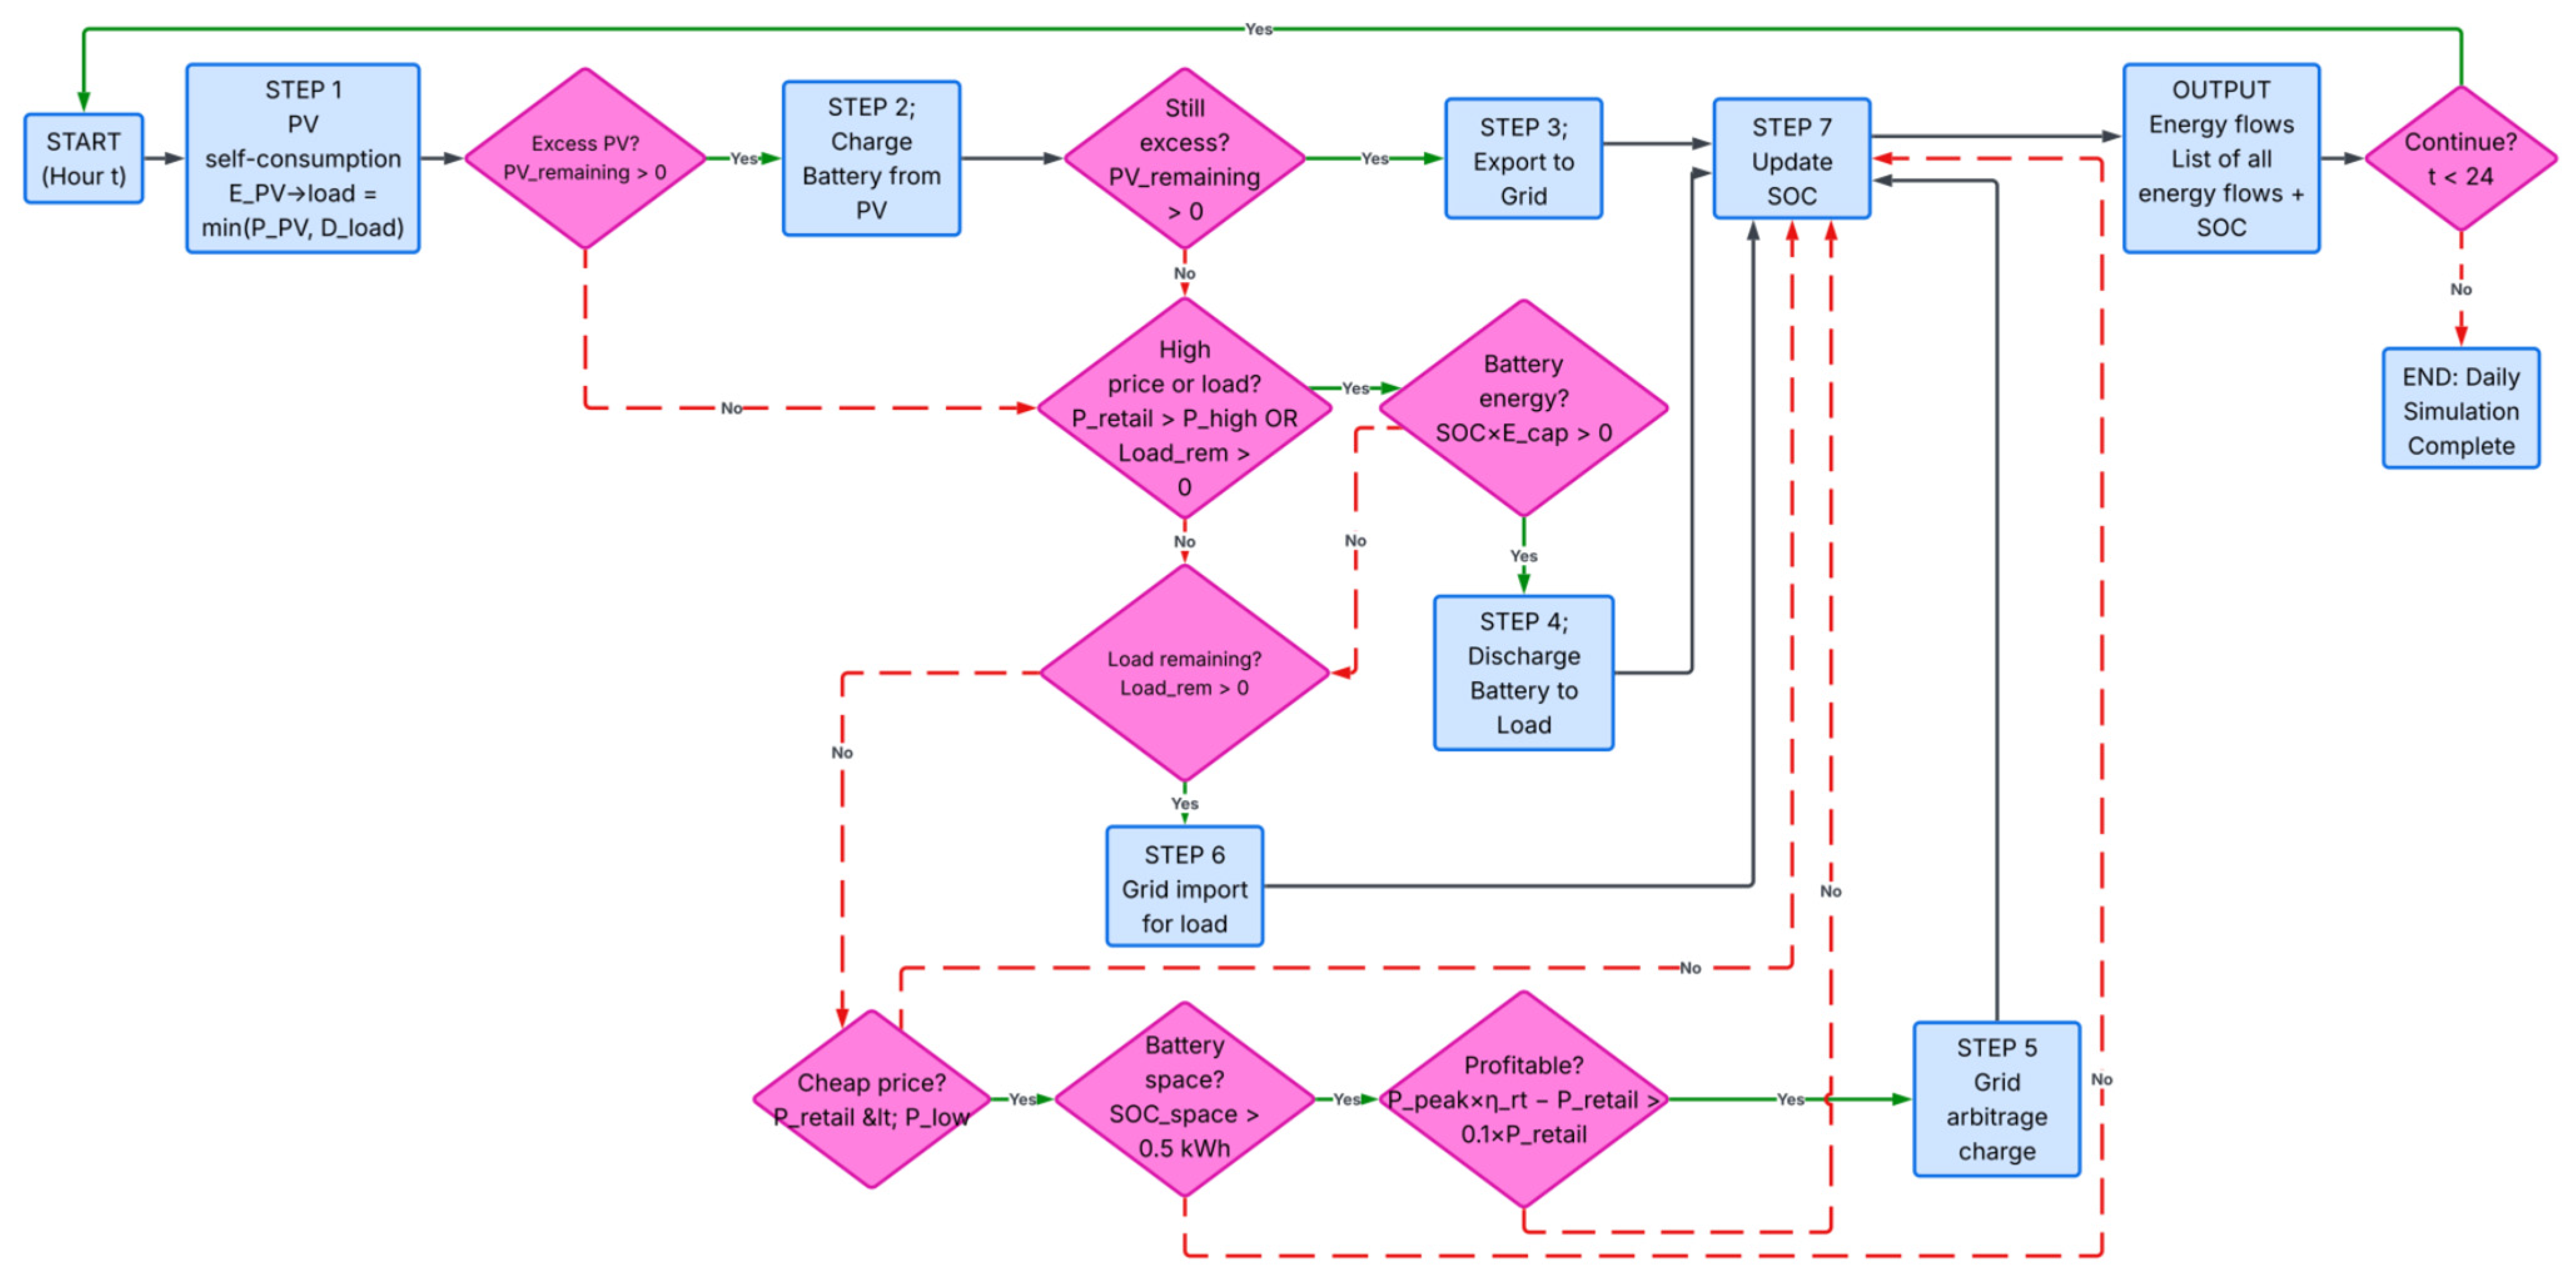
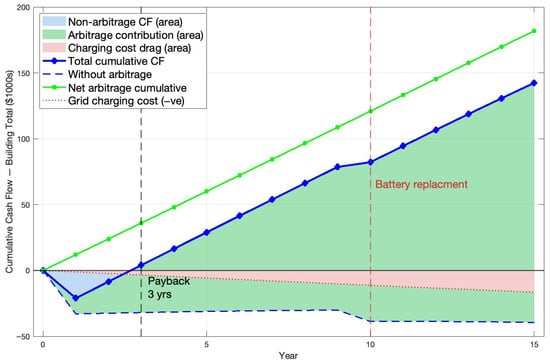
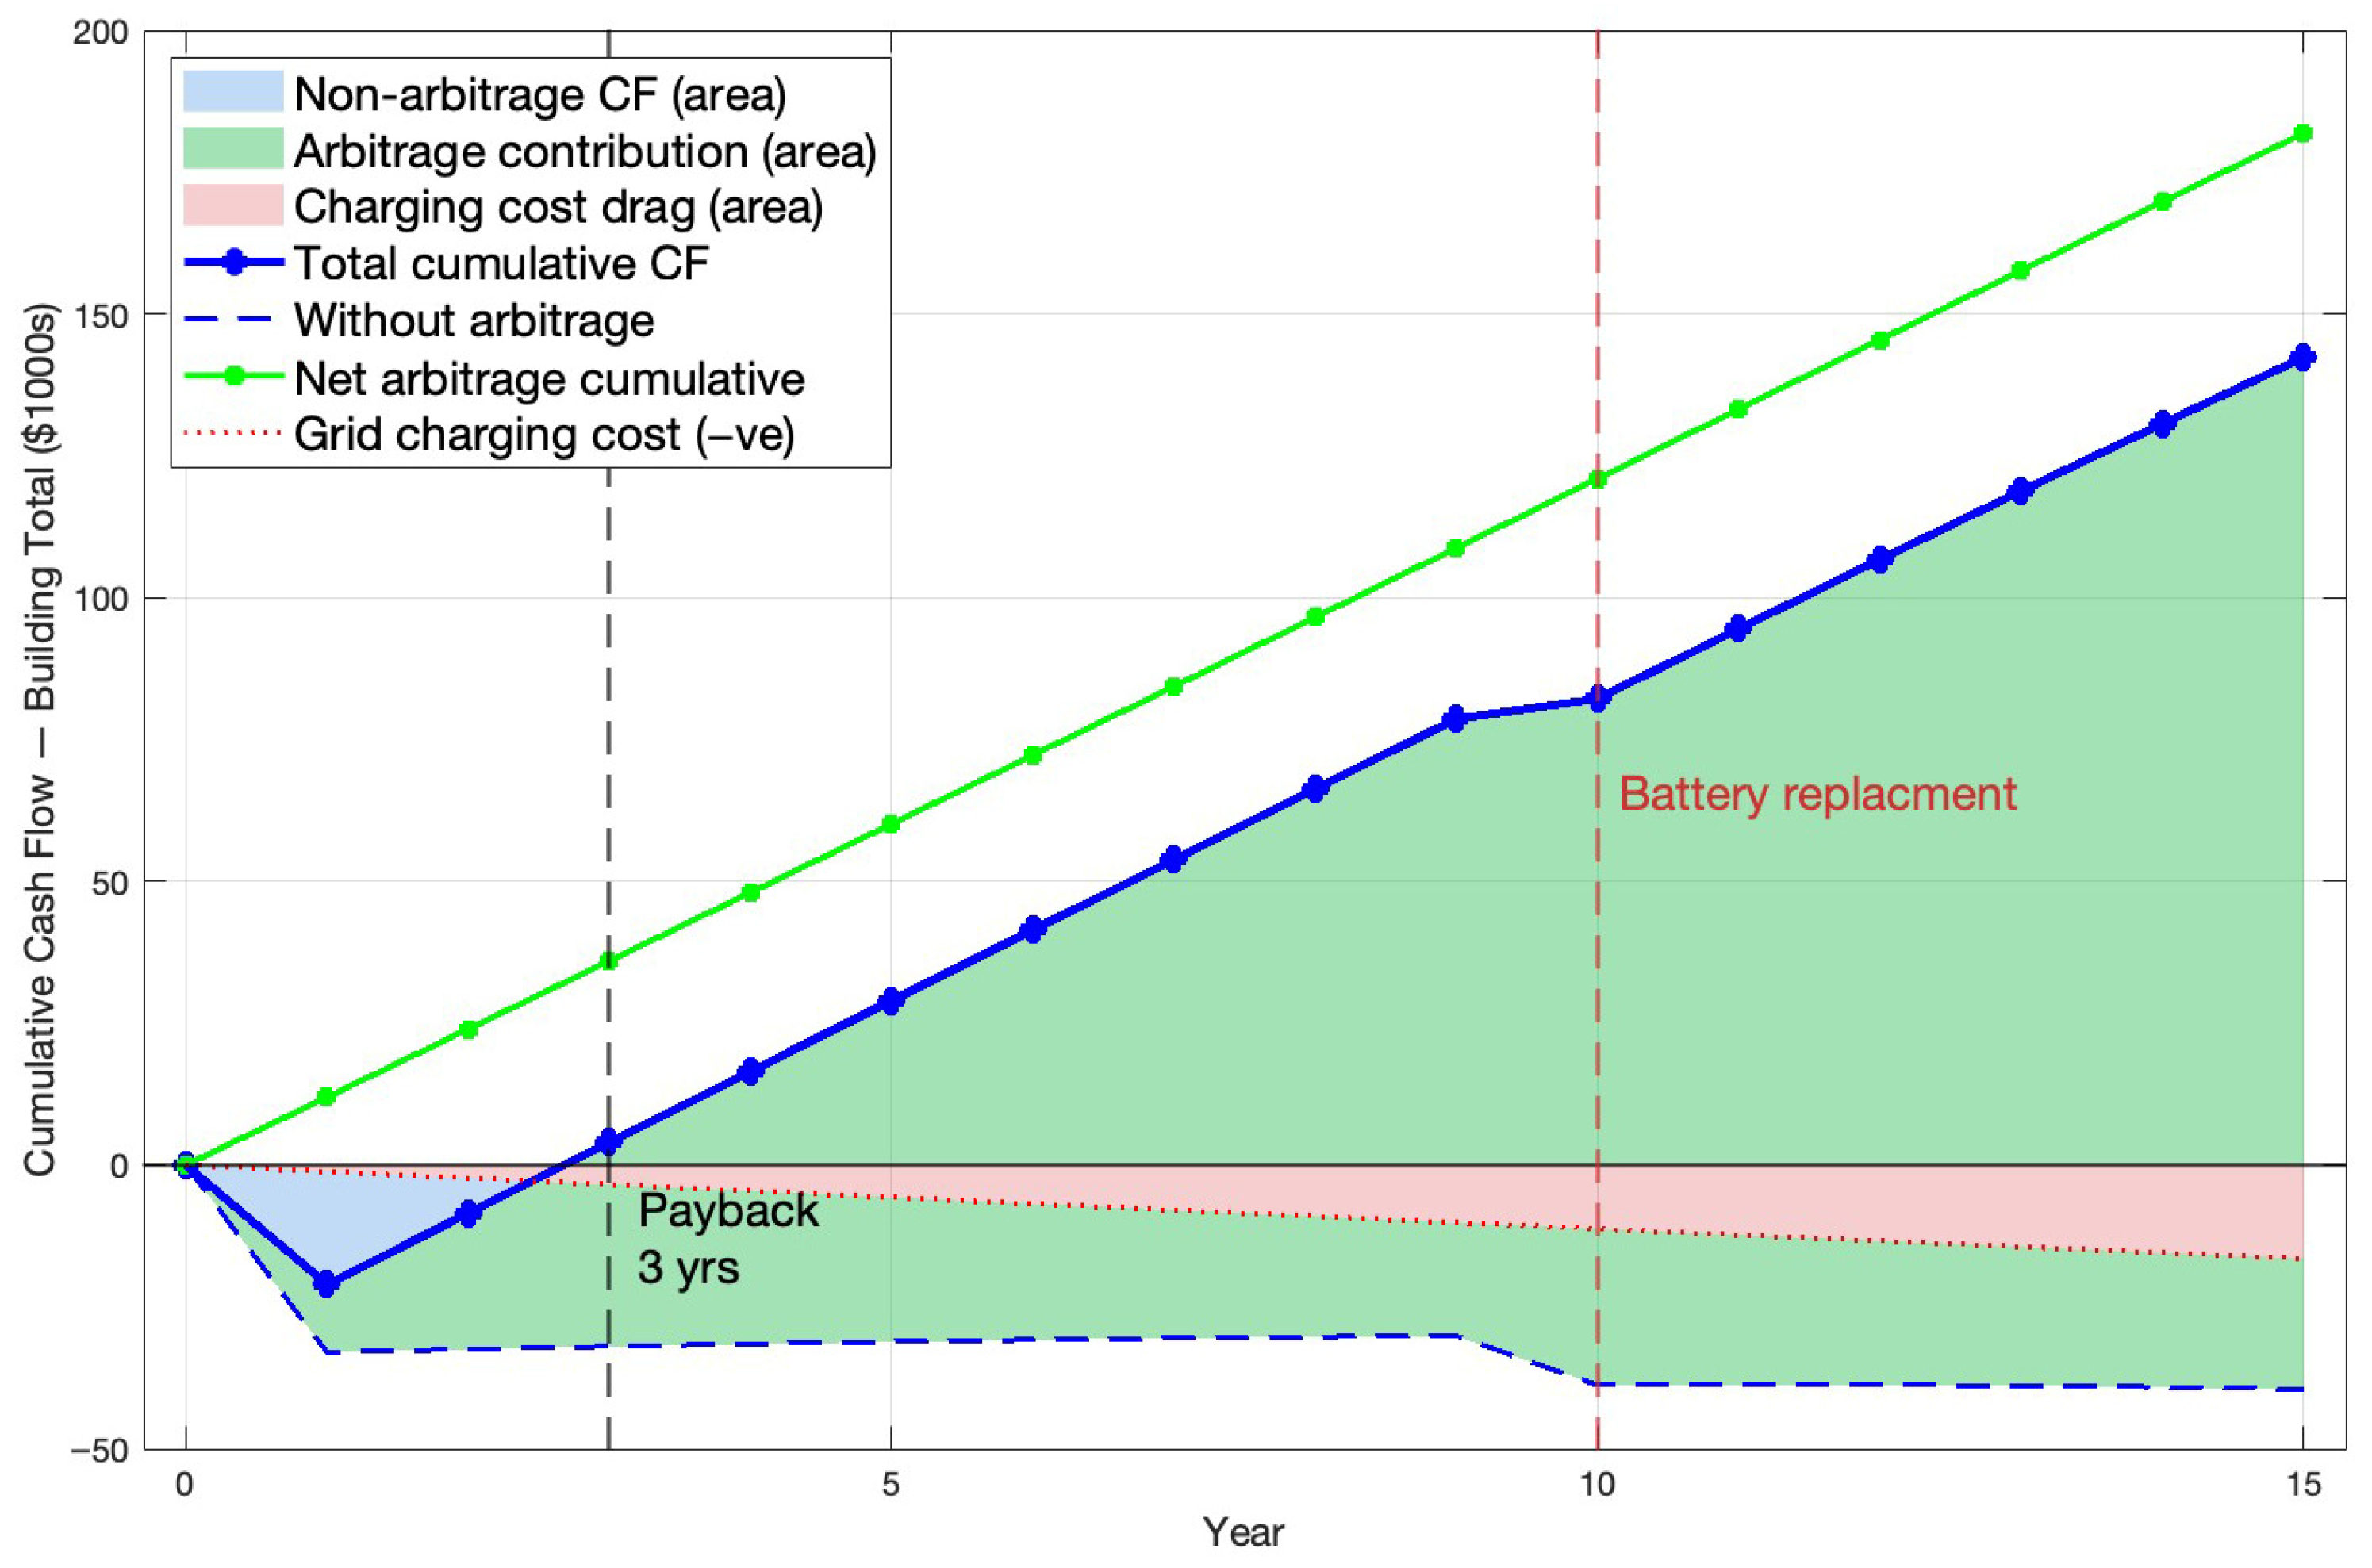
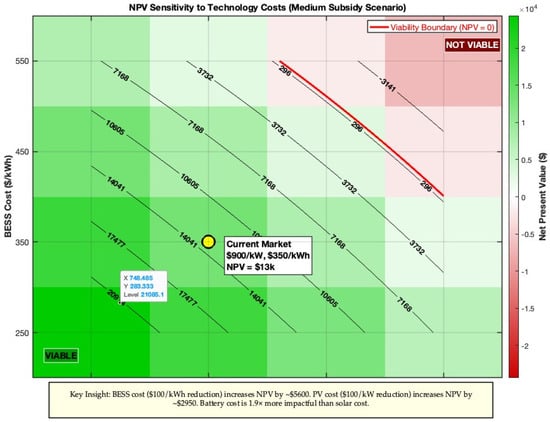
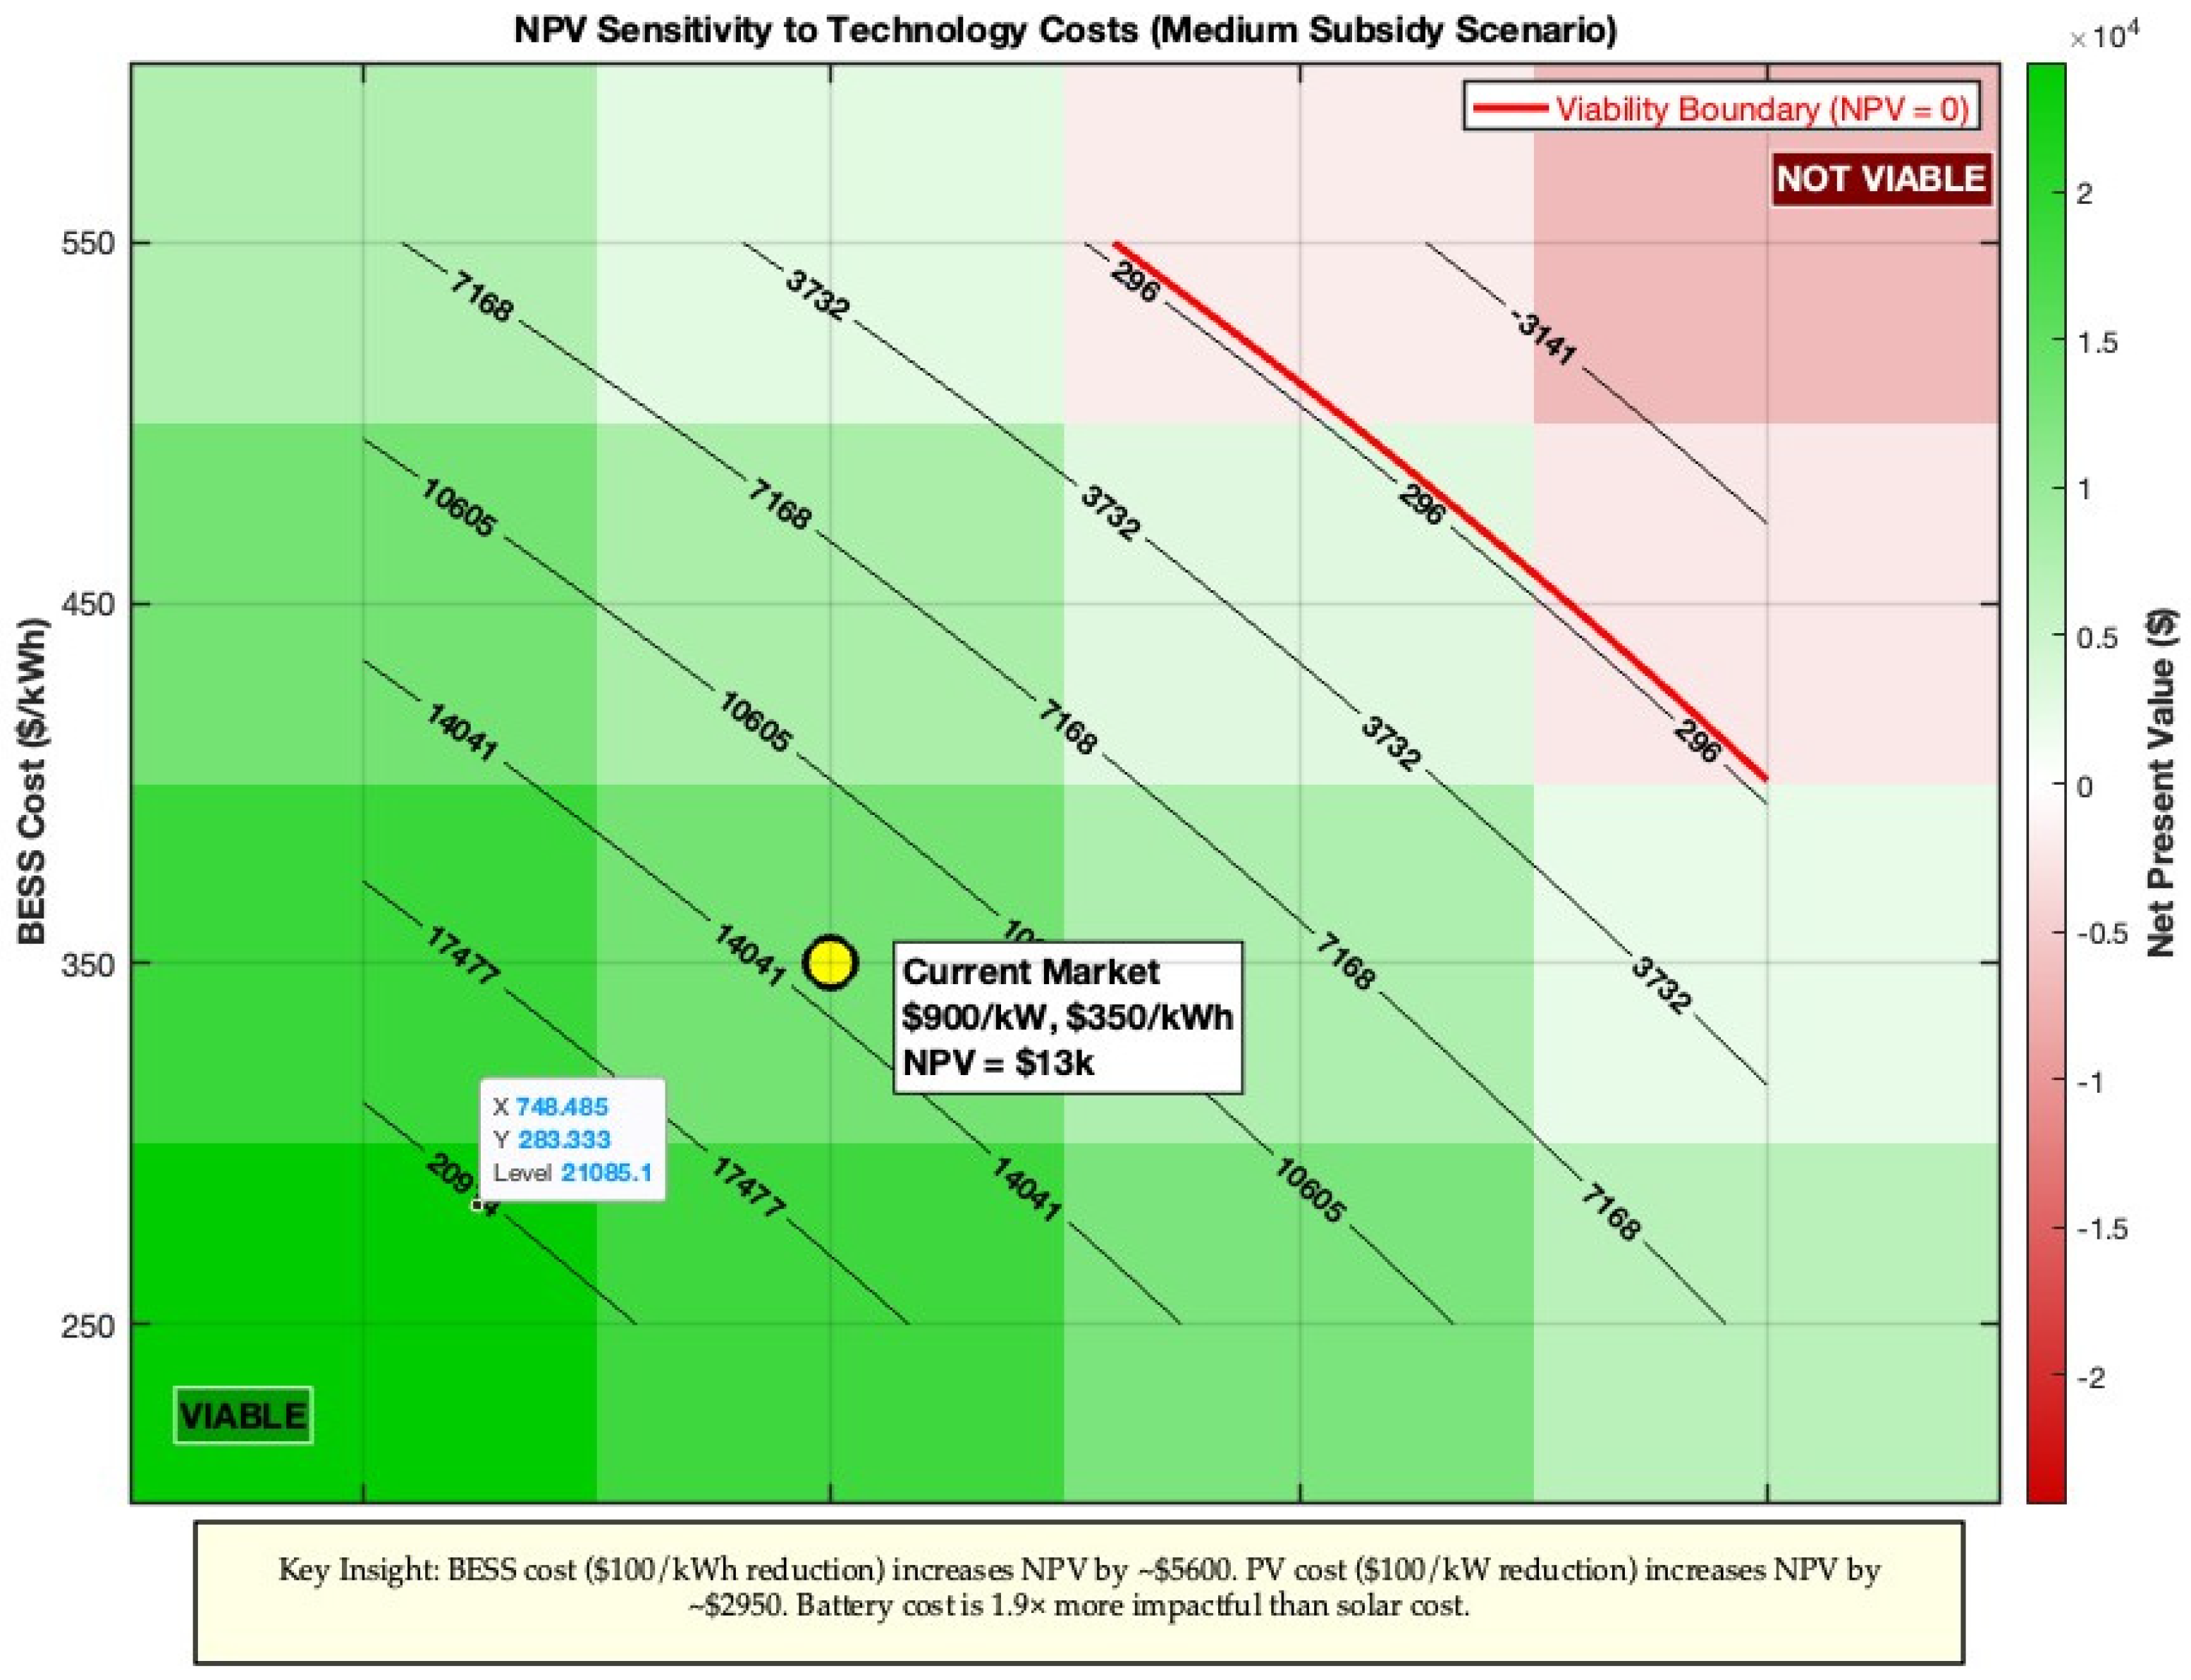
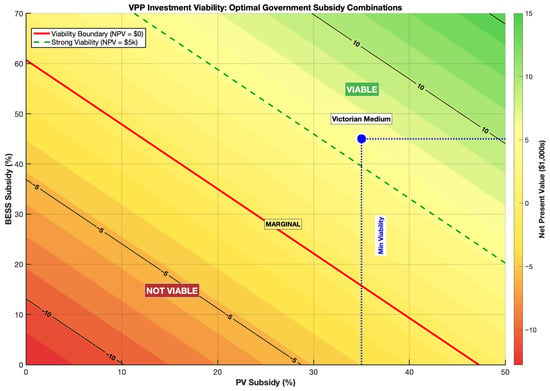
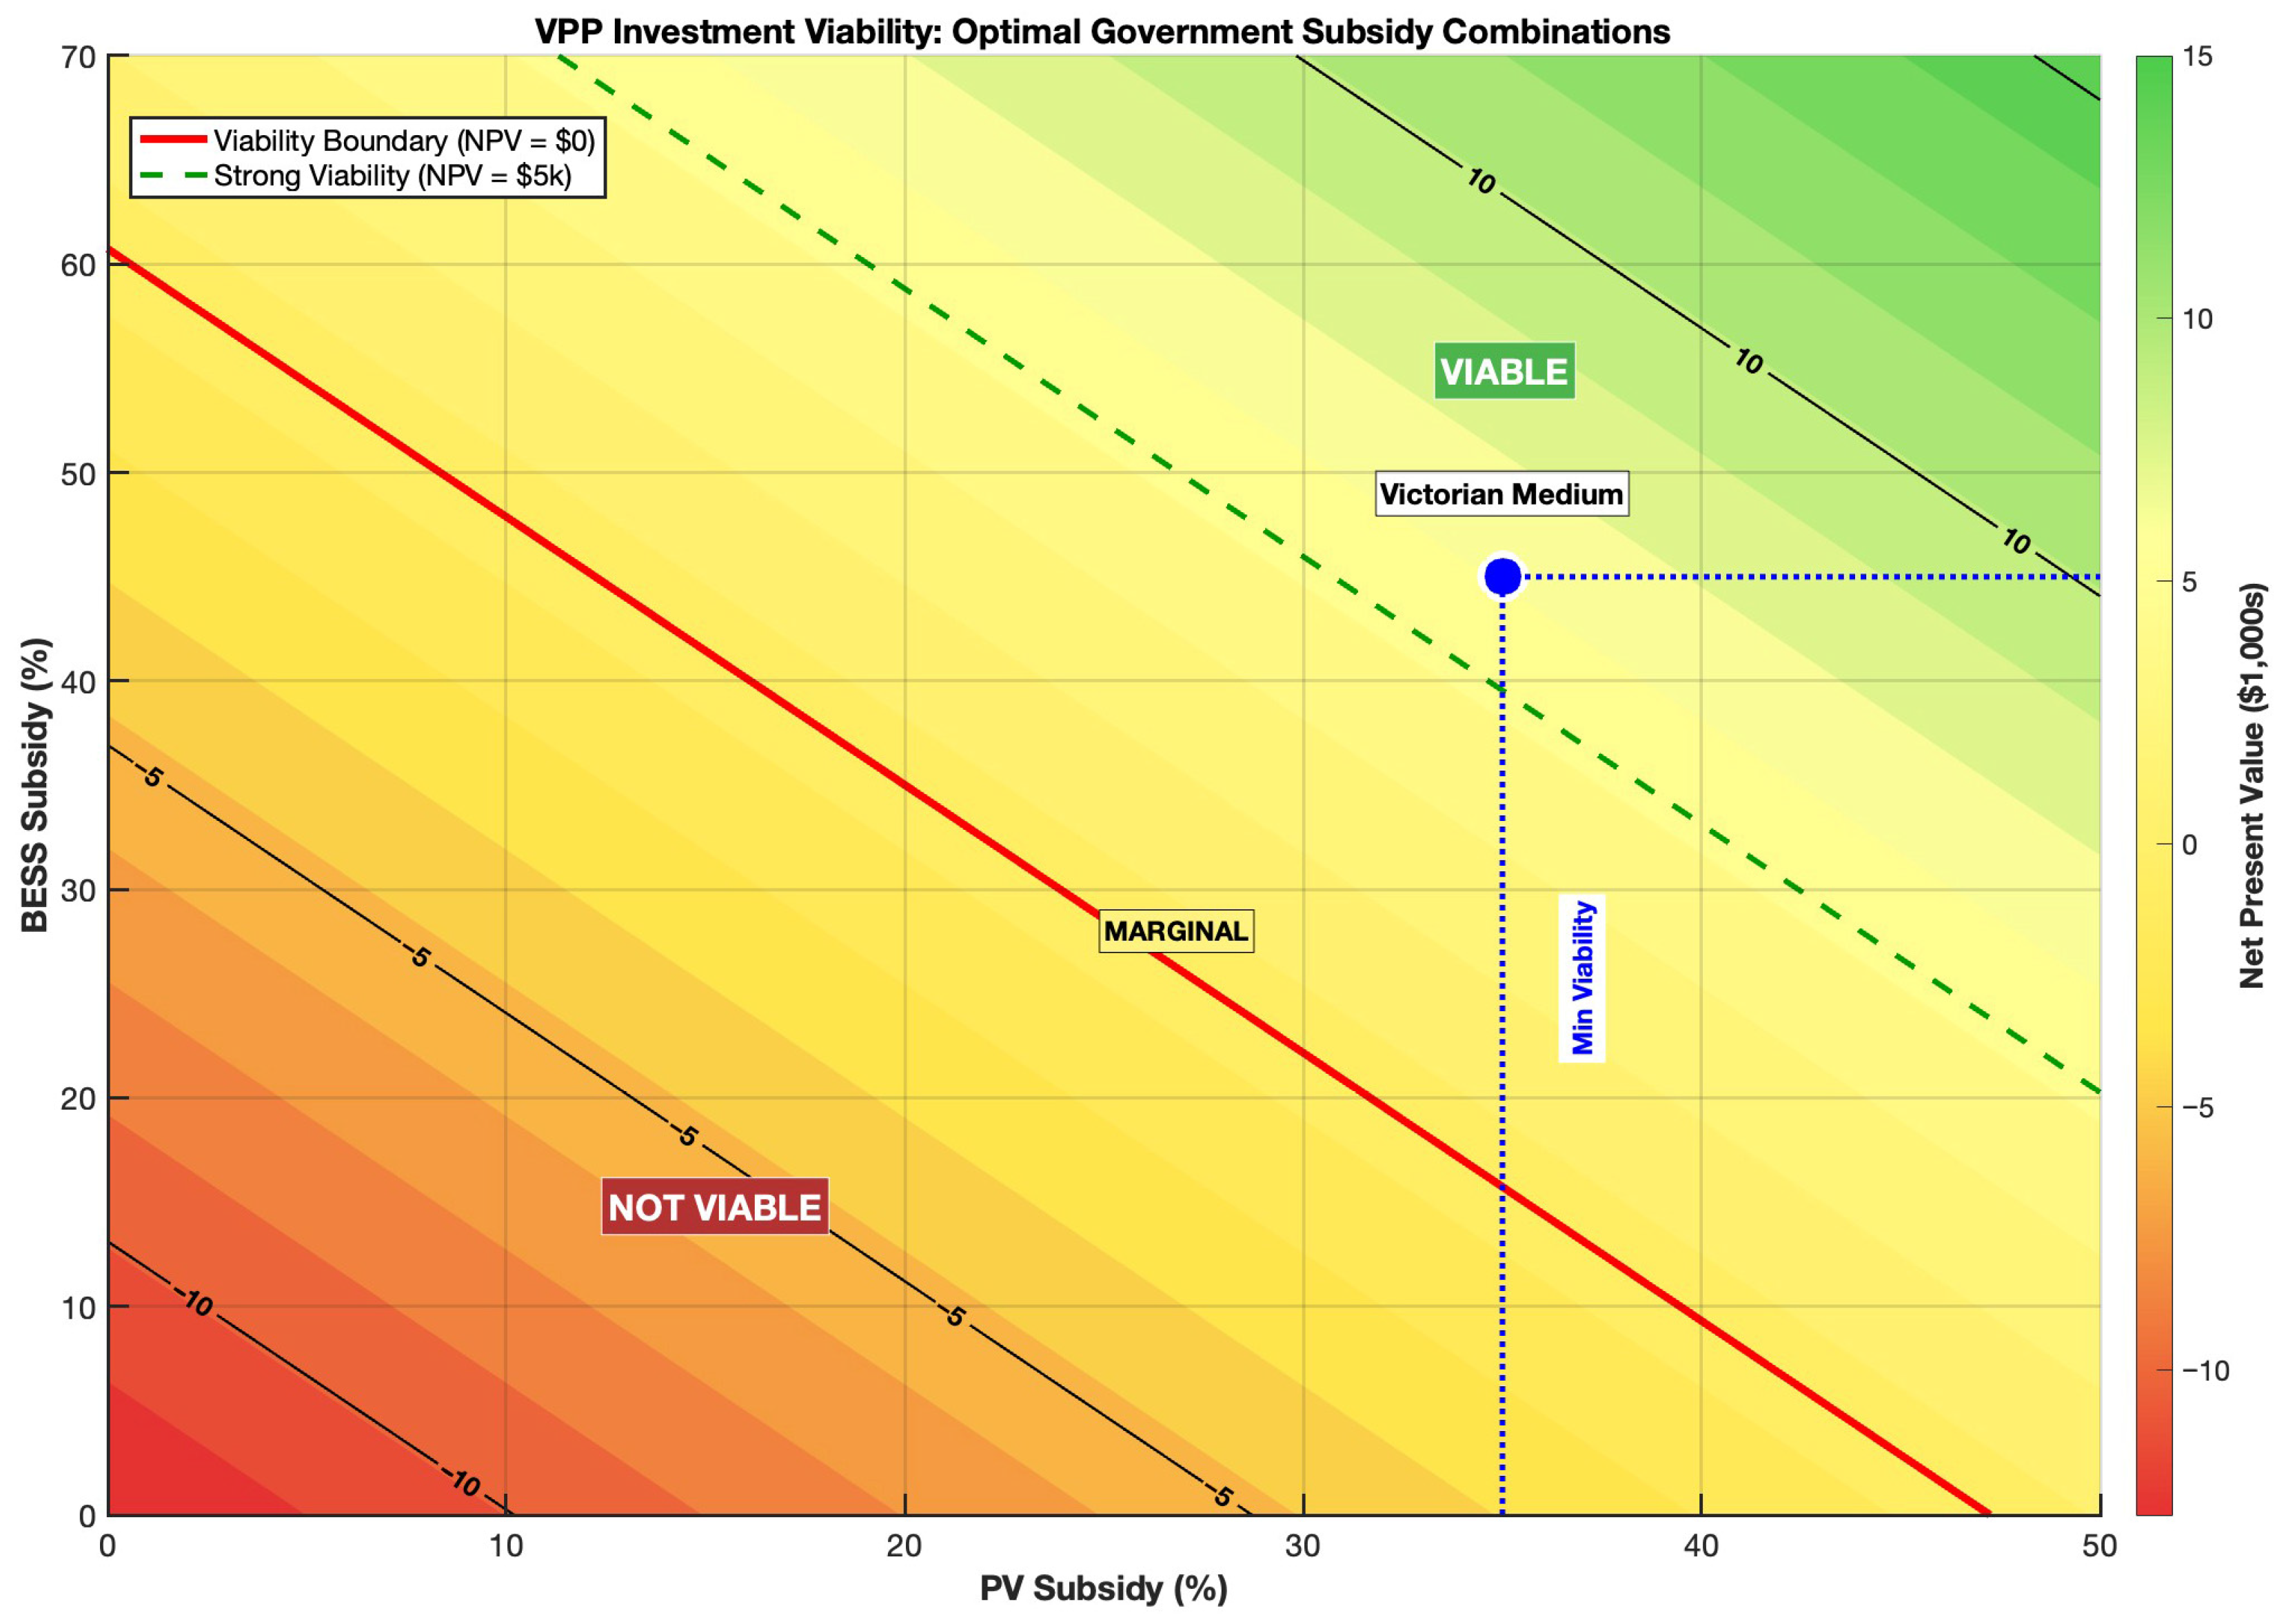

Disclaimer/Publisher’s Note: The statements, opinions and data contained in all publications are solely those of the individual author(s) and contributor(s) and not of MDPI and/or the editor(s). MDPI and/or the editor(s) disclaim responsibility for any injury to people or property resulting from any ideas, methods, instructions or products referred to in the content. |
© 2026 by the authors. Licensee MDPI, Basel, Switzerland. This article is an open access article distributed under the terms and conditions of the Creative Commons Attribution (CC BY) license.