


Abstract
Well-trajectory optimization is frequently framed as maximizing reservoir contact, although additional contact does not necessarily enlarge the dynamically connected drainage volume. Here, vertical, J-shaped and horizontal trajectories were evaluated at three locations in the Upper Safa reservoir (Middle Jurassic Khatatba Formation), Western Desert, Egypt, using a controlled Petrel–ECLIPSE workflow that combines simulated cumulative reservoir response with relative drilling complexity under a consistent reservoir model realization. For every location, the reservoir realization, target interval, and operating constraints were held constant, and only the well path and completed grid cells were varied. The resulting nine cases were compared using modeled contact length, early productivity index, cumulative oil and gas recovery, and an authorization for expenditure (AFE)-based relative drilling cost index, used as a decision support indicator rather than a full economic evaluation. Within these single realization cases, the trajectory ranking was location-specific: vertical at SE-1X (1.92 MMSTB oil, 8.6 BSCF gas), J-shaped at SW-1X (1.78 MMSTB, 8.2 BSCF) and horizontal at SE-5 (1.55 MMSTB, 8.7 BSCF). The SE-1X and SW-1X selections were supported by implemented well geometries and production test observations, whereas the SE-5 horizontal case remains a simulation-based outcome because it was not field-implemented. The horizontal cases returned the highest early productivity index at every location but the highest cumulative recovery only at SE-5, indicating that geometric exposure alone was not sufficient to predict cumulative recovery. Directional surveys and discrete production tests for the two implemented wells were consistent with the selected simulation cases (oil-rate MAPE 7.0–7.9%; gas-rate MAPE 2.3–4.9%). Overall, cumulative response, interpreted together with reservoir quality and connectivity diagnostics, provided a more informative basis for trajectory optimization than geometric contact length alone.
1. Introduction
Directional and horizontal drilling provide access to subsurface targets that may be difficult to reach with vertical wells and can increase reservoir exposure [1,2,3]. However, greater well length or reservoir contact does not necessarily result in higher sustained production or cumulative recovery. Well performance depends on reservoir thickness, permeability distribution and anisotropy, pressure drawdown, wellbore pressure losses, reservoir boundaries, and the hydraulic properties of the contacted formation [1,2,3,4,5]. Recent studies have shown that trajectory orientation and geometry can significantly affect production performance through their interaction with reservoir heterogeneity, permeability distribution, and flow behavior [6,7,8]. Researchers have investigated the productivity of vertical, deviated, and horizontal wells under a range of reservoir conditions. Analytical and numerical studies have shown that horizontal-well performance relative to vertical and deviated wells depends on formation thickness, permeability anisotropy, heterogeneity, and the spatial distribution of reservoir properties [1,2,6]. Field studies have also considered trajectory geometry, drilling constraints, wellbore stability, and reservoir-development requirements in designing deviated and horizontal wells [9,10]. Numerical investigations of heterogeneous reservoirs have shown that well inclination, permeability distribution, and reservoir layering can substantially influence production and recovery [6,7]. Studies of horizontal-well productivity and sweep efficiency have similarly emphasized the effects of reservoir architecture, water influx, and spatial variations in flow properties [11,12].
Trajectory design has also been addressed through numerical optimization and multi-criteria approaches. Quality-map and fast-marching methods have been used to identify feasible well paths under geometric and operational constraints [13]. Other studies have incorporated drilling cost, productivity, and economic factors into trajectory selection [14], while recent approaches have explicitly considered drilling length, inclination, and trajectory-control requirements as optimization constraints [8,15]. Reservoir-modeling studies have also shown the importance of adequately representing spatial variations in reservoir properties and facies when numerical simulation supports development decisions [16]. The main limitation of these approaches is the separation between trajectory design and the long-term dynamic response of the reservoir volume intersected by the well. Many trajectory studies focus primarily on geometric, drilling, mechanical, or economic objectives, whereas reservoir-oriented studies commonly evaluate productivity or recovery for a predefined well configuration. Consequently, a longer reservoir contact does not necessarily correspond to a larger hydraulically effective drainage volume or higher cumulative recovery. The production contribution of the contacted grid cells depends on their reservoir properties and hydraulic communication within the modeled system [11,12,17,18,19]. This distinction is particularly important when comparing vertical, deviated, and horizontal trajectories within the same reservoir interval and under identical simulation and operating conditions.
The methodological contribution of this study is a controlled, field-based Petrel–ECLIPSE framework that compares multiple well-trajectory geometries within the same dynamic reservoir realization and evaluates their long-term cumulative production response, along with an authorization for expenditure (AFE)-based relative drilling-complexity indicator. By maintaining consistent reservoir, fluid, operating, and forecast conditions while varying well-path geometry and corresponding completed grid-cell intersections, the framework tests whether greater modeled contact length translates into higher cumulative recovery and whether trajectory performance is location-dependent within the evaluated reservoir interval.
Numerical reservoir simulation provides a direct framework for this comparison because it allows different well paths to be introduced into the same three-dimensional reservoir model while maintaining consistent reservoir, fluid, and operating conditions. The resulting differences in production response can therefore be attributed primarily to the trajectory and the reservoir cells each well path intersects. Field-based applications have shown the value of integrating reservoir simulation with field data to evaluate production behavior and reservoir performance [16,20]. Recent trajectory studies have likewise shown that production response can vary substantially with trajectory orientation and local reservoir conditions [6,7,8,13].
This study evaluates vertical, J-shaped, and horizontal trajectories at three well locations targeting the Upper Safa Member of the Middle Jurassic Khatatba Formation in the West Kanayes area of the Western Desert, Egypt. We used a controlled Petrel–ECLIPSE workflow in which we held the reservoir-model realization, target interval, rock and fluid properties, operating constraints, forecast period, and numerical settings constant while varying the well-path geometry and corresponding completed grid-cell intersections. Nine trajectory scenarios were evaluated using modeled reservoir-contact length, early productivity index, cumulative oil production, cumulative gas production, and a relative drilling-cost index. The simulated results were also compared with available directional-survey and production-test data from the implemented wells to assess consistency between the numerical model and field observations. The objectives were to: (1) evaluate the relationship between modeled reservoir contact length and cumulative oil and gas production; (2) examine the relationship between early productivity index and long-term cumulative performance; (3) compare trajectory performance among different well locations targeting the same Upper Safa interval; (4) examine the relationship between the reservoir quality, connectivity diagnostics of the contacted cells, and the production response; and (5) combine reservoir performance indicators with relative drilling complexity to provide a practical basis for trajectory screening. Therefore, this study evaluates trajectory performance as a reservoir-dependent engineering problem rather than assuming that a particular trajectory type provides a universal production advantage.
2. Materials and Methods
2.1. Geological Setting and Field Data
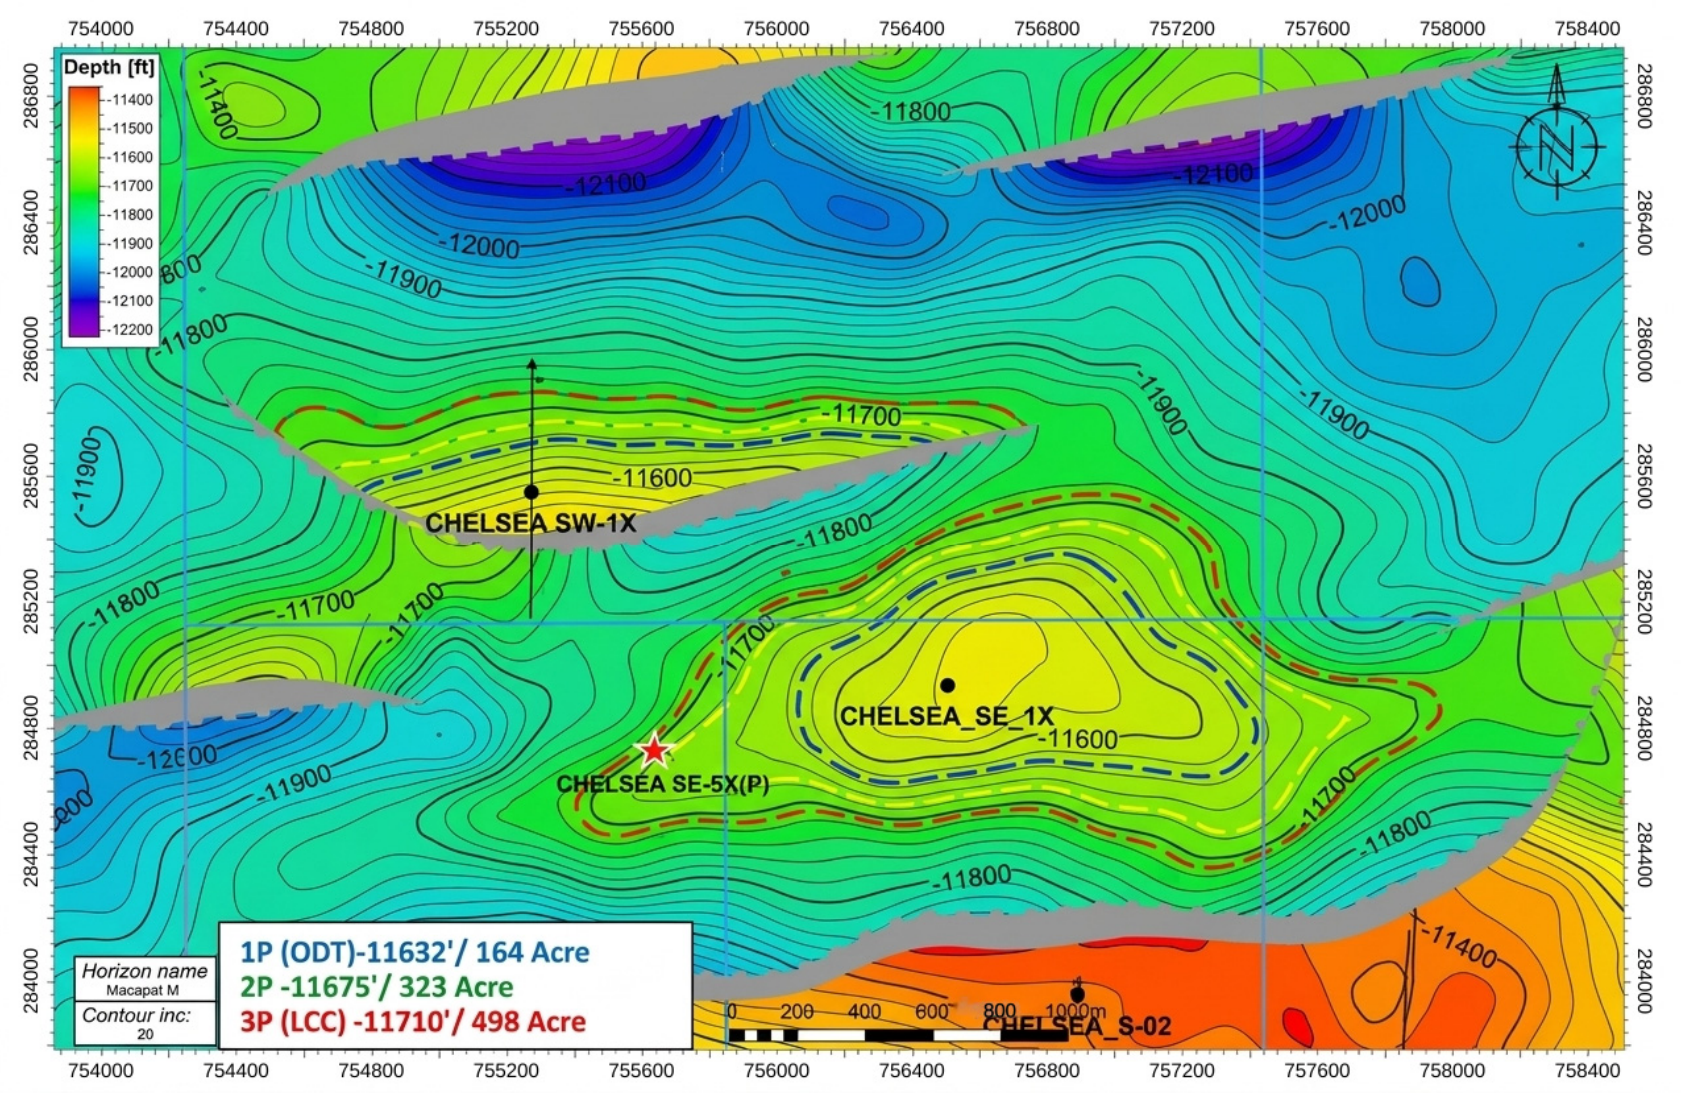
The study used field data for three wells in the West Kanayes area of the Western Desert, Egypt: CHELSEA SE-1X, CHELSEA SW-1X, and CHELSEA SE-5, presented in Figure 1. Available information included drilling programs, planned and actual directional surveys, formation targets, structural interpretations, reservoir pressure and mobility data, production-test observations, and drilling-planning records. The Upper Safa Member of the Middle Jurassic Khatatba Formation was selected as the common target for all trajectory comparisons because it is the principal producing interval at all three locations and because its lateral facies variability makes it a suitable test case for the contact-versus-connectivity question posed in the Introduction Section.
Figure 1.
Study area (CHELSEA SE-1X, CHELSEA SW-1X, and CHELSEA SE-5) with Upper Safa reservoir structure depth.
2.2. Static Reservoir Model
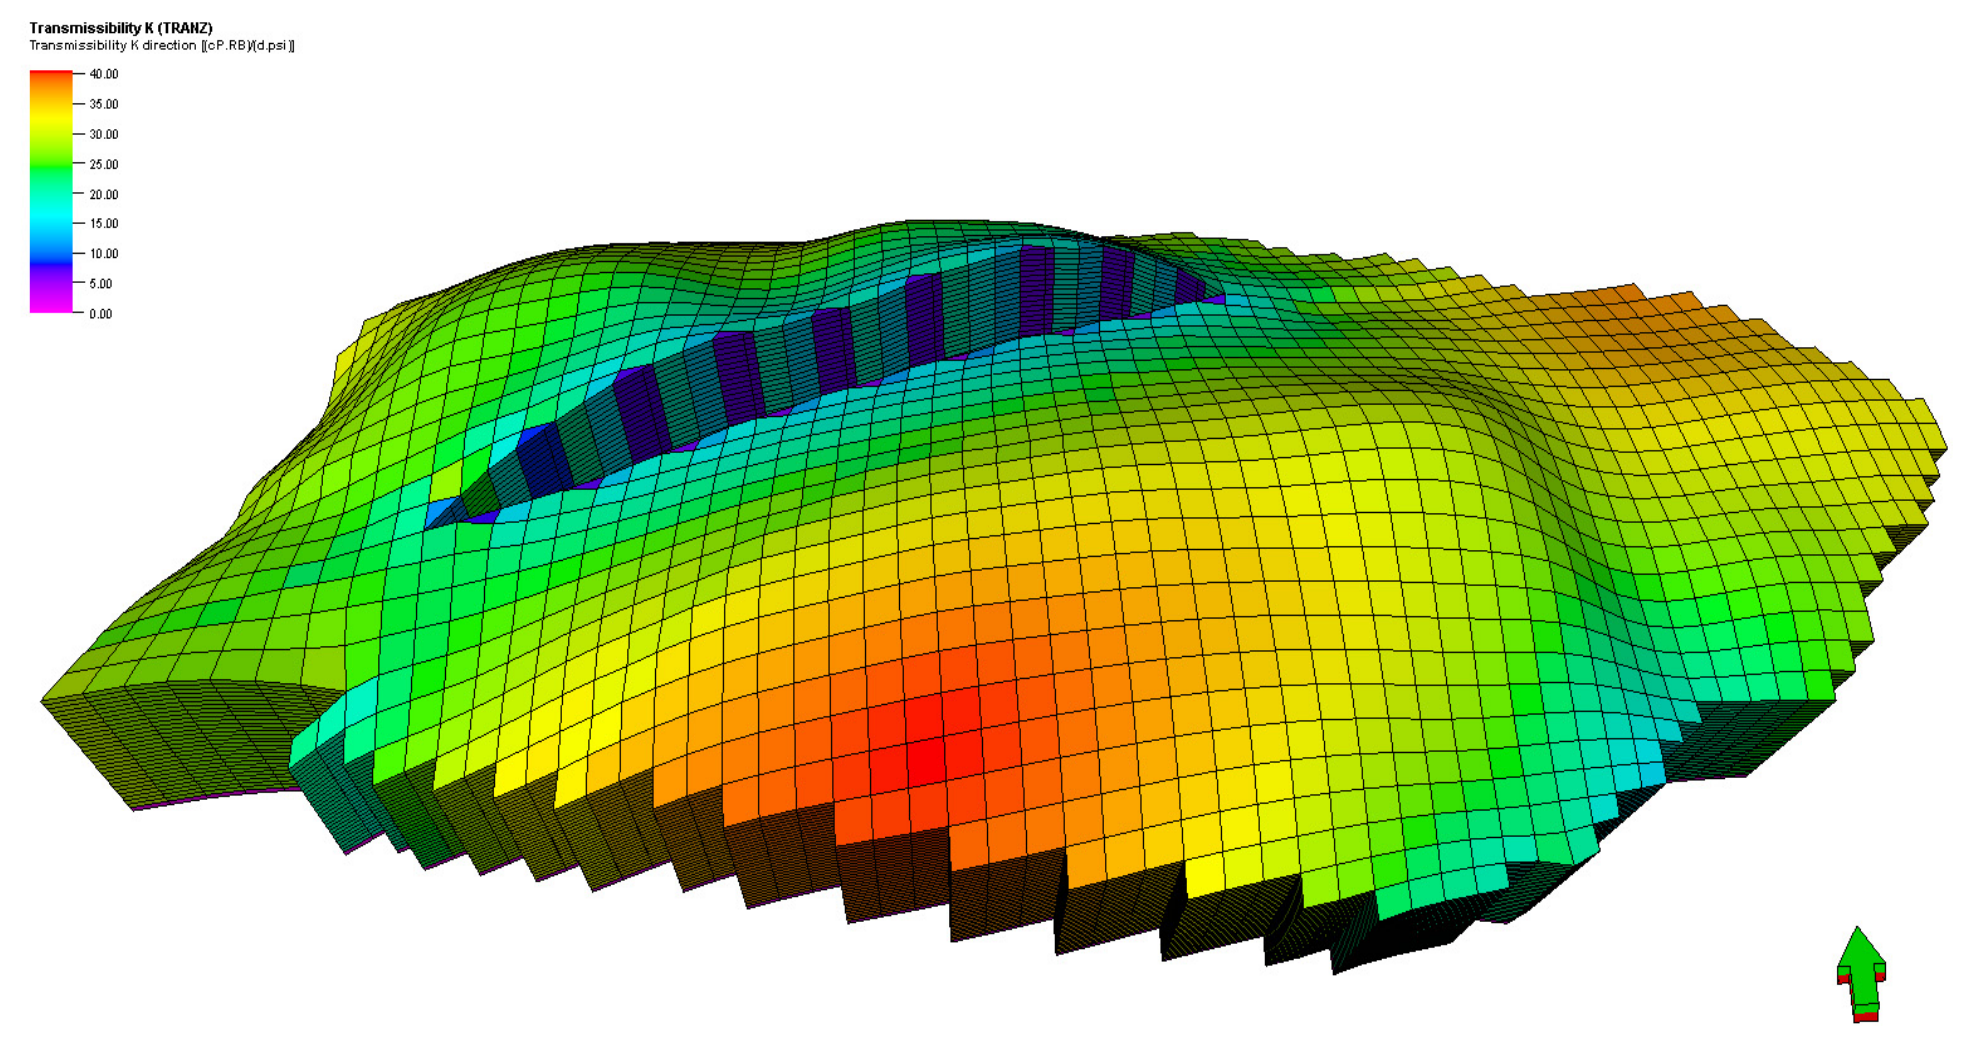
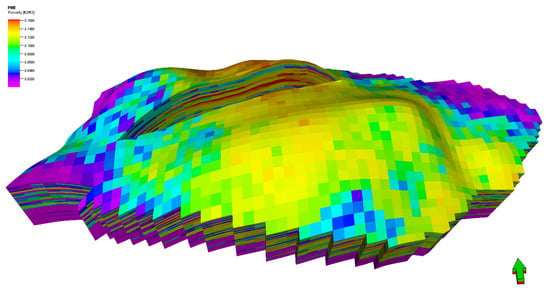
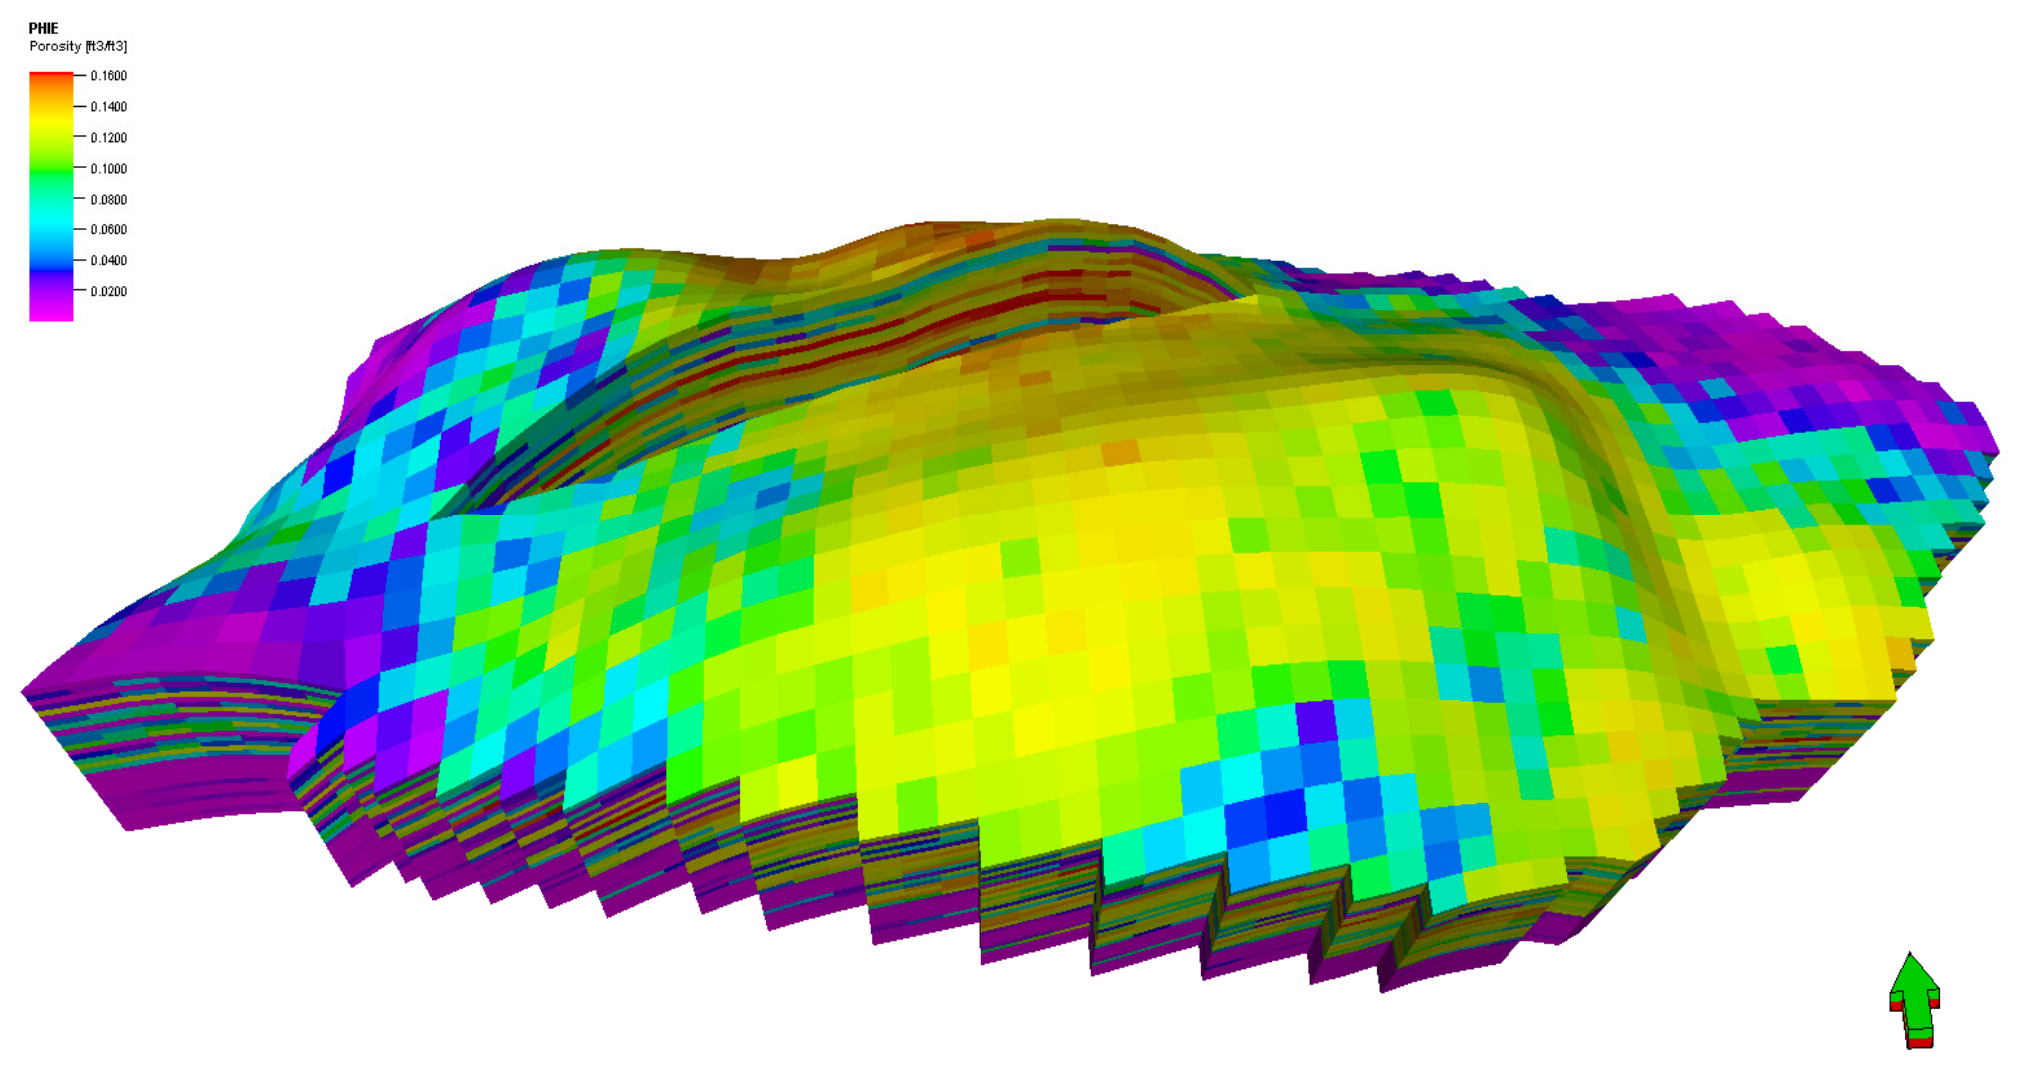
The static model was constructed and quality-controlled in Petrel and exported to ECLIPSE for dynamic simulation. The model carried spatial distributions of bulk volume, effective porosity, permeability, water saturation, pore volume, and directional transmissibility (TRANX, TRANY, TRANZ). Figure 2 shows a 3D spatial distribution of vertical grid transmissibility, highlighting localized flow conductivity across the reservoir layer, and Figure 3 shows the distribution of effective porosity used to interpret local storage quality along the evaluated well paths. These properties were used to interpret the storage and flow capacities and the connectivity of the cells intersected by each trajectory. Directional transmissibility was used specifically as a diagnostic for whether contacted cells communicate with the surrounding pore volume, since transmissibility contrasts between adjacent cells identify the baffles and barriers that can separate modeled contact from effective reservoir communication.
Figure 2.
Three-dimensional distribution of vertical grid transmissibility within the constructed Upper Safa reservoir grid. The green arrow refers to the north direction.
Figure 3.
Three-dimensional distribution of effective porosity (PHIE) within the Upper Safa static reservoir model. The green arrow refers to the north direction.
The model was not treated as a perfect representation of the subsurface. It was used as a single field-consistent engineering realization for controlled scenario comparison, and the simulation results were subsequently checked against available directional survey and discrete production test information (Section 2.6). The implications of using one realization rather than an ensemble are addressed in Section 4.6.
2.3. Dynamic Simulation Framework
Dynamic reservoir simulations and long-term production forecasts were performed using the ECLIPSE compositional simulator with an equation-of-state (EOS) fluid description to capture phase behavior during depletion.
2.3.1. Grid Discretization and Reservoir Initialization
The dynamic simulation domain was discretized using a 3D corner-point grid comprising 62 × 38 × 30 grid blocks, resulting in a total of 70,680 active cells across 30 geological layers. The spatial resolution was configured with average block increments of ΔX = 50.5 m, ΔY = 50.4 m, and a vertical thickness of ΔZ = 3.81 m. The structural framework incorporated the four major interpreted faults, and the model follows standard corner-point reservoir-simulation practice [21].
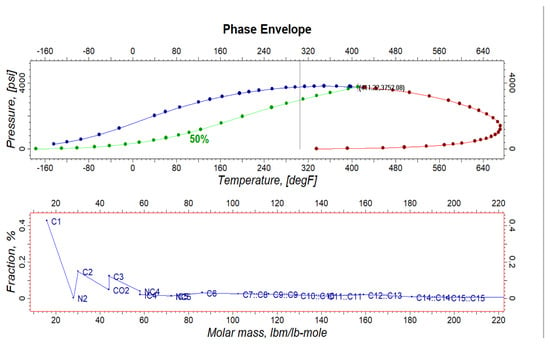
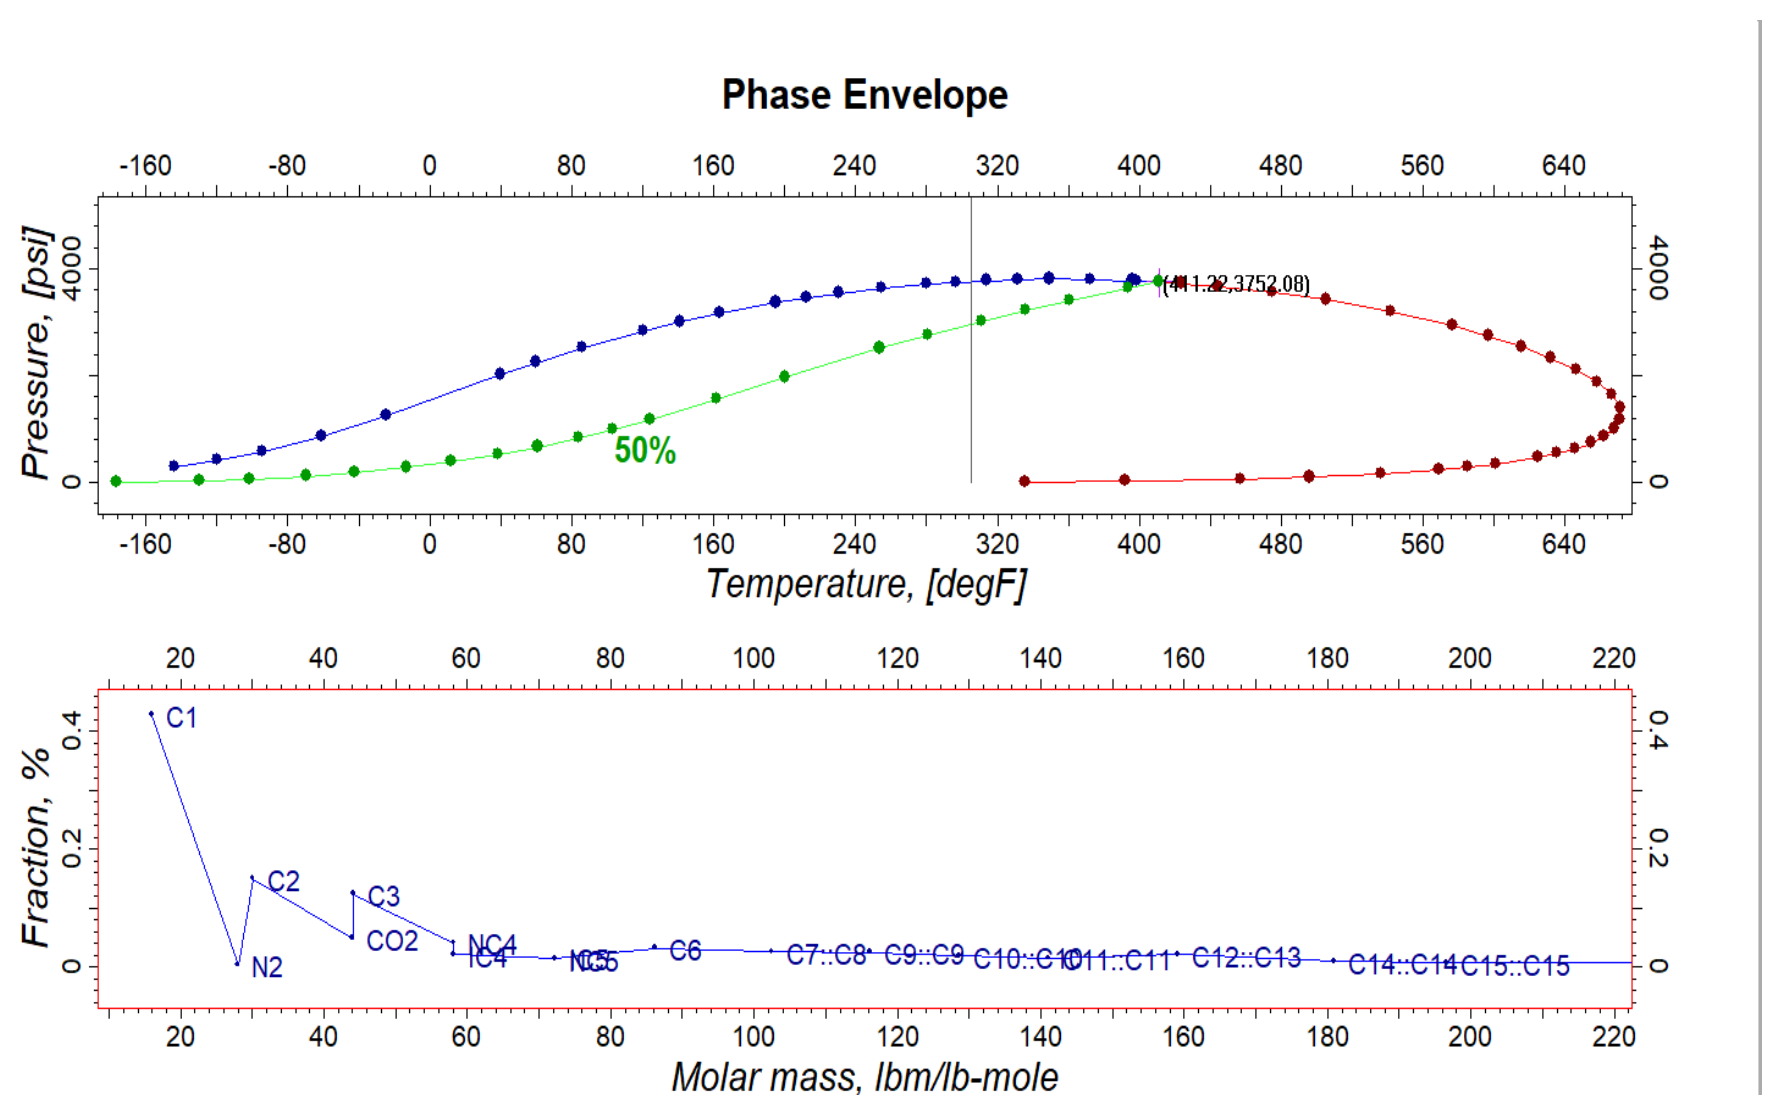
The reservoir model was initialized under hydrostatic gravity capillary equilibrium (EQUIL). Fluids were modeled using a compositional EOS characterized by non-hydrocarbon components (N2, CO2) and hydrocarbon fractions up to C16+. Phase behavior modeling (Figure 4) established a baseline reservoir temperature of 311 °F and a bubble-point pressure (Pb) of 3752 psi.
Figure 4.
Calculated pressure–temperature (P-T) phase envelope and component distribution for the EOS fluid model, highlighting the baseline reservoir condition (Tres = 311 °F, Pb = 3752 psi).
2.3.2. Rock–Fluid Properties and Wellbore Inflow Dynamics
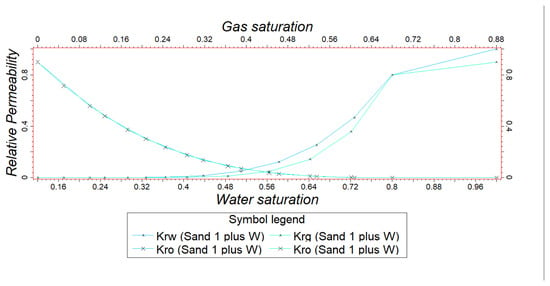
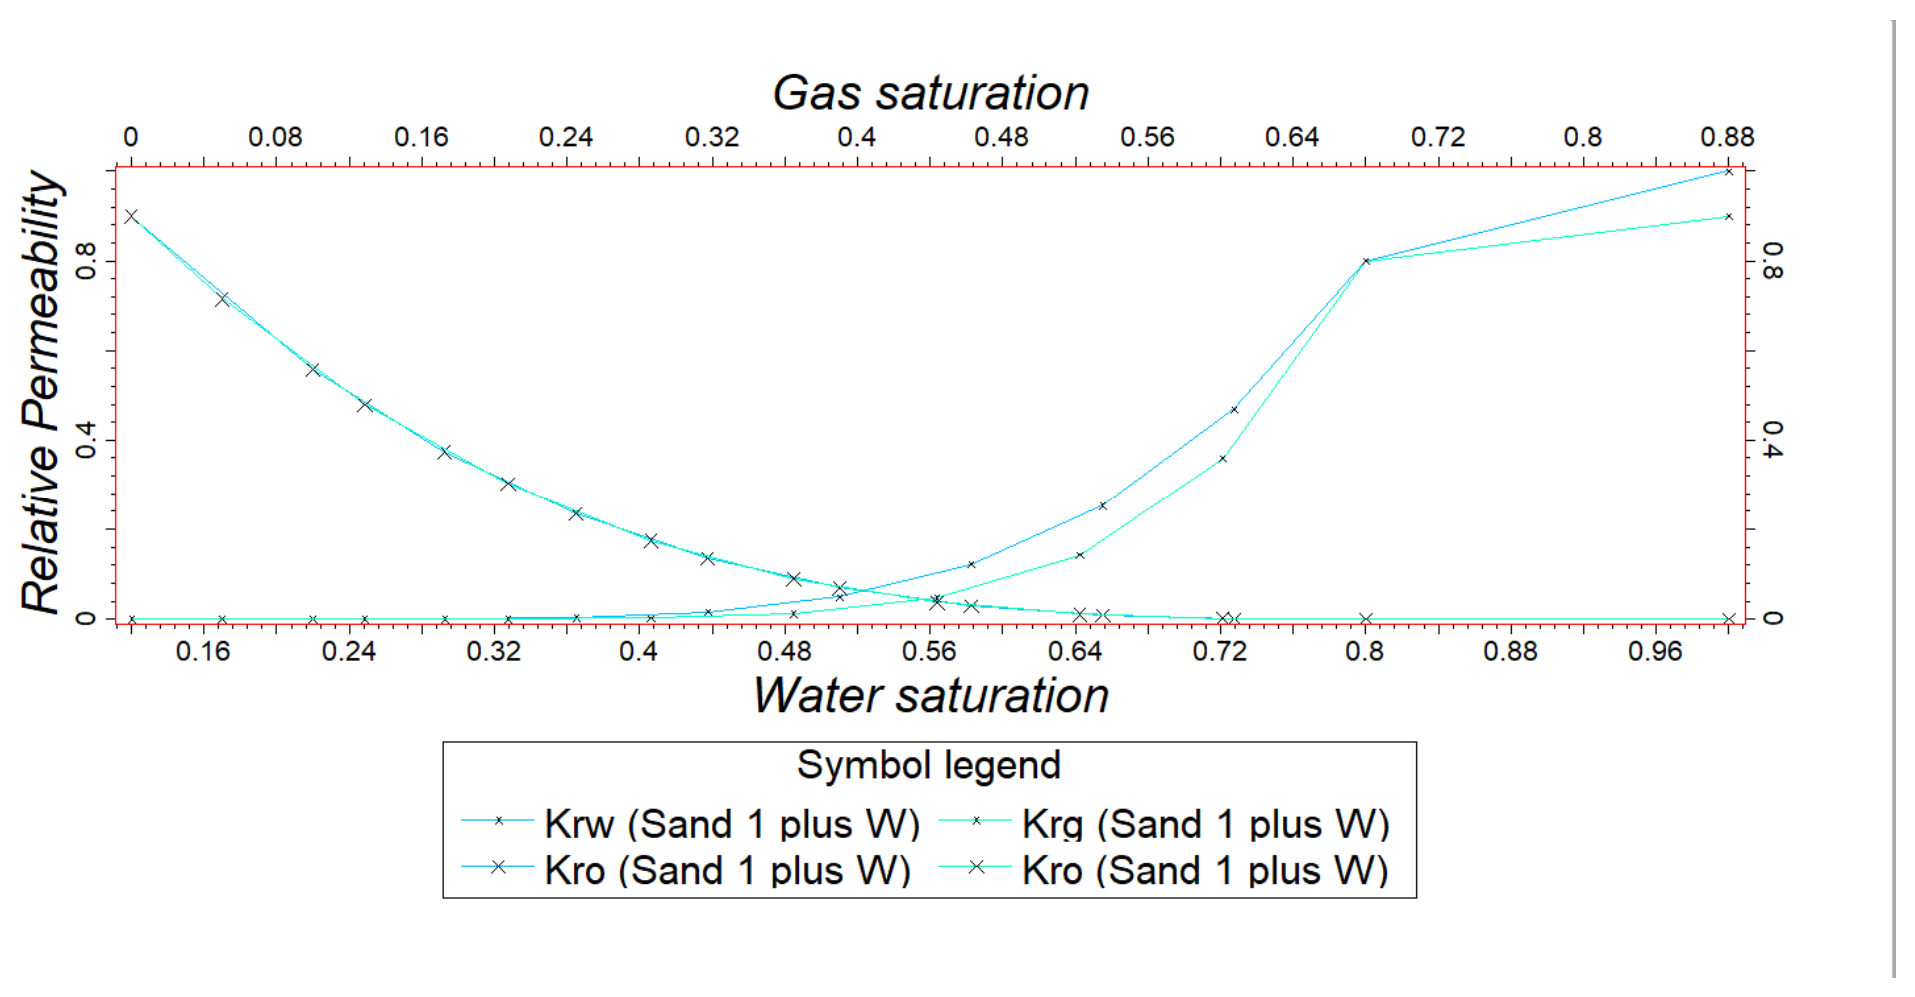
Multiphase flow characteristics were defined using special core analysis (SCAL) datasets. Relative permeability functions (Kro, Krw, Krg; Figure 5) and the actual model rock-physics definition specify a maximum capillary pressure of 13 psi, with Sw@Pc = 0 of 0.65 and a Brooks–Corey exponent of 3.86. The initial connate water saturation (Swc) was established at 0.13, with a maximum oil relative permeability (Kro) of 0.90. The Kro–Krw crossover occurs at a water saturation slightly above 50%, which, according to Craig’s rules of thumb, indicates a water-wet tendency [22,23]. However, the low connate water saturation (0.13) and a water relative permeability at residual oil saturation of approximately 0.4–0.5 (Figure 5) lie closer to the ranges associated with intermediate wettability [22,23]. The system is therefore interpreted as weakly water-wet to intermediate-wet, and wettability was not used as an explanatory variable in the trajectory comparison. The Kro-Krw crossover point occurring above 50% water saturation confirmed a predominantly water-wet reservoir system. Fluid inflow from penetrated grid cells into the wellbore was calculated using Peaceman’s connection formulation. To isolate the pure geometric performance of the evaluated trajectories, a uniform open-hole wellbore radius of rw = 0.354 ft (8.5-inch equivalent) and a zero skin factor (S = 0) was specified for all completed grid cell connections.
Figure 5.
Measured relative permeability (Krw, Kro, Krg) for the Upper Safa formation utilized in the ECLIPSE simulation.
These identical wellbore parameters were used as a normalization for controlled-trajectory comparison and should not be interpreted as representing identical field-scale completion conditions. In practice, trajectory-dependent drilling damage, completion efficiency, cleanup, and stimulation may produce different effective skin values.
As a supplementary analytical illustration (implications discussed in Section 4.6), the effect of assumed skin on a representative connection was estimated using Peaceman’s well-index relation, , where k_eff is effective permeability normal to the well connection, L is completed connection length, denotes the Peaceman equivalent well-block radius (not the reservoir drainage radius), r_w is the wellbore radius, and S is dimensionless skin [24,25]. For an illustrative isotropic Cartesian cell with a horizontal connection aligned along the x-axis, ≈ 0.14(ΔY2 + ΔZ2)^1/2. Using the average grid dimensions ΔY = 50.4 m and ΔZ = 3.81 m and r_w = 0.354 ft (0.107899 m) gives r_o ≈ 7.076 m and The normalized well index is therefore WI(S)/WI(0) = D/(D + S). At assumed S = 0, +2, and +5, the normalized well indices are 1.000, 0.677, and 0.456, corresponding to reductions of 0%, 32.3%, and 54.4% in idealized connection inflow capacity, respectively. For CHELSEA SE-5, the baseline horizontal-to-vertical ratio of the midpoints of the reported early-PI intervals (refer to Section 2.5) is R0 = [(32.5 + 38.0)/2]/[(11.3 + 12.4)/2] ≈ 2.97. Assuming the vertical case remains at S = 0 and that horizontal early PI scales in proportion to connection WI, R(S) ≈ R0D/(D + S); the corresponding first-order ratios are 2.97, 2.01, and 1.35 at S = 0, +2, and +5, respectively, with parity at approximately S = 8.3. If the vertical connection is assigned the same positive skin, the ratio changes little (≈2.90 at S = +2 and ≈2.85 at S = +5), because the vertical connection has a similar logarithmic term (ro,v = 0.14(ΔX2 + ΔY2)^1/2 ≈ 9.99 m, ln(ro,v/rw) ≈ 4.53); the horizontal-only damage case is therefore the conservative bound. Actual well responses depend on local grid geometry, permeability anisotropy, well orientation, well-connection contributions, multiphase flow, and operating controls.
2.4. Controlled Trajectory Scenarios
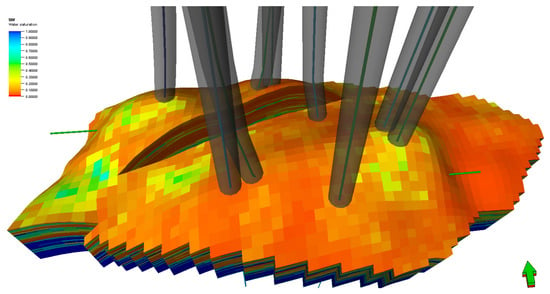
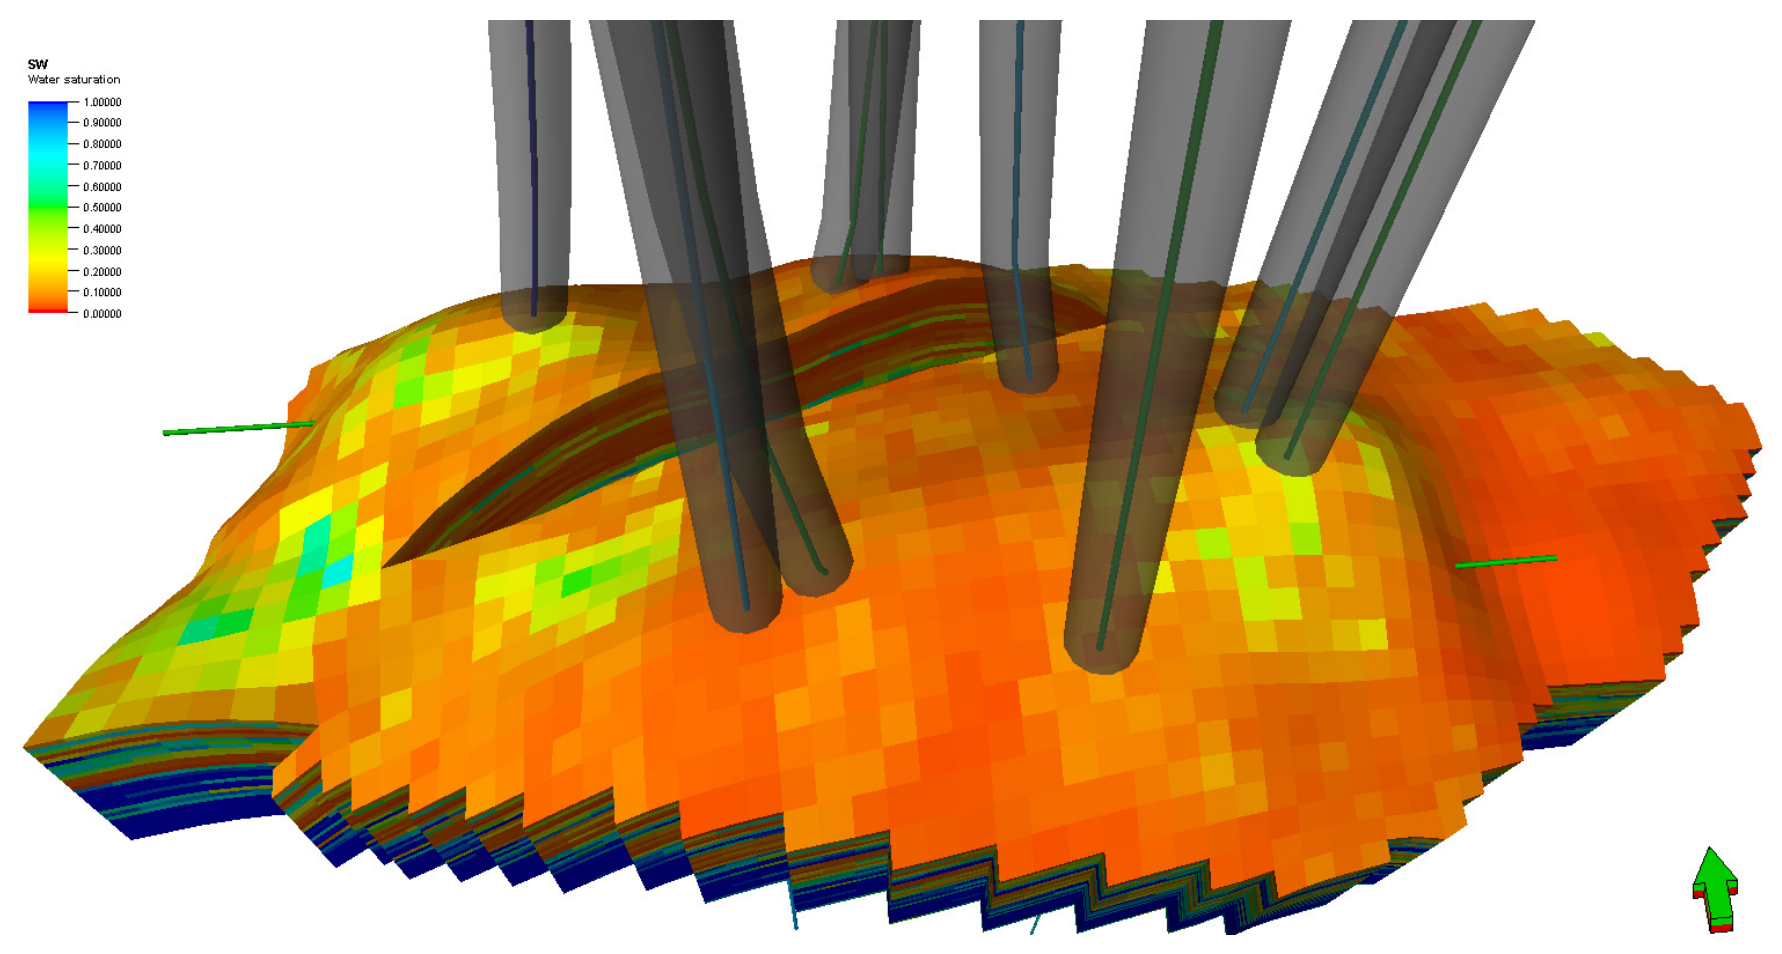
For each location, three configurations were constructed: a vertical reference, a moderately deviated J-shaped trajectory, and a horizontal trajectory. The target interval, reservoir-model realization, operating constraints, forecast period, numerical settings, and fluid and rock descriptions were retained unchanged across all cases. The intentional variable was the well-path geometry, which altered the reservoir cells intersected by the completed wellbore (Figure 6). Differences among cases therefore reflect the combined effect of placement, modeled contact length, contacted-cell quality, and connectivity. This controlled single-variable design follows established simulation-based trajectory-evaluation practice [26,27].
Figure 6.
3D numerical reservoir grid displaying the spatial distribution of initial water saturation and the targeted wellbore trajectories penetrating the formation layers. The green arrow refers to the north direction.
The modeled contact length is defined here as the calculated extent of wellbore intersection with active reservoir grid cells. It is a model-based indicator and is not assumed to be identical to the final productive completion length; the distinction matters because grid resolution and the well-index formulation control how a deviated wellbore is represented numerically. Table 1 summarizes the measured depth, true vertical depth, maximum inclination, and modeled contact length for all nine cases. Field dimensions are reported in conventional petroleum units, with exact conversion factors to SI units listed in the Abbreviations section.
Table 1.
Geometry and relative drilling-cost index of the evaluated trajectories.
2.5. Production and Drilling-Complexity Metrics
The primary dynamic indicators were the early productivity index, cumulative oil production, and cumulative gas production. Reservoir-property maps and directional transmissibility were used as explanatory variables rather than as independent response variables. The evaluation deliberately emphasized cumulative response, because a high early productivity index reflects instantaneous inflow capacity at near initial reservoir conditions and scales strongly with near-well flow capacity and contact length, whereas cumulative recovery is bounded by the connected, pressure-supported drainage volume accessible to the well [28,29]. The two quantities are therefore not interchangeable, and Section 3 shows that they rank the trajectories differently. Simulation results for the nine cases are presented in Table 2.
Table 2.
Comparative production response of the nine simulated trajectory cases.
A relative drilling-cost index was derived from the available AFE and cost-versus-days/depth planning records. Within each well location, the vertical case was assigned an index of 1.00 and the J-shaped and horizontal alternatives were scaled relative to that reference. The index captures project-specific differences in measured depth, directional control requirements, expected drilling time, and operational exposure. It is a screening metric only: revenue, operating expenditure, fiscal terms, discounting, and net present value were outside the scope of the study. Because the underlying planning records are unpublished internal operator data, they are identified in the text and are not included in the reference list, in accordance with journal policy on unpublished sources.
2.6. Field-Consistency Assessment
The preferred configurations were compared with actual directional surveys and available post-start-up production tests for CHELSEA SE-1X and CHELSEA SW-1X. CHELSEA SE-5 was excluded from this step because the technically favorable horizontal scenario could not be implemented within the operator’s available operational capability.
The comparison used 7 production-test observations for CHELSEA SE-1X and 6 for CHELSEA SW-1X. The simulated and observed rates are compared in Section 3.5. Agreement between simulated and observed rates was summarized by the mean absolute percentage error (MAPE):
where qsim,i and qobs,i are the simulated and observed production rates at observation i, and n is the number of available observations [30].
MAPE = (100/n) ∑ni=1 |(qobs,i − qsim,i)/qobs,i|
MAPE expresses the average magnitude of deviation relative to the observed values. It does not indicate the direction of bias, is undefined for zero observed rates, becomes unstable for small observed values, and is asymmetric because under-predictions cannot exceed 100% while over-predictions are unbounded [30,31]; therefore, it should not be used in isolation to select between competing models. Because the field information consisted of a small number of discrete test observations rather than a continuous production history, the comparison is presented as a field-consistency assessment rather than a history match or an independent validation of the long-term forecast.
2.7. Data Exclusion and Model Scope Boundaries
The available field dataset was not used in its entirety for reservoir-model construction and trajectory comparison. To maintain a controlled and reproducible evaluation, field observations that were not required as direct model inputs were reserved for subsequent consistency assessment. In particular, the actual directional surveys and post-start-up production-test observations were not used to define the alternative trajectory scenarios or to determine their production ranking. These data were used independently in the field-consistency assessment to compare simulated and observed production behavior. Likewise, drilling-planning and AFE records were used only to derive the relative drilling-cost index and were not introduced as reservoir-model inputs.
The dynamic model was intentionally limited to the reservoir, fluid, rock–fluid, and well-inflow representations required for the controlled comparison. The same reservoir realization, structural framework, PVT description, SCAL-derived relative-permeability and capillary-pressure functions, uniform wellbore radius, zero skin factor, operating constraints, and forecast settings were maintained for all trajectory cases. Well inflow from the completed grid cells was calculated using Peaceman’s well model. A uniform wellbore radius and zero skin factor were applied to all cases to avoid introducing trajectory-dependent near-wellbore effects into the comparison.
The model scope did not include additional dynamic effects that were outside the objective of isolating the reservoir-response contribution of trajectory geometry, such as detailed surface-facility hydraulics, trajectory-specific completion variations, or dynamic geomechanical effects. The adopted SCAL-based rock–fluid relationships were also applied consistently across all cases, without separately modeling additional hysteresis effects. These scope boundaries applied uniformly to all nine scenarios, so differences in production response could be interpreted in relation to well-path geometry and the reservoir cells each trajectory intersected. Because the simulations are deterministic scenarios based on a single realization, no statistical margin of error was assigned to the forecasts; model-to-field deviation was quantified with MAPE (Section 3.5), which is a consistency measure and not a confidence interval.
3. Results
3.1. Cross-Well Response
Increasing modeled reservoir contact did not produce a uniform increase in cumulative hydrocarbon recovery. Across the nine cases, modeled contact length ranged from 75–400 ft (22.9–121.9 m), more than a factor of five, whereas cumulative oil recovery ranged from 1.00 to 1.92 MMSTB, and the two quantities were not monotonically related. The horizontal cases returned the highest early productivity index at all three locations but were the highest cumulative producers only at CHELSEA SE-5. At CHELSEA SE-1X, the horizontal case had the highest early productivity index (39–46) but the lowest cumulative oil among the three SE-1X cases (1.55 MMSTB), a direct inversion of the ranking implied by contact length. The ranking at each location is unchanged when oil and gas are combined on an oil-equivalent basis (6 Mscf/BOE): 3.35, 3.22, and 2.82 MMBOE at SE-1X; 2.45, 3.15, and 2.88 MMBOE at SW-1X; and 1.82, 1.70, and 3.00 MMBOE at SE-5 for the vertical, J-shaped, and horizontal cases, respectively. The horizontal case also had the highest cumulative gas–oil ratio at every location (approximately 4900, 5160, and 5610 scf/STB at SE-1X, SW-1X, and SE-5, compared with 3910–4610 scf/STB for the vertical and J-shaped cases), indicating proportionally greater gas production from the horizontal completions.
3.2. CHELSEA SE-1X
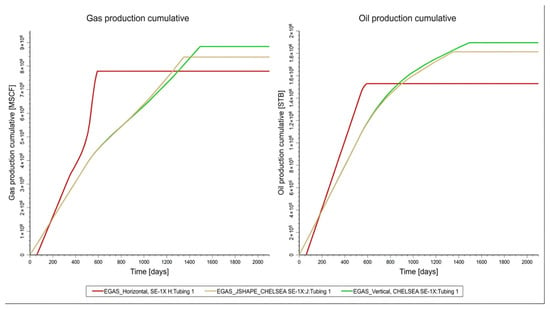
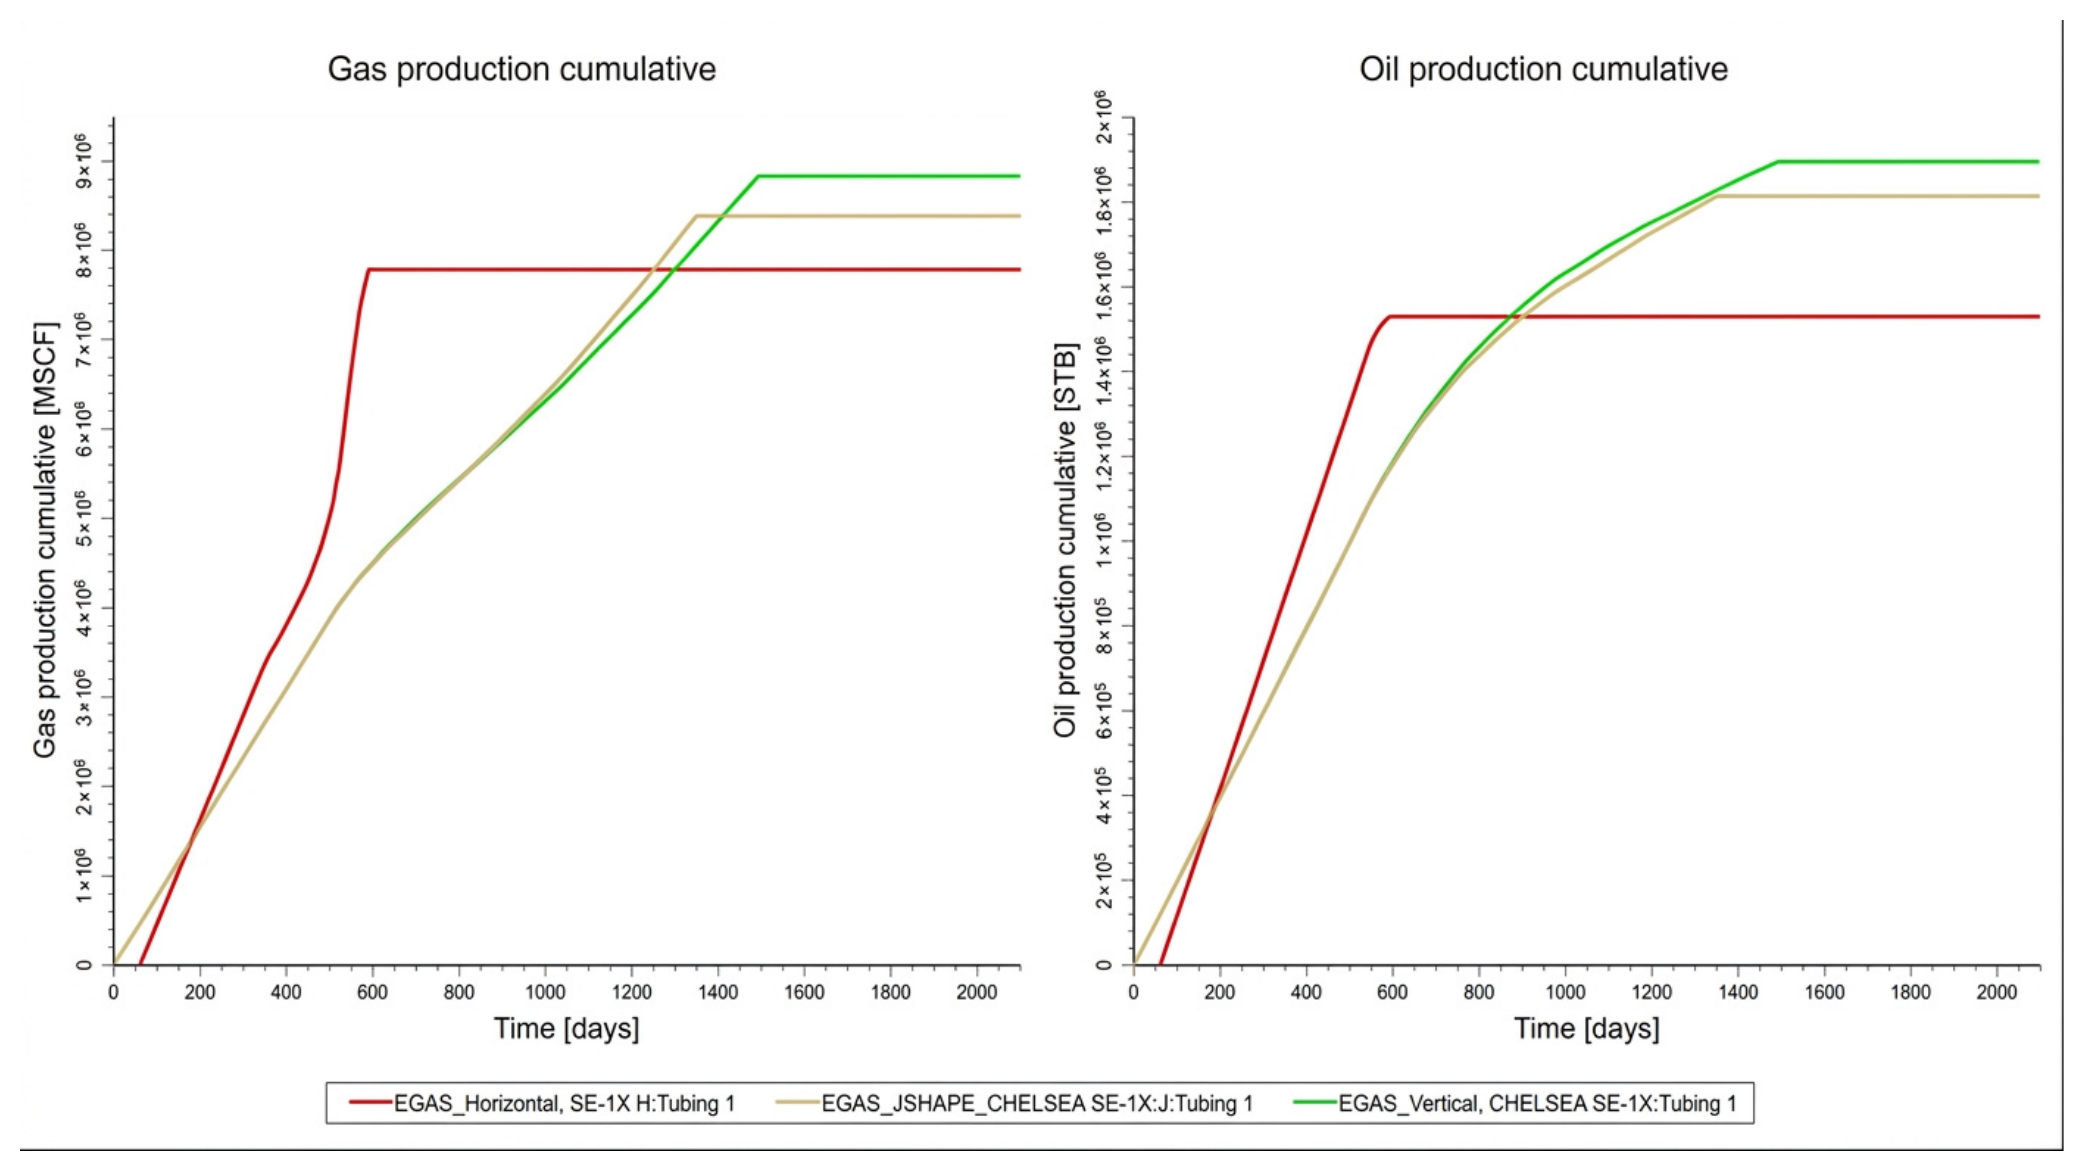
The vertical trajectory was the preferred case at CHELSEA SE-1X. Despite the shortest modeled contact of 75 ft (22.9 m), it produced 1.92 MMSTB of oil and 8.6 BSCF of gas. Increasing contact to 115 ft (35.1 m) in the J-shaped case reduced cumulative production to 1.85 MMSTB and 8.2 BSCF. The 300-ft (91.4-m) horizontal case generated the highest early productivity index of the three (39–46), but its cumulative response fell to 1.55 MMSTB and 7.6 BSCF, a reduction of 19.3% in oil and 11.6% in gas relative to the vertical reference. Its relative drilling-cost index was also the highest at 1.38 (Figure 7).
Figure 7.
Cumulative gas and oil production profiles for vertical, J-shaped, and horizontal trajectories in CHELSEA SE-1X.
For this location, the vertical path therefore dominated on both axes simultaneously: it achieved the highest cumulative oil and gas while retaining the lowest relative drilling burden, so no trade-off between recovery and cost arises. A longer path would have added capital and operational complexity without an offsetting recovery benefit.
3.3. CHELSEA SW-1X
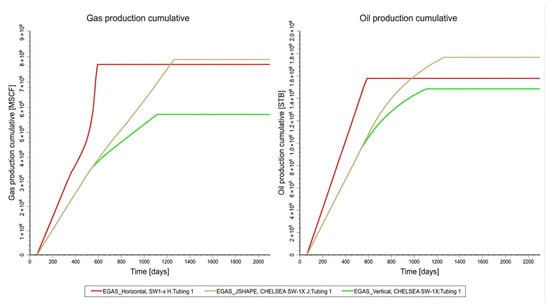
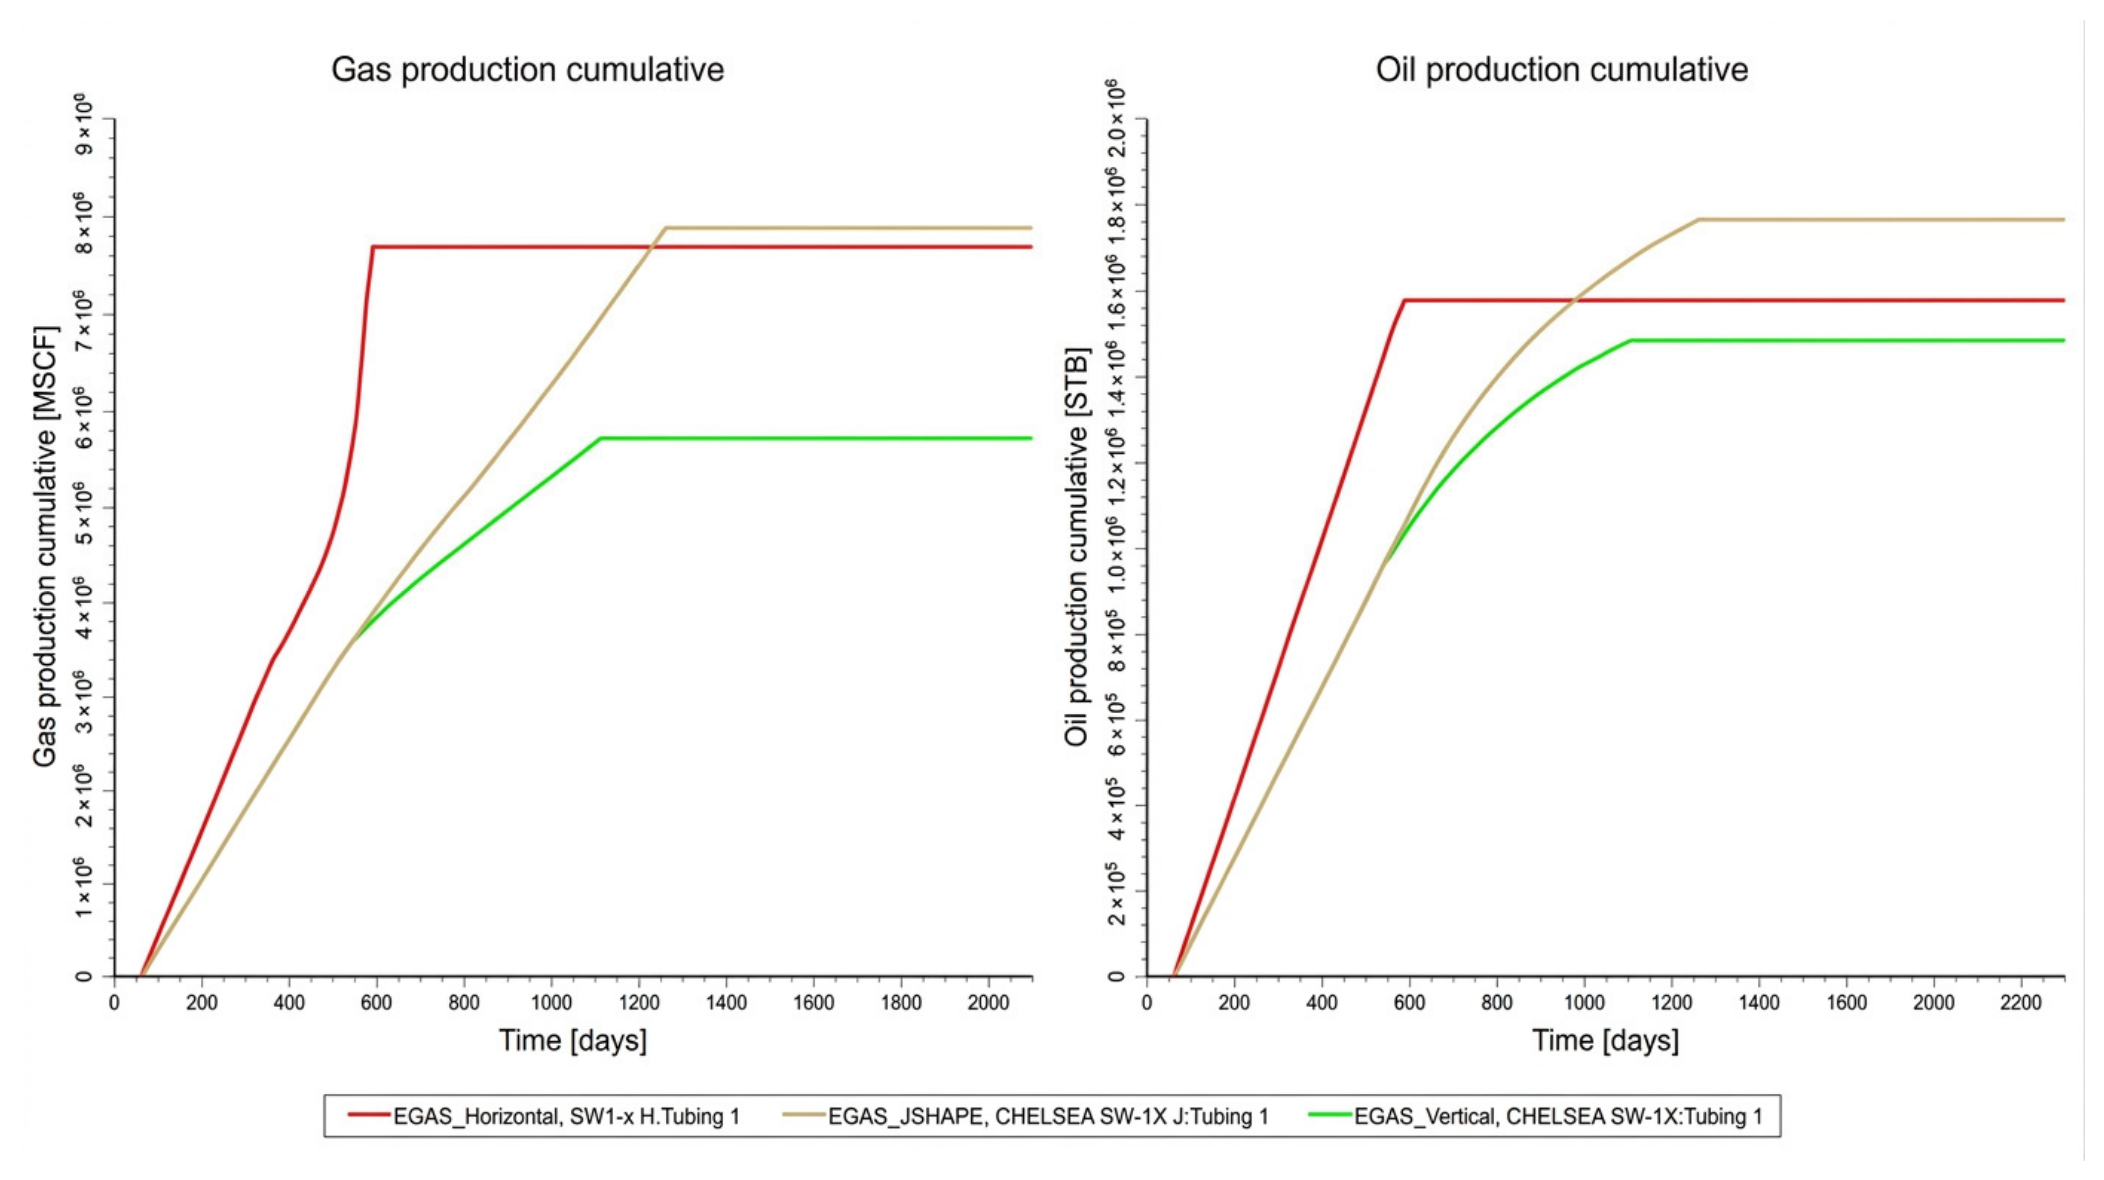
The J-shaped trajectory provided the most balanced response at CHELSEA SW-1X. Its modeled contact of 115 ft (35.1 m) yielded 1.78 MMSTB of oil and 8.2 BSCF of gas, compared with 1.45 MMSTB and 6.0 BSCF for the vertical case, increases of 22.8% and 36.7%, respectively. The 400-ft (121.9-m) horizontal path reached a much higher early productivity index of 44–52 but produced only 1.55 MMSTB of oil and 8.0 BSCF of gas. The J-shaped case therefore delivered approximately 14.8% more oil and 2.5% more gas than the horizontal alternative while carrying a materially lower relative drilling-cost index, 1.18 vs. 1.43 (Figure 8).
Figure 8.
Cumulative gas and oil production profiles for vertical, J-shaped, and horizontal trajectories in CHELSEA SW-1X.
SW-1X is the only location where the response is non-monotonic in contact length in both directions: recovery rises from the vertical to the J-shaped case, then falls again to the horizontal case. In this realization, moderate deviation gave higher simulated recovery without the full drilling and completion burden of a horizontal section, whereas the additional 285 ft of modeled contact in the horizontal case did not produce a proportional increase in simulated cumulative oil.
3.4. CHELSEA SE-5
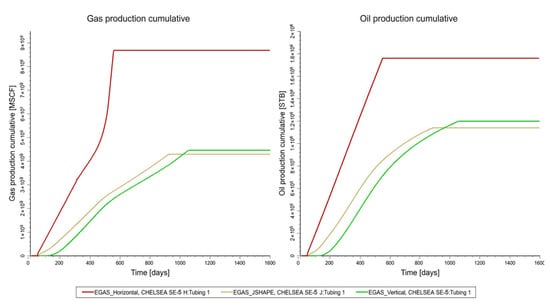
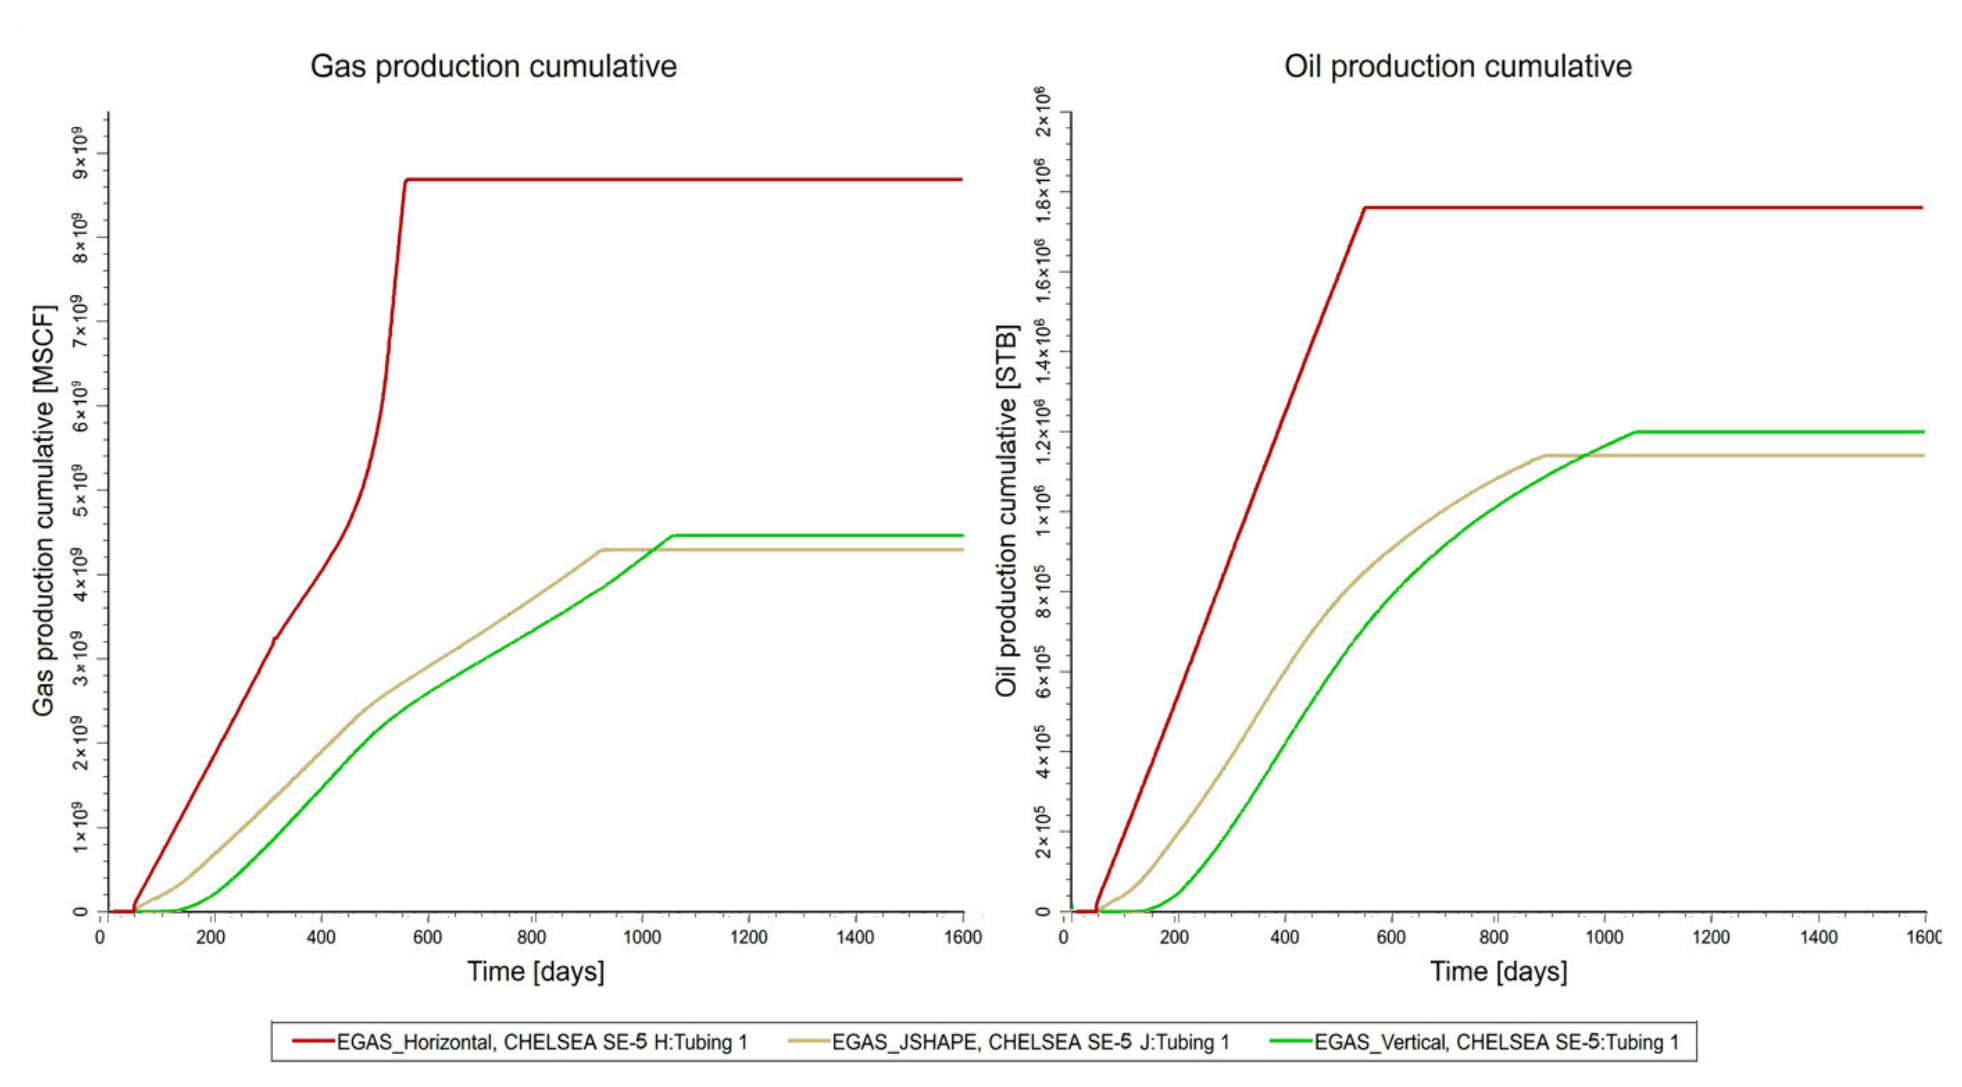
CHELSEA SE-5 showed the opposite behavior. The 300-ft horizontal configuration produced 1.55 MMSTB of oil and 8.7 BSCF of gas, compared with 1.10 MMSTB and 4.3 BSCF for the vertical reference, corresponding to increases of approximately 40.9% in oil and 102.3% in gas. The J-shaped case did not materially improve on the vertical response (1.00 MMSTB and 4.2 BSCF) despite increasing modeled contact from 80 to 125 ft, indicating that the incremental 45 ft of contact intersected cells of limited additional value (Figure 9).
Figure 9.
Cumulative gas and oil production profiles for vertical, J-shaped, and horizontal trajectories in CHELSEA SE-5.
At this location, the horizontal completion intersected cells of markedly higher modeled porosity and lower water saturation (Table 2, Table 3, Table 4 and Table 5), and the additional contact translated into higher simulated cumulative production. The horizontal case therefore provided a clear cumulative-production advantage, although its relative drilling-cost index of 1.42 was the highest among the SE-5 scenarios. Implementation would consequently require a separate economic assessment to establish whether the incremental recovery justifies the additional capital and operational risk. Because the SE-5 horizontal configuration was not implemented, this result should be interpreted as a simulation-based screening outcome rather than a field-confirmed recommendation.
Table 3.
Preferred trajectory at each evaluated well location.
Table 4.
Directional survey and production test consistency for the selected configurations implemented.
Table 5.
Trajectory-averaged static reservoir properties and dynamic performance indicators used for mechanistic interpretation.
The contrast indicates that geometric exposure alone is insufficient: the additional cells presumably need to be hydrocarbon-bearing, hydraulically connected, and supported by an adequate drainage volume. This interpretation is consistent with published work showing that deviated-well performance in layered heterogeneous reservoirs depends on the properties of the penetrated layers [17] and that connectivity, rather than sand volume alone, controls the volume accessible to a well in channelized reservoirs [18,19].
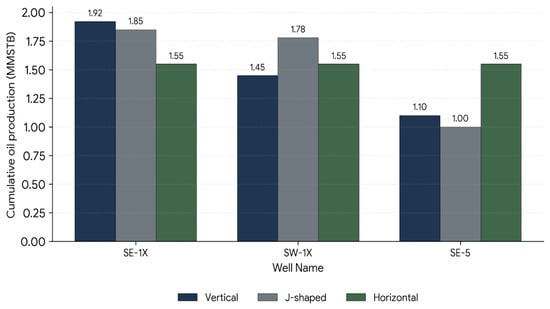
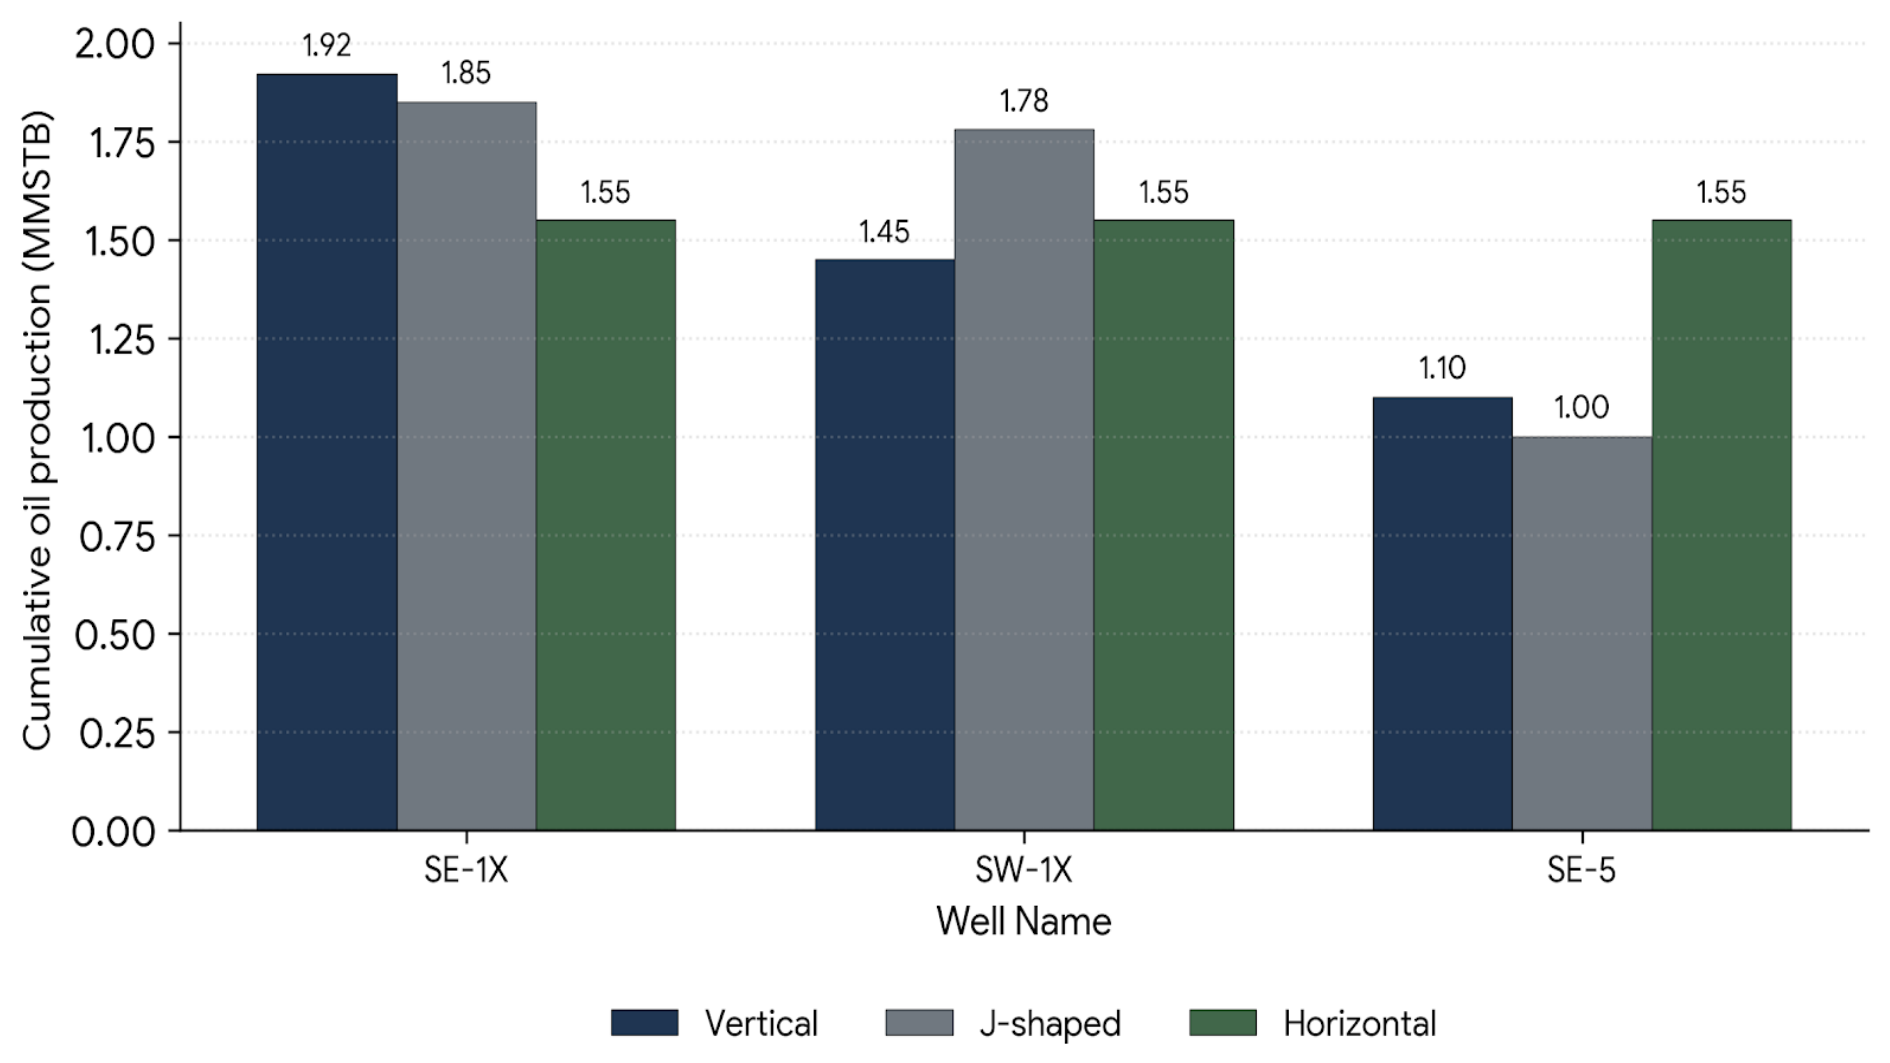
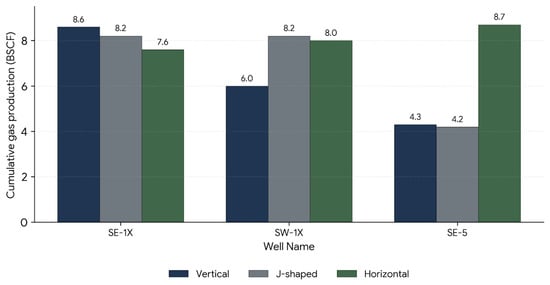
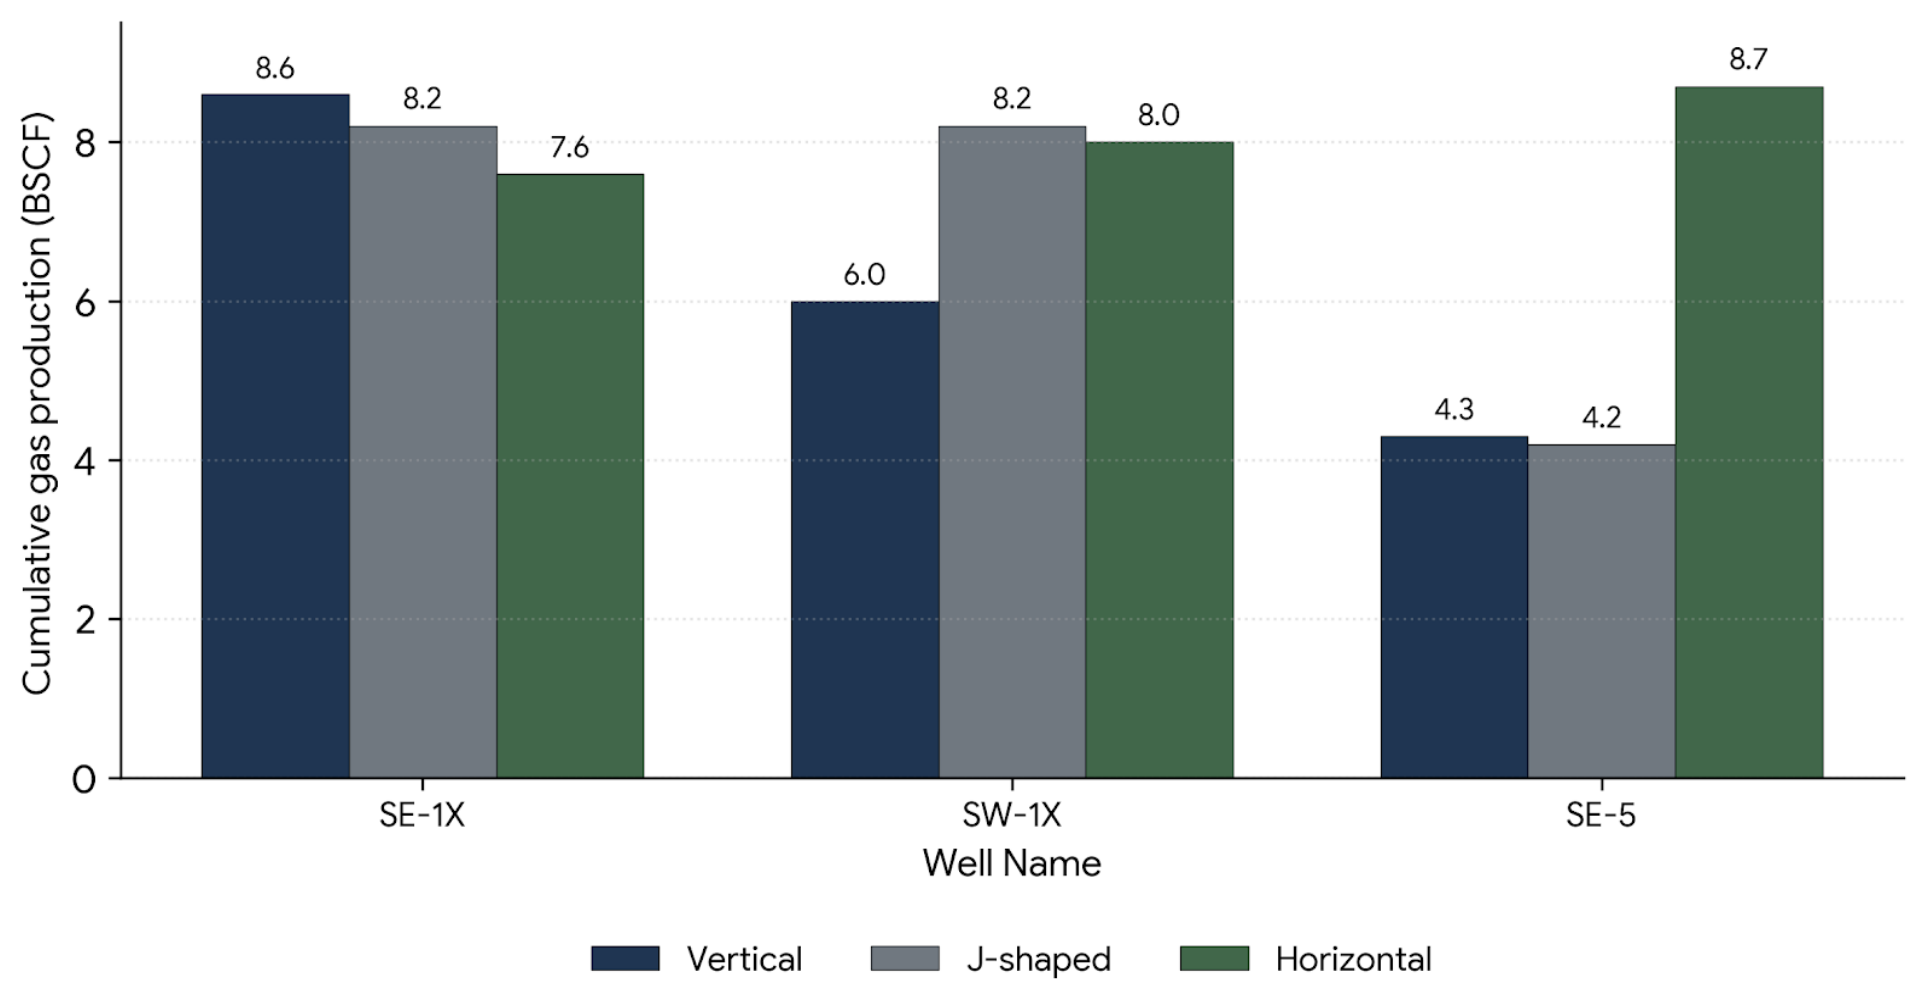
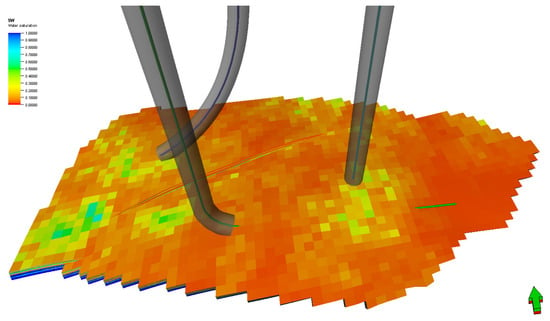
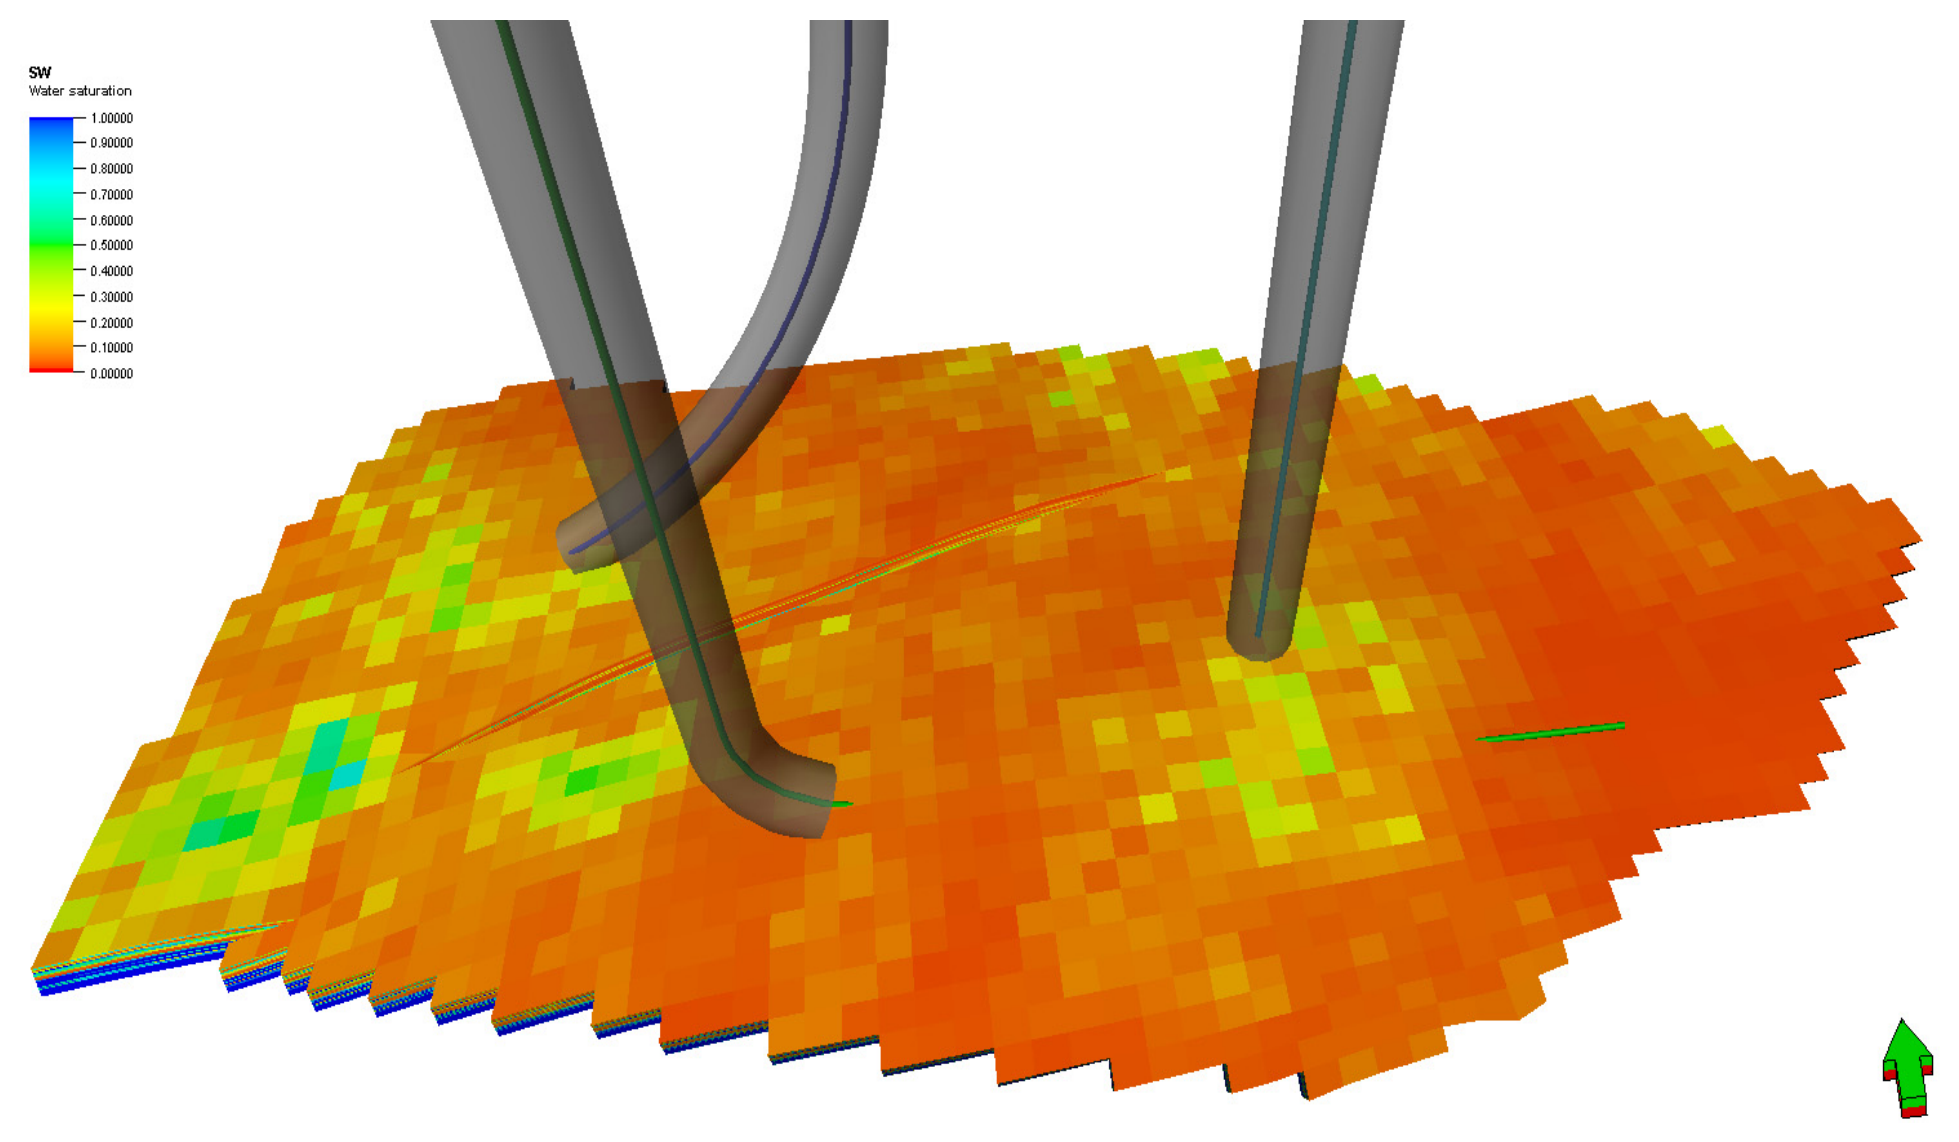
Figure 10 and Figure 11 compare final cumulative oil and gas production across all nine cases. Table 2 gives the numerical results, and Table 3 summarizes the final trajectory selection. Figure 12 places the selected well-specific configurations within the modeled water-saturation distribution and highlights their contrasting local reservoir settings. The preferred trajectory varied by location, showing that, within this realization, no single well architecture was preferred across the Upper Safa interval, even within a single area.
Figure 10.
Final simulated cumulative oil production for the vertical, J-shaped, and horizontal trajectory scenarios at the three evaluated well locations.
Figure 11.
Final simulated cumulative gas production for the vertical, J-shaped, and horizontal trajectory scenarios at the three evaluated well locations.
Figure 12.
Three-dimensional water-saturation (SW) distribution in the Upper Safa reservoir model showing the preferred configuration at each evaluated location: vertical for CHELSEA SE-1X, J-shaped for CHELSEA SW-1X, and horizontal for CHELSEA SE-5. The green arrow refers to the north direction.
3.5. Field Implementation and Production Consistency
The directional survey for CHELSEA SE-1X confirmed a near-vertical geometry, with a maximum recorded inclination of 2.23°. CHELSEA SW-1X followed a J-shaped profile and reached 33.53°, closely matching the 35° represented by the selected simulation case. The implemented geometries were therefore consistent with the configurations favored by the integrated evaluation.
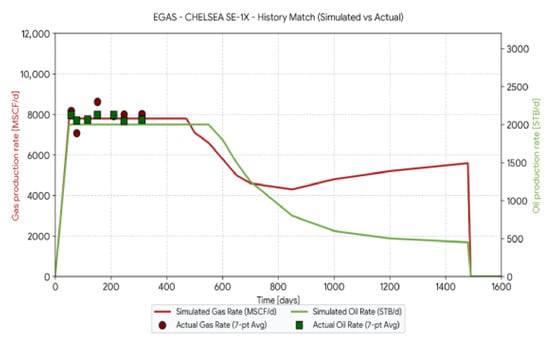
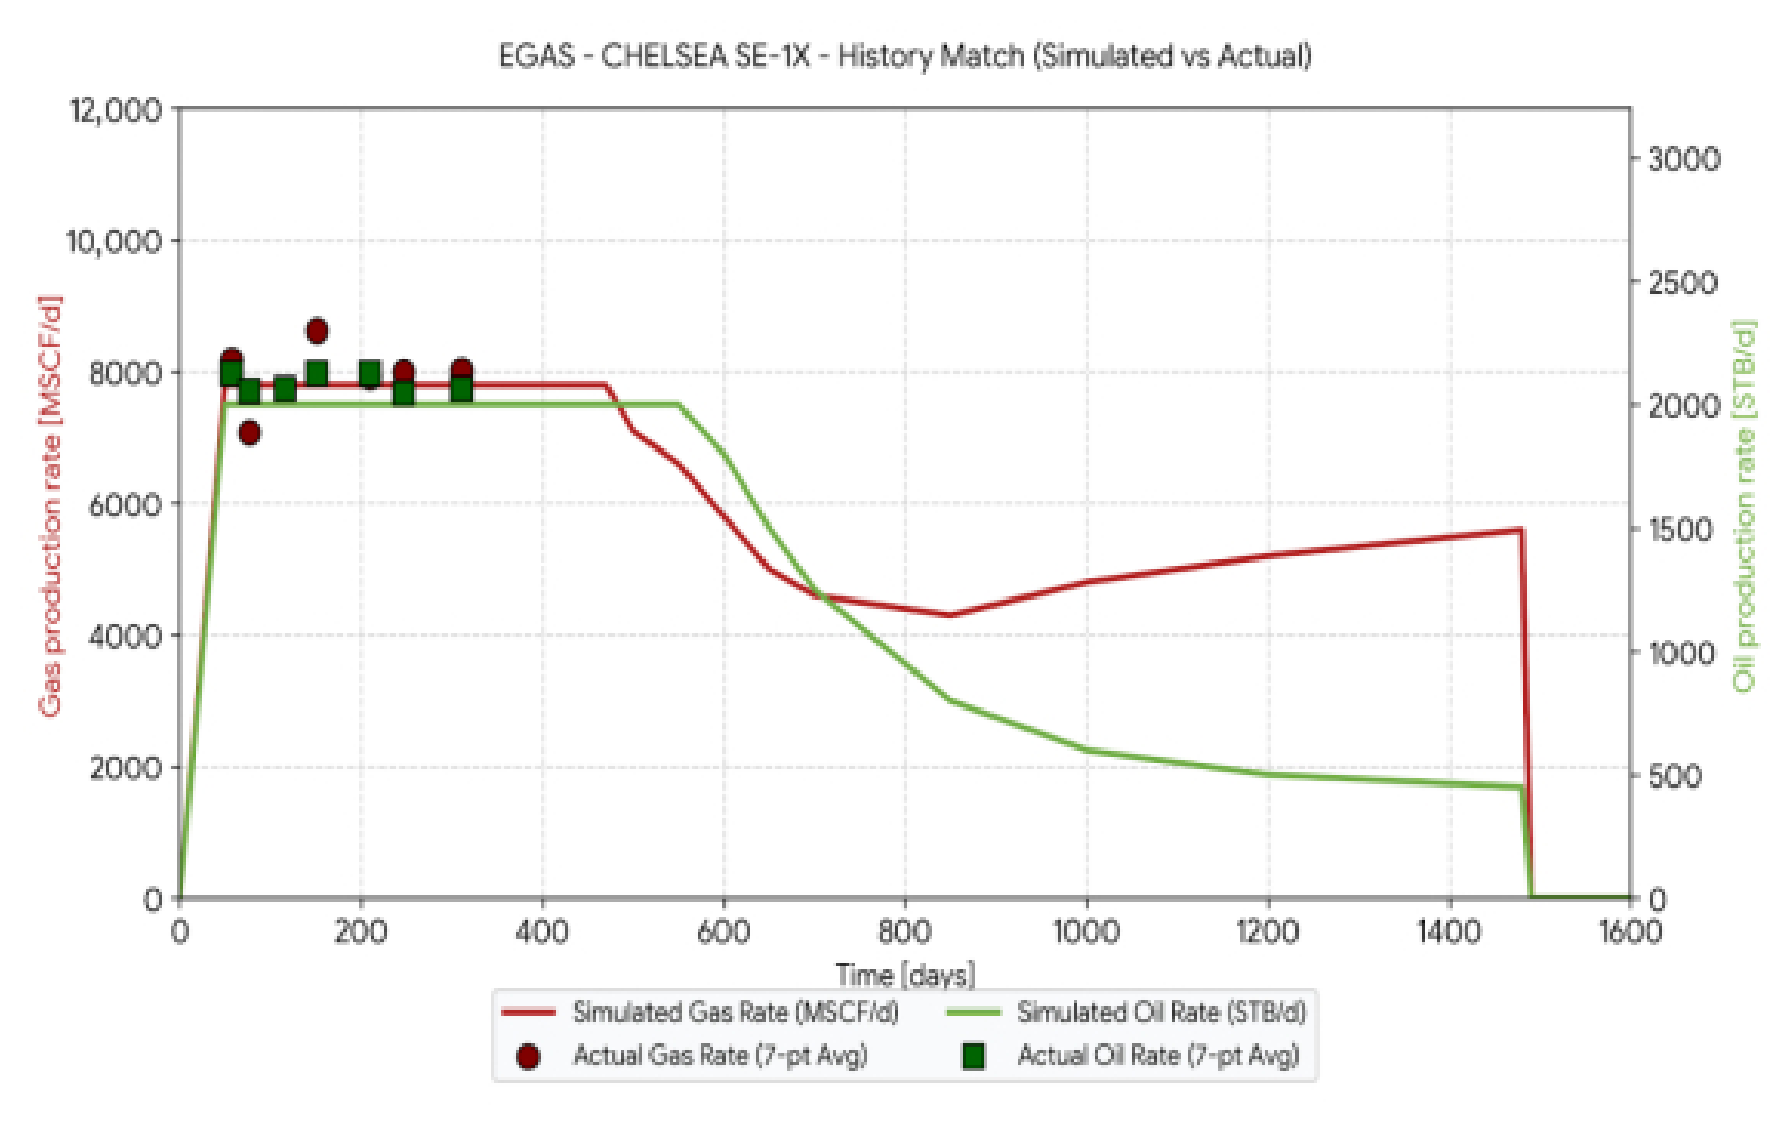
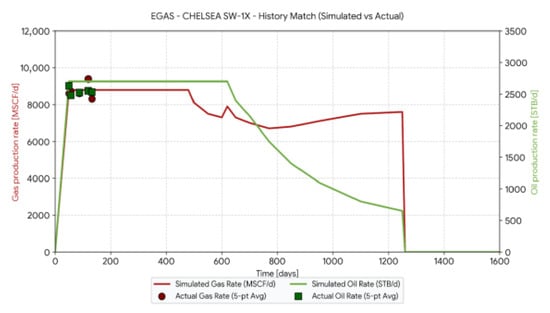
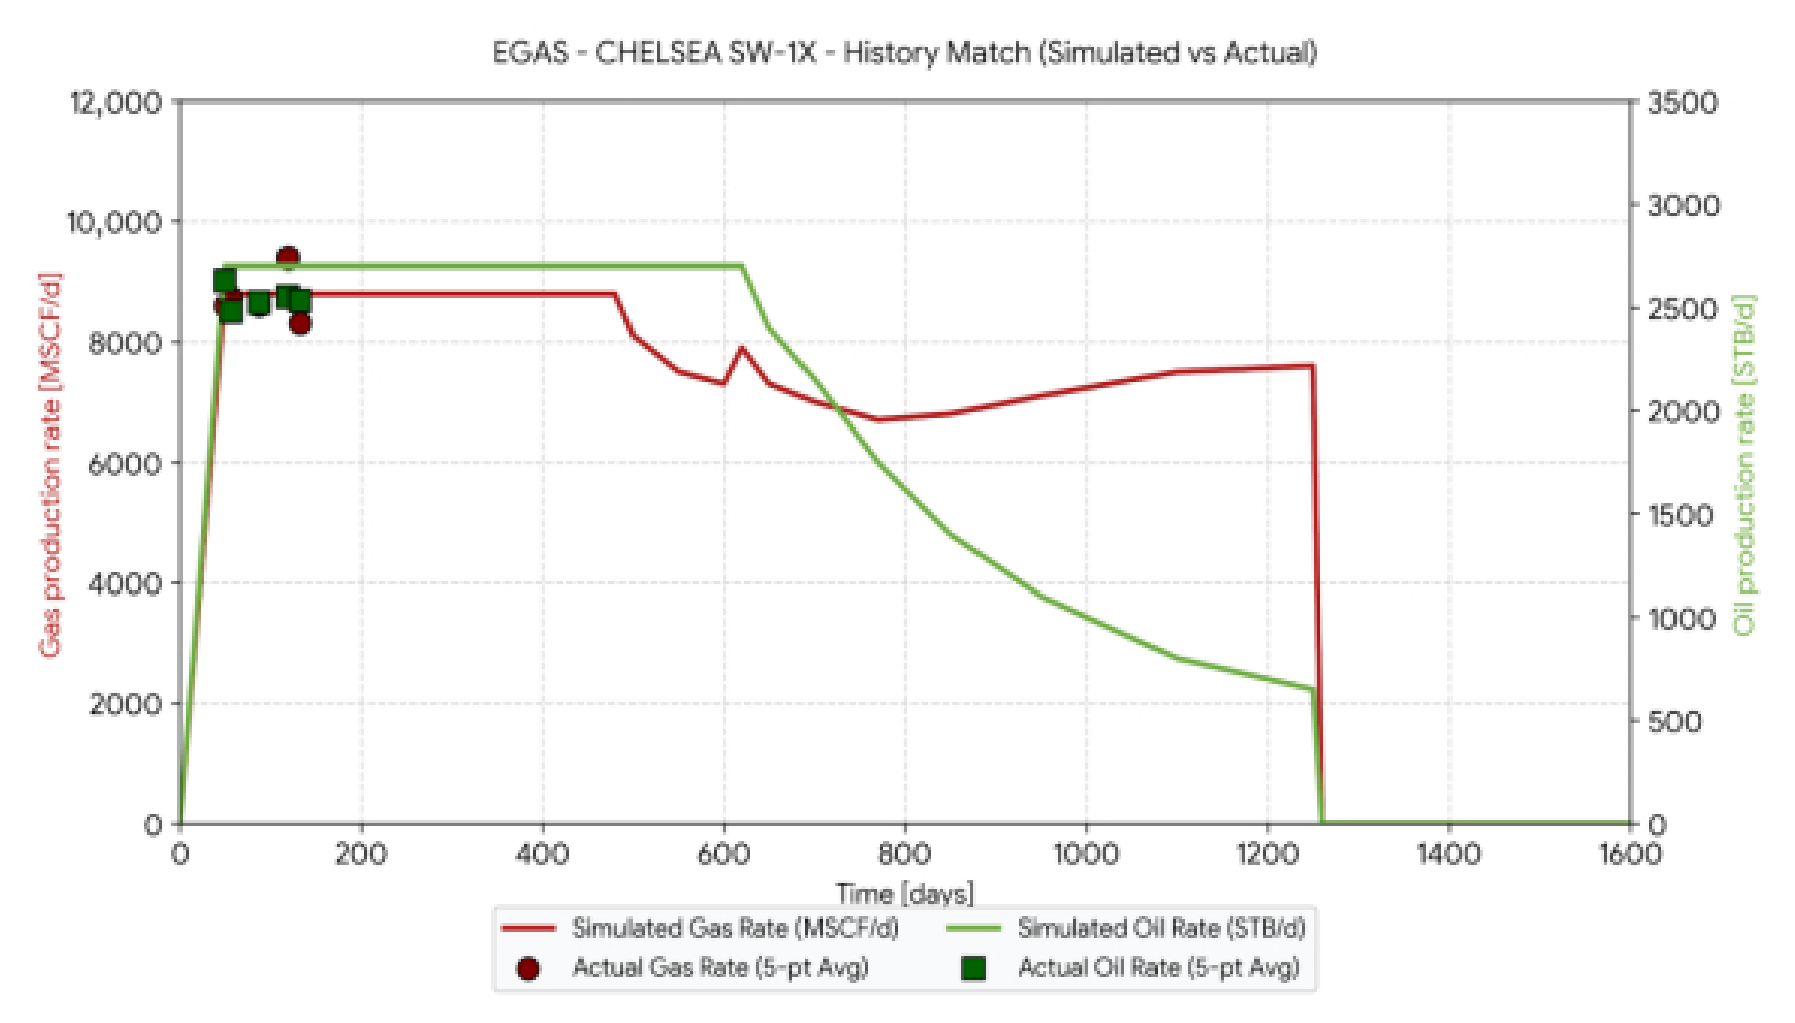
For CHELSEA SE-1X, over the available production-test observation period, the selected vertical case yielded average simulated rates of approximately 2000 BOPD and 7.80 MMSCFD, compared with observed averages of 2179 BOPD and 7.73 MMSCFD (Figure 13). For CHELSEA SW-1X, the selected J-shaped case yielded average simulated rates of approximately 2700 BOPD and 8.80 MMSCFD, compared with observed averages of 2529 BOPD and 8.60 MMSCFD (Figure 14). These averages provide a concise summary of the available production-test observations, while the MAPE values were calculated from individual simulated–observed test pairs. The simulated oil rate was therefore lower than the observed average at SE-1X and higher at SW-1X. All production-test observations fall within the initial constant-rate plateau of the simulated profiles (approximately the first 310 days at SE-1X and 135 days at SW-1X; Figure 13 and Figure 14). The oil-rate comparison therefore mainly tests whether the plateau rate is deliverable and representative of the observed rate, whereas the gas-rate comparison, which depends on the simulated producing gas–oil ratio, is the more informative check on the fluid model. The tests do not constrain the post-plateau decline, the timing of the gas-rate increase, or the end of production, which control the cumulative differences among trajectories.
Figure 13.
Representative comparison between simulated and observed oil and gas production rates for CHELSEA SE-1X. Lines are simulated rates of the selected case; symbols are production-test observations.
Figure 14.
Representative comparison between simulated and observed oil and gas production rates for CHELSEA SW-1X. Lines are simulated rates of the selected case; symbols are production-test observations.
Within the period covered by the available field observations, the simulated rates match the magnitude of the observed oil and gas production rates. For the two wells, the oil-rate MAPE was 7.0–7.9%, and the gas-rate MAPE was 2.3–4.9%. Table 4 reports the average rates; the MAPE values were calculated from the individual test observations. The average rates in Table 4 correspond to observed producing gas–oil ratios of approximately 3550 scf/STB (SE-1X) and 3400 scf/STB (SW-1X) and to simulated ratios of approximately 3900 and 3260 scf/STB, respectively. Ratios of this magnitude lie close to the boundary between volatile oils and retrograde gases [32] and indicate a gas-rich, near-critical fluid, which is relevant to the interpretation developed in Section 4.1.
4. Discussion
4.1. Why Contact Length Is a Weak Predictor of Cumulative Recovery
The central observation of this study is that the trajectory ranking produced by early productivity index does not match the ranking produced by cumulative recovery, and neither follows contact length. At CHELSEA SE-1X, the horizontal case raised the early productivity index by roughly a factor of three relative to the vertical reference (39–46 vs. 12.5–14.8) while reducing cumulative oil by 19.3%. Several factors may contribute to this behavior; they are discussed below and are, in principle, separable by the diagnostics recommended in Section 4.6.
First, the two metrics measure different physical quantities. The productivity index is an instantaneous inflow measure evaluated under essentially undepleted conditions; it scales with near-well flow capacity and the length of the completed interval, and analytical horizontal-well solutions predict the large early uplift observed here [1,2,29]. Cumulative recovery, by contrast, is bounded by the connected, pressure-supported pore volume that the well can access over the forecast period. When that volume is small, a high initial rate is followed by a correspondingly steep decline, and the additional contact accelerates depletion rather than adding incremental reserves.
Second, effective hydraulic communication is a key control on the reservoir volume that can contribute to production, whereas geometric exposure alone does not define that volume. Any part of the reservoir not hydraulically connected to the wellbore cannot be drained, and connectivity in geobody-dominated systems is a strongly non-linear function of net-to-gross, collapsing below a threshold of approximately 30% in three dimensions and at markedly higher net-to-gross where the reservoir behaves two-dimensionally [18,19]. Critically for the present case, well orientation and completed length are themselves recognized as controls on the connected volume accessible from a well [18]. A lateral drilled across, rather than along, discrete sand bodies may add substantial geometric contact while adding little connected volume; a lateral that crosses a sealing fault into an under-pressured compartment may add none at all. The Upper Safa Member, dominated by shale with discrete sandstone bodies [33] and compartmentalized by NE–SW normal step faults [34], is exactly the architecture in which this failure mode is expected. To further examine this interpretation, trajectory-averaged reservoir properties and directional transmissibility components (TRANX, TRANY, and TRANZ) were evaluated and are summarized in Table 5. The additional analysis shows that no individual static or local hydraulic indicator provides a monotonic predictor of long-term recovery across the evaluated trajectories.
At CHELSEA SE-1X, the horizontal trajectory combines substantially greater modeled contact (300 vs. 75 ft), a much higher early productivity index (39–46 vs. 12.5–14.8), higher mean effective porosity (0.1106 vs. 0.0850), markedly lower mean water saturation (0.1525 vs. 0.4201), and slightly higher mean vertical transmissibility (28.46 vs. 27.89) than the vertical case. Based on these local indicators alone, the horizontal trajectory would appear favorable. Nevertheless, cumulative oil recovery decreases from 1.92 to 1.55 MMSTB, and cumulative gas production decreases from 8.6 to 7.6 BSCF. This inversion demonstrates that greater geometric exposure, improved local reservoir quality, and favorable trajectory-averaged transmissibility do not necessarily translate into higher cumulative recovery. Because the 300-ft horizontal completion intersects only about two lateral grid cells, its trajectory averages are dominated by very few cells and should be read as local descriptors rather than as measures of the drained volume. The production profiles (Figure 7) indicate the operative mechanism: the horizontal case sustained a higher plateau rate but reached its producing limit after about 590 days, following a rapid increase in gas production, whereas the vertical case produced for about 1490 days. The low water saturation of the contacted cells (0.15) is consistent with completion in the hydrocarbon-saturated upper part of the interval, where high-rate withdrawal from a near-critical oil promotes earlier gas evolution and breakthrough.
CHELSEA SW-1X provides a second and more nuanced example. Moving from the vertical to the J-shaped trajectory increases mean TRANZ from 19.83 to 24.37, approximately 22.9%, while cumulative oil recovery increases from 1.45 to 1.78 MMSTB, approximately 22.8%. Extending the trajectory further to a 400-ft horizontal section, however, does not provide an additional cumulative-oil benefit. Relative to the J-shaped case, the horizontal configuration has substantially greater modeled contact (400 vs. 115 ft), approximately twice the early productivity index (44–52 vs. 21.3–24.8), slightly higher mean TRANZ (24.88 vs. 24.37), lower mean water saturation (0.4399 vs. 0.4598), and higher mean effective porosity (0.0710 vs. 0.0643). Despite these apparently favorable indicators, cumulative oil recovery decreases to 1.55 MMSTB, so the J-shaped trajectory produces about 14.8% more cumulative oil. The additional lateral exposure therefore increases near-well inflow capacity without producing a proportional increase in sustained cumulative recovery. CHELSEA SE-5 provides the complementary case in which extended lateral exposure does translate into a substantial cumulative benefit. The horizontal trajectory does not exhibit the highest mean vertical transmissibility; its mean TRANZ is 31.25 compared with 32.34 for the vertical trajectory and 34.68 for the J-shaped trajectory. Instead, the horizontal path intersects a markedly more favorable reservoir-quality interval, with mean effective porosity of 0.1271 compared with 0.0732 and 0.0768 for the vertical and J-shaped cases, respectively, and mean water saturation of only 0.1706 compared with 0.5018 and 0.5325. Under these conditions, the horizontal trajectory produces 1.55 MMSTB of cumulative oil and 8.7 BSCF of cumulative gas, substantially exceeding the response of both shorter alternatives. Taken together, these mechanisms explain the contrasting trajectory responses. The 300-ft horizontal section that underperformed at SE-1X produced a 40.9% oil and 102.3% gas uplift at SE-5, reinforcing that trajectory value depends on placement, reservoir quality, hydraulic communication, and dynamically accessible reservoir volume rather than geometry alone.
Two further effects reported for horizontal wells should be considered when applying the results in the field, although they are not expected to explain the simulated differences. Frictional pressure losses along a horizontal section redistribute inflow toward the heel and can limit the benefit of lateral extension in long, high-rate wells [4,5]; this effect was not represented in the present well model and would in any case be small for completions of 300–400 ft. In a gas-rich system, the drawdown that generates a high early productivity index also promotes unwanted-phase influx. The producing gas–oil ratios implied by Table 4 (roughly 3400–3900 scf/STB) place these wells in a regime where gas-cut evolution materially affects the oil rate that can be sustained. Gas or water coning can also reduce the sustained oil rate; horizontal wells generally permit higher critical rates than vertical wells in both isotropic and anisotropic formations [35], but coning is relevant only where a gas cap or an aquifer is present. In a volatile-oil system, the rise in producing gas–oil ratio once the pressure falls below the bubble point may also reduce the oil rate at high drawdown [32].
Taken together, these mechanisms explain why the SE-5 result is confirmatory, not anomalous. Where the contacted interval is genuinely connected and pressure-supported, the same 300 ft of lateral that under-performed at SE-1X delivered a 40.9% oil and 102.3% gas uplift at SE-5. These contrasting responses therefore support the interpretation that trajectory performance depends not simply on geometric contact, but on reservoir quality, hydraulic communication, and the dynamically accessible, pressure-supported reservoir volume associated with well placement.
4.2. Comparison with Published Trajectory-Selection Studies
Comparing these results with the published literature clarifies what aligns with prior work and what this study adds. Table 6 summarizes the comparison.
Table 6.
Position of the present study relative to published trajectory-evaluation and well-performance work.
The direction of the SE-5 result agrees with the general finding that increased reservoir contact improves recovery where vertical and lateral communication is good [1,17].
The SE-1X and SW-1X results, however, agree with a smaller but long-standing body of work showing that long horizontal wells in strongly heterogeneous reservoirs do not guarantee improved recovery, because the degree and spatial structure of the heterogeneity, not the length of the well, govern displacement and drainage efficiency [6,11].
The SW-1X outcome—an intermediate, moderately deviated path outperforming both the vertical reference and the longer horizontal alternative—is directly anticipated by classical analytical results: in thicker intervals with vertical permeability below horizontal permeability, a slant well can outperform a horizontal well of comparable exposure [1,2]. The optimum at one of three closely spaced locations is therefore a physically expected outcome rather than a modeling artifact.
The present results are consistent with two established trends in the literature. Where reservoir communication is favorable, increased contact can improve cumulative recovery, as observed at SE-5 [6]. Conversely, in heterogeneous or anisotropic systems, longer horizontal exposure does not necessarily improve recovery, and an intermediate slant trajectory may outperform a longer horizontal well, consistent with the SW-1X result [1,2,18,19].
The methodological distinction of the present study is that simulated cumulative reservoir response is evaluated together with relative drilling burden under a controlled reservoir realization. This complements trajectory-optimization studies focused primarily on drilling difficulty, torque, length, or operational risk [15,36,37,38], while retaining the reservoir-response component emphasized in simulation-based optimization studies [26,27].
A further point of agreement with the literature concerns orientation. Reported waterflood studies show that a well’s position and orientation relative to connected flow units affect drainage effectiveness independently of well length [39], and connectivity modeling indicates that the connected volume depends on well configuration [18]. The present results extend that finding from a waterflood context to primary-depletion trajectory screening.
4.3. Regional Context: The Upper Safa Reservoir
The location-specific outcome reported here is consistent with what is known regionally of the Upper Safa Member. Basin-scale characterization of the Khatatba Formation in the Matruh–Shushan Basin reports Upper Safa effective porosity of 10–18%, shale volume of 15–24%, and water saturation of 18–53%, with a compartmentalized structural framework of NE–SW-trending normal step faults producing horst blocks that are favorable but discrete traps [34]. The trajectory-averaged effective porosity of the completed cells in the present model (0.06–0.13; Table 5) lies mostly at or below the lower end of this regional range, indicating that the completed cells sample the tighter part of the regional distribution, partly because trajectory averages include low-porosity, shale-rich cells. By contrast, the water saturations of the horizontal completions at SE-1X and SE-5 (0.15–0.17; Table 5) lie at or below the lower bound of the regional range, consistent with placement in the most hydrocarbon-saturated part of the interval. Lithologically, the Upper Safa Member is dominated by shale with subordinate sandstone bodies and thin limestone stringers [33], and hydraulic flow-unit analysis within a single Khatatba field demonstrates substantial well-to-well variability in the pore-throat characteristics that control deliverability [40]. Comparable heterogeneity has been documented for other Western Desert reservoirs modeled in three dimensions [41].
Two implications follow. First, a shale-dominated interval with discrete sand bodies likely sits in the sensitive part of the net-to-gross–connectivity relationship, where small changes in net-to-gross or sand-body stacking produce large changes in connected volume [18,19]. Trajectory performance over such an interval should be expected to vary among wells, as observed. Second, where fault-bounded compartments or individual sand bodies have lateral dimensions of a few hundred feet, a 300–400 ft lateral may be long enough to cross a compartment or sand-body boundary. The practical corollary for the West Kanayes area is that lateral length should be planned against the mapped fault framework and sand-body dimensions at each location, not a field-wide default.
4.4. Drilling Complexity as a Co-Equal Selection Criterion
The relative drilling-cost indices (1.10–1.43) are plausible for the conventional single-lateral designs evaluated here but should be interpreted only as comparative screening metrics. They reflect differences in drilling scope, measured depth, directional-control requirements, and expected drilling time but exclude completion and stimulation costs, non-productive-time risk, sidetrack contingency, and intervention exposure. Increasing inclination and lateral extent also increases operational challenges related to torque and drag, hole cleaning, casing deployment, and directional control [42,43].
The interaction between recovery and drilling burden differs by location. At CHELSEA SE-1X, the vertical case provides both the highest cumulative recovery and the lowest relative cost, so no economic trade-off arises. At CHELSEA SW-1X, the J-shaped trajectory produces 14.8% more oil than the horizontal alternative at an approximately 17% lower relative cost index, thereby dominating the horizontal case. CHELSEA SE-5 is the only location with a genuine trade-off: the horizontal trajectory provides the highest simulated recovery but also the highest relative drilling cost. Normalized by the within-location cost index, the SE-5 horizontal and vertical cases yield nearly identical cumulative oil per unit relative cost (1.09 and 1.10 MMSTB), whereas the horizontal case is clearly superior on an oil-equivalent basis (2.11 vs. 1.82 MMBOE per unit cost index). The SE-5 decision is therefore sensitive to the value assigned to the incremental gas and to the available gas-handling capacity. Because this case remains simulation-based, its incremental recovery should ultimately be evaluated against incremental cost through a full economic assessment before implementation.
4.5. A Screening Hierarchy for Trajectory Selection
The results support a four-stage screening hierarchy that can be applied during well planning before any detailed economic evaluation is commissioned:
(i) Placement. The candidate path must intersect cells with adequate reservoir quality, assessed by effective porosity, permeability, and hydrocarbon saturation.
(ii) Connectivity. The contacted cells must communicate with a sufficient, pressure-supported drainage volume. Directional transmissibility, mapped fault geometry, and sand-body dimensions should be examined at the scale of the proposed lateral, not at field scale.
(iii) Cumulative response. Candidate paths must be ranked by simulated cumulative recovery over a common forecast endpoint, not by early productivity index or contact length, both of which ranked the trajectories differently from cumulative recovery in this study.
(iv) Complexity and cost. The cumulative gain must be weighed against the incremental drilling burden. Where a shorter path is not dominated in recovery, it should be preferred.
Applied to the present dataset, this hierarchy yields a different preferred configuration at each location. Horizontal drilling is favored only where additional contact produces a sustained simulated recovery advantage, as at SE-5; otherwise, vertical or moderately deviated trajectories provide a stronger production-to-complexity balance. The hierarchy should therefore be applied per location rather than per field.
4.6. Limitations and Recommendations for Future Work
Several limitations bound the confidence that should be attached to these results. The comparisons used a single field-consistent reservoir realization and therefore do not quantify geological uncertainty. Because hydraulic connectivity is an important component of the mechanistic interpretation and remains among the less well-constrained properties of the static model, the trajectory ranking could change under alternative geological realizations. Repeating the nine-case comparison across an ensemble of realizations and ranking trajectories on expected cumulative recovery, together with its dispersion, would substantially strengthen the conclusions [44,45]. A recommended intermediate step, considerably cheaper than a full ensemble study, is a targeted sensitivity on kv/kh and on the transmissibility multipliers of the interpreted faults, since these two parameters carry most of the mechanistic weight in Section 4.1.
The trajectory rankings also reflect the common operating constraints and forecast settings adopted for the controlled comparisons (Section 2.4). As the cases cease production at different times, cumulative production reflects both reservoir response and production timing. Evaluating alternative operating strategies would therefore provide additional insight into the robustness of the rankings.
The consistent corner-point grid and well-index formulation provide a common numerical basis for all nine scenarios. At CHELSEA SE-1X and CHELSEA SW-1X, the cumulative-production rankings are interpreted alongside reservoir-quality and connectivity diagnostics (Table 5), while the selected configurations show reasonable agreement with available production tests (oil-rate MAPE 7.0–7.9%; Section 3.5). Nevertheless, these comparisons do not establish grid independence, particularly as the 91–122 m horizontal completions span approximately two to three lateral grid cells. Future work could incorporate targeted local grid refinement (LGR) around completed well connections, with consistent well-index calculations, to assess the sensitivity of cumulative production and trajectory rankings to spatial resolution [25]. The coarse vertical resolution (ΔZ = 3.81 m) may also smear the saturation and pressure fronts that control the timing of gas breakthrough to the horizontal completions, which is the event that ended production in those cases (Figure 7, Figure 8 and Figure 9); this is an additional reason to test the rankings with refined near-well grids.
The uniform wellbore radius and zero-skin assumption were adopted to isolate trajectory effects, although near-wellbore damage may vary under actual completion conditions [46]. The illustrative Peaceman analysis (Section 2.3.2) indicates normalized horizontal well indices of 1.000, 0.677, and 0.456 for S = 0, +2, and +5, respectively. At CHELSEA SE-5, the baseline horizontal-to-vertical early-PI ratio is approximately 2.97 (Table 2). Assuming positive skin affects only the horizontal completion, this ratio decreases to approximately 2.01 and 1.35 at S = +2 and +5, respectively, reaching unity at approximately S = 8.3. If the vertical completion is assigned the same skin, the ratio remains approximately 2.90 at S = +2 and 2.85 at S = +5 (Section 2.3.2). These analytical estimates suggest that moderate positive skin would not eliminate the horizontal well’s early-inflow advantage under the stated assumptions. However, confirming its influence on cumulative recovery would require trajectory-specific dynamic sensitivity simulations.
The relative drilling-cost index is a screening indicator and not a discounted economic model. It should not be used to justify implementation at CHELSEA SE-5 without a net present value analysis that incorporates revenue, operating expenditure, fiscal terms, and completion costs. The production comparison rests on a small number of discrete test observations rather than a continuous validation dataset, and MAPE is an asymmetric metric that is unstable for small observed values. The reported agreement should be read as a consistency check on the selected cases, not as evidence that the long-term forecast is validated. In addition, all test observations fall within the simulated constant-rate plateau, so they do not test the post-plateau decline or the gas-breakthrough timing that determines the cumulative ranking. The favorable CHELSEA SE-5 horizontal case was not implemented and therefore lacks field confirmation; it remains the least-tested of the three recommendations. Finally, the study does not directly quantify connected hydrocarbon pore volume (HCPV). Future work should calculate trajectory-specific connected HCPV from the static model and test its correlation with simulated cumulative recovery. If successful, this could provide a useful pre-simulation screening proxy for dynamically favorable trajectory placement [19,47].
Future research can extend the present study by evaluating a wider range of trajectory geometries and additional well locations to examine the applicability of the observed production trends under different reservoir and well-placement conditions. Future work can also add detail to completion design and well-control parameters to investigate their effect on production response across trajectory configurations. In addition, the relative drilling-cost index used in this study can be extended to a full discounted economic evaluation that incorporates capital expenditure, operating costs, production revenues, and relevant economic assumptions. Such extensions would provide a broader basis for trajectory evaluation while retaining the reservoir-dependent approach adopted in the present study.
5. Conclusions
A controlled Petrel–ECLIPSE workflow was used to compare vertical, J-shaped, and horizontal trajectories at three locations in the Upper Safa reservoir in the Western Desert, Egypt, while holding the reservoir realization, target interval, operating constraints, and forecast settings fixed. The results support the following conclusions.
1. Modeled contact length and early productivity index were not sufficient, when considered alone, to predict cumulative recovery. The horizontal cases produced the highest early productivity index at all three locations but achieved the highest cumulative recovery only at CHELSEA SE-5.
2. Trajectory performance was strongly location-dependent. The highest-ranked configuration differed among the three evaluated locations: vertical at CHELSEA SE-1X, J-shaped at CHELSEA SW-1X, and horizontal at CHELSEA SE-5. Within this realization, no single trajectory geometry was preferred across the evaluated part of the Upper Safa reservoir. Because the SE-5 horizontal case was not drilled, its ranking remains a simulation-based result.
3. The SE-1X vertical case delivered 1.92 MMSTB of oil and 8.6 BSCF of gas at the lowest relative drilling burden, and additional deviation reduced cumulative recovery at this location. The SW-1X J-shaped case delivered 1.78 MMSTB and 8.2 BSCF, providing the best balance of reservoir response and drilling complexity and dominating the horizontal alternative on both axes. The SE-5 horizontal case delivered 1.55 MMSTB and 8.7 BSCF in simulation, indicating that additional contact was valuable where the contacted cells were of higher modeled quality.
4. Directional surveys and discrete production tests for the implemented SE-1X and SW-1X configurations were consistent with the selected cases within the available data, with oil-rate MAPE of 7.0–7.9% and gas-rate MAPE of 2.3–4.9%.
5. Trajectory alternatives should therefore be screened, per location rather than per field, on the basis of placement quality, connectivity, simulated cumulative response, and relative drilling burden in that order, with a full economic evaluation reserved for the cases in which the highest-recovery option is also the most expensive.
Author Contributions
Conceptualization, A.G.M. and S.K.; methodology, A.G.M. and M.F.; software, A.G.M. and F.S.R.; validation, A.G.M., S.K. and A.Z.N.; formal analysis, A.G.M. and M.F.; investigation, A.G.M.; resources, A.G.M. and F.S.R.; data curation, A.G.M.; writing—original draft preparation, A.G.M.; writing—review and editing, S.K., A.Z.N., F.S.R. and M.F.; visualization, A.G.M. and M.F.; supervision, S.K. and A.Z.N.; project administration, S.K. All authors have read and agreed to the published version of the manuscript.
Funding
The authors did not receive support from any organization for this work.
Institutional Review Board Statement
Not applicable.
Informed Consent Statement
Not applicable.
Data Availability Statement
Processed data supporting the findings of this study are available from the corresponding author upon reasonable request, subject to applicable data-access limitations.
Acknowledgments
The authors acknowledge the academic and technical support received during completion of the associated M.Sc. study and thank the operator for permission to use the field dataset.
Conflicts of Interest
Author Abdelrahman Galal Metwally is employed by the company Drilling and Workover Supervisor, Khalda Petroleum Company (Apache), Cairo 11431, Egypt. The remaining authors declare that the research was conducted in the absence of any potential or financial relationship that could be constructed as a potential conflict of interest.
Abbreviations
The following abbreviations are used in this manuscript:
| Abbreviation | Definition |
| AFE | Authorization for expenditure |
| BHP | Bottom-hole pressure, psia |
| BOPD | Barrels of oil per day |
| BSCF | Billion standard cubic feet |
| ECLIPSE | Dynamic reservoir-simulation software |
| GOR | Gas–oil ratio, scf/STB |
| HCPV | Hydrocarbon pore volume |
| kh, kv | Horizontal and vertical permeability, mD |
| MAPE | Mean absolute percentage error, % |
| MD | Measured depth, ft |
| MMSCFD | Million standard cubic feet per day |
| MMSTB | Million stock-tank barrels |
| n | Number of observations |
| NTG | Net-to-gross ratio, fraction |
| PHIE | Effective porosity, fraction |
| PI | Productivity index |
| qobs,i/qsim,i | Observed/simulated production rate at observation i |
| SW | Water saturation, fraction |
| Swc | Connate water saturation, fraction |
| TVD | True vertical depth, ft |
| TRANX, TRANY, TRANZ | Grid-cell transmissibility in the x, y, and z directions |
| UGS | Underground gas storage |
| Unit conversions | 1 ft = 0.3048 m; 1 STB = 0.158987 m3; 1 standard ft3 = 0.0283168 m3 |
References
- Joshi, S.D. Augmentation of well productivity with slant and horizontal wells. J. Pet. Technol. 1988, 40, 729–739. [Google Scholar] [CrossRef] [Scilit]
- Babu, D.K.; Odeh, A.S. Productivity of a horizontal well. SPE Reserv. Eng. 1989, 4, 417–421. [Google Scholar] [CrossRef] [Scilit]
- Ozkan, E.; Raghavan, R.; Joshi, S.D. Horizontal-well pressure analysis. SPE Form. Eval. 1989, 4, 567–575. [Google Scholar] [CrossRef] [Scilit]
- Dikken, B.J. Pressure drop in horizontal wells and its effect on production performance. J. Pet. Technol. 1990, 42, 1426–1433. [Google Scholar] [CrossRef] [Scilit]
- Cheng, Z.; Liu, J.; Zhang, L.; Zuo, K.; Liu, C.; Hao, Z.; Ding, X. Study on coupling model of reservoir seepage dynamic and horizontal wellbore flow. Front. Energy Res. 2025, 13, 1542360. [Google Scholar] [CrossRef] [Scilit]
- Naderi, M.; Rostami, B.; Khosravi, M. Effect of heterogeneity on the productivity of vertical, deviated and horizontal wells in water drive gas reservoirs. J. Nat. Gas Sci. Eng. 2015, 23, 481–491. [Google Scholar] [CrossRef] [Scilit]
- Du, A.; Wen, M.; Yang, J. Transient Multiphase Study on the Influence of Well Trajectory on Horizontal Shale Gas Production. Fluid Dyn. Mater. Process. 2025, 21, 939–957. [Google Scholar] [CrossRef] [Scilit]
- Jiang, Y.; Zhou, J.; Zhang, J.; Guo, Z.; Liu, D.; Li, X.; Gao, J. Trajectory optimization of ultra-short sidetrack horizontal wells in marginal reservoirs. Front. Earth Sci. 2025, 13, 1533309. [Google Scholar] [CrossRef] [Scilit]
- Seryakov, A.V.; Podberezhny, M.Y. Estimation of the fishbone optimal orientation for a Yamalo-Nenets Autonomous District oilfield. Georesursy 2023, 25, 130–139. [Google Scholar] [CrossRef] [Scilit]
- Almalikee, H.S.; Al-Najm, F.M. Optimization of Deviated and Horizontal Wells Trajectories and Profiles in Rumaila Oilfield. J. Pet. Res. Stud. 2020, 10, 36–53. [Google Scholar] [CrossRef] [Scilit]
- Su, Y.C.; Shi, H.F.; He, Y.F. A new method to calculate sweep efficiency of horizontal wells in heterogeneous reservoir. J. Pet. Explor. Prod. Technol. 2019, 9, 2019–2026. [Google Scholar] [CrossRef] [Scilit]
- Yuan, H.; Li, W.; Yuan, Y.; Luo, J.; Yan, W. Productivity evaluation of horizontal well in heterogeneous reservoir with composite water aquifer. J. Pet. Explor. Prod. Technol. 2021, 11, 1363–1373. [Google Scholar] [CrossRef] [Scilit]
- Yousefzadeh, R.; Sharifi, M.; Karkevandi-Talkhooncheh, A.; Ahmadi, H.; Farasat, A.; Ahmadi, M. Application of fast marching method and quality map to well trajectory optimization with a novel well parametrization. Geoenergy Sci. Eng. 2023, 231, 212301. [Google Scholar] [CrossRef] [Scilit]
- Manshad, A.K.; Dastgerdi, M.E.; Ali, J.A.; Mafakheri, N.; Keshavarz, A.; Iglauer, S.; Mohammadi, A.H. Economic and productivity evaluation of different horizontal drilling scenarios: Middle East oil fields as case study. J. Pet. Explor. Prod. Technol. 2019, 9, 2449–2460. [Google Scholar] [CrossRef] [Scilit]
- Yang, W.; Zeng, Y.; Xiao, X.; Wu, Q.; Kai, P. Wellbore-trajectory optimization design and application for short-radius horizontal wells based on the length minimization principle. Geomech. Geophys. Geo-Energy Geo-Resour. 2026, 12, 71. [Google Scholar] [CrossRef] [Scilit]
- Krivoshchekov, S.N.; Kochnev, A.A.; Ozhgibesov, E.S.; Shirinkin, D.O.; Yuzhakov, A.L. Hydrodynamic Modeling of Complex Carbonate Reservoirs Considering Facies Zonality. Georesursy 2025, 27, 235–245. [Google Scholar] [CrossRef] [Scilit]
- Guo, J.; Ning, B.; Yan, H.; Jia, C.; Li, Y. Production performance analysis for deviated wells in carbonate gas reservoirs with multiple heterogeneous layers. Front. Energy Res. 2022, 10, 861780. [Google Scholar] [CrossRef] [Scilit]
- Larue, D.K.; Hovadik, J. Connectivity of channelized reservoirs: A modelling approach. Pet. Geosci. 2006, 12, 291–308. [Google Scholar] [CrossRef] [Scilit]
- Hovadik, J.M.; Larue, D.K. Stratigraphic and structural connectivity. In Reservoir Compartmentalization; Jolley, S.J., Fisher, Q.J., Ainsworth, R.B., Vrolijk, P.J., Delisle, S., Eds.; Geological Society, London, Special Publications: London, UK, 2010; Volume 347, pp. 219–242. [Google Scholar] [CrossRef] [Scilit]
- Zargar, Z.; Thakur, G.C. Importance of reservoir simulation and early reservoir management for successful field development: Case study. Energy Rep. 2022, 8, 5038–5052. [Google Scholar] [CrossRef] [Scilit]
- Aziz, K.; Settari, A. Petroleum Reservoir Simulation; Applied Science Publishers: London, UK, 1979. [Google Scholar]
- Craig, F.F., Jr. The Reservoir Engineering Aspects of Waterflooding; SPE Monograph Series, Volume 3; Society of Petroleum Engineers: Richardson, TX, USA, 1971. [Google Scholar]
- Mirzaei-Paiaman, A. New methods for qualitative and quantitative determination of wettability from relative permeability curves: Revisiting Craig’s rules of thumb and introducing Lak wettability index. Fuel 2021, 288, 119623. [Google Scholar] [CrossRef] [Scilit]
- Peaceman, D.W. Interpretation of well-block pressures in numerical reservoir simulation. Soc. Pet. Eng. J. 1978, 18, 183–194. [Google Scholar] [CrossRef] [Scilit]
- Peaceman, D.W. Interpretation of well-block pressures in numerical reservoir simulation with nonsquare grid blocks and anisotropic permeability. Soc. Pet. Eng. J. 1983, 23, 531–543. [Google Scholar] [CrossRef] [Scilit]
- Barros, E.G.D.; Szklarz, S.P.; Khoshnevis Gargar, N.; Wollenweber, J.; van Wees, J.D. Optimization of well locations and trajectories: Comparing sub-vertical, sub-horizontal and multi-lateral well concepts for a marginal geothermal reservoir in the Netherlands. Energies 2025, 18, 627. [Google Scholar] [CrossRef] [Scilit]
- Janiga, D.; Wojnarowski, P. A multi-well trajectory optimization framework for maximizing underground gas storage performance and minimizing total drilling length. Energies 2026, 19, 1450. [Google Scholar] [CrossRef] [Scilit]
- Ertekin, T.; Abou-Kassem, J.H.; King, G.R. Basic Applied Reservoir Simulation; Society of Petroleum Engineers: Richardson, TX, USA, 2001. [Google Scholar]
- Ahmed, T. Reservoir Engineering Handbook, 4th ed.; Gulf Professional Publishing: Burlington, MA, USA, 2010. [Google Scholar]
- Hyndman, R.J.; Koehler, A.B. Another look at measures of forecast accuracy. Int. J. Forecast. 2006, 22, 679–688. [Google Scholar] [CrossRef] [Scilit]
- Tofallis, C. A better measure of relative prediction accuracy for model selection and model estimation. J. Oper. Res. Soc. 2015, 66, 1352–1362. [Google Scholar] [CrossRef] [Scilit]
- McCain, W.D., Jr. Reservoir-fluid property correlations—State of the art. SPE Reserv. Eng. 1991, 6, 266–272. [Google Scholar] [CrossRef] [Scilit]
- El-Ghandour, M.; Abu Shady, A.; Abdeldayem, A.; Soliman, A. Reservoir characterization of the Jurassic Safa Formation, Shoushan Basin, North Western Desert, Egypt. Delta J. Sci. 2023, 46, 144–158. [Google Scholar] [CrossRef] [Scilit]
- Eid, A.M.; Mabrouk, W.M.; Amer, M.; Metwally, A. 3D structural modeling using seismic data and well logs for Khatatba reservoir in Matruh-Shushan Basin, North Western Desert, Egypt. Sci. Rep. 2023, 13, 20158. [Google Scholar] [CrossRef] [Scilit] [PubMed]
- Chaperon, I. Theoretical study of coning toward horizontal and vertical wells in anisotropic formations: Subcritical and critical rates. In Proceedings of the SPE Annual Technical Conference and Exhibition, New Orleans, LA, USA, 5–8 October 1986. [Google Scholar] [CrossRef]
- Xiao, Y.; Zhou, T.; Su, H.; Li, J.; Song, L.; Kong, X.; Qian, F. Research and application of quantitative model for optimal well trajectory selection. Sci. Rep. 2025, 15, 42710. [Google Scholar] [CrossRef] [Scilit] [PubMed]
- Yavari, H.; Qajar, J.; Aadnoy, B.S.; Khosravanian, R. Selection of optimal well trajectory using multi-objective genetic algorithm and TOPSIS method. Arab. J. Sci. Eng. 2023, 48, 16831–16855. [Google Scholar] [CrossRef] [Scilit]
- Mansouri, V.; Khosravanian, R.; Wood, D.A.; Aadnøy, B.S. Optimizing the separation factor along a directional well trajectory to minimize collision risk. J. Pet. Explor. Prod. Technol. 2020, 10, 2113–2125. [Google Scholar] [CrossRef] [Scilit]
- Waburoko, J.; Xie, C.; Ling, K. Effect of well orientation on oil recovery from waterflooding in shallow green reservoirs: A case study from Central Africa. Energies 2021, 14, 1223. [Google Scholar] [CrossRef] [Scilit]
- Shalaby, M.R. Petrophysical characteristics and hydraulic flow units of reservoir rocks: Case study from the Khatatba Formation, Qasr field, North Western Desert, Egypt. J. Pet. Sci. Eng. 2021, 198, 108143. [Google Scholar] [CrossRef] [Scilit]
- Abu-Hashish, M.F.; Wanas, H.A.; Madian, E. 3D geological modeling of the Upper Cretaceous reservoirs in GPT oil field, Abu Sennan area, Western Desert, Egypt. J. Pet. Explor. Prod. Technol. 2020, 10, 371–393. [Google Scholar] [CrossRef] [Scilit]
- Youssef, A.S.; Mahmoud, A.A.; Elkatatny, S.; Al Shafloot, T. A review of the critical conditions required for effective hole cleaning while horizontal drilling. Petroleum 2025, 11, 143–157. [Google Scholar] [CrossRef] [Scilit]
- El Sabeh, K.; Gaurina-Međimurec, N.; Mijić, P.; Medved, I.; Pašić, B. Extended-reach drilling (ERD)—The main problems and current achievements. Appl. Sci. 2023, 13, 4112. [Google Scholar] [CrossRef] [Scilit]
- Deutsch, C.V. Geostatistical Reservoir Modeling; Oxford University Press: New York, NY, USA, 2002. [Google Scholar]
- Oliver, D.S.; Reynolds, A.C.; Liu, N. Inverse Theory for Petroleum Reservoir Characterization and History Matching; Cambridge University Press: Cambridge, UK, 2008. [Google Scholar]
- Frick, T.P.; Economides, M.J. Horizontal well damage characterization and removal. SPE Prod. Facil. 1993, 8, 15–22. [Google Scholar] [CrossRef] [Scilit]
- Hovadik, J.M.; Larue, D.K. Static characterizations of reservoirs: Refining the concepts of connectivity and continuity. Pet. Geosci. 2007, 13, 195–211. [Google Scholar] [CrossRef] [Scilit]

Disclaimer/Publisher’s Note: The statements, opinions and data contained in all publications are solely those of the individual author(s) and contributor(s) and not of MDPI and/or the editor(s). MDPI and/or the editor(s) disclaim responsibility for any injury to people or property resulting from any ideas, methods, instructions or products referred to in the content. |
© 2026 by the authors. Licensee MDPI, Basel, Switzerland. This article is an open access article distributed under the terms and conditions of the Creative Commons Attribution (CC BY) license.