


Abstract
Background/Objectives: Lung cancer exhibits substantial international variation in incidence that cannot be fully explained by established individual-level risk factors alone. Although tobacco smoking remains the principal cause of lung cancer, international ecological associations may also be influenced by differences in socioeconomic development, epidemiological transition, healthcare infrastructure, diagnostic capacity, and cancer registration systems. This study examined country-level associations between behavioral, environmental, occupational, dietary, metabolic, socioeconomic, and healthcare indicators and lung cancer incidence across 183 countries. Methods: An ecological cross-sectional study was conducted across 183 countries. Lung cancer incidence estimates for 2024 were obtained from the International Agency for Research on Cancer (IARC) Global Cancer Observatory, Cancer Today platform, using GLOBOCAN 2024. Exposure and contextual indicators were obtained from international databases, with reference years varying across indicators. Incidence was evaluated for the total population, males, females, and individuals aged 15–64 years. Country-level associations were assessed using exploratory Spearman correlations, exploratory receiver operating characteristic (ROC) analyses, and multivariable linear regression models. Analytical sample sizes varied according to data availability. Results: Indicators associated with socioeconomic development, including expected years of schooling (ρ = 0.664–0.728), personal health expenditure (ρ = 0.656–0.706), meat consumption (ρ = 0.640–0.732), and tobacco consumption (ρ = 0.492–0.677), showed consistent positive ecological associations with lung cancer incidence. Occupational silica exposure showed small positive ecological correlations (ρ = 0.194–0.278). Conversely, unsafe water sources (ρ = −0.729 to −0.786) and unsafe sanitation (ρ = −0.661 to −0.763) exhibited strong inverse ecological associations. Multivariable regression models explained 55.4–66.1% of the international variability in lung cancer incidence, with tobacco consumption showing positive associations across all demographic groups after adjustment for the other covariates included in the models. The inverse ecological associations observed for unsafe water and sanitation indicators may reflect differences in socioeconomic development, epidemiological transition, diagnostic capacity, and cancer registration systems; however, these explanations were not directly evaluated and should not be interpreted as evidence of biologically protective effects. Conclusions: Selected country-level indicators were associated with international variation in lung cancer incidence. Tobacco consumption showed positive associations across all demographic groups after adjustment for the covariates included in the models. The inverse ecological associations observed for unsafe water and sanitation indicators may reflect contextual differences between countries, but these explanations were not directly evaluated. The findings remain susceptible to residual confounding and do not establish individual-level causal relationships.
1. Introduction
Lung cancer remains one of the leading causes of cancer incidence and mortality worldwide, representing a major public health challenge despite substantial advances in prevention, diagnosis, and treatment. According to the Global Burden of Disease (GBD) Study and international cancer surveillance systems, cancers of the trachea, bronchus, and lung account for a considerable proportion of the global cancer burden and exhibit marked geographic variation in incidence across countries and regions [1,2]. These pronounced international differences cannot be fully explained by biological susceptibility alone and suggest that broader population-level determinants contribute substantially to the observed global patterns [3].
International ecological comparisons consistently demonstrate that countries with higher socioeconomic development generally report substantially greater lung cancer incidence than low-income nations. Although part of this variation reflects historical differences in tobacco consumption and other established carcinogenic exposures, important contextual factors—including demographic aging, epidemiological transition, healthcare infrastructure, diagnostic capacity, and the completeness of population-based cancer registration systems—also influence the observed incidence burden [4]. Consequently, reported incidence represents not only the occurrence of disease but also the ability of health systems to detect, diagnose, and register cancer cases.
This complexity creates an important challenge in ecological epidemiology. Country-level analyses frequently identify associations that appear contradictory when interpreted using an individual-level causal framework. For example, adverse environmental indicators, such as unsafe water and sanitation, may exhibit inverse ecological associations with lung cancer incidence. Such patterns may reflect differences in socioeconomic development, historical exposures, diagnostic capacity, and cancer surveillance rather than protective effects [5,6]. Such paradoxical findings do not imply protective biological effects but rather illustrate how ecological associations may reflect the broader socioeconomic context in which exposures occur.
Although the individual-level determinants of lung cancer have been extensively investigated, considerably less attention has been devoted to understanding how socioeconomic development shapes the interpretation of international ecological associations. Most previous studies have focused on quantifying the contribution of specific risk factors, whereas relatively few have examined how differences in development modify the ecological relationships observed between countries. As a result, ecological associations are often interpreted without adequately considering the influence of epidemiological transition, healthcare access, life expectancy, diagnostic intensity, and cancer registration quality, all of which may substantially affect the reported incidence of lung cancer [7].
Ecological studies provide valuable insights into population-level disease patterns, but their findings should not be interpreted as evidence of individual-level causality because they are inherently susceptible to ecological fallacy [8,9,10]. Instead, ecological indicators frequently function as markers of broader contextual characteristics, integrating multiple dimensions of socioeconomic development rather than representing isolated biological effects. Recognizing this distinction is essential for the appropriate interpretation of international comparisons involving complex chronic diseases such as lung cancer.
To address this knowledge gap, the present study investigated how socioeconomic development may influence the ecological interpretation of global associations between behavioral, environmental, occupational, dietary, metabolic, sanitation-related, and healthcare indicators and the incidence of tracheal, bronchial, and lung cancer using publicly available international databases [11,12]. Specifically, we sought to (i) identify ecological indicators consistently associated with lung cancer incidence across demographic groups, (ii) assess the consistency of ecological discrimination using exploratory receiver operating characteristic analyses, and (iii) estimate their country-level associations after adjustment for the covariates included in multivariable regression models. Rather than inferring causality, this study aims to provide a comprehensive ecological framework for interpreting international differences in lung cancer incidence and to better understand how socioeconomic development shapes global patterns of disease burden.
2. Materials and Methods
2.1. Study Design and Data Sources
An ecological cross-sectional study was conducted to examine country-level associations between behavioral, environmental, occupational, dietary, socioeconomic, sanitation-related, and healthcare indicators and lung cancer incidence across 183 countries.
Lung cancer incidence estimates for 2024 were obtained exclusively from the International Agency for Research on Cancer (IARC) Global Cancer Observatory, Cancer Today platform, using GLOBOCAN 2024. Age-standardized incidence rates were expressed per 100,000 population using the Segi–Doll world standard population. GBD/IHME and the other international databases supplied exposure and contextual indicators rather than the dependent variable [13,14]. The outcome reference year was distinguished from the database publication and access dates. Incidence estimates were extracted for the total population, males, females, and individuals aged 15–64 years. The incidence estimates refer to 2024; database publication and access dates are reported separately. Exposure and contextual indicators were obtained from publicly available international sources, including the Global Burden of Disease (GBD) Study through Institute for Health Metrics and Evaluation (IHME) platforms, the World Health Organization (WHO), the Food and Agriculture Organization of the United Nations (FAO), the United Nations Development Programme (UNDP), and the World Bank. Some indicators were accessed through Our World in Data (OWID) [15]. The original data producer and access platform are identified separately in Supplementary Table S1. GBD/IHME sources supplied the relevant exposure indicators rather than lung cancer incidence estimates [16,17].
Candidate indicators were initially considered across several domains. The study dataset comprised 183 countries [18]. Data availability varied across indicators and incidence outcomes, resulting in different numbers of paired observations for individual correlation analyses [19]. Supplementary Table S1 documents the candidate indicators, their reference years, definitions, sources, and analytical availability. Supplementary Table S2 presents selected exploratory correlations and the number of countries included in each analysis. Countries or territories with substantial missing information across the candidate indicators, or for which only substantially outdated indicator data were available, were excluded during dataset assembly. The resulting study dataset comprised 183 countries. Within this dataset, analytical sample sizes varied according to the availability of paired observations for each indicator and incidence outcome.
2.2. Study Variables
The dependent variables were age-standardized incidence rates of trachea, bronchus, and lung cancer in the total population, males, females, and individuals aged 15–64 years.
The ecological indicators evaluated represented behavioral, socioeconomic, environmental, dietary, occupational, metabolic, and sanitation-related characteristics at the country level rather than individual-level exposures. Among the evaluated variables were tobacco consumption per person, nitrogen dioxide (NO2) concentration, sulfur dioxide (SO2) concentration, occupational exposure to silica, expected years of schooling, personal health expenditure, caloric intake from meat consumption, body-mass index, fasting plasma glucose, systolic blood pressure, sanitation indicators, water access indicators, and selected dietary factors (Table 1) [1,2,4,5,20,21,22,23].
Table 1.
Description of Variables Included in the Global Ecological Analysis of Lung Cancer Incidence.
Country-level records were assembled into a common analytical matrix, retaining each indicator’s source-specific definition, unit, and reference year. Integration did not establish temporal alignment or measurement equivalence. Supplementary Table S1 reports sources, reference years, definitions, available observations, and missingness within the 183-country dataset. Missing percentages used 183 as the denominator. No missing values were imputed. Correlations used available paired observations, with analytical sample sizes reported in Supplementary Table S2. Absence from this selected table does not imply exclusion from all exploratory analyses.
2.3. Statistical Analysis
Statistical analyses were performed using IBM SPSS Statistics version 27.0 (IBM Corp., Armonk, NY, USA) and Python version 3.13 [30].
Spearman’s rank correlation was used to characterize the direction and magnitude of monotonic country-level associations between incidence and indicators measured on different scales. This rank-based approach does not require normally distributed variables and is less sensitive to extreme values than Pearson correlation. Its use was therefore justified by the analytical objective rather than solely by statistical tests of normality [31].
Because the unit of analysis was the country, all variables were treated as ecological indicators rather than individual-level exposures. Consequently, the associations identified in this study were interpreted as population-level relationships and should not be considered evidence of causal effects at the individual level. The analytical objective was to characterize international ecological patterns of lung cancer incidence rather than estimate individual disease risk.
2.3.1. Correlation Analysis
Associations between lung cancer incidence and each explanatory variable were assessed using Spearman’s rank correlation coefficient (ρ). Correlation analyses were performed separately for total incidence, male incidence, female incidence, and incidence among individuals aged 15–64 years [31].
The strength of correlations was interpreted according to the absolute value of Spearman’s coefficient as follows: negligible (<0.20), weak (0.20–0.39), moderate (0.40–0.59), strong (0.60–0.79), and very strong (≥0.80). Positive coefficients indicated direct associations, whereas negative coefficients indicated inverse associations [32,33].
The original correlation output included substantially more indicators than those presented in the summary table. Sample sizes varied between analyses according to the availability of paired observations. Supplementary Table S2 reports selected correlations with their corresponding sample sizes. The analyses were exploratory and hypothesis-generating, and no adjustment for multiple comparisons was applied.
Spearman correlation coefficients are reported with 95% percentile bootstrap confidence intervals based on 10,000 resamples, two-sided p-values, and the number of available paired observations. p-values below 0.001 are reported as p < 0.001; other values are reported to three decimal places. No adjustment for multiple comparisons was applied across indicators and the four incidence outcomes. Accordingly, p < 0.05 was treated as a nominal threshold, and the analyses were interpreted as exploratory and hypothesis-generating.
2.3.2. Descriptive Comparison of Consistently Associated Ecological Indicators
Indicators showing nominally significant correlations and consistent directions of association across the four demographic groups were summarized as consistently associated ecological correlates for descriptive, exploratory comparison. To characterize their global distribution, countries were ranked according to the values of each selected indicator [34,35].
For each selected variable, the five countries with the highest exposure values and the five countries with the lowest exposure values were identified. Corresponding age-standardized incidence rates of trachea, bronchus, and lung cancer were extracted and compared descriptively to explore whether countries at the extremes of exposure exhibited distinct incidence patterns [34,35].
This approach was used to provide epidemiological context for the observed correlations and to evaluate the consistency of associations across geographically and socioeconomically diverse settings. Results were summarized in Supplementary Tables reporting exposure values and corresponding lung cancer incidence rates for countries with the highest and lowest levels of each determinant [36]. No formal hypothesis testing was performed in this comparative analysis, as its purpose was descriptive and exploratory rather than inferential.
2.3.3. Receiver Operating Characteristic (ROC) Analysis
Receiver operating characteristic (ROC) analyses were conducted to evaluate the ability of the principal determinants identified in the correlation analyses to discriminate between countries with high and low lung cancer incidence.
For each demographic category (total population, males, females, and individuals aged 15–64 years), countries were classified into high- and low-incidence groups according to the median age-standardized incidence rate. Countries with incidence values above the median were categorized as high-incidence, whereas those with values at or below the median were categorized as low-incidence.
Receiver operating characteristic (ROC) analyses were not intended to develop predictive models or establish diagnostic thresholds. Instead, they were used as a complementary exploratory approach to evaluate whether variables consistently associated with lung cancer incidence could distinguish countries with relatively higher versus lower incidence burdens at the population level [37,38]. Therefore, ROC analyses should be interpreted as measures of ecological discriminatory capacity rather than tools for individual-level prediction [37].
The area under the ROC curve (AUC), corresponding 95% confidence intervals (95% CI), sensitivity, and specificity were calculated for each determinant. AUC values were interpreted as follows: <0.70, poor discrimination; 0.70–0.79, acceptable discrimination; 0.80–0.89, good discrimination; and ≥0.90, excellent discrimination [39,40,41]. These analyses were secondary and exploratory. Median dichotomization discards information from the continuous outcome, and selection and evaluation of indicators in the same dataset do not constitute independent validation and may overestimate discrimination. Confidence intervals were estimated using a non-parametric approach implemented in SPSS.
2.3.4. Multivariable Regression Analysis
To estimate the adjusted country-level associations between selected ecological indicators and lung cancer incidence, multiple linear regression models were constructed for each demographic category (total population, males, females, and individuals aged 15–64 years) [42,43].
Regression coefficients were interpreted as country-level associations conditional on the other covariates included in each model. They were not interpreted as causal effects or as associations independent of unmeasured contextual factors.
Predictor selection combined exploratory correlation findings, conceptual relevance, representation of behavioral, environmental, dietary, educational, and healthcare domains, data availability, and avoidance of redundant indicators. The final models included tobacco use prevalence, NO2 concentration, SO2 concentration, meat availability, expected years of schooling, and out-of-pocket health expenditure. Because correlation findings informed selection and alternative models were explored, these models were considered exploratory rather than confirmatory. Candidate variables were initially identified through Spearman correlation analyses and were considered eligible only if they fulfilled three complementary criteria: (i) statistically significant and directionally consistent ecological associations across multiple demographic groups; (ii) biological and epidemiological plausibility supported by the previous literature; and (iii) representation of distinct conceptual domains relevant to lung cancer epidemiology, including behavioral, environmental, dietary, healthcare, and socioeconomic indicators.
When multiple variables represented similar constructs (e.g., correlated metabolic or socioeconomic indicators), only the most representative variable was retained to minimize redundancy, improve model interpretability, and reduce multicollinearity. Final predictor selection also considered data completeness across countries and model parsimony. Several alternative multivariable models were explored during model development, and the final models were selected based on explanatory performance, epidemiological plausibility, statistical stability, and interpretability rather than solely on statistical significance [42,44]. Multicollinearity was assessed using variance inflation factors (VIFs) and tolerance statistics. VIF values < 5 and tolerance values > 0.20 were considered indicative of acceptable collinearity.
Standardized regression coefficients (β), corresponding p-values, adjusted coefficients of determination (adjusted R2), and overall model significance were reported.
Adjustment was limited to the covariates included in each model. Life expectancy, population age structure, cancer-registration quality, diagnostic capacity, urbanization, and historical smoking exposure were not directly included. Therefore, the estimated coefficients represent adjusted country-level associations and remain susceptible to residual confounding by these contextual factors.
Additional analyses expanded the six-predictor models to include the natural logarithm of GDP per capita at purchasing power parity for 2020. Complete information was available for 140 countries. The six-predictor models were also refitted to this same sample to distinguish GDP adjustment from sample restriction. No missing values were imputed. Unstandardized coefficients, HC3 robust standard errors, 95% confidence intervals, standardized coefficients, and two-sided p-values were calculated. Diagnostics assessed heteroscedasticity using the Breusch–Pagan test, multicollinearity using variance inflation factors, and influential observations using Cook’s distance. Sensitivity analyses refitted the expanded models after excluding observations with Cook’s distance > 4/N.
2.4. Ethical Considerations
This study was based exclusively on publicly available, de-identified secondary data obtained from international databases. No individual-level information was accessed, and no interaction with human participants occurred. Therefore, according to international guidelines for secondary analyses of publicly available data, institutional ethics committee approval and informed consent were not required [45,46].
2.5. Study Limitations
As an ecological study, the findings represent population-level associations and should not be interpreted as evidence of causal relationships at the individual level.
- The ecological design precludes causal inference and is inherently susceptible to ecological fallacy. Consequently, associations observed at the country level may not reflect individual-level risk relationships.
- Differences in cancer registration quality, diagnostic infrastructure, healthcare access, and reporting systems across countries may have influenced the incidence estimates analyzed.
- Lung cancer develops after prolonged latency periods. Therefore, contemporary indicators of tobacco consumption, environmental pollution, dietary patterns, and socioeconomic conditions may not fully reflect the historical exposures that contributed to current incidence rates.
- Residual confounding by life expectancy, population aging, healthcare access, cancer surveillance quality, and broader indicators of socioeconomic development cannot be excluded.
- Information regarding smoking duration, cumulative tobacco exposure, occupational history, genetic susceptibility, histological subtypes, and other individual-level risk factors was not available in the international databases used.
- Ecological associations may be strongly influenced by differences in epidemiological transition across countries. Nations with greater socioeconomic development often have longer life expectancy, older population structures, more comprehensive cancer registries, and greater diagnostic capacity, which may modify the direction and magnitude of ecological associations independently of the biological effects of individual risk factors.
Finally, although multiple international databases were integrated, variations in data completeness and availability across countries may have influenced the number of observations included in specific analyses [45,47,48].
3. Results
3.1. Global Patterns of Lung Cancer Incidence According to Sex and Age Group
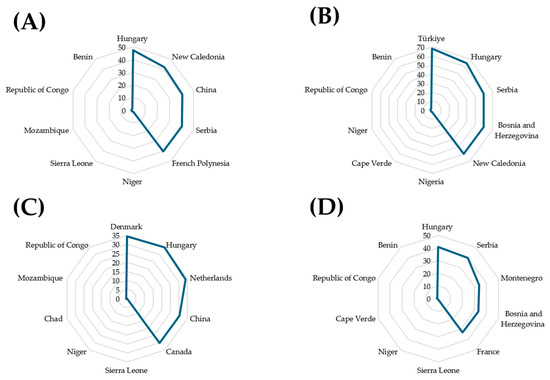
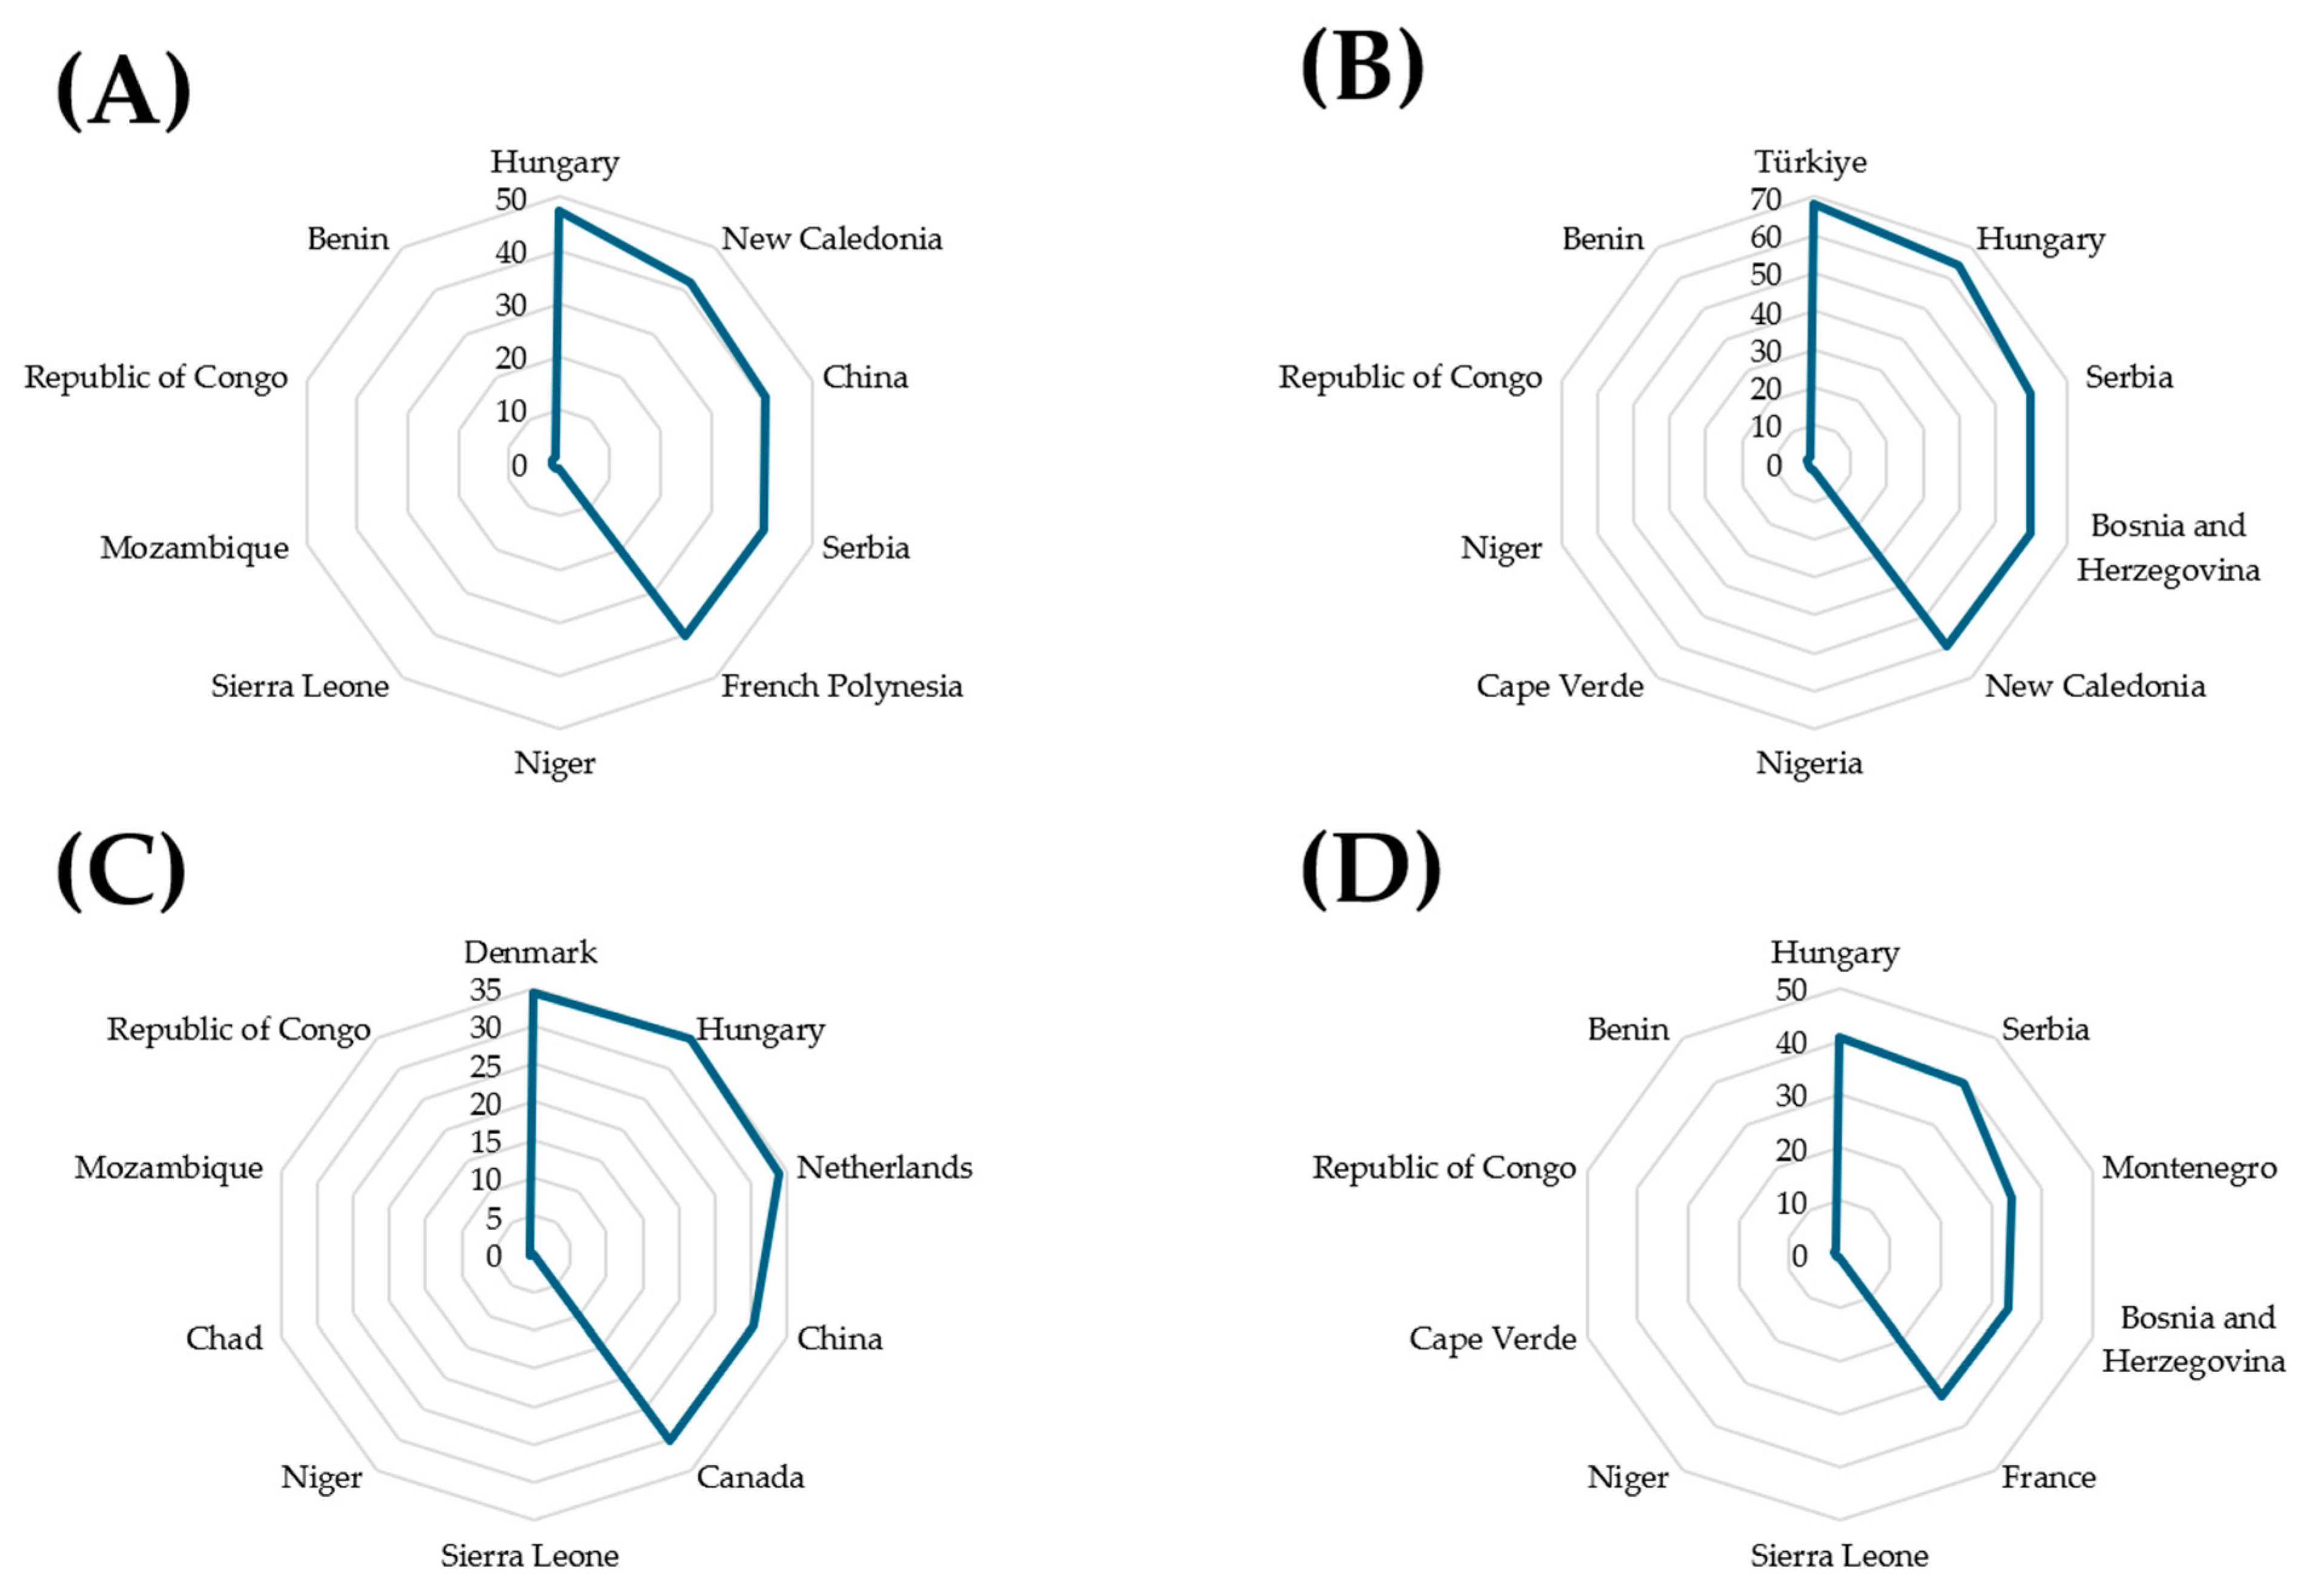
Figure 1 presents radar plots comparing the countries with the highest incidence rates of trachea, bronchus, and lung cancer across the total population, by sex, and among individuals aged 15–64 years. Overall, Hungary consistently ranked among the countries with the highest incidence rates across all analyzed groups, highlighting a persistent and disproportionate burden of lung cancer. In the total population, elevated incidence rates were also observed in New Caledonia, China, Serbia, and French Polynesia, whereas several African countries, including Niger, Sierra Leone, Mozambique, and the Republic of Congo, showed comparatively lower incidence values.
Figure 1.
Radar plots showing the countries with the highest incidence rates of trachea, bronchus, and lung cancer globally according to demographic groups: (A) total population, (B) males, (C) females, and (D) individuals aged 15–64 years. Hungary and other Eastern European countries consistently exhibited the highest incidence rates across multiple groups, whereas several African countries showed comparatively lower incidence values. Source: IARC Global Cancer Observatory, Cancer Today, GLOBOCAN 2024. Rates are expressed per 100,000 population.
Among males, the highest incidence rates were concentrated in Türkiye, Hungary, Serbia, Bosnia and Herzegovina, and New Caledonia, suggesting a marked geographic clustering in Eastern Europe and selected Pacific regions. Male incidence rates were substantially higher than those observed in females, consistent with the well-recognized global sex differences in lung cancer incidence.
In females, Denmark, Hungary, the Netherlands, Canada, and China exhibited the highest incidence rates. Compared with males, female incidence patterns appeared more heterogeneous, with representation from both high-income European countries and selected regions in Asia and North America. Conversely, lower incidence rates in females were observed in countries from Sub-Saharan Africa, including Chad, Niger, Mozambique, and the Republic of Congo.
For the population aged 15–64 years, Hungary, Serbia, Montenegro, Bosnia and Herzegovina, and France demonstrated the greatest incidence burden, indicating that lung cancer remains highly prevalent even within economically active age groups. In contrast, countries such as Cape Verde, the Republic of Congo, and Benin maintained the lowest incidence estimates in this age category.
Collectively, these findings demonstrate substantial geographic heterogeneity in lung cancer incidence worldwide. Countries with the highest incidence were predominantly located in economically developed regions of Europe, North America, and Oceania, whereas many low-income countries in Sub-Saharan Africa consistently reported substantially lower incidence rates. These global patterns suggest that international differences in lung cancer burden occur within distinct socioeconomic and epidemiological contexts that warrant further ecological investigation.
3.2. Correlation Between Socioenvironmental Factors and Lung Cancer Incidence
Spearman correlation analyses identified two distinct ecological patterns across countries (Figure S1). Indicators commonly associated with socioeconomic development, including expected years of schooling, personal health expenditure, meat consumption, and tobacco consumption, showed consistent positive associations with lung cancer incidence. Occupational silica exposure showed small positive correlations across demographic groups. In contrast, unsafe sanitation and unsafe water sources exhibited strong inverse ecological associations. These opposing patterns suggest that international ecological associations are likely influenced by broader country-level socioeconomic and epidemiological contexts rather than solely reflecting the isolated effects of individual exposures.
The strongest positive associations were observed for expected years of schooling and personal health expenditure, particularly in females and the total population. Tobacco consumption also demonstrated moderate-to-strong positive correlations across all groups, especially among males and individuals aged 15–64 years. Occupational silica exposure showed positive correlations of small magnitude: ρ = 0.227 for total incidence, 0.194 for males, 0.278 for females, and 0.211 for individuals aged 15–64 years.
3.3. Common Ecological Factors Associated with Lung Cancer Incidence Across Demographic Groups
Unsafe sanitation and unsafe water sources displayed strong inverse ecological correlations, whereas occupational silica exposure showed small positive correlations. The inverse ecological correlations observed for unsafe sanitation and unsafe water sources warrant further discussion in relation to country-level contextual factors.
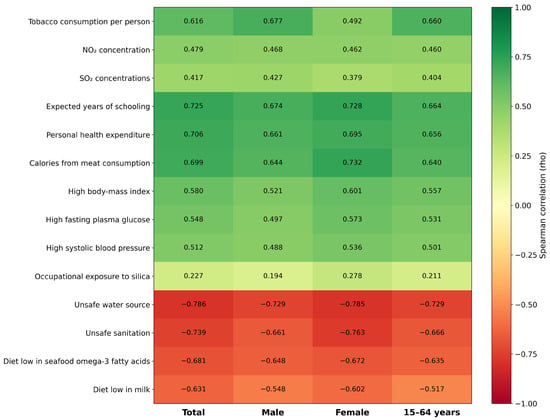
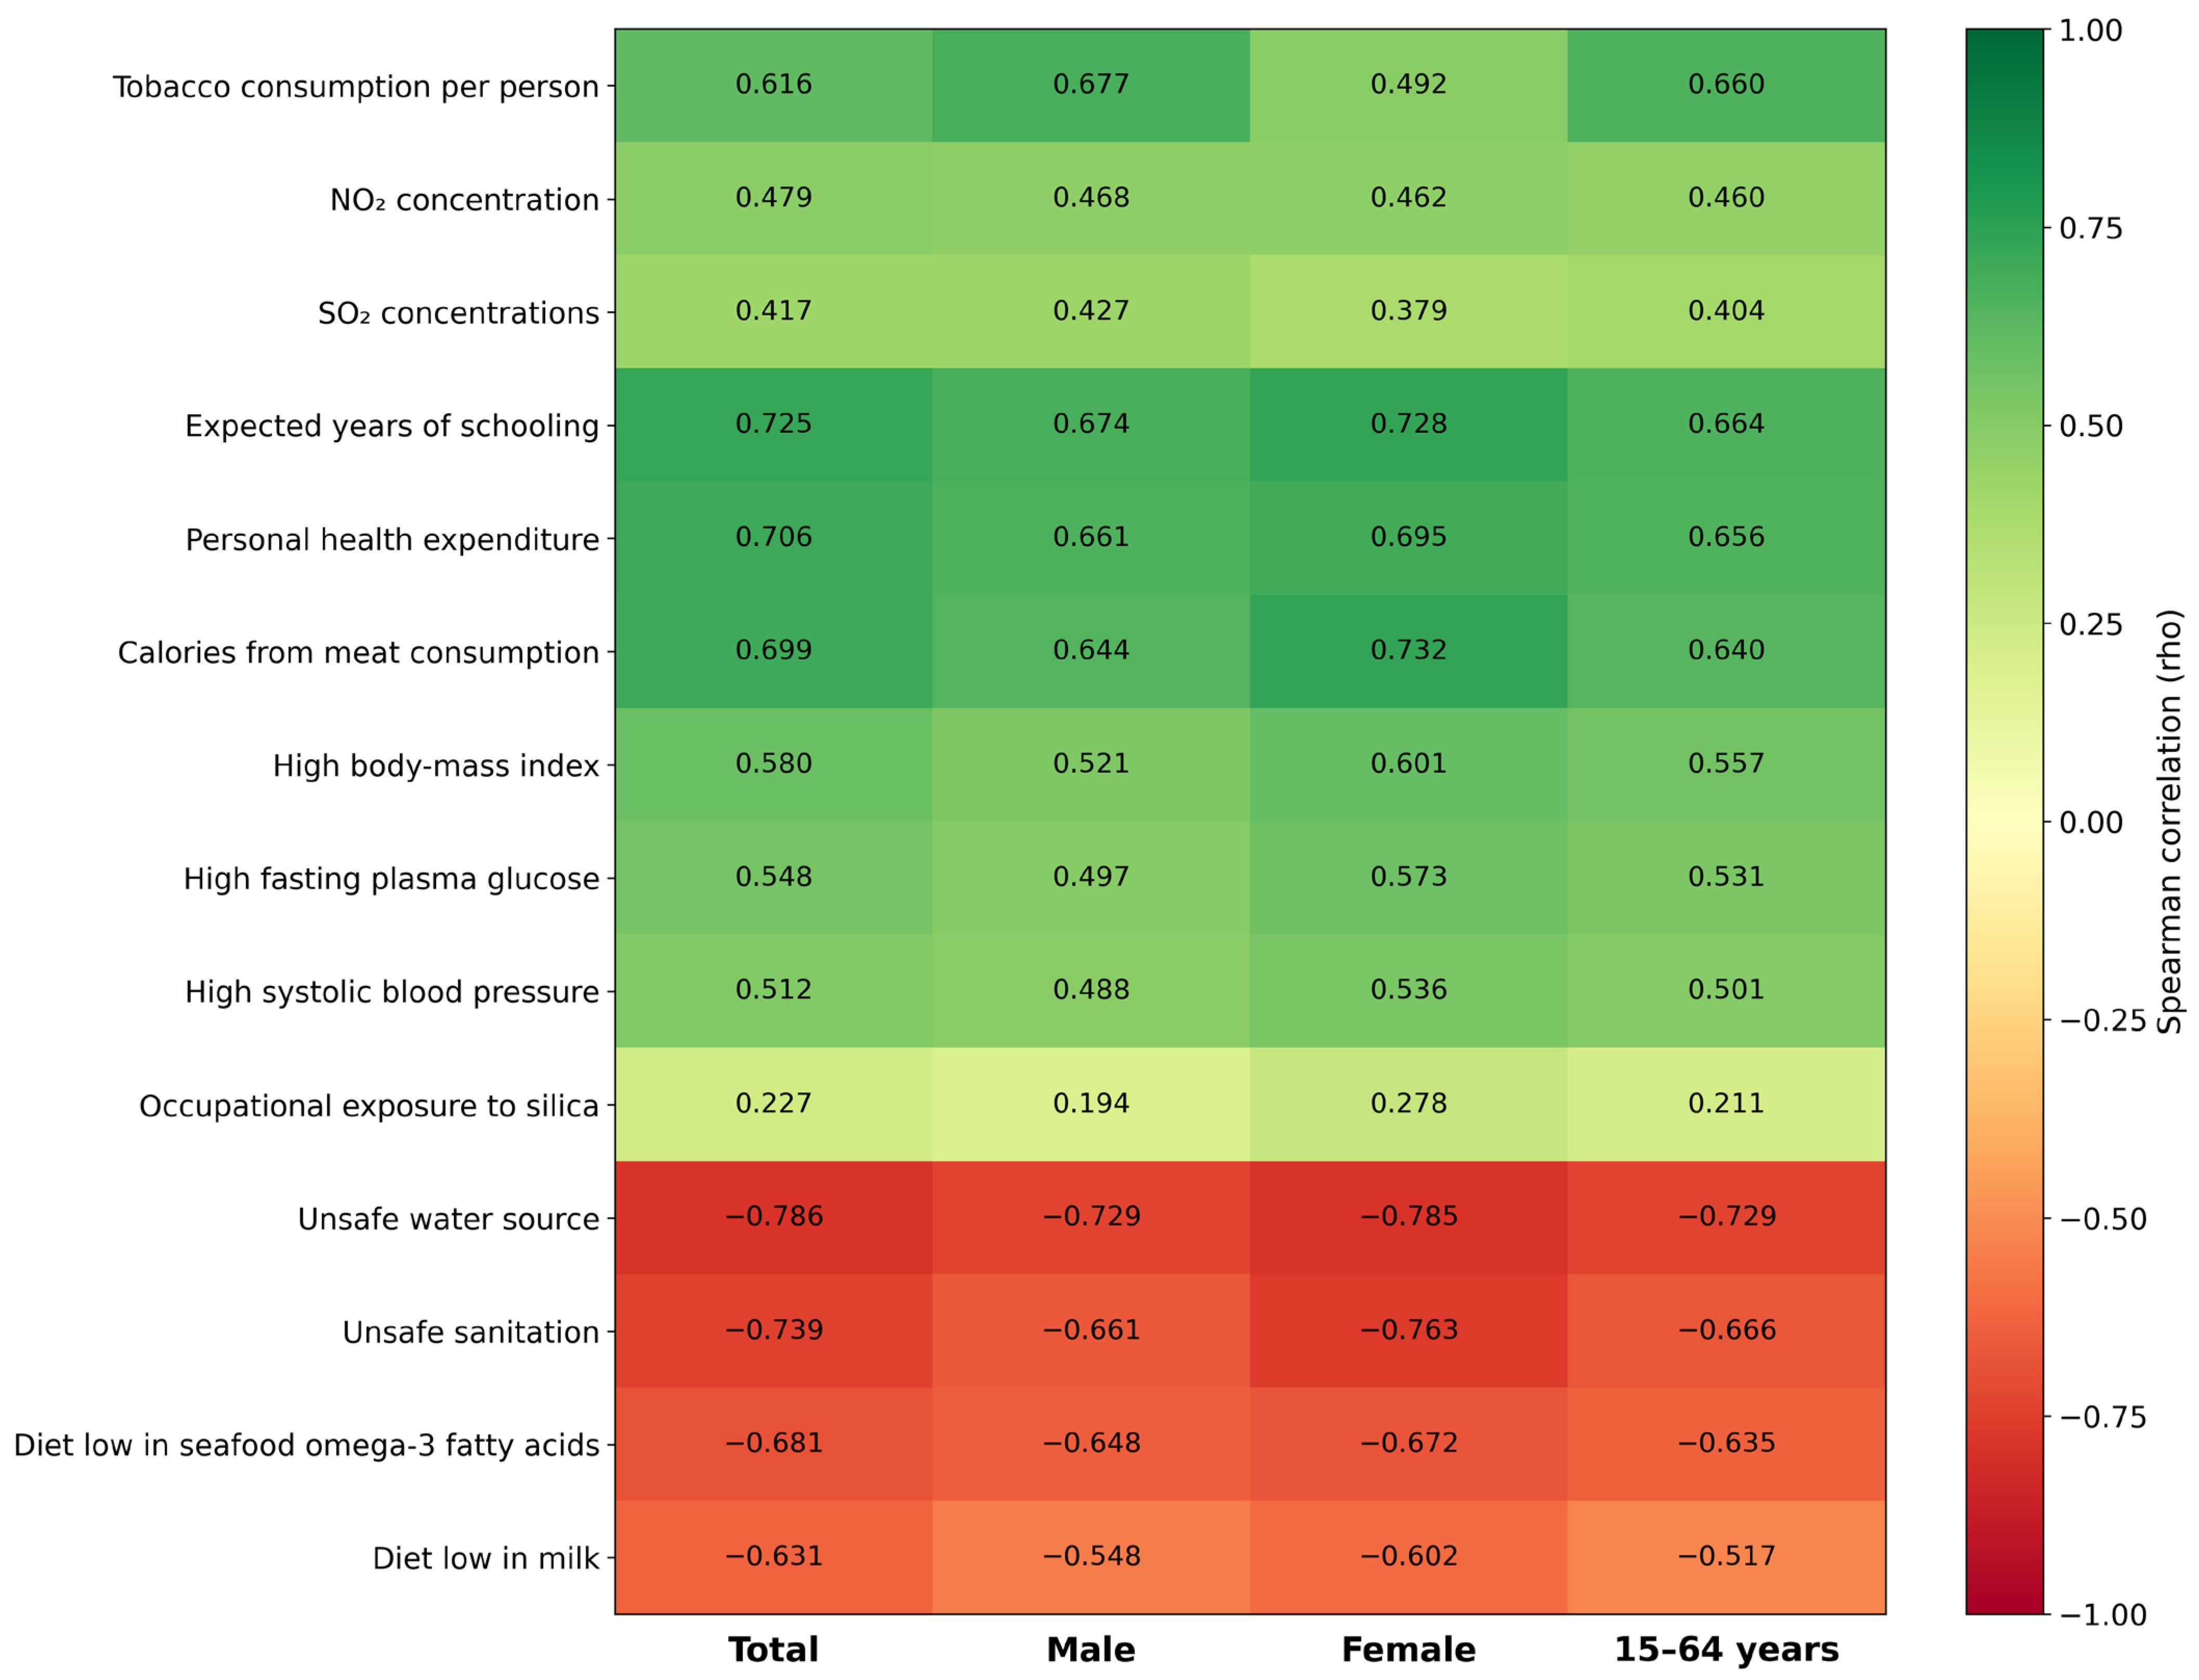
Additional dietary factors, including calories from eggs, fats and oils, vegetable consumption, sugar-derived kilocalories, and diets high in red meat, also demonstrated moderate positive associations. Among all variables, the strongest positive correlations were identified for expected years of schooling (ρ ≈ 0.66–0.73), personal health expenditure (ρ ≈ 0.65–0.71), calories from meat consumption (ρ ≈ 0.64–0.73), and tobacco consumption (ρ ≈ 0.49–0.68) (Figure 2).
Figure 2.
Heatmap showing common Spearman correlation coefficients between socioeconomic, environmental, dietary, and metabolic factors and trachea, bronchus, and lung cancer incidence across demographic groups: total population, males, females, and individuals aged 15–64 years. Green tones indicate positive correlations, whereas red tones indicate inverse correlations, with color intensity representing the magnitude of the correlation coefficient (ρ). Tobacco consumption, educational attainment, personal health expenditure, and meat consumption showed the strongest positive associations, while unsafe water sources and unsafe sanitation demonstrated strong inverse correlations across all groups. Occupational silica exposure showed small positive correlations.
Unsafe water sources and unsafe sanitation consistently exhibited strong inverse correlations with lung cancer incidence across demographic groups. Negative associations were also observed for diets low in seafood omega-3 fatty acids and low milk consumption. Occupational silica exposure, in contrast, showed small positive correlations across all four outcomes (ρ = 0.194–0.278).
The coexistence of positive correlations for tobacco use and occupational silica exposure with inverse correlations for unsafe water and sanitation illustrates the complexity of country-level comparisons and the need to consider contextual factors.
3.4. Characteristics of Countries with the Highest and Lowest Exposure to Common Associated Factors
To better characterize the observed correlations, countries with the highest and lowest exposure levels for the most relevant common determinants were compared. Countries exhibiting the highest tobacco consumption, educational attainment, health expenditure, and meat consumption were predominantly located in Europe, North America, and Oceania, and generally presented elevated lung cancer incidence rates. In contrast, countries with the lowest levels of these indicators were mainly located in Sub-Saharan Africa and South Asia, where lung cancer incidence remained comparatively low (Table 2).
Table 2.
Representative countries with the highest and lowest exposure levels for common determinants of trachea, bronchus, and lung cancer incidence.
Similarly, the highest values for occupational exposure to silica, unsafe water sources, unsafe sanitation, low seafood omega-3 intake, and low milk consumption were concentrated in low- and middle-income countries. These comparisons demonstrated that countries with the highest exposure to indicators of socioeconomic development consistently exhibited higher reported lung cancer incidence. Selected countries with poorer sanitation and unsafe water generally reported lower incidence rates. These descriptive comparisons do not establish the direction of association across the full dataset. In particular, the overall silica correlations were positive despite the contrasting profiles of some selected countries.
3.5. Secondary Exploratory ROC Analyses
Secondary exploratory ROC analyses assessed within-sample discrimination between countries above and at or below the median lung cancer incidence within each demographic group (Table 3; Supplementary Figure S2). The evaluated indicators were tobacco use prevalence, expected years of schooling, out-of-pocket health expenditure, meat availability, and NO2 concentration.
Table 3.
Secondary exploratory AUC estimates for selected country-level indicators across lung cancer incidence outcomes.
AUC estimates ranged from 0.693 to 0.791. Tobacco use prevalence had the highest AUC for total incidence (0.778, 95% CI: 0.701–0.856) and male incidence (0.791, 95% CI: 0.715–0.867). Expected years of schooling had the highest AUC for female incidence (0.771, 95% CI: 0.698–0.844) and incidence among individuals aged 15–64 years (0.782, 95% CI: 0.711–0.854). All reported AUC estimates differed from 0.50 at nominal p < 0.001.
These AUC estimates describe within-sample discrimination between countries above and at or below the median incidence. Median dichotomization discards information from the continuous outcome, and the indicators were selected and evaluated using the same dataset. Therefore, these secondary exploratory analyses do not provide independent validation of the correlation or regression findings and should not be interpreted as demonstrating individual-level predictive performance.
3.6. Multivariable Analysis of Adjusted Country-Level Associations with Lung Cancer Incidence
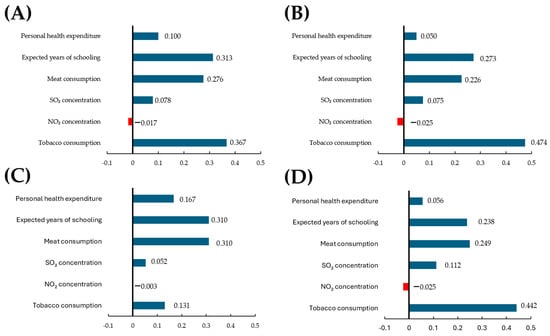
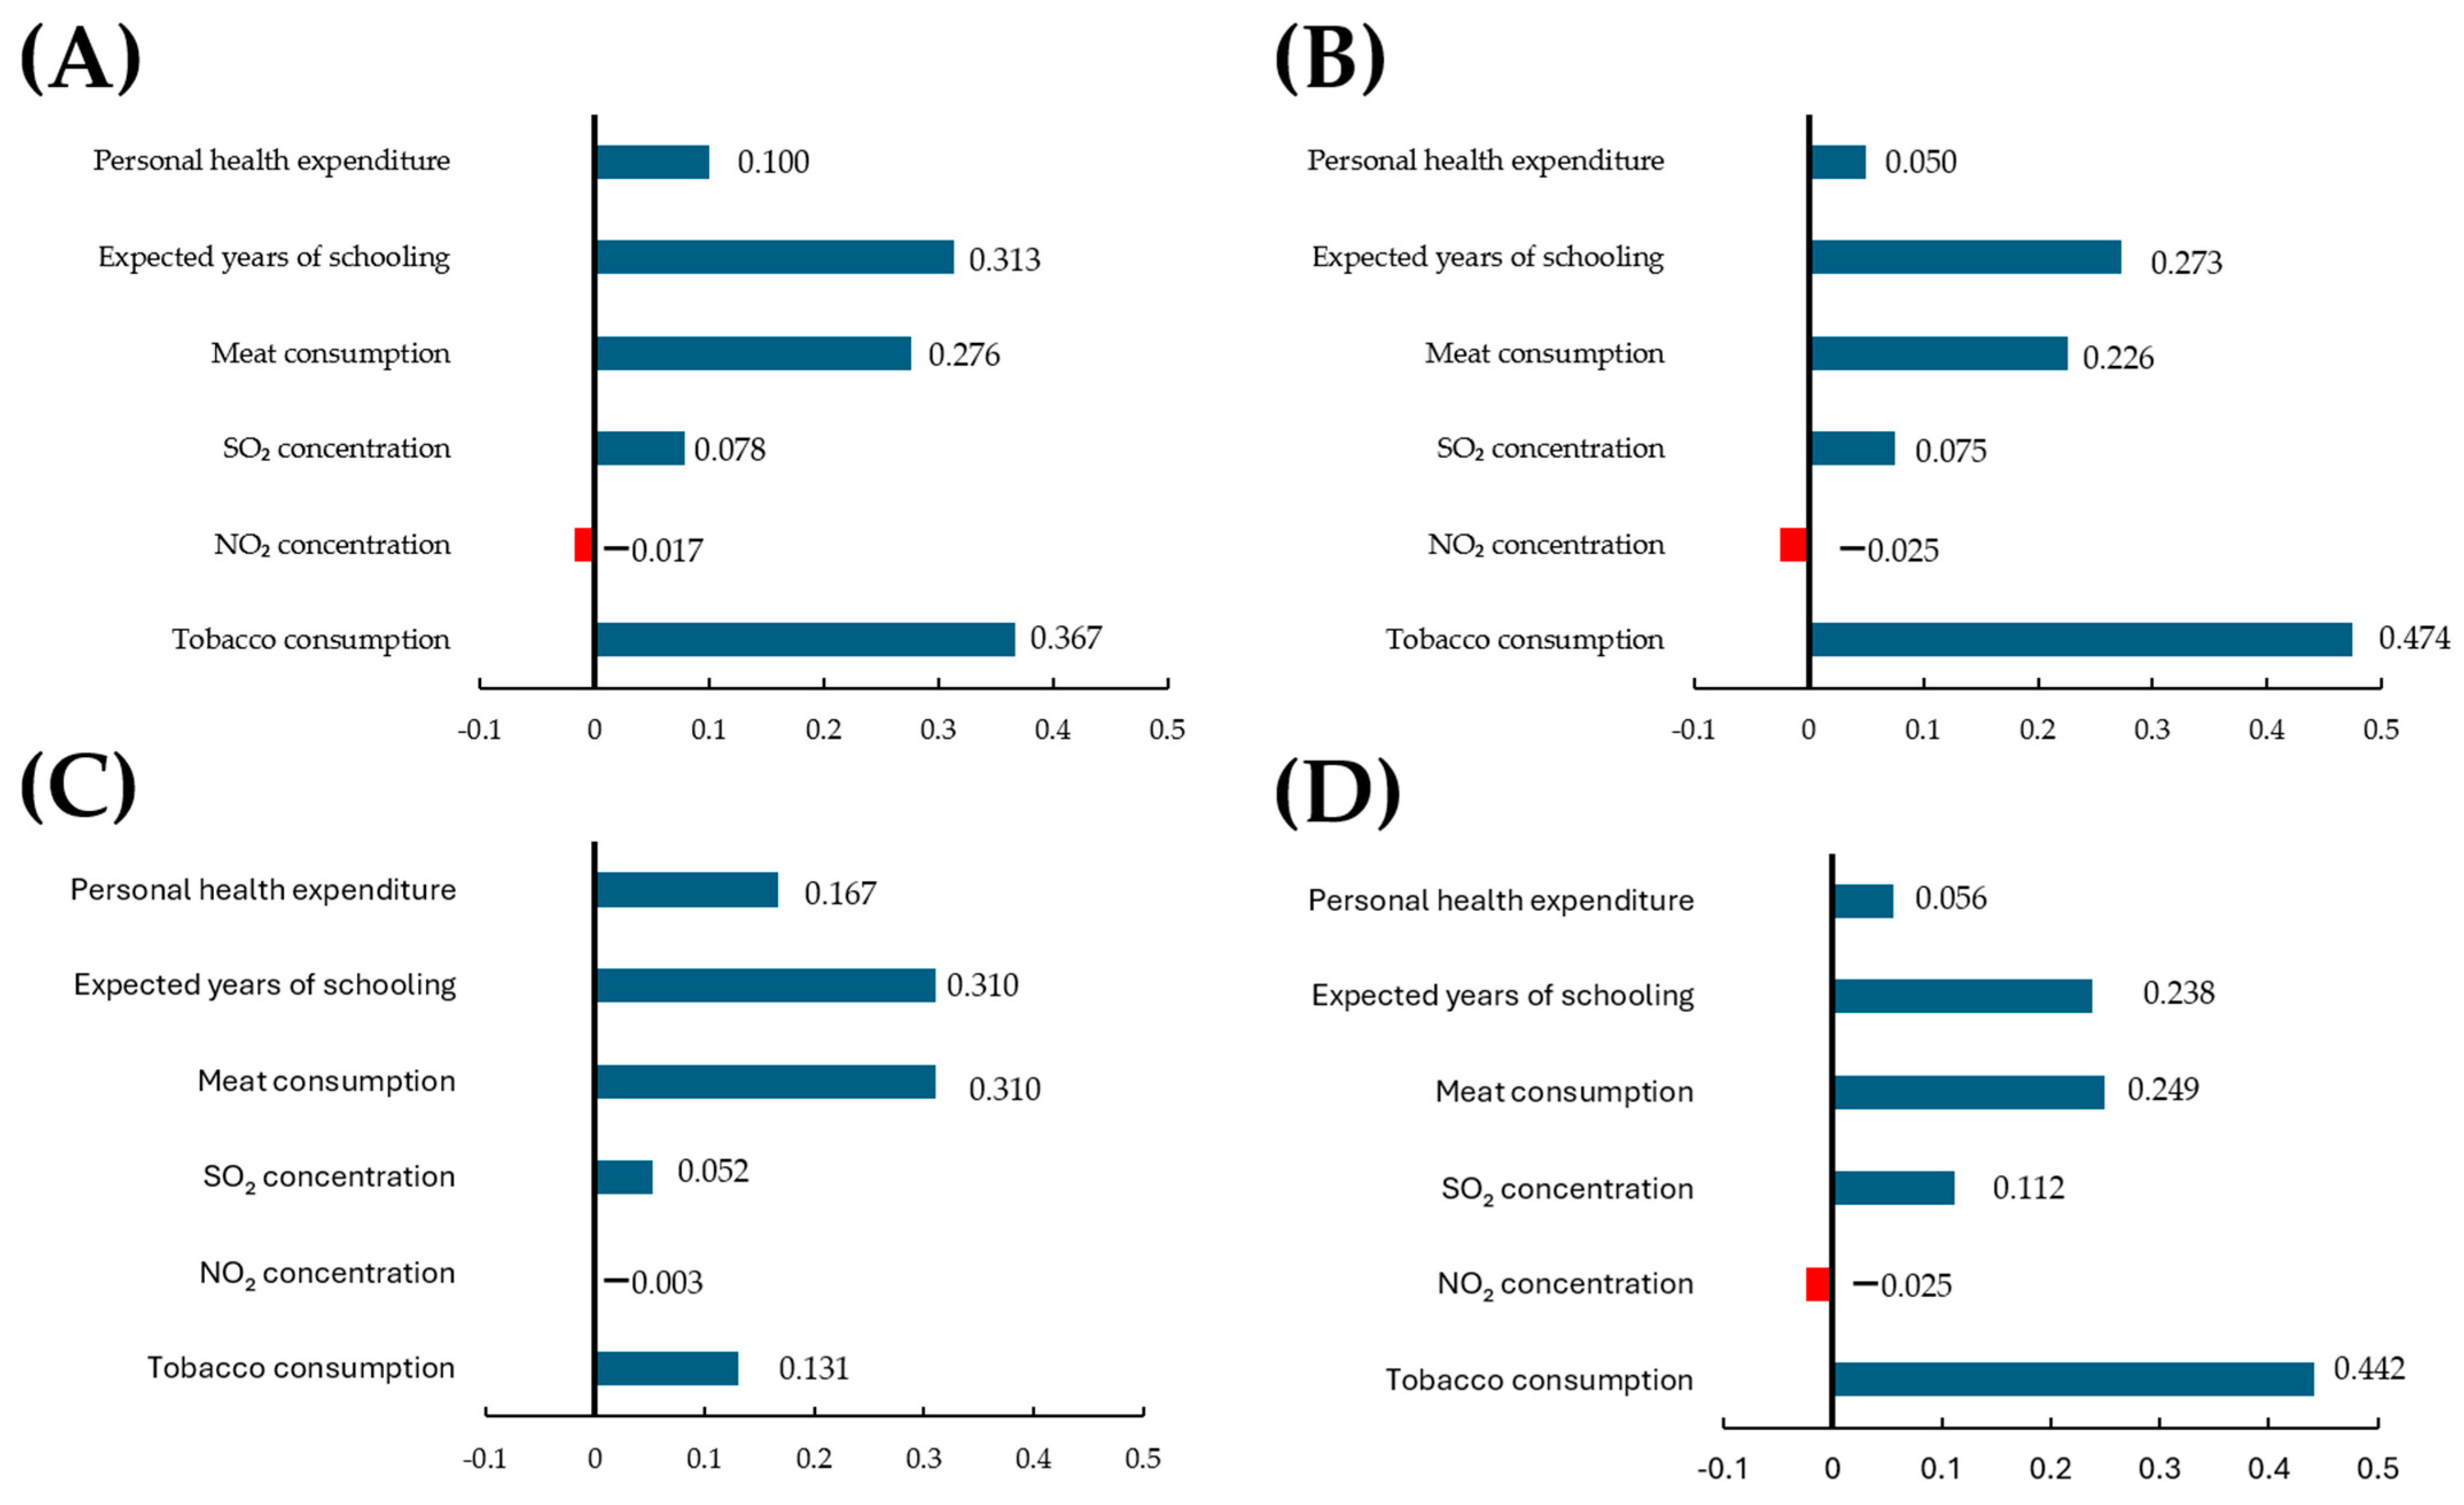
Multiple linear regression analyses were performed to estimate adjusted country-level associations between selected ecological indicators and the incidence of trachea, bronchus, and lung cancer within each demographic group (Figure 3, Table 4). The evaluated predictors included tobacco consumption per person, nitrogen dioxide concentration, sulfur dioxide (SO2) concentration, caloric intake from meat consumption, expected years of schooling, and personal health expenditure. For total lung cancer incidence, the model demonstrated strong explanatory performance (adjusted R2 = 0.661, p < 0.001). The multivariable regression models explained between 55% and 66% of the international variability in lung cancer incidence across demographic groups, indicating that a relatively small set of country-level ecological indicators accounted for a substantial proportion of global differences in incidence. Indicators representing different dimensions of socioeconomic development, particularly expected years of schooling, together with dietary characteristics represented by meat consumption, remained associated with lung cancer incidence across all demographic groups after adjustment for the other included covariates. Tobacco consumption showed positive adjusted associations in every model, with the largest standardized coefficient observed among males.
Figure 3.
Standardized regression coefficients (β) derived from multivariable linear regression models evaluating adjusted country-level associations between socioeconomic, environmental, and dietary factors and trachea, bronchus, and lung cancer incidence. Panels represent (A) total population, (B) males, (C) females, and (D) individuals aged 15–64 years. Positive coefficients indicate direct associations with lung cancer incidence after adjustment for all covariates included in the models, whereas negative coefficients indicate inverse associations. Tobacco consumption expected years of schooling, and meat consumption showed the largest standardized coefficients among the predictors included in the fitted models across demographic groups. The vertical black line indicates the null value (β = 0).
Table 4.
Multivariable linear regression models for trachea, bronchus, and lung cancer incidence according to demographic group.
Collectively, these findings indicate that international ecological variation in lung cancer incidence is explained by multiple interconnected country-level characteristics rather than by any single ecological indicator, emphasizing the importance of interpreting global ecological associations within their broader socioeconomic context. No evidence of relevant multicollinearity was detected (all VIF values < 2.5). Collinearity diagnostics demonstrated acceptable levels of multicollinearity among all predictors included in the final models. Tolerance values ranged from 0.437 to 0.859, whereas VIF values ranged from 1.164 to 2.287. All values remained well below the predefined threshold of 5, indicating that multicollinearity was unlikely to materially influence the regression estimates (Supplementary Tables S4 and S5).
Additional GDP-adjusted models included 140 countries (Supplementary Table S6). Compared with the six-predictor models refitted to the same sample, adjusted R2 changed from 0.664 to 0.668 for total incidence, 0.615 to 0.616 for males, 0.558 to 0.562 for females, and 0.584 to 0.584 for individuals aged 15–64 years. With HC3 robust inference, tobacco use prevalence remained positively associated with all four outcomes. Meat availability and expected years of schooling retained positive coefficients but reached nominal significance only for total and female incidence. GDP per capita did not reach nominal significance in the primary expanded models. Heteroscedasticity was detected in all four models, and the maximum VIF was 4.69. Sensitivity analyses retained positive tobacco associations across all outcomes, whereas several other associations varied after exclusion of influential observations.
4. Discussion
4.1. Principal Findings
The present global ecological analysis identified substantial geographic heterogeneity in the incidence of trachea, bronchus, and lung cancer, with the highest incidence rates concentrated in Eastern Europe and other highly developed regions, whereas substantially lower reported incidence rates were observed in many low-income countries. The most important finding of this study was that international ecological associations followed a clear socioeconomic gradient. Indicators associated with socioeconomic development—including educational attainment, healthcare expenditure, and dietary patterns—were consistently associated with higher reported lung cancer incidence, whereas several indicators concentrated in lower-income settings exhibited inverse ecological associations. Tobacco consumption remained associated after adjustment for the other included covariates across all demographic groups, a finding consistent with established epidemiological evidence on tobacco, although this consistency does not constitute independent validation of the ecological models [12,49].
Expected years of schooling and meat consumption showed positive associations in the primary models, although their significance was less consistent in the additional GDP-adjusted analyses. Schooling may represent broader socioeconomic conditions rather than a direct biological risk factor [50,51]. Personal health expenditure showed positive bivariate correlations but less consistent adjusted associations [52,53].
Meat consumption should be interpreted as an ecological correlate that may capture broader dietary and lifestyle patterns [54]. Previous studies have examined associations between meat intake and lung cancer, but the present analysis cannot distinguish specific foods, biological mechanisms, or individual-level effects [55,56].
Occupational silica exposure showed small positive ecological correlations with lung cancer incidence across all demographic groups (ρ = 0.194–0.278). Crystalline silica is an established human lung carcinogen, and occupational studies have documented increased lung cancer risk [57,58]. However, these country-level correlations do not quantify individual risk or establish causality. The indicator may inadequately represent cumulative exposure, occupational histories, and latency, and the observed associations remain susceptible to contextual confounding [57].
Environmental indicators showed more complex patterns. NO2 and SO2 concentrations were positively correlated with lung cancer incidence in the ecological analyses; however, these associations lost statistical significance after adjustment for tobacco consumption and socioeconomic variables [59]. NO2 and SO2 did not show statistically significant adjusted associations in these models. This finding does not establish their relative causal contributions compared with smoking and may reflect confounding, exposure measurement limitations, or temporal mismatch. The attenuation of these associations in multivariable models highlights the importance of considering multiple determinants simultaneously when evaluating population-level cancer burden [60,61].
4.2. Ecological Interpretation of the Findings
The inverse correlations observed for unsafe water and sanitation should not be interpreted as protective effects. They may reflect contextual differences in historical exposures, socioeconomic conditions, diagnostic capacity, and cancer surveillance. These explanations remain hypotheses because their contributions were not directly evaluated [10]. Occupational silica exposure showed small positive correlations and therefore does not exemplify an inverse ecological association in this dataset.
The secondary exploratory ROC analyses describe within-sample ecological discrimination but do not independently validate the correlation or regression findings [37]. Their AUC estimates should not be interpreted as individual-level predictive performance [38,62,63].
Additional adjustment for GDP per capita supported the stability of the tobacco association while indicating greater uncertainty for meat availability and schooling. Differences from the primary models reflect GDP adjustment, restriction to a complete-case sample, and the use of robust standard errors. GDP per capita provides partial adjustment for national development but does not directly measure diagnostic capacity or cancer-registration completeness.
4.3. Potential Influence of Diagnostic Capacity and Cancer Registration Systems
Differences in diagnostic infrastructure, healthcare access, and cancer registration systems may have contributed to the geographic variation observed in this study. Several low-income countries, particularly in Sub-Saharan Africa, reported substantially lower incidence rates despite exhibiting a high prevalence of adverse environmental and occupational exposures. This pattern may partly reflect underdiagnosis, limited access to imaging and pathology services, shorter life expectancy, and incomplete cancer registration systems. Consequently, the inverse ecological associations observed for unsafe sanitation and unsafe water sources may partly reflect differences in disease detection and reporting rather than protective effects.
Differences in access to imaging, pathology, and population-based registries may affect case ascertainment. Although age-standardization accounts for differences in population age composition, historical exposures, competing mortality, and survival patterns may still differ across countries.
Previous GBD studies have characterized lung cancer burden and attributable risks [10,12,18]. The present analysis provides a complementary examination of country-level associations; however, explanations involving socioeconomic development and surveillance remain hypotheses rather than mechanisms demonstrated by this study [7,19,35].
4.4. Strengths and Limitations
The study’s strengths include its broad geographic scope across 183 countries, the evaluation of indicators from multiple domains, and analyses of incidence in the total population, males, females, and individuals aged 15–64 years. These analyses characterize country-level patterns, although overlapping demographic groups do not constitute independent replication.
Several limitations warrant consideration. The ecological cross-sectional design precludes causal inference, and country-level associations may not reflect individual-level relationships. Differences in diagnostic capacity, healthcare access, and cancer-registration completeness may influence incidence estimates. Exposure indicators also represent different reference periods and may poorly capture the historical and cumulative exposures relevant to lung cancer latency. Their integration into a common dataset does not eliminate temporal or measurement heterogeneity.
Residual confounding remains despite additional adjustment for GDP per capita. Life expectancy, population age structure, urbanization, diagnostic intensity, registration quality, and historical smoking exposure were not directly controlled. Individual smoking histories, occupational exposure histories, genetic susceptibility, and histological subtypes were unavailable. Occupational silica indicators should therefore not be interpreted as evidence against its established carcinogenicity.
Correlation and ROC analyses were exploratory; median dichotomization reduced information, and selection and evaluation of indicators in the same dataset may have inflated apparent discrimination. Multiple testing without adjustment and correlation-based predictor selection increase the possibility of chance findings and uncertainty beyond that represented by model p-values. ROC results do not establish individual-level predictive performance. Additional complete-case models excluded 43 countries (23.5%), potentially reducing representativeness and introducing selection bias. Sensitivity analyses also showed that some regression findings depended on influential observations.
4.5. Future Studies and Perspectives
Future studies should incorporate longitudinal designs, historical exposure data, and more granular regional assessments to better disentangle the complex interactions among tobacco use, environmental pollution, socioeconomic development, healthcare access, and dietary patterns [35,64,65]. Additionally, integrating mortality, disability-adjusted life years, and temporal trend analyses may provide a more comprehensive understanding of the evolving global burden of lung cancer.
International ecological comparisons should be interpreted within their developmental and surveillance contexts. Tobacco-control policies remain supported by established evidence, alongside investments in diagnostic access and cancer registration.
5. Conclusions
Lung cancer incidence varied substantially across the countries included in this ecological analysis. Tobacco use prevalence showed positive adjusted country-level associations across all demographic groups, including additional GDP-adjusted models and sensitivity analyses. Meat availability and expected years of schooling also showed positive associations, although their statistical significance was less consistent under robust inference. Adjustment for GDP per capita produced only small changes in model fit and did not eliminate potential confounding by historical exposures, diagnostic capacity, or cancer-registration completeness. These findings should be interpreted as exploratory ecological associations rather than individual-level causal effects.
Supplementary Materials
The following supporting information can be downloaded at: https://www.mdpi.com/article/10.3390/epidemiologia7060151/s1, Table S1. Data Provenance, Definitions, and Analytical Availability of Variables Initially Considered for the Global Ecological Analysis of Lung Cancer Incidence. Table S2. Exploratory Spearman Correlations between Lung Cancer Incidence and Selected Country-Level Indicators. Table S3. Countries with the Highest and Lowest Available Values of Selected Country-Level Indicators and Corresponding Lung Cancer Incidence Rates. Table S4. Collinearity Diagnostics Across Demographic-Specific Multivariable Regression Models. Table S5. Tolerance Statistics Across Demographic-Specific Multivariable Regression Models. Table S6. Additional GDP-Adjusted Regression Models, Diagnostics, and Sensitivity Analyses for Lung Cancer Incidence. Figure S1. Spearman’s rank correlation coefficients (ρ) between selected socioeconomic, environmental, and lifestyle factors and trachea, bronchus, and lung cancer incidence according to demographic groups. Figure S2. Heatmap illustrating the area under the receiver operating characteristic curve (AUC) for selected socioeconomic, environmental, and dietary determinants associated with trachea, bronchus, and lung cancer incidence across demographic groups.
Author Contributions
Conceptualization, G.A.H.-F. and I.D.-E.; Methodology, N.C.-G., K.B.C.-P., K.S.-M., A.I.-d.Á., M.W.-G., S.Y.L.-A. and G.A.H.-F.; Software, N.C.-G., A.O.-M., E.X.I.-F., K.B.C.-P., K.S.-M. and S.Y.L.-A.; Validation, N.C.-G., K.B.C.-P., K.S.-M., A.I.-d.Á., M.W.-G., D.T.-J. and S.Y.L.-A.; Formal analysis, G.A.H.-F., K.B.C.-P., A.I.-d.Á., M.W.-G. and J.A.O.-L.; Investigation, G.A.H.-F., N.C.-G., A.O.-M., E.X.I.-F., V.H.C.-K., M.A.A.-P., S.Y.L.-A. and D.T.-J.; Resources, N.C.-G., V.H.C.-K., M.A.A.-P., U.D.-L. and S.Y.L.-A.; Data curation, E.X.I.-F., V.H.C.-K., M.A.A.-P. and U.D.-L.; Writing—original draft preparation, G.A.H.-F.; Writing—review and editing, G.A.H.-F., J.A.O.-L. and I.D.-E.; Visualization, U.D.-L., J.A.O.-L. and I.D.-E.; Supervision, G.A.H.-F., D.T.-J. and I.D.-E.; Project administration, G.A.H.-F. and I.D.-E.; Funding acquisition, I.D.-E. All authors have read and agreed to the published version of the manuscript.
Funding
This study was funded by the Mexican Secretariat of Science, Humanities, Technology and Innovation (SECIHTI, Mexico) through the Call for National Research and Incidence Projects, 2024 (grant PRONAII-2024-117; author I.D.-E.).
Institutional Review Board Statement
This study was based exclusively on publicly available, de-identified secondary data obtained from international databases. No individual-level information was accessed, and no interaction with human participants occurred. Therefore, according to international guidelines for secondary analyses of publicly available data, institutional ethics committee approval and informed consent were not required.
Informed Consent Statement
This study was based exclusively on publicly available, de-identified secondary data obtained from international databases. No individual-level information was accessed, and no interaction with human participants occurred. Therefore, according to international guidelines for secondary analyses of publicly available data, institutional ethics committee approval and informed consent were not required.
Data Availability Statement
The original contributions presented in the study are included in the article/Supplementary Material; further inquiries can be directed to the corresponding authors.
Acknowledgments
G.A. Hernandez-Fuentes would like to express his gratitude for the financial support from SECIHTI, Mexico, for his postdoctoral studies (633738). J.A.O.-L. and S.Y.L.-A. gratefully acknowledge the financial support provided by SECIHTI, Mexico, for their doctoral studies (scholarship numbers 952976 and 612907, respectively).
Conflicts of Interest
The authors declare no conflicts of interest.
References
- Global Burden of Disease (GBD) Global Burden of Disease (GBD). Available online: https://www.healthdata.org/research-analysis/gbd (accessed on 3 June 2026).
- Bray, F.; Laversanne, M.; Sung, H.; Ferlay, J.; Siegel, R.L.; Soerjomataram, I.; Jemal, A. Global Cancer Statistics 2022: GLOBOCAN Estimates of Incidence and Mortality Worldwide for 36 Cancers in 185 Countries. CA Cancer J. Clin. 2024, 74, 229–263. [Google Scholar] [CrossRef] [Scilit] [PubMed]
- Brock, B.A.; Mir, H.; Flenaugh, E.L.; Oprea-Ilies, G.; Singh, R.; Singh, S. Social and Biological Determinants in Lung Cancer Disparity. Cancers 2024, 16, 612. [Google Scholar] [CrossRef] [Scilit] [PubMed]
- Walser, T.; Cui, X.; Yanagawa, J.; Lee, J.M.; Heinrich, E.; Lee, G.; Sharma, S.; Dubinett, S.M. Smoking and Lung Cancer: The Role of Inflammation. Proc. Am. Thorac. Soc. 2008, 5, 811. [Google Scholar] [CrossRef] [Scilit] [PubMed]
- Islami, F.; Torre, L.A.; Jemal, A. Global Trends of Lung Cancer Mortality and Smoking Prevalence. Transl. Lung Cancer Res. 2015, 4, 327–338. [Google Scholar] [CrossRef] [Scilit] [PubMed]
- Schabath, M.B.; Cote, M.L. Cancer Progress and Priorities: Lung Cancer. Cancer Epidemiol. Biomark. Prev. 2019, 28, 1563. [Google Scholar] [CrossRef] [Scilit] [PubMed]
- Clegg, L.X.; Reichman, M.E.; Miller, B.A.; Hankey, B.F.; Singh, G.K.; Lin, Y.D.; Goodman, M.T.; Lynch, C.F.; Schwartz, S.M.; Chen, V.W.; et al. Impact of Socioeconomic Status on Cancer Incidence and Stage at Diagnosis: Selected Findings from the Surveillance, Epidemiology, and End Results: National Longitudinal Mortality Study. Cancer Causes Control 2008, 20, 417–435. [Google Scholar] [CrossRef] [Scilit] [PubMed]
- Emmanuel, W.; Sylvia, K.; Kevin, N.; Martin, N.; Monicah, B. Prevalence and Correlates of Modifiable and Environmental Risk Factors for Non Communicable Diseases among Refugees and Asylum Seekers in Northern Kenya. Confl. Health 2026, 20, 34. [Google Scholar] [CrossRef] [Scilit] [PubMed]
- Kaneko, M.; Ikeda, T. Association between Rurality and Mortality from Major Diseases in Japan: An Ecological Study. BMJ Open 2026, 16, e103227. [Google Scholar] [CrossRef] [Scilit] [PubMed]
- Wakefield, J. Ecologic Studies Revisited. Annu. Rev. Public Health 2008, 29, 75–90. [Google Scholar] [CrossRef] [Scilit] [PubMed]
- Lin, J.; Xie, X.; Zheng, X.; Shi, H. Global Burden and Trends of Tracheal, Bronchus, and Lung Cancer Attributed to Occupational Exposure to Polycyclic Aromatic Hydrocarbons in Regions with Different Sociodemographic Index, 1990–2021. PLoS ONE 2026, 21, e0342250. [Google Scholar] [CrossRef] [Scilit] [PubMed]
- Kuang, Z.; Wang, J.; Liu, K.; Wu, J.; Ge, Y.; Zhu, G.; Cao, L.; Ma, X.; Li, J. Global, Regional, and National Burden of Tracheal, Bronchus, and Lung Cancer and Its Risk Factors from 1990 to 2021: Findings from the Global Burden of Disease Study 2021. eClinicalMedicine 2024, 75, 102804. [Google Scholar] [CrossRef] [Scilit] [PubMed]
- Sung, H.; Filho, A.M.; Laversanne, M.; Ferlay, J.; Siegel, R.L.; Soerjomataram, I.; Jemal, A.; Bray, F. Global Cancer Statistics 2024: GLOBOCAN Estimates of Incidence and Mortality Worldwide for 34 Cancers in 186 Countries. CA Cancer J. Clin. 2026, 76, e70090. [Google Scholar] [CrossRef] [Scilit] [PubMed]
- GCO Cancer Today. Available online: https://gco.iarc.who.int/today/en (accessed on 8 October 2026).
- United Nations Development Programme Home|United Nations Development Programme. Available online: https://www.undp.org/ (accessed on 3 June 2026).
- World Health Organization via World Bank Our World in Data. 2022. Available online: https://ourworldindata.org/grapher/out-of-pocket-expenditure-per-capita-on-healthcare?tab=table (accessed on 7 October 2024).
- UN Food and Agriculture Organization (FAO)—Processed by Our World in Data Global Food Data Explorer: Per Capita Kilocalorie Supply from All Meat per Day, 1961 to 2020. Available online: https://www.fao.org/faostat/en/#data/FBS (accessed on 7 October 2024).
- Zhang, X.; Zou, J.; Ning, J.; Qu, R.; Zhao, Y.; Lv, C.; Liang, Y.; Zhang, Y. Disease Burden of Trachea, Bronchus and Lung Cancer 1990–2021 and Global Trends Projected to 2035. Sci. Rep. 2025, 15, 6264. [Google Scholar] [CrossRef] [Scilit] [PubMed]
- Diaz-Martinez, J.; Hernández-Fuentes, G.A.; Delgado-Enciso, J.; Alcalá-Pérez, M.A.; Jiménez-Calvo, I.; Sánchez-Ramírez, C.A.; Rojas-Larios, F.; Rodriguez-Hernandez, A.; Ramírez-Flores, M.; Guzmán-Esquivel, J.; et al. Beyond Biology: Uncovering Structural and Sociocultural Predictors of Breast Cancer Incidence Worldwide. Curr. Oncol. 2025, 32, 553. [Google Scholar] [CrossRef] [Scilit] [PubMed]
- Taha, S.S.; Idoudi, S.; Alhamdan, N.; Ibrahim, R.H.; Surkatti, R.; Amhamed, A.; Alrebei, O.F. Comprehensive Review of Health Impacts of the Exposure to Nitrogen Oxides (NOx), Carbon Dioxide (CO2), and Particulate Matter (PM). J. Hazard. Mater. Adv. 2025, 19, 100771. [Google Scholar] [CrossRef] [Scilit]
- Böhm, G.M. Air Pollution and Lung Cancer. Cancer Detect. Prev. 1982, 5, 371–374. [Google Scholar] [CrossRef] [Scilit]
- Elmadani, M.; Mokaya, P.O.; Omer, A.A.A.; Kiptulon, E.K.; Klara, S.; Orsolya, M. Cancer Burden in Europe: A Systematic Analysis of the GLOBOCAN Database (2022). BMC Cancer 2025, 25, 447. [Google Scholar] [CrossRef] [Scilit] [PubMed]
- Food and Agriculture Organization of the United Nations FAOSTAT. Data. Available online: https://www.fao.org/faostat/en/#data (accessed on 7 October 2024).
- WHO. Global Health Observatory Data Repository. Available online: https://data.who.int/indicators/i/C6262EC/BEFA58B (accessed on 7 October 2024).
- Institute for Health Metrics and Evaluation. Global Burden of Disease (GBD) Study Compare. Available online: https://vizhub.healthdata.org/gbd-compare/# (accessed on 7 October 2024).
- United Nations Development Programme Human Development Report. (2021–22) Our World in Data. (2020–2022). Available online: https://ourworldindata.org/grapher/expected-years-of-schooling (accessed on 7 October 2024).
- UNICEF Access to Drinking Water—UNICEF DATA. Available online: https://data.unicef.org/topic/water-and-sanitation/drinking-water/ (accessed on 3 June 2026).
- UNICEF Water, Sanitation and Hygiene|UNICEF Supply Division. Available online: https://www.unicef.org/supply/water-sanitation-and-hygiene (accessed on 3 June 2026).
- Nabi, M.H.; Rupa, F.H.; Jahan, I.; Hasan, A.B.M.N.; Naz, F.; Masud, I.; Hawlader, M.D.H.; Hossian, M. Water, Sanitation, and Hygiene (WASH) Factors and the Incidence of Communicable Diseases in Urban Bangladesh: Evidence from Municipal Areas. PLoS Negl. Trop. Dis. 2025, 19, e0013329. [Google Scholar] [CrossRef] [Scilit] [PubMed]
- Dudley, W.N.; Benuzillo, J.G.; Carrico, M.S. SPSS and SAS Programming for the Testing of Mediation Models. Nurs. Res. 2004, 53, 59–62. [Google Scholar] [CrossRef] [Scilit] [PubMed]
- Rosner, B. (Ed.) Fundamentals of Biostatistics, 7th ed.; Brooks/Cole, Cengage Learning: Boston, MA, USA, 2011; Volume 1. [Google Scholar]
- Rezende, M.P.; Faria, F.A.; Beraldo, D.P.; Polido, J.; Beifort, R., Jr.; Cabral, T. Analysis of Correlations between Biomarkers Assessed with Swept-Source OCT and OCT Angiography in Naïve Patients with Diabetic Macular Edema Treated with Aflibercept: A Prospective Study. Int. J. Retin. Vitr. 2025, 12, 18. [Google Scholar] [CrossRef] [Scilit] [PubMed]
- Papageorgiou, S.N. On Correlation Coefficients and Their Interpretation. J. Orthod. 2022, 49, 359. [Google Scholar] [CrossRef] [Scilit] [PubMed]
- Celentano, D.D.; Szklo, M.; Leon, G. Gordis Epidemiology; Elsevier: Amsterdam, The Netherlands, 2019; p. 410. [Google Scholar]
- Rothman, K.; Greenland, S.; Lash, T. Modern Epidemiology with Access Code; Lippincott Williams & Wilkins: Philadelphia, PA, USA, 2021. [Google Scholar]
- World Health Statistics. Available online: https://www.who.int/data/gho/publications/world-health-statistics (accessed on 3 June 2026).
- Zweig, M.H.; Campbell, G. Receiver-Operating Characteristic (ROC) Plots: A Fundamental Evaluation Tool in Clinical Medicine. Clin. Chem. 1993, 39, 561–577. [Google Scholar] [CrossRef] [Scilit]
- Hosmer, D.W.; Lemeshow, S.; Sturdivant, R.X. Applied Logistic Regression, 3rd ed.; John Wiley & Sons: Hoboken, NJ, USA, 2013; pp. 1–510. [Google Scholar] [CrossRef] [Scilit]
- Polo, T.C.F.; Miot, H.A. Aplicações Da Curva ROC Em Estudos Clínicos e Experimentais. J. Vasc. Bras. 2020, 19, 200186. [Google Scholar] [CrossRef] [Scilit] [PubMed]
- Cerda, J.; Cifuentes, L. Uso de Curvas ROC En Investigación Clínica: Aspectos Teórico-Prácticos. Rev. Chil. Infectol. 2012, 29, 138–141. [Google Scholar] [CrossRef] [Scilit] [PubMed]
- Mendoza Hernandez, M.; Hernandez Fuentes, G.; Sanchez Ramirez, C.; Rojas Larios, F.; Guzman Esquivel, J.; Rodriguez Sanchez, I.; Martinez Fierro, M.; Cardenas Rojas, M.; De Leon Zaragoza, L.; Trujillo Hernandez, B.; et al. Time dependent ROC Curve Analysis to Determine the Predictive Capacity of Seven Clinical Scales for Mortality in Patients with COVID 19: Study of a Hospital Cohort with Very High Mortality. Biomed. Rep. 2024, 20, 100. [Google Scholar] [CrossRef] [Scilit] [PubMed]
- Jaffa, M.A.; Gebregziabher, M.; Luttrell, D.K.; Luttrell, L.M.; Jaffa, A.A. Multivariate Generalized Linear Mixed Models with Random Intercepts to Analyze Cardiovascular Risk Markers in Type-1 Diabetic Patients. J. Appl. Stat. 2016, 43, 1447–1464. [Google Scholar] [CrossRef] [Scilit] [PubMed]
- Concato, J.; Feinstein, A.R.; Holford, T.R. The Risk of Determining Risk with Multivariable Models. Ann. Intern. Med. 1993, 118, 201–210. [Google Scholar] [CrossRef] [Scilit] [PubMed]
- Lundgreen, C.S.; Larson, D.R.; Atkinson, E.J.; Devick, K.L.; Lewallen, D.G.; Berry, D.J.; Maradit Kremers, H.; Crowson, C.S. Adjusted Survival Curves Improve Understanding of Multivariable Cox Model Results. J. Arthroplast. 2021, 36, 3367–3371. [Google Scholar] [CrossRef] [Scilit] [PubMed]
- Intemann, T.; Haug, U.; Pigeot, I.; Intemann, T.; Haug, U.; Pigeot, I. Use of Secondary and Registry Data for Digital Public Health; Springer Nature: Cham, Switzerland, 2025; pp. 537–561. [Google Scholar] [CrossRef] [Scilit]
- Tripathy, J.P. Secondary Data Analysis: Ethical Issues and Challenges. Iran. J. Public Health 2013, 42, 1478. [Google Scholar] [PubMed]
- Thygesen, L.C.; Ersbøll, A.K. When the Entire Population Is the Sample: Strengths and Limitations in Register-Based Epidemiology. Eur. J. Epidemiol. 2014, 29, 551–558. [Google Scholar] [CrossRef] [Scilit] [PubMed]
- Abravan, A.; Fornacon-Wood, I.; Kingston, R.; Topping, D.; Price, G. Environmental Determinants of Cancer Outcomes: A Scoping Review. Radiother. Oncol. 2026, 217, 111408. [Google Scholar] [CrossRef] [Scilit] [PubMed]
- Cao, W.; You, Z.; Wang, Z.; Liang, Z.; Li, H.; Chang, Z.; Chen, Y.; Dong, G.; Cheng, Z.J.; Sun, B. Risk Factors behind the Global Lung Cancer Burden: A Pan-Database Exploration. Transl. Lung Cancer Res. 2025, 14, 2452–2469. [Google Scholar] [CrossRef] [Scilit] [PubMed]
- Borg, M.; Løkke, A.; Henriksen, M.; Wen, S.W.C.; Ibsen, R.; Hilberg, O. Educational Attainment and Employment Status in Lung Cancer Patients: A Nationwide Study. Clin. Transl. Oncol. 2025, 28, 176. [Google Scholar] [CrossRef] [Scilit] [PubMed]
- Onwuka, J.U.; Zahed, H.; Feng, X.; Alcala, K.; Erhunmwunsee, L.; Williams, R.M.; Aldrich, M.C.; Ahluwalia, J.S.; Albanes, D.; Arslan, A.A.; et al. Association between Socioeconomic Position and Lung Cancer Incidence in 16 Countries: A Prospective Cohort Consortium Study. eClinicalMedicine 2025, 82, 103152. [Google Scholar] [CrossRef] [Scilit] [PubMed]
- Yilihamu, G.; Aierxiding, S. Current Status of Cancer Education in Developing and Developed Countries: Identifying the Disparities and Bridging the Gap. Front. Public Health 2025, 13, 1608525. [Google Scholar] [CrossRef] [Scilit] [PubMed]
- Zheng, R.; Wang, S.; Zhang, S.; Zeng, H.; Chen, R.; Sun, K.; Li, L.; Bray, F.; Wei, W. Global, Regional, and National Lifetime Probabilities of Developing Cancer in 2020. Sci. Bull. 2023, 68, 2620–2628. [Google Scholar] [CrossRef] [Scilit] [PubMed]
- Lim, W.Y.; Chuah, K.L.; Eng, P.; Leong, S.S.; Lim, E.; Lim, T.K.; Ng, A.; Poh, W.T.; Tee, A.; Teh, M.; et al. Meat Consumption and Risk of Lung Cancer among Never-Smoking Women. Nutr. Cancer 2011, 63, 850–859. [Google Scholar] [CrossRef] [Scilit] [PubMed]
- Li-Hua, P.; Bajinka, O. Processed Meat Health Risks: Pathways and Dietary Solutions. J. Nutr. 2025, 155, 3584–3594. [Google Scholar] [CrossRef] [Scilit] [PubMed]
- Wu, K.; Liu, L.; Shu, T.; Li, A.; Xia, D.; Sun, X. The Relationship between Processed Meat, Red Meat, and Risk of Types of Cancer: A Mendelian Randomization Study. Front. Nutr. 2022, 9, 942155. [Google Scholar] [CrossRef] [Scilit] [PubMed]
- Liu, Y.; Steenland, K.; Rong, Y.; Hnizdo, E.; Huang, X.; Zhang, H.; Shi, T.; Sun, Y.; Wu, T.; Chen, W. Exposure-Response Analysis and Risk Assessment for Lung Cancer in Relationship to Silica Exposure: A 44-Year Cohort Study of 34,018 Workers. Am. J. Epidemiol. 2013, 178, 1424–1433. [Google Scholar] [CrossRef] [Scilit] [PubMed]
- Morgenstern, H. Ecologic Studies in Epidemiology: Concepts, Principles, and Methods. Annu. Rev. Public Health 1995, 16, 61–81. [Google Scholar] [CrossRef] [PubMed]
- Feng, M.; Wang, F.; Bao, M.; Zhu, L. Environmental Risk Factors, Protective Factors and Lifestyles for Lung Cancer: An Umbrella Review. Front. Public Health 2025, 13, 1623840. [Google Scholar] [CrossRef] [Scilit] [PubMed]
- Gozlu, M.; Senol, O.; Cirakli, U.; Aslan, H.; Akbulut, F.; Gokkaya, D. The Effect of Air Pollution Quality on Lung Cancer Rates in Middle-Income and High-Income Countries: A Panel Data Analysis Approach. Front. Public Health 2024, 12, 1372320. [Google Scholar] [CrossRef] [Scilit] [PubMed]
- Li, D.; Shi, J.; Liang, D.; Ren, M.; He, Y. Lung Cancer Risk and Exposure to Air Pollution: A Multicenter North China Case–Control Study Involving 14,604 Subjects. BMC Pulm. Med. 2023, 23, 182. [Google Scholar] [CrossRef] [Scilit] [PubMed]
- Arredondo Montero, J.; Martín-Calvo, N. Diagnostic Performance Studies: Interpretation of ROC Analysis and Cut-Offs. Cir. Esp. (Engl. Ed.) 2023, 101, 865–867. [Google Scholar] [CrossRef] [Scilit] [PubMed]
- Unal, I. Defining an Optimal Cut-Point Value in ROC Analysis: An Alternative Approach. Comput. Math. Methods Med. 2017, 2017, 3762651. [Google Scholar] [CrossRef] [Scilit] [PubMed]
- An, D.H. CVD Mortality Disparities with Risk Factor Associations Across U.S. Counties. Healthcare 2025, 13, 2937. [Google Scholar] [CrossRef] [Scilit] [PubMed]
- Woodcock, J.; Tatah, L.; Anciaes, P.; Andersen, Z.; Bardhan, R.; Chen, X.; de Nazelle, A.; Gehring, U.; Gössling, S.; Helbich, M.; et al. Quantitative Health Impact Assessment of Environmental Exposures Linked to Urban Transport and Land Use in Europe: State of Research and Research Agenda. Curr. Environ. Health Rep. 2025, 12, 38. [Google Scholar] [CrossRef] [Scilit] [PubMed]

Disclaimer/Publisher’s Note: The statements, opinions and data contained in all publications are solely those of the individual author(s) and contributor(s) and not of MDPI and/or the editor(s). MDPI and/or the editor(s) disclaim responsibility for any injury to people or property resulting from any ideas, methods, instructions or products referred to in the content. |
© 2026 by the authors. Licensee MDPI, Basel, Switzerland. This article is an open access article distributed under the terms and conditions of the Creative Commons Attribution (CC BY) license.