


Abstract
Gallium oxide is an ultra-wide bandgap semiconductor with excellent opto-electronic properties, making it a highly promising material for a wide range of applications and devices. In this article, we report how the optical, morphological, structural, and compositional properties of -Ga2O3 thin films deposited by RF Sputtering on silicon substrates are affected by thermal treatments. Ellipsometric spectra recorded at multiple angles of incidence from several samples subjected to thermal annealing in the range of 550–1000 °C were analyzed to extract the optical functions using appropriate multilayer models. This analysis is complemented by compositional, structural, and morphological characterization techniques. We observed two main stages of crystallization with increasing annealing temperature; up to 700 °C, there is an increase in density and then, for 700–1000 °C, there is an improvement in crystallinity. While the refractive index increases continuously throughout this process, we found that the polarizability of the samples decreases in the first stage and increases in the second. These observations demonstrate that thermal treatments are a powerful tool to tune the optical properties of Ga2O3 thin films for device applications.
1. Introduction
Gallium oxide (Ga2O3), an emerging wide-bandgap semiconductor, has become increasingly popular in recent years due to its outstanding properties such as a high breakdown electric field of 8 MV/cm, ultra-wide bandgap of ∼4.85 eV at room temperature [1], tunable electrical conductivity [2], high thermal and chemical stability [3], and excellent radiation hardness [4].
Some of the key applications of Ga2O3 are Schottky barrier diodes, field effect transistors and deep-ultraviolet (DUV) photodetectors [4,5,6]. It is especially promising for a new generation of DUV photodetectors due to its solar blind response and tunable bandgap [3,6,7,8].
Regarding optical characteristics, and due to its wide bandgap providing high transparency in the visible and UV regions, this semiconductor is promising for integrated photonic applications in the UV to near-infrared (NIR) spectral range [9,10]. In addition to its potential for the development of low-loss waveguides, this material also stands out for its promise as a fast semiconductor scintillator, being considered the fastest among the semiconductor scintillators available for pulse height spectra [11]. In this context, this semiconductor, which combines unique electrical and optical properties, is particularly interesting for the development of opto-electronic applications, and even for the development of Photonic Integrated Circuits (PICs) [10,12].
Furthermore, high-quality thin films of Ga2O3 can be obtained through physical vapor deposition, and bulk crystals can also be grown through cost-effective melt-growth processes [13]. The present work focuses on the potential of radio-frequency (RF) sputtered thin films, which is a fast technique requiring very simple equipment, resulting in a quality coating over large areas on a wide variety of substrates [6,14]. By using thin films, we can leverage the micro- and nanofabrication techniques that are already developed and well-established for the silicon industry [13], as well as innovate through the use of flexible substrates for wearable devices [3].
However, despite its advantages, this physical deposition technique typically results in amorphous Ga2O3 films when performed at room temperature, irrespective of the crystalline structure of the substrate or gas conditions used [15,16]. Therefore, post-thermal treatments or performing the deposition at a higher temperature are essential for promoting the crystallization of these thin films [15,17]. Despite their fundamental importance for the design of optical applications, the correlation between optical properties such as the refractive index and the structural, morphological, and compositional changes induced by thermal annealing remains inadequately understood.
In this work, we systematically investigate the effects of thermal annealing on the refractive index of Ga2O3 thin films deposited by RF Sputtering on silicon substrates, together with the associated changes in structure and morphology. By using complementary techniques, both direct and indirect, we are able to determine how the refractive index of the material varies, and how this may be influenced by its density and polarizability.
2. Materials and Methods
The Ga2O3 thins films were deposited by RF Sputtering at 60 W and 6 mTorr working pressure, in a home-built chamber at room temperature. The substrate holder was placed at approximately 7.3 cm above the 2″ Ga2O3 target (99.99% purity, supplied by (Demaco Holland B.V., Oester 2, NL-1723 HW Noord-Scharwoude, The Netherlands), with an Ar flow of 15 sccm, totaling 1 h of deposition time. A ∼3.6 cm × 3.6 cm piece of Si wafer was used, which had been previously cleaned with acetone, isopropyl alcohol and deionized water.
The thickness of the thin film was determined through profilometry, performed on a Bruker Dektak XT, (Bruker, Karlsruhe, Germany) with a 2.5 µm stylus and scan speed of 6.67 µm/s. These measurements were done on a 3-by-3 grid.
The sample was then cut into 9 pieces, using a diamond-tipped pen. Following this, a study was performed by annealing 4 pieces at different temperatures, from 550 to 1000 °C, in 150 °C steps. The furnace was preheated to the desired temperature prior to inserting the samples, which were then annealed for 1 h in an air atmosphere before being allowed to cool naturally in air.
Spectroscopic ellipsometry (SE) measurements were performed on an SE-2000 Spectroscopic Ellipsometer (Semilab Inc., Budapest, Hungary) [18], with a spectral range spanning from 190 to 2100 nm, at incidence angles between 50 and 75°, with a step of 5°. The resulting data was processed using Semilab’s SEA (version 1.7.11) ellipsometric analysis software to perform the simulations and fits.
Atomic force microscopy (AFM) was performed on a Agilent 5100 PicoLE AFM/SPM system (Agilent Technologies, Santa Clara, CA, USA). These measurements were done in tapping mode, scanning a 1 µm × 1 µm area at a time, using a cantilever with a force constant of 5.4 N/m and a tip with a nominal radius smaller than 8 nm. The data was then processed using Gwyddion (version 2.68) [19].
Rutherford backscattering spectrometry (RBS) was carried out, using the 2.5 MV Van de Graaff accelerator at Instituto Superior Técnico [20] to generate a 1.8 MeV He+ beam to probe the samples. Two Si pin diode detectors were used, with a resolution of 15 keV, placed at 165° and 140° with respect to the beam incident direction, and the samples’ normal was tilted by 60° towards the detectors in order to enhance the depth resolution. The data from both detectors were fitted simultaneously using NDF [21], yielding information about the composition depth profile of the samples, while taking their surface roughness into account.
X-ray diffraction (XRD) was done in order to probe the crystalline structure of the thin films. - and grazing incidence scans were done on a Bruker D8 Discover Diffractometer (Bruker, Karlsruhe, Germany), which has a Cu anode and W cathode, operated at 40 kV/40 mA, in low-resolution mode. The primary beam was parallelized using a parabolic Göbel mirror and collimated using a 0.2 mm slit; the diffracted beam was collimated using long Soller slits and measured using a scintillation detector. Each sample was aligned using the 400 reflection from the Si substrate [22], which is the most intense peak, and the width of its peak was approximated to be the instrumental width for any calculations. The grazing incidence scans were taken at a 3° incidence angle, with the primary beam collimated by a 0.6 mm slit.
3. Results and Discussion
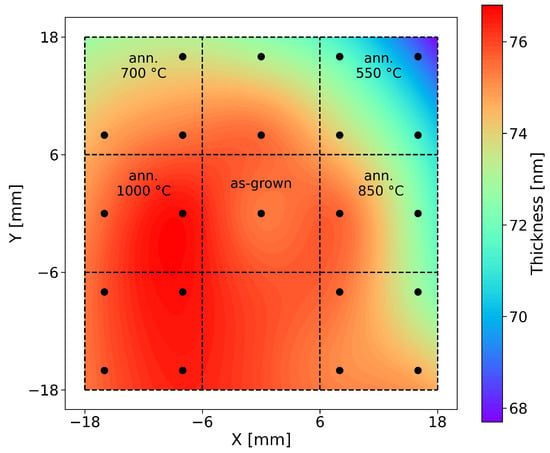
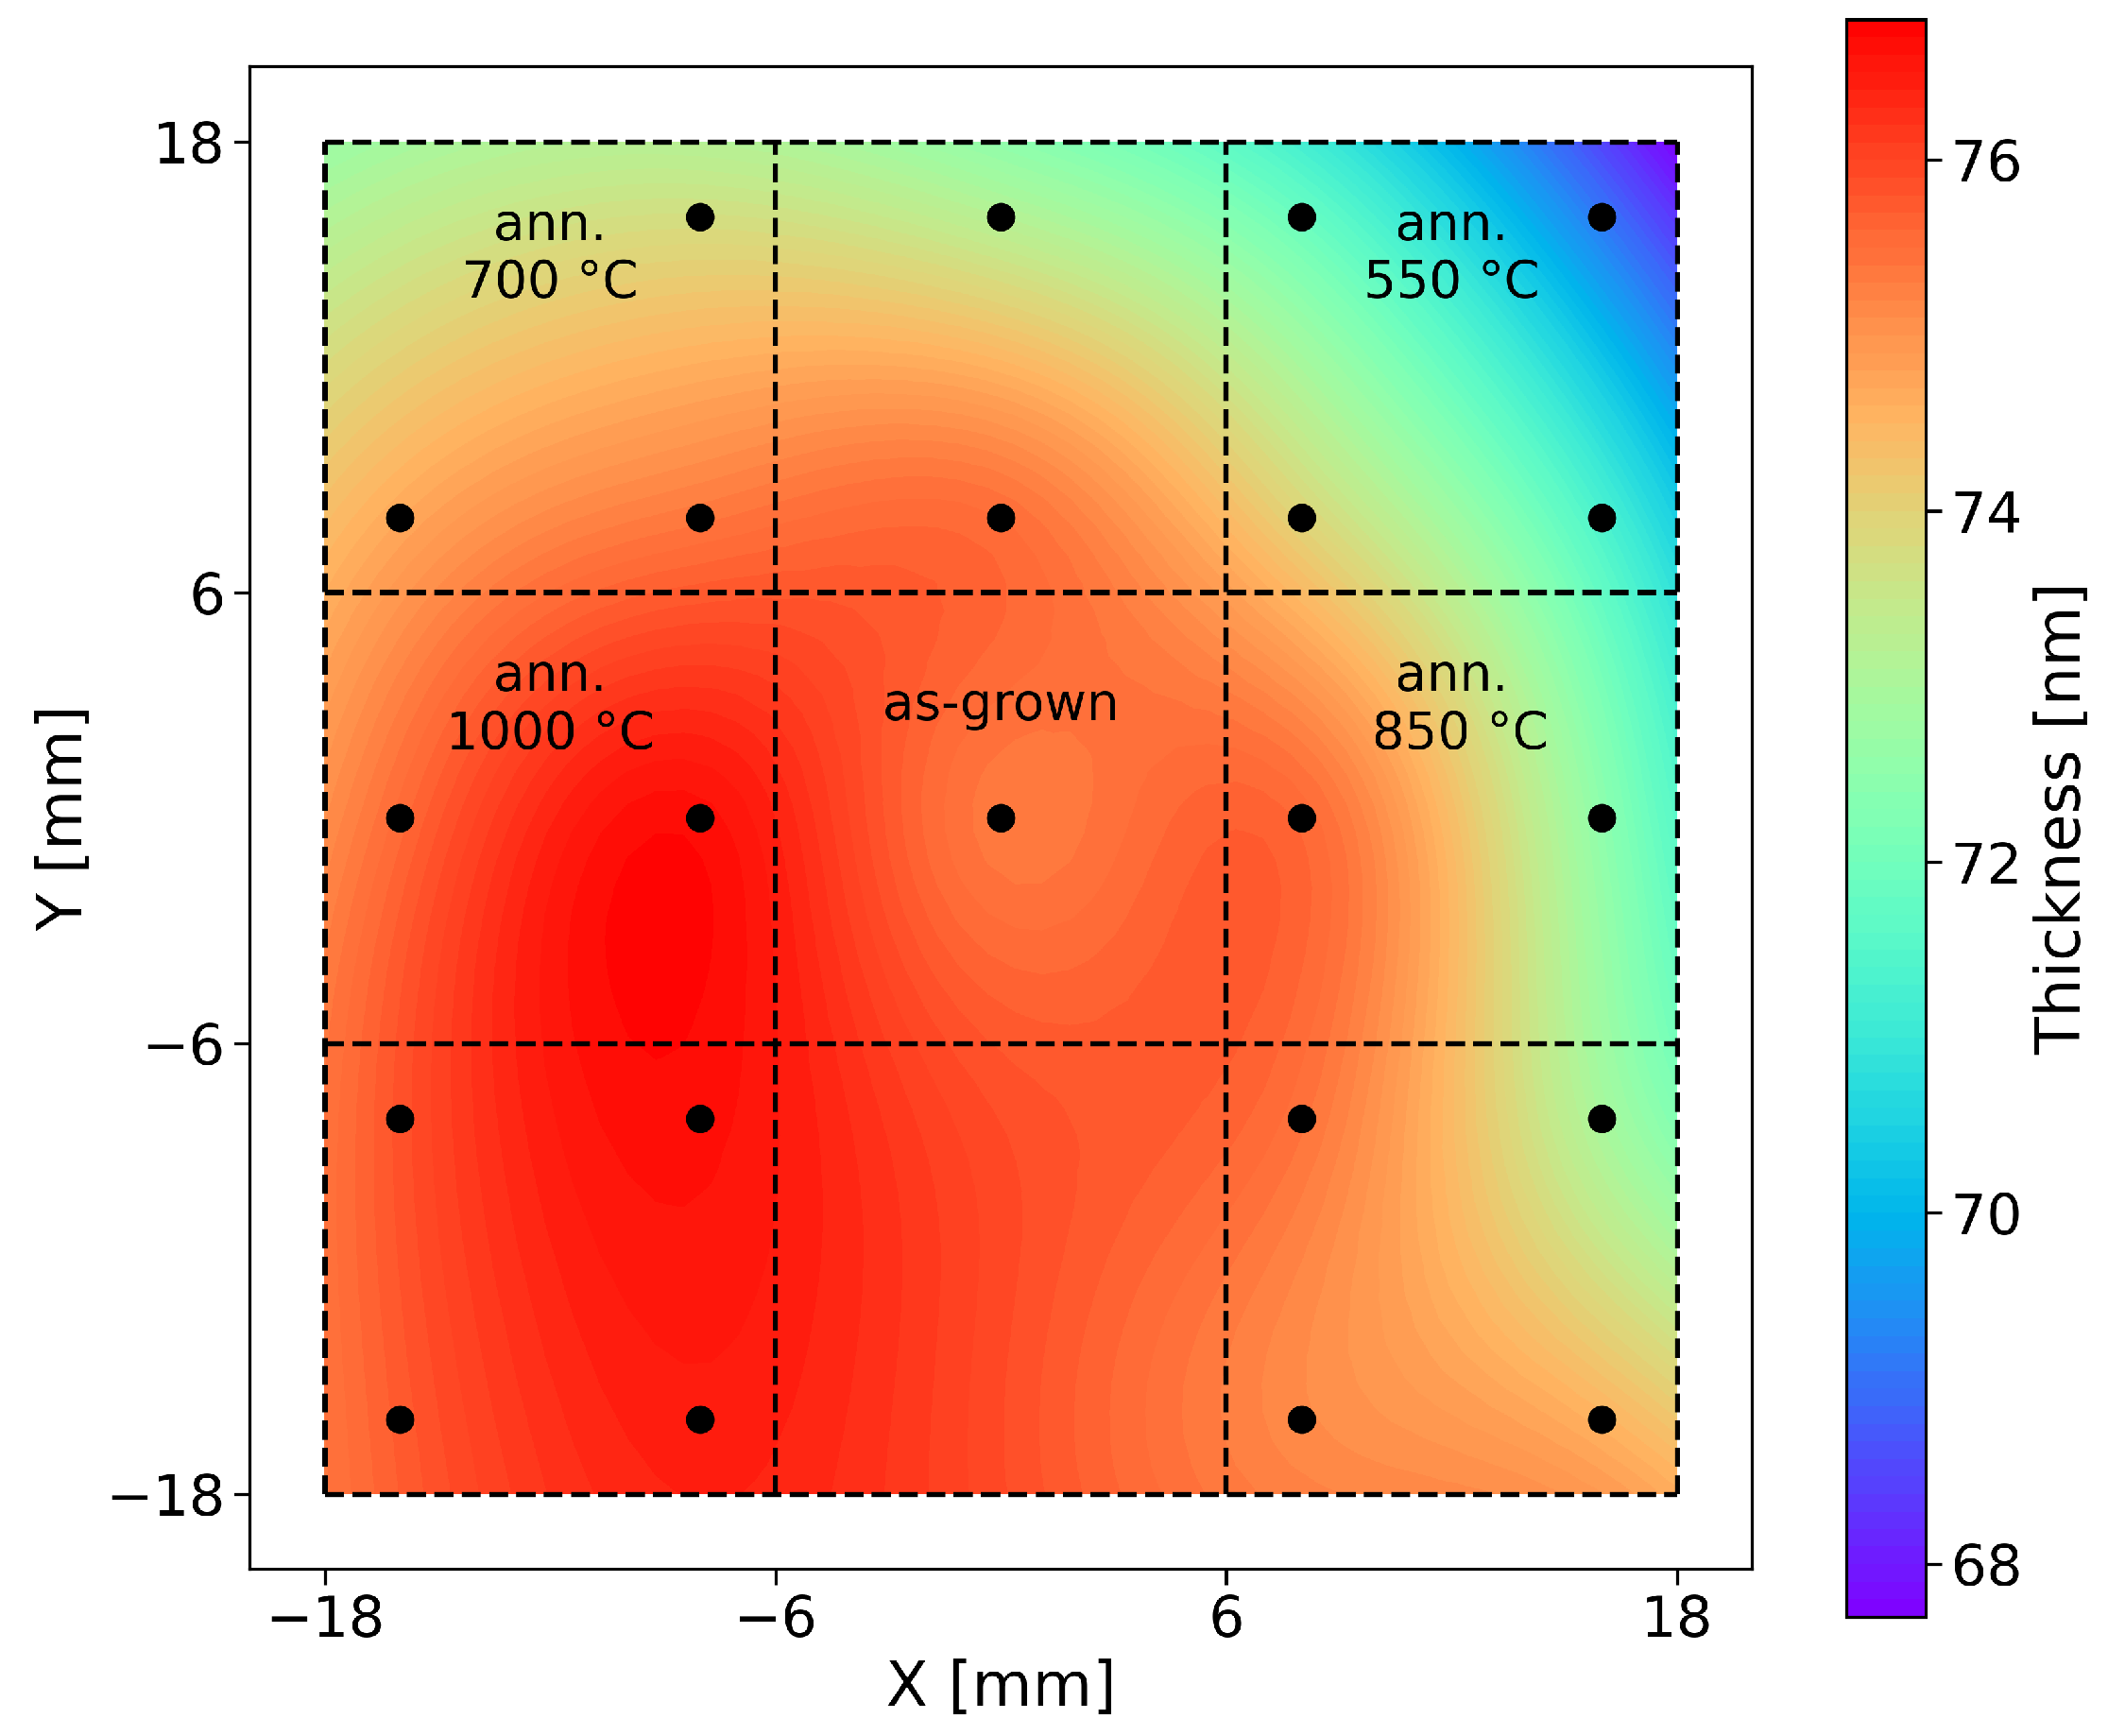
The thickness of the as-deposited film considered for this study was determined to be 73 ± 4 nm by profilometry. Through spectroscopic ellipsometry, we were also able to determine the variation of this thickness across the different pieces, see Figure 1. This map yielded a thickness of 74 ± 2 nm, with a uniformity of 94%, which is fairly good.
Figure 1.
Thickness map obtained through SE, using a Cauchy dispersion function to model data from 350 to 2100 nm. The dots represent measurement points, and the lines show how the sample was then divided and what piece was assigned to each post-deposition annealing temperature.
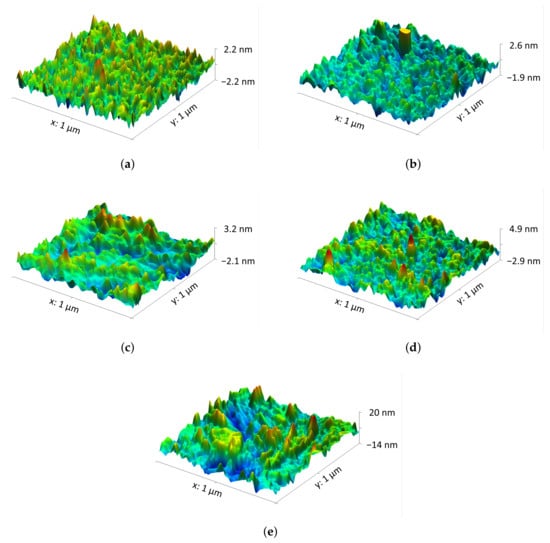
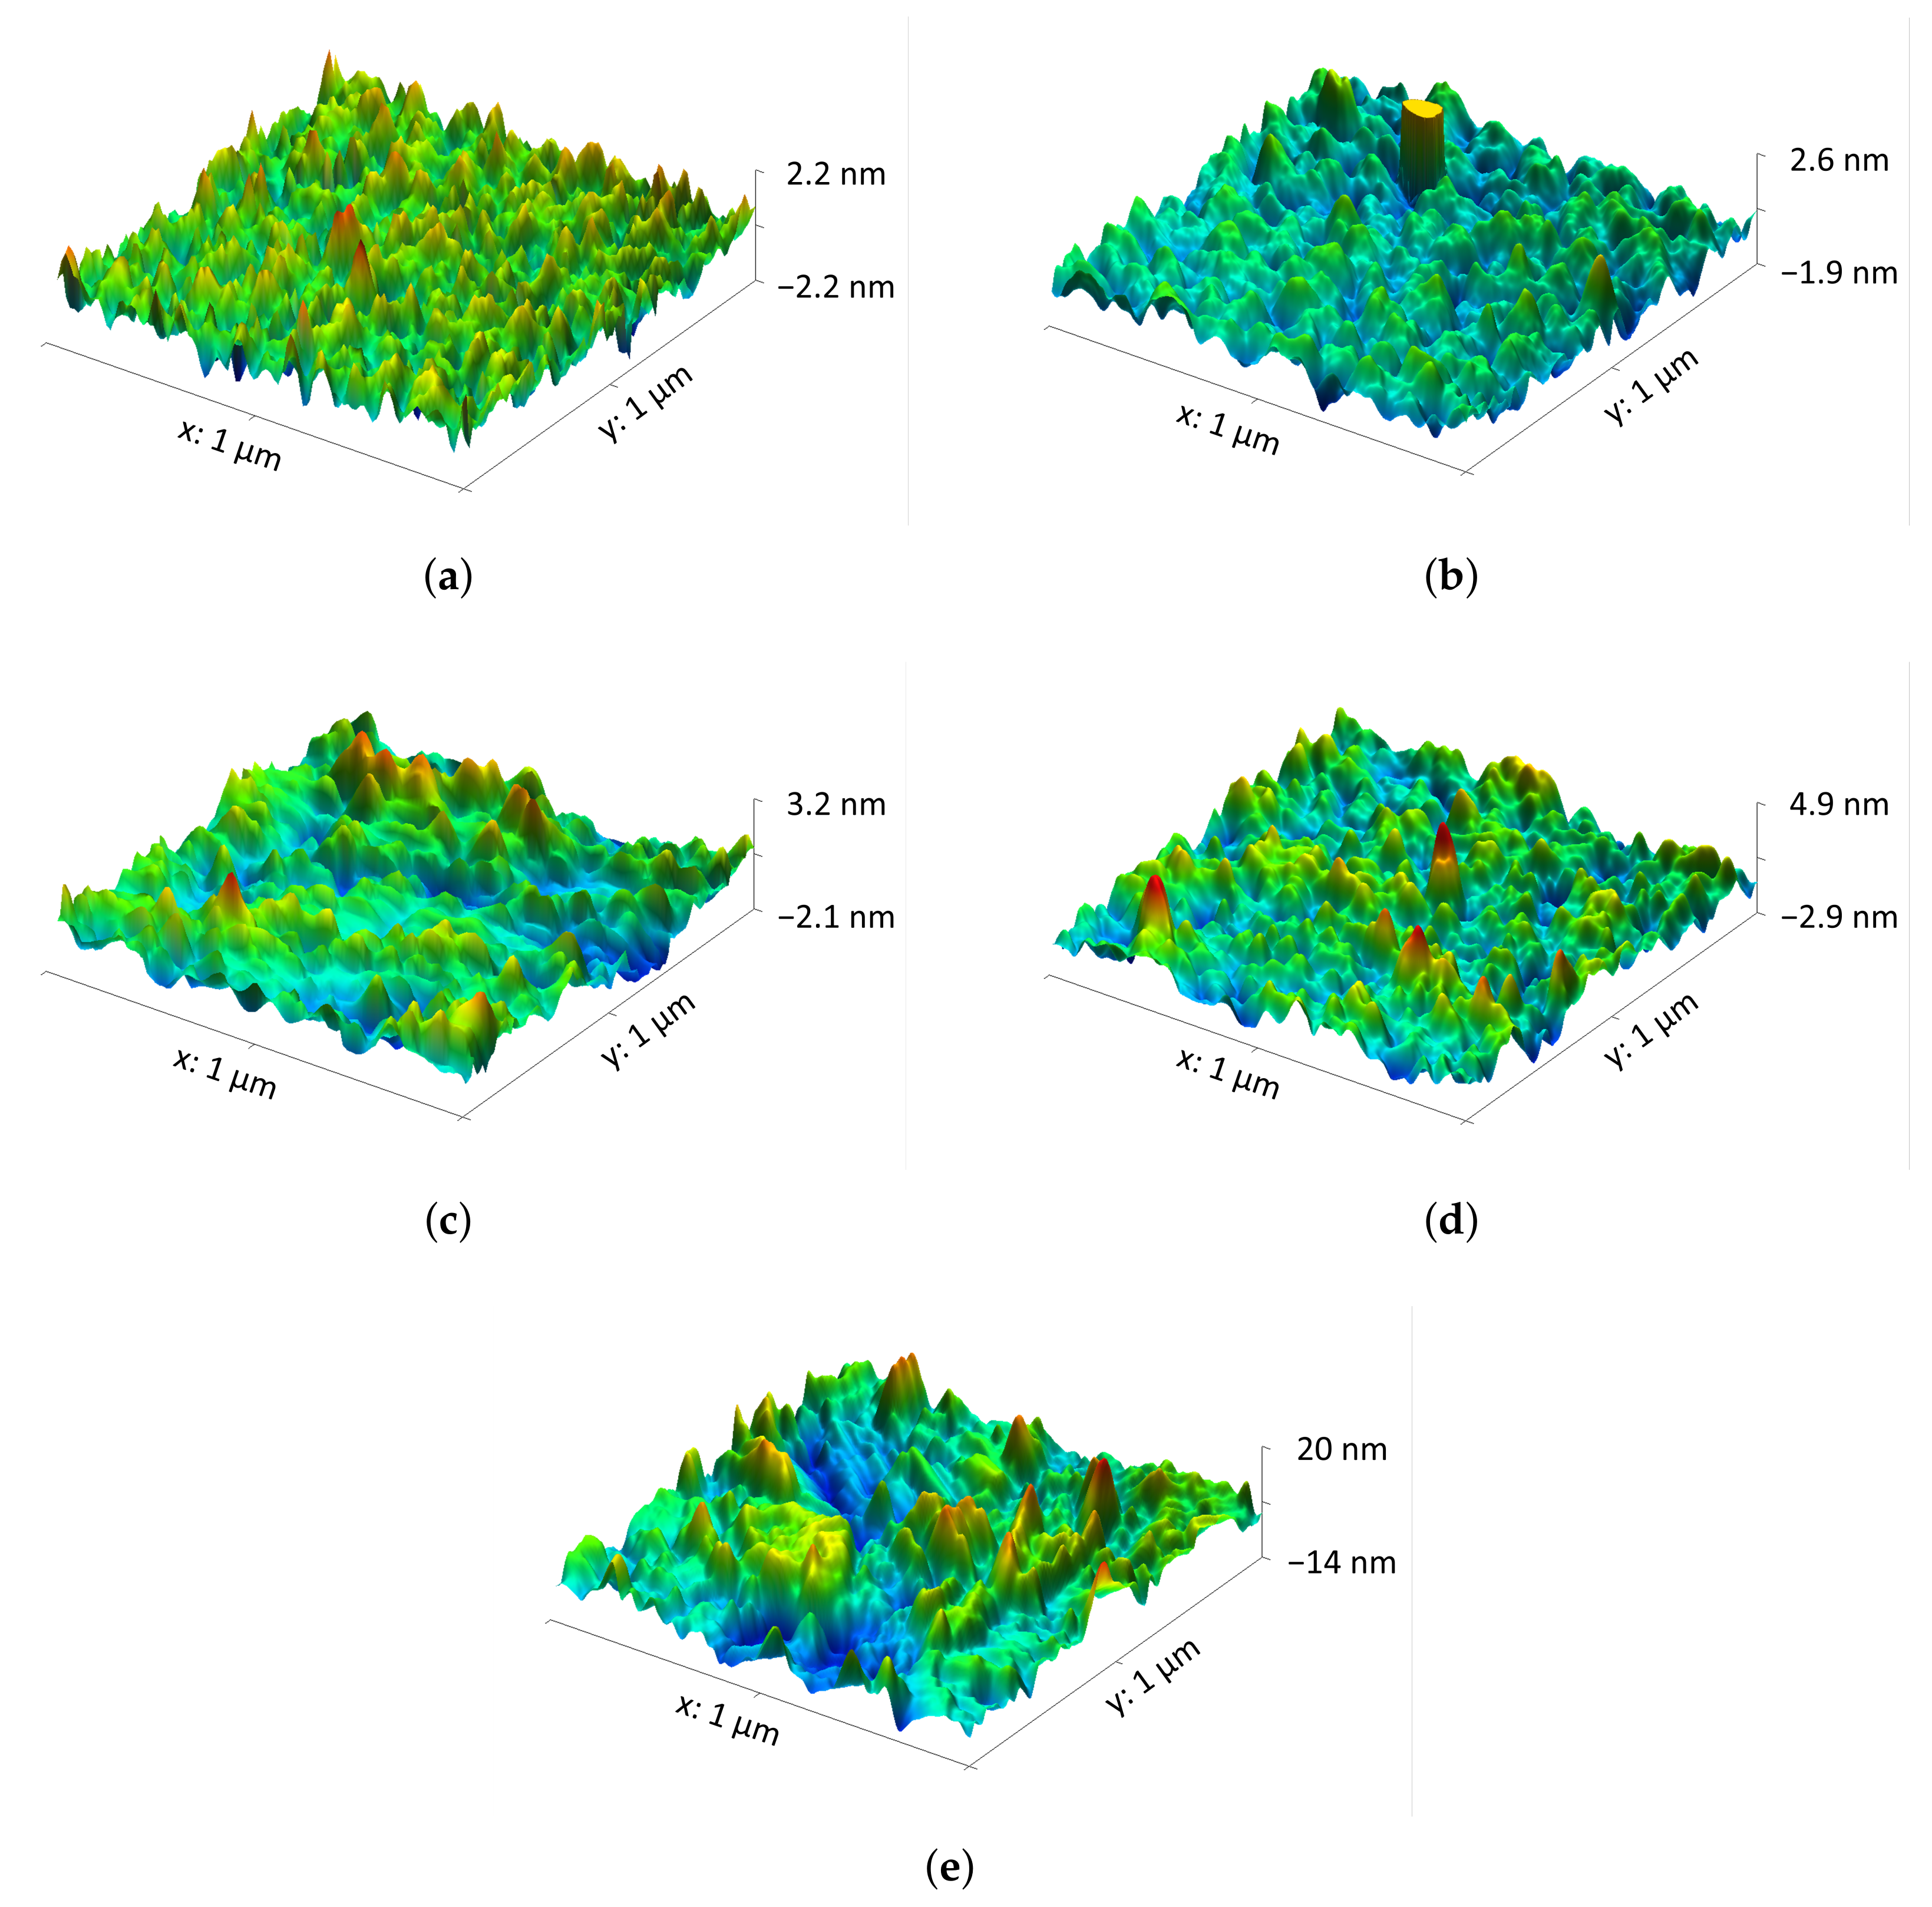
Figure 2 presents atomic force microscopy images of the as-deposited sample, as well as the samples annealed at various temperatures in air atmosphere. From these scans, the root mean square (RMS) roughness of the thin films was calculated, as shown in Table 1, demonstrating a marked increase after annealing at 1000 °C. Regarding the images themselves, they show that the films appear to be uniform in terms of features, although some inhomogeneities in the surface morphology begin to appear at higher temperatures.
Figure 2.
AFM images of the samples obtained (a) after deposition and after annealing at (b) 550, (c) 700, (d) 850, and (e) 1000 °C.
Table 1.
Root mean square (RMS) roughness values for the AFM scans.
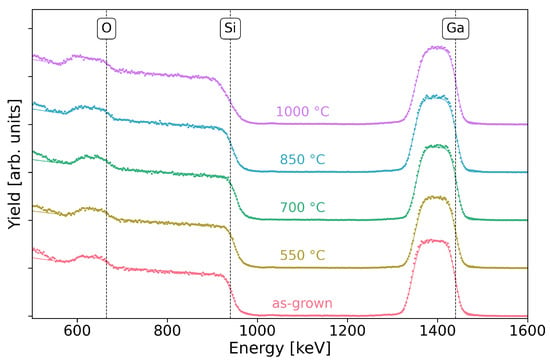
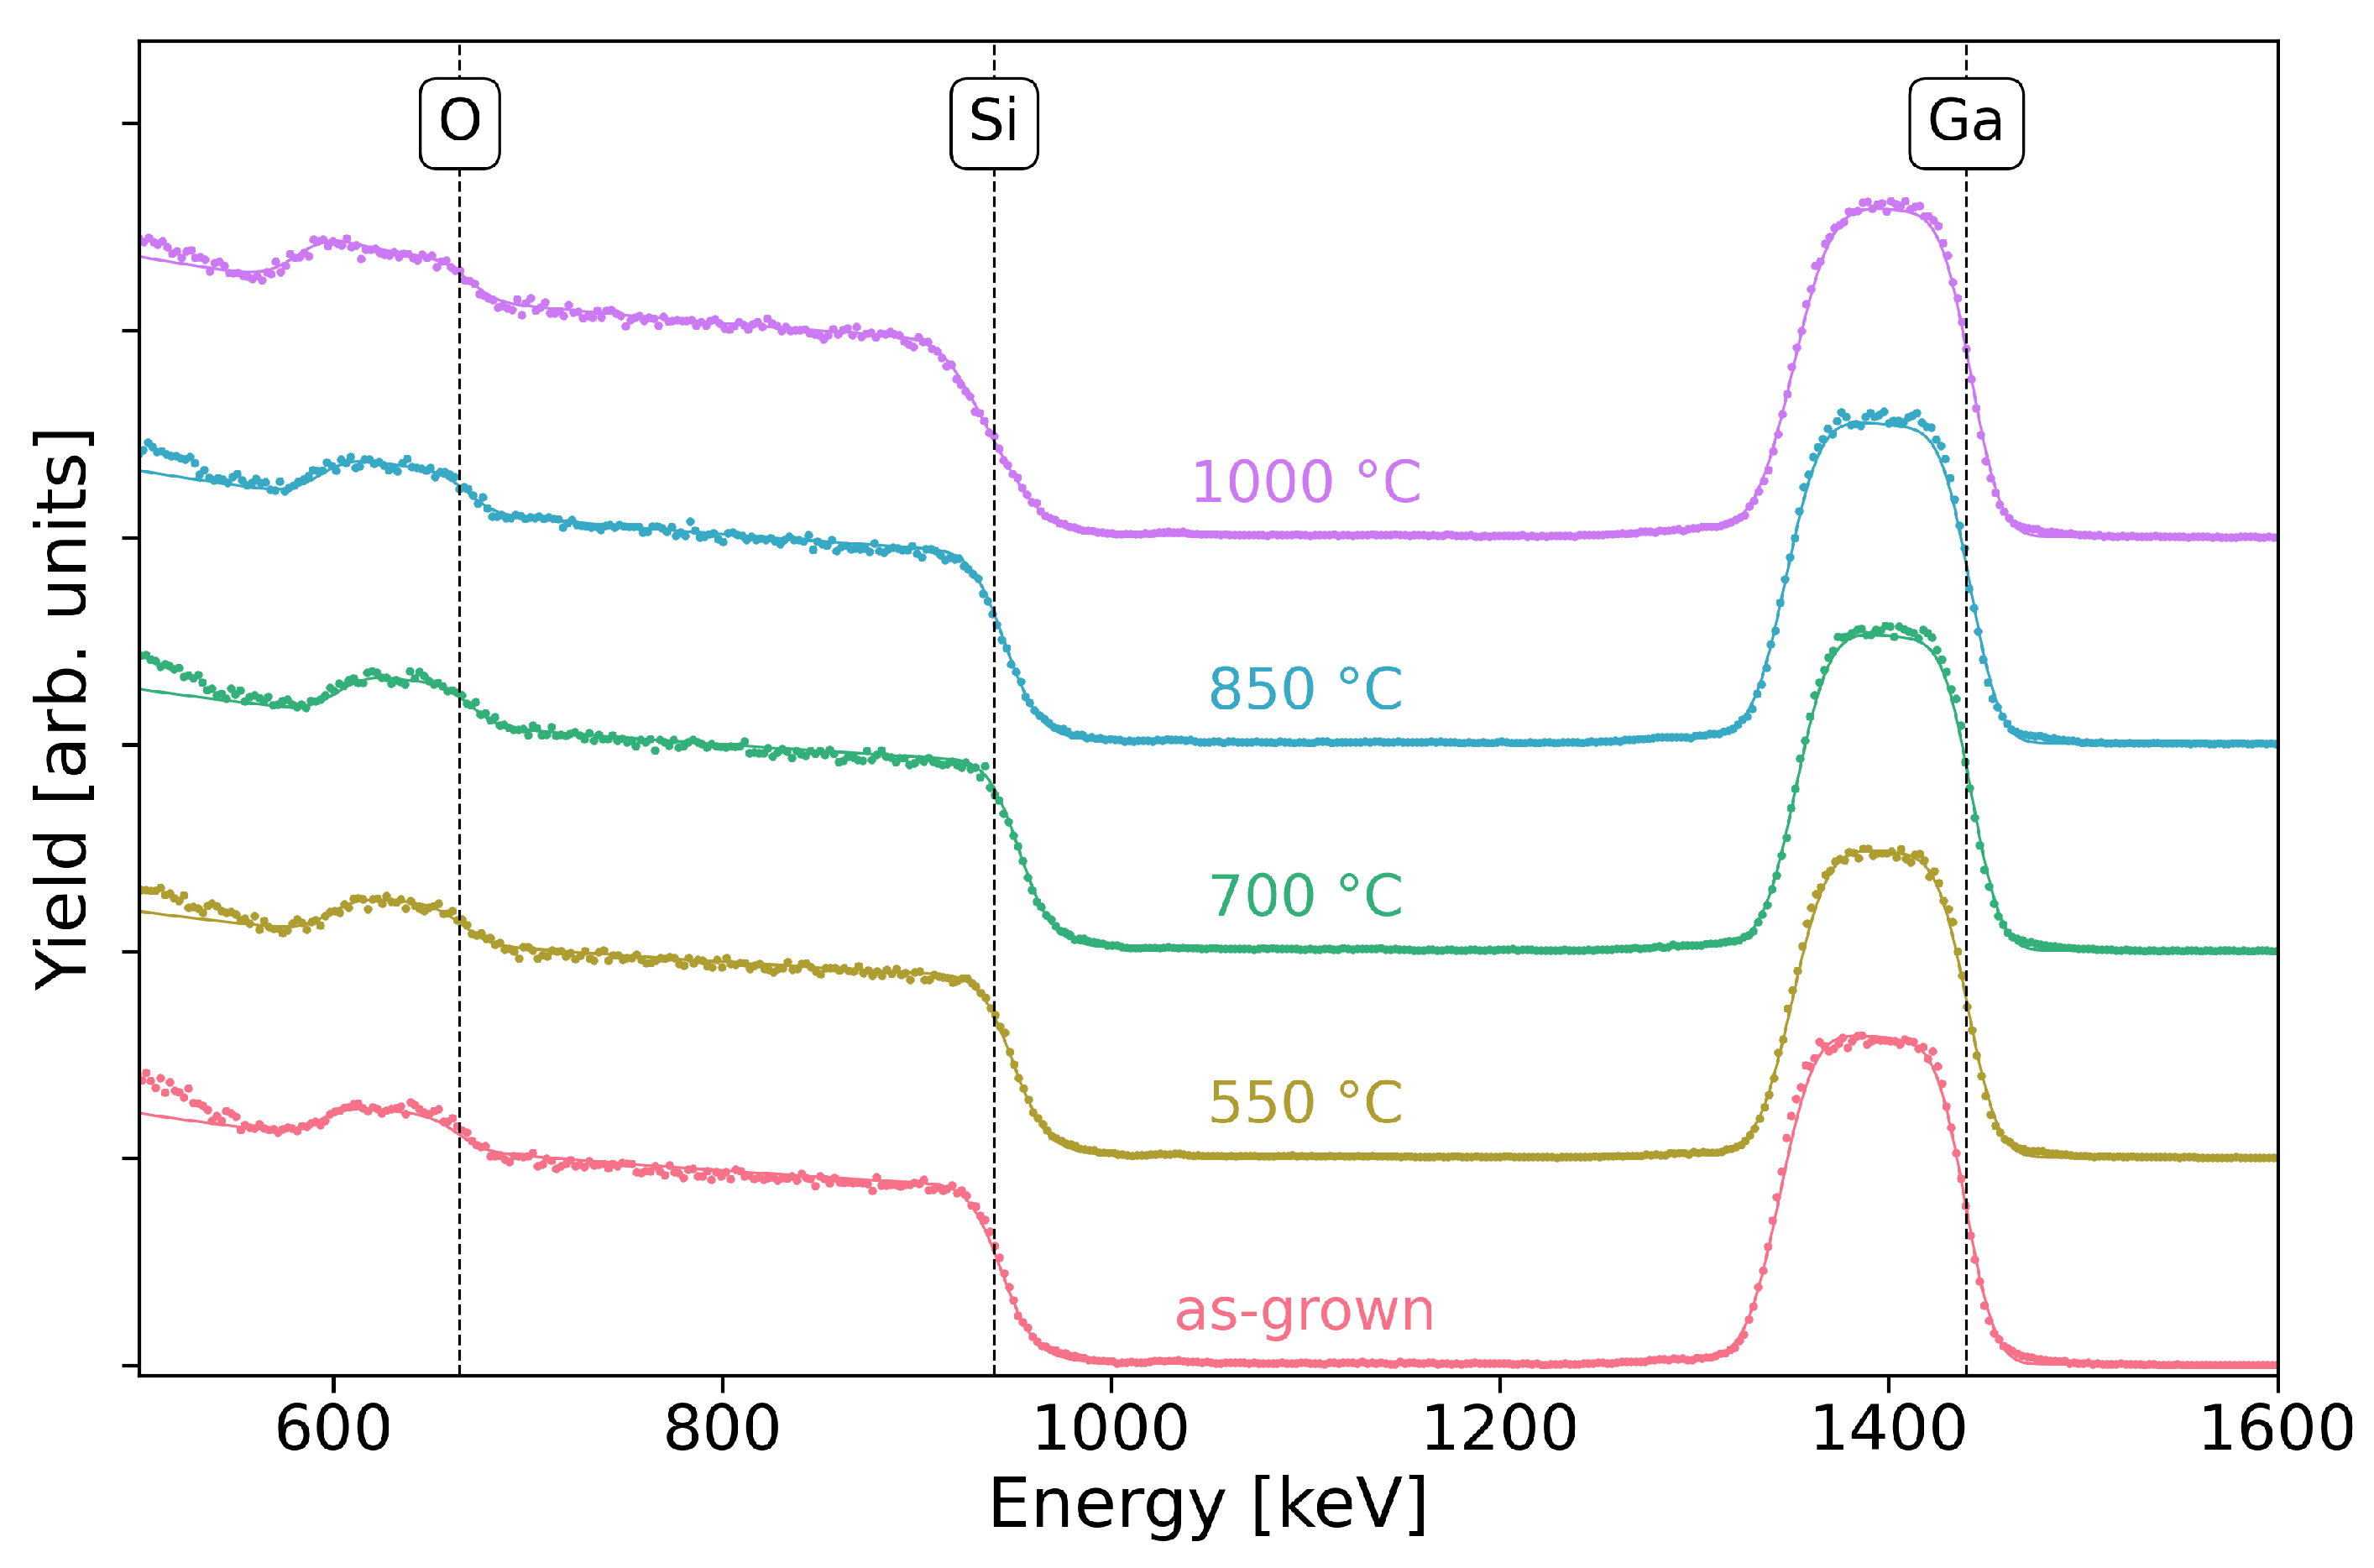
To determine their in-depth elemental composition and to evaluate the changes promoted by thermal treatment, the thin films were characterized using Rutherford backscattering spectrometry. As shown in Figure 3, three distinct barriers are clearly observed in the RBS spectra, associated with the Ga and O from the thin film, in addition to the Si from the substrate. It is also worth noting that, with increasing temperature, at first sight, no significant changes are observed that would suggest variations in composition or thickness.
Figure 3.
RBS spectra and respective fits for the samples as-grown and annealed at 550–1000 °C. The energies corresponding to the Ga and O at the surface, as well as the Si barrier from the substrate/SiO2, are marked. The data were vertically shifted for visual clarity and are from the detector placed at 165°.
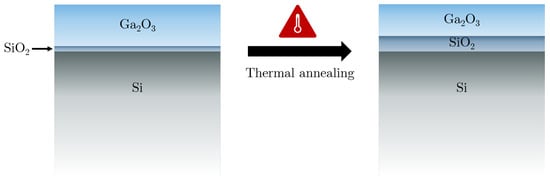
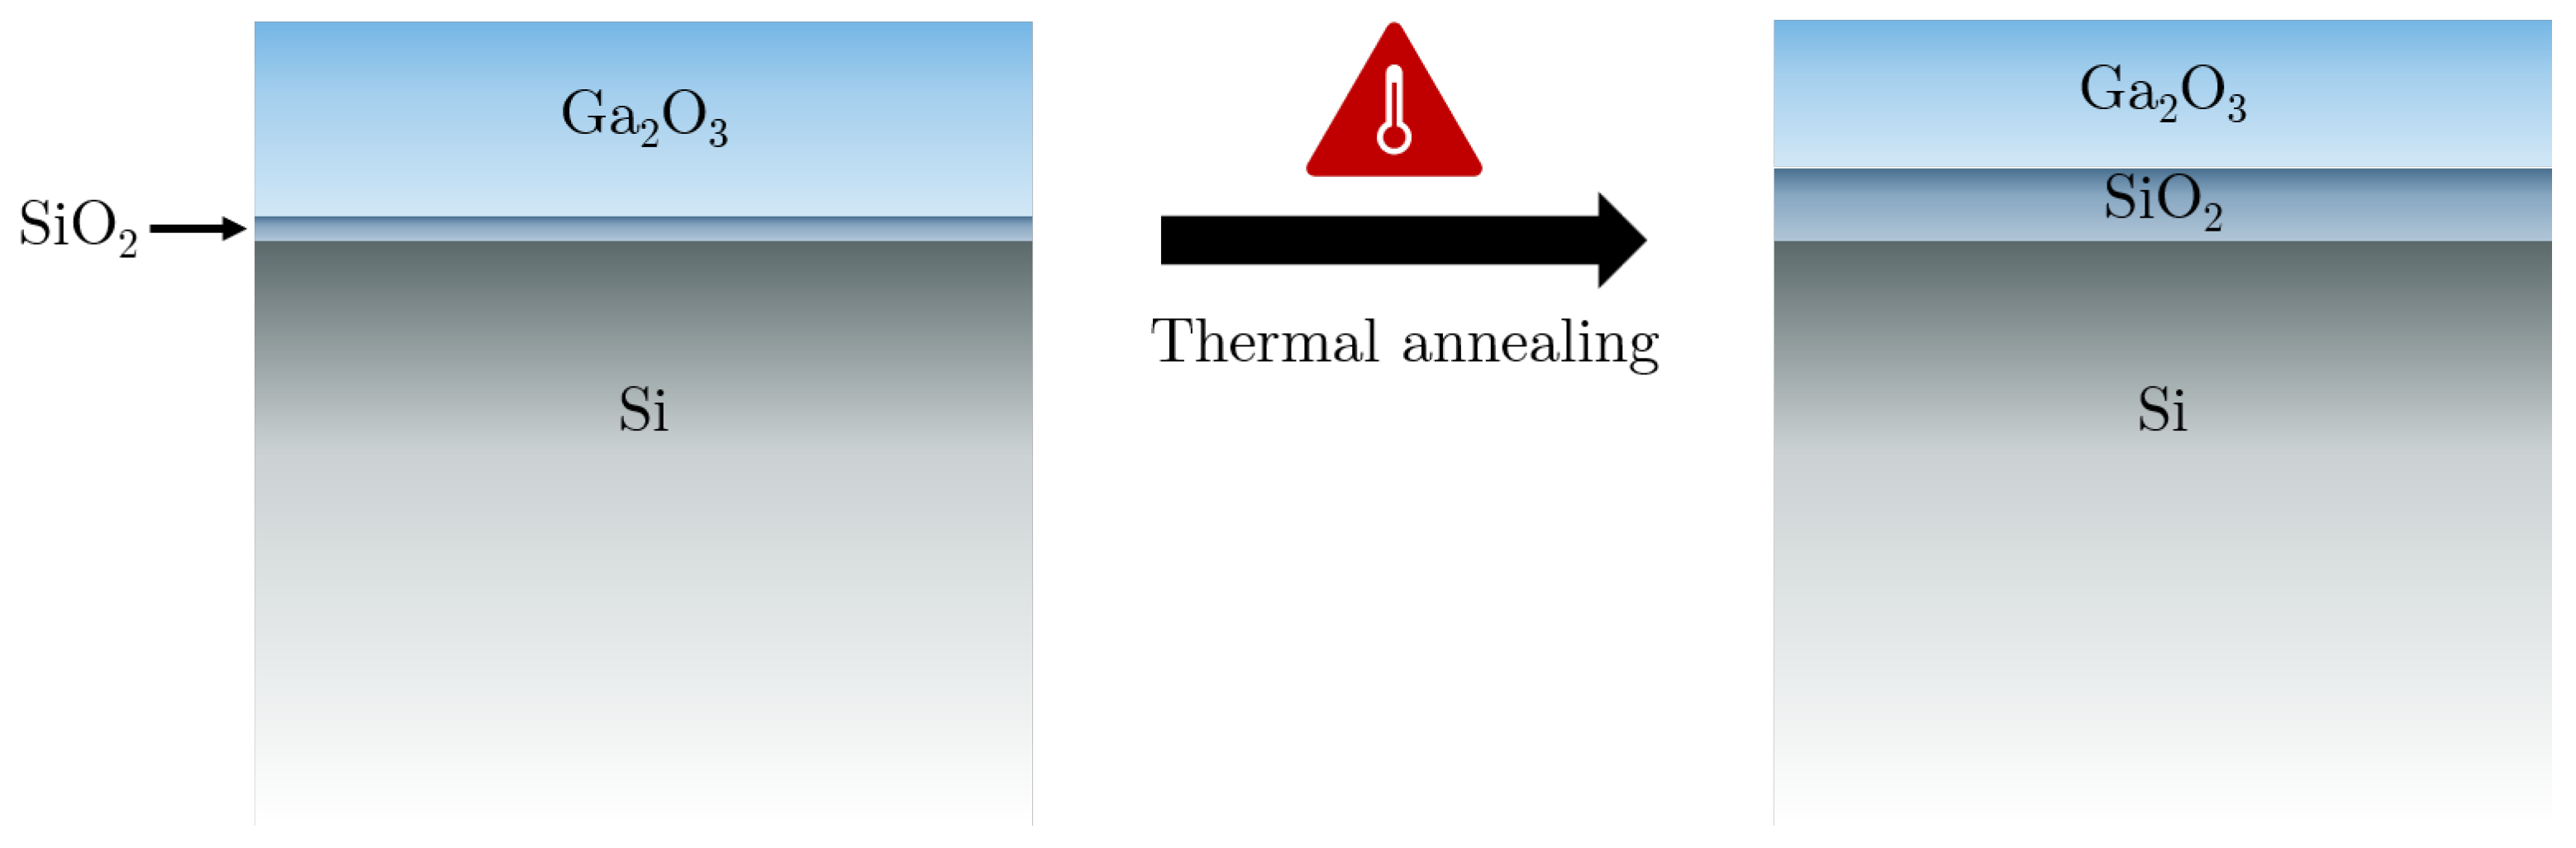
However, a more detailed analysis based on fitting these spectra indicated the presence of an SiO2 layer, as depicted in Figure 4, whose thickness increases with annealing, especially at the highest temperature. The presence of this interface layer was expected due to natural oxidation processes taking place before the sputtering [23,24] and thickening due to the susceptibility of the Si substrate to oxidation [25]. It is noteworthy that this result is contrary to other studies, particularly those involving rapid thermal annealing (RTA), in which no alteration of the native SiO2 layer was observed as a consequence of the thermal annealing in air [24], since the shorter annealing times prevent diffusion between layers [26].
Figure 4.
Schematic of the layer model used for the depth analysis performed through RBS and SE.
Table 2 presents the fitting results, showing that the thickness of the Ga2O3 layer tends to decrease as the annealing temperature increases. Muhammad et al. [27] reported a similar trend for films deposited by electron-beam evaporation and annealed at 900 °C.
Table 2.
RBS fit results, including layer thicknesses and stoichiometry.
On the other hand, an SiO2 layer is clearly present, and increasing in thickness with the annealing temperature. This phenomenon has been studied in high dielectric constant oxides [28], where it was determined that this layer’s growth rate is quite low at temperatures below ∼800 °C and then increases rapidly with the temperature, in agreement with our results. There is also a shift in the Ga:O stoichiometry, from 44:56 to closer to 40:60 after annealing. This effect was also observed by Gu et al. [29,30], who found that oxygen could be diffused into extremely oxygen-deficient thin films deposited by atomic layer deposition through thermal annealing in ambient O2. It has been shown that annealing Ga2O3 thin films deposited by RF Sputtering at room temperature in an oxygen or nitrogen atmosphere results in a decrease in oxygen vacancies—as the temperature increases, the O2 and N2 molecules present in the air dissociate and diffuse into the thin film, filling the oxygen vacancies [31]. For the highest annealing temperature, surface roughness had to be considered to achieve a good fit, in good agreement with the AFM results in Table 1.
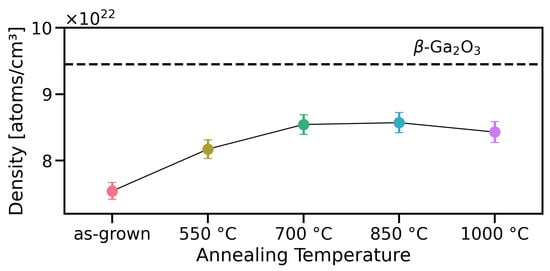
These results, in conjunction with the films’ thicknesses as determined through SE (Table 3), allow us to estimate their densities. As shown in Figure 5, the density tends to increase as the annealing temperature increases, plateauing at ∼700–1000 °C and approaching the theoretical atomic density of 9.45 × 10²² atoms/cm3 [32] for -Ga2O3.
Table 3.
General parameters of the SiO2 and Ga2O3 layers resulting from the SE fit.
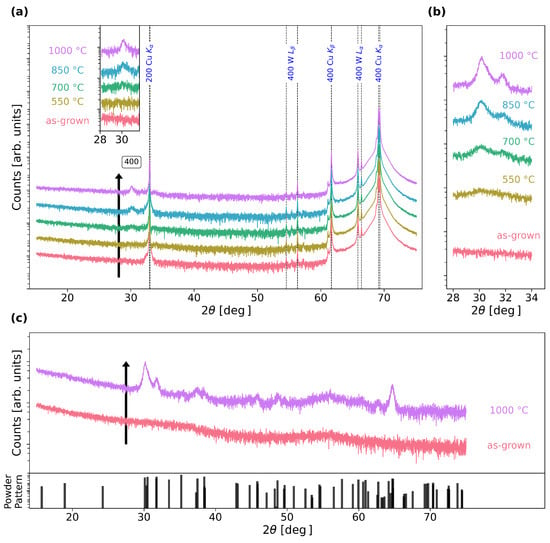
To complement the compositional analysis, a structural characterization of these films was performed using X-ray diffraction. Figure 6a features the XRD – scans, showing no peaks in the as-deposited films, suggesting that they are amorphous as expected for room-temperature deposition, and the emergence of a peak at around 30° as the annealing temperature increases, tentatively assigned to the 400 reflection of -Ga2O3. To better ascertain the crystalline quality of the thin films, grazing incidence scans were then taken, see Figure 6b,c. Figure 6b shows an improvement in crystalline quality with annealing temperature and Figure 6c clarifies that our film is textured, as a multitude of peaks can be observed in this diffractogram, with intensity ratios differing from the powder pattern. This is congruent with previous studies—Makeswaran et al. [33] also observed a variety of peaks that became more intense and defined with increasing annealing temperature.
Figure 6.
X-ray diffractograms of the thin films as a function of annealing temperature: (a) in a 2- scan with the most relevant substrate peaks marked in blue as well as the 400 Ga2O3 reflection, (b) in a grazing incidence scan around the 400 reflection, and (c) showing the full grazing incidence scan and the powder pattern [34]. The data were vertically shifted for visual clarity.
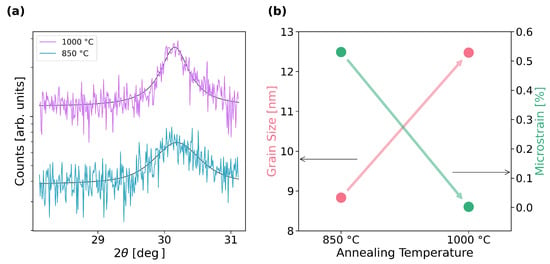
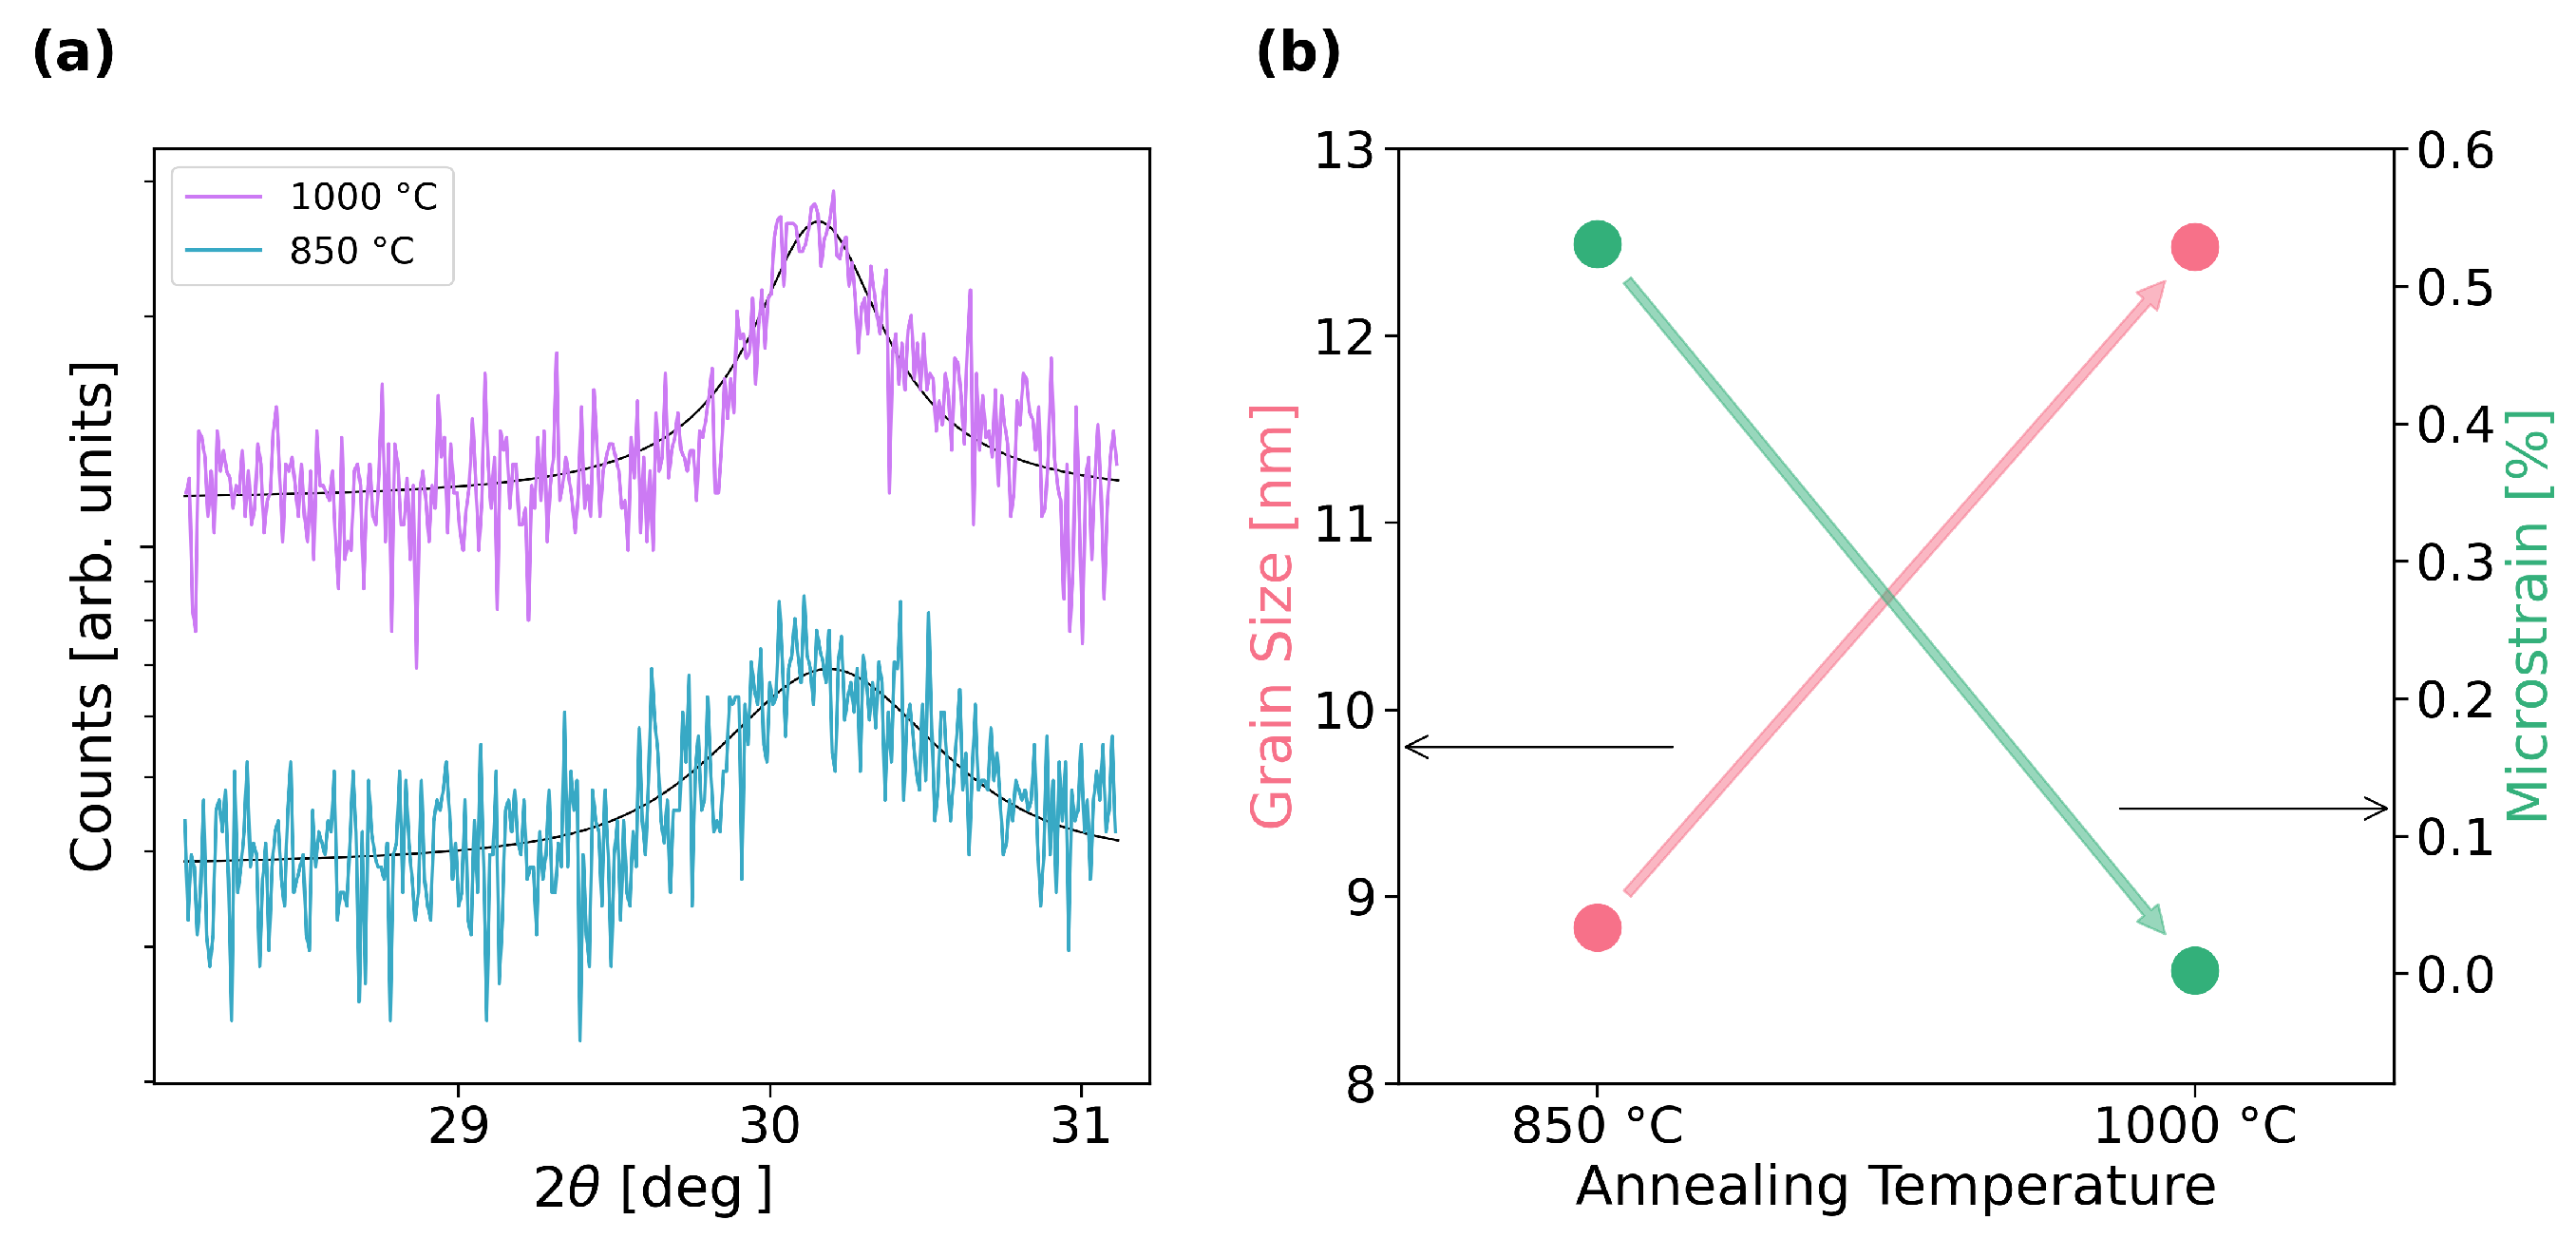
We can leverage this data to obtain further information on the crystallinity of the samples. By fitting the -Ga2O3 400 peak to a pseudo-Voigt function, as shown in Figure 7a, we can estimate the crystal domain size and microstrain through the Scherrer [35] and Wilson [36] equations, respectively. We opted to do this only for the samples annealed at 850 and 1000 °C, as these showed clearly defined peaks. Figure 7b then shows the evolution of these two parameters, demonstrating an increase in the grain size, as expected, as well as a dramatic decrease in the microstrain [37]. This conclusively demonstrates that the crystallinity of the thin films improves with annealing temperature, in agreement with other studies [38]. On the other hand, these results also suggest that the increase in roughness measured by both AFM and RBS is likely associated with structural improvement and the formation of larger grains [38,39,40].
Figure 7.
XRD Analysis of the 400 peaks of the thin films annealed at 850 and 1000 °C: (a) pseudo-Voigt fitting and (b) corresponding grain size and microstrain values.
To study and characterize the optical properties of the thin films, variable angle spectroscopic ellipsometry (VASE) was used. Based on this method and through fitting the obtained results, it was possible to estimate the refractive index and the extinction coefficient of the deposited films, as well as their thicknesses. As with the RBS analysis, the model was based on three layers as shown on Figure 4.
Although it is not clear which model best fits these data, as the amorphous Ga2O3 becomes polycrystalline due to the annealing, the most widely used model is a Tauc–Lorentz (TL) dispersion function [41], which has successfully been used to model amorphous and polycrystalline thin films of semiconductors/dielectrics, including Ga2O3 [42,43,44,45,46], as well as to measure the optical constants of single crystalline - and -Ga2O3 [47], considering anisotropy through the introduction of extraordinary and ordinary axes. An improvement on this model is to use two TL oscillators [48], or the Cody–Lorentz model [49]. A purely mathematical alternative is to do a point-by-point (or wavelength-by-wavelength) calculation [50]. Although this method leads to multiple solutions and does not guarantee consistency with the Kramers–Kronig relations, needing initial estimates on both the thickness and n/k parameters, it can be further processed to mitigate these issues [51,52]. In particular, it is possible to obtain a good estimate of the thickness and n/k in the lower energy spectral region, where Ga2O3 is essentially transparent, using the Cauchy model [48,50]. To fit the thickness of the SiO2 layer and simulate the Si substrate, we can use its well-known and as provided by the software [18].
We then started with a Cauchy model, fitting only wavelengths above 350 nm, where the material is transparent; then, using those results, we performed a wavelength-by-wavelength (WBW) fitting at wavelengths below 1000 nm, where the signal is less noisy; finally, we used a TL-based dispersion function to model the whole spectrum [48,53]. For the latter, we used two oscillators, as it has been reported that Ga2O3 only has two major absorption peaks at energies below 7 eV [48,54]. For all of the fittings, the Levenberg–Marquardt Algorithm (LMA) was used, minimizing the Root Mean Square Error (RMSE). Since the Tauc–Lorentz model has quite a few parameters, we did a brief analysis on their cross-correlation [55], finding that the most significant ones are between and or A, as well as C and or , and between the thicknesses of the two layers. In order to avoid these interactions, we start by considering the thicknesses estimated from the Cauchy method: we fit the layer thicknesses separately; then A, and ; then and C; finally, we do a global fit with all of the parameters to do any fine adjustments and estimate their uncertainties.
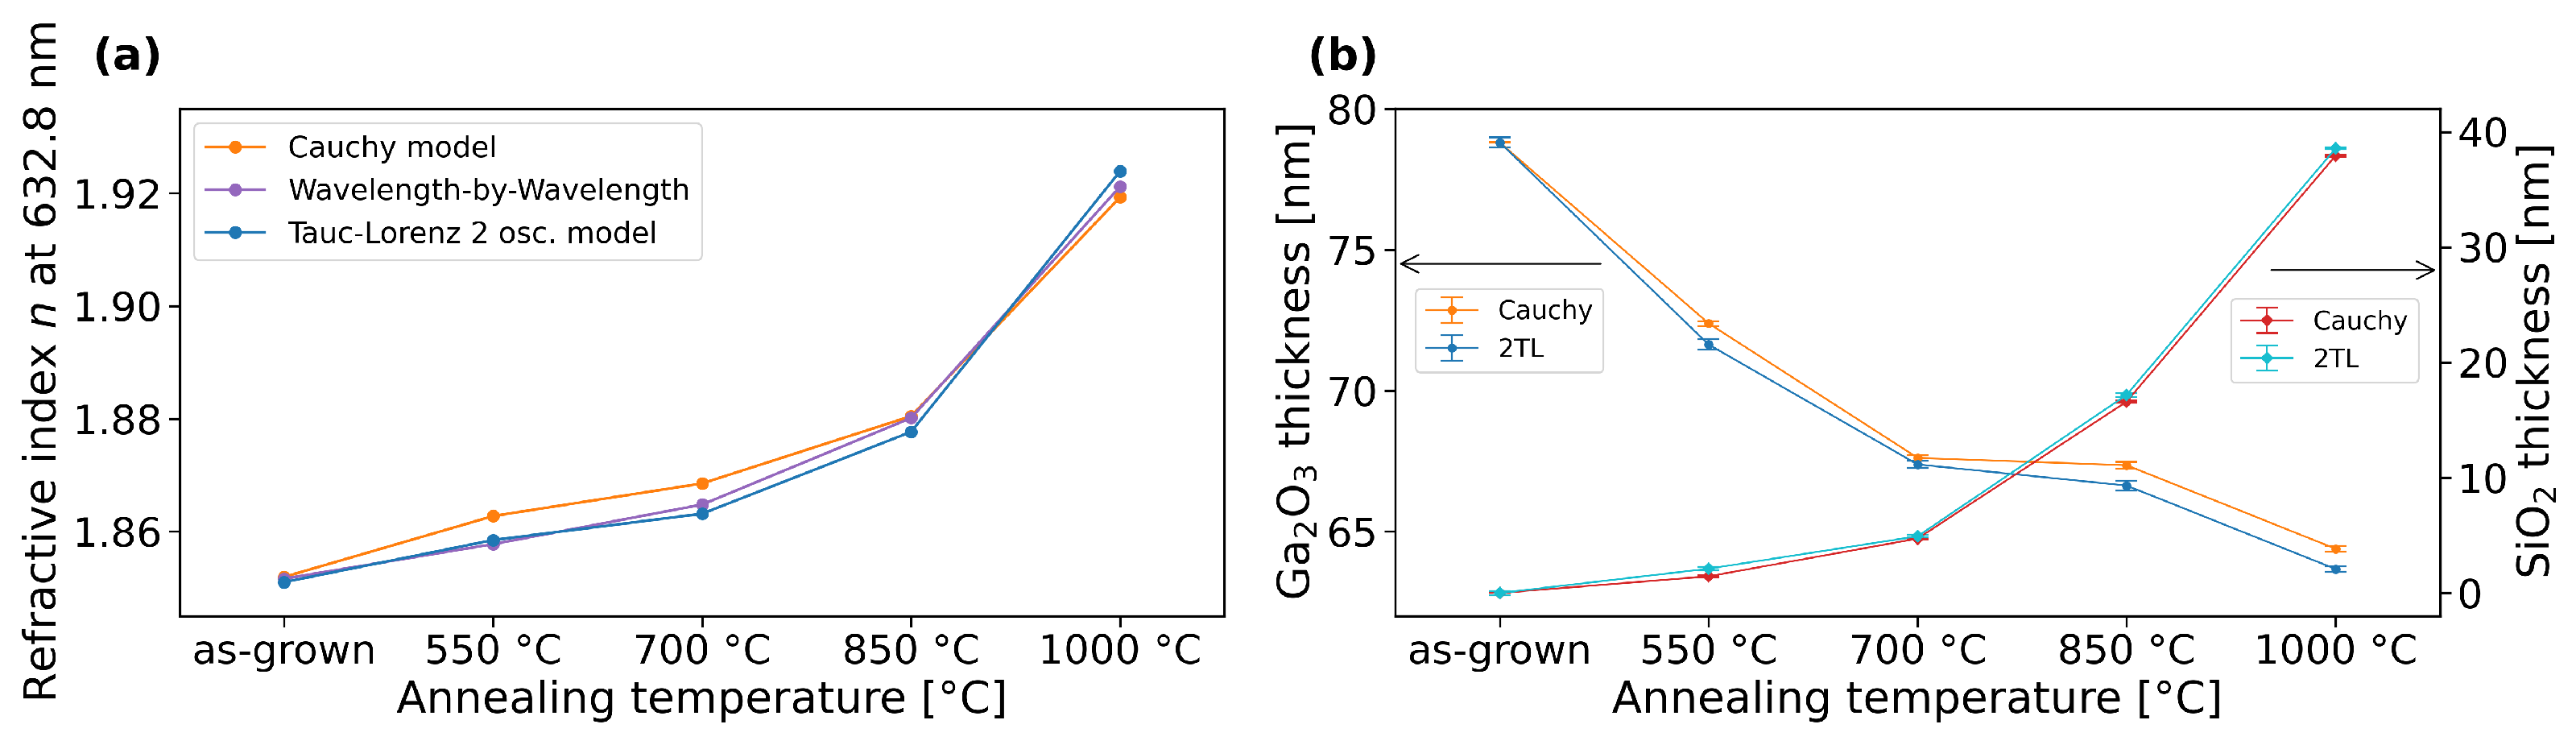
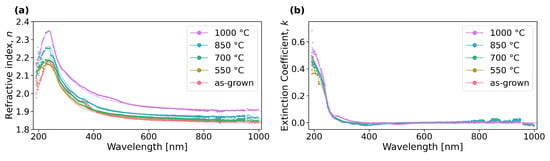
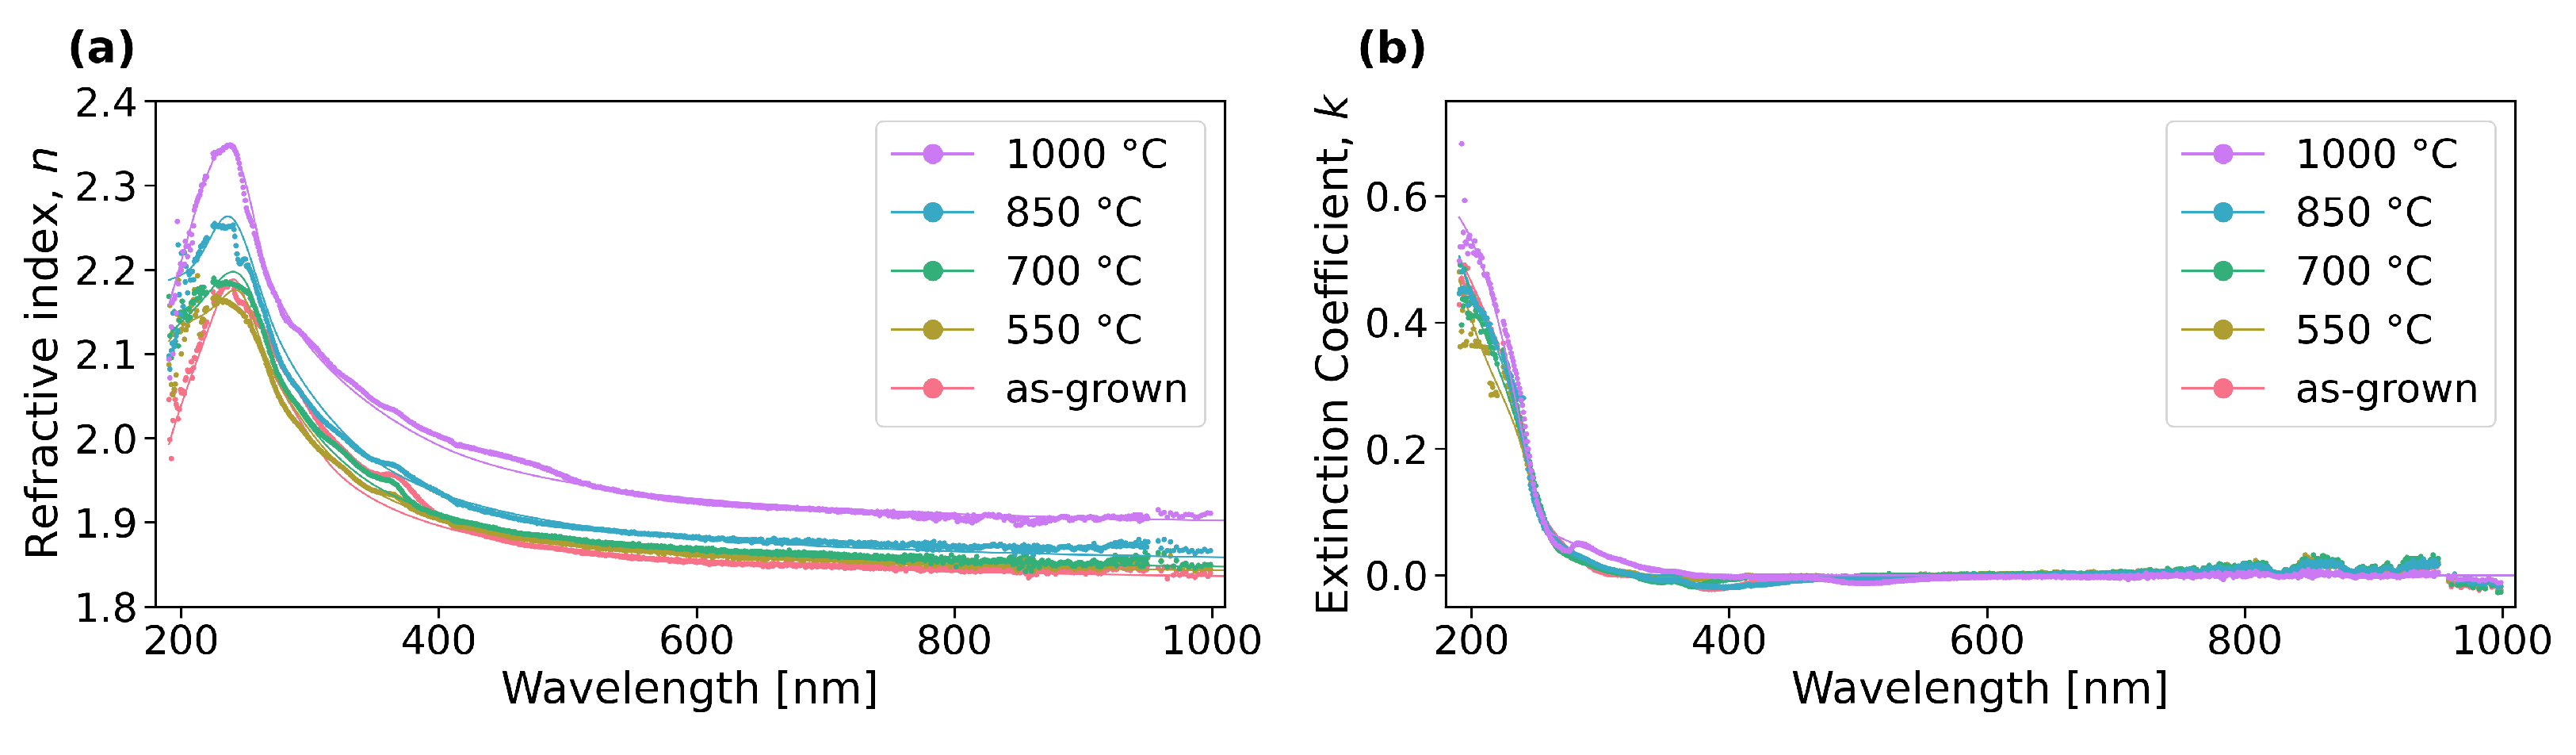
Figure 8 demonstrates good agreement between the three methods, both in terms of the refractive index for the Ga2O3 layer, as well as the decreasing (resp. increasing) thickness of the Ga2O3 (resp. SiO2) layers and Figure 9 shows how the 2TL model is quite good at describing the behavior calculated through the WBW method, both in terms of refractive index and extinction coefficient.
Figure 8.
Comparison between SE fit methods: (a) refractive index (n) at 632.8 nm taken from the Cauchy model, wavelength-by-wavelength calculation and 2-oscillator Tauc–Lorentz model (2TL); (b) comparison between fit thickness of the Ga2O3 and SiO2 layers.
Figure 9.
Spectra determined through the point-by-point method (dots) and TL fitting (line) of the (a) refractive index and (b) extinction coefficient.
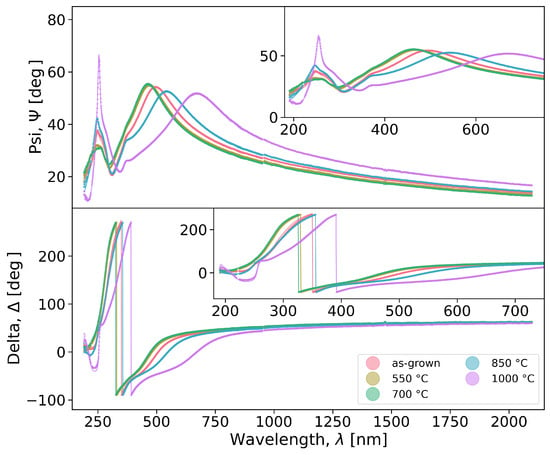
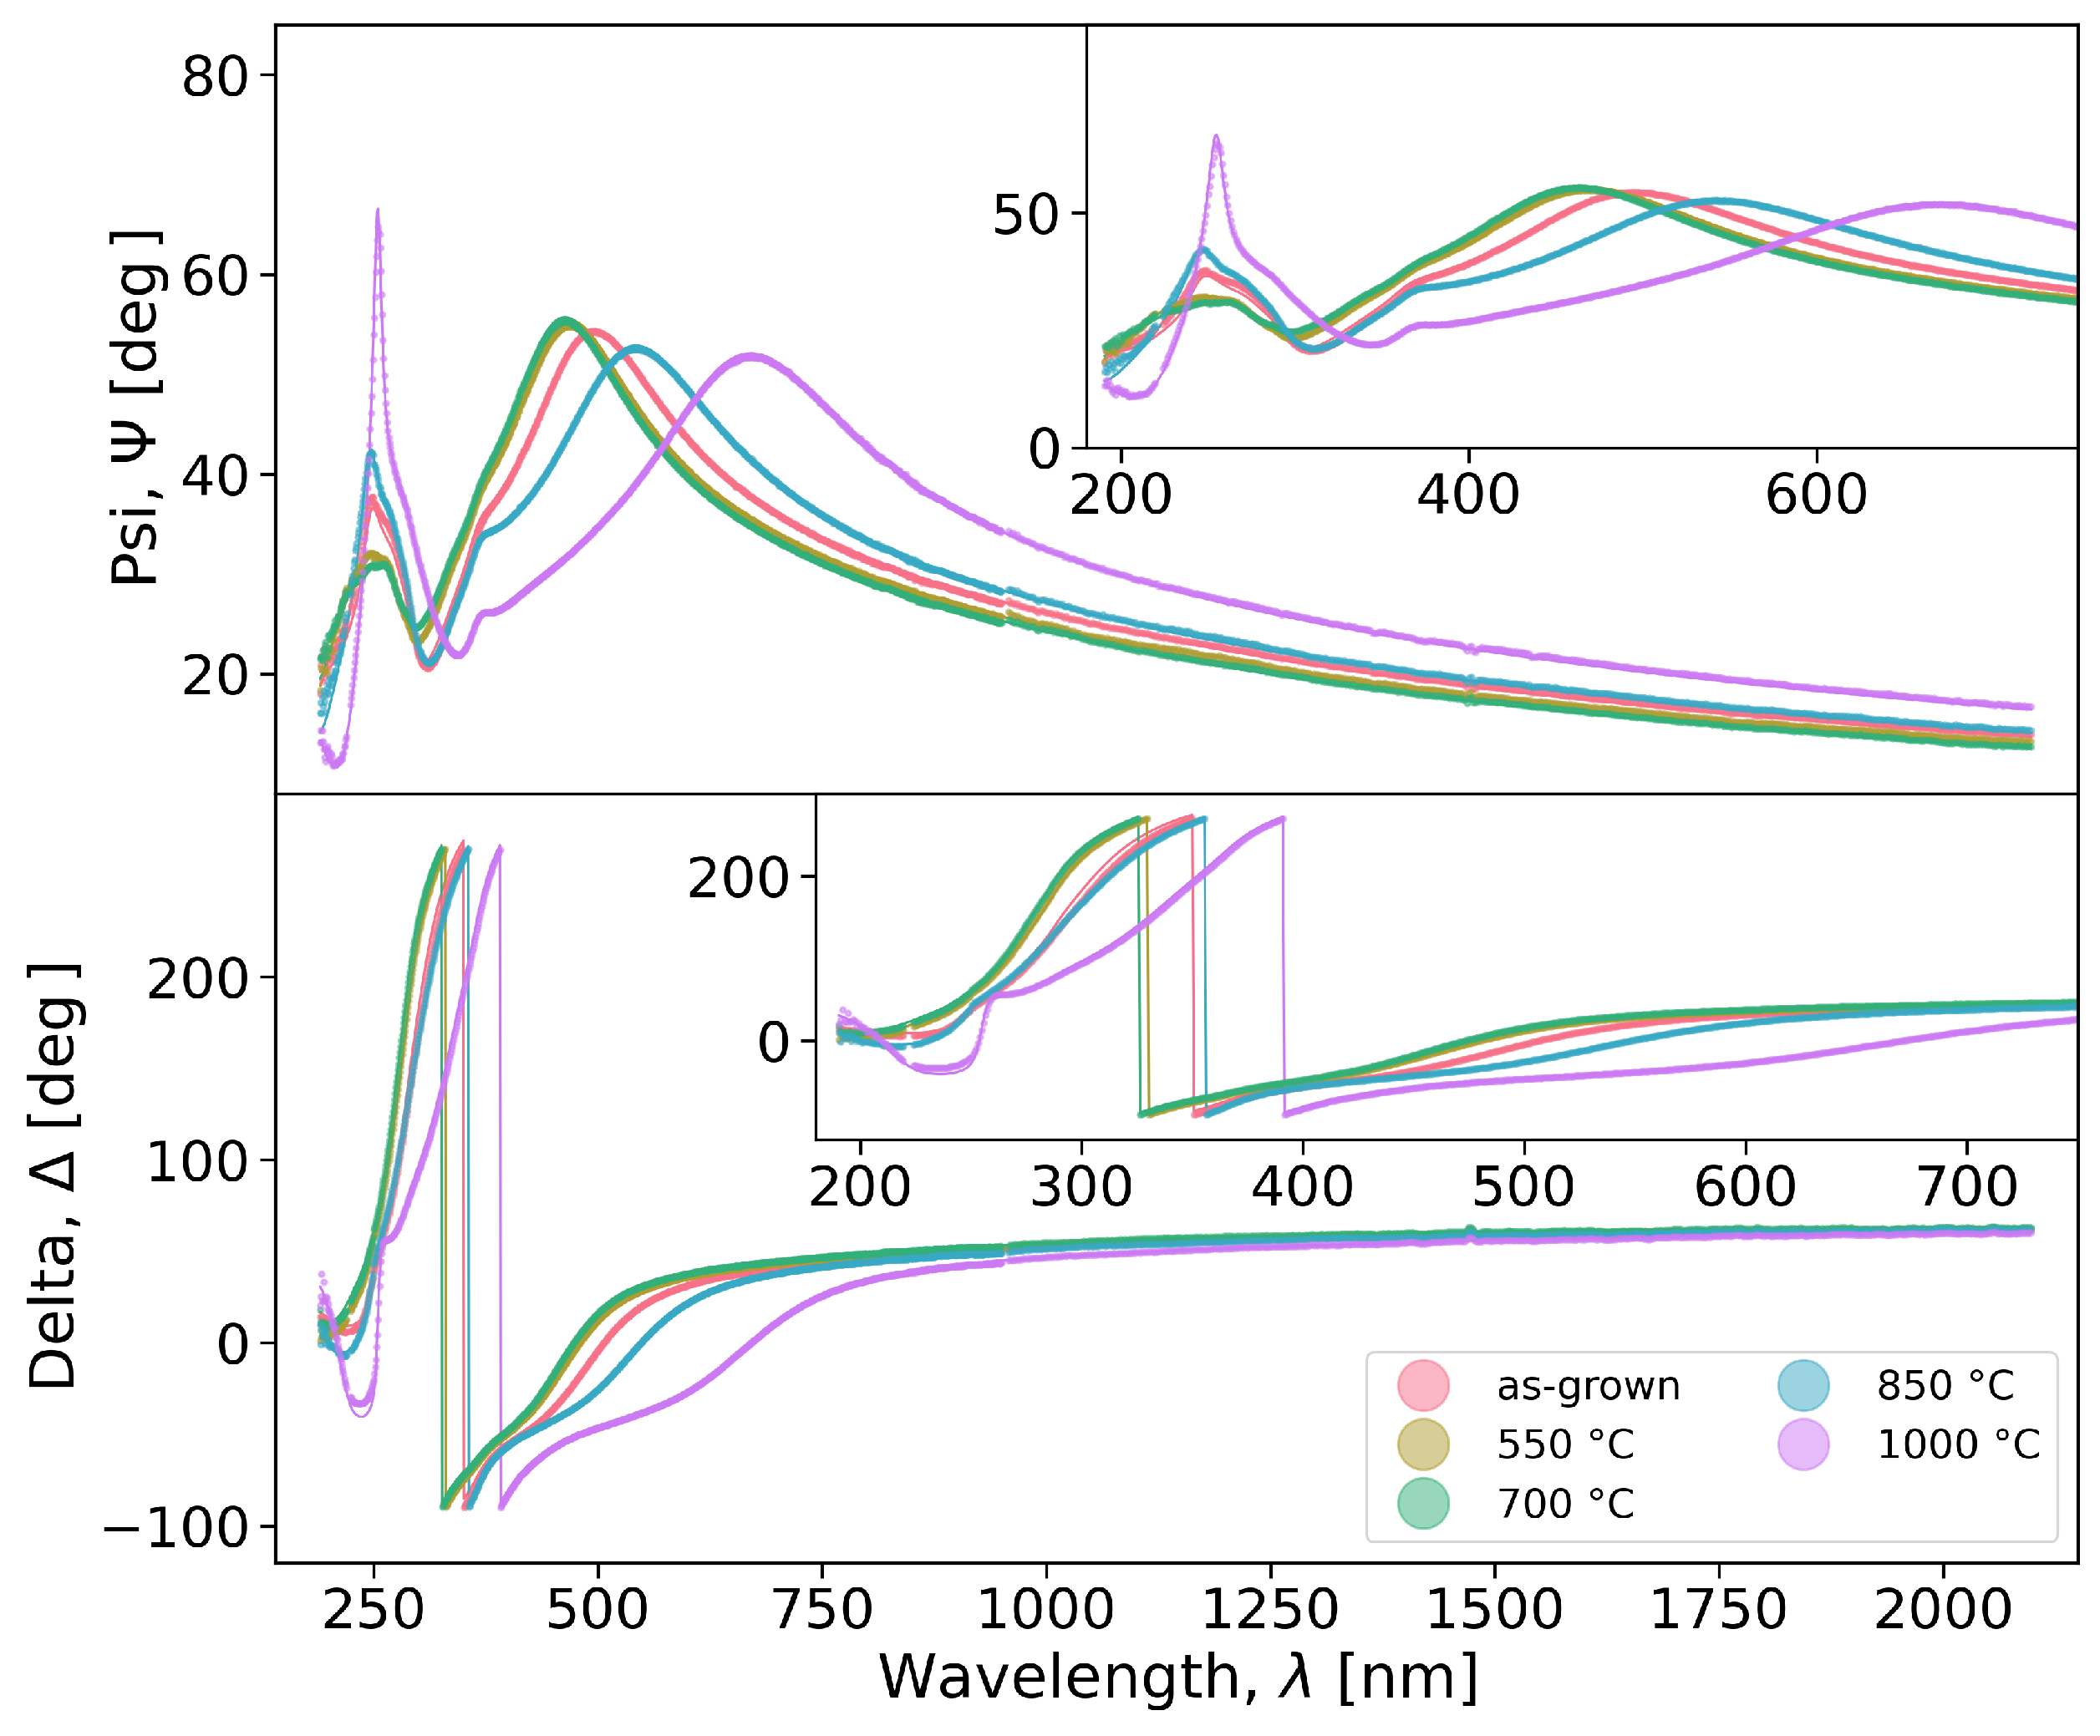
Figure 10 shows the spectra acquired at 75° along with the 2TL fittings, as a function of the annealing temperature. It shows that the model is quite adequate in fitting the data, as further demonstrated by the RMSE values in Table 3, as well as taking into account the expected thickness of 73 nm. Table 4 then shows the different TL parameters for both oscillators (TL1 and TL2): A is the oscillator amplitude, is the oscillator peak position, C represents the peak width and is the bandgap. Although this technique is more sensitive to minute variations in thickness than RBS, we found that it could not reliably fit the roughness of the thin film. This is unsurprising, as we are considering a large number of variable parameters which may have indistinguishable effects while fitting.
Figure 10.
Ellipsometric Psi () and Delta () spectra and fits of the as-grown and annealed samples, taken at 75°. For clarity, there are insets showing the data at wavelengths 190–750 nm.
Table 4.
Tauc–Lorentz model parameters for the Ga2O3 layer, from the fitting.
In this case, the first oscillator at lower energies (TL1 ) corresponds to the bandgap transition, while the second oscillator (TL2) represents the contribution from the high-energy region [48]. The bandgap (TL1 ) slightly decreases after the initial annealing at 550–850 °C, and then increases again after annealing at 1000 °C. As outlined by Muhammad et al. [27], who performed a similar study but with increasing annealing time, this non-monotonic behavior can be explained by competing physical effects as the material transitions from amorphous to polycrystalline [56]. This initial decrease in the bandgap could be ascribed to a reduction in quantum confinement effects due to the observed increase in grain size, as well as the introduction of defects [27]. An increase in the bandgap may be due to the decrease in oxygen vacancies, the phase change, or even the Burstein–Moss effect, wherein an enhanced electron density can raise the Fermi level into the conduction band, resulting in a higher apparent bandgap [27,57]. Overall, as the annealing temperature increases, the material crystallizes and there is a reduction in the number of defects, resulting in an increase in the bandgap. This correlates nicely with the RBS stoichiometry results—with annealing, the amount of oxygen vacancies decreases and the bandgap increases [58].
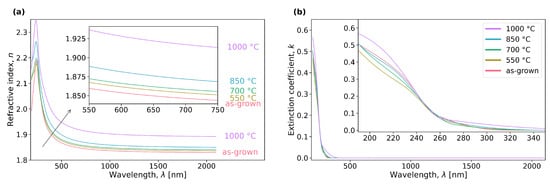
Figure 11a shows the resulting refractive index spectra from the 2TL model, outlining its increase with annealing temperature, especially after annealing at 1000 °C. This is congruent with results in the literature, as Makeswaran et al. observed a similar increase in samples annealed at 500–900 °C [33]. It is also in agreement with the behavior of other wide bandgap semiconductors, such as Al2O3 thin films, where annealing tends to reduce vacancies and the thickness of the film, leading to a higher dielectric polarization [59]. Figure 5 reveals an increase in the density with the annealing temperature up to 700 °C, calculated from the RBS areal density and the film thickness from the TL fittings. Since the refractive index n is expected to increase with the polarization [60] and the density [25,61], we can postulate that there is an improvement in the polarization at 700–1000 °C. The extinction coefficient k, in Figure 11b, is null up to roughly 350 nm, demonstrating excellent transparency in the UVA–visible–NIR spectral region. This onset of extinction is in agreement with the material’s bandgap, and is coherent with our choice to fit only this region using the Cauchy model.
Figure 11.
Spectra of the (a) refractive index (n) and (b) extinction coefficient (k) taken from the TL model. For clarity, there are insets showing the data at wavelengths 550–750 and 190–350 nm, respectively.
We can then combine the refractive index with the density determined through RBS to calculate the polarizability of the material. This is done through the Lorentz–Lorenz (or Clausius–Mossotti) relation [62,63,64],
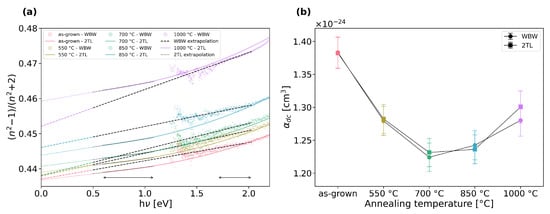
where is the refractive index, is the wavelength, is the atomic density, and is the optical polarizability, in CGS units. The most common metric is low-frequency polarizability (), calculated by extrapolating to [65]. We can do this using the refractive index determined from the WBW method and through the 2TL fitting, as shown in Figure 12a, by selecting lower energy regions with good linearity to extrapolate from. The low-frequency polarizability is then determined through Equation (1) using the density values from Figure 5, and is shown Figure 12b. These values are coherent with first-principles calculations performed for Ga2O3 nanoclusters, as Rahane et al. [66] found a polarizability of ∼1.6 × 10⁻²⁴ cm3 for clusters of (Ga2O3)N with 6 ≤ N ≤ 10, slowly decreasing as N increases.
Figure 12.
Determination of the polarization: (a) extrapolation of from the refractive index (n) determined through the WBW method and 2TL fitting and (b) comparison of the polarizability () obtained from both datasets for each annealing temperature. In (a), the extrapolation fit regions are indicated with arrows at the bottom of the plot.
Taking into account the density and polarizability trends (Figure 5 and Figure 12, resp.), it becomes apparent that there are two main stages in the crystallization process. At annealing temperatures of 550–700 °C, the material undergoes densification and its polarizability decreases as the electrons become less mobile [65] and the average Ga–O bond length decreases [66]; furthermore, since O has a much lower static dipole polarizability than Ga—(0.79 ± 0.03) × 10−24 versus (7.4 ± 0.5) × 10−24 cm3, resp.— [67], the decrease in O:Ga ratio observed by RBS after the initial 550 °C annealing may contribute to the corresponding steep decrease in polarizability observed [62]. Then, at annealing temperatures of 700–1000 °C, the density stabilizes, meaning that this increase in refractive index and, subsequently, the polarizability, can be ascribed to structural changes stemming from the crystallization, as observed through XRD, which affect the bonding between the Ga and O atoms and, subsequently, their vibrational energy [63].
4. Conclusions
Stemming from the analysis done through four complementary techniques—AFM, RBS, XRD and SE—we clearly demonstrated a shift in the structural and optical properties of RF-sputtered thin films with thermal annealing. It was shown that there is an increase in the refractive index with the increasing annealing temperature, accompanied by a decrease/increase of the thickness of the Ga2O3 (resp. SiO2) layers, observed both through RBS and SE. We saw a definite improvement on the crystalline quality of the samples through XRD, marked by increasing grain size and decreasing microstrain, which supports the overall increase in the density of the films. Direct measurements of the samples’ roughness by AFM showed a very significant increase after annealing at 1000 °C. In particular, we observed two main stages of crystallization with increasing annealing temperature, corresponding to an initial densification up to 700 °C followed by an improvement in crystallinity up to 1000 °C; while the refractive index increases continuously through this process, the polarizability tends to decrease in the first stage and then increase in the second. This study is of special relevance for the understanding of the optical properties of this material and how they can potentially be tuned for applications such as waveguides, as well as for the integration of electrical and optical functionality in the same device.
Author Contributions
Conceptualization, A.S.S., K.L. and M.P.; methodology, A.S.S., D.M.E., T.T.R., M.S.R., K.L. and M.P.; software, A.S.S.; validation, K.L. and M.P.; formal analysis, A.S.S.; investigation, A.S.S., D.M.E., T.T.R., M.S.R., K.L. and M.P.; resources, M.S.R., K.L. and M.P.; data curation, A.S.S. and T.T.R.; writing—original draft preparation, A.S.S.; writing—review and editing, A.S.S., D.M.E., T.T.R., M.S.R., K.L. and M.P.; visualization, A.S.S.; supervision, M.S.R., K.L. and M.P.; project administration, K.L. and M.P.; funding acquisition, K.L. and M.P. All authors have read and agreed to the published version of the manuscript.
Funding
The authors acknowledge funding of the Research Unit INESC MN from the Fundação para a Ciência e a Tecnologia (FCT) through Plurianual financing (UIDB/05367/2025, UID/PRR/5367/2025 and UID/PRR2/05367/2025) [doi: https://doi.org/10.54499/UID/PRR/05367/2025 and https://doi.org/10.54499/UID/PRR2/05367/2025], as well as via the IonProGO project (2022.05329.PTDC, http://doi.org/10.54499/2022.05329.PTDC) and via the INESC MN Research Unit funding (UID/05367/2020) through Pluriannual BASE and PROGRAMATICO financing. A. S. Sousa thanks FCT for her PhD grant (2025.04778.BD), as does D. M. Esteves (2022.09585.BD, https://doi.org/10.54499/2022.09585.BD).
Data Availability Statement
The data presented in this study are openly available in Zenodo at https://doi.org/10.5281/zenodo.18876039, reference number [68].
Conflicts of Interest
The authors declare no conflicts of interest. The funders had no role in the design of the study; in the collection, analyses, or interpretation of data; in the writing of the manuscript; or in the decision to publish the results.
References
- Pearton, S.J.; Yang, J.; Cary, P.H.; Ren, F.; Kim, J.; Tadjer, M.J.; Mastro, M.A. A review of Ga2O3 materials, processing, and devices. Appl. Phys. Rev. 2018, 5, 011301. [Google Scholar] [CrossRef] [Scilit]
- Orita, M.; Hiramatsu, H.; Ohta, H.; Hirano, M.; Hosono, H. Preparation of highly conductive, deep ultraviolet transparent β-Ga2O3 thin film at low deposition temperatures. Thin Solid Film. 2002, 411, 134–139. [Google Scholar] [CrossRef] [Scilit]
- Kaur, D.; Kumar, M. A Strategic Review on Gallium Oxide Based Deep-Ultraviolet Photodetectors: Recent Progress and Future Prospects. Adv. Opt. Mater. 2021, 9, 2002160. [Google Scholar] [CrossRef] [Scilit]
- Higashiwaki, M.; Sasaki, K.; Kuramata, A.; Masui, T.; Yamakoshi, S. Gallium oxide (Ga2O3) metal-semiconductor field-effect transistors on single-crystal β-Ga2O3 (010) substrates. Appl. Phys. Lett. 2012, 100, 013504. [Google Scholar] [CrossRef] [Scilit]
- Liu, Z.; Li, P.G.; Zhi, Y.S.; Wang, X.L.; Chu, X.L.; Tang, W.H. Review of gallium oxide based field-effect transistors and Schottky barrier diodes. Chin. Phys. B 2019, 28, 017105. [Google Scholar] [CrossRef] [Scilit]
- Xu, J.; Zheng, W.; Huang, F. Gallium oxide solar-blind ultraviolet photodetectors: A review. J. Mater. Chem. C 2019, 7, 8753–8770. [Google Scholar] [CrossRef] [Scilit]
- Liao, C.H.; Li, K.H.; Torres-Castanedo, C.G.; Zhang, G.; Li, X. Wide range tunable bandgap and composition β-phase (AlGa)2O3 thin film by thermal annealing. Appl. Phys. Lett. 2021, 118, 032103. [Google Scholar] [CrossRef] [Scilit]
- Sousa, A.S.; Esteves, D.M.; Robalo, T.T.; Rodrigues, M.S.; Santos, L.F.; Lorenz, K.; Peres, M. Effect of Annealing on Al Diffusion and its Impact on the Properties of Ga2O3 Thin Films Deposited on c-Plane Sapphire by RF Sputtering. Phys. Status Solidi (RRL) –Rapid Res. Lett. 2026, 20, e202500053. [Google Scholar] [CrossRef] [Scilit]
- Zhou, J.; Chen, H.; Fu, H.; Fu, K.; Deng, X.; Huang, X.; Yang, T.H.; Montes, J.A.; Yang, C.; Qi, X.; et al. Demonstration of low loss β-Ga2O3 optical waveguides in the UV–NIR spectra. Appl. Phys. Lett. 2019, 115, 251108. [Google Scholar] [CrossRef] [Scilit]
- Han, Y.; Chen, W.; Jiao, T.; Yu, H.; Zhang, Z.; Dong, X.; Zhang, Y.; Zhang, B. Silicon-based gallium oxide optical waveguide fabricated by MOCVD. Vacuum 2025, 238, 114221. [Google Scholar] [CrossRef] [Scilit]
- Li, Z.; Tang, H.; Li, Y.; Gu, M.; Xu, J.; Chen, L.; Liu, J.; Ouyang, X.; Liu, B. Enhanced scintillation performance of β-Ga2O3 single crystals by Al3+ doping and its physical mechanism. Appl. Phys. Lett. 2022, 121, 102102. [Google Scholar] [CrossRef] [Scilit]
- Lin, Y.; Zhang, S. Recent Advanced Photodetectors Coupling Optical Structure. Photonics 2025, 12, 1096. [Google Scholar] [CrossRef] [Scilit]
- Jessen, G.H. The Supercharged Semiconductor: Gallium oxide could make powerful radios and switch thousands of volts. IEEE Spectr. 2021, 58, 36–42. [Google Scholar] [CrossRef] [Scilit]
- Saikumar, A.K.; Nehate, S.D.; Sundaram, K.B. Review—RF Sputtered Films of Ga2O3. ECS J. Solid State Sci. Technol. 2019, 8, Q3064. [Google Scholar] [CrossRef] [Scilit]
- Ramana, C.V. Properties of sputter-deposited gallium oxide. In Gallium Oxide; Pearton, S., Ren, F., Mastro, M., Eds.; Metal Oxides; Elsevier: Amsterdam, The Netherlands, 2019; pp. 47–66. [Google Scholar] [CrossRef] [Scilit]
- Patil, V.; Lee, B.T.; Jeong, S.H. Optical and structural characterization of high crystalline β-Ga2O3 films prepared using an RF magnetron sputtering. J. Alloys Compd. 2022, 894, 162551. [Google Scholar] [CrossRef] [Scilit]
- Mishra, M.; Saha, R.; Bhowmick, S.; Pandey, S.K.; Chakrabarti, S. Effect of post-deposition annealing ambient on gallium oxide (Ga2O3) films. In Proceedings of the UV and Higher Energy Photonics: From Materials to Applications 2022; SPIE: San Diego, CA, USA, 2022; Volume 12201, pp. 49–55. [Google Scholar] [CrossRef] [Scilit]
- Makai, L.; Lehto, T.; Fodor, B.; King, P. Breakthrough instruments and products: Investigation of atomic layer deposited Al:ZnO layer by spectroscopic ellipsometry from the deep-UV to the mid-IR in one instrument. Rev. Sci. Instrum. 2021, 92, 119501. [Google Scholar] [CrossRef] [Scilit]
- Nečas, D.; Klapetek, P. Gwyddion: An open-source software for SPM data analysis. Cent. Eur. J. Phys. 2012, 10, 181–188. [Google Scholar] [CrossRef] [Scilit]
- Alves, E.; Lorenz, K.; Catarino, N.; Peres, M.; Dias, M.; Mateus, R.; Alves, L.C.; Corregidor, V.; Barradas, N.P.; Fonseca, M.; et al. An insider view of the Portuguese ion beam laboratory. Eur. Phys. J. Plus 2021, 136, 684. [Google Scholar] [CrossRef] [Scilit]
- Barradas, N.P.; Jeynes, C. Advanced physics and algorithms in the IBA DataFurnace. Nucl. Instrum. Methods Phys. Res. Sect. B Beam Interact. Mater. At. 2008, 266, 1875–1879. [Google Scholar] [CrossRef] [Scilit]
- Harrington, G.F.; Santiso, J. Back-to-Basics tutorial: X-ray diffraction of thin films. J. Electroceramics 2021, 47, 141–163. [Google Scholar] [CrossRef] [Scilit]
- Morita, M.; Ohmi, T.; Hasegawa, E.; Kawakami, M.; Ohwada, M. Growth of native oxide on a silicon surface. J. Appl. Phys. 1990, 68, 1272–1281. [Google Scholar] [CrossRef] [Scilit]
- Yen, C.C.; Huang, T.M.; Chen, P.W.; Chang, K.P.; Wu, W.Y.; Wuu, D.S. Role of Interfacial Oxide in the Preferred Orientation of Ga2O3 on Si for Deep Ultraviolet Photodetectors. ACS Omega 2021, 6, 29149–29156. [Google Scholar] [CrossRef] [Scilit] [PubMed]
- Altuntas, H.; Donmez, I.; Ozgit-Akgun, C.; Biyikli, N. Effect of postdeposition annealing on the electrical properties of β-Ga2O3 thin films grown on p-Si by plasma-enhanced atomic layer deposition. J. Vac. Sci. Technol. A 2014, 32, 041504. [Google Scholar] [CrossRef] [Scilit]
- Muhammad, A.; Ng, S.S.; Quah, H.J.; Hamzah, N.A.; Abutawahina, M.S.M.; Shitu, I.G. Post-rapid thermal annealing time-dependent engineering of gallium oxide/gallium nitride heterostructures for enhanced optoelectronic performance. Opt. Mater. 2025, 168, 117477. [Google Scholar] [CrossRef] [Scilit]
- Muhammad, A.; Ng, S.S.; Quah, H.J.; Abutawahina, M.S.M. Tailoring annealing duration of gallium oxide film deposited by electron beam evaporation. Ceram. Int. 2025, 51, 32240–32250. [Google Scholar] [CrossRef] [Scilit]
- Gopireddy, D.; Takoudis, C.G. Diffusion-reaction modeling of silicon oxide interlayer growth during thermal annealing of high dielectric constant materials on silicon. Phys. Rev. B 2008, 77, 205304. [Google Scholar] [CrossRef] [Scilit]
- Gu, L.; Ma, H.P.; Shen, Y.; Zhang, J.; Chen, W.J.; Yang, R.Y.; Wu, F.; Yang, L.; Zeng, Y.X.; Wang, X.R.; et al. Temperature-dependent oxygen annealing effect on the properties of Ga2O3 thin film deposited by atomic layer deposition. J. Alloys Compd. 2022, 925, 166727. [Google Scholar] [CrossRef] [Scilit]
- Feng, Z.; Huang, L.; Feng, Q.; Li, X.; Zhang, H.; Tang, W.; Zhang, J.; Hao, Y. Influence of annealing atmosphere on the performance of a β-Ga2O3 thin film and photodetector. Opt. Mater. Express 2018, 8, 2229–2237. [Google Scholar] [CrossRef] [Scilit]
- Wang, J.; Ji, X.; Yan, Z.; Qi, S.; Liu, X.; Zhong, A.; Li, P. The role of oxygen vacancies in Ga2O3-based solar-blind photodetectors. J. Alloys Compd. 2024, 970, 172448. [Google Scholar] [CrossRef] [Scilit]
- Stepanov, S.; Nikolaev, V.; Bougrov, V.; Romanov, A. Gallium Oxide: Properties and Applications—A Review. Rev. Adv. Mater. Sci. 2016, 44, 63–86. [Google Scholar]
- Makeswaran, N.; Battu, A.K.; Deemer, E.; Ramana, C.V. Crystal Growth and Structure–Property Optimization of Thermally Annealed Nanocrystalline Ga2O3 Films. Cryst. Growth Des. 2020, 20, 2893–2903. [Google Scholar] [CrossRef] [Scilit]
- Åhman, J.; Svensson, G.; Albertsson, J. A Reinvestigation of β-Gallium Oxide. Acta Crystallogr. Sect. C Cryst. Struct. Commun. 1996, 52, 1336–1338. [Google Scholar] [CrossRef] [Scilit]
- Scherrer, P. Bestimmung der Größe und der inneren Struktur von Kolloidteilchen mittels Röntgenstrahlen. Nachrichten Ges. Wiss. GöTtingen Math.-Phys. Kl. 1918, 1918, 98–100. [Google Scholar]
- Stokes, A.R.; Wilson, A.J.C. The diffraction of X rays by distorted crystal aggregates—I. Proc. Phys. Soc. 1944, 56, 174. [Google Scholar] [CrossRef] [Scilit]
- Sinha, G.; Adhikary, K.; Chaudhuri, S. Effect of annealing temperature on structural transformation of gallium based nanocrystalline oxide thin films and their optical properties. Opt. Mater. 2007, 29, 718–722. [Google Scholar] [CrossRef] [Scilit]
- Gu, L.; Shen, Y.; Chen, W.; Zuo, Y.; Ma, H.; Zhang, Q. The Influence of Annealing Temperature on the Interfacial Heat Transfer in Pulsed Laser Deposition-Grown Ga2O3 on Diamond Composite Substrates. C 2024, 10, 80. [Google Scholar] [CrossRef] [Scilit]
- Guo, P.; Xiong, J.; Zhao, X.; Sheng, T.; Yue, C.; Tao, B.; Liu, X. Growth characteristics and device properties of MOD derived β-Ga2O3 films. J. Mater. Sci. Mater. Electron. 2014, 25, 3629–3632. [Google Scholar] [CrossRef] [Scilit]
- Dong, L.; Jia, R.; Xin, B.; Zhang, Y. Effects of post-annealing temperature and oxygen concentration during sputtering on the structural and optical properties of β-Ga2O3 films. J. Vac. Sci. Technol. A 2016, 34, 060602. [Google Scholar] [CrossRef] [Scilit]
- Jellison, G.E., Jr.; Modine, F.A. Parameterization of the optical functions of amorphous materials in the interband region. Appl. Phys. Lett. 1996, 69, 371–373, Erratum in Appl. Phys. Lett. 1996, 69, 2137. https://doi.org/10.1063/1.118155. [Google Scholar] [CrossRef] [Scilit]
- Kalanov, D.; Unutulmazsoy, Y.; Spemann, D.; Bauer, J.; Anders, A.; Bundesmann, C. Properties of gallium oxide thin films grown by ion beam sputter deposition at room temperature. J. Vac. Sci. Technol. A 2022, 40, 033409. [Google Scholar] [CrossRef] [Scilit]
- Shih, H.Y.; Chu, F.C.; Das, A.; Lee, C.Y.; Chen, M.J.; Lin, R.M. Atomic Layer Deposition of Gallium Oxide Films as Gate Dielectrics in AlGaN/GaN Metal–Oxide–Semiconductor High-Electron-Mobility Transistors. Nanoscale Res. Lett. 2016, 11, 235. [Google Scholar] [CrossRef] [Scilit]
- Mahmoodinezhad, A.; Janowitz, C.; Naumann, F.; Plate, P.; Gargouri, H.; Henkel, K.; Schmeißer, D.; Flege, J.I. Low-temperature growth of gallium oxide thin films by plasma-enhanced atomic layer deposition. J. Vac. Sci. Technol. A 2020, 38, 022404. [Google Scholar] [CrossRef] [Scilit]
- Allen, T.G.; Cuevas, A. Electronic passivation of silicon surfaces by thin films of atomic layer deposited gallium oxide. Appl. Phys. Lett. 2014, 105, 031601. [Google Scholar] [CrossRef] [Scilit]
- Onuma, T.; Saito, S.; Sasaki, K.; Masui, T.; Yamaguchi, T.; Honda, T.; Kuramata, A.; Higashiwaki, M. Spectroscopic ellipsometry studies on β-Ga2O3 films and single crystal. Jpn. J. Appl. Phys. 2016, 55, 1202B2. [Google Scholar] [CrossRef] [Scilit]
- Zhao, M.; Tong, R.; Chen, X.; Ma, T.; Dai, J.; Lian, J.; Ye, J. Ellipsometric determination of anisotropic optical constants of single phase Ga2O3 thin films in its orthorhombic and monoclinic phases. Opt. Mater. 2020, 102, 109807. [Google Scholar] [CrossRef] [Scilit]
- Liu, W.; He, J.; Zhu, X.; Huang, T.; Chen, X.; Zheng, Y.; Chen, L.; Zhang, R. Thickness dependent optical properties of amorphous/polycrystalline Ga2O3 thin films grown by plasma-enhanced atomic layer deposition. Thin Solid Film. 2023, 766, 139655. [Google Scholar] [CrossRef] [Scilit]
- Gajdics, M.; Cora, I.; Zámbó, D.; Horváth, Z.E.; Sulyok, A.; Frey, K.; Pécz, B. Evolution of structural and photoluminescent properties of sputter-deposited Ga2O3 thin films during post-deposition heat treatment. J. Alloys Compd. 2025, 1021, 179634. [Google Scholar] [CrossRef] [Scilit]
- Nguyen, T.T.; Jung, D.H.; Lee, J.J.; Lee, H. Optical study of Ga2-xSnxO3 (0 ≤ X ≤ 0.7) thin films using spectroscopic ellipsometry and cathodoluminescence. Thin Solid Film. 2023, 764, 139611. [Google Scholar] [CrossRef] [Scilit]
- Gilliot, M. Wavelength-by-wavelength Kramers–Kronig consistent inversion of ellipsometry data. Appl. Opt. 2019, 58, 8153–8159. [Google Scholar] [CrossRef] [Scilit]
- Gilliot, M.; Hadjadj, A.; Stchakovsky, M. Revised wavelength-by-wavelength inversion of ellipsometry data of semiconductor thin films. J. Vac. Sci. Technol. B Nanotechnol. Microelectron. Mater. Process. Meas. Phenom. 2019, 37, 062925. [Google Scholar] [CrossRef] [Scilit]
- Bohórquez, C.; Bakkali, H.; Delgado, J.J.; Blanco, E.; Herrera, M.; Domínguez, M. Spectroscopic Ellipsometry Study on Tuning the Electrical and Optical Properties of Zr-Doped ZnO Thin Films Grown by Atomic Layer Deposition. ACS Appl. Electron. Mater. 2022, 4, 925–935. [Google Scholar] [CrossRef] [Scilit] [PubMed]
- Mock, A.; Korlacki, R.; Briley, C.; Darakchieva, V.; Monemar, B.; Kumagai, Y.; Goto, K.; Higashiwaki, M.; Schubert, M. Band-to-band transitions, selection rules, effective mass, and excitonic contributions in monoclinic β-Ga2O3. Phys. Rev. B 2017, 96, 245205. [Google Scholar] [CrossRef] [Scilit]
- Jellison, G.E.; Merkulov, V.I.; Puretzky, A.A.; Geohegan, D.B.; Eres, G.; Lowndes, D.H.; Caughman, J.B. Characterization of thin-film amorphous semiconductors using spectroscopic ellipsometry. Thin Solid Films 2000, 377–378, 68–73. [Google Scholar] [CrossRef] [Scilit]
- Klein, J.; Kampermann, L.; Mockenhaupt, B.; Behrens, M.; Strunk, J.; Bacher, G. Limitations of the Tauc Plot Method. Adv. Funct. Mater. 2023, 33, 2304523. [Google Scholar] [CrossRef] [Scilit]
- Muhammad, A.; Hassan, Z.; Mohammad, S.M.; Rajamanickam, S.; Shitu, I.G. Effect of trisodium citrate on morphological, structural, and optical properties of fluorine-doped ZnO structures. Ceram. Int. 2022, 48, 13431–13439. [Google Scholar] [CrossRef] [Scilit]
- Lim, H.; Kim, D.; Yeon Cha, S.; Simon Mun, B.; Young Noh, D.; Chol Kang, H. Crystallization and bandgap variation of non-stoichiometric amorphous Ga2O3-x thin films during post-annealing process. Appl. Surf. Sci. 2022, 585, 152771. [Google Scholar] [CrossRef] [Scilit]
- Wang, Z.Y.; Zhang, R.J.; Lu, H.L.; Chen, X.; Sun, Y.; Zhang, Y.; Wei, Y.F.; Xu, J.P.; Wang, S.Y.; Zheng, Y.X.; et al. The impact of thickness and thermal annealing on refractive index for aluminum oxide thin films deposited by atomic layer deposition. Nanoscale Res. Lett. 2015, 10, 46. [Google Scholar] [CrossRef] [Scilit]
- Fujiwara, H. Spectroscopic Ellipsometry: Principles and Applications; John Wiley & Sons: Hoboken, NJ, USA, 2007. [Google Scholar]
- Tan, C.Z. Dependence of the refractive index on density, temperature, and the wavelength of the incident light. Eur. Phys. J. B 2021, 94, 139. [Google Scholar] [CrossRef] [Scilit]
- Piercy, B.D.; Leng, C.Z.; Losego, M.D. Variation in the density, optical polarizabilities, and crystallinity of TiO2 thin films deposited via atomic layer deposition from 38 to 150 °C using the titanium tetrachloride-water reaction. J. Vac. Sci. Technol. A 2017, 35, 03E107. [Google Scholar] [CrossRef] [Scilit]
- Busani, T.; Devine, R.A.B. Dielectric and infrared properties of TiO2 films containing anatase and rutile. Semicond. Sci. Technol. 2005, 20, 870. [Google Scholar] [CrossRef] [Scilit]
- Kakiuchida, H.; Saito, K.; Ikushima, A.J. Refractive Index, Density and Polarizability of Silica Glass with Various Fictive Temperatures. Jpn. J. Appl. Phys. 2004, 43, L743. [Google Scholar] [CrossRef] [Scilit]
- Usha, K.S.; Sivakumar, R.; Sanjeeviraja, C. Optical constants and dispersion energy parameters of NiO thin films prepared by radio frequency magnetron sputtering technique. J. Appl. Phys. 2013, 114, 123501. [Google Scholar] [CrossRef] [Scilit]
- Rahane, A.B.; Deshpande, M.D.; Chakraborty, S. Optical Properties of Gallium Oxide Clusters from First-Principles Calculations. J. Phys. Chem. A 2012, 116, 10559–10565. [Google Scholar] [CrossRef] [Scilit]
- Schwerdtfeger, P.; Nagle, J.K. 2018 Table of static dipole polarizabilities of the neutral elements in the periodic table. Mol. Phys. 2019, 117, 1200–1225. [Google Scholar] [CrossRef] [Scilit]
- Sousa, A.S.; Magalhães Esteves, D.; Robalo, T.T.; Rodrigues, M.; Lorenz, K.; Peres, M. Study on the Effect of Annealing on Ga2O3 Thin Films Deposited on Silicon by RF Sputtering. Zenodo 2026. [Google Scholar] [CrossRef]

Disclaimer/Publisher’s Note: The statements, opinions and data contained in all publications are solely those of the individual author(s) and contributor(s) and not of MDPI and/or the editor(s). MDPI and/or the editor(s) disclaim responsibility for any injury to people or property resulting from any ideas, methods, instructions or products referred to in the content. |
© 2026 by the authors. Licensee MDPI, Basel, Switzerland. This article is an open access article distributed under the terms and conditions of the Creative Commons Attribution (CC BY) license.