


Abstract
Background: In adults with type 1 diabetes (T1D), routine anthropometric assessment may not detect deterioration in muscle quality and cellular integrity. Body mass index (BMI) remains useful as a first-line screening tool but cannot distinguish lean mass, fat mass and tissue quality. This study aims to describe bioimpedance-derived cellular integrity, apply the full diagnostic algorithm of the European Working Group on Sarcopenia in Older People (EWGSOP2), compare two bioimpedance muscle-mass equations, and examine the associations of disease duration and long-term glycemic exposure with muscle-related outcomes. Methods: This cross-sectional study included 193 adults with T1D recruited by consecutive sampling at the outpatient clinics of two hospitals. Participants underwent phase-sensitive 50 kHz bioelectrical impedance analysis (BIA), handgrip dynamometry and chair stand testing, and historical HbA1c and continuous glucose monitoring data were retrieved. Low muscle mass was estimated using the Janssen and Sergi equations with predefined sex-specific thresholds, and the complete EWGSOP2 algorithm was applied to distinguish low muscle mass from probable, confirmed and severe sarcopenia. Multivariable ordinary least squares models were adjusted for age and sex and fitted separately to preserve the largest complete-case sample for each outcome, with Benjamini–Hochberg correction for multiple testing. Results: Estimated low muscle mass differed markedly by equation, from 28.4% (Janssen) to 8.7% (Sergi); probable sarcopenia, defined by low handgrip strength, was present in 8.5%, whereas confirmed sarcopenia occurred in 2 of 167 participants (1.2%) and severe sarcopenia in none. The 16 participants identified by the Sergi equation were a strict subset of the 52 identified by the Janssen equation. Longer T1D duration was associated with a lower phase angle (β = −0.018 per year; 95% CI −0.028 to −0.009; and p < 0.001), independently of chronological age. Historical HbA1c was not associated with the appendicular skeletal muscle mass index (β = +0.092; p = 0.190) but was associated with lower handgrip strength (β = −1.67 kg per 1%; p = 0.013), a longer five-repetition chair stand time (β = +0.71 s per 1%; p = 0.004) and a lower muscle quality index (β = −0.064 per 1%; p = 0.025). Conclusions: In long-standing T1D, disease duration was associated with impaired cellular integrity and cumulative glycemic exposure with reduced muscle function and quality rather than with reduced muscle quantity. Estimated prevalence of low muscle mass varied more than threefold with the equation applied, while confirmed sarcopenia was rare. These cross-sectional findings suggest that BIA-derived muscle-mass equations should not be used in isolation and support anchoring morphofunctional assessment in measured muscle strength, complemented by phase angle.
1. Introduction
The clinical management of type 1 diabetes (T1D) has historically focused on preventing microvascular and macrovascular complications. Increasing life expectancy, new insulin analogs and continuous glucose monitoring have brought new therapeutic challenges, among them the early onset of musculoskeletal frailty [1]. Sarcopenia is no longer regarded solely as a consequence of aging, nor defined simply as low muscle mass [2]. Under current consensus statements, including the European Working Group on Sarcopenia in Older People (EWGSOP2) and the Global Leadership Initiative in Sarcopenia, it is defined as a progressive muscle disease in which loss of strength and structural quality is more relevant than volumetric reduction [1,3].
Skeletal muscle is an active endocrine organ essential for metabolic homeostasis, so its deterioration is particularly relevant in diabetes [4]. This has supported the adoption of morphofunctional assessment, which combines body composition and muscle function measurements [5]. In type 2 diabetes, diabetic sarcopenia is well-established: insulin resistance inhibits muscle protein synthesis while chronic hyperglycemia and low-grade inflammation accelerate proteolysis [6], and glycemic variability aggravates the catabolic environment [7].
In T1D the evidence is considerably weaker [8]. Absolute insulin deficiency and lifelong glycemic excursions may threaten muscle function through partly different mechanisms [9], and cross-sectional studies report a wide range of prevalence estimates for reduced muscle mass and dynapenia [8,9]. Routine outpatient assessment nevertheless still relies largely on body mass index (BMI), which cannot distinguish functional lean tissue, fluid retention and adipose tissue. A further and less examined problem is that estimates of muscle mass in this setting depend on the bioimpedance prediction equation chosen, and that these estimates are frequently reported as sarcopenia without applying the strength and performance criteria required by current consensus definitions [2,3].
Accordingly, this study examines the muscle–glucose axis in a well-characterized cohort of adults with T1D attending outpatient clinics. We describe the distribution of low muscle mass and of the complete EWGSOP2 sarcopenia stages, compare two widely used bioimpedance equations, and evaluate the associations of disease duration and of historical glycemic exposure with cell membrane integrity, muscle mass and muscle function. We hypothesized that the chronicity of T1D would be associated with lower phase angle independently of chronological age, and that estimates of muscle mass would vary substantially with the equation applied.
2. Materials and Methods
2.1. Study Design and Participants
This was a cross-sectional observational study nested within a broader protocol on emerging metabolic and nutritional phenotypes in T1D. It initially included 194 patients with T1D, of whom 193 were retained for analysis after exclusion of one incomplete record during data cleaning. Participants were followed within the Spanish public healthcare system at the endocrinology outpatient clinics of two participating hospitals and were recruited at each site by consecutive non-probability sampling: all adults with T1D attending the clinic during the inclusion period and meeting the selection criteria were invited in strict order of attendance, in order to limit selection bias. Inclusion criteria were age 18 years or older, a confirmed diagnosis of T1D of more than one year’s duration, active follow-up at the clinic and written informed consent. Exclusion criteria were pregnancy, an implanted pacemaker or defibrillator, major amputation precluding bioimpedance or functional testing, primary myopathy, advanced heart failure (NYHA class III–IV) and severe cognitive impairment. The protocol specified a minimum sample size of 190 participants, which the analytical sample satisfies.
2.2. Body Composition and Bioelectrical Impedance Analysis (BIA)
Routine anthropometric measurements, including body weight and height, were recorded to calculate body mass index (BMI, kg/m2). Whole-body composition was assessed using a phase-sensitive, single-frequency 50 kHz bioelectrical impedance analyzer (Akern Nutrilab, Akern Srl, Florence, Italy), the same model at both sites [10]. Measurements were performed in the supine position following standard electrode placement, during routine outpatient visits at varying times of day, without enforced fasting or hydration control.
The device provided direct measurements of the raw bioelectrical parameters: resistance (R), which is inversely related to total body water, and reactance (Xc), which reflects the capacitance of cell membranes and is therefore an indicator of cellular integrity [10]. Phase angle (PA, °) was calculated as arctan (Xc/R) × 180/π. A PA threshold of <5° was applied for descriptive stratification only. This threshold derives from percentile-based cut-offs established in oncological and general hospitalized populations [11] and has not been validated in adults with T1D of comparable age, sex distribution or ethnicity; it is therefore used as exploratory and is not employed in any inferential model, in all of which PA is analyzed as a continuous variable.
Predictive equations were selected on the basis of hardware compatibility with a phase-sensitive analyzer and validation against a reference method. The rationale for this selection is discussed in Section 4.4.
- Appendicular skeletal muscle mass (ASMM)—the Sergi equation. Appendicular mass was estimated with the equation of Sergi et al. [12], validated against dual-energy X-ray absorptiometry in free-living Caucasian older adults, which incorporates reactance in addition to resistance:
- 2.
- Total skeletal muscle mass (SMM)—the Janssen equation. For comparative purposes we applied the equation of Janssen et al. [13], a multiethnic model validated against magnetic resonance imaging:
Both estimates were normalized to height squared to obtain the appendicular skeletal muscle mass index (ASMI = ASMM/height2) and the skeletal muscle mass index (SMI = SMM/height2). Low muscle mass was defined by ASMI < 7.0 kg/m2 in men and <5.5 kg/m2 in women, in accordance with EWGSOP2 [3], and by SMI < 10.75 kg/m2 in men and <6.75 kg/m2 in women, in accordance with the thresholds proposed by Janssen and colleagues [14]. A muscle quality index was calculated as maximal handgrip strength divided by ASMM (kg/kg) [15].
- 3.
- Fat-free mass (FFM)—the Kyle equation. Fat-free mass was calculated with the equation of Kyle et al., validated in Caucasian populations, and fat mass (FM) was derived by subtraction [16]. Both compartments were normalized to height squared to obtain the fat-free mass index and the fat mass index (FMI = FM/height2, kg/m2) [17]. An elevated FMI was defined as ≥9 kg/m2 in men and ≥13 kg/m2 in women [18].
Other historical BIA equations, such as those of Baumgartner, Lukaski and Chou, were not applied [19].
2.3. Functional Assessment
Handgrip strength was measured with participants seated, the shoulder adducted, the elbow flexed at 90° and the forearm in a neutral position. Three maximal trials were performed with each hand, alternating sides, with a one-minute rest interval between trials; the single highest value obtained across both hands was retained for analysis, because this maximized the number of participants with a valid measurement. Two devices were used over the recruitment period, a Jamar Plus+ digital dynamometer (Performance Health, Warrenville, IL, USA) at one site and a hydraulic Jamar dynamometer (Performance Health) in most participants at the other, with a small number also measured with the digital device; the instrument used was not recorded at the individual level. Low strength was defined as <27 kg in men and <16 kg in women [3].
Two chair stand protocols were performed. In the five-repetition test, participants rose from a standard chair without armrests with the arms folded across the chest, and the time to complete five sit-to-stand cycles was recorded; poor physical performance was defined as more than 15 s [3]. In the 30 s test, the number of complete repetitions performed in 30 s was counted. The five-repetition test was used for EWGSOP2 staging, and both tests were analyzed as continuous outcomes. EWGSOP2 stages were assigned as follows: low muscle mass, an ASMI below the sex-specific threshold; probable sarcopenia, low handgrip strength; confirmed sarcopenia, low handgrip strength together with low ASMI; and severe sarcopenia, confirmed sarcopenia together with a five-repetition chair stand time of more than 15 s [3].
2.4. Glycemic Assessment
Historical HbA1c was calculated as the unweighted arithmetic mean of all HbA1c determinations recorded in the electronic health record between January 2019 and December 2025. Determinations were performed in the clinical laboratory of the participant’s own center; assays were not prospectively harmonized across sites, which is acknowledged as a limitation. The median number of determinations per participant was 9 (interquartile range 7–11; range 3–21), distributed across the whole observation window, which both precedes and surrounds the bioimpedance assessment. The variable therefore represents cumulative glycemic exposure over approximately seven years.
Continuous glucose monitoring (CGM) metrics were extracted retrospectively from the manufacturers’ platforms as consecutive 90-day reporting periods. The number of available periods was not uniform (median 10 per participant; interquartile range 7–10; and maximum 21), corresponding to a median aggregated window of approximately 2.5 years and a range from under one year to five years. Mean sensor wear time was 91.7% ± 18.5% (median 100%); 15 of 188 participants (8.0%) had wear time below 70%, and no minimum threshold was applied at extraction. Periods without data were omitted rather than imputed, and aggregate metrics are unweighted means of the available periods. Current-visit metrics, namely time in range (TIR) and the glucose management indicator, are reported descriptively; aggregated long-term metrics are used only in exploratory analyses.
2.5. Statistical Analysis
Data handling and statistical analyses were carried out using IBM SPSS Statistics for Windows, version 27.0 (IBM Corp., Armonk, NY, USA), with independent verification in Python 3 (Python Software Foundation, Wilmington, DE, USA; statsmodels 0.15). Continuous variables are reported as means with standard deviations and categorical variables as counts and percentages. Between-group differences were evaluated with Welch’s t test for continuous variables and the chi-squared test for categorical variables. Agreement between diagnostic criteria was quantified with Cohen’s kappa.
The parent protocol prespecified the estimation of sarcopenia prevalence, the application of the EWGSOP2 algorithm and the comparison between the Janssen and Sergi equations; these analyses are therefore prespecified.
The regression models relating disease duration and glycemic exposure to phase angle, muscle mass and muscle function were planned within the protocol’s general statistical framework but were not prespecified as primary endpoints, and analyses of the muscle quality index and of phase angle in relation to microvascular complications are exploratory and labeled as such. Multivariable ordinary least squares regression models were fitted with complete-case analysis, implemented as listwise deletion, so that each model was fitted to the largest complete-case sample achievable for its outcome–predictor pairing rather than to a single fixed subset.
All models were adjusted for chronological age and biological sex, with male as the reference category. Models were kept parsimonious because the least frequent outcomes comprised only 15 to 16 events; the wider adjustment set specified in the protocol, comprising disease duration, glycemic control and BMI, and additional adjustment for recruiting site are reported as sensitivity analyses in Supplementary Table S5.
Multicollinearity was assessed by Pearson correlation and variance inflation factors. The planned set comprised nine models as follows: the five models of phase angle (Section 3.4) and the four models of muscle mass, strength and physical performance in relation to historical HbA1c (Section 3.5). The Benjamini–Hochberg procedure was applied across these nine models to control the false discovery rate; throughout the manuscript p denotes the unadjusted two-sided p value and q the false discovery rate adjusted p value. The muscle quality index is not specified in the study protocol, is reported as exploratory and is not included in the corrected set. Statistical significance was defined as a two-sided p value below 0.05.
3. Results
3.1. Baseline Cohort Characteristics
The study population consisted of 193 adults with a confirmed diagnosis of type 1 diabetes (T1D), following the exclusion of one incomplete record during data cleaning. There was a slight male predominance (110, 57.0%) over females (83, 43.0%), with a mean age of 55.7 ± 9.7 years. Mean T1D duration was 27.6 ± 11.0 years, longer than in most previously published T1D cohorts [8,9]. The two recruiting sites contributed 108 and 85 participants and were comparable in age, sex distribution, disease duration, BMI, handgrip strength and chair stand performance, although raw impedance parameters differed between them; this comparison is presented in Supplementary Table S10 and addressed in Section 4.4 and Section 4.6. Baseline characteristics of the whole cohort are summarized in Table 1.
Table 1.
Baseline clinical, anthropometric, and metabolic characteristics of the study cohort.
3.2. Body Mass Index and the Distribution of Body Composition Phenotypes
BMI remains convenient, widely available and useful as a first-line screening tool. In this cohort, however, BMI category and compartment-specific indices identified partially non-overlapping groups.
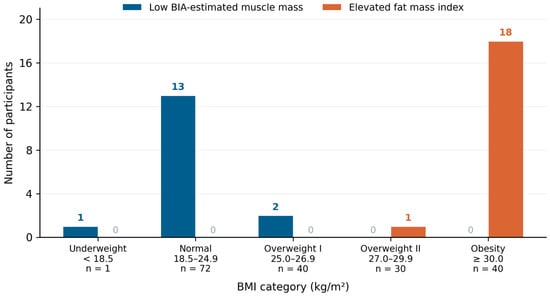
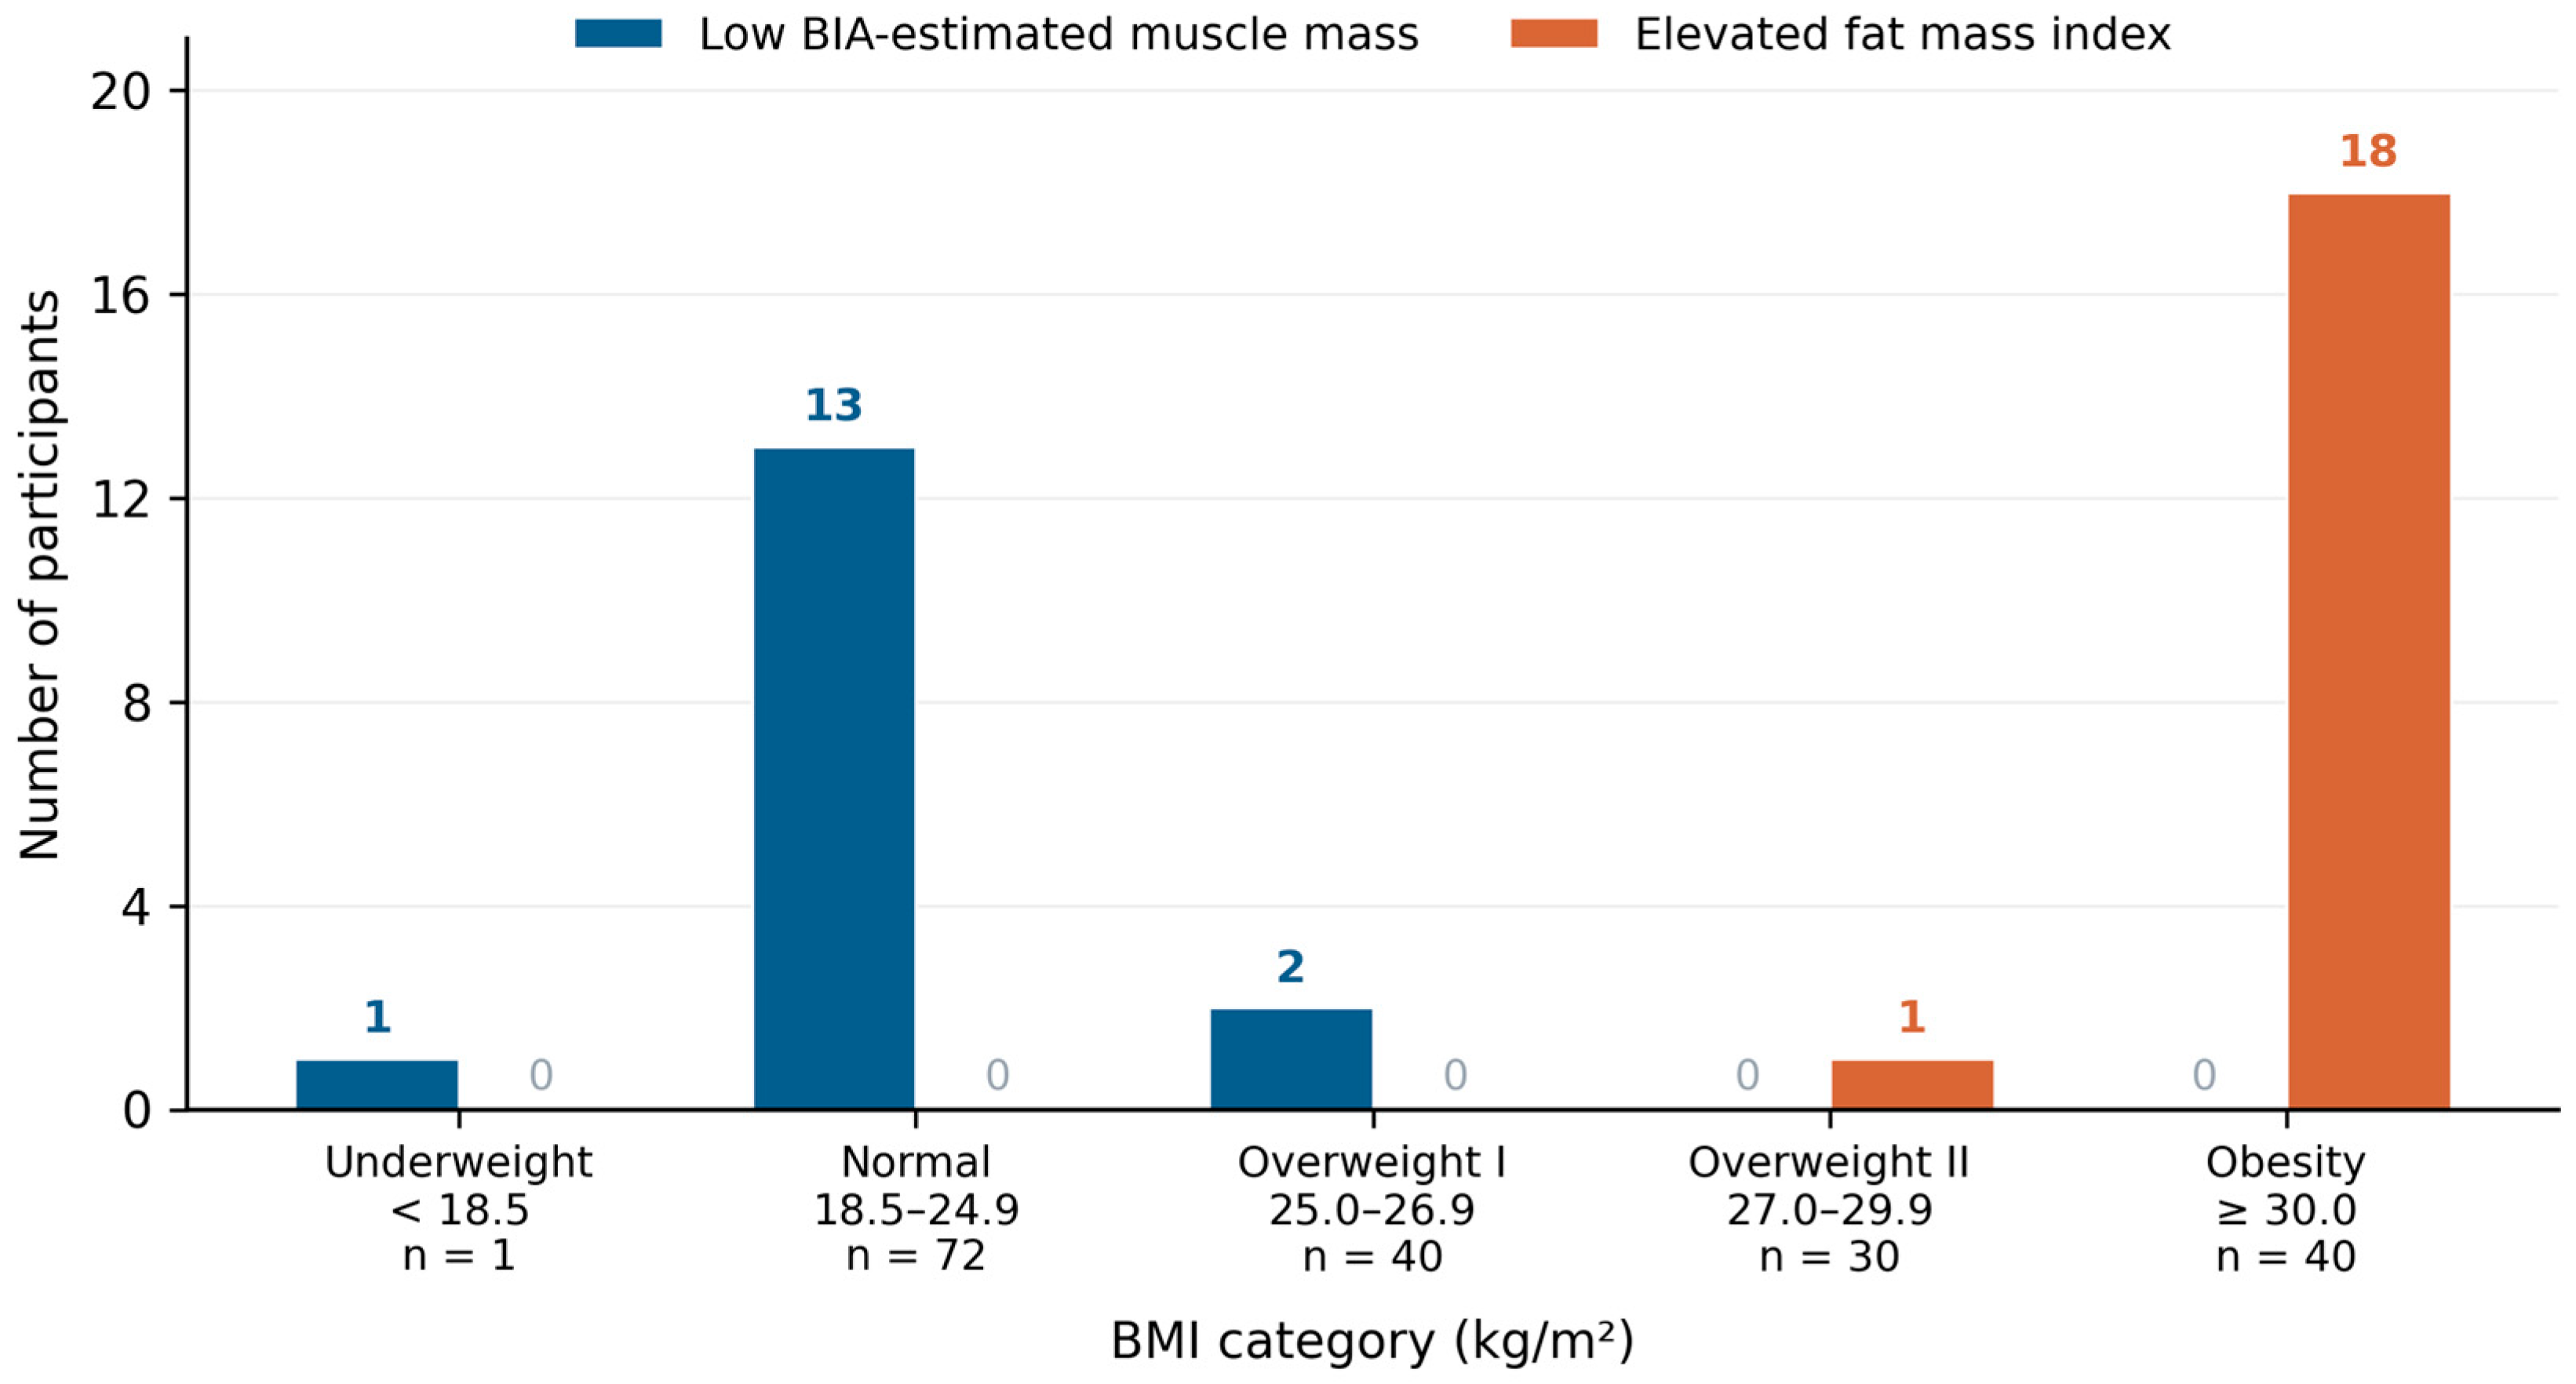
Among the 183 participants with complete bioimpedance data, 40 had a BMI of 30 kg/m2 or above; of these, 18 (45.0%) had an elevated fat mass index while the remaining 22 did not.
Conversely, all 16 participants with low BIA-estimated muscle mass had a BMI below 27 kg/m2: 13 were of normal weight (18.5–24.9 kg/m2), two were in the overweight I category and one was underweight.
Figure 1 shows the distribution of both criteria across BMI categories among the 183 participants with complete bioimpedance data. The number of participants in each BMI category is given beneath its label. The underlying contingency table is provided in Supplementary Table S9.
Figure 1.
Number of participants meeting each body composition criterion within each BMI category, among the 183 participants with complete bioimpedance data. Bars show absolute counts; the number of participants in each BMI category is given beneath its label. Definitions and cut-off values for low BIA-estimated muscle mass and elevated fat mass index are given in Section 2.2 and Supplementary Table S1.
3.3. EWGSOP2 Staging and Comparison Between Equations
Applying different prediction equations to the same raw impedance data produced substantially different estimates of low muscle mass. The Janssen equation classified 28.4% of participants (52/183) below the sex-specific threshold, with a marked difference by sex (44.2% of men versus 7.6% of women), whereas the Sergi equation classified 8.7% (16/183; 12.5% of men, 3.8% of women). Low handgrip strength, corresponding to probable sarcopenia, was present in 8.5% (15/177). When the complete EWGSOP2 algorithm was applied, confirmed sarcopenia was identified in 2 of 167 participants (1.2%) and severe sarcopenia in none of the 159 participants with all three components available (Table 2).
Table 2.
Distribution of EWGSOP2 stages and of equation-derived low muscle mass.
The two equations did not identify distinct groups in this cohort: all 16 participants classified by the Sergi equation were also classified by the Janssen equation, so the two criteria differed in the number of participants identified rather than in which of them were identified (Cohen’s κ = 0.39). Agreement of each equation with the handgrip-based criterion was poor (κ = 0.06 for Sergi and 0.11 for Janssen). Neither index was associated with handgrip strength after adjustment for age and sex (ASMI: β = +0.94, 95% CI −0.44 to +2.31, and p = 0.179; SMI: β = +0.48, 95% CI −0.43 to +1.39, and p = 0.300).
In the unadjusted comparison, participants classified by the Janssen equation had higher handgrip strength than those not classified (37.0 ± 10.6 versus 32.4 ± 11.8 kg; p = 0.016). This difference did not persist after adjustment for age and sex, and the direction of the association reversed (β = −2.79 kg, 95% CI −5.60 to +0.02, and p = 0.051); in sex-stratified analyses it was not significant in either stratum (men: β = −3.45, 95% CI −7.02 to +0.11, and p = 0.057; women: β = +0.18, 95% CI −5.20 to +5.55, and p = 0.949). With additional adjustment for BMI the association was significant in the expected direction (β = −3.24, 95% CI −6.19 to −0.28, and p = 0.032) (Table 3).
Table 3.
Handgrip strength in relation to Janssen-defined low muscle mass: unadjusted, adjusted and sex-stratified estimates.
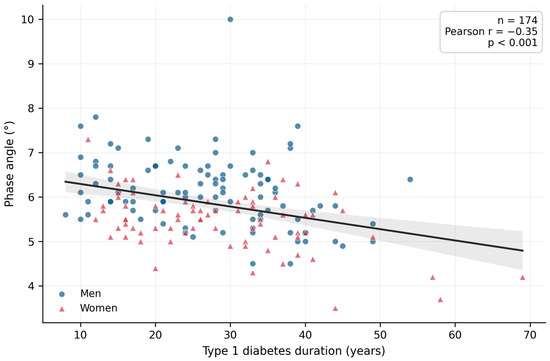
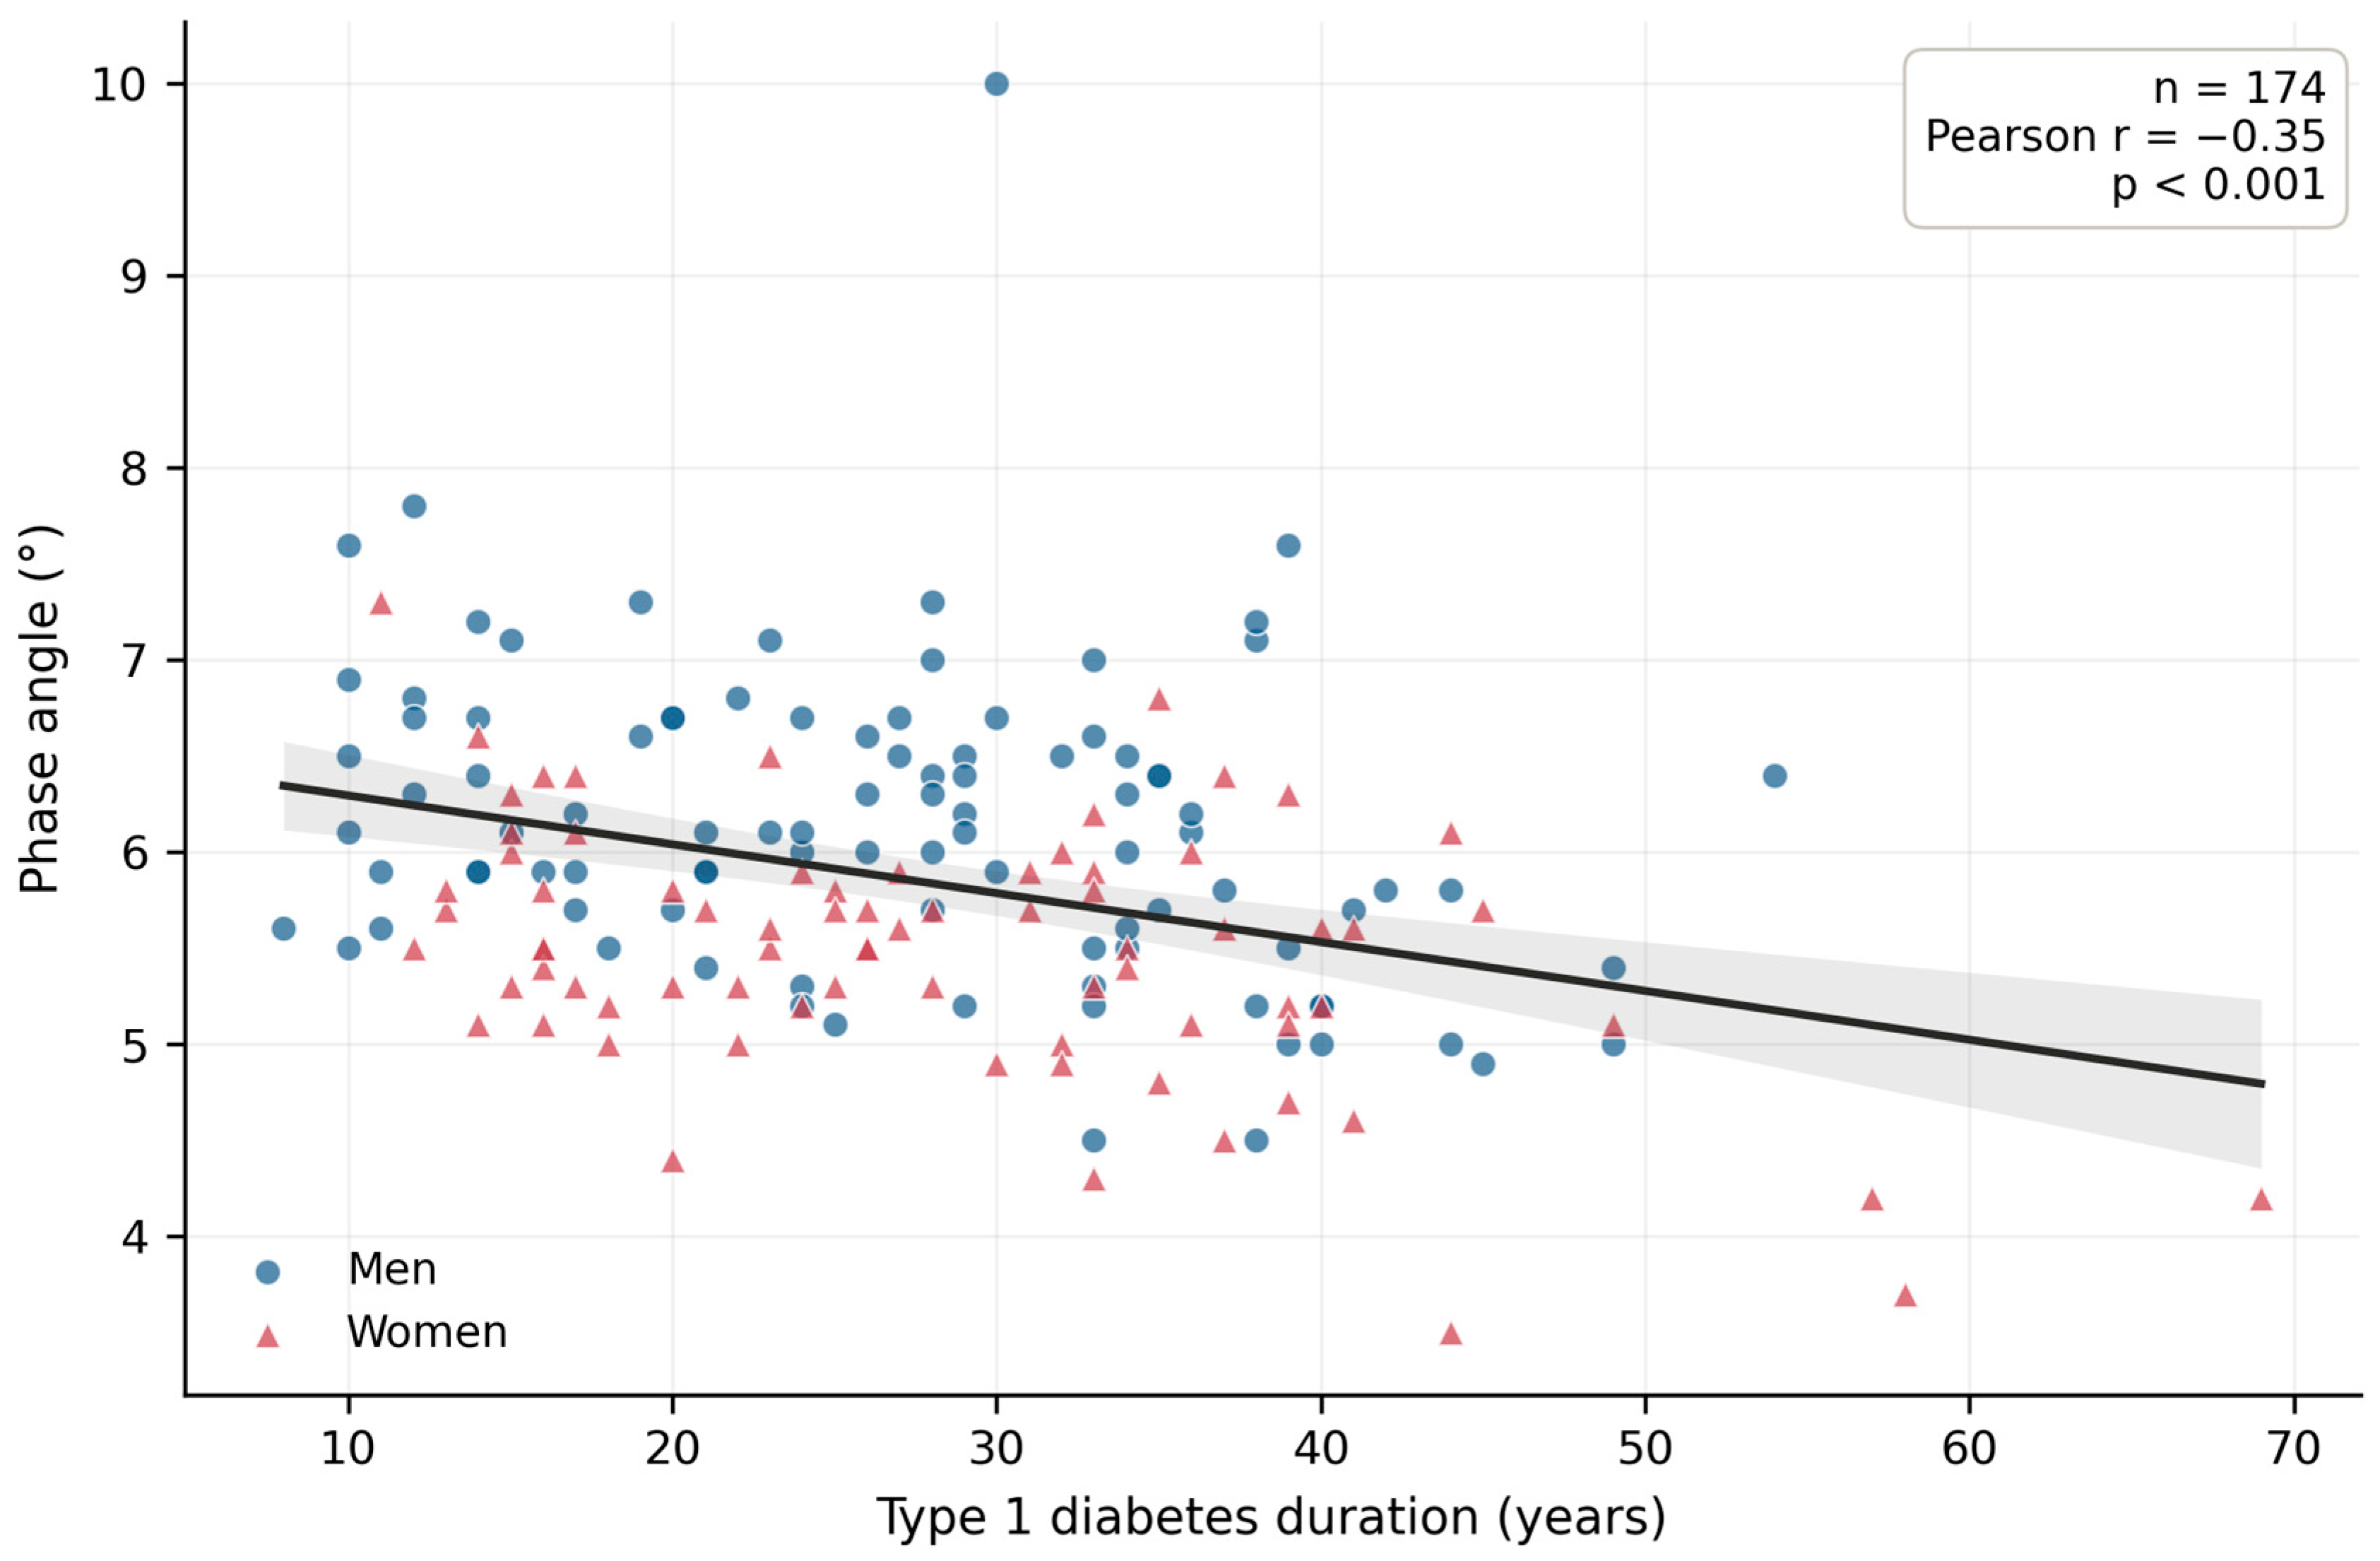
Phase angle was lower in participants with low muscle mass by either equation after adjustment for age and sex (Sergi: β = −0.674, 95% CI −1.050 to −0.298, p < 0.001, and q = 0.002; Janssen: β = −0.384, 95% CI −0.640 to −0.128, p = 0.004, and q = 0.008). It was not significantly lower in participants meeting the handgrip-based criterion (β = −0.361, 95% CI −0.788 to +0.067, and p = 0.097), although handgrip strength analyzed as a continuous variable was associated with phase angle (β = +0.021, 95% CI +0.006 to +0.036, and p = 0.005), as were 30 s chair stand repetitions (β = +0.043, 95% CI +0.015 to +0.071, and p = 0.003). Phase angle also declined with increasing disease duration (Figure 2).
Figure 2.
Unadjusted relationship between phase angle (PA) and type 1 diabetes (T1D) duration. Each point represents one participant, color-coded by sex; blue circles denote men and red triangles women. The solid line is the ordinary least squares fit and the shaded band its 95% confidence interval. The plotted correlation is unadjusted (Pearson r = −0.35; p < 0.001; n = 174) and is shown for descriptive purposes only; the inference reported in Section 3.4 derives from the age- and sex-adjusted multivariable model fitted to the same 174 participants.
3.4. Multivariable Models of Cellular Integrity
To examine whether the association between disease duration and phase angle persisted after adjustment for chronological age, multivariable ordinary least squares models were fitted, each adjusted for age and sex. Longer T1D duration was associated with a lower phase angle (β = −0.018 per year; 95% CI −0.028 to −0.009; p < 0.001; q = 0.002; and n = 174). Chronological age and disease duration were only weakly correlated (Pearson r = 0.255; p < 0.001; and n = 182) and variance inflation factors were 1.09 for duration, 1.08 for age and 1.00 for sex, indicating no relevant multicollinearity. The estimate was unchanged after additional adjustment for BMI and for recruiting site. The planned models are summarized in Table 4; all 30 models fitted, including those that did not reach significance, are reported in Supplementary Table S2.
Table 4.
Planned multivariable OLS regression models of cellular integrity (age- and sex-adjusted).
Phase angle, calculated as arctan (Xc/R), and both muscle mass equations are derived from the same raw impedance measurements: all three incorporate whole-body resistance, and the Sergi equation additionally incorporates reactance. Three analyses were therefore performed to examine structural dependence. First, when appendicular mass was recomputed without the reactance term, the reactance-free appendicular index remained positively associated with phase angle (β = +0.172° per kg/m2; 95% CI +0.062 to +0.283; and p = 0.002), but this procedure leaves the shared resistance term intact. Second, models were additionally adjusted for resistance. Resistance was strongly correlated with both muscle mass indices (r = −0.87 with the appendicular index and r = −0.93 with the Janssen-derived index) but only moderately with phase angle (r = −0.36). Under this adjustment the association with the Sergi-defined criterion attenuated but persisted (β = −0.523; 95% CI −0.960 to −0.086; and p = 0.019), whereas the association with the Janssen-defined criterion did not (β = −0.233; 95% CI −0.588 to +0.123; and p = 0.198). This is a conservative test, since resistance is itself a component of phase angle, so conditioning on it isolates variation attributable to reactance alone. Third, the two measures that share no impedance term with phase angle were essentially unaffected by adjustment for resistance: handgrip strength (β = +0.020; 95% CI +0.005 to +0.034; and p = 0.009) and 30 s chair stand repetitions (β = +0.039; 95% CI +0.011 to +0.067; and p = 0.006). Structural dependence therefore contributes materially to the associations between phase angle and the equation-derived indices and cannot be excluded as a partial explanation; the evidence that phase angle relates to muscle status rests principally on the measures that are independent of bioimpedance (Supplementary Table S6).
3.5. Glycemic Exposure, Muscle Mass and Muscle Function
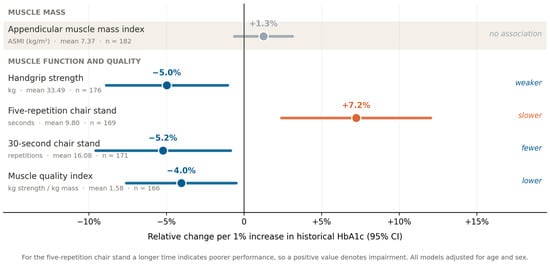
Historical HbA1c was not associated with the appendicular skeletal muscle mass index (β = +0.092; 95% CI −0.046 to +0.231; p = 0.190; and n = 182), nor with absolute appendicular mass after adjustment for height (β = +0.167; p = 0.415) or for height and weight (β = −0.163; p = 0.256). By contrast, historical HbA1c was associated with the following four functional outcomes: lower handgrip strength (β = −1.67 kg per 1%; 95% CI −2.98 to −0.35; p = 0.013; q = 0.024; and n = 176), a longer five-repetition chair stand time (β = +0.71 s per 1%; 95% CI +0.24 to +1.18; p = 0.004; and n = 169), fewer 30 s chair stand repetitions (β = −0.84 per 1%; 95% CI −1.54 to −0.14; p = 0.019; q = 0.029; and n = 171) and a lower muscle quality index (β = −0.064 per 1%; 95% CI −0.120 to −0.008; p = 0.025; and n = 166). HbA1c measured at the study visit was not associated with handgrip strength (β = −0.55; p = 0.252). Long-term time in range showed associations in the corresponding direction (handgrip strength: β = +0.080 kg per 1%; p = 0.045; five-repetition chair stand: β = −0.030 s per 1%; and p = 0.040). These results are summarized in Table 5.
Table 5.
Historical HbA1c and muscle outcomes: multivariable models adjusted for age and sex.
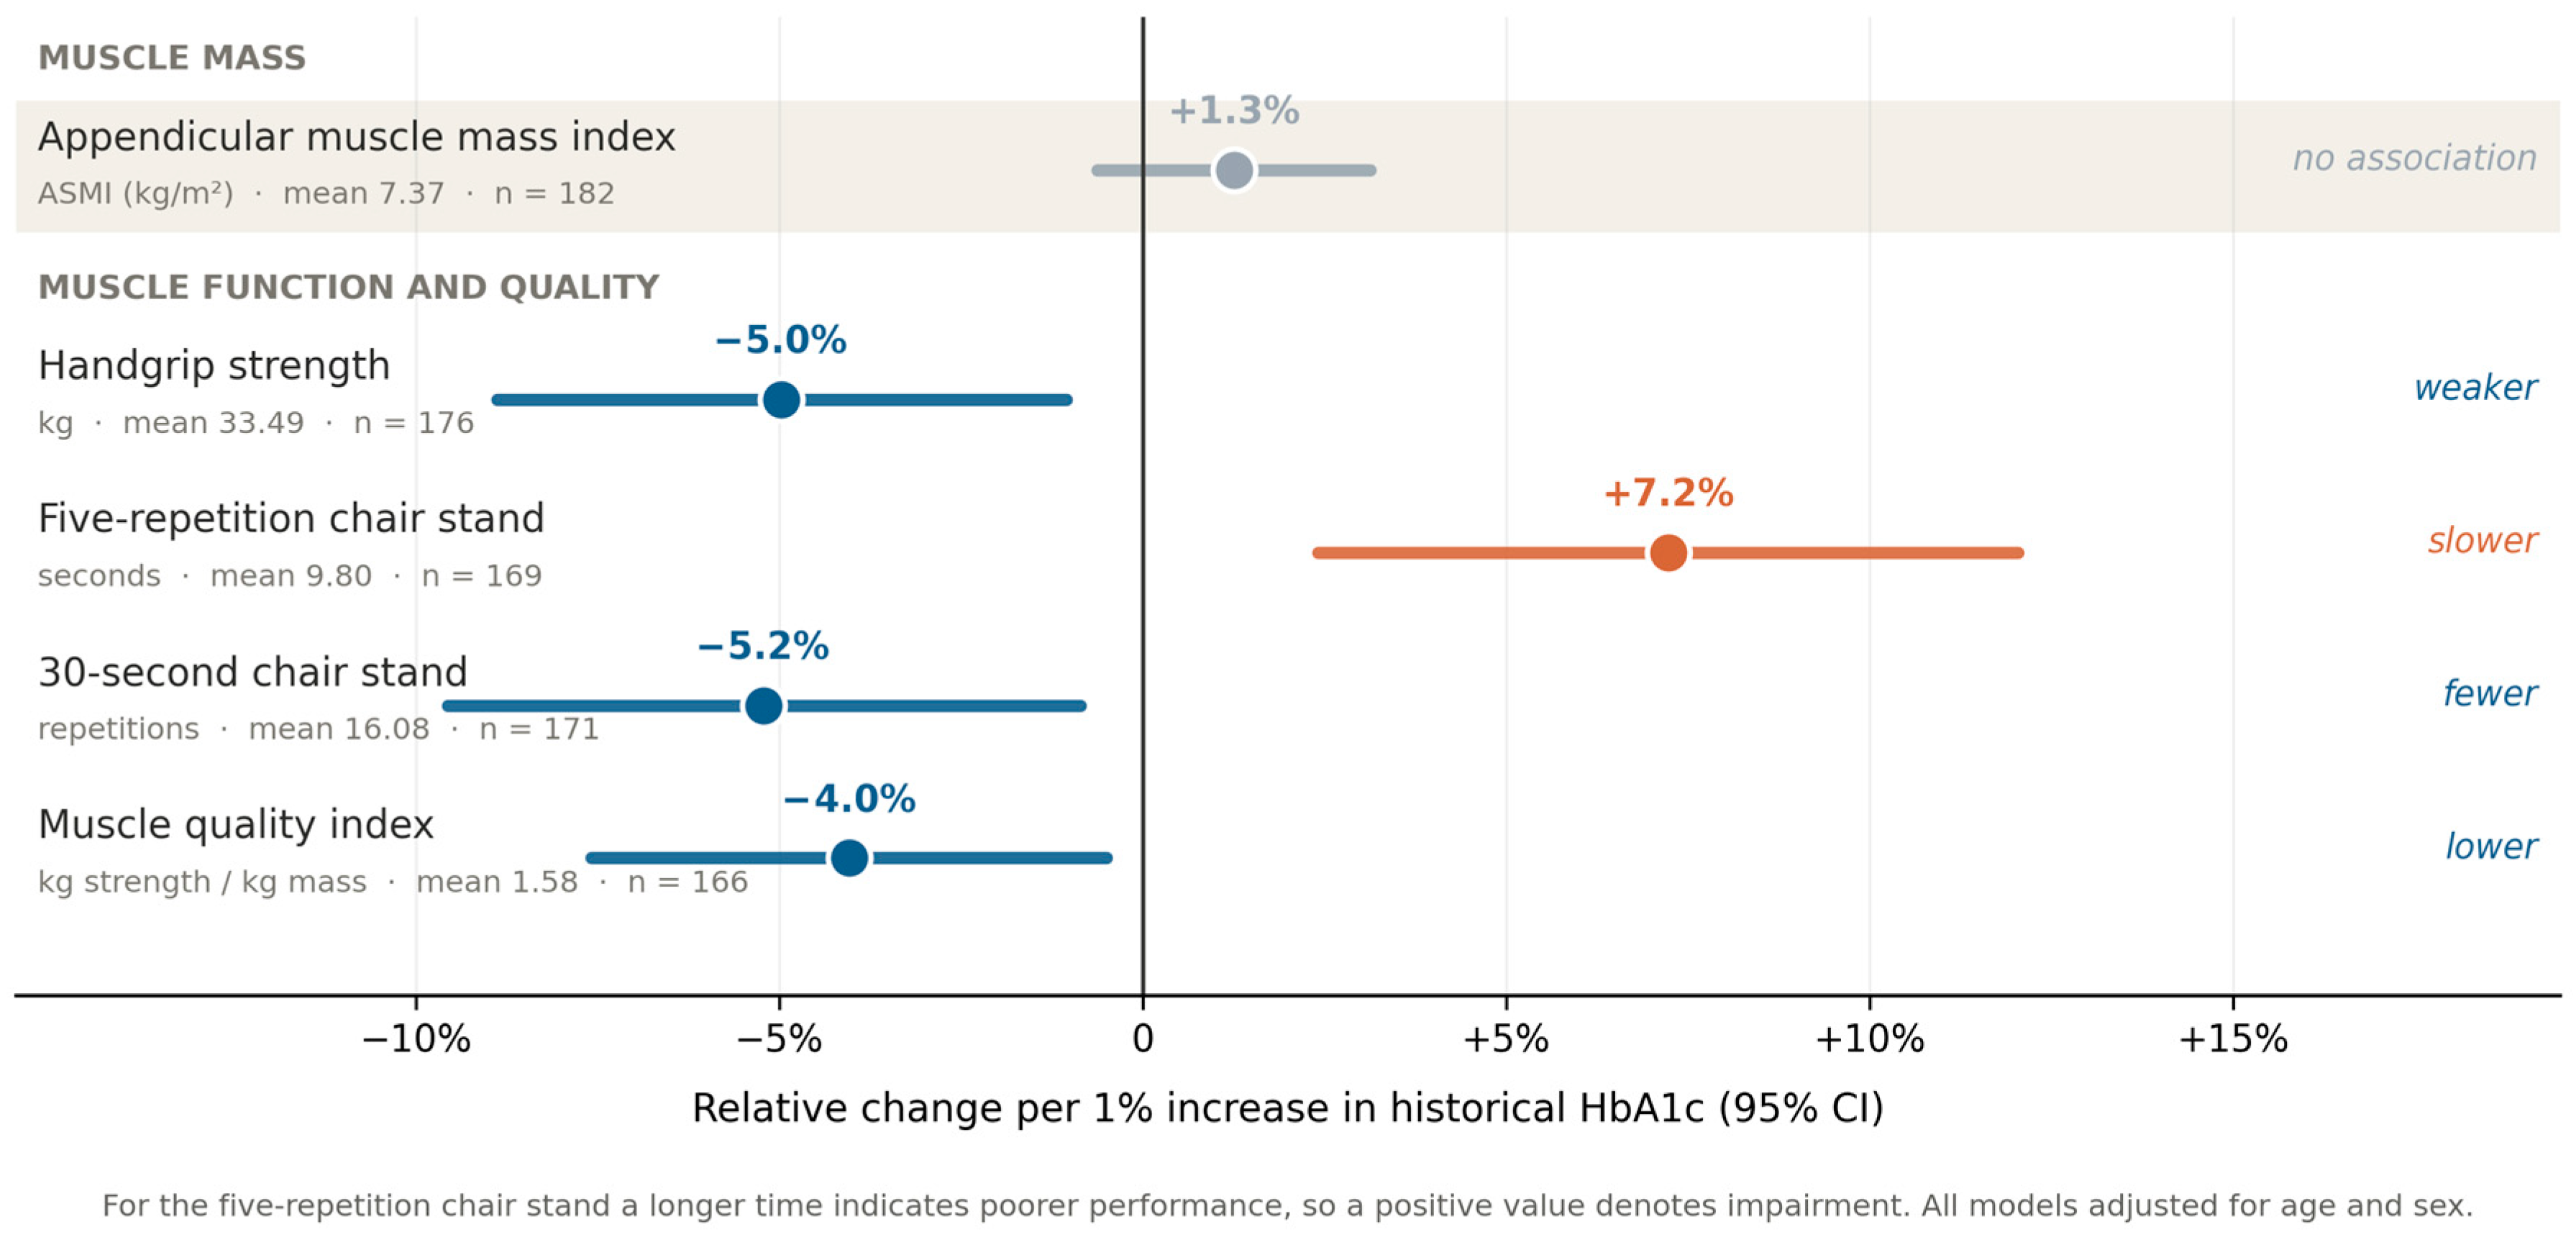
In an exploratory analysis, phase angle was lower in participants with diabetic retinopathy after adjustment for age and sex (β = −0.269; 95% CI −0.491 to −0.048; and p = 0.018). Figure 3 summarizes the associations between historical HbA1c and muscle outcomes, expressed as relative change with respect to the cohort mean of each measure.
Figure 3.
Relative change in muscle mass, strength, physical performance and muscle quality per 1% increase in historical HbA1c. Each estimate is expressed as the percentage change relative to the cohort mean of that outcome, so that measures reported in different units can be displayed on a common axis. Circles show the point estimate and horizontal lines the 95% confidence interval; the vertical line marks no change. Estimates are derived from multivariable ordinary least squares models adjusted for age and sex, and the mean value and sample size of each outcome are printed beneath its label. For the five-repetition chair stand a longer time indicates poorer performance, so a positive value denotes impairment. Cumulative glycemic exposure was associated with muscle function and quality but not with height-normalized muscle mass.
4. Discussion
4.1. Principal Findings
In this cross-sectional cohort of adults with long-standing T1D, longer disease duration was associated with a lower phase angle independently of chronological age. Cumulative glycemic exposure was associated with lower muscle function and quality but not with height-normalized muscle mass. The estimated prevalence of low muscle mass varied more than threefold according to the equation applied, whereas confirmed sarcopenia under the complete EWGSOP2 algorithm was rare and severe sarcopenia was absent. These findings are associative and do not establish temporality.
The association between disease duration and phase angle is consistent with work in Korean adults with diabetes showing that duration mediates a substantial part of the observed cellular decline independently of aging trajectories [20], and with reports of reduced phase angle in children and adolescents with newly diagnosed T1D [21] and in adults with T1D [22]. It supports the conceptual shift away from treating sarcopenia as a purely geriatric phenomenon [1,3].
4.2. Glycemic Exposure and Muscle Function
Our data do not support an association between cumulative glycemic exposure and muscle quantity once mass is normalized for body size. They do support associations with handgrip strength and chair stand performance, which were consistent across both chair stand protocols and survived correction for multiple testing, together with an exploratory association with muscle quality. This pattern is compatible with the current conceptual framework, in which strength and quality rather than volume define muscle health [2,3], and with reports that loss of muscle strength in diabetes relates to disease burden and complications rather than to muscle mass alone [23]. While muscle catabolism in type 2 diabetes is classically attributed to peripheral insulin resistance and low-grade inflammation [6,24], T1D is characterized by absolute insulin deficiency and lifelong glycemic excursions [9]; our data suggest that the downstream functional phenotype may converge despite this pathophysiological divergence [25]. Phase angle has been reported to correlate inversely with glycemic indices across diabetes types and BIA frequencies [26,27,28] and to relate to microvascular complications [29], which is consistent with our exploratory finding for retinopathy.
4.3. Diagnostic Classification and EWGSOP2 Staging
The contrast between an estimated 28.4% prevalence of low muscle mass by one equation and 1.2% confirmed sarcopenia under the full algorithm is, in our view, the most clinically relevant observation of this study. It suggests that prevalence figures reported in the diabetes literature on the basis of bioimpedance-derived mass alone may substantially exceed the burden of sarcopenia as currently defined [2,3,9], and that in this outpatient population the clinically actionable signal is subclinical, residing in cellular quality and muscle strength rather than in established sarcopenia [22].
4.4. Choice of Bioimpedance Equations
Both equations were developed against reference methods but capture different signals: the Janssen model is driven primarily by whole-body resistance and therefore by total conductive tissue volume [13], whereas the Sergi equation incorporates reactance and is anchored to appendicular compartments [12]. Independent validation studies comparing several BIA equations against dual-energy X-ray absorptiometry have similarly found that resistance-dominant whole-body models tend to yield higher prevalence estimates in populations with heterogeneous fat distribution, while appendicular models are more conservative [30]. We do not interpret our data as demonstrating the superiority of either equation. Neither index was associated with handgrip strength, agreement of both with the functional criterion was poor, and the participants identified by one equation were a subset of those identified by the other. What our data do show is that the choice of equation changes the estimated prevalence more than threefold and that the estimate obtained in men by the resistance-driven equation is difficult to reconcile with the strength distribution observed in the same men. This point is reinforced by the comparison between recruiting sites: equation-derived prevalence differed markedly between the two centers, whereas measured handgrip strength did not (34.0 ± 11.4 versus 33.1 ± 11.8 kg; p = 0.62), a pattern consistent with sensitivity of the equations to differences in raw impedance rather than with a genuine difference in muscle function (Supplementary Table S10). We therefore suggest that BIA-derived muscle-mass equations should not be used in isolation and that assessment be anchored in measured muscle strength [3,15,25].
4.5. Clinical Implications
This analysis is not intended to discredit BMI as a clinical tool. BMI remains inexpensive, universally available and useful as an initial screening step. Our data reaffirm, in a T1D-specific context, what has been documented in general adult populations: that height-normalized lean and fat indices resolve part of the ambiguity that BMI leaves unaddressed [16,17]. In practical terms, our findings suggest that a handgrip dynamometer and a chair are more informative in the diabetes clinic than any single bioimpedance equation, and that phase angle, which requires no prediction equation, may add information on cellular status.
4.6. Limitations and Strengths
Several limitations should be acknowledged. First, no DXA or MRI reference measurement was available, so all compartment values are estimates from predictive equations rather than measured quantities. Second, phase angle and both muscle mass equations derive from the same raw impedance measurements and share whole-body resistance, and the Sergi equation additionally shares reactance, so the associations between phase angle and the equation-derived indices are partly structural; adjustment for resistance attenuated the association with the Sergi-defined criterion and abolished the association with the Janssen-defined criterion, although this adjustment is conservative because resistance is a component of phase angle. The associations between phase angle and the bioimpedance-independent measures of muscle function were unaffected. Third, residual confounding is likely, since physical activity, dietary intake, corticosteroid exposure, thyroid and renal comorbidity and socioeconomic status were unavailable. Fourth, multiple comparisons were made; false discovery rate correction was applied and exploratory analyses are labeled as such, but chance findings cannot be excluded. Fifth, complete-case analysis was used and sample sizes ranged from 159 to 183, so selection bias is possible if missingness relates to frailty. Sixth, the cross-sectional design cannot establish temporality. Seventh, bioimpedance was performed without standardized fasting, hydration or exercise conditions; because resistance and reactance respond to acute fluid shifts, this introduces measurement error that we expect to be largely non-differential and therefore to attenuate rather than create the associations reported, although differential error cannot be excluded. Eighth, raw impedance parameters differed between sites despite the use of the same analyzer model, so pooled prevalence estimates should be interpreted with caution. Ninth, two dynamometer models were used, HbA1c was measured in each site’s own laboratory without prospective harmonization, and CGM observation windows were not uniform. Finally, the equations and thresholds applied were validated in Caucasian and non-diabetic populations, which limits their transportability.
The study also has strengths. These include its size relative to the existing T1D literature, in which samples have typically ranged from 16 to 177 participants [9]; the consecutive sampling strategy applied at both sites; the availability of long-term glycemic exposure data; and the application of the complete EWGSOP2 algorithm rather than muscle mass alone.
5. Conclusions
In this cross-sectional cohort of adults with long-standing type 1 diabetes, longer disease duration was associated with a lower phase angle independently of chronological age, and cumulative glycemic exposure was associated with lower handgrip strength, poorer chair stand performance and lower muscle quality, but not with height-normalized appendicular muscle mass.
The estimated prevalence of low muscle mass varied more than threefold according to the bioimpedance equation applied, whereas confirmed sarcopenia under the complete EWGSOP2 algorithm was rare (1.2%) and severe sarcopenia was absent. These findings indicate that BIA-derived muscle-mass equations should not be used in isolation to estimate the burden of sarcopenia in type 1 diabetes and support anchoring morphofunctional assessment in measured muscle strength, complemented by phase angle as an indicator of cellular status that requires no prediction equation. Given the cross-sectional design, the mathematical coupling between impedance-derived indices and phase angle, and the absence of reference-method validation, these associations require confirmation in longitudinal studies.
Supplementary Materials
The following supporting information can be downloaded at https://www.mdpi.com/article/10.3390/endocrines7040068/s1: Table S1: Diagnostic criteria, equations and cut-off values applied; Table S2a: All multivariable models fitted, irrespective of statistical significance; Table S2b: Benjamini–Hochberg correction across the nine planned models; Table S3: Exploratory analyses of long-term glycemic metrics and microvascular complications; Table S4: Handgrip strength in relation to Janssen-defined low muscle mass; Table S5: Sensitivity analyses; Table S6: Assessment of structural dependence between impedance-derived indices and phase angle; Table S7: Variance inflation factors for the multivariable models; Table S8: Distribution of glycemic exposure data; Table S9: Contingency table underlying Figure 1; Table S10: Comparison between the two recruiting sites; Figure S1: Prevalence of each diagnostic criterion by sex; Figure S2: Expanded forest plot of the planned models, including those that did not reach statistical significance; Figure S3: Sensitivity analysis by continuous glucose monitoring sensor wear time.
Author Contributions
Conceptualization, J.J.O.T. and M.M.A.O.; methodology, J.J.O.T., M.S.C., J.O.B. and M.M.A.O.; formal analysis, J.J.O.T. and C.M.P.M.; investigation, J.J.O.T., M.S.C., P.L.M., C.L.C., T.E.M. and L.S.O.; data curation, J.J.O.T., M.S.C., P.L.M., C.L.C., T.E.M. and L.S.O.; resources, J.J.O.T., M.S.C., P.L.M., C.L.C., T.E.M. and L.S.O.; writing, original draft preparation, J.J.O.T. and C.M.P.M.; writing, review and editing, J.J.O.T., C.M.P.M., J.O.B. and M.M.A.O.; supervision, J.J.O.T., J.O.B. and M.M.A.O.; project administration, J.J.O.T. and P.L.M. All authors have read and agreed to the published version of the manuscript.
Funding
This research received no external funding.
Institutional Review Board Statement
The study was conducted in accordance with the Declaration of Helsinki. Participants recruited at Hospital Reina Sofía de Tudela were included under a protocol approved by the Clinical Research Ethics Committee of Navarre (CEIm-NA; study code HRS-DM1-2026, protocol version 2.0, July 2026). Participants recruited at Hospital Clínico Universitario Lozano Blesa were included under a protocol approved by the Clinical Research Ethics Committee of Aragón (CEICA; protocol code PI24/087, version 2, March 2024), which authorizes retrieval of clinical data from the electronic health record.
Informed Consent Statement
Written informed consent was obtained from all subjects involved in the study at both participating sites.
Data Availability Statement
The data supporting the findings of this study are not publicly available because they contain clinical information and their public disclosure may compromise participant privacy. Anonymized data may be made available by the corresponding author upon reasonable request, subject to approval by the relevant institutional authorities and ethics committee and in accordance with applicable data protection regulations.
Acknowledgments
During the preparation of this manuscript, the authors used Perplexity Pro (Perplexity AI, Inc., San Francisco, CA, USA; accessed July 2026), for the purposes of English translation, grammatical correction, stylistic refinement and improvement of sentence clarity and readability. The authors have reviewed and edited the output and take full responsibility for the content of this publication.
Conflicts of Interest
The authors declare no conflicts of interest.
References
- Kirk, B.; Cawthon, P.M.; Arai, H.; Ávila-Funes, J.A.; Barazzoni, R.; Bhasin, S.; Binder, E.F.; Bruyere, O.; Cederholm, T.; Chen, L.-K.; et al. The Conceptual Definition of Sarcopenia: Delphi Consensus from the Global Leadership Initiative in Sarcopenia (GLIS). Age Ageing 2024, 53, afae052. [Google Scholar] [CrossRef] [Scilit] [PubMed]
- Cruz-Jentoft, A.J.; Gonzalez, M.C.; Prado, C.M. Sarcopenia ≠ low muscle mass. Eur. Geriatr. Med. 2023, 14, 225–228. [Google Scholar] [CrossRef] [Scilit] [PubMed]
- Cruz-Jentoft, A.J.; Bahat, G.; Bauer, J.; Boirie, Y.; Bruyère, O.; Cederholm, T.; Cooper, C.; Landi, F.; Rolland, Y.; Sayer, A.A.; et al. Sarcopenia: Revised European consensus on definition and diagnosis. Age Ageing 2019, 48, 16–31. [Google Scholar] [CrossRef] [Scilit] [PubMed]
- Romagnoli, C.; Pampaloni, B.; Brandi, M.L. Muscle endocrinology and its relation with nutrition. Aging Clin. Exp. Res. 2019, 31, 783–792. [Google Scholar] [CrossRef] [Scilit] [PubMed]
- Ortez Toro, J.J. Diabetes and Sarcopenia: Unraveling the Metabolic Crossroads of Muscle Loss and Glycemic Dysregulation. Endocrines 2025, 6, 47. [Google Scholar] [CrossRef] [Scilit]
- Salom Vendrell, C.; García Tercero, E.; Moro Hernández, J.B.; Cedeno-Veloz, B.A. Sarcopenia as a Little-Recognized Comorbidity of Type II Diabetes Mellitus: A Review of the Diagnosis and Treatment. Nutrients 2023, 15, 4149. [Google Scholar] [CrossRef] [Scilit] [PubMed]
- Ceriello, A.; Monnier, L.; Owens, D. Glycemic variability in diabetes: Clinical and therapeutic implications. Lancet Diabetes Endocrinol. 2019, 7, 221–230. [Google Scholar] [CrossRef] [Scilit] [PubMed]
- Andreo-López, M.C.; Zarco-Martín, M.T.; Contreras-Bolívar, V.; Fernández-Soto, M.L. Prevalence of Sarcopenia and Dynapenia and Related Clinical Outcomes in Patients with Type 1 Diabetes Mellitus. Nutrients 2023, 15, 4914. [Google Scholar] [CrossRef] [Scilit] [PubMed]
- Milluzzo, A.; Quaranta, G.; Manuella, L.; Sceusa, G.; Bosco, G.; Di Giacomo Barbagallo, F.; Di Marco, M.; Lombardo, A.M.; Oteri, V.; Sciacca, L.; et al. Sarcopenia in type 1 diabetes mellitus: A systematic review. Diabetes Res. Clin. Pract. 2025, 227, 112399. [Google Scholar] [CrossRef] [Scilit] [PubMed]
- Sbrignadello, S.; Göbl, C.; Tura, A. Bioelectrical Impedance Analysis for the Assessment of Body Composition in Sarcopenia and Type 2 Diabetes. Nutrients 2022, 14, 1864. [Google Scholar] [CrossRef] [Scilit] [PubMed]
- Norman, K.; Stobäus, N.; Zocher, D.; Bosy-Westphal, A.; Szramek, A.; Scheufele, R.; Smoliner, C.; Pirlich, M. Cutoff percentiles of bioelectrical phase angle predict functionality, quality of life, and mortality in patients with cancer. Am. J. Clin. Nutr. 2010, 92, 612–619. [Google Scholar] [CrossRef] [Scilit] [PubMed]
- Sergi, G.; De Rui, M.; Veronese, N.; Bolzetta, F.; Berton, L.; Carraro, S.; Bano, G.; Coin, A.; Manzato, E.; Perissinotto, E. Assessing appendicular skeletal muscle mass with bioelectrical impedance analysis in free-living Caucasian older adults. Clin. Nutr. 2015, 34, 667–673. [Google Scholar] [CrossRef] [Scilit] [PubMed]
- Janssen, I.; Heymsfield, S.B.; Baumgartner, R.N.; Ross, R. Estimation of skeletal muscle mass by bioelectrical impedance analysis. J. Appl. Physiol. 2000, 89, 465–471. [Google Scholar] [CrossRef] [Scilit] [PubMed]
- Janssen, I.; Baumgartner, R.N.; Ross, R.; Rosenberg, I.H.; Roubenoff, R. Skeletal muscle cutpoints associated with elevated physical disability risk in older men and women. Am. J. Epidemiol. 2004, 159, 413–421. [Google Scholar] [CrossRef] [Scilit] [PubMed]
- Prado, C.M.; Landi, F.; Chew, S.T.H.; Atherton, P.J.; Molinger, J.; Ruck, T.; Gonzalez, M.C. Advances in muscle health and nutrition: A toolkit for healthcare professionals. Clin. Nutr. 2022, 41, 2244–2263. [Google Scholar] [CrossRef] [Scilit] [PubMed]
- Kyle, U.G.; Schutz, Y.; Dupertuis, Y.M.; Pichard, C. Body composition interpretation: Contributions of the fat-free mass index and the body fat mass index. Nutrition 2003, 19, 597–604. [Google Scholar] [CrossRef] [Scilit] [PubMed]
- Kyle, U.G.; Piccoli, A.; Pichard, C. Body composition measurements: Interpretation finally made easy for clinical use. Curr. Opin. Clin. Nutr. Metab. Care 2003, 6, 387–393. [Google Scholar] [CrossRef] [Scilit] [PubMed]
- Kelly, T.L.; Wilson, K.E.; Heymsfield, S.B. Dual energy X-ray absorptiometry body composition reference values from NHANES. PLoS ONE 2009, 4, e7038. [Google Scholar] [CrossRef] [Scilit] [PubMed]
- Pineda Zuluaga, M.C.; González Correa, C.H.; Martínez Durán, A.G. Cut-off points to determine muscle mass reduction by electrical bioimpedance analysis for the diagnosis of sarcopenia in older adults: A systematic review. Nutr. Clínica Dietética Hosp. 2023, 43, 98–104. [Google Scholar] [CrossRef] [Scilit]
- Jun, M.H.; Ku, B.; Kim, J.; Kim, K.H.; Kim, J.U. Mediation effect of the duration of diabetes mellitus on the decrease in bioimpedance phase angles in ethnically Korean people: A multicenter clinical study. J. Diabetes Investig. 2021, 12, 790–802. [Google Scholar] [CrossRef] [Scilit] [PubMed]
- Więch, P.; Bazaliński, D.; Sałacińska, I.; Binkowska-Bury, M.; Korczowski, B.; Mazur, A.; Kózka, M.; Dąbrowski, M. Decreased bioelectrical impedance phase angle in hospitalized children and adolescents with newly diagnosed type 1 diabetes: A case-control study. J. Clin. Med. 2018, 7, 516. [Google Scholar] [CrossRef] [Scilit] [PubMed]
- Zhang, L.; Zhu, J.; Gu, R.; Cui, T.; Xi, X.; Yang, L.; Yu, G.; Wang, J.-G.; Yang, F. Analysis of body composition characteristics in patients with type 1 diabetes mellitus: A case-control study based on a bioelectrical impedance analyzer. Front. Med. 2026, 13, 1776074. [Google Scholar] [CrossRef] [Scilit] [PubMed]
- Nomura, T.; Kawae, T.; Kataoka, H.; Ikeda, Y. Aging, physical activity, and diabetic complications related to loss of muscle strength in patients with type 2 diabetes. Phys. Ther. Res. 2018, 21, 33–38. [Google Scholar] [CrossRef] [Scilit] [PubMed]
- Lopez-Pedrosa, J.M.; Camprubi-Robles, M.; Guzman-Rolo, G.; Lopez-Gonzalez, A.; Garcia-Almeida, J.M.; Sanz-Paris, A.; Rueda, R. The Vicious Cycle of Type 2 Diabetes Mellitus and Skeletal Muscle Atrophy: Clinical, Biochemical, and Nutritional Bases. Nutrients 2024, 16, 172. [Google Scholar] [CrossRef] [Scilit] [PubMed]
- de Luis Román, D.; Carretero Gómez, J.; García-Almeida, J.M.; Garrachón Vallo, F.; Guzmán Rolo, G.; López Gómez, J.J.; Tarazona-Santabalbina, F.J.; Sanz-Paris, A. Diabetic Sarcopenia. A proposed muscle screening protocol in people with diabetes. Rev. Endocr. Metab. Disord. 2024, 25, 651–661. [Google Scholar] [CrossRef] [Scilit] [PubMed]
- Owari, G.; Kono, K.; Nonaka, T.; Watabe, Y.; Nishida, Y.; Takemoto, M.; Kakuda, W. Phase angle as an independent predictor of sarcopenia and glycemic control in older adults with type 2 diabetes: A cross-sectional observational study. J. Diabetes Metab. Disord. 2025, 24, 82. [Google Scholar] [CrossRef] [Scilit] [PubMed]
- Dittmar, M.; Reber, H.; Kahaly, G.J. Bioimpedance phase angle indicates catabolism in Type 2 diabetes. Diabet. Med. 2015, 32, 1177–1185. [Google Scholar] [CrossRef] [Scilit] [PubMed]
- Muramae, N.; Matsuda, T.; Inagaki, S.; Takahashi, H.; Abe, K.; Nakatani, S.; Takahashi, M.; Kato, K.; Sakaguchi, K.; Ogawa, W. Determinants of phase angle in Japanese patients with diabetes. Diabetol. Int. 2023, 14, 339–343. [Google Scholar] [CrossRef] [Scilit] [PubMed]
- Ito, H.; Miura, S.; Mori, T.; Miura, S.; I, C.; Matsumoto, S.; Inoue, H.; Antoku, S.; Yamasaki, T.; Togane, M.; et al. Phase angle evaluated by a bioimpedance analysis is closely related to diabetic nephropathy and peripheral neuropathy in patients with type 2 diabetes. JMA J. 2025, 8, 925–935. [Google Scholar] [CrossRef] [Scilit] [PubMed]
- Yu, S.C.Y.; Powell, A.; Khow, K.S.F.; Visvanathan, R. The performance of five bioelectrical impedance analysis prediction equations against dual X-ray absorptiometry in estimating appendicular skeletal muscle mass in an adult Australian population. Nutrients 2016, 8, 189. [Google Scholar] [CrossRef] [Scilit] [PubMed]

Disclaimer/Publisher’s Note: The statements, opinions and data contained in all publications are solely those of the individual author(s) and contributor(s) and not of MDPI and/or the editor(s). MDPI and/or the editor(s) disclaim responsibility for any injury to people or property resulting from any ideas, methods, instructions or products referred to in the content. |
© 2026 by the authors. Licensee MDPI, Basel, Switzerland. This article is an open access article distributed under the terms and conditions of the Creative Commons Attribution (CC BY) license.