


Abstract
Pressure pulsation and mass flow-rate fluctuation of the refrigerant are major flow-side excitation sources of noise and vibration in automotive HVAC systems, which make flow stability inside the compressor an important design concern. In this paper, flow characteristics of working fluids are analyzed based on the numerical model of a mass-produced automotive HVAC compressor’s expansion chamber. A parametrically configurable muffling structure is introduced, and its geometric parameters are varied one at a time, with the remaining parameters held at fixed values, to evaluate their influence on the flow field. Among the single muffler models examined, the best-performing one yields a reduction of 34.32% on pressure pulsation, and 53.31% on mass flow-rate fluctuation, compared to the original model. Subsequently, a new design of a double muffling structure is proposed to further improve the flow stability. A total of 25 distinct models are compared, and the best-performing models under two criteria, minimum pressure pulsation and minimum mass flow-rate fluctuation, are different. The structure that yields minimum pressure pulsation value achieves a reduction of 49.73% on pressure pulsation and 61.58% on mass flow-rate fluctuation, compared to the original model, while the one that yields minimum mass flow-rate achieves a reduction of 46.22% on pressure pulsation, and 61.63% on mass flow-rate fluctuation. This discrepancy could possibly be attributed to simulation uncertainties since the mass flow-rate fluctuation values derived from two models are extremely close. This research demonstrates that an effective measure to improve the stability of flow fields is to increase the spacing of pipelines on both sides of the muffling segment, thus extending the time and distance of fluid movement and facilitating the sufficient and uniform flow of fluids inside the chamber. However, this could cause a decrease in the mean mass flow and this is a potential cost of the design. The effect on compressor work and COP would require a system-level model and is left for future work. While this study evaluates flow-side excitations only, acoustic quantities are not computed, and acoustic validation is left for future work.
1. Introduction
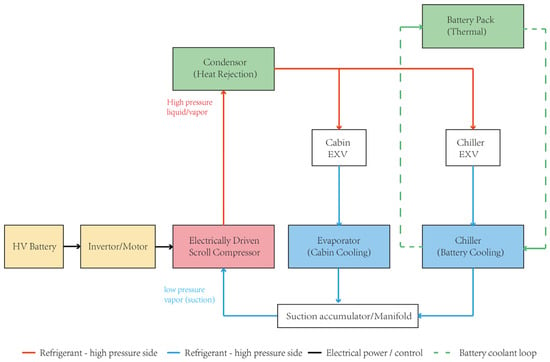
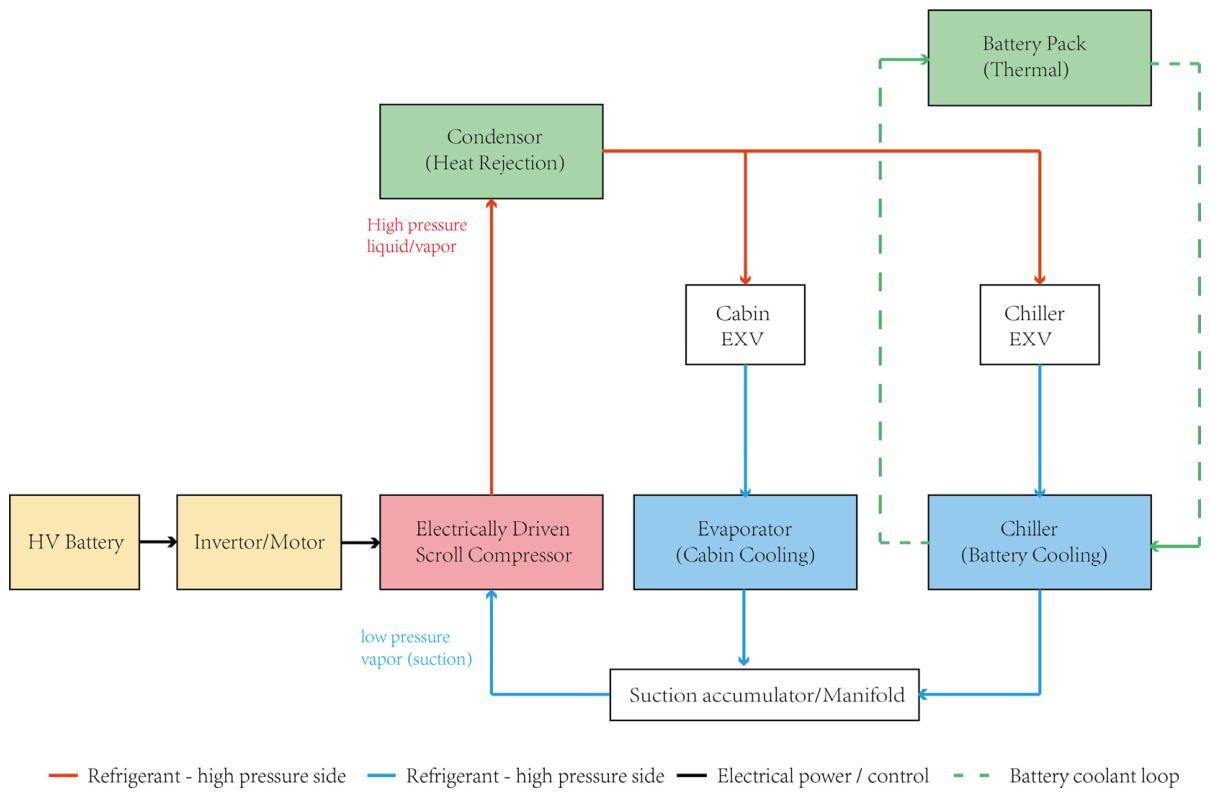
Noise, Vibration, and Harshness (NVH) represent an important indicator of vehicle durability, comfortability, and manufacturing quality. Industry reporters claim that a large amount of R&D expenditure of major automotive manufacturers is spent on NVH issues. Optimizing the NVH performance from vehicle to sub-system and component to improve vehicle quality and upgrade brand value has been a significant research topic for automotive original equipment manufacturers (OEMs) and component suppliers. In recent years, production and sales of new energy vehicles (NEVs) have achieved explosive growth thanks to the implementation of national energy conservation, emission reduction, and dual-carbon policies. NEVs refer to automobiles powered by non-conventional energy sources. Instead of gasoline or diesel, they use electricity, hydrogen, or other clean energy sources. The main categories of NEVs include the following: battery electric vehicles (BEVs), driven solely by electric motors using electrical energy stored in batteries; plug-in hybrid electric vehicles (PHEVs), combining a battery system with an internal combustion engine, and driving with batteries for short distances and gasoline for long distances; and fuel cell electric vehicles (FCEVs), using electrical energy generated by electrochemical reactions between hydrogen and oxygen. In contrast to traditional internal combustion engine (ICE) vehicles, the vibration and noise of the engines and gearboxes contribute less to the overall NVH performance of NEVs, especially BEVs. The noise coming from the heating, ventilation, and air-conditioning (HVAC) system becomes one of the dominant interior noises in the cabin, which needs to be considered at an early stage of BEVs development. During the working cycles of the HVAC system, the air compressor compresses the refrigerant coming out of the evaporator and raises its temperature and pressure, and then delivers it into the condenser (see Figure 1). In this process, considerable vibration and noise can generate as the compressor blades rotate at high speeds, the refrigerant flows rapidly, and the refrigerant molecules collide into the compressor inner walls.
Figure 1.
Schematic diagram of the working cycle for a typical automotive (BEV) HVAC system.
Numerous research findings have been published by scholars about the vibration and noise reductions of automotive components, including HVAC systems. An effective measure to enhance the NVH performances is to use mufflers. By modifying the end-cap structure of an automotive HVAC scroll compressor using expansion muffler and insertion-tube principles, the cavity is split into parallel chambers, resulting in a weakened airflow pulsation and a reduced sound pressure level [1]. Acoustic and thermodynamic performances of two mufflers and a resonator are compared for different operating points, showing that these structures can dampen the pressure pulsations in the refrigeration cycle across a wide frequency range, without influencing the thermodynamic efficiency [2]. A noise reduction design method is proposed that employs a Helmholtz resonator and a three-chamber perforated muffler at the exhaust end, which effectively mitigates airflow pulsation at the exhaust port, stabilizing the flow and reducing low-frequency noise at the exhaust end. With this method, the exhaust port noise of the twin-screw compressor is reduced from 100–114 dB to 37–68 dB [3].
To reduce the aerodynamic noise from the air conditioning system, the cavity modal of a muffler is studied to reveal the transmission loss under cavity mode resonance, using the finite element method. A dual-cavity expansion structure of an impedance composite muffler is proposed, with sound-absorbing materials placed in the cavity to enhance acoustic performance [4]. To address the issue of low frequency noise control in automobile air-conditioning duct mufflers, a new type of Helmholtz perforated and tortuous-characteristic duct muffler for the unit cell of acoustic metamaterials is proposed. Meanwhile, acoustic theoretical modeling, finite element simulation, and parametric optimization methods are adopted to systematically analyze the influence of the muffler’s key structural parameters on the sound transmission loss, providing theoretical support and design basis for solving the problem of low-frequency noise control in ventilation ducts, improving low-frequency broadband sound absorption performance, and promoting the engineering application of high-efficiency noise reduction devices [5]. A model-experimental approach is employed to investigate the performance of four different sizes of expansion silencers in controlling the pulsating noise in the suction part of the compressor. Research results show a relatively good agreement between modeling and experimental outcomes, indicating that increasing the diameter results in increased transmission loss, while increasing the silencer length leads to an increase in the number of transmission loss peaks without altering the transmission loss [6].
Besides HVAC systems, mufflers are also commonly employed in other automotive component systems like engine exhausts. A parallel perforated tube expansion muffler is proposed and a numerical analysis of its acoustic and aerodynamic performance is conducted using the finite element method. A multi-objective optimization study is carried out using the competitive multi-objective particle swarm optimization (CMOPSO) method. Calculation results reveal that the exhaust noise is reduced and the fuel economy of the engine is improved, thus enhancing the overall performance of the muffler [7]. A novel, organized design process of the muffler for the KTM390 engine is presented, by selecting appropriate parameters including comparing the resulting transmission loss curves and quantitative evaluation of objective functions (for transmission loss) and backpressure. This organized design process leads to an increase in the efficiency of designing mufflers [8].
It has been proven that there is a strong correlation between pressure pulsation and acoustic performances in numerous studies of compressors. The enhancement of acoustic performance in compressors is investigated through the optimization of muffler designs within the gas flow path. The results of this study provide insights into the interplay between pressure pulsation dynamics and noise emissions, contributing to compressor acoustics-efficient muffler designs. Optimized designs not only lead to a significant decrease in noise but also reinforce the established correlation between pressure pulsations and corresponding acoustic emissions, highlighting advanced modeling and optimization [9]. A thorough investigation into the suction system of a reciprocating compressor reveals that excessive pressure pulsations in the suction bottle and strong mechanical coupling between the cylinders and suction bottle due to high cylinder gas forces are the root causes of vibration-induced failure of the suction system. A solution is proposed to split the suction bottle into two parts and make one bottle as an acoustic filter (Helmholtz resonator). The modified suction system achieves a 14.3–61.1% reduction in vibration and a 75.56% reduction in peak-to-peak pressure pulsation for the compressor operating at 1000 rpm [10].
As the computing power of modern computers increases significantly, numerical results obtained from simulation software are highly consistent with experimental data. Compared with experimental methods, numerical simulations reduce time and economic consumptions, and play an important role in assisting experimental validation at the early stage of product design. A commonly used methodology, computational fluid dynamics (CFD), has been proven to be effective in numerous studies to predict flow characteristics and optimize flow fields in various engineering scenarios.
A combination of experimental and numerical simulations (using the dynamic mesh method) is employed to study the scroll compressor in electric vehicles, exploring the effects of rotational speed and pressure ratio on compressor performance. The results reveal a significantly uneven temperature distribution across the chambers, primarily due to tangential leakage, which results in elevated temperatures in the central areas of the chambers and reduced temperatures near the meshing points. These findings provide valuable insights into the performance characteristics of scroll compressors and offer theoretical support for optimizing compressor efficiency in practical applications [11]. A computational fluid dynamics simulation technology is utilized to investigate methods for improving the uniformity of pressure within the symmetrical working chambers of a scroll compressor. Three conclusions are drawn with the aid of numerical simulation, providing a significant reference value for improving the performance of scroll compressors and extending the driving range of electric vehicles [12]. A mathematical model of the thermodynamic process and dynamic analysis is established for an electric scroll compressor, and then validated by experiment. Four working conditions under different pressure ratios and rotational speeds are selected to perform the simulation. The impacts of the working conditions and asymmetrical features on pressure and temperature changes within the scroll chambers and changes in the forces and moments acting on the orbiting scroll plate are compared and analyzed [13]. A new theoretical model of the compressor’s operating cycle is developed, enabling precise simulations of performance under different conditions. The study demonstrates that increasing the number of spiral turns enhances heat generation but reduces the coefficient of performance (COP), while vapor injection technology improves heating performance by 2.4% to 4.9% compared to non-injection designs. The theoretical model is rigorously validated through experimental testing, confirming its accuracy and providing practical insights for compressor design [14].
A research transonic centrifugal compressor is experimentally tested and analyzed using numerical simulations. Three different numerical approaches are used to conduct the numerical investigation, including steady and unsteady Reynolds-Averaged Navier–Stokes calculations with the code elsA, while high-fidelity simulations (LES) are performed with AVBP. A brief description of the experimental methods and numerical approaches is given, and the predictivity of the performance at high rotation speed is investigated for the three numerical approaches [15]. The characteristics of the compression process in the intermediate discharge valve (IDV) compressor are analyzed and the effects of IDV port location and port size on compressor efficiency are discussed based on the validated high fidelity scroll compressor model. It is found that the IDVs could be able to adjust the gas bypass process in different compression ratio conditions and maintain high efficiency over a wider compression ratio range than that of the non-IDV compressor [16].
In a review of mesh adaptation technology applied to computational fluid dynamics, mesh adaptation techniques are found to have significant impact on computational fluid dynamics by improving solution accuracy and reducing computational costs. The two most prominent families of error estimation are analyzed: feature-based techniques, which target regions of high physical gradients and goal-oriented adjoint methods, which aim to reduce the error in a specific integral quantity of interest. After years of limited progress, recent work has demonstrated promising results, including certifiable solutions and applications to increasingly complex cases such as transonic compressor blades and film-cooled turbines. Despite these advances, several critical challenges remain: efficient parallelization, robust geometry integration, application to unsteady flows, and deployment in high-order discretization frameworks [17].
Pressure pulsation fields are normally considered as the acoustic excitation source terms in computational aeroacoustics (CAA) calculations, and are decomposed into convective components and acoustic components before being used as a noise source. With acoustic analogy methodology, the momentum equations are recast into an inhomogeneous wave equation with monopole/dipole/quadrupole source terms, and propagating noises are predicted via a coupled acoustic–structure interaction (ASI) analysis or a finite element/boundary element (FEM/BEM) acoustic model. The flow-induced noise of a hermetic reciprocating compressor (HRC) is numerically analyzed using fluid–structure interaction (FSI) analysis, acoustic excitation source modeling, and acoustic–structure interaction (ASI). Acoustic modeling, which calculates acoustic excitation source strength from pressure pulsation of the refrigerant caused by the behavior of the piston and valve, is presented for predicting flow-induced noise. The numerical noise analysis results show good agreement with experimental results, especially with high accuracy in the frequency band of cavity resonance [18]. The influence of the changes in pressure, flow rate, and gas-phase volume fraction on the acoustic radiation produced by the refrigerant in the process of the phase change of the electronic expansion valve is analyzed by constructing the refrigerant cavitation model and acoustic radiation model. Through CFD numerical simulation, the characteristics of the flow field distribution under different working conditions are explored, and the correlation between thermodynamic parameters and acoustic parameters is revealed. A vapor-doped super-cavitation optimization strategy is proposed, and the key structural parameters are optimized by the response surface methodology, leading to a reduction in the peak sound pressure level by 9.95 dB, and the effective sound pressure RMS level by 0.79 dB [19]. Large Eddy Simulation (LES) near the near-field region and the Ffowcs Williams–Hawkings (FW-H) methods are performed to analyze the flow characteristics around the fan and predict the aerodynamic noise emitted from the fan under a constant rotational speed of 2100 rpm. The simulation results for the velocity distributions and aerodynamic noise are compared with the experimental data and show good agreement [20].
A review of existing literature shows that most existing studies optimize discharge ports or valve geometry or acoustic transmission loss, but few systematically optimize expansion chamber parameters based on the criteria of combined pressure pulsation and mass flow-rate fluctuation reductions. This work uses the numerical model of a mass-produced automotive air-conditioning compressor and analyzes the pressure pulsation, flow-rate fluctuation, and flow field characteristics of the working fluids inside the expansion chamber. By adding a muffler at the end of the expansion chamber, the flow field distribution is changed and the pressure pulsation combined with the mass flow-rate fluctuation, which act as source terms of flow-induced noise and vibrations, are suppressed. Methods to improve the muffler design are further discussed to enhance the quality of the flow field in the expansion chamber. While this study evaluates flow-side excitations only, acoustic quantities are not computed, and acoustic validation is left for future work.
2. Research Methods
2.1. Theoretical Background
The CFD method solves the evolution characteristics of fluids based on two conservation equations: the mass conservation equation and the momentum conservation equation.
In Equations (1) and (2), ρ denotes for the density of the fluid, t denotes for time, u denotes for the three-dimensional velocity of the fluid, p denotes for pressure of the fluid, τ denotes for viscous stress tensor, f denotes for body force vector per unit mass, and ∇ is an operator which stands for the following:
In three dimensions, i, j, and k, respectively, stand for the unit vector in the x, y, and z directions.
For a compressible Newtonian fluid,, and τ is represented by the following:
Substituting this into Equation (2) yields the famous Navier–Stokes (N-S) equation:
μ stands for dynamic viscosity; I is the identity tensor, and g is the gravitational body force and is omitted for internal gas-dynamics flow. The Navier–Stokes (N-S) equation establishes the base of fluid dynamics, and serves as the core for most CFD solvers. Besides the N-S equation, the energy equation and the turbulence equation, critical in solving fluid dynamics problems, are, respectively, as follows:
Equation (6) represents the energy equation. Equations (7) and (8) represent the transport equation of kinetic energy and dissipation rate, respectively, for the standard k-epsilon turbulence model.
To further study the influence of flow fields on flow-induced noise and vibrations, Lighthill proposed a theory of acoustic analogy in his study, explaining the correlation between turbulence and aerodynamic acoustic sources [21]. This finding laid the foundation of modern aerodynamic acoustics, and is widely applied in modern engineering.
In Equation (9), ρ0 denotes the average density of the fluid, c0 denotes the speed of sound in the quiescent far-field medium, xi and xj are spatial coordinate components, and Tij denotes the Lighthill stress tensor, or the equivalent acoustic source of flow-induced noises.
Equation (10) stands for the expression of the Lighthill stress tensor. ρuiuj denotes the Reynolds inertial stress term, denotes compressible nonlinear entropy source term, and τij denotes viscous stress tensor. For low-speed and incompressible flows, the entropy source term and viscous source term can be neglected, and the Reynolds inertial stress term constitutes the crucial factor of the acoustic source of flow-induced noises.
This framework clarifies why the pressure pulsation is an appropriate and physically meaningful target even in a purely flow-field-focused study such as the present one. Because the pulsation amplitude at the muffler outlet directly determines the strength of the downstream acoustic excitation source, a CFD-based reduction in pressure pulsation, even without an explicit downstream acoustic radiation simulation, can be reasonably expected to translate into reduced radiated noise. This coupling mechanism has been reported across diverse compressor architectures, including hermetic refrigeration compressors [9], industrial reciprocating suction systems [10], and, directly relevant to the present application, automotive electric scroll compressors operating in electrified vehicle refrigeration cycles [2,22,23]. This pulsation-driven excitation pathway is further corroborated by discharge valve flutter studies [23] and structural noise optimization work [1] on automotive scroll compressors, both of which identify discharge-chamber pulsation suppression as an effective noise mitigation strategy, directly supporting the premise that CFD-predicted pulsation reduction in the present study is a meaningful proxy for expected noise reduction. However, a dedicated acoustic radiation analysis of the present compressor geometry is beyond the scope of this flow-field-focused study. Such validation is identified as a direction for future work.
2.2. Numerical Model and Mesh Generation
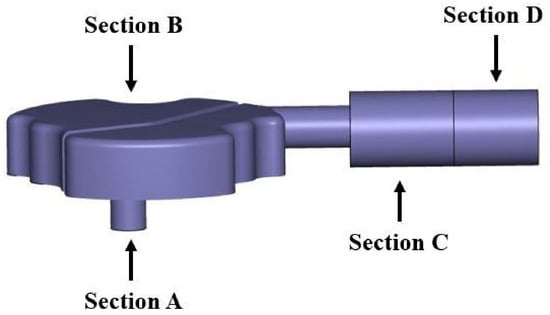
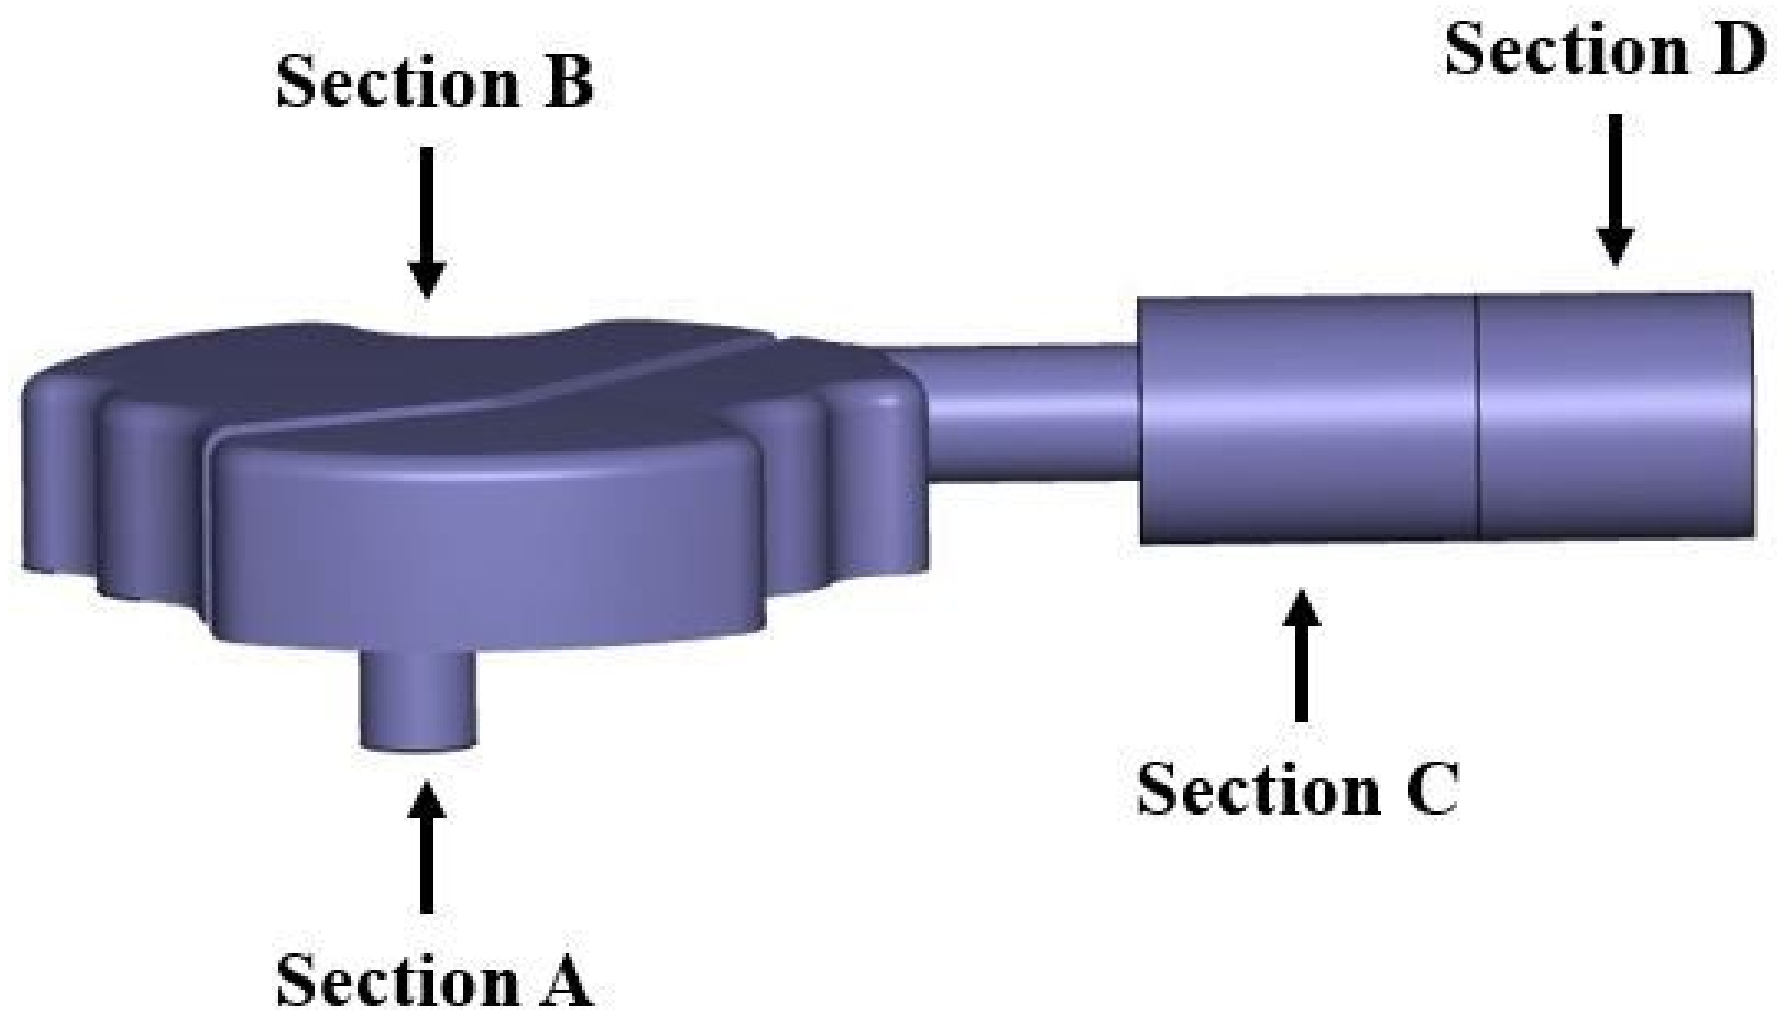
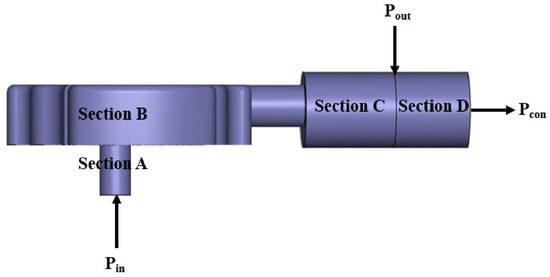
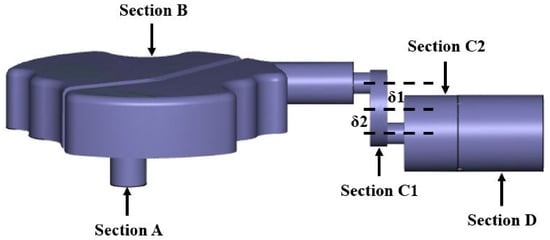
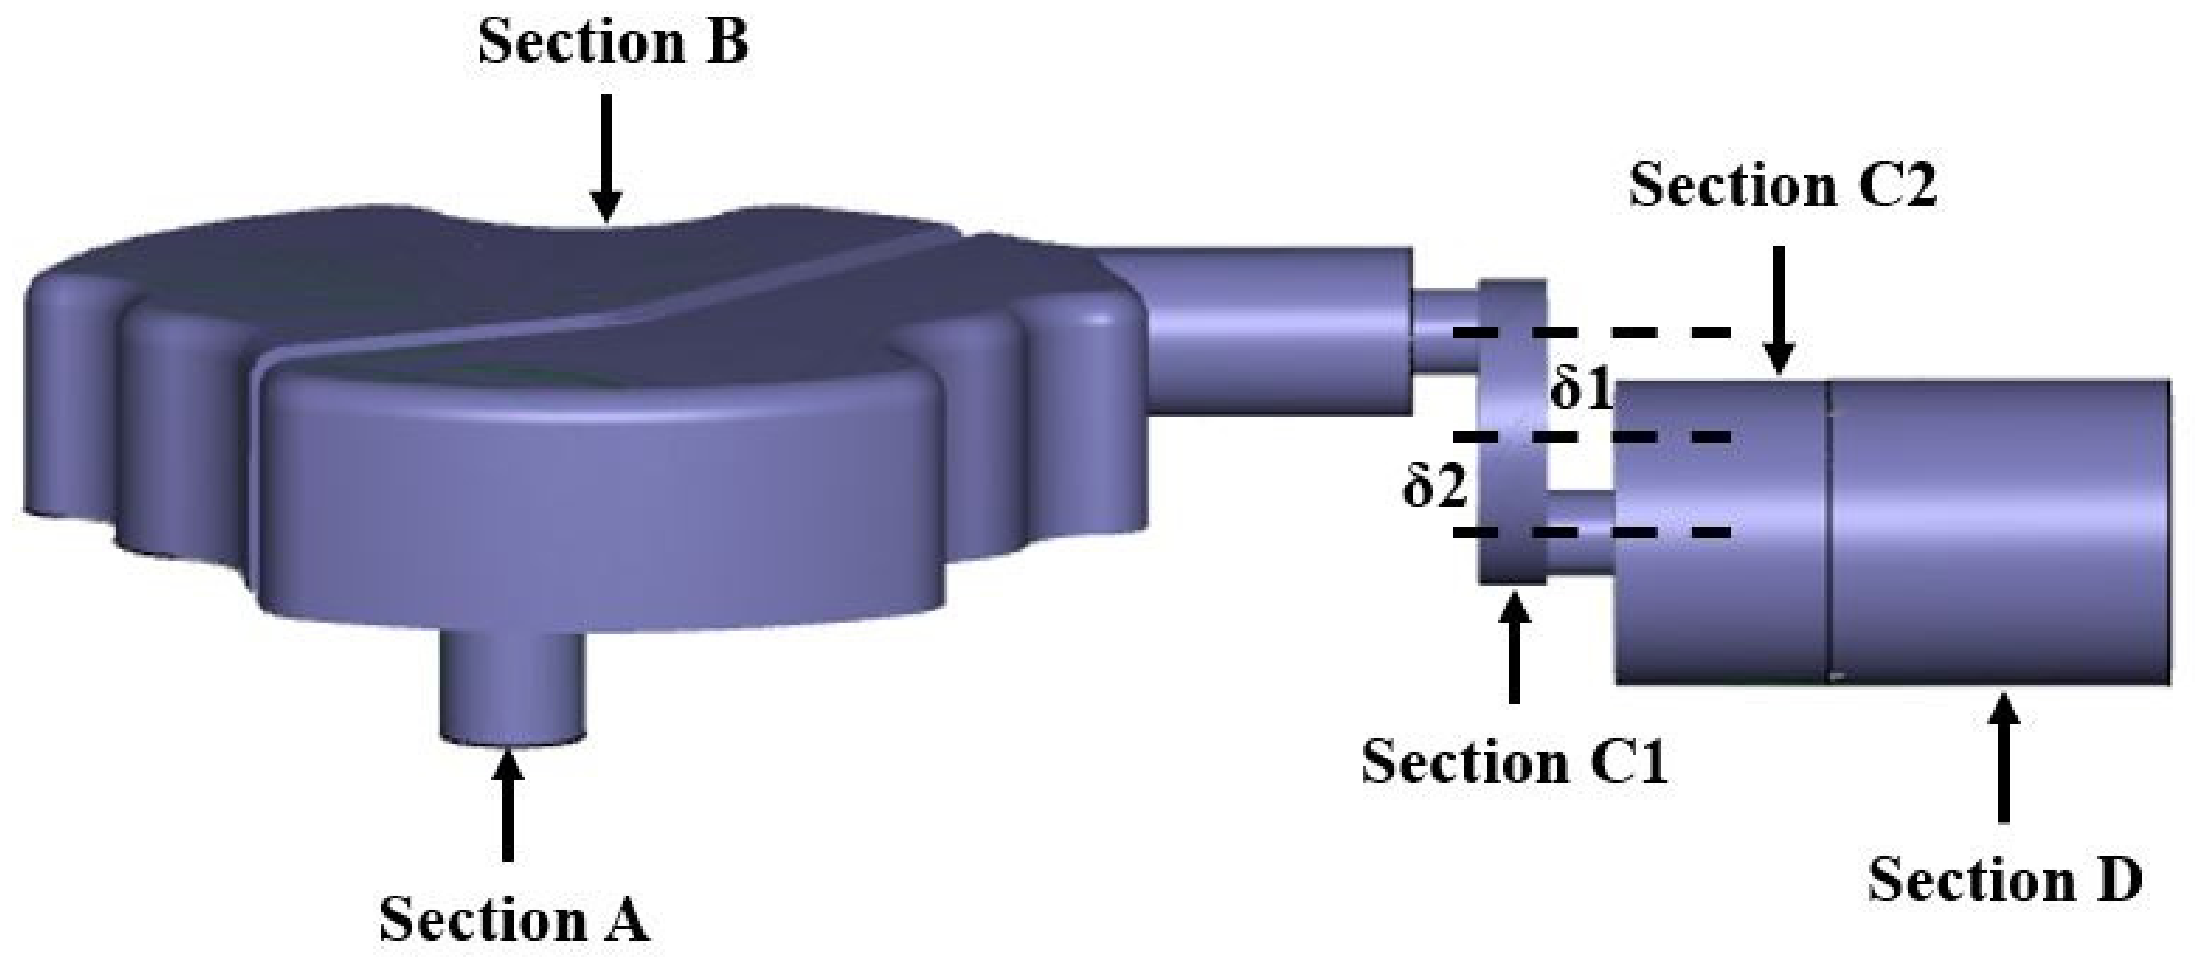
In general, the fluids inside the air conditioning compressor are compressed by fast rotating blades and turn into a gas flow with high temperature and high pressure. It then passes through an expansion chamber, flows thoroughly and mixes uniformly. The numerical model of the expansion chamber of a real compressor is illustrated in Figure 2. Section A represents the inlet segment, where turbulent fluids flow in. Section B is the expansion segment, where fluids pass through and flow into section C, known as the discharge segment. The fluids flow through section C and finally enter the external environment. Section D is a hypothetical extension segment, which is used to define the boundary conditions of numerical simulations. Main dimensions of the chamber are illustrated in Table 1.
Figure 2.
Numerical model of the expansion chamber of a mass-produced HVAC compressor.
Table 1.
Main dimensions of the expansion chamber model.
The key part of numerical simulations is the definition of model meshes. High-resolution meshes result in calculations in better accuracy, but at the same time increase computational complexity and extend calculation time. It is also critical to set different mesh resolutions within different segments of the model. The initial setup of mesh resolutions of this expansion chamber model is illustrated in Table 2.
Table 2.
Setup of mesh resolutions of the HVAC expansion chamber model.
After the initial mesh setup, the mesh independence needs to be analyzed, which will be further explained in subsequent chapters.
2.3. Boundary Conditions
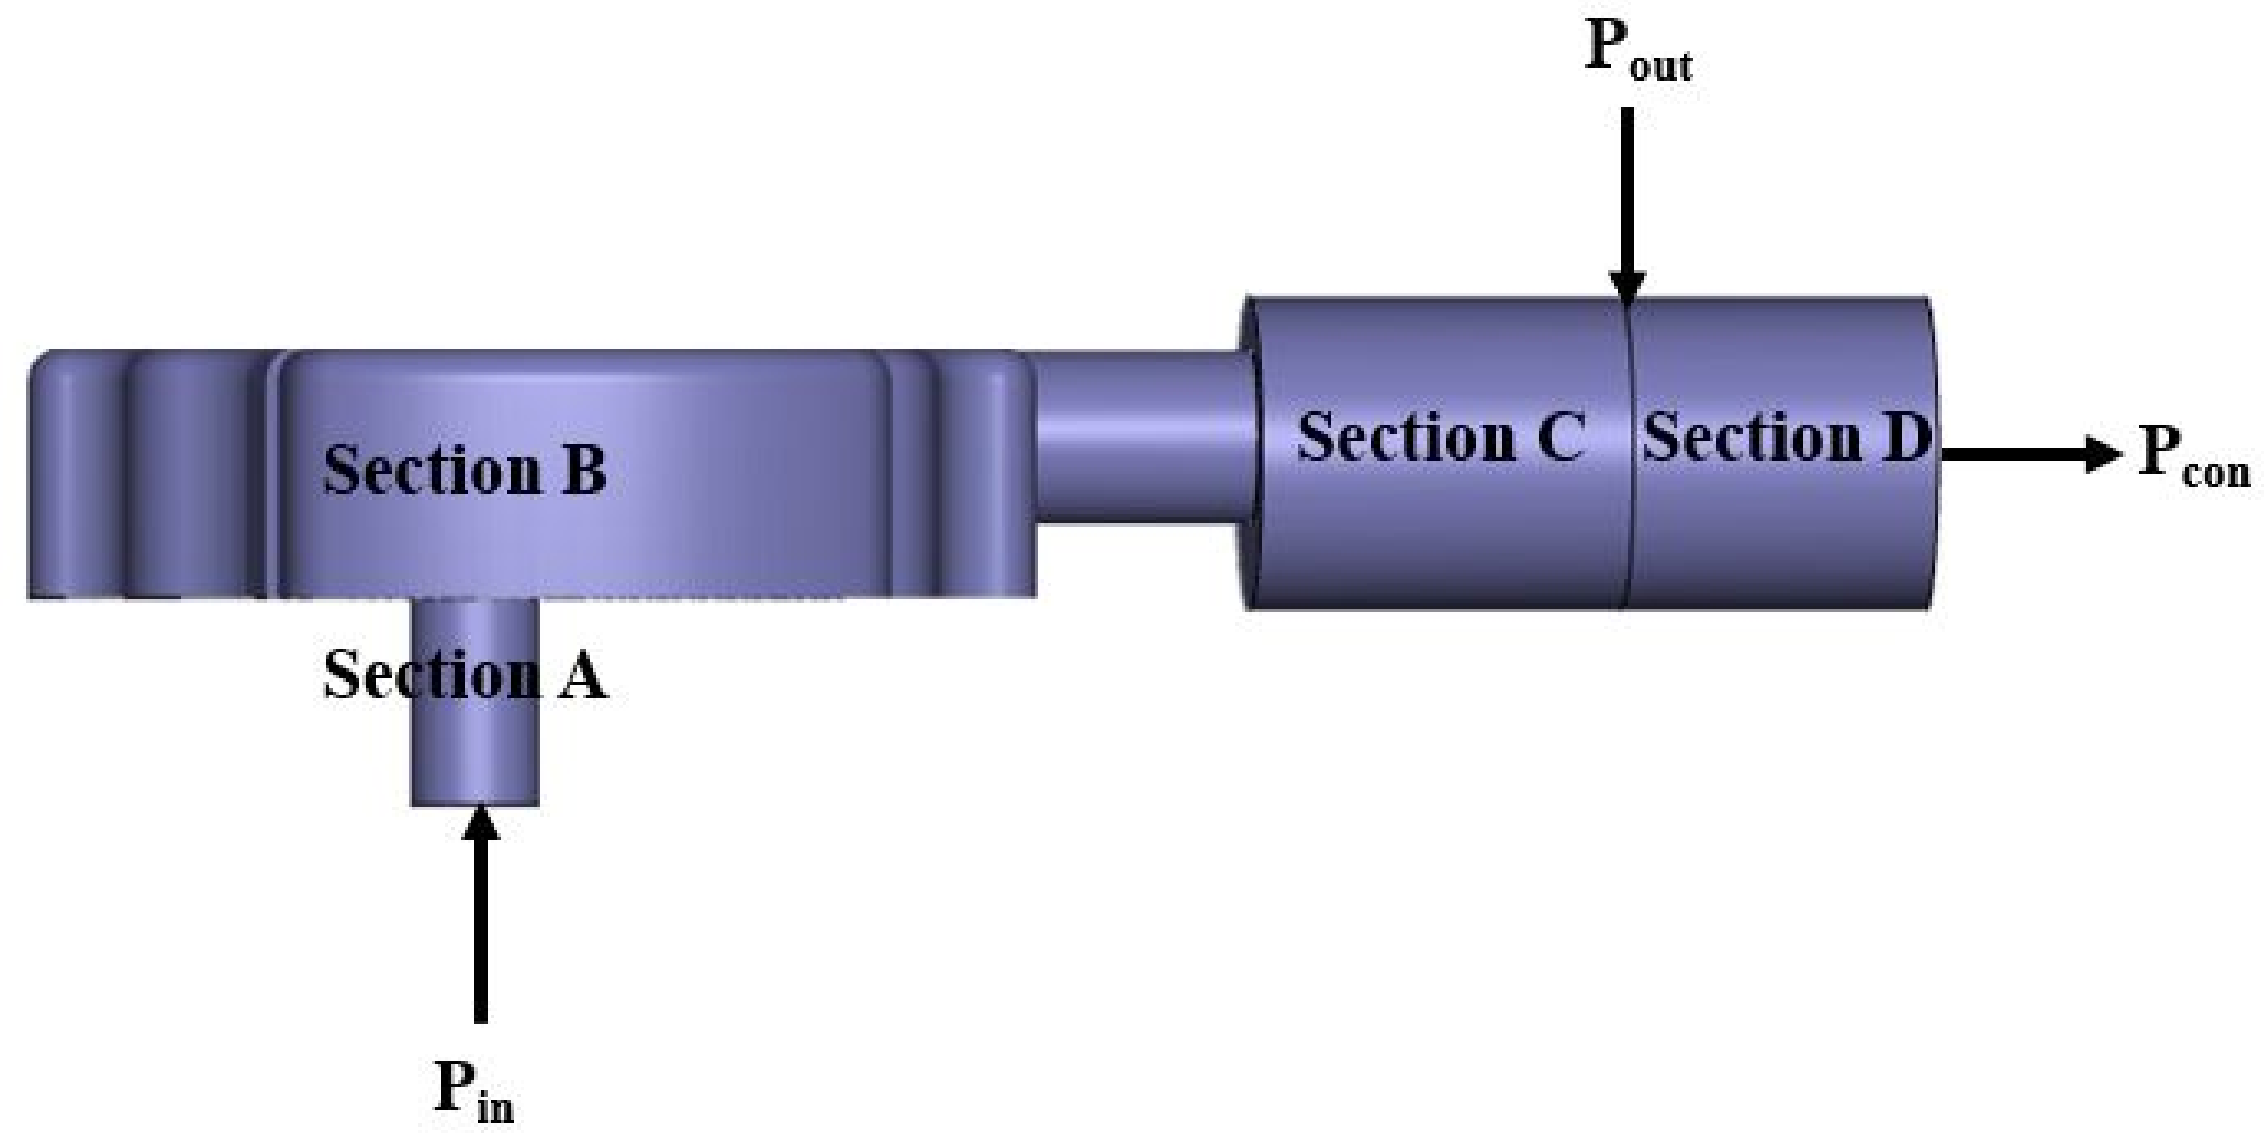
The inlet face of the expansion chamber is directly connecting the outlet face of the compression chamber, which means that the pressures of these two faces should remain consistent. The inlet pressure of the expansion chamber, fluctuating around 1,500,000 Pa, is denoted as Pin, and set as the inlet boundary condition. The time-domain curve of Pin is given by previous simulation results of the compression chamber. The outlet pressure of the expansion chamber is denoted as Pout, and refers to the pressure at the end surface of Section C. To calculate the flow characteristics in the expansion chamber, an imaginary segment is added connecting the end of Section C, and denoted as Section D. This segment is used to set the outlet boundary condition, namely the condenser-side pressure, with a magnitude of Pcon = 1,500,000 Pa. Figure 3 illustrates the locations of all key boundaries and their corresponding pressure values.
Figure 3.
Pressure boundary conditions of the expansion chamber. Pin: inlet pressure, fluctuating around 1.5 MPa; Pcon: consenser-side pressure, equal to 1.5 MPa; Pout: outlet pressure, to be simulated.
Apart from boundary pressures, the flow and thermodynamic parameters of the working fluids also need to be defined. These parameters include density, dynamic viscosity, thermal conductivity, enthalpy, and inlet temperature. Density, dynamic viscosity, thermal conductivity, and enthalpy are tabulated functions related to pressure and temperature, and initial inlet temperature is set to 453 K.
The calculations are based on the transient simulation model, with simulation time set to 0.15 s. The simulation time period is divided into 1800 time steps, corresponding to a calculation per 8.330 × 10⁻⁵ s. For each calculation 50 iterations are performed to ensure data conformity. The outlet pressure and mass flow-rate at the end of the discharge segment (Section C), and the streamlines inside the expansion chamber, are output to the results after all calculations are done.
Numerical simulations were performed with CFD software Simerics Pumplinx version 4.6.0. The turbulence model is standard k-epsilon, and the pressure–velocity coupling method is SimpleS. The numeric scheme for velocity and pressure is upwind, and the transient simulation is performed with the second-order implicit backward differentiation formular (BDF2) for time discretization, which is the default temporal scheme in Simerics PumpLinx software for transient flow calculations. The convergence criteria are all set to 0.1 for pressure, velocity, energy, turbulent kinetic energy, and turbulent energy dissipation rate, as the help documents of Pumplinx state, “The default converge criterion is 0.1 for transient simulations and 0.001 for steady state simulations. These defaults usually provide sufficient accuracy.” The residual drop diagrams show that when the pressure residual drop reaches −1, indicating that the pressure converge criterion of 0.1 (10−1) is achieved, the residual drops in velocity, temperature, turbulent kinetic energy, and turbulent energy dissipation rate are, respectively, −2.2, −3.5, −1.8, and −2.1, arriving at a more stringent convergence level than pressure. In Table 3, a list of the main parametrical settings of the solver is stated.
Table 3.
Main settings of the solver used to simulate the expansion chamber model.
2.4. Mesh Independence Study
The resolution of model meshes can substantially influence the calculation results in numerical simulations. Extremely fine meshes can enhance the accuracy of calculations, yet extend simulation time and degrade computational efficiency. In contrast, coarse meshes tremendously save simulation time but negatively affect the computational accuracy. It is a critical step to configure appropriate mesh resolutions in numerical simulation processes.
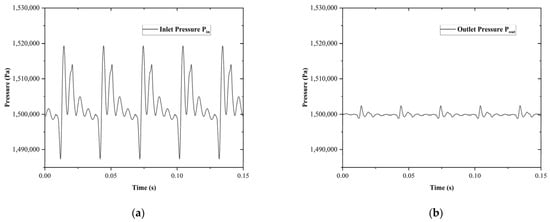
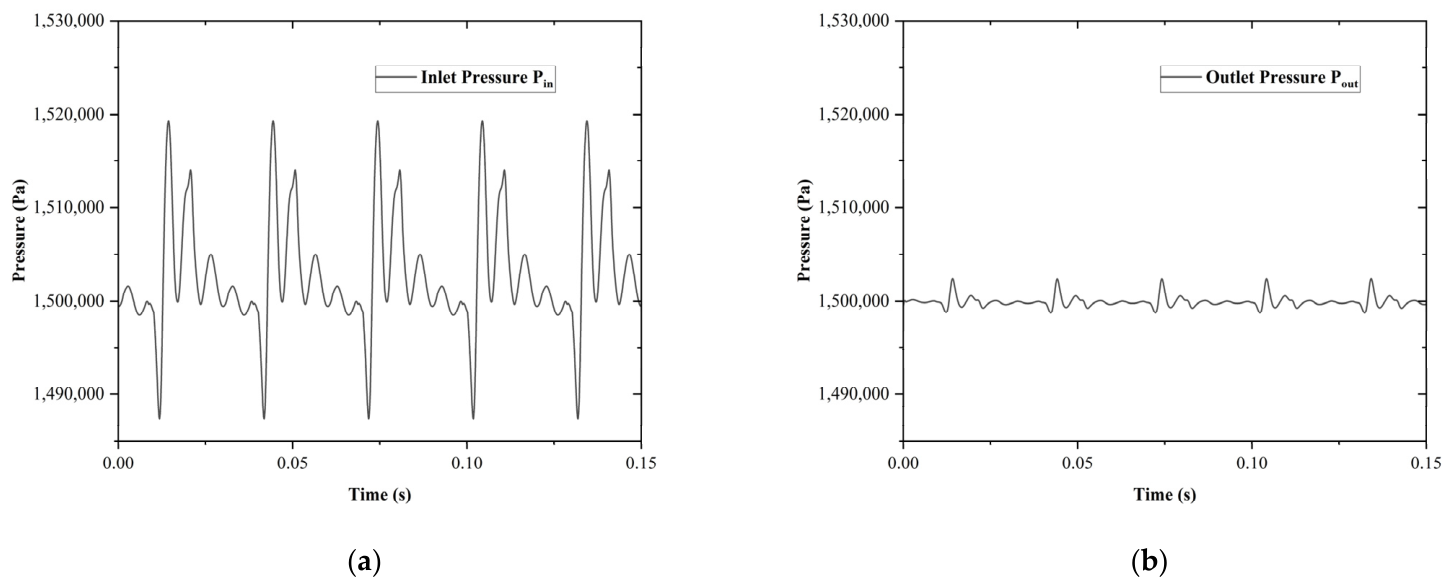
Calculate the pressure value of the inlet boundary (Pin) and the outlet boundary (Pout) according to the parameters defined in previous chapters. The pressure–time graphs of these two pressure values are illustrated in Figure 4. It can be clearly seen that the amplitude of pressure variations of working fluids passing through the expansion chamber, namely the pressure pulsation decreased significantly. The maximum inlet pressure (Pin) is 1,519,370 Pa, while the minimum is 1,487,410 Pa, yielding a pressure pulsation (peak-to-peak value) of 31,960 Pa. The maximum outlet pressure (Pout) is 1,502,390 Pa, while the minimum is 1,498,780 Pa, yielding a pressure pulsation (peak-to-peak value) of 3610 Pa. The pressure pulsation of the outlet boundary is reduced by 88.7% compared to that of the inlet boundary.
Figure 4.
Pressure–time graphs of (a) pressure at inlet boundary Pin and (b) pressure at discharge boundary Pout.
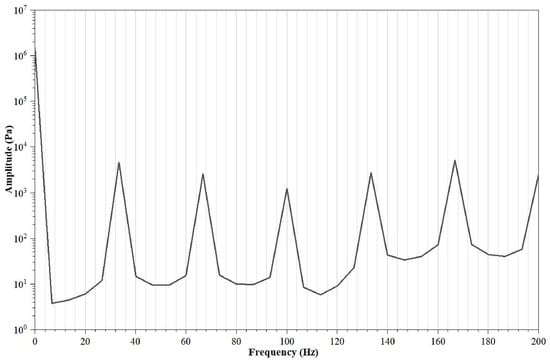
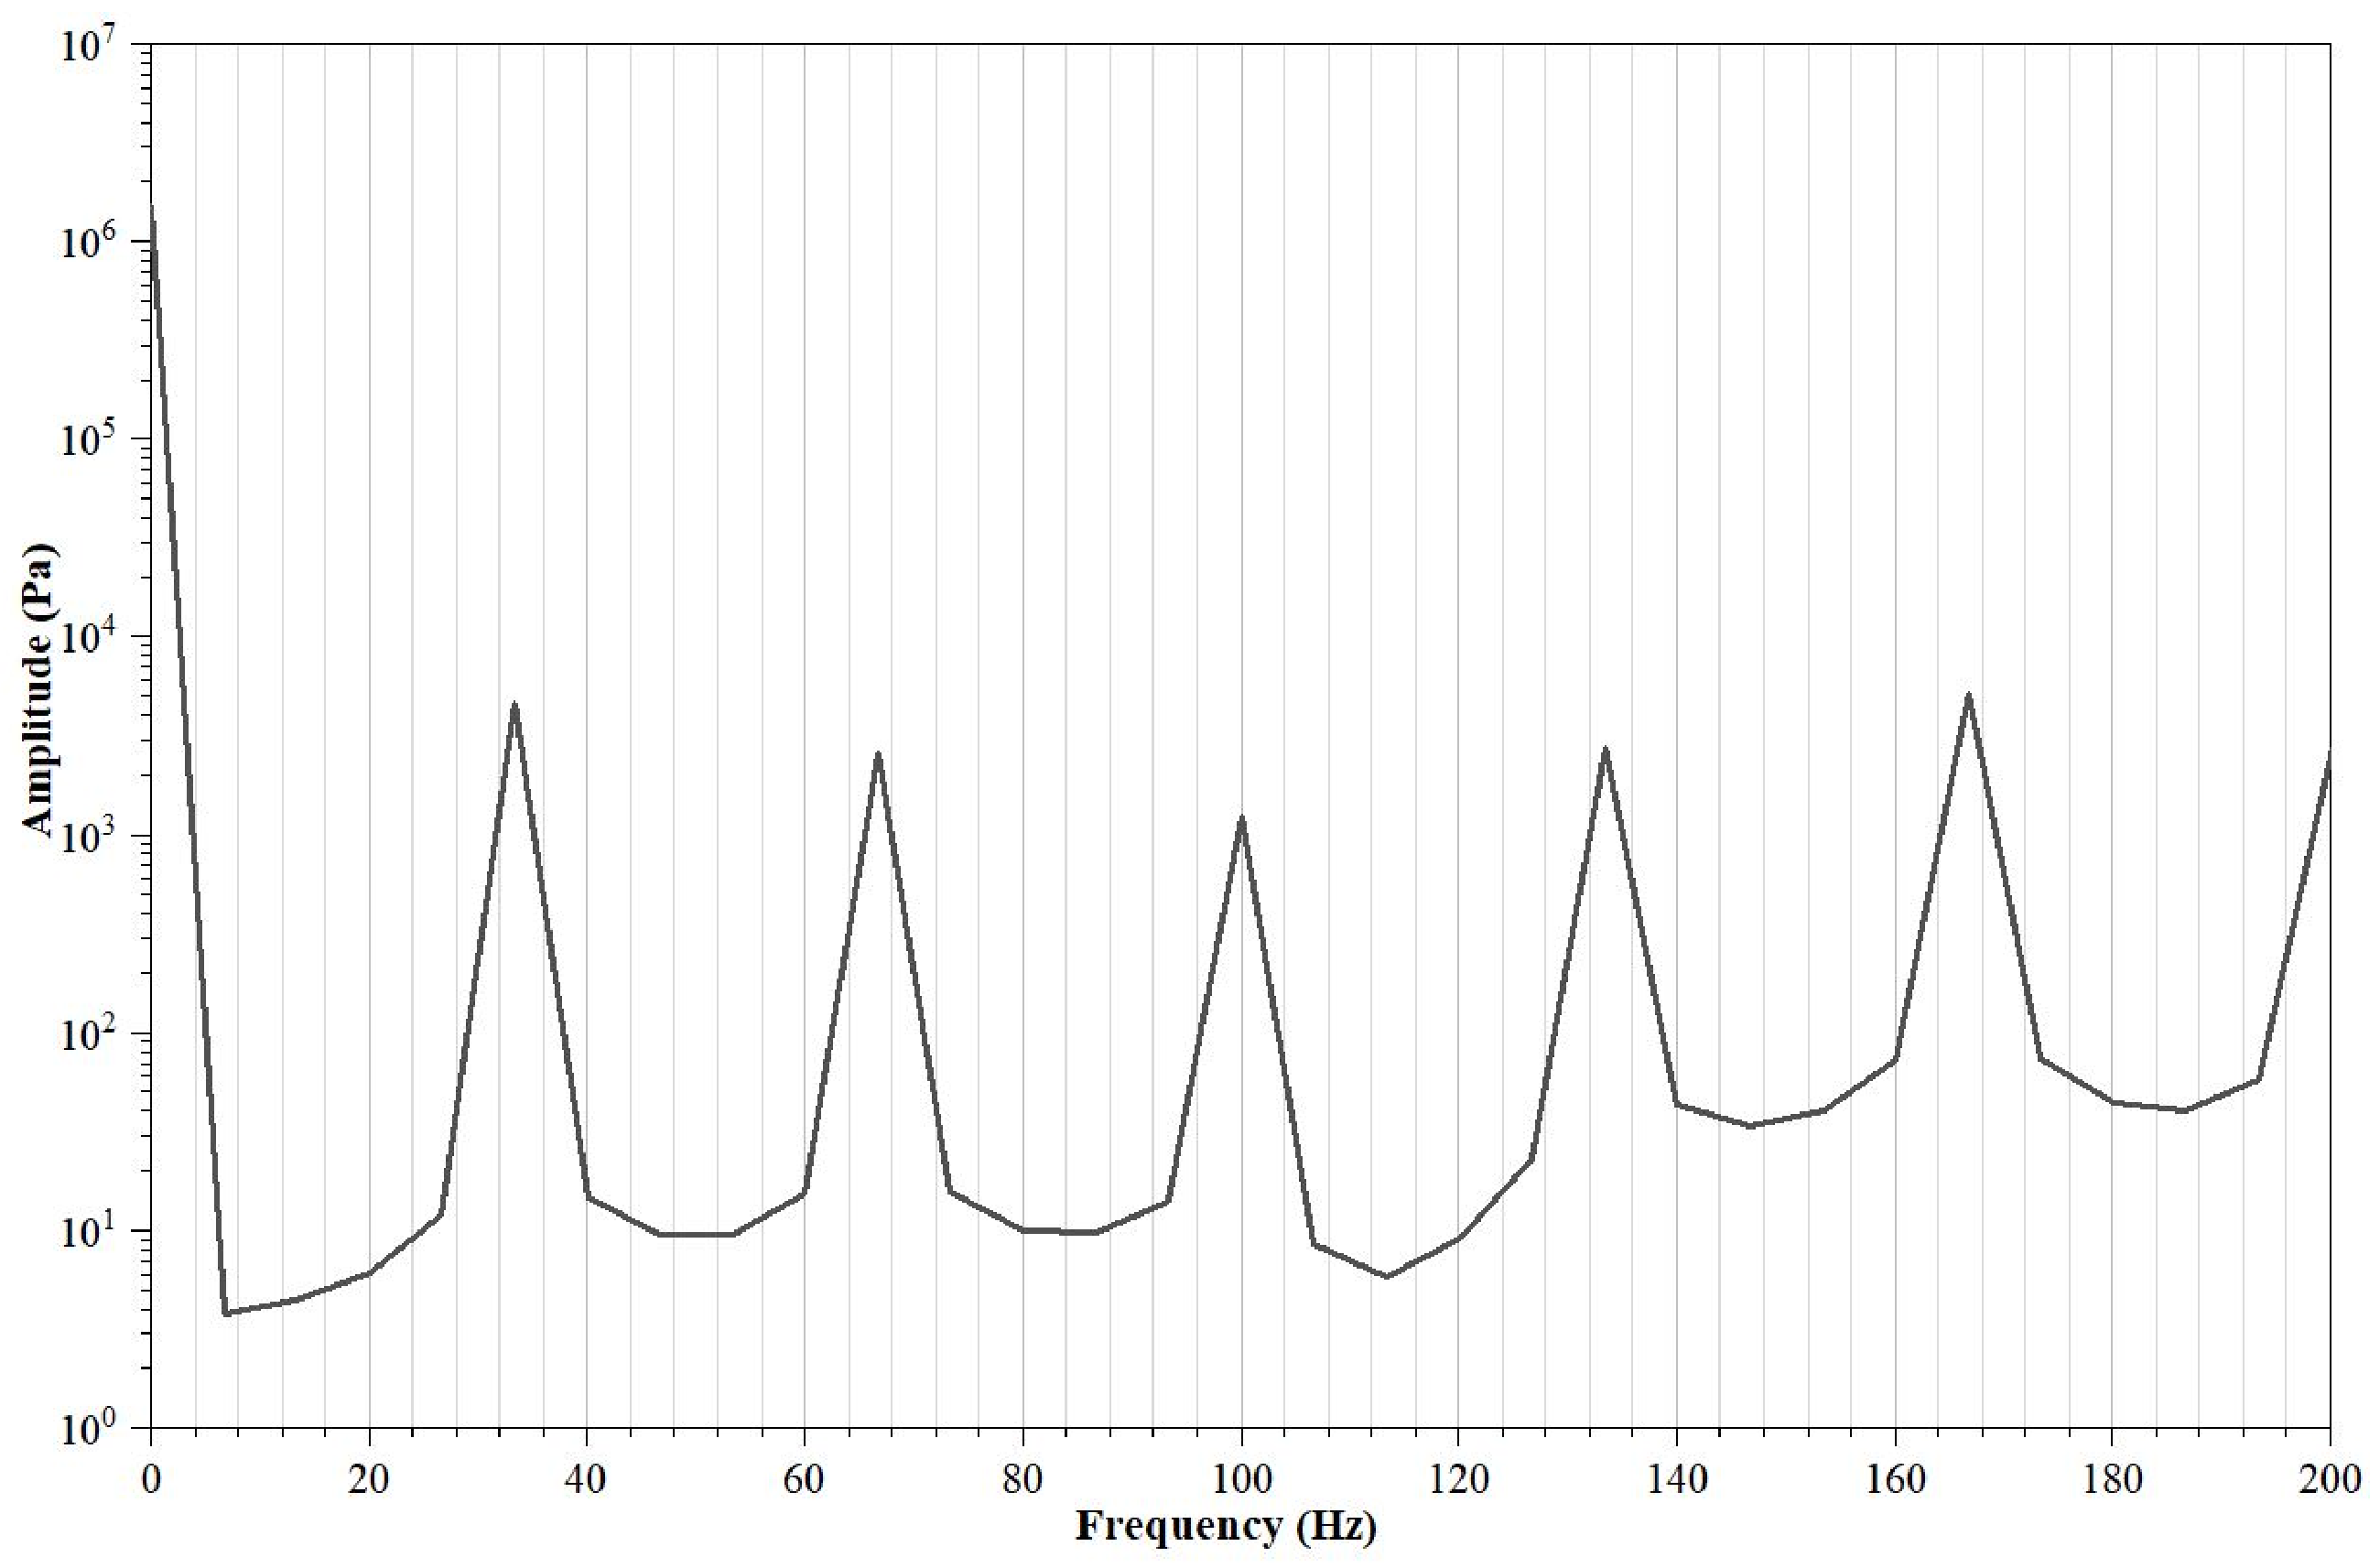
The calculated model is based on a scroll-type compressor rotating at a constant speed of 2000 rpm, generating a shaft frequency of 33.3 Hz. A FFT analysis of the inlet pressure–time waveform reveals that the fundamental frequency is also 33.3 Hz, corresponding to the shaft frequency of the compressor. The FFT diagram of the inlet pressure is plotted in Figure 5.
Figure 5.
FFT analysis of the inlet pressure, with a fundamental frequency of 33.3 Hz.
Based on the maximum mesh size, minimum mesh size, and surface mesh size configured in Table 1, regenerate meshes with seven resolution levels (0.5×, 1×, 2×, 4×, 6×, 8×, and 10× reference resolution) for this numerical model. The mesh sizes of Section B (expansion segment) at each level are listed in Table 4.
Table 4.
Mesh sizes of Section B (expansion segment) at seven resolution levels.
Apply this mesh generation rule to all remaining segments accordingly. The pressure pulsation values at the outlet boundary of the discharge segment (Section C) are calculated with all seven mesh resolutions. The rest of the parameters including boundary conditions remain consistent.
Taking the start-up spike in pressure and mass flow-rate into consideration, stabilized data over the last three cycles are used. Simulation results based on 1× resolution meshes reveal that the maximum pressure value during stabilized revolutions is 1,502,390 Pa and the minimum pressure value is 1,498,780 Pa. The difference between these two values, defined as the pressure pulsation, is 3610 Pa at the outlet surface.
Regarding the results of 2× resolution meshes, the maximum pressure value over the last three cycles is 1,502,400 Pa and the minimum is 1,498,740 Pa. This yields a pressure pulsation of 3660 Pa at the outlet surface.
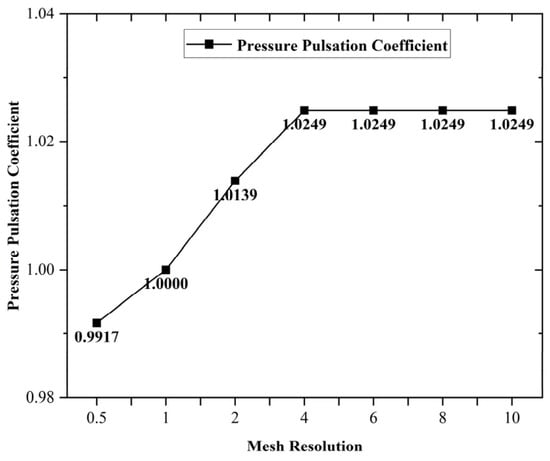
Taking the values of pressure pulsation obtained from the 1× resolution mesh as a reference, the pressure pulsation proportional coefficient of 2× resolution mesh is calculated, which equals 3660/3610 = 1.0139.
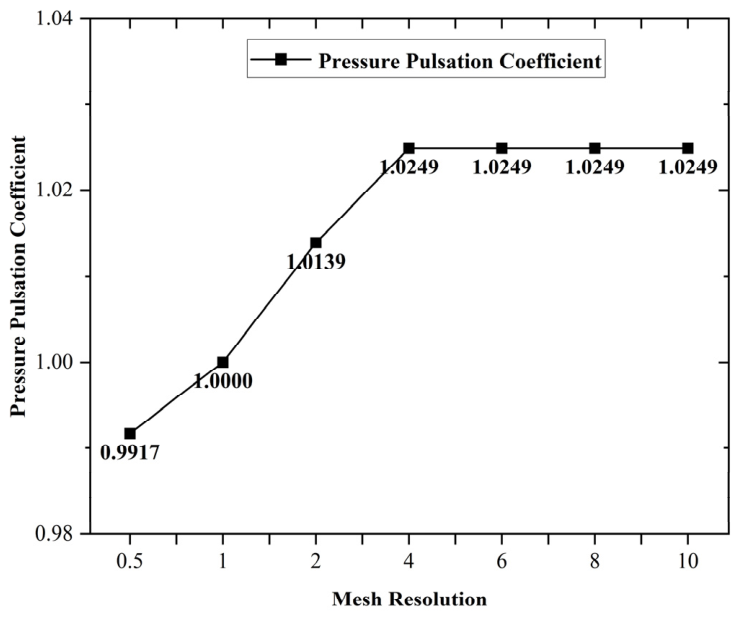
Similarly, the pressure pulsation coefficients are calculated with all seven mesh resolutions for this model. Calculated results are plotted in Figure 6.
Figure 6.
Pressure pulsation coefficients calculated with 0.5×, 1×, 2×, 4×, 6×, 8×, and 10× mesh resolutions for the original expansion chamber.
It is clearly indicated in Figure 6 that starting from 4× mesh resolution, the pressure pulsation coefficients are maintained at a constant value of 1.0249, exhibiting strong converging characteristics.
Grid independence verification is conducted with seven different mesh resolutions. The results show that the pressure pulsation coefficient remains consistent within the resolution ranging from 4× to 10×, with a relative difference less than 0.0001. It indicates that the numerical result of the pressure pulsation coefficient has reached a grid-independent state.
The 6× mesh resolution is finally selected as the computational scheme in all subsequent simulations, which meets the requirement of both maintaining sufficient simulation accuracy and avoiding excessive computational time.
The simulation result of this expansion chamber based on a grid of 6× resolution yields an outlet pressure pulsation of 3700 Pa and mass flow-rate fluctuation (peak-to-peak value of mass flow rate over the last three cycles) of 0.04652 kg/s, which serves as the benchmark reference in the subsequent study.
2.5. Modification of Expansion Chamber Model
To further enhance the stability of flow fields inside the expansion chamber, the original discharge segment (Section C) is separated into two sub-segments: a muffling segment with length of 4 mm (Section C1) and a new discharge segment (Section C2). The new structure of the expansion chamber is shown in Figure 7. The aim of the muffling segment is to facilitate the flow of fluids inside the expansion chamber, minimize the pressure pulsation of working fluids at the end of the new discharge segment (Section C2), and potentially suppress the flow-induced noises at the outlet boundary.
Figure 7.
Structure of the new expansion chamber: separate the original discharge segment (Section C) into muffling segment (Section C1) and new discharge segment (Section C2).
The offset between the centerline of the pipeline on the left side of C1 and the centerline of C1 is denoted as δ1; the offset between the centerline of the pipeline on the right side of C1 and the centerline of C1 is denoted as δ2; In addition, if the centerline of the pipeline is offset to the upside of the centerline of the muffler, δ is considered as a positive value. Otherwise, it is considered negative. According to this definition, the δ values in Figure 6 are: δ1 = 6 mm, δ2 = −6 mm.
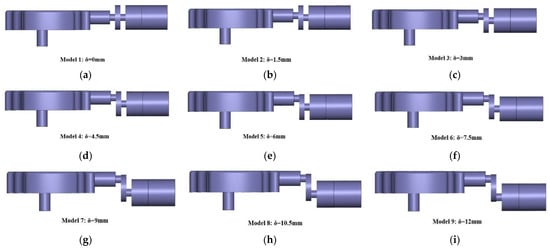
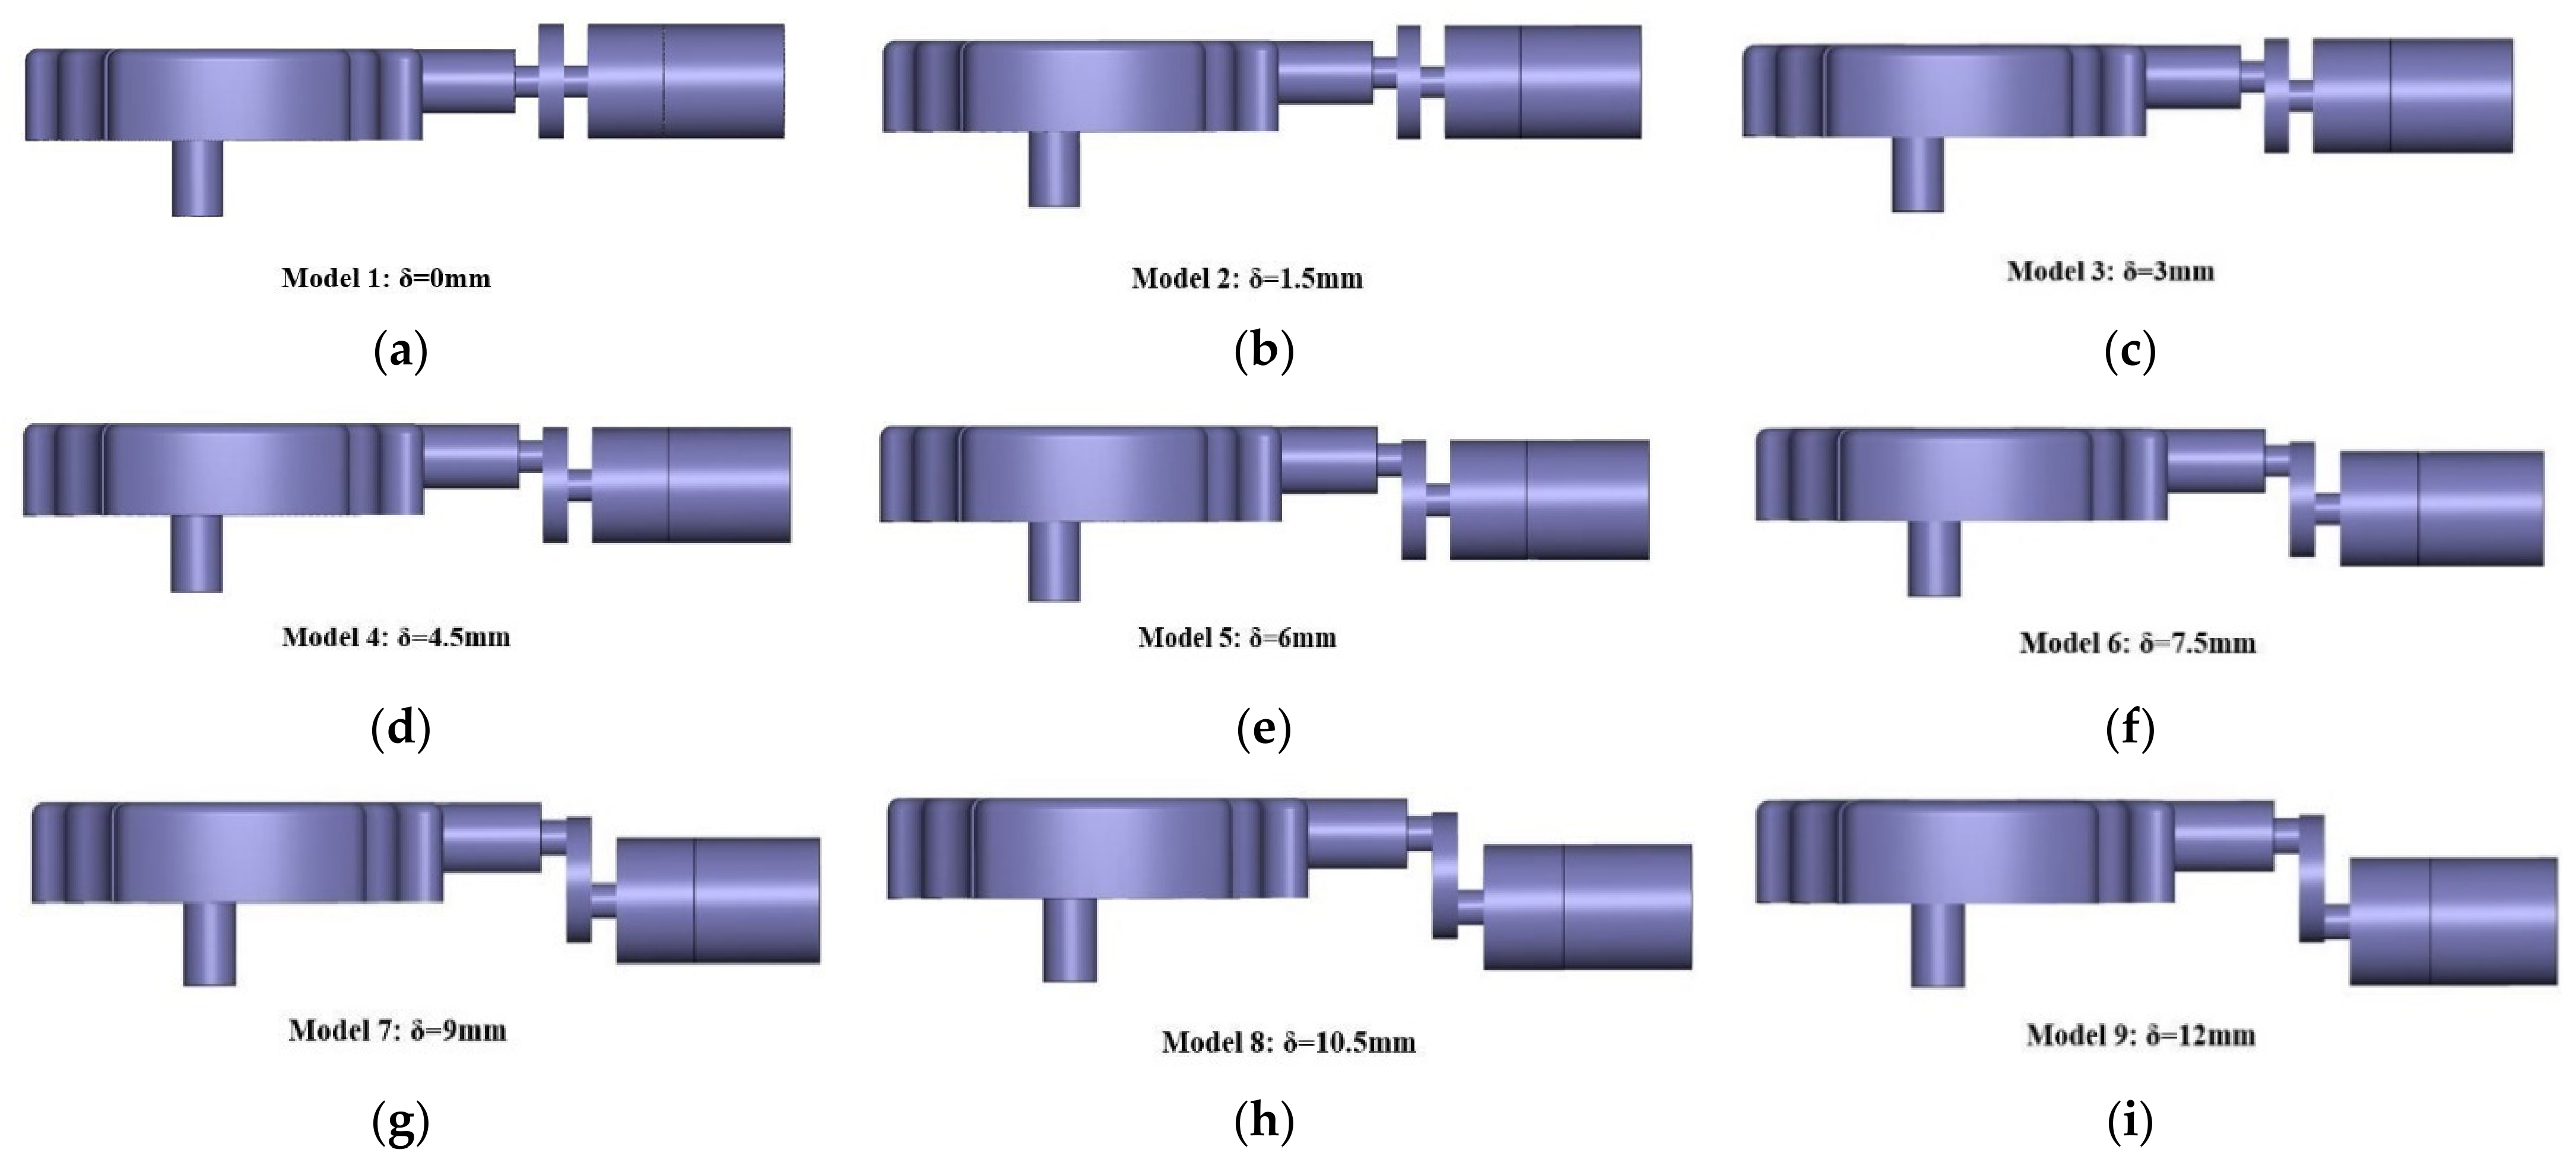
Then, define δ to be the distance between the centerlines of the segments on the lefthand and righthand sides of the muffling segment (C1). According to previous explanations, the relationship between δ, δ1, and δ2 is δ = δ1 − (δ2). Calculate the pressure pulsation and mass flow-rate fluctuation at the outlet face of the discharge segment (C2) as δ changes from 0 mm to 12 mm gradually. In order to reduce the time of computing, set a new model for every 1.5 mm increment of δ. A total number of 9 distinct muffler constructions are generated as illustrated in Figure 8. The best-performing muffling structure is identified after comparing the simulation results of all 9 numerical models.
Figure 8.
Nine muffler structures, respectively, as (a) Model 1: δ = 0 mm, (b) Model 2: δ = 1.5 mm, (c) Model 3: δ = 3 mm, (d) Model 4: δ = 4.5 mm, (e) Model 5: δ = 6 mm, (f) Model 6: δ = 7.5 mm, (g) Model 7: δ = 9 mm, (h) Model 8: δ = 10.5 mm, (i) Model 9: δ = 12 mm.
3. Results
3.1. Results of Single Muffler Models
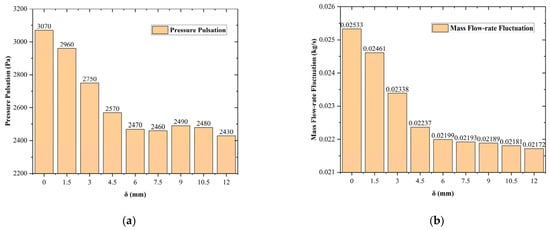
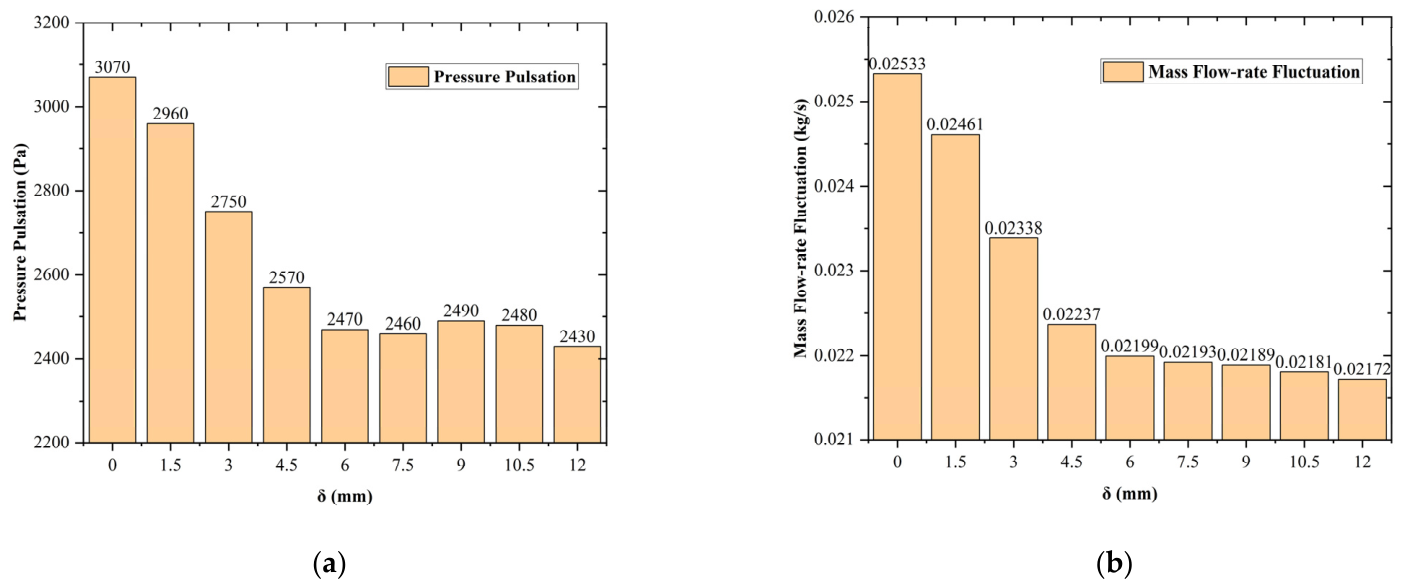
Simulate the nine single muffler models illustrated in Figure 9 with 6× resolution meshes. Define the pressure pulsation value to be the peak-to-peak pressure over the last three cycles, and the mass flow-rate fluctuation to be the peak-to-peak mass flow-rate during the same cycles, excluding the start-up spike in pressure and mass flow-rate. The pressure pulsation and mass flow-rate fluctuation values at the outlet face of the discharge segment (Section C2) are obtained and listed in Figure 8.
Figure 9.
Pressure pulsation (a) and mass flow-rate fluctuation (b) values at the outlet of all nine single muffler models.
Data in Figure 9 reveal that the pressure pulsation and mass flow-rate fluctuation exhibit a trend of decreasing as the distance between centerlines of the segments on the lefthand and righthand sides of the muffling segment (δ) increases. When δ reaches a value of 12 mm, the pressure pulsation value at the outlet reduces to 2430 Pa, and the mass flow-rate fluctuation of the flow reduces to 0.02172 kg/s, which are both minimum values among all nine models. Since a more stable flow field is characterized by lower pressure pulsation and mass flow-rate fluctuation values at the outlet surface, it can be inferred that Model 9 (δ = 12 mm) achieves the best flow field stability performance among all single muffler structures.
A quantitative analysis on the basic single muffler model (model 1) and the best-performing single muffler model (model 9) reveals that the modification of the muffler structure yields a reduction of 640 Pa for pressure pulsation and 0.00361 kg/s for mass flow-rate fluctuation at the outlet boundary, corresponding to a 20.85% drop in pressure pulsation, and a 14.25% drop in mass flow-rate fluctuation.
In comparison with the original model without muffler segment, the best-performing single muffler model yields a reduction of 1270 Pa for pressure pulsation and 0.0248 kg/s for mass flow-rate fluctuation at the outlet boundary, corresponding to a 34.32% drop in pressure pulsation, and a 53.31% drop in mass flow-rate fluctuation.
In order to verify the rationality of the chosen mesh, a second mesh study on Model 9 is repeated and the result is as follows:
Cell counts of three meshes (4×, 6×, and 8×) are, respectively, as follows: N1 (8×, fine) = 3,197,479; N2 (6×, medium) = 1,593,786; N3 (4×, coarse) = 564,414.
Use the mass flow-rate fluctuation as the primary metric and pressure pulsation as the secondary metric.
Primary metrics are as follows: φ1 (8×, fine) = 0.021809 kg/s; φ2 (6×, medium) = 0.021724 kg/s; φ3 (4×, coarse) = 0.021518 kg/s. The mass flow-rate fluctuation converges monotonically (0.021518, 0.021724 and 0.021809), with an apparent order of 1.65 and a GCI of 1.04% on the fine (8×) grid and 1.53% on the medium (6×) grid.
Secondary metrics are as follows: φ1 (8×, fine) = 2430 Pa; φ2 (6×, medium) = 2430 Pa; φ3 (4×, coarse) = 2380 Pa. The pressure pulsations are 2380, 2430, and 2430 Pa. The fine and medium grids agree within the resolution of the data (about 0.2%). The mesh used in this study (6×, medium) is therefore adequately resolved for the comparisons reported here.
It is worth mentioning that the fine-to-medium refinement ratio (1.26) is slightly below the commonly recommended value of 1.3.
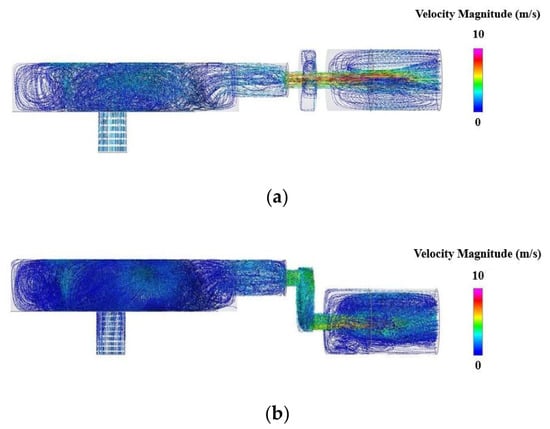
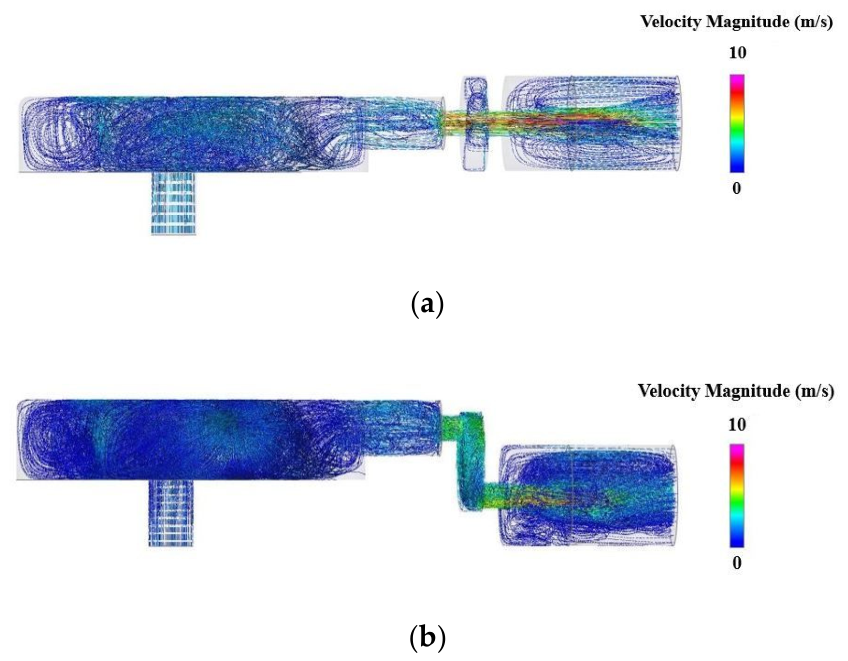
Figure 10 compares the streamlines of working fluids inside the expansion chamber of Model 1 and Model 9, at the instant of 0.15 s when the simulation is completely finished. Obviously, the working fluids flow more sufficiently and uniformly in the structure with the muffling segment, explaining the fact that the pressure pulsation at the discharge outlet of this structure is lower than that of the basic structure.
Figure 10.
Comparison of streamlines inside the expansion chamber of (a) Model 1 and (b) Model 9.
3.2. Improvement of Double Muffler Model
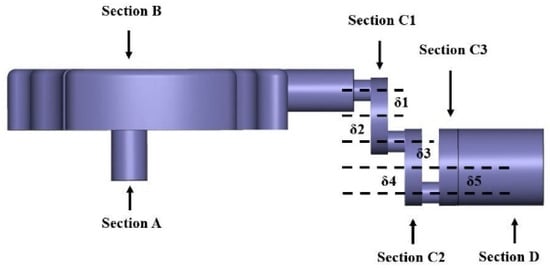
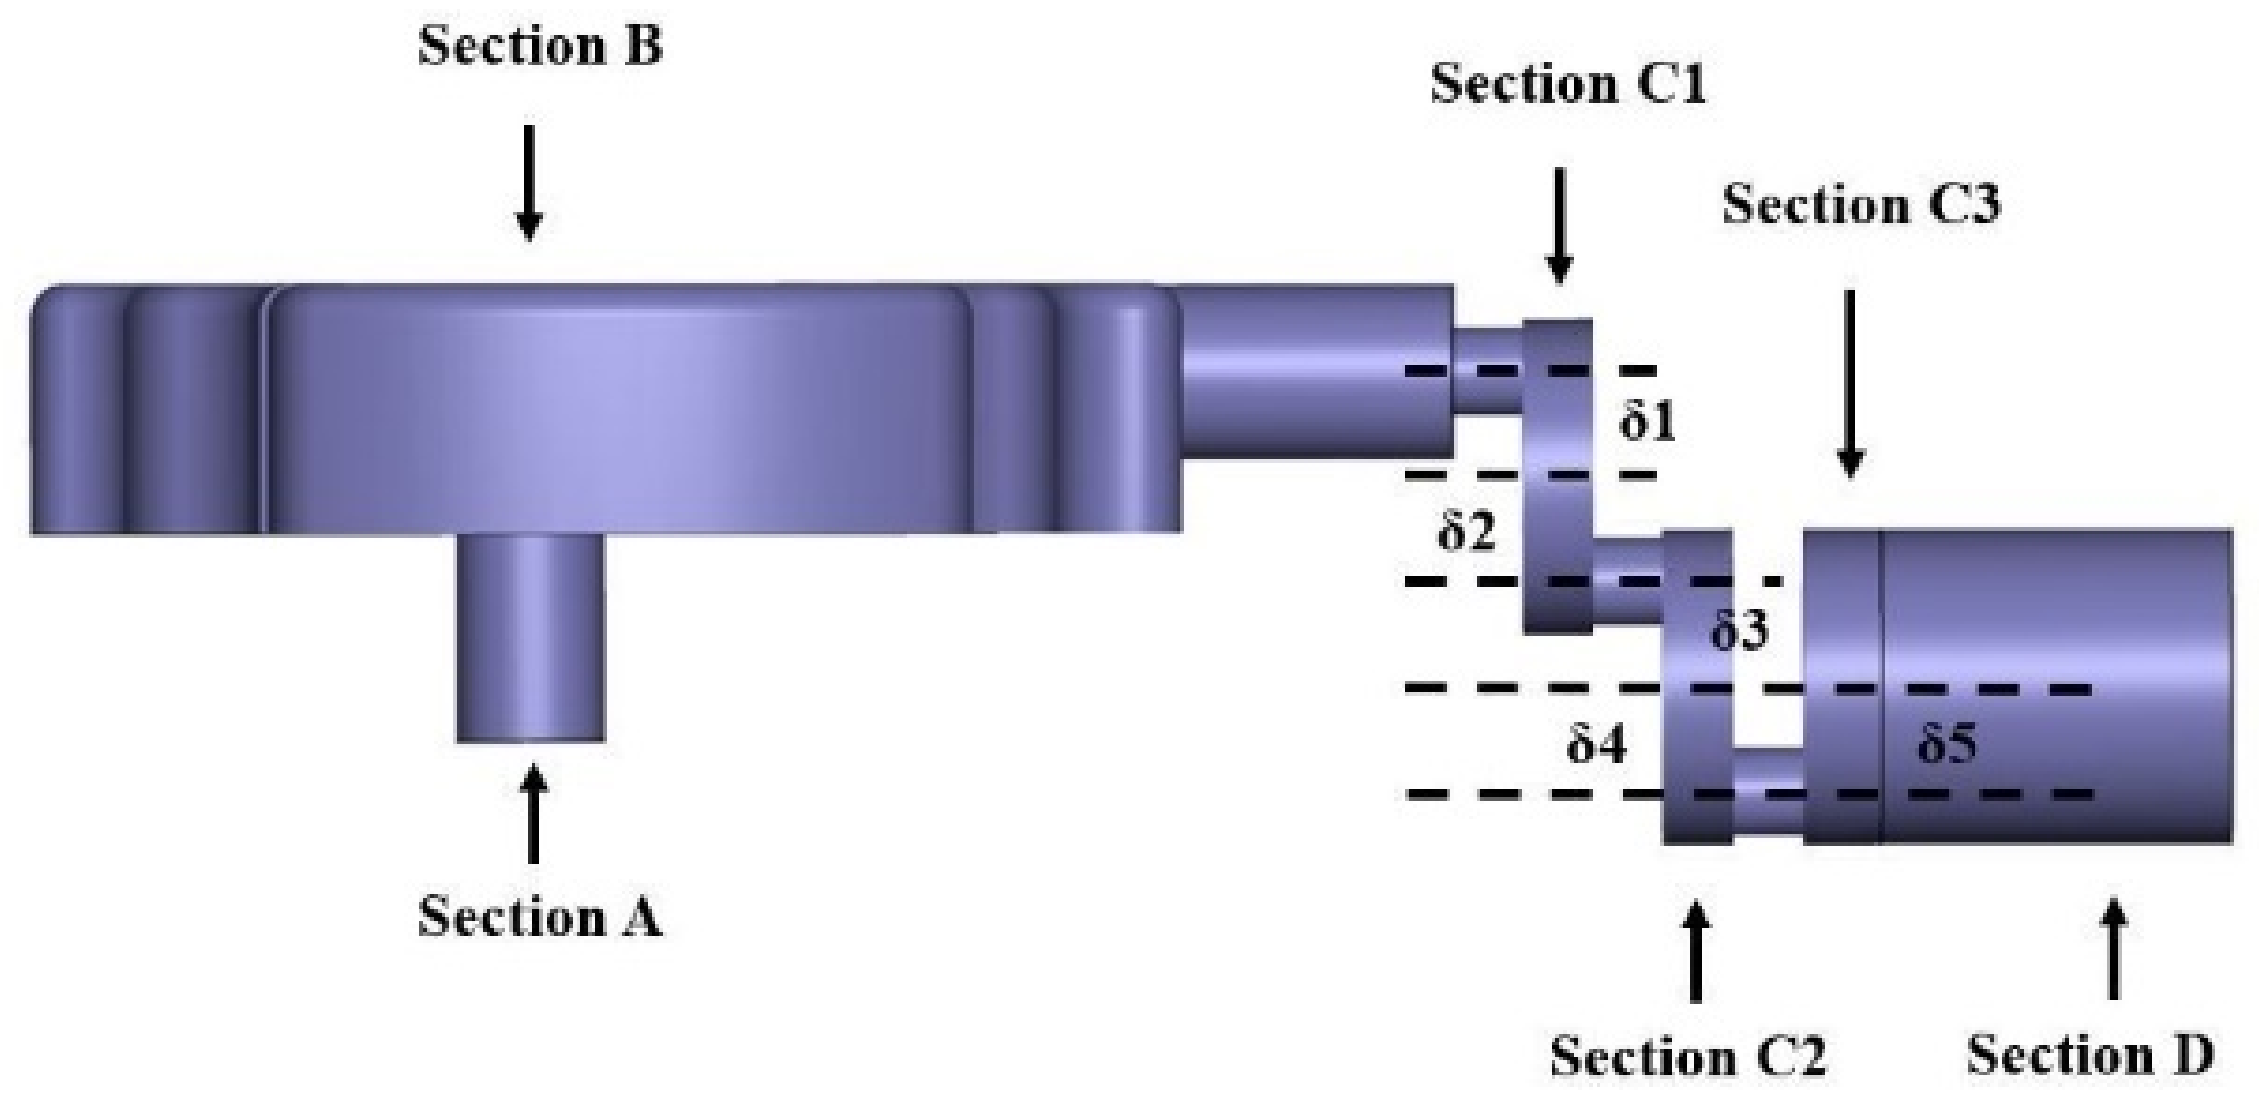
To further improve the structure of the expansion chamber and reduce the pressure pulsation at the outlet surface, a segment with the same thickness as the existing muffler (Section C1) is separated from the discharge segment (Section C2) to form a double muffler structure. The remaining part of discharge segment constitutes the new discharge segment (Section C3). The structure of this double muffling expansion chamber is illustrated in Figure 11.
Figure 11.
Structure of the double muffler expansion chamber, with offsetting values as δ1 = 6 mm, δ2 = −6 mm, δ3 = 6 mm, δ4 = −6 mm, δ5 = −6 mm.
Define the following crucial parameters:
- the offset between the centerline of the pipeline on the left side of C1 and the centerline of C1 is denoted as δ1;
- the offset between the centerline of the pipeline on the right side of C1 and the centerline of C1 is denoted as δ2;
- the offset between the centerline of the pipeline on the left side of C2 and the centerline of C2 is denoted as δ3;
- the offset between the centerline of the pipeline on the right side of C2 and the centerline of C2 is denoted as δ4;
- the offset between the centerline of the pipeline on the left side of C3 and the centerline of C3 is denoted as δ5.
In addition, if the centerline of the pipeline is offset to the upside of the centerline of the muffler, δ is considered as a positive value. Otherwise, it is considered negative. According to this definition, the δ values in Figure 10 are as follows: δ1 = 6 mm, δ2 = −6 mm, δ3 = 6 mm, δ4 = −6 mm, δ5 = −6 mm.
If the values of δ1 to δ5 are adjusted by increments of 1.5 mm starting from −6 mm to 6 mm, each value of δ1 to δ5 has 9 options, namely, −6 mm, −4.5 mm, −3 mm, −1.5 mm, 0 mm, 1.5 mm, 3.0 mm, 4.5 mm, and 6 mm. This results in a total number of 59,049 (95) numerical models to be simulated, consuming an extremely huge amount of computational time. Given that arbitrary variations in values from δ1 to δ5 can potentially reduce the pressure pulsation at the outlet surface, it is impractical to conduct numerical simulations for all 59,049 candidate models. To save computational cost and improve simulation efficiency, the subsequent parametric investigation is simplified into a three-step procedure as follows:
Step 1: Fix δ1 to 6 mm and δ2 to −6 mm. Analysis in Section 3.1 has revealed that for the single muffler structure, the outlet pressure pulsation value reaches a minimum when the spacing between the lefthand and righthand side of the muffler is 12 mm. Based on this conclusion, it can be inferred that setting δ1 and δ2 to 6 mm and −6 mm, respectively, can significantly suppress the outlet pressure pulsation of the double muffler model.
Step 2: Once δ1 and δ2 are determined, a total number of 729 (93) possible combinations of δ3, δ4, and δ5 are involved. As a preliminary screening, δ4 and δ5 are both fixed to 0 mm, while δ3 is adjusted from −6 mm to 6 mm with an increment of 1.5 mm, yielding nine models to be calculated. The value of δ3 can be decided from the results of these nine models.
Step 3: Fix δ3 to the value obtained in Step 2, and calculate the full-factorial combination of δ4 and δ5, resulting in a total number of 81 (92) cases. To further simplify calculations, the step size of δ4 and δ5 is enlarged to 3 mm, setting each parameter to iterate between five values: −6 mm, −3 mm, 0 mm, 3 mm, and 6 mm. Accordingly, the number of models to be calculated is reduced to 25 (52), and the final improved solution is determined from these 25 cases.
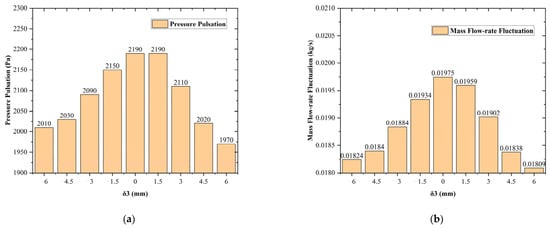
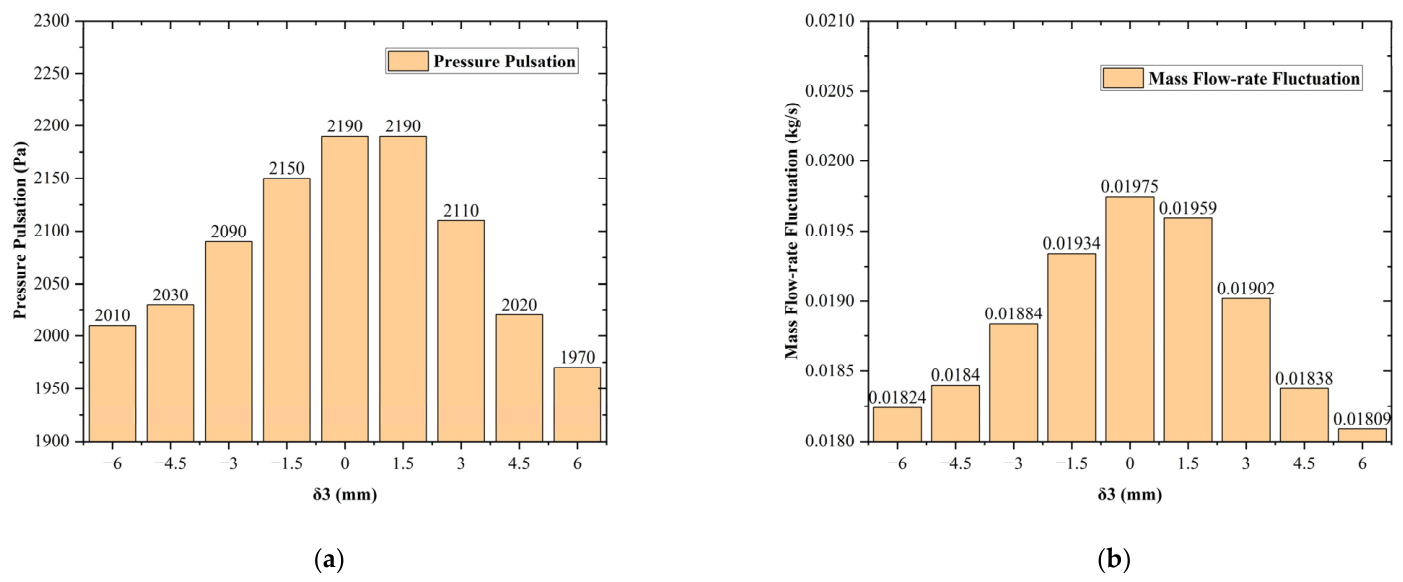
The simulation of nine models defined in Step 2 obtains a result of pressure pulsation (peak-to-peak pressure value over last three cycles) and mass flow-rate fluctuation (peak-to-peak mass flow-rate value over last three cycles) curves illustrated in Figure 12. It can be observed from the data in Figure 11 that both pressure pulsation and mass flow-rate fluctuation at the outlet reach minimum values when δ3 = 6 mm, suggesting a more stable flow of fluids inside the chamber.
Figure 12.
Pressure pulsation (a) and mass flow-rate fluctuation (b) curves at the outlet boundary of 9 models assuming δ1 = 6 mm, δ2 = −6 mm, δ4 = δ5 = 0 mm.
In Figure 12, the numerical values of pressure pulsation do not correspond to a perfectly monotonic decrease as δ3 varies from 0 mm to 6 mm. This phenomenon can be possibly caused by the minimum numerical resolution of 10 Pa for pressure computations in Simerics PumpLinx software. As a result, both the maximum and minimum values of the time-domain pressure curves are subject to an error of at least ±10 Pa. Since the pressure pulsation value is derived from the difference between the maximum and minimum pressures, the calculation result may have an error between −20 Pa and 20 Pa.
According to the simulation results, the outlet pressure pulsation values of the two models corresponding to δ3 = 0 mm and δ3 = 1.5 mm are the same, which is most likely induced by the numerical resolution error of the software.
Now set δ1 = 6 mm, δ2 = −6 mm and δ3 = 6 mm, vary the values of δ4 and δ5 and simulate all 25 models mentioned in Step 3. The simulated pressure pulsation and fluctuating mass flow-rate values at the outlet boundary are listed in Table 5.
Table 5.
Simulated results of pressure pulsation and mass flow-rate fluctuation of 25 models in Step 3.
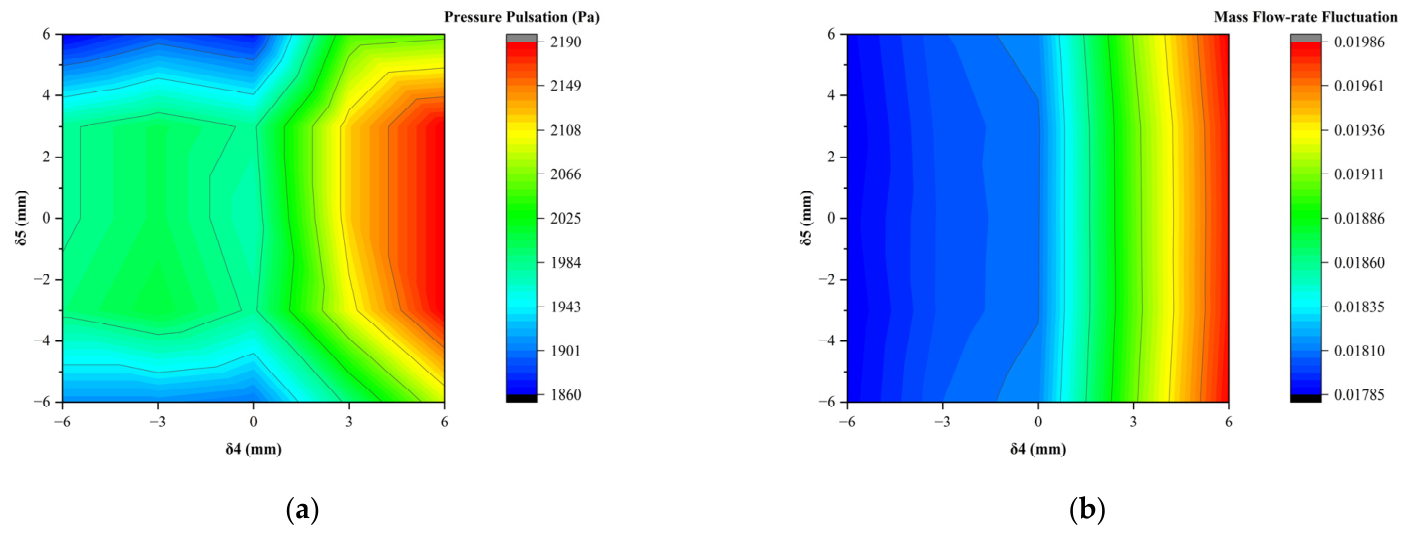
There exists a discrepancy between the best-performing solution among these 25 models derived from two distinct criteria, namely, minimum pressure pulsation and minimum mass flow-rate fluctuation. The model that yields the minimum pressure pulsation value corresponds to the model setting parameters to δ1 = 6 mm, δ2 = −6 mm, δ3 = 6 mm, δ4 = −6 mm, and δ5 = 6 mm. The simulated outlet pressure pulsation and mass flow-rate fluctuation values are 1860 Pa and 0.017874 kg/s, respectively. The double muffling structure achieves a reduction of 1840 Pa for pressure pulsation and 0.028646 kg/s for mass flow-rate fluctuation at the outlet boundary, corresponding to a 49.73% drop in pressure pulsation, and a 61.58% drop in mass flow-rate fluctuation, compared to the original expansion chamber model.
The model that yields the minimum mass flow-rate fluctuation value corresponds to the model setting parameters to δ1 = 6 mm, δ2 = −6 mm, δ3 = 6 mm, δ4 = −6 mm, and δ5 = −3 mm. The simulated outlet pressure pulsation and mass flow-rate fluctuation values are 1990 Pa and 0.017852 kg/s, respectively. The double muffling structure achieves a reduction of 1710 Pa for pressure pulsation and 0.028668 kg/s for mass flow-rate fluctuation at the outlet boundary, corresponding to a 46.22% drop in pressure pulsation, and a 61.63% drop in mass flow-rate fluctuation, compared to the original expansion chamber model.
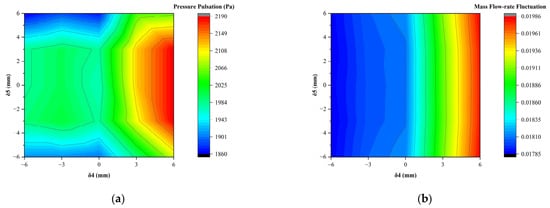
Figure 13 illustrates the evolution of pressure pulsation and mass flow-rate fluctuation with varying values of δ4 and δ5 in an intuitive manner. The values of δ4 and δ5 corresponding to the minimum pressure pulsation and mass flow-rate fluctuation can be readily identified, and the corresponding numerical models can be determined accordingly.
Figure 13.
Diagram of (a) pressure pulsation and (b) mass flow-rate fluctuation at the outlet boundary of 25 models.
The discrepancy between the best-performing solution derived from different criteria could be caused by the uncertainty of the simulation results. The simulated mass flow-rate fluctuation values at the outlet boundary of two models have a difference of merely 0.000022 kg/s, which is quite close to zero. Minor discrepancies induced by numerical simulation errors may lead to a fundamental shift in the criterion for evaluating the relative performance of the models, thereby altering the conclusion regarding the best-performing solution. Quantitative uncertainty analysis is performed in Section 4.
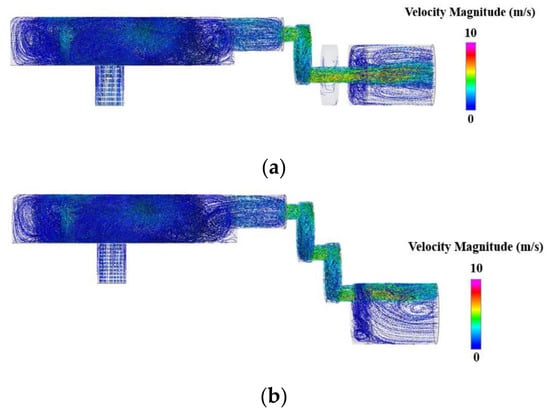
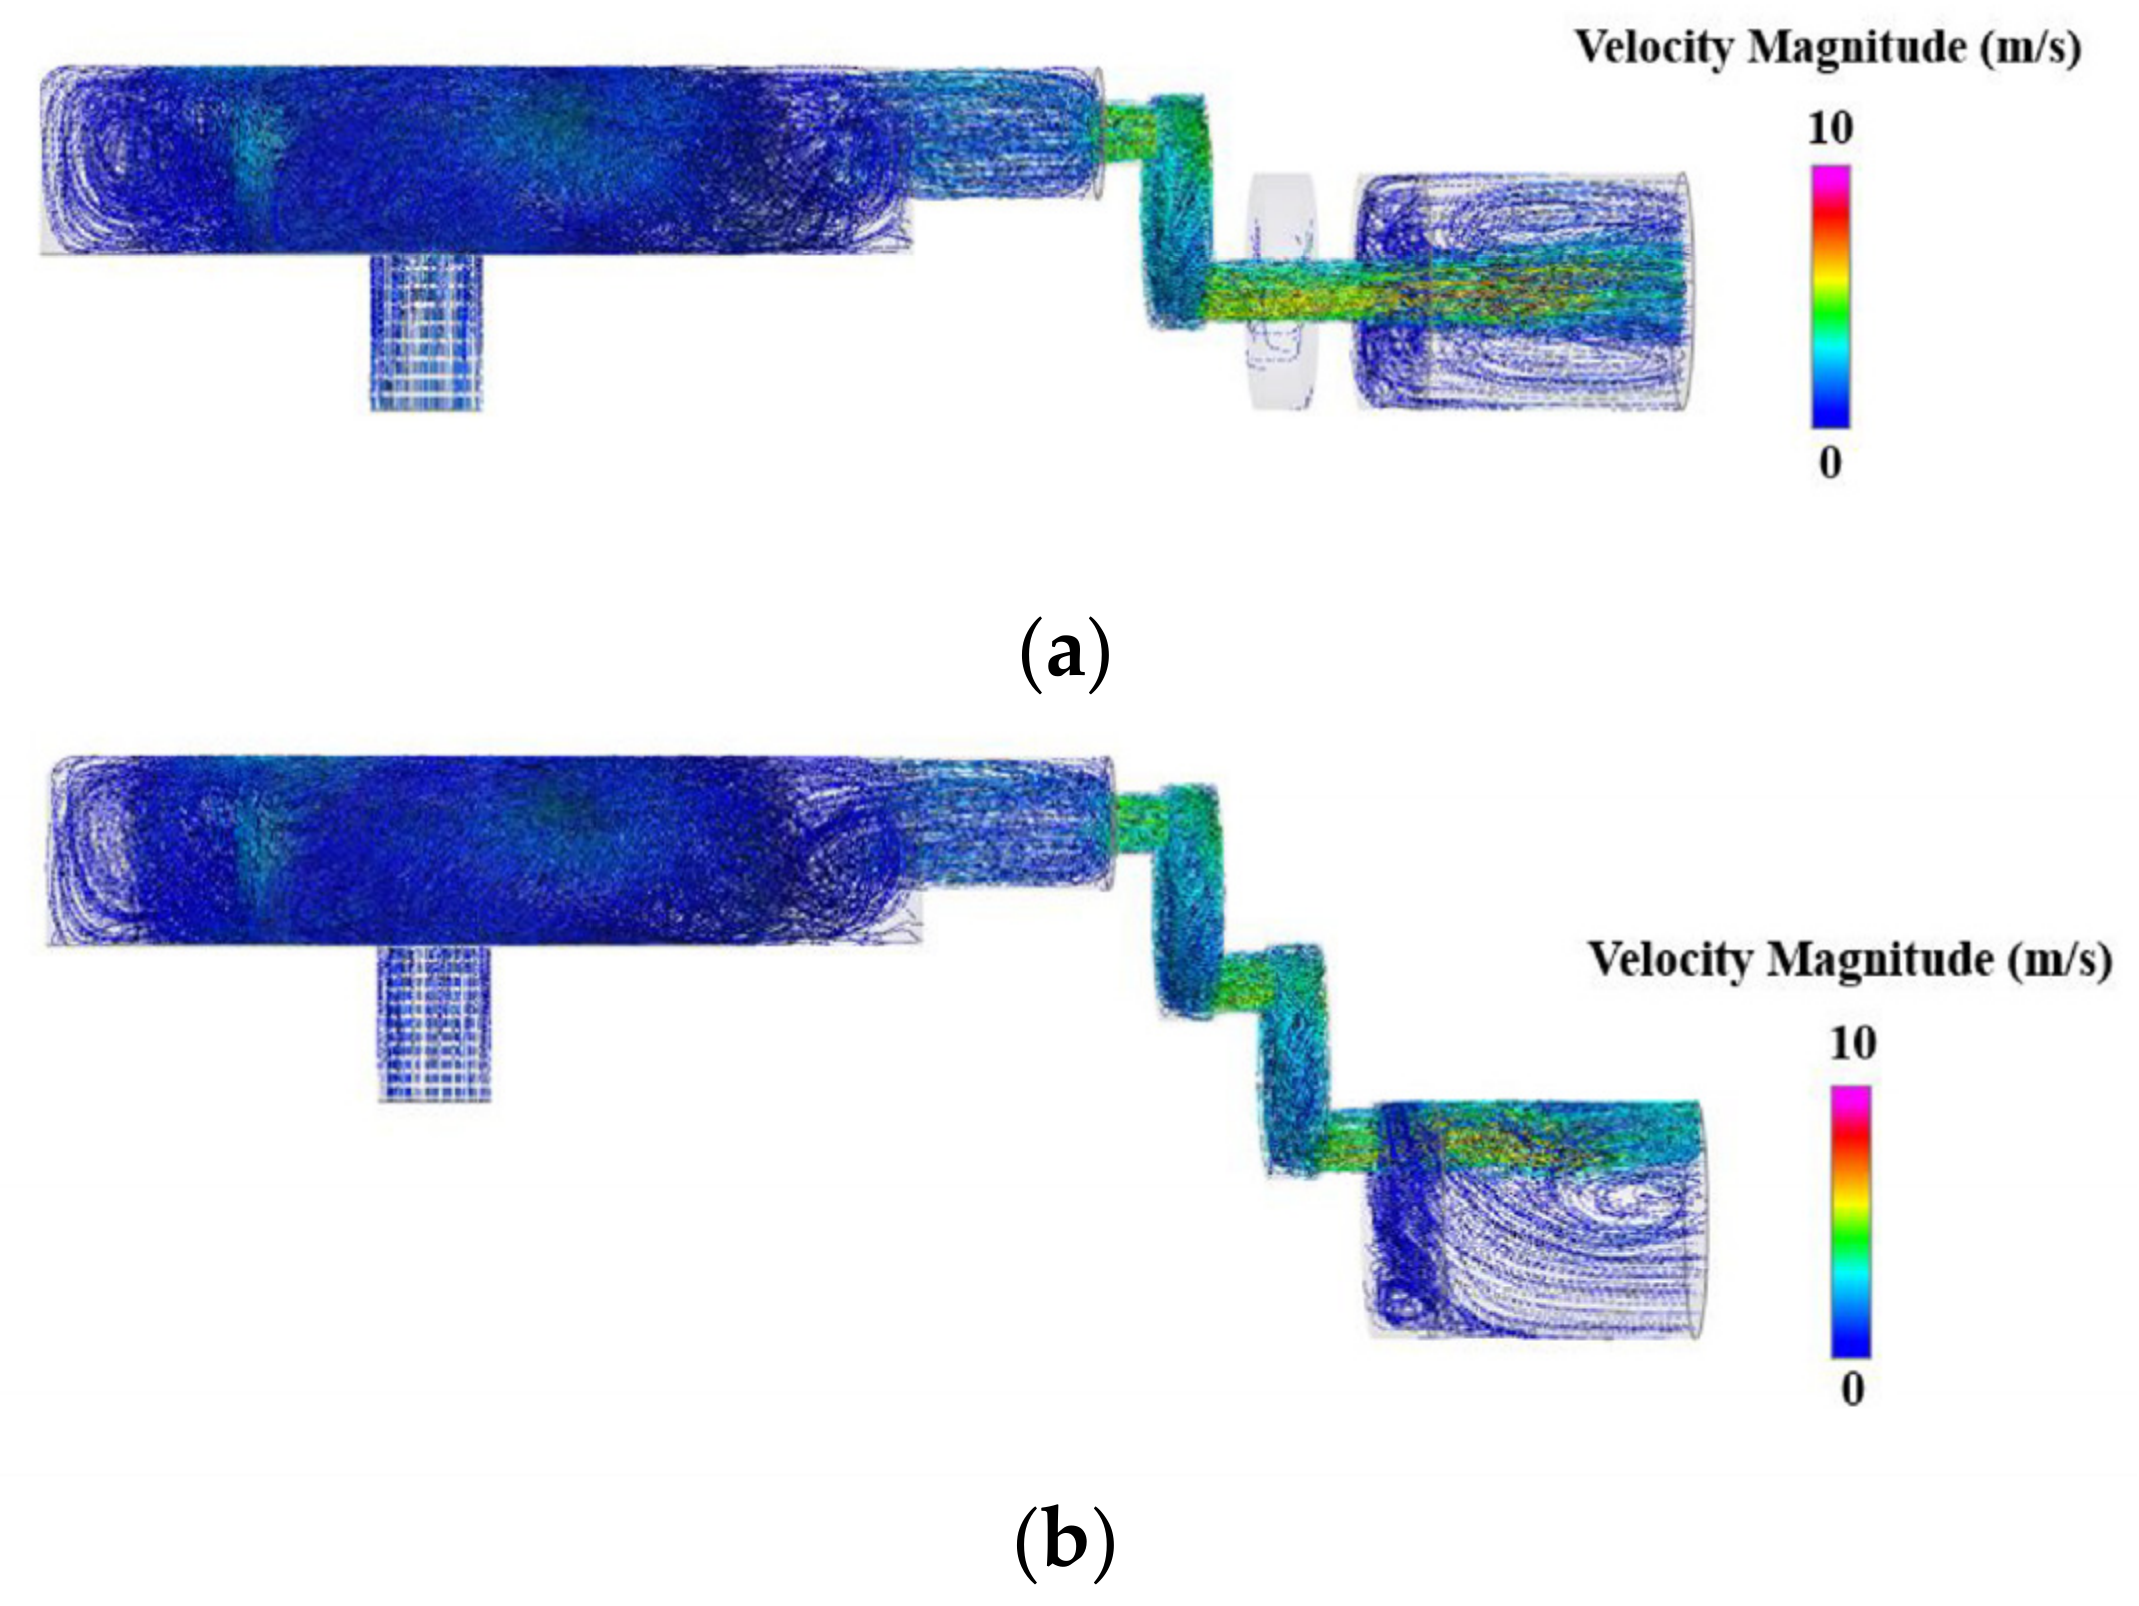
Figure 14 compares the streamlines inside the expansion chamber of two muffling structures, namely, δ1 = 6 mm, δ2 = −6 mm, δ3 = 0 mm, δ4 = 0 mm, δ5 = 0 mm, and δ1 = 6 mm, δ2 = −6 mm, δ3 = 6 mm, δ4 = −6 mm, δ5 = 6 mm, at the instant of 0.15 s when the simulation is completely finished. It is obviously indicated that the working fluids flow more sufficiently and uniformly in the expansion chamber of the improved model.
Figure 14.
Comparison of streamlines inside the expansion chamber of two models: (a) δ1 = 6 mm, δ2 = −6 mm, δ3 = 0 mm, δ4 = 0 mm, δ5 = 0 mm; (b) δ1 = 6 mm, δ2 = −6 mm, δ3 = 6 mm, δ4 = −6 mm, δ5 = 6 mm.
4. Discussion
Among all single muffler structures, the pressure pulsation and mass flow-rate fluctuation at the expansion chamber outlet are both minimal when δ = 12 mm, indicating that this model possesses a more stable pressure and velocity distribution at the outlet. This conclusion can be explained by the fluid dynamics mechanism in principle. The larger the offset between the centerlines of the pipelines on both sides of the muffling segment, the longer the distance working fluids need to travel inside the chamber, and the longer the time fluids dwell within the chamber. The prolongation of time that working fluids reside in the chamber can lead to more uniform flows of the fluids, and a more stable pressure behavior of the fluids that exit the chamber.
Among all double muffler models, the pressure pulsation at the outlet boundary of the expansion chamber reaches a minimum value when δ1 = 6 mm, δ2 = −6 mm, δ3 = 6 mm, δ4 = −6 mm, δ5 = 6 mm, while the mass flow-rate fluctuation reaches a minimum value when δ1 = 6 mm, δ2 = −6 mm, δ3 = 6 mm, δ4 = −6 mm, δ5 = −3 mm. Unlike the single muffler model, the best-performing double muffler models derived from objectives of minimum pressure pulsation and minimum mass flow-rate fluctuation are inconsistent. This could possibly be attributed to simulation uncertainties since the mass flow-rate fluctuation values derived from two models are extremely close.
In Table 6, the effects of flow controlling are compared between the original model, the best single muffler model, and the two best double muffler models, based on the simulation results of outlet pressure pulsation and mass flow-rate fluctuation.
Table 6.
Comparison between models based on outlet pressure pulsation and mass flow-rate fluctuation.
According to the data in Table 6, the best double muffler model 2 is better on mass flow-rate fluctuation by 0.05 percentage points, while the best double muffler model 1 is better on pressure by 3.51 percentage points. According to previous GCI analysis, the uncertainty of the mesh on the mass flow-rate fluctuation can reach 1.53%, which is larger than 0.05%. Other uncertainties may include the time-step uncertainty and the numeric scheme uncertainty.
The original model is rerun with both halved and doubled time steps. The result is that halving the time step changed the outlet pressure pulsation by 7.2% and the mass flow-rate fluctuation by 1.4%, and doubling the time step changed the outlet pressure pulsation by 10.5% and the mass flow-rate fluctuation by 3.0%. The pressure peak, which is governed by the short discharge transient, is therefore only partly converged in time, whereas the mass flow-rate fluctuation is converged to within 3%. This uncertainty in mass flow-rate fluctuation can also lead to a difference of 0.05 percentage points between model 1 and model 2.
A further analysis into the FFT of the outlet pressure demonstrates that halving or doubling the time step changes the pressure amplitude at the fundamental frequency (33.3 Hz) by less than 1.5% (0.12 dB). Although the peak-to-peak pressure value varies by up to 10.5%, which we would attribute to the short discharge transient, whose high-frequency content is not fully resolved at the larger steps, the relative conclusions are insensitive to the time step. Absolute peak values should be regarded as having a temporal uncertainty of roughly 7%.
The numeric scheme for velocity and pressure is first-order upwind, and will damp the pulsation amplitudes being measured. To quantify the numerical dissipation, we rerun the original model, the best single-muffler model (Model 9), and the best double-muffler model 1 with a second-order scheme. The pressure pulsation values of these three models are, respectively, 3810 Pa, 2470 Pa, and 1950 Pa, and the mass flow-rate fluctuation values are 0.04774 kg/s, 0.02205 kg/s, and 0.01818 kg/s. The percentage reductions in pressure pulsation and mass flow-rate fluctuation are as follows: best single-muffler model -> original model: 35.17%/53.81%, best double-muffler model 1 -> original model: 48.82%/61.92%. The differences between the original calculated percentage reductions using the first-order upwind numeric scheme, and the results using the second-order scheme, are all less than 1%: the largest difference is 0.91 percentage points, belonging to the pressure pulsation percentage reduction between the best double muffler model 1 and the original model. The differences are quite small, as Table 7 below illustrates.
Table 7.
Comparisons of first-order upwind and second-order upwind numeric schemes on different models.
The scheme sensitivity moves the double muffler mass flow-rate reduction by 0.34 points, and the mesh and time-step studies give mass flow-rate uncertainties of about 1–1.5%. So, the two models are indistinguishable on mass flow-rate, and the best double muffler model 1 is clearly better on pressure.
According to the theory of Lighthill acoustic analogy, although the mass flow-rate flow exerts a more direct impact on the quadratic Reynolds inertial stress source term, the pressure pulsation acts as the fundamental excitation of periodic flow disturbance in the expansion chamber. Minimizing pressure pulsation can simultaneously reduce both the global velocity fluctuation in the chamber and the dipole noise induced by periodic wall pressure impact.
Frequency analysis of the inlet and outlet pressure of the original model, the best single muffler model 9, and the best double muffler model 1 gives the attenuation values in dB of the first harmonics as in Table 8.
Table 8.
Attenuation values in dB of the first harmonics of three models.
According to the values in the table, the best single muffler model 9 adds about 5–6 dB at all three harmonics compared to the original model. The best double muffler model 1 adds 12.3, 8.7 and 5.3 dB. The additional attenuation of the second muffler is therefore concentrated at the lowest frequencies and decreases with frequency, consistent with a volume acting as a low-pass flow reservoir and unlike the oscillating transmission loss of a plane-wave expansion chamber, which is small at these low frequencies.
The overall principle of obtaining a numerical model that enhances the flow field performance should be increasing the offset between centerlines of pipelines on the left and right sides of the muffling segment, extending the time and distance of working fluids movement, and enabling a sufficient and uniform flow inside the chamber. This conclusion is consistent with that of single muffler model in principle.
Another calculation is performed to understand the residence time in Table 9.
Table 9.
Calculation of residence time of three models.
The fluid volume between the inlet and outlet planes decreases slightly with the mufflers (48,040, 46,162, and 45,222 mm3), whereas the mean mass flow falls from 0.00969 to 0.00324 and 0.00269 kg/s. The mean-flow residence time τ = ρV/ṁ therefore increases by factors of 2.9 and 3.4, almost entirely owing to the reduced throughput. The mean flow decreases by about two-thirds and this is a cost of the design. The effect on compressor work and COP would require a system-level model and is left for future work.
The present results are based solely on numerical simulation and have not been validated against experimental measurements of pressure or mass flow on the production compressor. The absolute magnitudes of the predicted pulsation reductions therefore carry model uncertainty, including that of the turbulence closure, the thermodynamic model, and the boundary conditions. The study should be read as a comparative assessment of muffler configurations under identical conditions. Experimental verification with dynamic pressure measurements on a compressor test bench is planned as future work.
5. Conclusions
This paper establishes a numerical model of the expansion chamber of a mass-produced automotive HVAC compressor. The pressure values at the chamber inlet and the condenser-side pressure conditions are defined, and other parameters of working fluids like density, viscosity, thermal conductivity, enthalpy, and temperature are set. The pressure and mass flow curves at the expansion chamber outlet are calculated, and pressure pulsation and mass flow-rate fluctuation values are obtained. Through mesh independence verification, the mesh resolution is set to 6× reference values to make a balance between computational efficiency and accuracy.
Single muffler models and double muffler models are designed in order to enhance flow performance at the outlet boundary of the expansion chamber. Regarding the single muffler model, a muffling segment with a length of 4 mm is separated from the original discharge segment. Multiple muffler models are generated by adjusting the offset (δ) between centerlines of pipelines on both sides of the muffling segment. Analysis of these models reveal that pressure pulsation and mass flow-rate fluctuation values reach minimum values when δ = 12 mm.
Based on the structure of the single muffler model, another muffling segment with length of 4 mm is separated from the original discharge segment to form two consecutive mufflers, which is called the double muffler model in this paper. Multiple double muffler models are generated by adjusting the offsets between the centerlines of pipelines on both sides of two muffling segments, namely δ1, δ2, δ3, δ4, and δ5. Analyses on these models reveal that the pulsating pressure value at the outlet is minimal when δ1 = 6 mm, δ2 = −6 mm, δ3 = 6 mm, δ4 = −6 mm, and δ5 = 6 mm, while the model that yields the minimum mass flow-rate fluctuation value corresponds to the model setting parameters to δ1 = 6 mm, δ2 = −6 mm, δ3 = 6 mm, δ4 = −6 mm, and δ5 = −3 mm. The discrepancy between the best-performing solutions derived from different criteria could be caused by the uncertainty of the simulation results.
The above research demonstrates that an effective measure to reduce the pressure pulsation at the outlet boundary is to increase the offset between the centerlines of pipelines on both sides of the muffling segment, thus extending the time and distance of fluid movement and facilitating the sufficient and uniform flow of fluids inside the chamber. However, this could cause a decrease in the mean mass flow and this is a potential cost of the design. The effect on compressor work and COP would require a system-level model and is left for future work.
The study should be read as a comparative assessment of muffler configurations under identical conditions. Experimental validation and a dedicated acoustic radiation analysis of the present compressor geometry are identified as a direction for future work.
Author Contributions
Conceptualization, Y.T.; methodology, Y.T. and L.H.; software, Y.T. and L.H.; validation, Y.T.; formal analysis, Y.T.; investigation, Y.T., L.H. and C.Z.; resources, Y.T. and C.Z.; data curation, Y.T.; writing—original draft preparation, Y.T.; writing—review and editing, Y.T.; visualization, Y.T.; supervision, D.S.; project administration, Y.T.; funding acquisition, Y.T. All authors have read and agreed to the published version of the manuscript.
Funding
This research received no external funding.
Data Availability Statement
Data are contained within the article.
Conflicts of Interest
The authors declare no conflicts of interest.
Abbreviations
The following abbreviations are used in this manuscript:
| ASI | Acoustic–Structure Interaction |
| BEM | Boundary Element |
| BEV | Battery Electric Vehicle |
| BNS | Broadband Noise Source |
| CAA | Computational Aeroacoustics |
| CFD | Computational Fluid Dynamics |
| CMOPSO | Competitive Multi-Objective Particle Swarm Optimization |
| COP | Coefficient of Performance |
| FCEV | Fuel Cell Electric Vehicles |
| FEM | Finite Element |
| FSI | Fluid–Structure Interaction |
| FW-H | Ffowcs Williams–Hawkings |
| HRC | Hermetic Reciprocating Compressor |
| HVAC | Heating, Ventilation, and Air Conditioning |
| ICE | Internal Combustion Engine |
| IDV | Intermediate Discharge Valve |
| LES | Large Eddy Simulation |
| NEV | New Energy Vehicle |
| NVH | Noise, Vibration, and Harshness |
| N-S | Navier–Stokes |
| OEM | Original Equipment Manufacturer |
| PHEV | Plug-in Hybrid Electric Vehicle |
| R&D | Research and Development |
Nomenclature
| Symbol/Abbreviation | Description |
| c0 | Speed of Sound in Quiescent Far-field Medium |
| δ | Offset Between Centerlines of Adjacent Boundaries |
| ∆ij | Kronecker delta function |
| f | Body Force Vector Per Unit Mass |
| i | Unit Vector in x Direction |
| j | Unit Vector in y Direction |
| k | Unit Vector in z Direction |
| p | Pressure |
| Pin | Inlet Pressure |
| Pcon | Condenser-Side Pressure |
| Pout | Outlet Pressure |
| ρ | Density |
| ρ0 | Average Density |
| t | Time |
| τ | Viscous Stress Tensor |
| τij | Viscous Stress Tensor |
| Tij | Lighthill Stress Tensor |
| u | Three-dimensional Velocity |
| ui,uj | Rectangular Components of Velocity Vector |
| xi,xj | Spatial Coordinate Components |
References
- Gao, F.; Yang, B.; Li, X.; Wu, J. Noise Analysis and Structural Optimization of Automobile Scroll Compressor Air Valve. Appl. Sci. 2024, 14, 4875. [Google Scholar] [CrossRef] [Scilit]
- Saur, L.; Heidegger, P.; Naeger, C.; Becker, S. Reduction of Flow-Induced Noise in Refrigeration Cycles. SAE Int. J. Adv. Curr. Pract. Mobil. 2024, 7, 1230–1239. [Google Scholar] [CrossRef] [Scilit]
- He, Y.; He, X.; Chen, L.; Wang, J.; Zhao, Y.; Ren, Z. Flow Field Noise Analysis and Noise Reduction Research of Twin-Screw Air Compressor Based on Multi-Field Coupling Technology. Machines 2024, 12, 577. [Google Scholar] [CrossRef] [Scilit]
- Huang, Y.; Yan, B.; Zhang, H.; Wang, C.; Wang, J.; Zhang, Z.; Huang, Q.; Zhan, X. Transmission Loss Characteristics of Dual Cavity Impedance Composite Mufflers for Non-Planar Wave Cavity Resonance. Appl. Sci. 2024, 14, 6879. [Google Scholar] [CrossRef] [Scilit]
- Huang, Y.; Fan, Q.; Wang, X.; Liu, Z.; Shi, Y.; Liu, C. Study on Acoustic Metamaterial Unit Cells: Acoustic Absorption Characteristics of Novel Tortuously Perforated Helmholtz Resonator with Consideration of Elongated Acoustic Propagation Paths. Materials 2025, 18, 3930. [Google Scholar] [CrossRef] [Scilit] [PubMed]
- Rahmani, N.; Khastavan, Y.; Variani, A.S.; Ahmadi, S. Compressor pulsation noise attenuation using reactive silencer with various configurations: A theoretical and experimental study. Heliyon 2024, 10, e27263. [Google Scholar] [CrossRef] [Scilit] [PubMed]
- Li, F.; Yuan, W.; Ma, Y.; Fu, J. Structural Performance Analysis and Optimization of Small Diesel Engine Exhaust Muffler. Processes 2024, 12, 2186. [Google Scholar] [CrossRef] [Scilit]
- Saadabadi, M.; Samimi, M.; Hosseinlaghab, H. Organized Computational Measurement to Design a High-Performance Muffler. Metrology 2023, 3, 254–279. [Google Scholar] [CrossRef] [Scilit]
- Catak, N.O.; Arslan, E.; Lazoglu, I. Enhancing acoustic performance of refrigerator compressors through muffler modeling and optimizing via discharge pressure. Int. J. Refrig. 2025, 180, 393–406. [Google Scholar] [CrossRef] [Scilit]
- Li, S.; Yang, H.; Yin, A.; Yu, G. Vibration and Pressure Pulsation Elimination in a Reciprocating Compressor Suction System Using an Acoustic Filter. Sci. Rep. 2024, 14, 81527. [Google Scholar] [CrossRef] [Scilit] [PubMed]
- Liu, X.; Guo, S.; Wang, Y.; Wang, D.; Wang, G.; Li, H. CFD-based unsteady simulation and performance analysis of scroll compressor. Int. J. Refrig. 2025, 170, 150–163. [Google Scholar] [CrossRef] [Scilit]
- Hu, H.; He, S.; Yin, X.; Song, Y.; Yang, X.; Cao, F.; Sun, M. Computational fluid dynamics (CFD) study on the pressure uniformity of symmetric working chambers in a scroll compressor for electric vehicle thermal systems. Energy Storage Sav. 2025, 4, 157–165. [Google Scholar] [CrossRef] [Scilit]
- Zhao, Z.; Wang, C.; Wu, J. Influence of asymmetrical features of scroll plates on thermodynamic processes and orbiting scroll dynamic characteristics of electric vehicle scroll compressors. Int. J. Refrig. 2025, 174, 270–285. [Google Scholar] [CrossRef] [Scilit]
- Li, K.; Tan, Z.; Mohtaram, S.; Tian, Y.; Liu, N.; Zhang, H.; Yan, J.; He, Q.; Li, C.; Yang, T. Injection performance analysis of scroll compressors with varying spiral turn configurations for electric vehicle applications: An experimental approach. Int. J. Refrig. 2025, 177, 65–78. [Google Scholar] [CrossRef] [Scilit]
- Fiquet, A.; Dombard, J.; Poujol, N.; Duquesne, P. Numerical Investigation of a Transonic Centrifugal Compressor at High Rotational Speed. In Proceedings of the 15th European Conference on Turbomachinery Fluid dynamics & Thermodynamics, Budapest, Hungary, 24–28 April 2023. [Google Scholar] [CrossRef] [Scilit]
- Yang, M.; Shao, S. Numerical investigation on scroll compressor with intermediate discharge valve for VRF annual performance promotion. Int. J. Refrig. 2024, 168, 758–767. [Google Scholar] [CrossRef] [Scilit]
- Vivarelli, G.; Qin, N.; Shahpar, S. A Review of Mesh Adaptation Technology Applied to Computational Fluid Dynamics. Fluids 2025, 10, 129. [Google Scholar] [CrossRef] [Scilit]
- Choi, J.; Son, Y.; Kim, H.; Lee, S. Acoustic excitation source modeling for flow-induced noise of hermetic compressor using FSI analysis. J. Mech. Sci. Technol. 2024, 38, 5979–5987. [Google Scholar] [CrossRef] [Scilit]
- Hu, L.; Qin, Y.; Ruan, B.; Wan, Y.; Wang, B.; Tian, R.; Quan, N. Cavitation noise suppression in automotive heat pumps via vapor-doped supercavitation. PLoS ONE 2025, 20, e0325719. [Google Scholar] [CrossRef] [Scilit] [PubMed]
- Mo, J.-O.; Choi, J.-H. Numerical Investigation of Unsteady Flow and Aerodynamic Noise Characteristics of an Automotive Axial Cooling Fan. Appl. Sci. 2020, 10, 5432. [Google Scholar] [CrossRef] [Scilit]
- Lighthill, M.J. On Sound Generated Aerodynamically. I. General Theory. Proc. R. Soc. London. Ser. A Math. Phys. 1952, 211, 24. [Google Scholar] [CrossRef] [Scilit]
- Kim, C.; Ha, N. A Study on the Vibration and Noise Reduction of Scrolling-Type Electric Compressor for Electric Vehicles. World Electr. Veh. J. 2025, 16, 126. [Google Scholar] [CrossRef] [Scilit]
- Ma, K.; He, Z.; Li, D.; Zhou, M.; Chen, W. Main discharge valve dynamics in variable wrap height compressors for electric vehicles: Decoupled FSI modeling with experimental validation. Results Eng. 2025, 27, 106795. [Google Scholar] [CrossRef] [Scilit]

Disclaimer/Publisher’s Note: The statements, opinions and data contained in all publications are solely those of the individual author(s) and contributor(s) and not of MDPI and/or the editor(s). MDPI and/or the editor(s) disclaim responsibility for any injury to people or property resulting from any ideas, methods, instructions or products referred to in the content. |
© 2026 by the authors. Licensee MDPI, Basel, Switzerland. This article is an open access article distributed under the terms and conditions of the Creative Commons Attribution (CC BY) license.