


Abstract
Regenerative braking control in a hybrid electric vehicle must be evaluated at both the brake and powertrain levels, and additional recovered energy does not necessarily imply lower fuel consumption. This study examines a preview-aware C3 controller for a midsize parallel P2 hybrid electric vehicle against a causal, state-of-power-constrained C2 controller. C3 changes the desired regenerative torque share during braking and modifies the SOC target and power allocation before predicted deceleration. The controllers were evaluated on FTP-75, WLTP Class 3b and US06 using 100 matched realizations of six uncertain factors per cycle (300 C2–C3 pairs). Mean battery-recovered energy increased by 1.751%, 1.420% and 4.083%, while friction braking energy decreased by 5.100%, 4.393% and 11.842%, respectively. All 300 pairs favored C3 on the three braking metrics. Full-cycle factorial ablations attributed the nominal recovery gain primarily to the braking-torque allocation channel. SOC target preparation alone yielded negligible additional recovery at the tested initial SOC. With the stated algebraic terminal-SOC correction, mean fuel effects were −0.171%, −0.439% and +0.118%, respectively, where positive values indicate a reduction. Direct SOC-matched checks preserved the cycle-dependent sign, but the US06 advantage was only about 0.03–0.05%. Thus, the robust braking-energy benefit and the small, cycle-dependent fuel response arise from distinct control mechanisms. Improved recuperation alone does not establish a fuel-economy benefit.
1. Introduction
The energy efficiency of a hybrid electric vehicle (HEV) is determined not only by the operating characteristics of the internal combustion engine and electric machine but also by how effectively the control system coordinates their operation during transient conditions. Braking is particularly important in this context because part of the vehicle kinetic energy can be converted into electrical energy by the electric machine and returned to the traction battery instead of being dissipated by the friction brakes. Recent reviews treat regenerative braking as a multi-criteria problem in which the energy recovery benefit must be balanced against braking stability, ride comfort, permissible electric-machine operating conditions and battery charge acceptance [1]. At the same time, regenerative braking cannot be assessed independently of hybrid powertrain energy management. Reviews of model predictive control and intelligent connected energy management strategies show that locally maximizing a single energy flow does not necessarily minimize the total energy expenditure over a complete trip [2,3].
In a parallel HEV, regenerative braking forms part of a broader torque-allocation process involving the electric machine, friction braking system and, depending on the transmission state, the combustion-engine branch of the powertrain. Recent energy management studies demonstrate a clear transition from static rule-based approaches toward hierarchical and predictive architectures. At the same time, they emphasize the need for interpretable control algorithms that can be implemented in real time while explicitly respecting physical constraints [4,5]. This is especially relevant to the P2 architecture, in which the electric machine is positioned upstream of the transmission. The generator torque available at the wheels therefore depends on machine speed, gear ratio, clutch state and battery limitations. Consequently, the principle of applying the maximum possible electric braking torque first should be regarded only as an initial heuristic rather than a complete control strategy.
In modern braking systems, the requested braking force is produced through coordinated blending of regenerative and friction braking. Mariani et al. [6] formulated this task as a constrained optimization problem over a prediction horizon, accounting for electric-machine efficiency, rated operating limits, the feasible braking region and comfort requirements. In the configuration considered in that study, approximately 18% of the vehicle kinetic energy was recovered. Chen et al. [7] combined fuzzy Twin Delayed Deep Deterministic Policy Gradient (TD3) control with braking intensity recognition and sliding-mode control to coordinate regenerative and hydraulic braking under both normal and emergency conditions. Koch et al. [8] showed that torque redistribution between the electric drive and wheel brakes can excite torsional oscillations and reduce braking smoothness. Braking performance is therefore determined not only by the amount of energy recovered but also by accurate tracking of the driver braking demand, continuity of the total braking torque and the absence of undesirable switching between braking actuators.
The further development of blended braking algorithms is associated with the explicit consideration of safety and configuration constraints. Hosseini Salari et al. [9] proposed an analytical braking-torque distribution method that accounts for electronic brake-force distribution, tire–road adhesion, electrical limitations and regulatory requirements. For a P2 plug-in hybrid electric vehicle (PHEV), Dong et al. [10] used downshifting to move the electric machine into a more favorable generating region and introduced threshold-based logic to suppress excessive gear shifting. Experimental results reported by Lee et al. [11] further confirmed that the effect of regenerative braking intensity on net energy consumption depends on the vehicle speed regime and road conditions. These studies highlight two important aspects: the available regenerative power varies over time, and the effect of a given control strategy cannot be assumed to remain invariant across driving cycles with different dynamic characteristics.
Another line of research combines braking control with the prediction of future operating conditions. Wu et al. [12] proposed a coordinated design of braking-force distribution and energy management based on short-term vehicle-speed prediction. Ruan et al. [13] employed hierarchical learning to allocate traction and regenerative torques in a multimode powertrain. In a more recent study, Naseri et al. [14] directly incorporated the dynamic battery charging-power limit into the allocation of regenerative and friction braking. Reusser et al. [15] demonstrated the feasibility of bidirectional power flow in a hybrid electric drivetrain controlled by model predictive control (MPC). Despite differences in the underlying algorithms, these approaches share a common feature: a fixed regenerative braking ratio is replaced by a state-dependent constraint that varies with the current operating conditions.
Battery charge acceptance constitutes a separate physical limitation that cannot be represented solely by an upper battery state-of-charge (SOC) threshold. The State of Power defines the maximum power that the battery can deliver or absorb over a specified time interval without violating current, voltage, temperature and internal-state constraints. Wu et al. [16] investigated how SoP estimation depends on equivalent-circuit parameters and the duration of the prediction horizon. Guo and Shen [17] determined the admissible battery power from a combined set of constraints over an extended prediction window, thereby defining a dynamic safe operating region. A recent review by Shen et al. [18] classifies SoP estimation methods into map-based, model-based, data-driven and multi-state co-estimation approaches while emphasizing the trade-off between accuracy, robustness and computational complexity.
The validity of regenerative braking constraints also depends on the accuracy of SOC and battery-state estimation. Methods based on variable-gain techniques and sliding differentiators can capture nonlinear changes in battery parameters under standardized load profiles [19]. Real-world HEV and electric vehicle (EV) testing reported by Jeong et al. [20] showed that system-level energy consumption is jointly influenced by the SOC-sustaining strategy, temperature and trip characteristics. This implies that increasing regenerative braking torque without first creating sufficient battery charge headroom may fail to increase the amount of energy accepted by the battery. For a hybrid powertrain, this has an additional consequence: creating SOC headroom before an anticipated braking event may require an earlier redistribution of power between the internal combustion engine and the electric machine.
Predictive energy flow control in HEVs has primarily evolved toward the joint optimization of operating modes, power distribution and SOC trajectories. Guo et al. [21] combined predictive energy management with transient-process coordination and simultaneous power allocation. Liu et al. [22] used driving-cycle prediction to adapt an equivalent consumption minimization strategy, while Gao et al. [23] integrated speed prediction, driver intention and light detection and ranging (LiDAR) data. Compared with adaptive ECMS without prediction, fuel-economy improvements of 1.3–2.7% were reported together with improved charge sustenance. These results demonstrate the informational value of future speed profiles. However, most such strategies focus on overall torque allocation rather than on proactively creating battery charge headroom specifically before braking events.
The practical implementation of predictive control also requires supervision of internal powertrain states. Han et al. [24] incorporated electric-machine thermal dynamics into a predictive energy management strategy (EMS) and showed that neglecting thermal constraints may lead to overestimation of the achievable benefit. Wang et al. [25] included the frequency of mode transitions in the objective function because excessive switching can reduce both efficiency and practical implementability. For a parallel HEV, model-predictive static programming was shown by Biswas et al. [26] to provide constrained multi-objective optimization at a computational cost compatible with online application. Taken together, these studies support the use of a predictive yet structurally compact strategy in which each control action has a clear physical interpretation.
Uncertainty in the future driving cycle remains a fundamental limitation of deterministic predictive control. Scenario MPC [27] uses multiple realizations of future power demand instead of a single exact forecast. In the uncertainty-oriented strategy proposed by Zhang et al. [28], a hybrid deep learning model was combined with robust predictive control to compensate for stochastic power-demand fluctuations and modeling errors. Xue et al. [29] proposed a hierarchical architecture that separates speed planning from energy management, whereas Li et al. [30] combined prediction of the preceding vehicle speed with motion planning and energy allocation. Therefore, nominal testing on a single driving cycle is insufficient to establish whether the regenerative braking benefit remains robust to variations in vehicle parameters, battery characteristics and external disturbances.
More recent studies aim to reduce the dependence of control on complete a priori information. Cai et al. [31] planned the SOC trajectory using low-granularity information about the future route while maintaining near-optimal performance and robustness to prediction errors. Hierarchical control for uncertain road scenarios proposed by Tang et al. [32] combines adaptive speed planning, prediction of the reference SOC trajectory and dynamic tuning of energy management parameters. Chen et al. [33] introduced an analytical online solution with driving-cycle recognition and demonstrated its feasibility in simulation studies. Even in these works, however, the effect is generally evaluated separately for predefined scenarios. Formal paired analysis of the same uncertain parameter set across driving cycles with different dynamic characteristics remains uncommon.
The fuel criterion requires particular attention in charge-sustaining HEVs. If two strategies complete a driving cycle at different SOC levels, the direct difference in fuel consumption includes a hidden exchange between the chemical energy of the fuel and the electrical energy stored in the battery. Sauermann et al. [34] compared six methods for compensating terminal SOC differences and showed that neglecting this correction can distort EMS optimization results. In the authors’ previous study [35], a unified control-oriented model of a midsize P2 HEV revealed a pronounced dependence of speed-tracking error, fuel consumption, battery depletion and electric-machine loading on the characteristics of the FTP-75, HWFET and US06 driving cycles. That model provides a verified basis for further investigation of regenerative braking, but it does not by itself answer whether the energy benefit of a predictive strategy remains robust under cross-cycle and parametric variability.
Recent HEV energy management studies provide useful comparisons while addressing different control questions. Han et al. [36] used a Nash deep Q-network to balance fuel use, battery SOC and battery-life objectives in an off-road hybrid. Zhou et al. [37] coupled online driving-condition identification with an adaptive deep deterministic policy-gradient power-distribution controller. Liu et al. [38] combined preceding-vehicle intention recognition, speed planning and power management in a connected plug-in hybrid. These approaches optimize broader operating decisions instead of testing the separate contributions of braking-torque allocation and preparatory SOC control in paired, fixed-plant comparisons.
The literature leaves four issues pertinent to the present comparison. First, the effects of preview-dependent brake-torque allocation and pre-braking SOC management are often combined, making their individual contributions difficult to identify. Second, nominal-cycle comparisons alone do not establish whether a paired advantage persists under common plant-parameter uncertainty. Third, recovered energy and trip-level fuel consumption are not always assessed together at a comparable terminal battery state. Fourth, the sensitivity of an apparent fuel benefit to the SOC-equivalence assumption and to the driving cycle is seldom made explicit.
This study evaluates a preview-aware regenerative braking strategy C3 for a midsize parallel P2 HEV and identifies which of its two channels accounts for the observed response. Relative to causal C2 strategy, C3 uses a proxy for forthcoming braking energy to alter the desired regenerative share during braking and to adjust the supervisory SOC target, charging permission and preparatory power split. The physical upper SOC bound remains fixed. Both strategies satisfy the same electric-machine, battery charging, low-speed fade-out and total braking-torque constraints. Matched uncertainty runs, channel ablations and fuel-equivalence checks are used to distinguish a braking-energy gain from a charge-sustaining fuel benefit.
The methodological contribution is the separation of the two preview-dependent control channels and their evaluation with matched plant-parameter realizations and terminal-SOC checks. The availability of a future speed profile is not itself claimed as novel. The study tests three hypotheses: C3 increases energy returned to the battery during braking (H1); reduces friction braking energy and raises the regenerative braking ratio without violating the common constraints (H2); and lowers fuel consumption at an equivalent terminal battery state (H3). H3 is evaluated independently of the braking-energy hypotheses.
2. Materials and Methods
2.1. Parallel HEV Model and Physical Constraints
The study was conducted using a control-oriented model of a midsize parallel full hybrid electric vehicle with a P2 powertrain architecture. The internal combustion engine and bidirectional electric machine are connected to a common transmission input shaft. The electric machine operates in both motoring and generating modes, while the portion of the braking demand that cannot be provided electrically is assigned to a separate friction braking channel. The model includes a quasi-static internal combustion engine, a motor–generator represented by characteristic maps, a Thevenin-equivalent battery model, a fixed-ratio transmission and the longitudinal vehicle dynamics. This level of model fidelity preserves the energy interactions required for regenerative braking analysis without introducing fast electromagnetic or thermodynamic processes that are outside the scope of the present study.
The nominal plant is a class-level research benchmark, not a digital replica of a named production HEV. Its parameters include a 1650 kg vehicle, a 190 N·m engine torque plateau, a 60 kW peak electric machine and a 360 V/5 Ah battery with 1.8 kWh nominal energy. The model parameter file also contains a nominal 105 kW engine-power label, but this value is not enforced by the active torque–speed envelope. That envelope delivers a maximum of approximately 70.6 kW over its 700–5500 rpm calibration interval, and operation beyond 5500 rpm is not independently power-limited. Thus, 105 kW must not be presented as the realized engine rating of the simulated plant. Component envelopes, efficiency maps, battery limits and supervisory thresholds were specified for comparative control experiments, not identified from manufacturer test data.
The 60 kW electric-machine setting was inherited from the preceding proportional–integral–derivative (PID)-controlled Simulink implementation underlying [35]. The 1650 kg mass, 360 V/5 Ah battery and fixed 2.8 × 3.5 reduction were selected for the present benchmark. The production 2020 Kia Optima Hybrid EX [39] was chosen as an external scale comparator. Its traction motor, traction battery and six-speed transmission slightly differ from the simulated plant. This comparison contextualizes selected nominal magnitudes and does not establish that the plant was derived from or validated against the Kia vehicle.
The methodological basis was the previously developed PID-controlled parallel HEV model reported in [35]. For the present study, the electrical subsystem was refined by introducing a physically consistent sign convention for battery charging and discharging, bidirectional efficiency maps, explicit friction braking and constraints on SOC, power, current, torque and rotational speed. In all configurations, the speed-tracking error ev = vref − v is supplied to the same PID controller with a filtered derivative term:
where Kp = 100, Ki = 50, Kd = 10, and N = 100. Here, vref and v are the reference and actual longitudinal speeds (m/s), s is the Laplace variable, Kp, Ki and Kd are the proportional, integral and derivative gains, and N is the derivative-filter coefficient. The operator sat[a,b](x) clips x to [a,b].
A positive control signal u generates a traction demand, whereas a negative signal corresponds to braking. The controller tuning, vehicle parameters and component constraints were identical for strategies C2 and C3. Only the supervisory torque allocation and charge-headroom management differed between the two strategies.
For the common shaft, the net shaft torque is expressed as TΣ = Te + Tm − Tfr, where Te ≥ 0 is the engine torque, Tm > 0 corresponds to motoring operation, Tm < 0 corresponds to generating operation, and Tfr ≥ 0 is the magnitude of the friction braking torque. The equivalent longitudinal vehicle dynamics are described by
where θ = 0 for the standard driving cycles considered in this study. Here, m is vehicle mass, Fx is longitudinal wheel force, g is gravitational acceleration, Crr is the rolling-resistance coefficient, ρ is air density, Cd is the drag coefficient, Af is frontal area, ηd is driveline efficiency, iΣ is the total speed-reduction ratio, and rw is the wheel radius. For this benchmark, air density is 1.225 kg/m3, the drag coefficient is 0.28, and the frontal area is 2.30 m2. Driveline efficiency is 0.92, and the wheel radius is 0.315 m. The electrical power at the battery terminals, including the auxiliary load, is calculated as
where Pb > 0 denotes battery discharge, and Pb < 0 denotes charging. The motoring and generating efficiencies, ηm and ηg, are defined by continuous quasi-static maps within the ranges 0.78–0.94 and 0.76–0.93, respectively. In (4), ωm is machine angular speed (rad/s), Paux = 500 W is the auxiliary load, and Pb is expressed in W.
The battery open-circuit voltage is defined as a function of the SOC, while the current is calculated using the physically stable branch of the Thevenin-equivalent relation:
where Ieff = Ib/ηdis during discharge, and Ieff = ηchIb during charging. In (5), Voc is open-circuit voltage (V), Ib is signed battery current (A; positive on discharge), R0 is internal resistance (Ω), Qb is charge capacity (Ah), and ηdis and ηch are the discharge and charge efficiency factors. SOC is a unit fraction in these state equations. The nominal charge and discharge factors are 0.98 and 1.00, respectively. The internal combustion engine is represented by a quasi-static torque–speed envelope and a brake-specific fuel-consumption map. The instantaneous fuel consumption is calculated as:
BSFC = 238 + 65(λT − 0.72)2 + 45(λn − 0.48)2.
In (6) and (7), χe is the binary engine-on state; and are fuel and idle fuel mass-flow rates (kg/s); Pe is engine mechanical power (kW); BSFC is brake-specific fuel consumption (g/kWh); and λT and λn are torque and speed normalized to the available torque and the 5500 rpm calibration speed, respectively. The nominal idle fuel mass-flow rate is 1.8 × 10⁻⁴ kg/s. The calculated fuel consumption is used as an internally consistent comparative metric for evaluating the control strategies rather than as a certification-level prediction for a specific production vehicle.
The value of 5500 rpm is used to normalize the engine speed in the fuel-consumption map and to define the descending branch of the torque envelope. It is therefore an explicitly stated limitation of the control-oriented model rather than a separate hard speed cutoff. The study employs a hierarchy of control configurations, C0–C3. Configuration C0 uses friction braking only. C1 applies a non-predictive allocation with a fixed desired regenerative braking share of 0.60, subject to physical availability. C2 implements causal adaptive blending of regenerative and friction braking according to deceleration intensity and the current component constraints. C3 extends C2 with a preview-dependent SOC target and preparatory power allocation and adjusts the desired regenerative share using a proxy for upcoming braking energy. Configurations C0 and C1 are used as auxiliary reference levels, whereas the main confirmatory comparison is performed for the C2-C3 pair. The corresponding energy flow and control architecture is shown in Figure 1.
Figure 1.
Control architecture for regenerative braking in a parallel P2 HEV.
2.2. Baseline C2 Strategy and Prediction-Oriented C3 Strategy
The causal C2 strategy was selected as the primary comparator. It responds to current speed, SOC, charging capability, machine torque and braking intensity but uses no future-speed information. The paired C3-C2 comparison measures the effect of the complete added C3 layer; only the factorial channel ablations can attribute that effect to preview-dependent brake allocation or SOC preparation separately.
2.2.1. Baseline C2 Strategy
When the controller output is negative, the braking demand and its normalized intensity are defined as:
In (8), b is normalized braking intensity, and Tbr,max is the maximum requested braking torque. C2 reduces the desired regenerative braking share from 0.80 under mild braking to 0.55 at the maximum braking demand:
rC2 = rmax − (rmax − rmin)bγ, rmax = 0.80, rmin = 0.55, γ = 1.5.
The physical availability of regenerative braking is governed by low-speed and SOC-dependent multipliers. Electric braking is disabled below 5 km/h, progressively activated between 5 and 10 km/h and gradually reduced as the SOC approaches its upper limit:
Here vkph is vehicle speed in km/h, ϕv and ϕSOC are the speed- and charge-availability factors, SOC is expressed as a unit fraction, and SOCmax = 0.80 is the hard upper SOC bound of the modeled battery, distinct from the 0.59 charge-sustaining target and the variable C3 target. Consequently, ϕSOC equals one at SOC ≤ 0.75, decreases linearly over 0.75 < SOC < 0.80 and reaches zero at SOC = 0.80. Lowering the C3 target within 0.55–0.59 does not, by itself, relax this physical regeneration limit.
The torque equivalent of the available battery charging power and the corresponding supervisory limit are given by:
where Pch,max = 35,000 W, , and ωε = 1 rad/s. Here, TP,ch is the charging-power-equivalent generator torque, Tg,max is the generator torque ceiling, ωsh is common-shaft angular speed, and Paux = 500 W is the auxiliary load. After this supervisory constraint is applied, the motor-battery subsystem again enforces the actual efficiency maps together with hard limits on torque, speed, power, current and SOC. The regenerative and friction braking commands are then defined as:
Thus, saturation of the electric braking channel does not reduce the total braking demand. Any torque that cannot be provided regeneratively is automatically transferred to the friction brakes. C2 also maintains a constant target value of SOCtar,0 = 0.59 by means of an additional charging torque:
2.2.2. Preview-Aware C3 Strategy
C3 is implemented as an extension of C2 and uses only the future reference speed over a prediction horizon Tp = 10 s with a sampling interval Δtp = 1 s. In a real vehicle, this profile could be provided by a navigation system, digital map, vehicle-to-everything (V2X) communication channel or traffic-prediction module. No future actual vehicle or battery states are supplied to the algorithm. The potential braking energy is estimated from positive decreases in kinetic energy:
In (14), vk is the predicted reference speed at look-ahead step k, is the assumed vehicle mass, and is the nominal recovery factor. The resulting braking-energy proxy is in kWh. This quantity serves as a monotonic indicator of an upcoming braking event rather than as a prediction of the energy that will be accepted by the battery. The normalized prediction level, requested SOC headroom and dynamic target are defined as:
where Esc = 0.020 kWh, kres = 0.25, and Ebat = 1.8 kWh. Esc scales the energy proxy, kres converts it to a target-SOC reduction, Ebat is nominal battery energy, and ΔSOCres is a unit-fraction reserve capped at 0.04 (four percentage points). Reducing the dynamic target does not directly trigger an engine start. Charging permission is switched relative to the static 59% SOC target using hysteresis: it is enabled when SOC ≤ 58.7%, disabled when SOC ≥ 59.1% and retains its previous state within this interval. Once charging permission is established, the charging torque is calculated from the dynamic target. This can suppress charging locally before an anticipated event, but it does not imply that integrated engine-driven charging decreases over a complete cycle.
In addition, C3 allows a limited increase in the electric traction contribution while the engine is already operating. The intensity of this preparatory redistribution is defined as:
In (16), λprep is the dimensionless preparation intensity, is the engine-torque request before redistribution, and Te,min is the minimum permissible engine torque while running. The torque Tprep is subtracted from the engine torque command and added to the electric-machine motoring command. This preserves the total traction torque and does not introduce an additional engine-start request. During braking, the same prediction signal q shifts the desired regenerative braking share toward 0.80:
C3 therefore changes two supervisory decisions such as the SOC target and preparatory power split before braking and the desired electric braking share during deceleration. Whether the first action yields usable charge headroom is an empirical question. The component constraints and torque-balance identity Treg + Tfr = Tbr,req remain those of C2. All C3 parameters were fixed after FTP-75 calibration; WLTP Class 3b and US06 were not retuned. The functional differences between C2 and C3 are summarized in Table 1.
Table 1.
Functional comparison of the C2 and C3 strategies.
2.3. Development Protocol and Deterministic Validation
C3 was developed on FTP-75 at an initial SOC of 60%, with checks of speed tracking, braking-torque closure, component limits, switching behavior and fuel use. The retained parameters were a 10 s prediction horizon, a 0.020 kWh braking-energy scale, a 0.25 SOC-headroom coefficient, 10 N·m maximum preparatory torque and charging-hysteresis thresholds of +0.30/−0.10 percentage points. They were held fixed for the WLTP Class 3b, US06 and uncertainty analyses. These are controller calibration values rather than measurements identified from a production HEV. This procedure established a physically admissible calibration. It was not a search for a fuel-minimizing parameter set, and no post hoc retuning to reverse the fuel penalty was performed.
C2 was the primary confirmatory comparator, C0 used friction braking only, and C1 had a fixed desired regenerative share of 0.60 under the same physical constraints. For structural checks, C3a disabled the preview channel and was compared with C2. C3b retained SOC preparation with a fixed 0.60 braking share and was therefore compared with C1. A separate full-factorial test combined C2 with brake-allocation only (C6), SOC-preparation only (C7) and both channels (C3). These nominal full-cycle controls diagnose mechanism but are not part of the 300-pair uncertainty ensemble.
To test the fuel accounting separately, the assumed electrical-to-battery conversion factor was checked against local model-derived marginal values and nominal pairs were rerun to a common final SOC. A continuous US06 drive-and-recharge test retained all powertrain states across the cycle boundary. Prediction stress tests included timing lags, underestimation, blackout and a causal short-horizon proxy. These targeted checks were performed after the confirmatory analysis and were not added to its 300 pairs.
Transmission-structure sensitivity was assessed separately, without changing the fixed-ratio plant used for the primary 300 C2-C3 comparisons. An auxiliary two-ratio variant used transmission ratios of 2.8 and 1.4, a 3.5 final drive and 0.92 driveline efficiency, and it shifted up at 60 km/h and down at 50 km/h. The selected ratio also entered the machine-speed estimate used in the regeneration limit. C2 and C3 were tested in six nominal runs, and 36 additional pairs formed from 12 common parameter vectors per cycle drawn from the original uncertainty design. The controller rules were otherwise unchanged. Shift and clutch transients were not modeled, and the ratios were not identified from a production transmission.
Cross-cycle similarity was evaluated using three standard speed trajectories representing urban driving, a multiphase mixed-driving regime and a short aggressive-driving scenario (Table 2). The cycles were treated as reproducible input disturbances rather than as certification procedures for determining fuel consumption or emissions. The original time base and speed profiles were neither truncated nor smoothed or rescaled.
Table 2.
Characteristics of the driving cycles.
The FTP-75 profile was obtained from the MATLAB R2025a ‘cycleFTP75’ library dataset [40]. It was used during calibration and subsequently repeated with fixed parameters to verify reproducibility. WLTP Class 3b [41,42] and US06 [43] served as out-of-calibration driving-cycle tests. For the current speed demand and the 10 s prediction vector, the same time base and the same speed array were used. The prediction therefore contained no hidden phase lead and had no access to an alternative version of the driving cycle. The deterministic test matrix comprised two strategies, three cycles and three initial SOC levels.
Initial SOC values of 50%, 60% and 70% represented conditions below, near and above the static charge-sustaining target of 59%. Within each C2-C3 pair, the plant parameters, PID controller, component limits, initial mechanical states, driving cycle and integration settings were kept identical. These three SOC levels were treated as deterministic operating-range checks rather than as statistical replicates.
2.4. Parametric Uncertainty and Statistical Analysis
The robustness of the paired C3-C2 effect was evaluated using the uncertainty-quantification design UQ-1.0 based on a randomized maximin Latin hypercube. Six independent factors were included and varied uniformly within predefined intervals (Table 3). The nominal physical entries of Table 3 (mass, rolling resistance, battery resistance and capacity) come from the control-oriented parameter set, and they were not identified from a catalog vehicle or measured fleet data. Chosen ranges represent an engineering stress-test domain of the model rather than an empirically established parameter distribution for the HEV fleet. Accordingly, the frequency with which C3 outperforms C2 is interpreted only within this domain.
Table 3.
Factors included in the UQ-1.0 parametric uncertainty design.
The parameters m, Crr, Rbat, Qbat and kη modified the physical plant and took identical values within each C2-C3 pair. The multiplier kp acted only in the predictive channel of C3. Values below or above unity represented systematic underestimation or overestimation of the future braking energy, respectively. Within each simulation, kp remained constant and therefore did not represent time-varying prediction error or random noise. The controller retained its nominal calibration in all realizations.
Among 40 candidate Latin hypercubes, the design with the largest minimum Euclidean distance between points in the normalized six-dimensional space was selected. A fixed random seed ensured a unique correspondence between the experiment number and the associated parameter vector. The same set of 100 parameter vectors was repeated over all three driving cycles with an initial SOC of 60%. The complete confirmatory series therefore comprised 100 experiments × 3 cycles × 2 strategies, giving 600 simulations and 300 paired C3-C2 effects. The three cycle-specific effects associated with the same experiment number shared an identical uncertainty vector. Accordingly, the resampling unit in the cross-cycle analysis was the complete experimental cluster rather than an individual simulation.
For each driving cycle, the mean, median, range, number of favorable pairs and empirical probability of improvement were calculated. The 95% confidence intervals (CIs) for the mean were estimated using a nonparametric percentile bootstrap with 10,000 resamples. The same experiment indices were resampled simultaneously across all three cycles. Wilson intervals were used for the proportion of favorable realizations. Conclusions regarding the direction of the effect were based jointly on the confidence interval of the mean and the frequency of favorable pairs rather than on a single nominal simulation.
Cross-cycle heterogeneity was assessed using a permutation test for repeated measures. In each of 10,000 permutations, the labels of the three driving cycles were randomly reassigned only within the same experiment. This was followed by evaluation of three prespecified contrasts: FTP-75 minus WLTP Class 3b, US06 minus FTP-75 and US06 minus WLTP Class 3b. The contrasts were assessed using a cluster bootstrap and a two-sided sign-flip test with Holm correction. The statistical significance level was set at 0.05. A realization was considered jointly favorable when the effect had the desired sign simultaneously across all three driving cycles.
Sensitivity of the results to the UQ factors was evaluated using cycle-specific partial rank correlation coefficients (PRCCs) with 2000 bootstrap samples. Differences in PRCCs between cycles were estimated using shared experiment indices. This analysis characterizes conditional monotonic relationships within the UQ-1.0 domain and is not interpreted as evidence of causal effects or higher-order non-monotonic interactions. The simulations were performed in MATLAB/Simulink R2025a using the ode15s solver with a maximum step size of 0.05 s, relative tolerance of 10−3 and absolute tolerance of 10−5. Nominal equivalence between the parameterized and baseline implementations was verified separately for C2 and C3.
2.5. Performance Metrics, SOC Correction and Acceptance Criteria
The performance metrics were calculated from the time histories of vehicle speed, braking torques, electric-machine speed, battery power, SOC and fuel consumption. Only completed simulations satisfying the requirements for driving-cycle tracking, braking-torque balance and component constraints were included in the paired analysis. For all primary effects, the sign convention was defined so that a positive value indicates an advantage of C3.
The energy actually returned to the battery during braking demand, the energy dissipated by friction braking and the total requested braking energy were calculated as:
In (18) and (19), tf is cycle duration, Ereg is battery-side braking energy, Efr is friction brake energy, Ebr,req is requested braking energy (all in kWh), and Rrec is their dimensionless recovery ratio. The divisor 3.6 × 10⁶ converts joules to kWh. The indicator in the first integral separates regenerative energy inflow from battery charging initiated by the engine. Because Rrec is defined using battery-side recovered energy in the numerator, the metric reflects both braking-torque allocation and electromechanical conversion losses. It is therefore not interpreted as the local efficiency of the motor–generator.
The primary paired effects of C3 relative to C2 were calculated as:
Thus, positive values indicate an increase in recovered energy, a reduction in friction braking losses and an increase in the regenerative braking ratio in percentage points, respectively.
Raw fuel consumption was calculated as To account for differences in the terminal energy state, the C3 result was algebraically corrected to the terminal SOC of the corresponding C2 case:
where Vnom = 360 V, ηe→b = 0.32 and Hf = LHV/3.6, with the lower heating value LHV = 43 MJ/kg. Here, Qbat,i is the realized battery capacity (Ah) for parameter vector i, SOCf is the terminal SOC in percent, Ebat,i and ΔESOC,i are energies in kWh, Hf is the corresponding fuel energy per unit mass (kWh/kg), and Δmf,SOC,i is the fuel-equivalent mass in kg. The factor 0.32 is an assumed conversion efficiency, not a fitted value. Local model-based marginal estimates of approximately 0.273–0.281 and direct final-SOC matching were therefore used as sensitivity checks. SOC-corrected percentage values throughout the main UQ results retain the prespecified 0.32 definition; values from alternative definitions are labeled separately and are not pooled with it.
In the UQ analysis, the actual battery capacity Qbat,i of each realization was used. The corrected fuel consumption and the primary fuel-consumption effect were then defined as:
If the terminal SOC of C3 was lower, the fuel-equivalent energy deficit was added to its fuel consumption. If the terminal SOC was higher, the correction became negative. Direct charge comparability of the raw fuel-consumption results was considered satisfied when ∣ΔSOCf∣ ≤ 0.5 percentage point. However, the same SOC correction was applied to all 300 paired cases. This prevents anticipatory battery depletion from being interpreted as an unconditional fuel-consumption benefit.
Secondary indicators included the difference in terminal SOC, the number and duration of engine starts, engine mechanical energy, engine-driven battery charging, total battery charging and discharging energy and preparatory-torque activity. These metrics were used to provide a mechanistic interpretation of the fuel-consumption results. They were not treated as additional confirmatory hypotheses.
The accuracy of speed tracking was characterized using the root mean square error (RMSE) and the maximum absolute error:
In (23), n is the number of sampled time points, and ev,k is evaluated in km/h after conversion of the m/s speed-error signal used by the controller. In addition, braking-torque closure and compliance with the powertrain limits were verified for each simulation:
In (24), Pb/1000 is battery-terminal power in kW, Ib is in A, Tm is in N·m, and nm is machine speed in rpm. Violation of any of these conditions, an incomplete simulation or the absence of physically expected activation of the braking channels rendered the corresponding run unacceptable, regardless of the achieved increase in recovered energy.
3. Results
3.1. Model Verification and Dataset Integrity
Nominal equivalence of the parameterized and baseline implementations, physical constraints and dataset completeness were checked on the FTP-75 cycle before evaluating paired effects. During tested run, monitored signals and engine-start counts matched within numerical precision. More decisively, full-cycle C3a results matched C2 for recovered energy, friction energy, raw fuel, terminal SOC and engine starts on all three cycles at the reported precision. Thus, disabling preview restored the causal baseline.
The full-cycle factorial control showed recovered-energy gains of 1.862%, 1.506% and 4.325% for allocation-only C6 on FTP-75, WLTP Class 3b and US06, respectively. Preparation-only C7 changed recovery negligibly on the first two cycles and by only 0.016% on US06. C3b, compared appropriately with fixed-share C1, likewise yielded only 0.000232%, 0.000062% and 0.016417% more recovery. These controls identify the brake-allocation rule as the operative nominal mechanism.
Preview stress tests supplied a separate information check. Under a full-cycle five-second phase lag, underestimation and blackout, recovered energy did not vary monotonically with speed-forecast error and blackout removed nearly all gain. A simple causal extrapolator based only on current and one-second-delayed speed still gave nominal recovery gains of 1.94%, 1.91% and 4.35%, respectively. It reacted mainly after deceleration began and is not a validated road predictor. At 76% and 79% initial SOC on US06, upper-SOC fade became active briefly, but the battery soon left that region, so these tests do not demonstrate a sustained high-SOC headroom benefit. With a five-second phase lag, nominal full-cycle recovered-energy gains relative to C2 were 3.02%, 2.38% and 6.02% on FTP-75, WLTP Class 3b and US06, and forecast blackout reduced each gain to approximately zero.
All 18 deterministic simulations, comprising two strategies, three driving cycles and three initial SOC levels, were completed successfully. The maximum speed-tracking error was 0.01876 km/h. The SOC remained within 49.64–70%, battery power ranged from −35 to +41.7339 kW, the maximum electric-machine speed reached 10,867.2 rpm, and the braking-torque balance residual was zero.
The confirmatory dataset contained 600 completed simulations, corresponding to 100 paired C2-C3 runs for each of the FTP-75, WLTP Class 3b and US06 cycles. For every cycle, experiments 1–100 were present without omissions or duplicates. Within each cross-cycle cluster, the coordinates of the UQ parameter vector matched to an absolute tolerance of 10−12.
The direct SOC-comparability criterion was satisfied for all FTP-75 and WLTP Class 3b pairs and for 73 US06 pairs. The mean terminal SOC difference, defined as C3 minus C2, was −0.116, −0.290 and −0.444 percentage points for FTP-75, WLTP Class 3b and US06, respectively. The SOC correction, calculated using the battery capacity of the corresponding realization, was therefore applied consistently to all 300 paired cases. For 27 US06 observations, this correction was essential for a charge-sustaining interpretation. Failure to satisfy the direct comparability criterion did not indicate physical invalidity because the SOC values for both strategies remained within the admissible operating range.
Within the confirmatory series, the maximum speed-tracking error was 0.00741 km/h for FTP-75, 0.00726 km/h for WLTP Class 3b and 0.0516 km/h for US06. Both active battery power limits, −35 and +45 kW, were reached on US06, but no limit violations occurred. All 600 simulations satisfied the constraints on SOC, current, battery power, electric-machine torque and speed, as well as the exact allocation of the requested braking torque.
In the auxiliary two-ratio test, all 6 nominal and 72 parameterized simulations met the speed-tracking and component-constraint criteria, and the highest common-shaft speed was 5435 rpm. For the 12 common parameter vectors on each cycle, the mean C3 gain in battery-recovered braking energy under the fixed-ratio/two-ratio plants was 1.758%/1.885% on FTP-75, 1.426%/2.173% on WLTP Class 3b and 4.082%/7.244% on US06. The corresponding SOC-corrected fuel effects were −0.184%/−0.155%, −0.454%/−0.285% and +0.126%/+0.583%, respectively (positive denotes less fuel). The mean fuel-effect sign persisted in this diagnostic subset, whereas its magnitude, particularly on US06, changed with transmission structure.
3.2. Main Effects of Regenerative Braking
The primary result of the study is the consistent improvement in all three braking-energy utilization metrics when switching from the causal C2 strategy to the prediction-oriented C3 strategy. For each driving cycle, all 100 paired realizations showed an increase in the energy returned to the traction battery, a reduction in the energy dissipated by the friction brakes and an increase in the regenerative braking ratio. Thus, a favorable effect was observed in all 300 cycle-specific comparisons for each of the three metrics. None of the 95% bootstrap confidence intervals for the mean crossed zero (Figure 2).
Figure 2.
Mean paired C3-C2 effects and corresponding 95% bootstrap confidence intervals for FTP-75, WLTP Class 3b and US06: increase in recovered battery energy, reduction in friction braking energy, increase in the regenerative braking ratio and SOC-corrected fuel-consumption effect.
On FTP-75, the mean increase in recovered battery energy was 1.751%, with a 95% confidence interval of 1.712–1.789%. For WLTP Class 3b, the corresponding value was 1.420% (1.390–1.450%), while for US06 it increased to 4.083% (4.025–4.142%). The close agreement between the medians and means, equal to 1.746%, 1.415% and 4.087%, respectively, indicates that the estimates were not driven by a small number of realizations with unusually large effects. Even the minimum values within the UQ samples remained positive: 1.308% for FTP-75, 1.074% for WLTP Class 3b and 3.370% for US06.
The mean reduction in friction braking energy was 5.100% (95% CI: 4.990–5.210%) on FTP-75, 4.393% (4.301–4.485%) on WLTP Class 3b and 11.842% (11.683–12.002%) on US06, the corresponding medians were 5.080%, 4.379% and 11.808%. The coordinated increase in recovered energy and reduction in friction work is consistent with a higher desired electric braking share, subject to the same physical limits. Exact closure of requested braking torque excludes under-delivery of the driver’s braking request as its source.
The regenerative braking ratio, which normalizes the energy returned to the battery by the total requested braking energy, increased on average by 1.044 percentage points (1.021–1.067) for FTP-75, 0.854 percentage points (0.836–0.873) for WLTP Class 3b and 2.546 percentage points (2.511–2.581) for US06. This metric complements the relative change in recovered energy because it reflects not the absolute amount of braking work over the cycle but the fraction of the available braking energy that the system was able to redirect to the battery. Its positive value in every realization confirms that the C3 benefit is not merely a consequence of differences in overall braking intensity among the individual parameter realizations. Table 4 summarizes the paired effects for the three braking-performance metrics.
Table 4.
Paired C3–C2 effects for the main regenerative braking performance metrics.
US06 showed the largest braking-related effect by every reported metric. Its more intense braking events produced a larger absolute opportunity for redistribution from friction to electric braking. This observation alone does not establish that the battery’s upper-SOC or charging-power limit constrained recovery: the SOC fade-out region begins above 75%, whereas the nominal initial SOC was 60%, and the charge limit was active for only about 0.66 s on nominal US06 and not on nominal FTP-75 or WLTP Class 3b.
For FTP-75 and WLTP Class 3b, the energy benefit was smaller but remained consistently positive throughout the entire declared uncertainty domain. For each cycle-specific estimate, the proportion of favorable realizations was 1.000, while the lower bound of the corresponding 95% Wilson interval was 0.963. Within the adopted model and UQ-1.0 domain, these results support H1 regarding increased recovered energy and the energy-related part of H2 concerning reduced friction braking use and an increased regenerative braking ratio.
3.3. Cross-Cycle Heterogeneity and Joint Robustness
Differences in effect magnitude across the driving cycles were evaluated while accounting for the repeated-measures structure of the experiment. Each experiment represented the same vector of six uncertain parameters applied to FTP-75, WLTP Class 3b and US06. The omnibus permutation test rejected the null hypothesis of no systematic cycle effect for all five analyzed metrics. The test statistics were 4.214 for the increase in recovered energy, 33.813 for the reduction in friction braking energy, 1.718 for the increase in the regenerative braking ratio, 0.155 for the SOC-corrected fuel effect and 8.736 for the difference in the number of engine starts. In all cases, p = 9.999 × 10⁻⁵, which is the minimum nonzero value obtainable from 10,000 permutations with the plus-one correction. This result indicates that the driving cycle affects not only the operating level of the metrics but also the paired response of the system to the transition from C2 to C3.
All 15 prespecified cross-cycle contrasts remained statistically significant after Holm correction, with an adjusted p-value of 2.9997 × 10⁻⁴ for each contrast. The largest differences in braking-related effects were observed between US06 and WLTP Class 3b. On US06, the mean increase in recovered energy was greater by 2.663 percentage points (2.633–2.693), the reduction in friction braking energy by 7.449 percentage points (7.381–7.517) and the increase in the regenerative braking ratio by 1.692 percentage points (1.674–1.709). Compared with FTP-75, the corresponding US06 advantages were 2.333 (2.310–2.356), 6.742 (6.690–6.795) and 1.502 (1.489–1.515) percentage points.
The differences between FTP-75 and WLTP Class 3b were smaller but still unambiguous. On FTP-75, the C3 effect exceeded that obtained for WLTP Class 3b by 0.330 percentage points for recovered energy, 0.707 percentage points for the reduction in friction braking energy and 0.190 percentage points for the regenerative braking ratio. Their 95% confidence intervals, 0.322–0.339, 0.689–0.725 and 0.185–0.194, respectively, did not include zero. Therefore, the descriptive ordering US06 > FTP-75 > WLTP Class 3b identified in Section 3.2 is confirmed by the within-cluster analysis and cannot be explained by random redistribution of different parametric realizations across the driving cycles.
Cross-cycle heterogeneity also extended to powertrain-related metrics. The difference in the mean SOC-corrected fuel effect was 0.268 percentage points for FTP-75 relative to WLTP Class 3b, 0.289 percentage points for US06 relative to FTP-75 and 0.557 percentage points for US06 relative to WLTP Class 3b. The additional number of engine starts on WLTP Class 3b was, on average, 2.08 higher than on FTP-75 and 4.18 higher than on US06. The difference between FTP-75 and US06 was 2.10 starts. The principal cross-cycle contrasts are reported above. These results were not combined into a single cross-cycle score because the underlying metrics differ in physical meaning and sign convention. They were therefore interpreted together with the cycle speed profiles and braking structure rather than as an arbitrary selection of interchangeable operating outcomes.
The statistically significant heterogeneity in effect magnitude did not contradict the robustness of the braking-related benefit. For the three braking metrics, every realization that was favorable on FTP-75, WLTP Class 3b and US06 simultaneously corresponded to the same uncertain-parameter vector. Thus, all 100 matched parameter sets showed a joint increase in recovered energy, a reduction in friction braking energy and an increase in the regenerative braking ratio across all three cycles (Figure 3). The empirical proportion of jointly favorable realizations was 1.000, with a 95% Wilson interval of 0.963–1.000 for each of the three metrics.
Figure 3.
Empirical proportion of favorable C3 realizations for FTP-75, WLTP Class 3b and US06, as well as under the joint cross-cycle criterion. For the braking metrics, a positive C3-C2 effect was considered favorable. For the number of engine starts, a C3-C2 difference not exceeding zero was considered favorable.
For the SOC-corrected fuel-consumption metric, the favorable effect was observed in 2 out of 100 realizations on FTP-75, in none of the 100 realizations on WLTP Class 3b and in 97 out of 100 realizations on US06. No single realization exhibited a fuel-consumption benefit of C3 across all three cycles. A similar pattern was observed for the difference in engine-start counts: the favorable effect occurred in 14 realizations on FTP-75, in no realizations on WLTP Class 3b and in 22 realizations on US06 but never jointly across all cycles within the same parameter set. For both jointly favorable proportions, the estimate was 0, and the upper bound of the 95% Wilson interval was 0.037. This interval should not be interpreted as evidence for an exactly zero probability beyond the investigated uncertainty domain.
The paired braking-energy improvement occurred for every investigated UQ vector, with the largest mean effect on US06. The nominal factorial control, however, assigned almost all the gain to preview-dependent brake allocation, and SOC preparation alone provided negligible additional recovery. Thus, H1 and the braking-related part of H2 are supported within the specified cycles and uncertainty domain, without implying that anticipatory creation of charge headroom was the operative cause.
3.4. Fuel Effect and Charge-Sustaining Comparison
Unlike the braking metrics, the fuel effect changed sign across cycles. Under the specified terminal-SOC correction, positive values denote lower fuel consumption for C3 than C2, and negative values denote a penalty. Figure 4 presents the paired-effect distributions, and Figure 5 decomposes their cycle-specific means into raw fuel and SOC correction components.
Figure 4.
Distribution of the paired SOC-corrected fuel effect for C3 relative to C2 on FTP-75, WLTP Class 3b and US06.
Figure 5.
Decomposition of the mean SOC-corrected fuel effect into the raw change in fuel consumption and the terminal-SOC correction.
For FTP-75, the mean SOC-corrected reduction in fuel consumption was −0.171% (95% CI: −0.186 to −0.156%), meaning that C3 increased fuel consumption relative to C2 after adjustment for the terminal battery energy state. The median was −0.164%, while individual realizations ranged from −0.355 to +0.021%. A favorable sign was observed in only 2 of the 100 paired realizations, corresponding to an empirical probability of 0.020 and a 95% Wilson interval of 0.006–0.070. These two positive observations do not alter the overall conclusion for this cycle because the bootstrap confidence interval for the mean remained entirely below zero.
The fuel penalty was largest on WLTP Class 3b. The mean SOC-corrected effect was −0.439% (95% CI: −0.456 to −0.422%), with a median of −0.446% and a range from −0.595 to −0.236%. All 100 realizations had a negative sign. Because no favorable pairs were observed, the upper bound of the 95% Wilson interval for the empirical probability of improvement was 0.037. Within the UQ-1.0 domain, variations in vehicle parameters and prediction scaling were therefore insufficient to eliminate the fuel-consumption penalty introduced by C3 on WLTP Class 3b.
On US06, the mean algebraically SOC-corrected fuel effect was +0.118% (95% bootstrap CI: 0.107–0.128%), with a median of +0.121% and a range from −0.041 to +0.231%. C3 was favorable in 97 of the 100 matched UQ realizations (empirical proportion 0.970; 95% Wilson interval 0.915–0.990). These intervals describe resampling within the specified model and UQ domain, and they do not establish a vehicle-fleet effect. The estimated advantage is small and remains conditional on the SOC-equivalence model.
The opposite signs of the cycle-specific results rule out an interpretation based on a universal fuel-consumption benefit. FTP-75, WLTP Class 3b and US06 do not represent a random sample from a general population of driving regimes, and their equal weighting does not correspond to any predefined vehicle-use distribution. Moreover, each trip is evaluated repeatedly across the three cycles. For this reason, the fuel-related results are reported separately by cycle, while cross-cycle differences are characterized using the contrasts presented in Section 3.3 rather than by a single aggregated estimate.
To determine the source of the fuel effect, the paired change in raw fuel consumption was separated from the terminal-SOC correction according to Equation (22). For FTP-75, the raw fuel effect was already unfavorable, with a mean value of −0.108% (95% CI −0.124 to −0.092%). The correction for a lower terminal SOC in C3 contributed a further −0.063 percentage points (95% CI −0.064 to −0.061), resulting in a corrected effect of −0.171%. For WLTP Class 3b, the raw fuel penalty was −0.326% (95% CI −0.342 to −0.310%), while the SOC correction added another −0.113 percentage points (95% CI −0.116 to −0.110). Thus, on both cycles, the SOC correction amplified an already unfavorable fuel effect but did not determine its sign.
On US06, raw fuel consumption fell by 0.382% on average (95% CI: 0.368–0.395%). The assumed terminal-SOC correction contributed −0.264 percentage points (95% CI: −0.274 to −0.254), offsetting approximately 69% of that raw change and leaving +0.118%. This algebraic result must not be interpreted as a directly measured charge-sustaining fuel saving. The supplementary fuel-conversion and SOC-matched checks below quantify its dependence on that assumption.
The raw-fuel component determined the sign of the mean effect under the adopted correction: it was negative on FTP-75 and WLTP Class 3b and positive on US06. The terminal-SOC correction opposed C3 on all three cycles. These accounting components identify where the cycle-dependent sign arises but do not by themselves establish which controller channel caused it.
H3 is not supported as a universal hypothesis. With the stated SOC correction, the mean fuel effect is unfavorable on FTP-75 and WLTP Class 3b and slightly favorable on US06. Direct SOC-matched checks retain those signs while reducing the US06 advantage to only about 0.03–0.05%. The braking-energy improvement is therefore more robust than the fuel result. Neither its sign outside the tested conditions nor any practically material fuel savings can be inferred.
Sensitivity checks did not turn the small fuel effect into a general claim. The model-derived marginal conversion factor was approximately 0.273–0.281 rather than the assumed 0.32. Recalculation kept the mean fuel-effect signs on all three cycles but reduced the US06 mean to about +0.07%. Direct nominal final-SOC-matched runs gave −0.133% for FTP-75, −0.388% for WLTP Class 3b and +0.031–0.050% for US06. The continuous US06 drive-and-recharge check gave the same small positive range across the tested integration steps. In the 300 archived pairs, changing the assumed fuel-to-stored-electricity factor to 0.20, 0.24 and 0.32 gave mean US06 corrected effects of −0.041%, +0.030% and +0.118%, with 30, 72 and 97 favorable pairs out of 100, respectively. The mean sign switches near 0.221 for a fixed 360 V battery-energy estimate (approximately 0.226 using the model OCV curve), so neither threshold is an experimentally calibrated efficiency.
3.5. Analysis of the Fuel-Consumption Penalty
The mechanisms responsible for the cross-cycle variation in the fuel effect were examined at three inter-related levels.
At the first level, the terminal-SOC correction was analyzed. It was unfavorable to C3 on every driving cycle but, as shown above, did not alter the sign of the raw fuel effect. The mean SOC correction was −0.063 percentage points for FTP-75, −0.113 percentage points for WLTP Class 3b and −0.264 percentage points for US06. At the same time, the corresponding raw fuel effects were −0.108%, −0.326% and +0.382%. Thus, the largest terminal-SOC penalty occurred on US06, yet this cycle still retained a positive fuel benefit after correction.
Across the 100 matched UQ pairs per cycle, the Spearman association between raw and SOC-corrected fuel effects was strong on FTP-75 (ρs = 0.994; 95% bootstrap CI: 0.987–0.996) and WLTP Class 3b (ρs = 0.984; 0.973–0.988). On US06, it was moderate (ρs = 0.614; 0.459–0.731). Thus, the SOC correction changed the ordering of US06 parameter cases more substantially than it did for the two longer cycles.
The relationship between the SOC-related component and terminal battery charge was not identical across the three driving regimes. On FTP-75, the Spearman correlation between the fuel effect and SOC correction was −0.463 (95% CI: −0.617 to −0.281), with the terminal-SOC difference contributing −0.312 (−0.484 to −0.123). On WLTP Class 3b, the corresponding values were +0.271 (0.076–0.449) and +0.113 (−0.082–0.307), while on US06 they were +0.159 (−0.054–0.355) and +0.011 (−0.192–0.203). These associations were small or moderate and were not consistent in sign across cycles. Consequently, terminal SOC cannot be considered a universal monotonic predictor of the fuel-consumption effect.
The number of additional engine starts also showed a cycle-dependent and multidirectional relationship with the fuel outcome. On WLTP Class 3b, a larger number of starts was associated with a less favorable C3 fuel effect (ρs′ = −0.443, 95% CI: −0.577 to − 0.278). On FTP-75, the relationship was opposite in sign (ρs′ = 0.237, 0.048–0.416), while on US06, the confidence interval included zero (ρs′ = 0.126,−0.064–0.306). Therefore, the additional number of engine starts cannot by itself be treated as a sufficient explanation of the fuel penalty. Its effect depends on the duration and timing of the corresponding engine operating events. The preparatory torque law does not issue an engine-start command directly, but changes in the SOC and charging-hysteresis state may nevertheless alter subsequent engine-state transitions.
The associations with the braking-related metrics further clarify this behavior. On FTP-75, the SOC-corrected fuel effect was positively correlated with the increase in recovered energy (ρs = 0.319), the reduction in friction braking energy (0.352) and the increase in the regenerative braking ratio (0.491). None of the corresponding 95% confidence intervals included zero. For WLTP Class 3b, the respective confidence intervals included zero despite the consistent braking-related advantage of C3 across all realizations. On US06, positive associations were observed with recovered energy (0.264, 95% CI: 0.071–0.438)and the reduction in friction braking energy (0.287, 0.090–0.465), although both were moderate. For the regenerative braking ratio, the confidence interval included zero. The energy benefit of the braking subsystem is the intended effect of C3, but its magnitude alone does not determine the charge-sustaining or fuel-consumption outcome.
The third level of the audit was based on nominal simulations with an initial SOC of 60% and complete preservation of the time-series signals. The signs of the raw fuel effect reproduced the UQ results: −0.063% for FTP-75, −0.257% for WLTP Class 3b and +0.383% for US06. These simulations were used to examine operational changes rather than to quantify statistical uncertainty.
On FTP-75, the transition to C3 produced almost no change in total engine operating time (+0.060 s) but introduced two additional engine starts. Engine mechanical energy increased by 0.0033 kWh, engine-driven battery charging energy by 0.0574 kWh and battery discharge energy by 0.0676 kWh. The mean dynamic SOC target decreased by 0.051 percentage points. This combination is consistent with a small fuel penalty associated with a deeper redistribution of energy through the battery. However, the nearly unchanged engine operating time does not support attributing this penalty to a longer duration of engine operation.
On WLTP Class 3b, nominal C3 increased engine operating time by 23.554 s and added five starts. Engine mechanical energy decreased by 0.0034 kWh and mean mechanical power by 0.367 kW, while engine-driven battery charging increased by 0.0451 kWh and battery discharge by 0.0570 kWh. The mean dynamic SOC target decreased by 0.082 percentage points. These observations show a more intensive battery energy exchange and changed engine operation, but the quasi-static model cannot isolate start-up fuel or clutch transients.
On US06, nominal engine operating time increased by 5.722 s without additional starts, while engine mechanical energy fell by 0.0184 kWh and mean mechanical power by 0.545 kW. Engine-driven charging nevertheless increased by 0.0273 kWh and battery discharge by 0.0507 kWh. C3 recovered 0.0172 kWh more braking energy and dissipated 0.0191 kWh less in friction brakes. These simultaneous changes are consistent with the small positive raw-fuel component but do not identify SOC preparation as the cause of the regenerative gain.
The nominal US06 interval at 82–132 s illustrates the controller and powertrain response around a major braking event (Figure 6). The core 96–128 s deceleration segment was selected from the reference-speed trace alone because it had the largest decrease in specific kinetic energy (499.46 J/kg) among continuous decreasing-speed segments. The wider window shows the preceding and subsequent states. This example illustrates a local trajectory, and it is not an independent proof of anticipatory gain.
Figure 6.
Nominal US06 response over 82–132 s at 60% initial SOC: (a) reference speed; (b) controller braking-energy proxy; (c) actual SOC and dynamic SOC target; (d) requested, regenerative and friction braking torque; (e) battery power.
The C3 SOC target fell before the selected deceleration, but the trajectory does not show that a binding charge constraint was relieved. During the event, the requested regenerative share was higher: regenerative braking energy rose from 0.1044 to 0.1080 kWh (+3.49%), friction braking energy fell from 0.0321 to 0.0284 kWh (−11.26%), and energy returned to the battery rose from 0.0876 to 0.0908 kWh (+3.65%). The paired torque balance was preserved, with a residual below 5.2 × 10⁻¹³ N·m.
Across FTP-75, WLTP Class 3b and US06, the integrals of positive mechanical power associated with the preparatory torque command were 0.0098, 0.0194 and 0.0329 kWh, respectively. Preview-channel activation lasted 129.447, 143.271 and 101.311 s. Battery discharge and engine-driven charging both increased in the nominal C3 runs. Consequently, the observed fuel response cannot be explained as a simple reduction in engine charging before braking.
The mechanism checks separate two effects. Raising the desired regenerative share during braking accounts for nearly all additional energy recovery in the nominal cycles. The SOC-preparation channel did not produce a meaningful recovery gain at 60% initial SOC but changed battery cycling and engine operation, contributing to the fuel trade-off. This interpretation is consistent with the absence of sustained upper-SOC or charging-power saturation in these cases. A headroom benefit under different initial SOC, thermal limits or battery sizing remains a testable possibility, not a result demonstrated by the present cycles.
3.6. Parametric Sensitivity and Cross-Cycle Interaction of Factors
Partial rank correlation coefficients were used to characterize conditional monotonic relationships between the paired C3–C2 effects and the six UQ-1.0 factors under the statistical control of the remaining five factors. The reported PRCC values describe the structure of relationships within the specified ranges and uniform parameter distributions. They should not be interpreted as causal-effect estimates or as evidence of higher-order non-monotonic interactions. Point estimates for each driving cycle are presented in Figure 7, while conclusions regarding pairwise differences are based on 95% bootstrap confidence intervals.
Figure 7.
Cycle-specific partial rank correlations between six uncertain factors and five paired C3–C2 effects.
For all three braking metrics, the preview-energy scale had the largest positive conditional rank association. Its PRCCs for recovered-energy gain were 0.986, 0.986 and 0.973 on FTP-75, WLTP Class 3b and US06, respectively, while the corresponding values for friction-energy reduction were 0.986, 0.986 and 0.980. These associations arise within the specified UQ domain. Since the scale modifies both C3 channels, PRCC alone cannot assign the response to charge-headroom preparation. The factorial ablation instead identifies brake allocation as the dominant nominal mechanism.
Vehicle mass also showed a positive conditional association with the braking effects: its PRCC for recovered-energy gain ranged from 0.947 to 0.950 across cycles. Greater mass increases the kinetic-energy proxy and hence the requested change in braking share in this controller. This is a within-model association over the stated UQ range, not evidence that an upper-SOC constraint was relieved or that the same relationship will hold in an arbitrary HEV.
The influence of the regenerative-efficiency scaling factor depended on the response metric considered. For the increase in recovered energy, its PRCC was negative: −0.339 for FTP-75, −0.355 for WLTP Class 3b and −0.523 for US06. In contrast, the relationship with the increase in the regenerative braking ratio remained positive, with values of 0.781, 0.794 and 0.641, respectively. This indicates that a higher baseline regeneration efficiency reduces the absolute incremental benefit of C3 in terms of additional recovered energy. However, the relative advantage of the predictive strategy can still be retained when the share of braking energy redirected to the battery increases.
The rolling-resistance coefficient showed a weak or moderate relationship with the increase in recovered energy for FTP-75 (−0.334) and WLTP Class 3b (−0.313), whereas the corresponding interval for US06 included zero. For battery internal resistance and battery capacity, the 95% PRCC confidence intervals included zero for all three metrics and across all three cycles. Thus, within the UQ-1.0 domain, these two parameters did not materially affect the ranking of the braking-related benefit produced by the predicted-energy scaling factor and vehicle mass.
Fuel-effect PRCCs were more cycle-dependent. On FTP-75, regenerative efficiency (0.779; 95% CI: 0.675–0.846), the preview-energy scale (0.652; 0.507–0.754) and battery capacity (0.449; 0.262–0.610) had positive associations. On WLTP Class 3b, regenerative efficiency (0.667; 0.520–0.790) and mass (0.400; 0.172–0.618) were positive, whereas capacity (−0.574; −0.739 to −0.378) and rolling resistance (−0.409; −0.581 to −0.208) were negative. On US06, the preview-energy scale was positive (0.352; 0.150–0.539), while efficiency (−0.226; −0.424 to −0.029) and capacity (−0.374; −0.555 to −0.151) were negative.
Engine-start PRCCs were also cycle-dependent. On FTP-75, additional starts were associated with mass (0.723), regenerative efficiency (0.654) and, negatively, rolling resistance (−0.352). On WLTP Class 3b, battery capacity (0.509) and rolling resistance (0.420) were positive, and mass was not distinguishable from zero. No US06 95% interval excluded zero.
The repeated-measures comparison yielded 90 cycle-by-factor contrasts: five effects, six factors and three cycle pairs. The preview-energy scale was consistently strongly associated with braking outcomes, but several weaker factor associations differed between cycles. In particular, the change in the regenerative-efficiency association must be interpreted for each specific outcome rather than as one common causal effect.
Fuel-effect contrasts showed more pronounced heterogeneity. The FTP-75 minus WLTP Class 3b contrast for battery capacity was +1.023 PRCC units (95% CI: 0.770–1.243). For regenerative efficiency, the US06 minus FTP-75 and US06 minus WLTP Class 3b contrasts were −1.005 and −0.894, respectively. For the preview-energy scale, FTP-75 minus WLTP Class 3b was +0.849.
Engine-start associations also differed by cycle, but tied start counts limit their precision. Together, the fuel and start results indicate that a fixed preparatory calibration cannot be assumed to produce a uniform system-level advantage. Future control design should evaluate the expected cost of SOC preparation separately from the value of increasing the regenerative braking share.
A one-factor-at-a-time nominal sensitivity check further bounded the fuel claim. On US06, increasing the braking-energy scale from 0.020 to 0.040 kWh or the maximum preparatory torque from 10 to 20 N·m changed the sign of the model-based corrected fuel effect, although C3 still recovered more braking energy than C2. In separate nominal one-factor tests, shortening the preview horizon from 10 to 5 s reduced C3 recovered braking energy by approximately 0.19%, 0.13% and 0.12% on FTP-75, WLTP Class 3b and US06, respectively, relative to the default C3 setting. Doubling the SOC-reserve coefficient from 0.25 to 0.50 changed US06 recovery by −0.03%. These checks, together with the energy-scale and preparatory-torque perturbations above, cover the four selected controller parameters but are not a joint sensitivity analysis or additional members of the 300-pair uncertainty ensemble.
3.7. Summary of Results and Study Limitations
The robust finding is improved braking-energy allocation, not verified creation of useful charge headroom. Across 300 matched C2–C3 pairs, mean recovered-energy gains were 1.751%, 1.420% and 4.083% for FTP-75, WLTP Class 3b and US06, respectively, with a favorable braking-metric sign in every pair. Nominal full-cycle factorial ablations attributed almost all of this gain to the C3 brake-allocation rule; SOC preparation alone contributed negligibly. Under the manuscript’s assumed algebraic SOC correction, mean fuel effects were −0.171%, −0.439% and +0.118%. This separation between local energy recovery and trip-level fuel use is the principal methodological result of the study.
For practical control, the results favor retaining causal SoP-constrained C2 as the physical safety layer and treating preview as a supervisory input. The brake-allocation channel can improve recovery when electric torque is available. The preparatory SOC channel requires a separate cost–benefit gate because it changed battery cycling and fuel use without meaningful extra recovery in the tested nominal cycles. A proposed adaptive gate should therefore be presented as a design implication, not as a validated feature of the current controller.
These conclusions apply to a control-oriented midsize P2 HEV, three standard cycles and the specified six-factor UQ domain. The engine and driveline representations do not resolve start-up, clutch, gearshift or actuator transients, and the model lacks thermal derating, battery aging, axle-level brake balance, tire adhesion and ABS/ESC dynamics. The primary preview uses the synchronized reference trajectory, not a validated onboard predictor and targeted causal and disturbed-preview tests are diagnostic proxies. The UQ ensemble began at 60% SOC, below the upper-SOC fade-out region. Accordingly, no general charge-headroom advantage or real-vehicle fuel saving can be inferred without measured forecasts, higher-SOC/thermal tests and HIL, bench and road validation. In the fixed-ratio plant, high-speed operation can exceed the engine map’s 5500 rpm normalization point. The auxiliary two-ratio check addresses this structural sensitivity but does not validate either model against a production powertrain.
4. Discussion
The C3 benefit in this study is an increase in battery-recovered braking energy produced mainly by brake-torque allocation, not by verified creation of SOC headroom. Dong et al. [10] likewise treated braking-force distribution as a determinant of recovery in a P2 plug-in hybrid but additionally optimized downshifting to change the electric machine’s operating region. Our separate two-ratio diagnostic confirms that transmission representation can alter the magnitude of the C3-C2 contrast, especially on US06. It does not reproduce the gear-selection controller, plug-in operating mode or component calibration of Dong et al. and their recovery figures therefore cannot serve as numerical validation of the present fixed-ratio results.
Vehicle-level observations also caution against equating more recovered energy with a proportional reduction in energy use. In road tests of an electric SUV, Lee et al. [11] found that stronger regenerative braking settings increased both recovered energy and battery consumption outside regeneration, while net battery consumption decreased; this is an EV energy balance rather than an HEV fuel comparison. Real-world HEV and EV measurements by Jeong et al. [20] further showed dependence on operating strategy, route and ambient conditions. These findings support reporting braking recovery and trip-level consumption separately, as done here, but do not establish the accuracy of our predicted percentages. For HEV fuel comparisons, Sauermann et al. [34] demonstrated the importance of terminal-SOC compensation. Our corrected fuel effects depend on an assumed conversion efficiency, and direct final-SOC matching left only a small nominal US06 advantage, so no cycle-independent fuel benefit is claimed.
The contribution relative to these studies is a matched C2-C3 comparison that separates preview-guided brake allocation from SOC preparation and tests the sign of each outcome across a prescribed parameter ensemble. The evidence is internal to the control-oriented plant: neither the 300-pair uncertainty study nor the limited two-ratio diagnostic constitutes experimental validation of a production P2 HEV. Such validation would require measured machine and battery limits, transmission and clutch behavior, braking-system constraints and onboard-preview errors, followed by chassis dynamometer or road comparisons of braking-energy flows and fuel use at matched terminal SOC.
5. Conclusions
The preview-aware C3 strategy was compared with causal C2 in a midsize parallel P2 HEV model using FTP-75, WLTP Class 3b and US06 and 100 matched parameter vectors per cycle. Channel ablations and terminal-SOC checks were added to distinguish the mechanism of recuperation from the fuel response.
- C3 increased the mean battery-recovered braking energy by 1.751%, 1.420% and 4.083% and reduced the friction braking energy by 5.100%, 4.393% and 11.842% on the three cycles, respectively. The regenerative braking ratio rose by 1.044, 0.854 and 2.546 percentage points. All 300 matched comparisons favored C3 on these three metrics; requested braking torque remained fully supplied.
- Full-cycle controls located the recovery gain in the brake-allocation channel, not in the nominal SOC-preparation channel: allocation-only C6 increased recovered energy by 1.862%, 1.506% and 4.325% relative to C2, while preparation-only C7 produced essentially no gain on FTP-75 and WLTP Class 3b and only 0.016% on US06. C3a reproduced C2, while C3b likewise showed no meaningful gain over its matched fixed-share reference C1.
- A braking-energy gain did not ensure lower fuel consumption. Mean fuel effects under the specified 0.32-efficiency SOC correction were −0.171%, −0.439% and +0.118% (positive denotes a reduction). Favorable outcomes occurred in 2, 0 and 97 of the 100 UQ pairs, respectively, and none was favorable across all three cycles. The US06 effect remained positive but only about 0.03–0.05% in direct final-SOC-matched nominal checks. H3 is therefore not supported as a universal claim.
- The assumed SOC correction opposed C3 on all cycles, and the raw-fuel component determined the mean sign. Nominal ablations showed that SOC preparation altered battery cycling and could impose a fuel cost without releasing a binding charging constraint. The present simulations thus support separation of brake-allocation control from preparation rather than a claim that anticipatory headroom caused the observed regenerative benefit.
- A future preview supervisor should quantify the expected net value of both channels and suppress SOC preparation when its cost exceeds the recoverable-energy opportunity. This design implication still requires testing with measured trajectories and realistic forecast error, battery thermal constraints, higher-SOC conditions and HIL, bench and road validation.
Author Contributions
Conceptualization, D.T. and O.L.; methodology, D.M.; software, D.M.; validation, O.T., O.L. and D.K.; formal analysis, M.L.; investigation, O.T.; resources, M.L.; data curation, D.T. and D.K.; writing—original draft preparation, D.M.; writing—review and editing, D.T. and O.T.; visualization, D.K. and M.L.; supervision, O.L. All authors have read and agreed to the published version of the manuscript.
Funding
This research received no external funding.
Data Availability Statement
The original contributions presented in this study are included in the article. Further inquiries can be directed to the corresponding author.
Conflicts of Interest
The authors declare no conflicts of interest.
Abbreviations
The following abbreviations are used in this manuscript:
| ABS | Anti-lock braking system |
| BSFC | Brake-specific fuel consumption |
| C0 | Friction-only braking reference configuration |
| C1 | Fixed-ratio regenerative braking reference configuration |
| C2 | Causal SoP-aware regenerative braking baseline strategy |
| C3 | Preview-aware regenerative braking strategy |
| C3a | Ablation configuration with the preview channel disabled |
| C3b | Ablation configuration with charge-reserve preparation and a fixed regenerative braking fraction |
| CI | Confidence interval |
| ECMS | Equivalent consumption minimization strategy |
| EMS | Energy management strategy |
| EPA | United States Environmental Protection Agency |
| ESC | Electronic stability control |
| EV | Electric vehicle |
| FTP-75 | Federal Test Procedure 75 driving cycle |
| HEV | Hybrid electric vehicle |
| HIL | Hardware-in-the-loop |
| HWFET | Highway Fuel Economy Test driving cycle |
| JRC | Joint Research Centre |
| LHV | Lower heating value |
| LiDAR | Light detection and ranging |
| MPC | Model predictive control |
| P2 | Parallel-hybrid powertrain architecture with the electric machine located between the engine and transmission |
| PHEV | Plug-in hybrid electric vehicle |
| PID | Proportional–integral–derivative |
| pp | Percentage point(s) |
| PRCC | Partial rank correlation coefficient |
| RMSE | Root mean square error |
| SOC | State of charge |
| SOH | State of health |
| SoP | State of power |
| STU | Sustainable Transport Unit |
| TD3 | Twin Delayed Deep Deterministic Policy Gradient |
| UNECE | United Nations Economic Commission for Europe |
| UQ | Uncertainty quantification |
| UQ-1.0 | Uncertainty-quantification design adopted in this study |
| US06 | US06 Supplemental Federal Test Procedure driving cycle |
| WLTP | Worldwide Harmonized Light Vehicles Test Procedure |
References
- Yang, C.; Sun, T.; Wang, W.; Li, Y.; Zhang, Y.; Zha, M. Regenerative braking system development and perspectives for electric vehicles: An overview. Renew. Sustain. Energy Rev. 2024, 198, 114389. [Google Scholar] [CrossRef] [Scilit]
- Lü, X.; Li, S.; He, X.; Xie, C.; He, S.; Xu, Y.; Fang, J.; Zhang, M.; Yang, X. Hybrid electric vehicles: A review of energy management strategies based on model predictive control. J. Energy Storage 2022, 56, 106112. [Google Scholar] [CrossRef] [Scilit]
- Dong, P.; Zhao, J.; Liu, X.; Wu, J.; Xu, X.; Liu, Y.; Wang, S.; Guo, W. Practical application of energy management strategy for hybrid electric vehicles based on intelligent and connected technologies: Development stages, challenges, and future trends. Renew. Sustain. Energy Rev. 2022, 170, 112947. [Google Scholar] [CrossRef] [Scilit]
- Pan, M.; Cao, S.; Zhang, Z.; Ye, N.; Qin, H.; Li, L.; Guan, W. Recent progress on energy management strategies for hybrid electric vehicles. J. Energy Storage 2025, 116, 115936. [Google Scholar] [CrossRef] [Scilit]
- Azim Mohseni, N.; Bayati, N.; Ebel, T. Energy management strategies of hybrid electric vehicles: A comparative review. IET Smart Grid 2024, 7, 191–220. [Google Scholar] [CrossRef] [Scilit]
- Mariani, V.; Rizzo, G.; Tiano, F.A.; Glielmo, L. A model predictive control scheme for regenerative braking in vehicles with hybridized architectures via aftermarket kits. Control Eng. Pract. 2022, 123, 105142. [Google Scholar] [CrossRef] [Scilit]
- Chen, Z.; Ding, R.; Zhou, Q.; Wang, R.; Zhao, B.; Liao, Y. Research on coordinated control of electro-hydraulic composite braking for an electric vehicle based on the Fuzzy-TD3 deep reinforcement learning algorithm. Control Eng. Pract. 2025, 157, 106248. [Google Scholar] [CrossRef] [Scilit]
- Koch, A.; Brauer, J.; Falkenstein, J. Drivability optimization of electric vehicle drivetrains for brake blending maneuvers. World Electr. Veh. J. 2022, 13, 209. [Google Scholar] [CrossRef] [Scilit]
- Hosseini Salari, A.; Mirzaeinejad, H.; Fooladi Mahani, M. A new control algorithm of regenerative braking management for energy efficiency and safety enhancement of electric vehicles. Energy Convers. Manag. 2023, 276, 116564. [Google Scholar] [CrossRef] [Scilit]
- Dong, P.; Li, J.; Yao, K.; Li, S.; Wang, S.; Xu, X.; Guo, W. Downshifting strategy of plug-in hybrid vehicle during braking process for greater regenerative energy. Control Eng. Pract. 2024, 152, 106049. [Google Scholar] [CrossRef] [Scilit]
- Lee, G.; Song, J.; Han, J.; Lim, Y.; Park, S. Study on energy consumption characteristics of passenger electric vehicle according to the regenerative braking stages during real-world driving conditions. Energy 2023, 283, 128745. [Google Scholar] [CrossRef] [Scilit]
- Wu, G.; Wang, C.; Zhao, W.; Meng, Q. Integrated energy management of hybrid power supply based on short-term speed prediction. Energy 2023, 262, 125620. [Google Scholar] [CrossRef] [Scilit]
- Ruan, J.; Wu, C.; Liang, Z.; Liu, K.; Li, B.; Li, W.; Li, T. The application of machine learning-based energy management strategy in a multi-mode plug-in hybrid electric vehicle, part II: Deep deterministic policy gradient algorithm design for electric mode. Energy 2023, 269, 126792. [Google Scholar] [CrossRef] [Scilit]
- Naseri, F.; Ragnarsson a Nordi, B.; Spiliotopoulos, K.; Schaltz, E. Regenerative–frictional brake blending in electric vehicles considering energy recovery and dynamic battery charging limit: A reinforcement learning-based approach. Machines 2026, 14, 416. [Google Scholar] [CrossRef] [Scilit]
- Reusser, C.; Parra, M.; Stamulis, C.; Vega, A.; Mino, G. Novel energy management scheme for a permanent magnet electric drive-based hybrid vehicle using model predictive control. Machines 2024, 12, 3. [Google Scholar] [CrossRef] [Scilit]
- Wu, M.; Qin, L.; Wu, G. State of power estimation of power lithium-ion battery based on an equivalent circuit model. J. Energy Storage 2022, 51, 104538. [Google Scholar] [CrossRef] [Scilit]
- Guo, R.; Shen, W. An enhanced multi-constraint state of power estimation algorithm for lithium-ion batteries in electric vehicles. J. Energy Storage 2022, 50, 104628. [Google Scholar] [CrossRef] [Scilit]
- Shen, X.; Zhang, H.; Li, J.; Du, C.; Yu, Z.; Cui, Y.; Fang, Y.; Wang, Z. State of power estimation for LIBs in electric vehicles: Recent progress, challenges, and prospects. J. Energy Storage 2025, 115, 116042. [Google Scholar] [CrossRef] [Scilit]
- Fornaro, P.; Puleston, P.; Battaiotto, P. State-of-charge and state-of-health variable-gain estimation based on tracking sliding mode differentiators for an electric vehicle lithium-ion battery. J. Energy Storage 2023, 65, 107298. [Google Scholar] [CrossRef] [Scilit]
- Jeong, J.W.; Lee, J.; Lee, J.; Cha, J.; Lee, K. Comparison of energy consumption between hybrid and electric vehicles under real-world driving conditions. J. Power Sources 2024, 618, 235190. [Google Scholar] [CrossRef] [Scilit]
- Guo, L.; Liu, H.; Han, L.; Yang, N.; Liu, R.; Xiang, C. Predictive energy management strategy of dual-mode hybrid electric vehicles combining dynamic coordination control and simultaneous power distribution. Energy 2023, 263, 125598. [Google Scholar] [CrossRef] [Scilit]
- Liu, B.; Shi, Q.; He, Z.; Wei, Y.; Qiu, D.; He, L. A driving-cycle predictive control approach for energy consumption optimization of hybrid electric vehicle. Proc. Inst. Mech. Eng. Part D J. Automob. Eng. 2022, 236, 2507–2518. [Google Scholar] [CrossRef] [Scilit]
- Gao, K.; Luo, P.; Xie, J.; Chen, B.; Wu, Y.; Du, R. Energy management of plug-in hybrid electric vehicles based on speed prediction fused driving intention and LIDAR. Energy 2023, 284, 128535. [Google Scholar] [CrossRef] [Scilit]
- Han, J.; Shu, H.; Tang, X.; Lin, X.; Liu, C.; Hu, X. Predictive energy management for plug-in hybrid electric vehicles considering electric motor thermal dynamics. Energy Convers. Manag. 2022, 251, 115022. [Google Scholar] [CrossRef] [Scilit]
- Wang, F.; Xia, J.; Cai, Y.; Guo, J. Novel energy management strategy for a dual-motor hybrid electric vehicle considering frequency of mode transitions. Energy Convers. Manag. 2022, 269, 116106. [Google Scholar] [CrossRef] [Scilit]
- Biswas, D.; Ghosh, S.; Sengupta, S.; Mukhopadhyay, S. Energy management of a parallel hybrid electric vehicle using model predictive static programming. Energy 2022, 250, 123505. [Google Scholar] [CrossRef] [Scilit]
- East, S.; Cannon, M. Scenario model predictive control for data-based energy management in plug-in hybrid electric vehicles. IEEE Trans. Control Syst. Technol. 2022, 30, 2522–2533. [Google Scholar] [CrossRef] [Scilit]
- Zhang, T.; Zhao, C.; Sun, X.; Lin, M.; Chen, Q. Uncertainty-aware energy management strategy for hybrid electric vehicle using hybrid deep learning method. IEEE Access 2022, 10, 63152–63162. [Google Scholar] [CrossRef] [Scilit]
- Xue, J.; Jiao, X.; Yu, D.; Zhang, Y. Predictive hierarchical eco-driving control involving speed planning and energy management for connected plug-in hybrid electric vehicles. Energy 2023, 283, 129058. [Google Scholar] [CrossRef] [Scilit]
- Li, C.; Xu, X.; Zhu, H.; Gan, J.; Chen, Z.; Tang, X. Research on car-following control and energy management strategy of hybrid electric vehicles in connected scene. Energy 2024, 293, 130586. [Google Scholar] [CrossRef] [Scilit]
- Cai, X.; Zhou, W.; Cui, Z.; Bai, X.; Liu, F.; Yu, H.; Ren, Y. An explicit state-of-charge planning solution for plug-in hybrid electric vehicle based on low-granularity prior-knowledge. Energy 2024, 313, 133990. [Google Scholar] [CrossRef] [Scilit]
- Tang, W.; Jiao, X.; Zhang, Y. Hierarchical energy management control for connected hybrid electric vehicles in uncertain traffic scenarios. Energy 2025, 315, 134291. [Google Scholar] [CrossRef] [Scilit]
- Chen, Y.; Yang, L.; Yang, C.; Wang, W.; Zha, M.; Gao, P.; Liu, H. Real-time analytical solution to energy management for hybrid electric vehicles using intelligent driving cycle recognition. Energy 2024, 307, 132643. [Google Scholar] [CrossRef] [Scilit]
- Sauermann, R.; Kirschbaum, F.; Nelles, O. Optimization of fuel consumption for rule-based energy management strategies of hybrid electric vehicles: SOC compensation methods. IEEE Access 2024, 12, 112594–112604. [Google Scholar] [CrossRef] [Scilit]
- Wołowiec, T.; Mironov, D.; Lyashuk, O.; Martyniuk, V.; Gąsior, M.; Lutsyk, A.; Gevko, I.; Lyashuk, M. Effect of standardized driving-cycle characteristics on control performance and energy efficiency of a PID-controlled hybrid electric vehicle. Energies 2026, 19, 2923. [Google Scholar] [CrossRef] [Scilit]
- Han, L.; Zhou, X.; Yang, N.; Liu, H.; Bo, L. Multi-objective energy management for off-road hybrid electric vehicles via Nash DQN. Automot. Innov. 2025, 8, 140–156. [Google Scholar] [CrossRef] [Scilit]
- Zhou, X.; Ma, Z.; Wang, J.; Xu, K.; Wang, C.; Zhao, W. Adaptive DDPG energy management strategy for hybrid electric vehicles based on online robust driving condition identification. Green Energy Intell. Transp. 2026. Epub ahead of printing. [Google Scholar] [CrossRef] [Scilit]
- Liu, G.; Shen, S.; Liu, Y.; Zhang, Y.; Liu, Y.; Chen, Z.; Guo, F. Energy-saving control of intelligent connected plug-in hybrid electric vehicle via fusing driving intention of front vehicle. Green Energy Intell. Transp. 2026, 5, 100330. [Google Scholar] [CrossRef] [Scilit]
- Kia America. 2020 Optima Hybrid Specifications. n.d. Available online: https://www.kiamedia.com/us/en/models/optima-hybrid/2020/specifications (accessed on 29 October 2026).
- The MathWorks, Inc. MATLAB and Powertrain Blockset, release R2025a. Computer software. The MathWorks, Inc.: Natick, MA, USA, 2025. Available online: https://www.mathworks.com/products/powertrain.html (accessed on 29 October 2026).
- European Commission, Joint Research Centre, Sustainable Transport Unit. wltp: Generate WLTC Gear-Shifts Based on Vehicle Characteristics (Commit 18650f372044371ed994a161a93473a75e76d2a9) [Data Set and Computer Software]. GitHub. n.d. Available online: https://github.com/JRCSTU/wltp/tree/18650f372044371ed994a161a93473a75e76d2a9 (accessed on 29 October 2026).
- United Nations Economic Commission for Europe. United Nations Global Technical Regulation No. 15: Worldwide Harmonized Light Vehicles Test Procedure, Amendment 6 (ECE/TRANS/180/Add.15/Amend.6). 2021. Available online: https://unece.org/transport/standards/transport/vehicle-regulations-wp29/global-technical-regulations-gtrs (accessed on 29 October 2026).
- U.S. Environmental Protection Agency. US06 Supplemental FTP Driving Schedule [Data Set]. 2025. Available online: https://www.epa.gov/system/files/other-files/2025-03/us06col.txt (accessed on 29 October 2026).
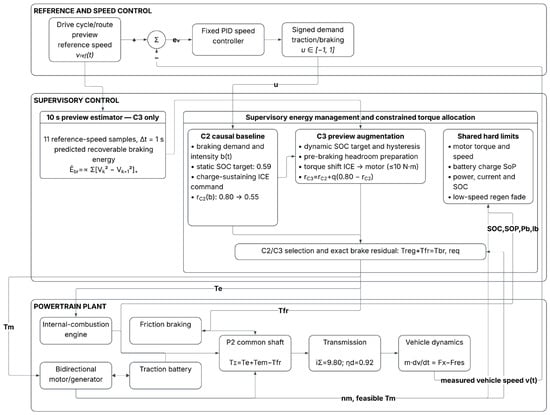
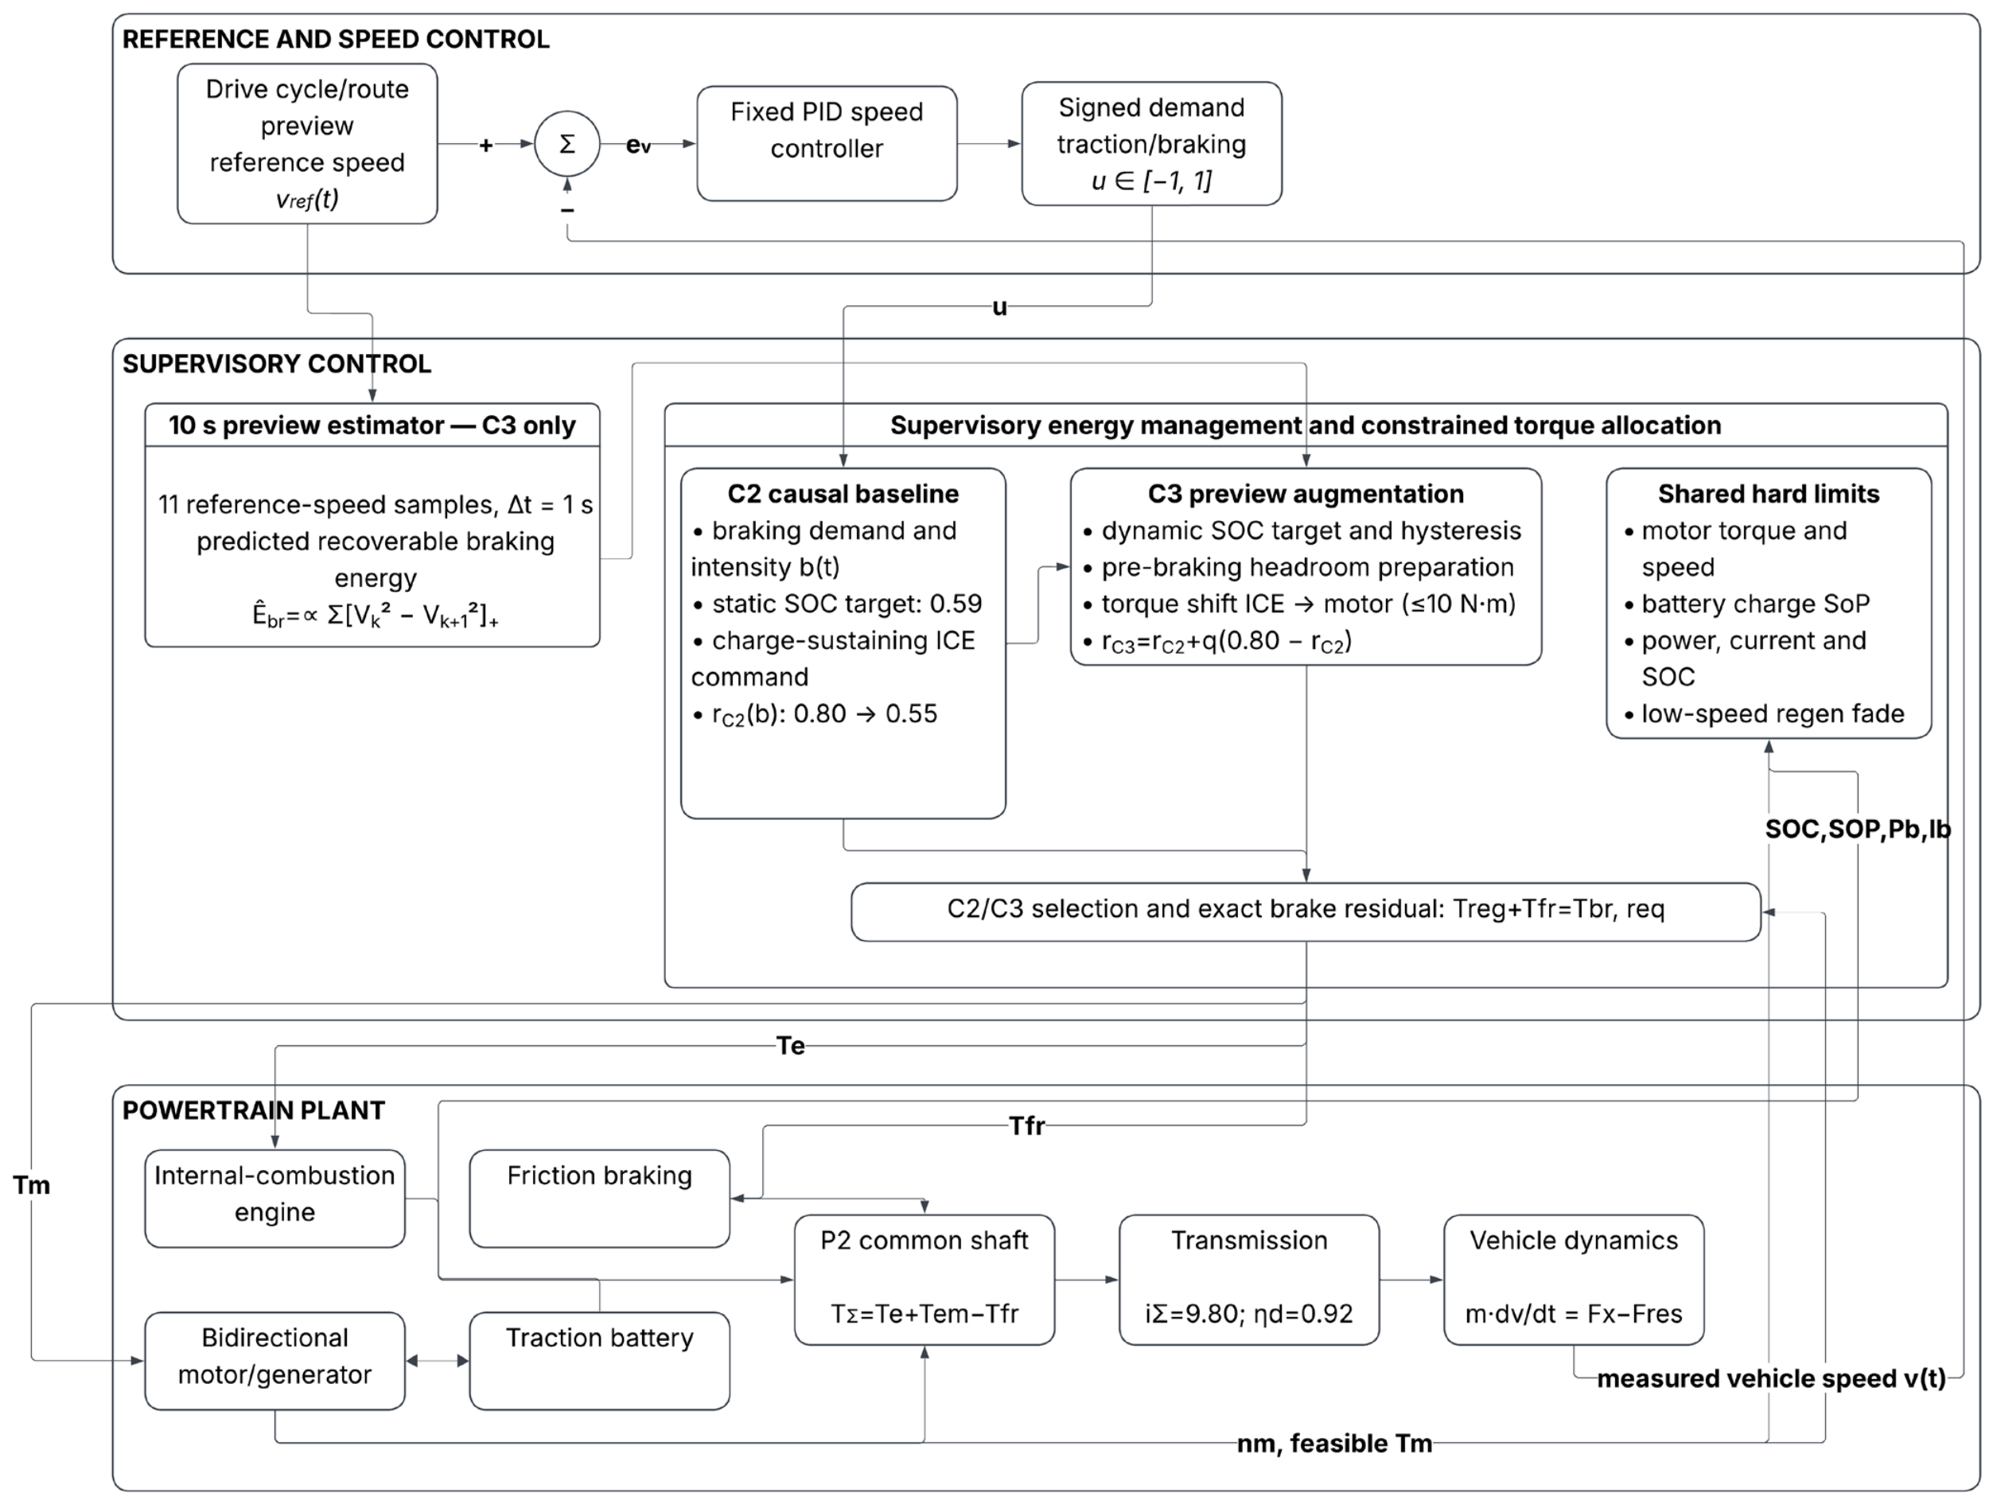
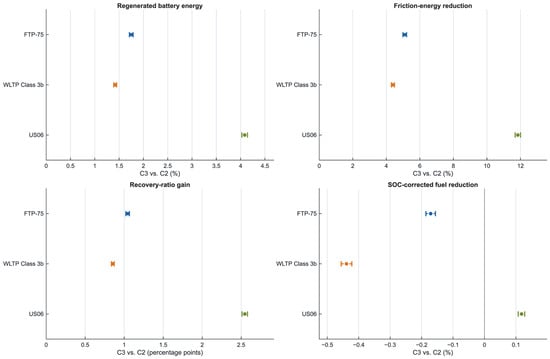
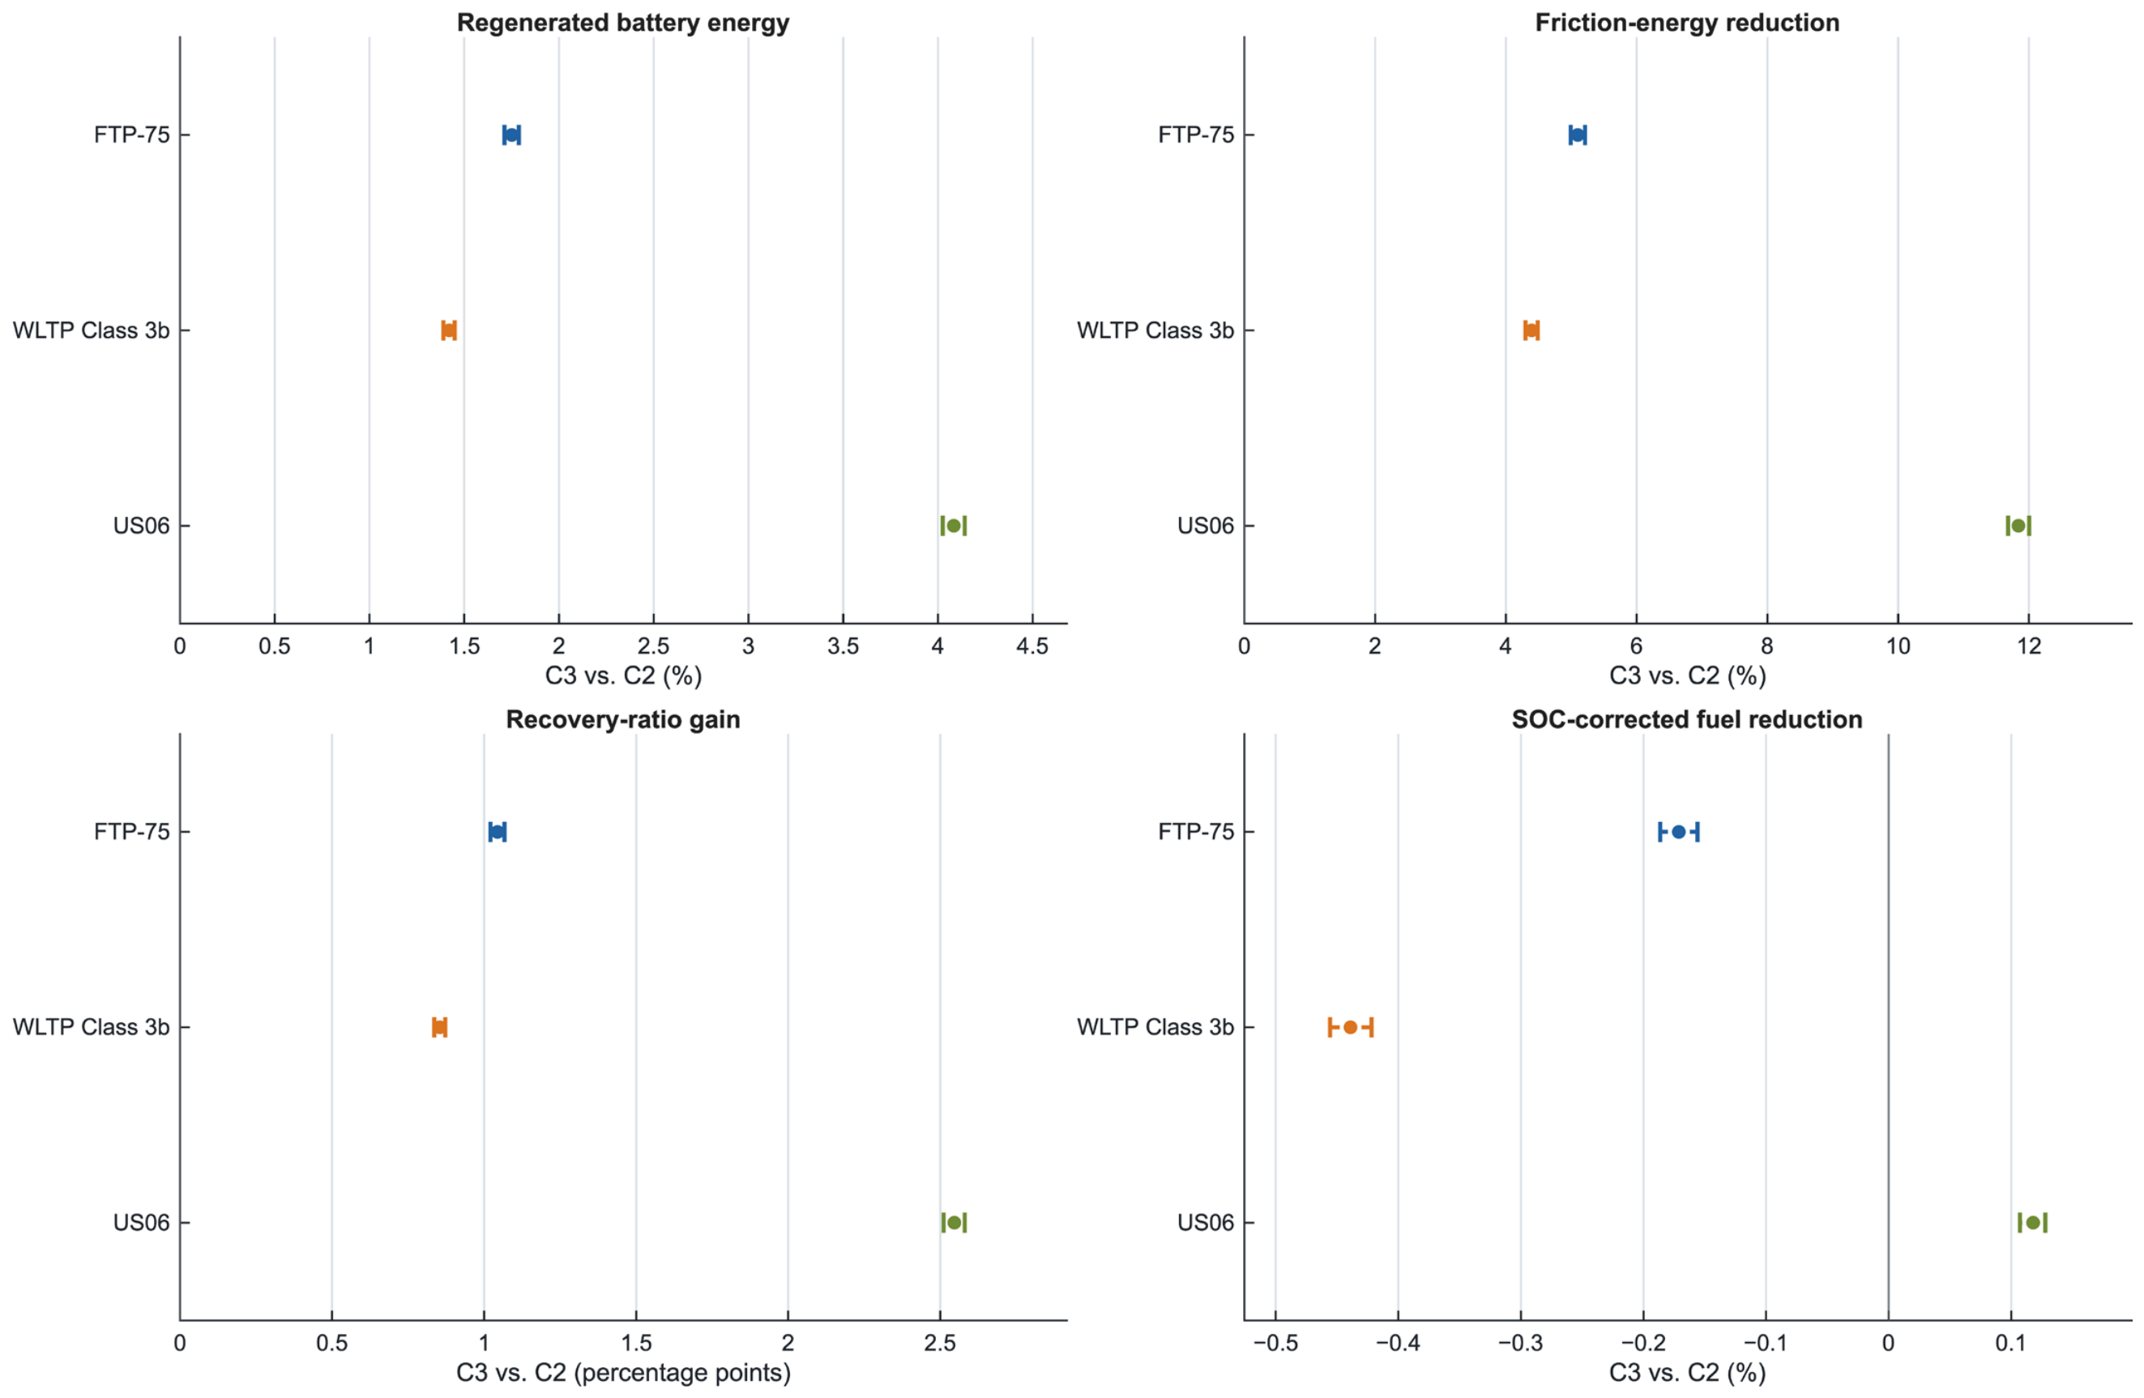
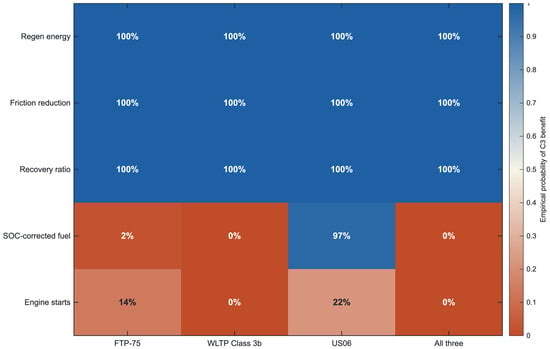
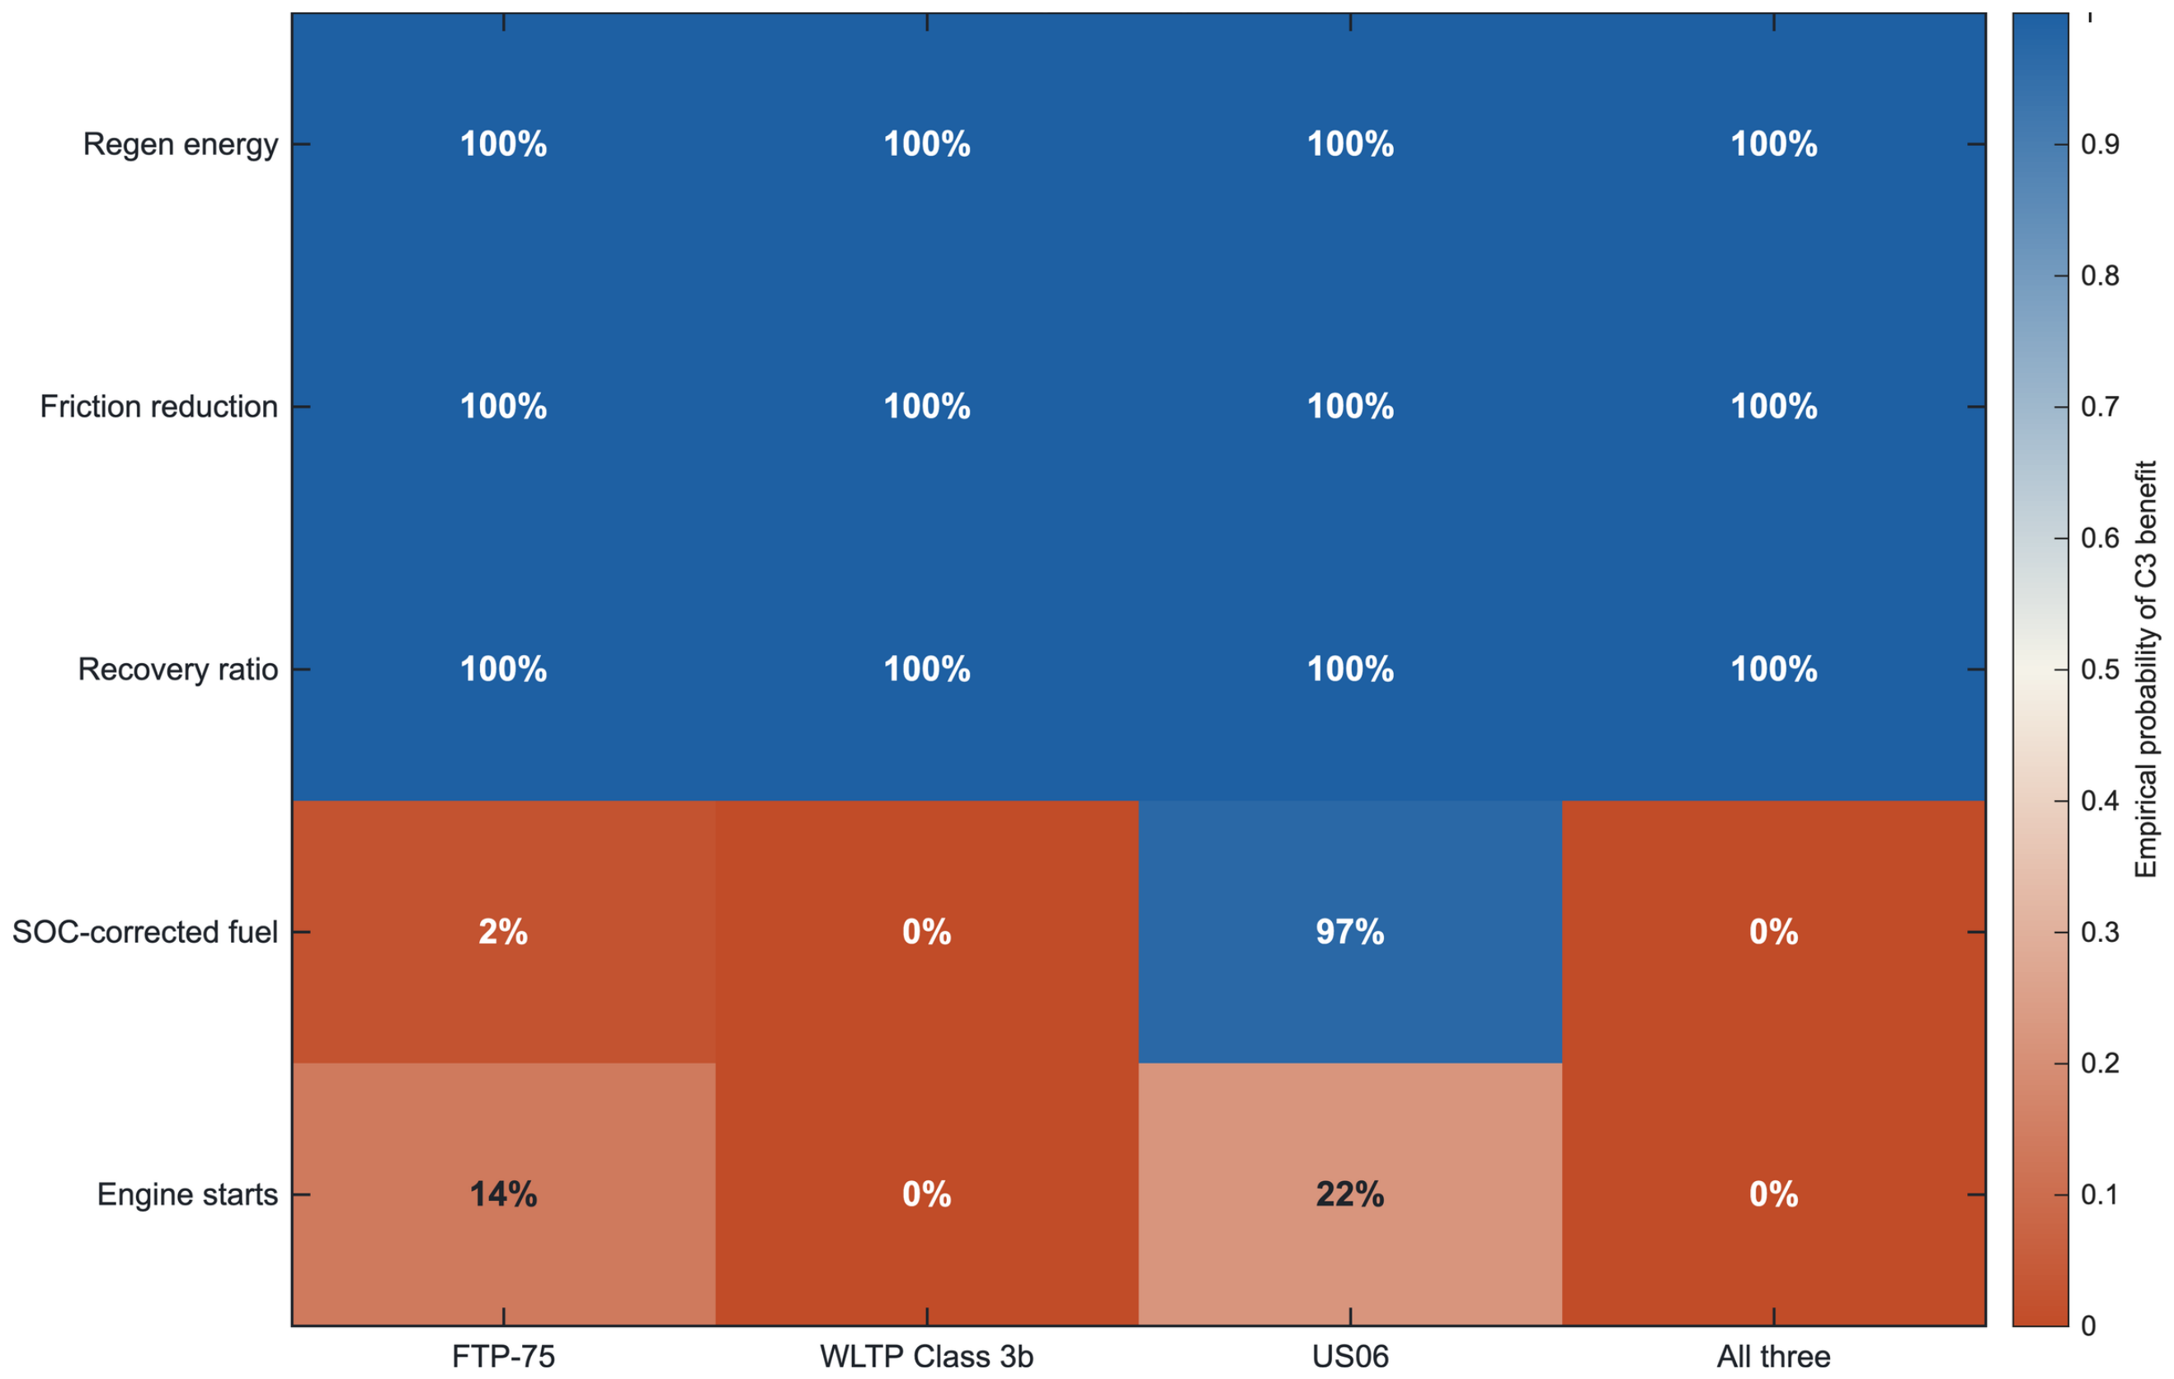
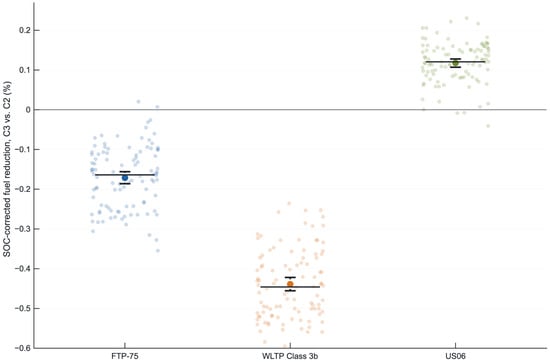
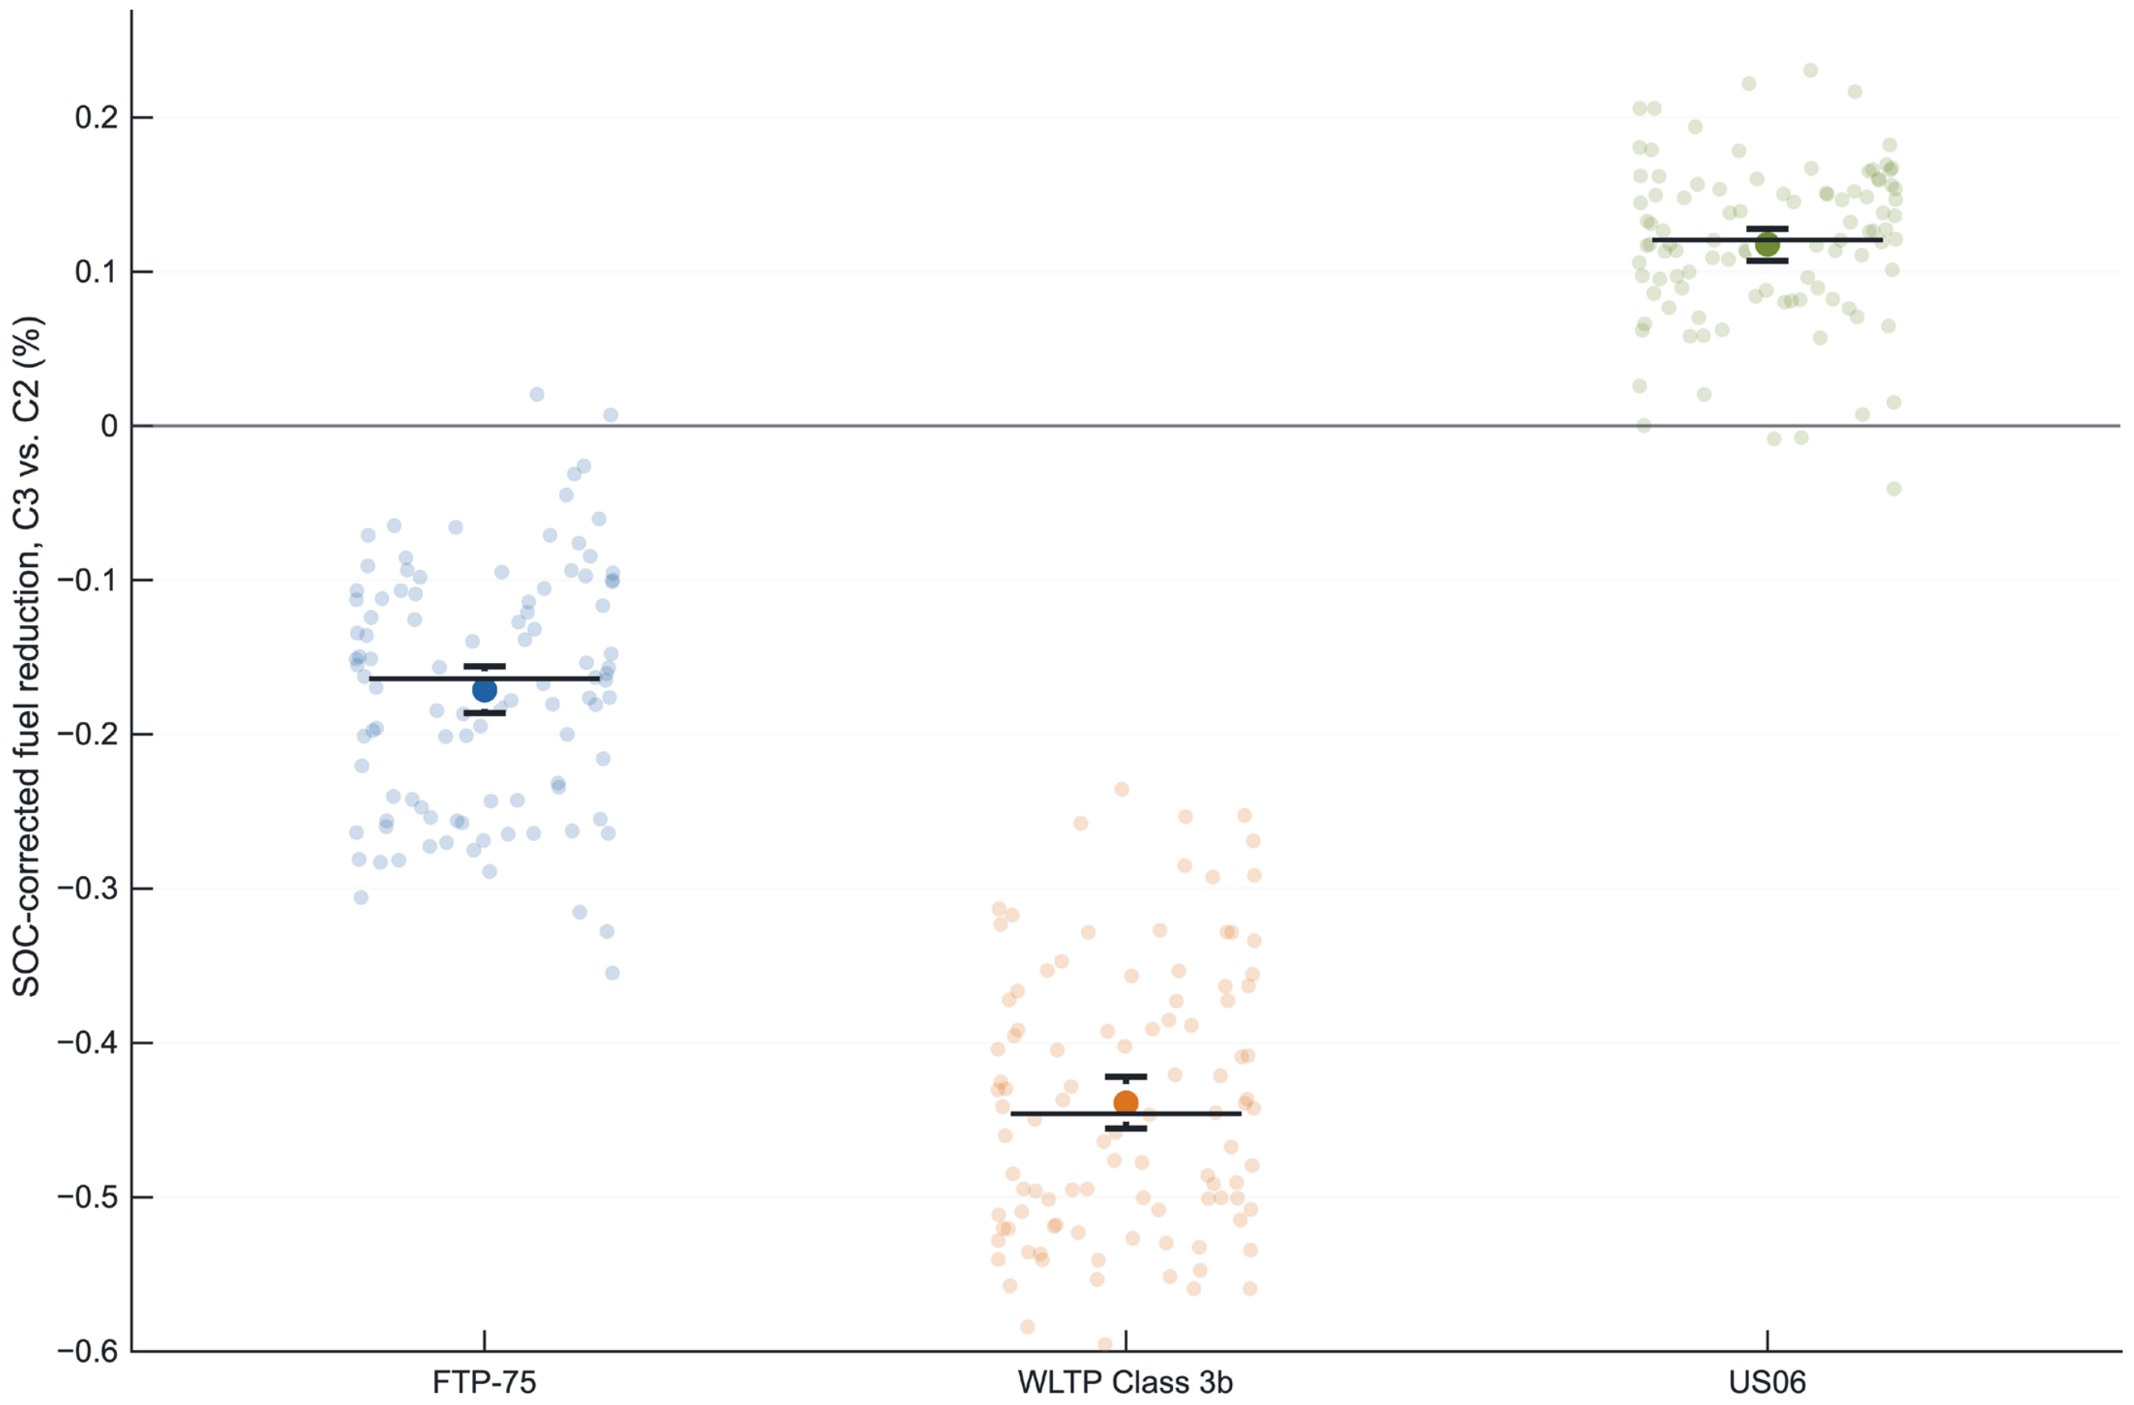
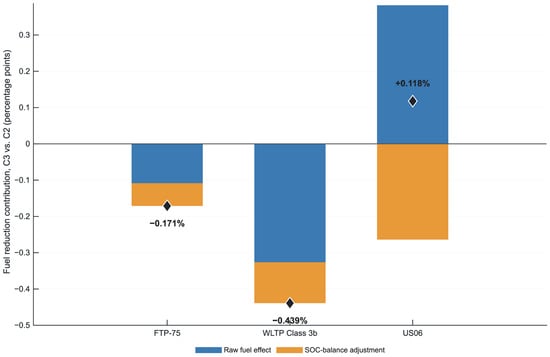
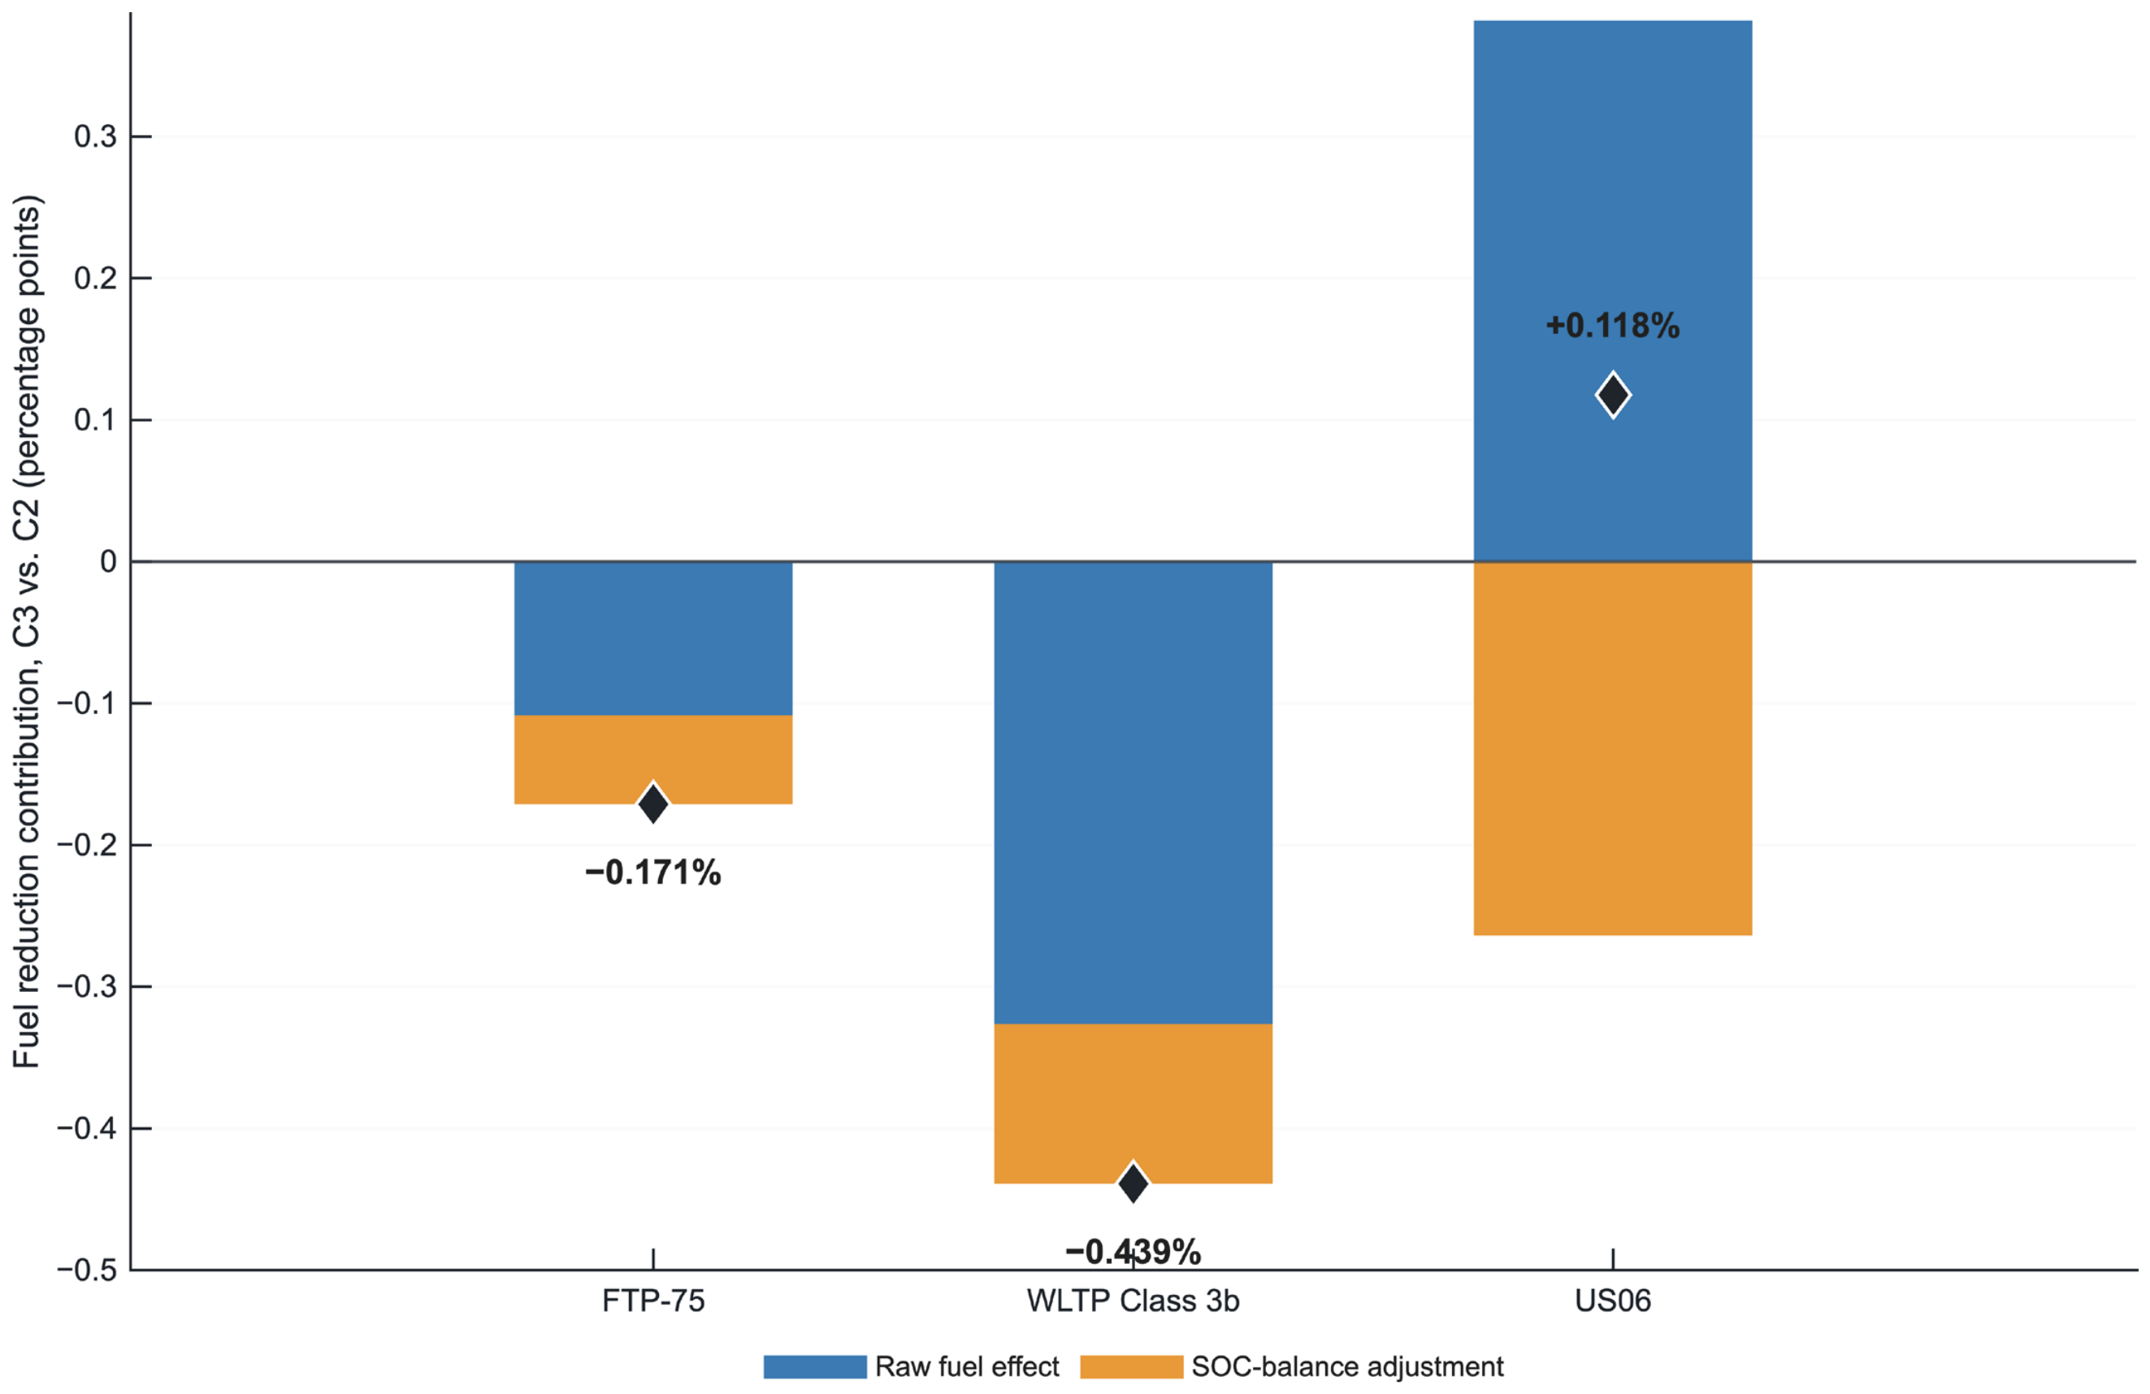
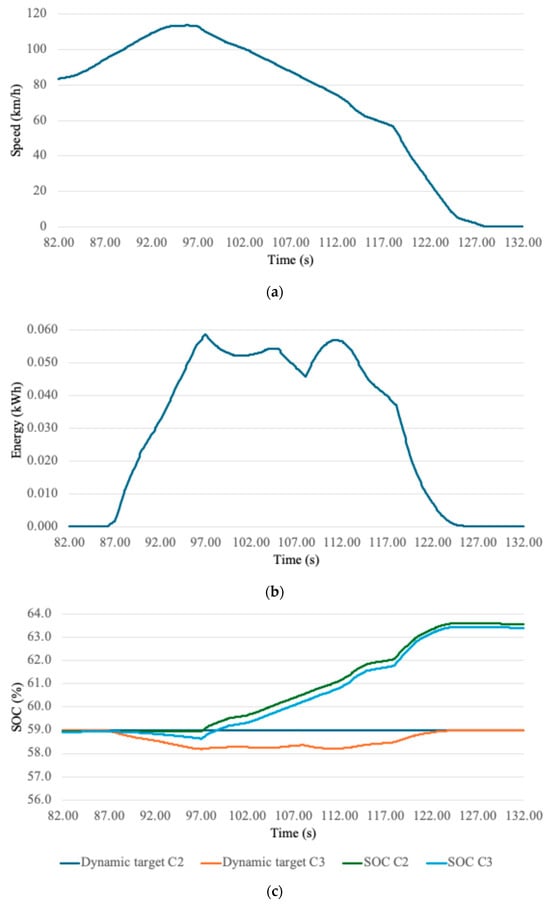
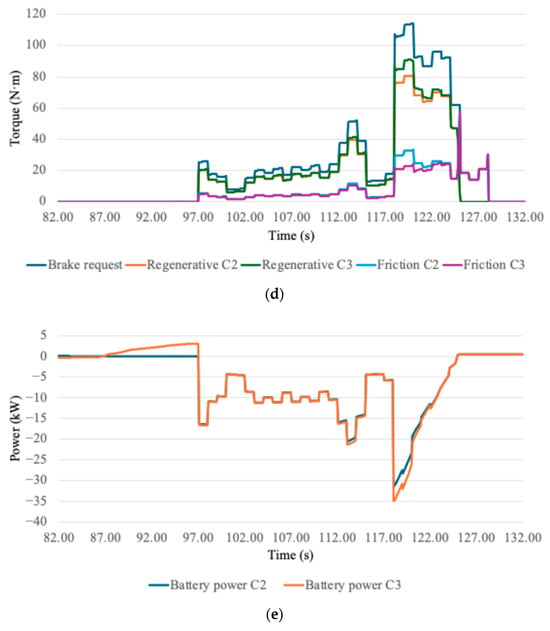
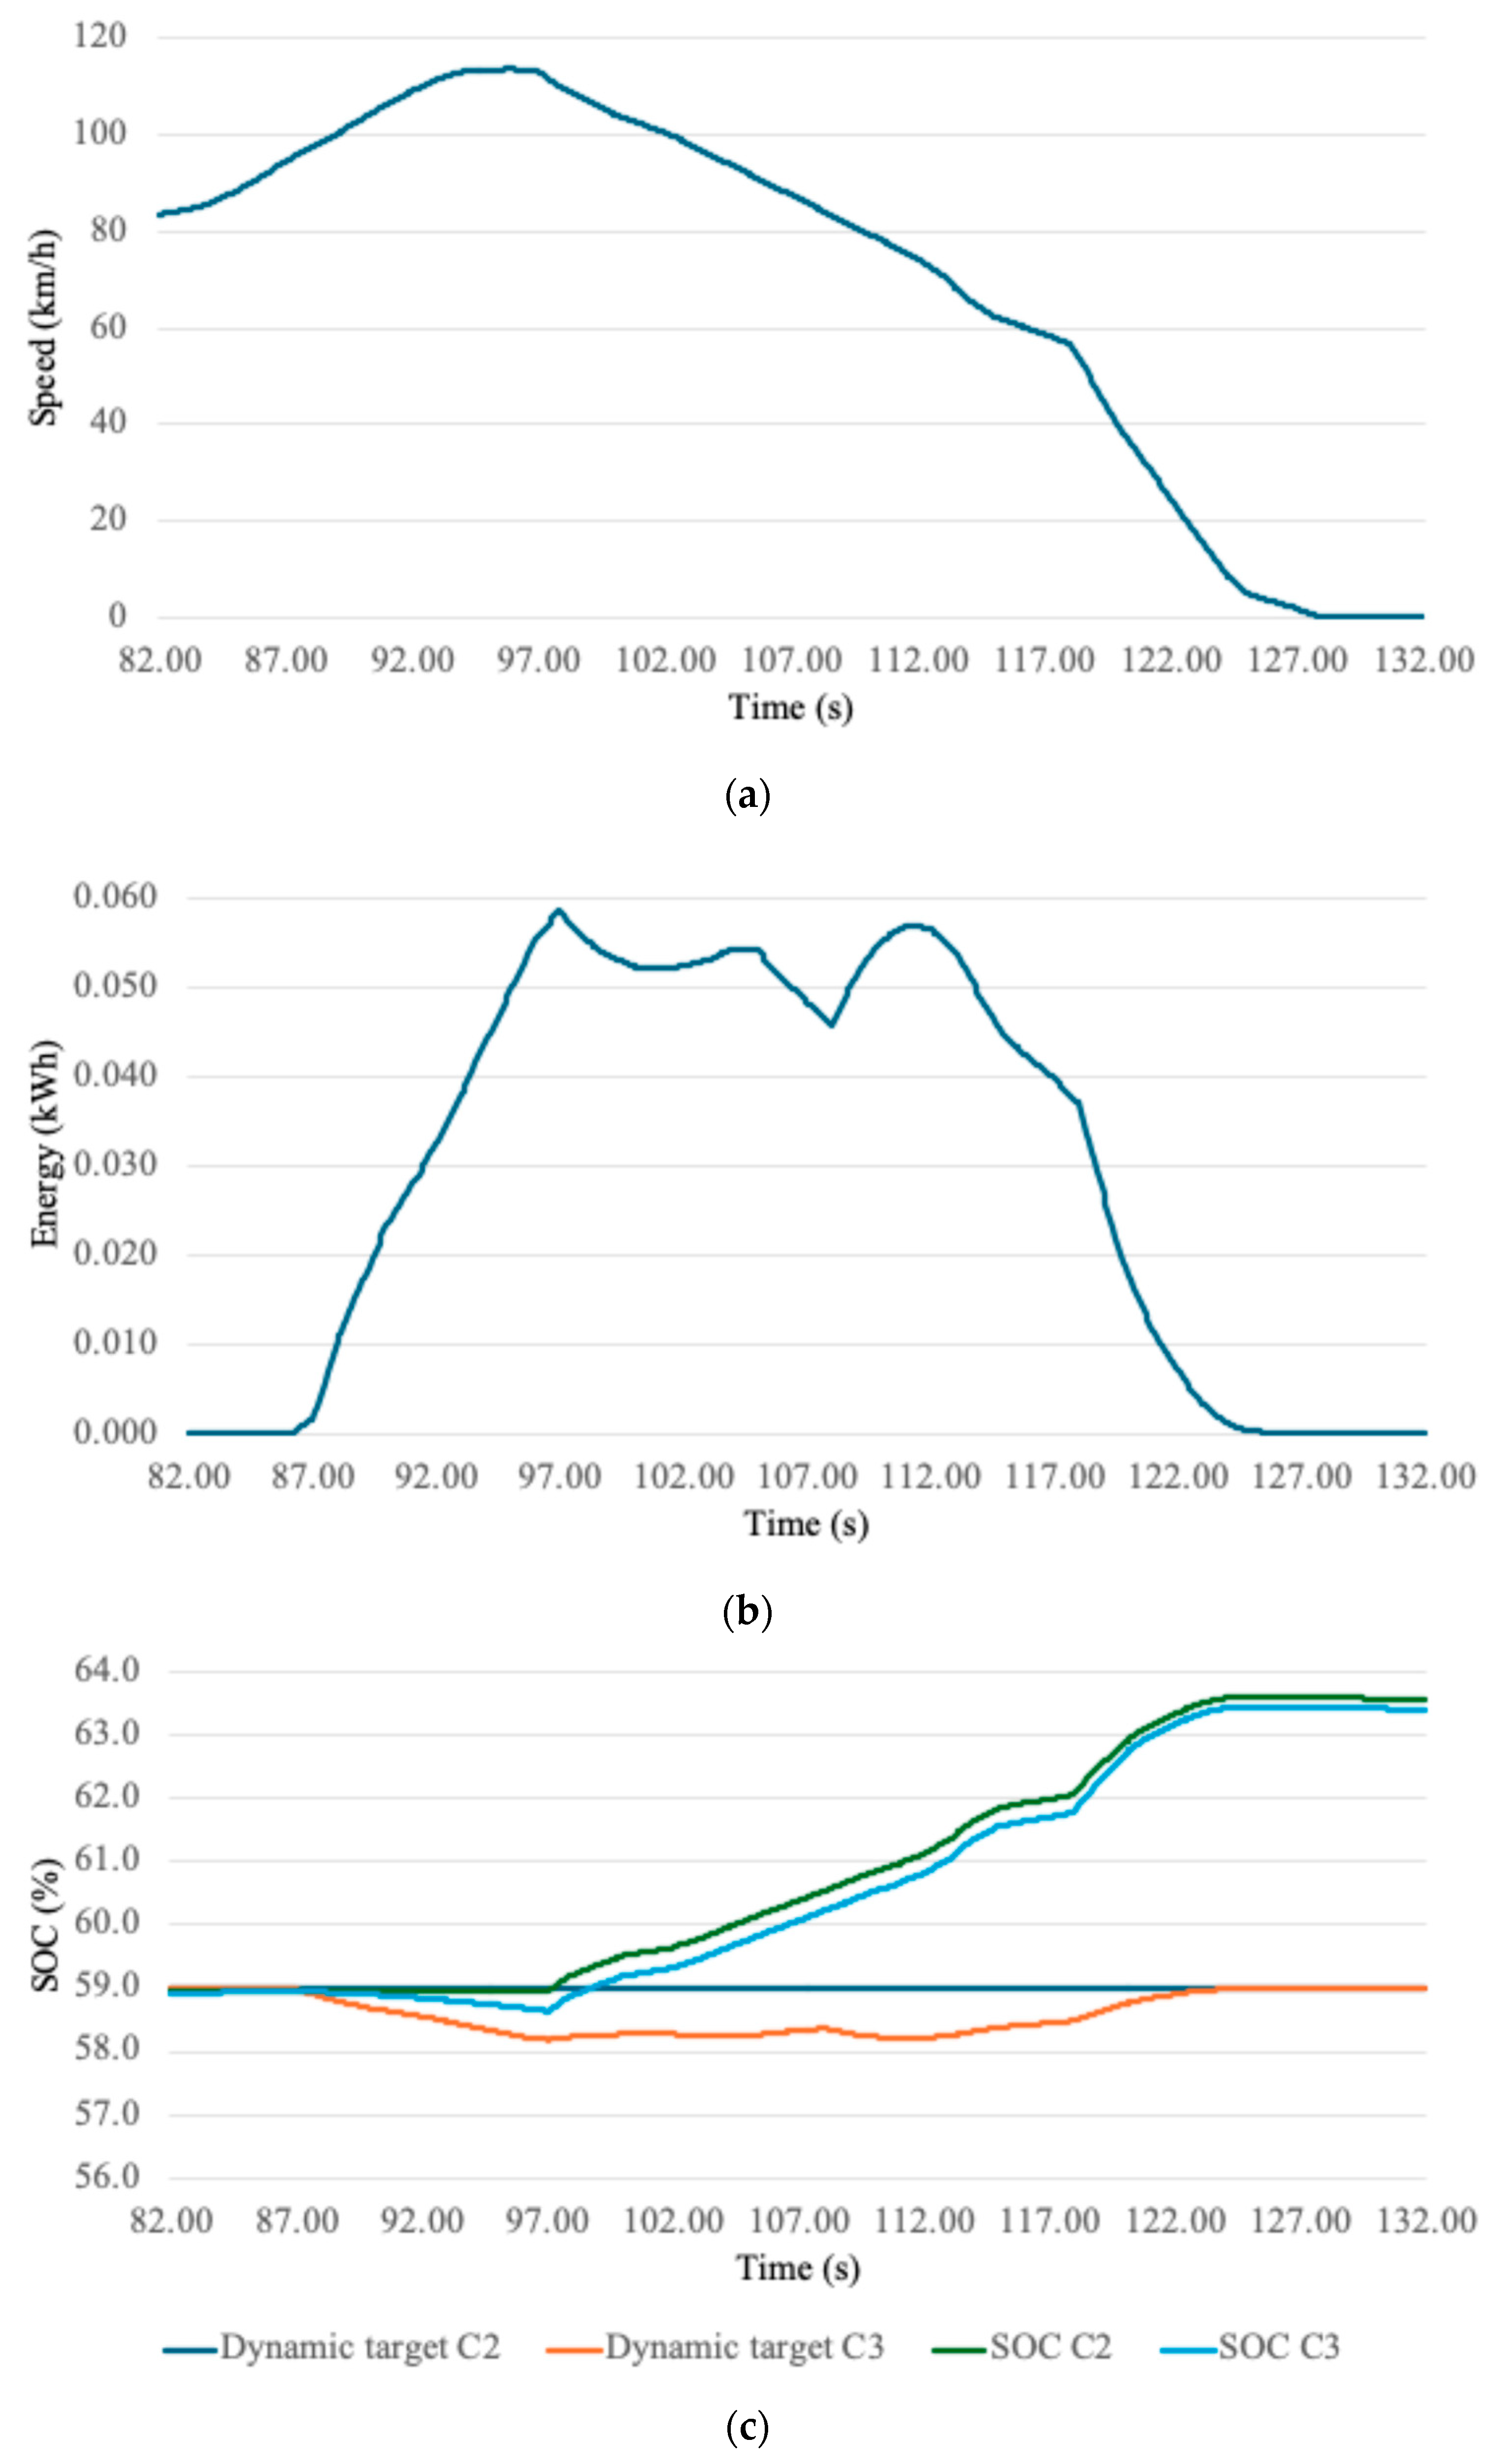
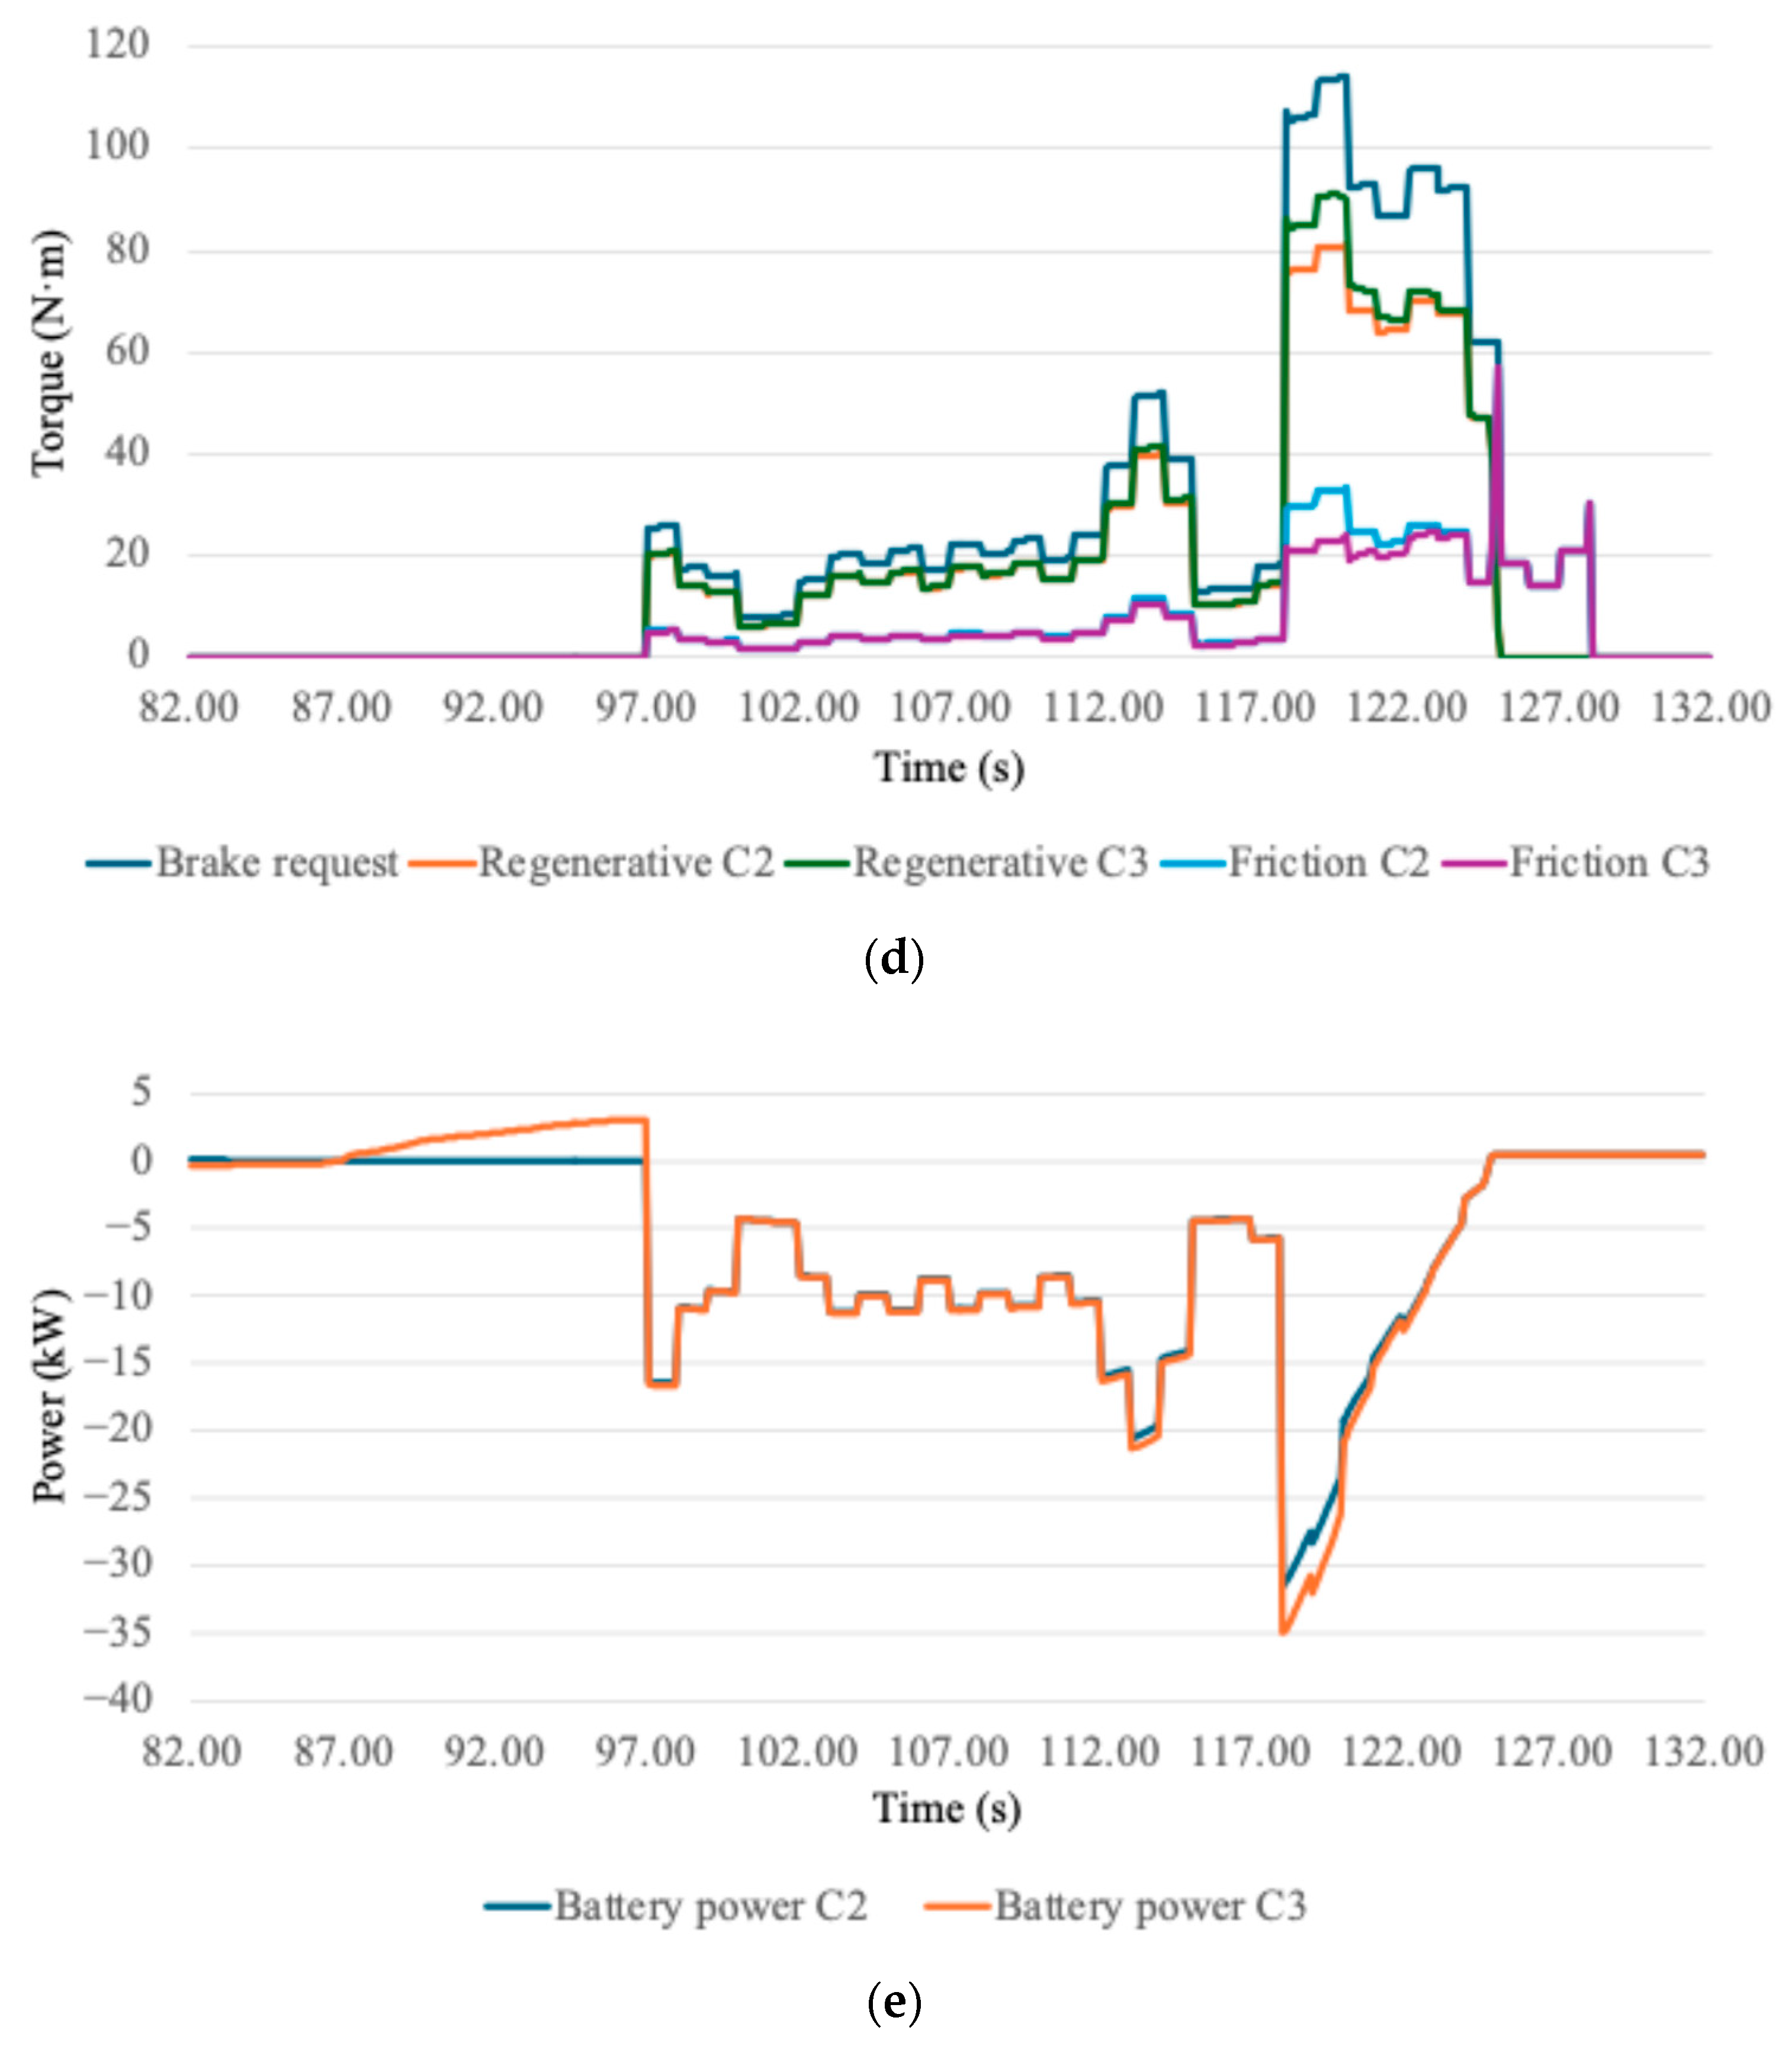
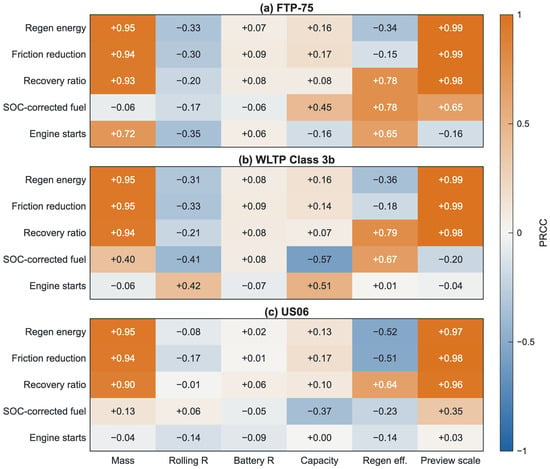
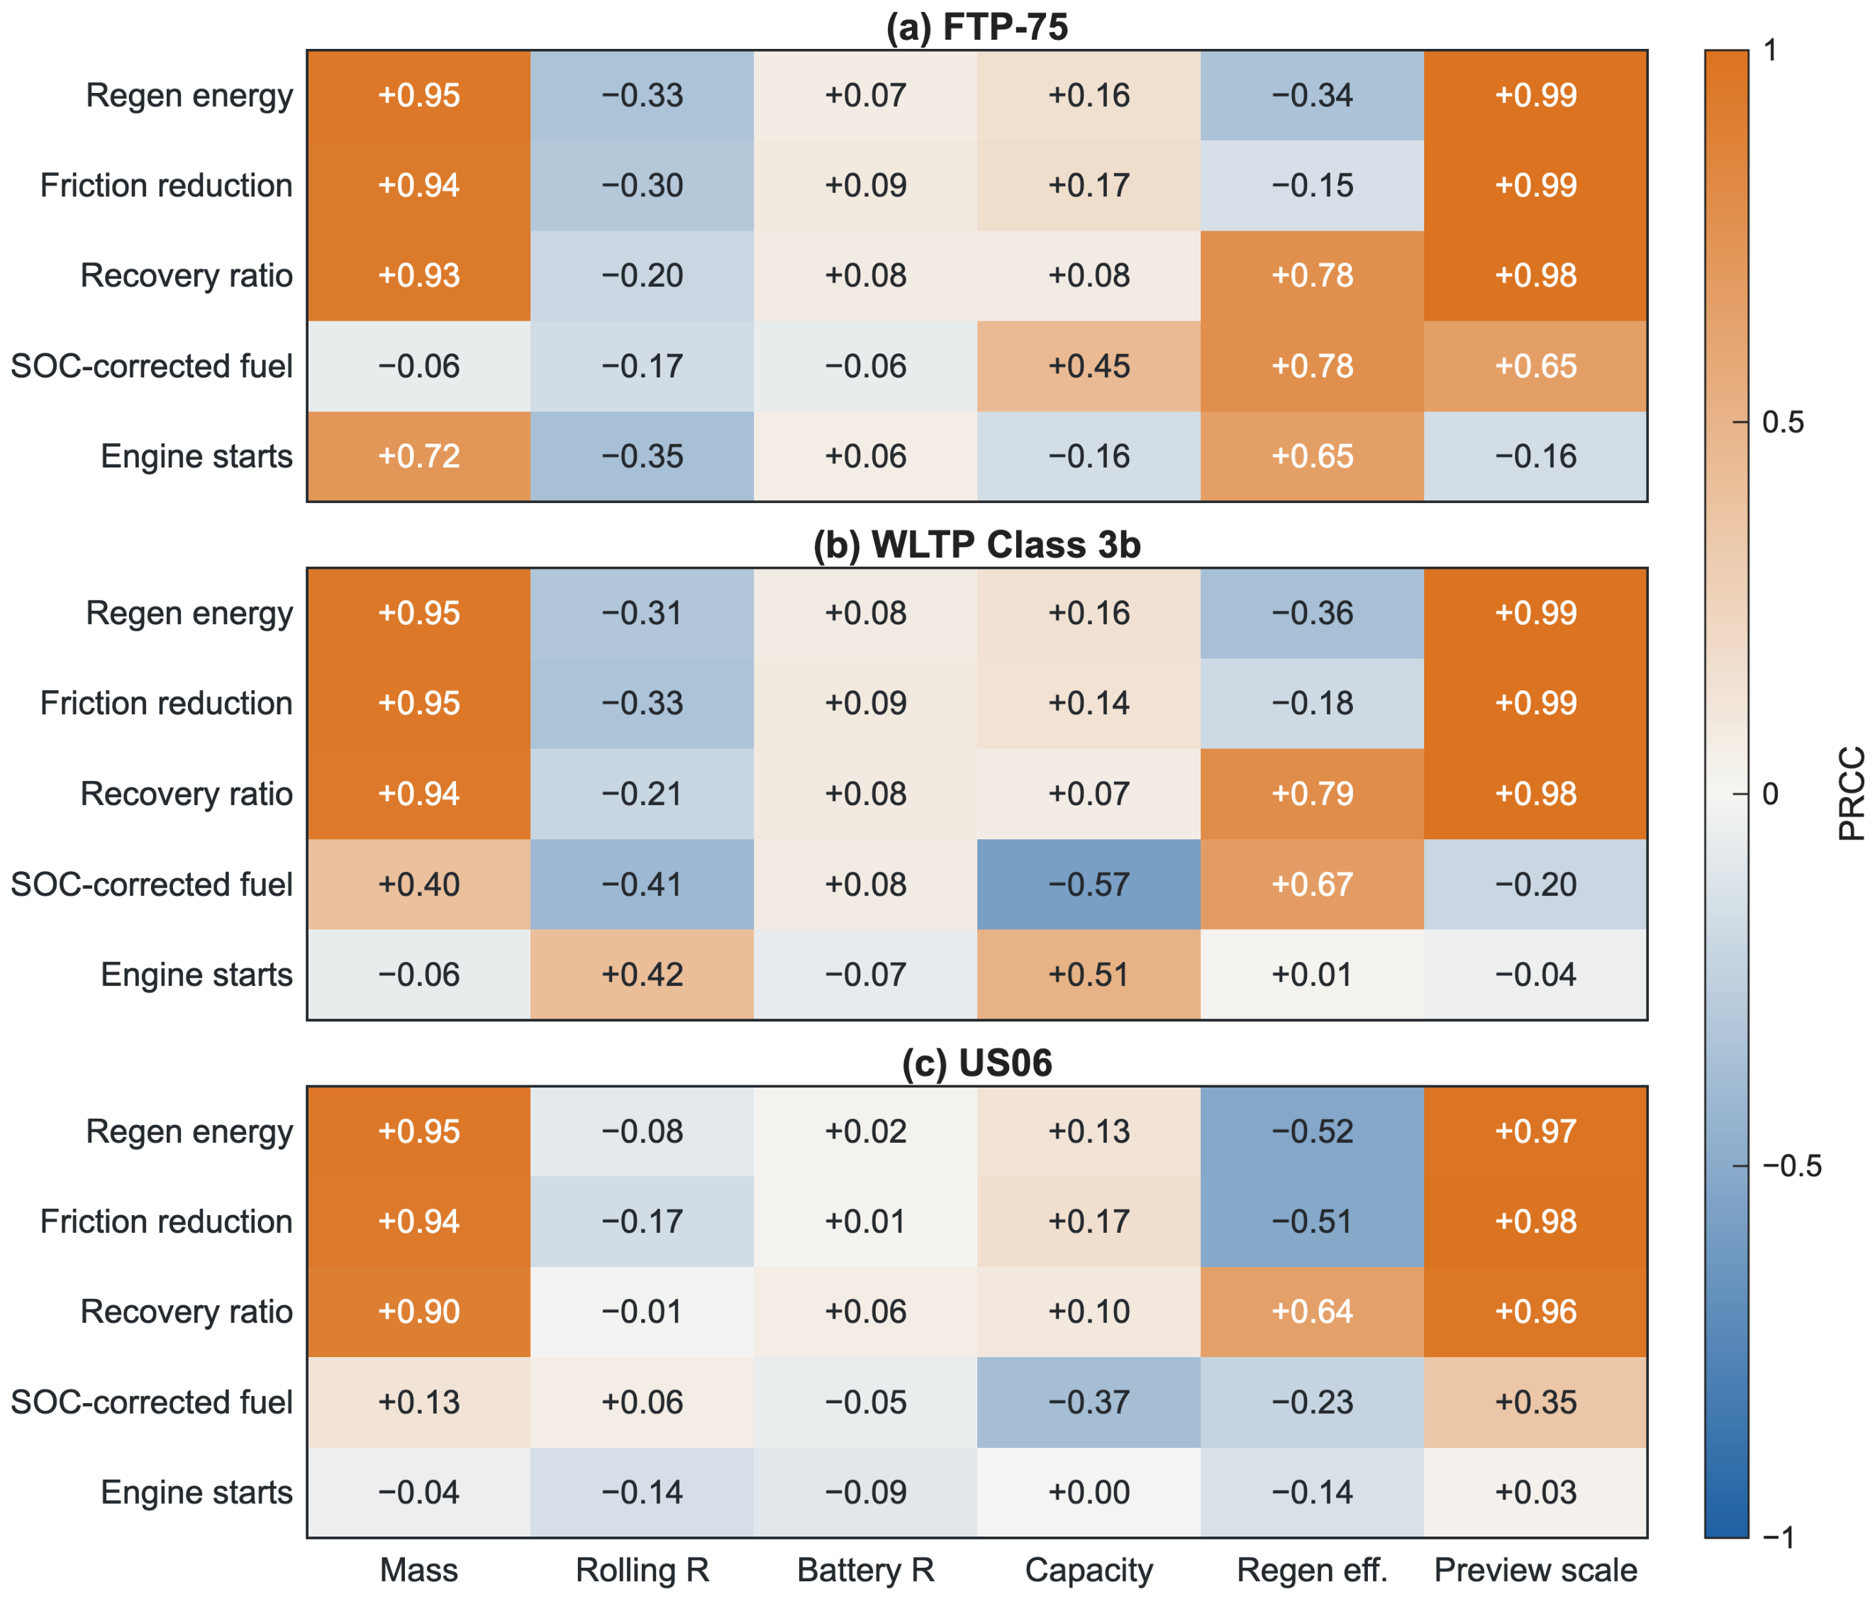

Disclaimer/Publisher’s Note: The statements, opinions and data contained in all publications are solely those of the individual author(s) and contributor(s) and not of MDPI and/or the editor(s). MDPI and/or the editor(s) disclaim responsibility for any injury to people or property resulting from any ideas, methods, instructions or products referred to in the content. |
© 2026 by the authors. Licensee MDPI, Basel, Switzerland. This article is an open access article distributed under the terms and conditions of the Creative Commons Attribution (CC BY) license.