


Abstract
To develop a refined traffic diversion scheme for expressway reconstruction and expansion, this study establishes generalized link impedance functions for cars and trucks, considering their differences in road travel time, time value, and toll costs. Subsequently, a traffic diversion model is constructed based on user equilibrium theory, taking the heterogeneity between cars and trucks into consideration. A path-based solution algorithm using the method of successive averages is designed to solve the model. To evaluate the environmental impact of the traffic diversion, a vehicle exhaust emission (including CO2, CO, HC, and NOx) estimation method based on the COPERT model is proposed. The results of a case study show that the optimized traffic diversion scheme significantly reduces the average V/C ratio while increasing the average velocity of both cars and trucks on the reconstructed links, without substantially compromising the traffic efficiency of other links. Additionally, the diversion scheme reduces the exhaust pollutant emissions, but increases the CO2 emissions within the network. The findings justify the effectiveness of the traffic diversion approach on alleviating the traffic congestion on the reconstructed expressway and its mixed impacts on the environment.
1. Introduction
To improve pavement performance and alleviate traffic congestion, the reconstruction and expansion of existing expressways has become a central task in China’s transport infrastructure agenda. For example, during the last five years, Guangdong Province in China has accomplished the reconstruction and expansion projects for more than 1500 km of expressways. The workloads during the projects typically occupy existing lanes and thus inevitably reduce highway capacity. It necessitates a traffic diversion scheme, which splits a proportion of the traffic flow on the reconstructed expressway to its neighboring highways.
In the literature, a substantial body of research has been devoted to the traffic diversion during expressway reconstruction and expansion. For the reconstruction and expansion projects of many expressways in China, such as the Shanghai–Kunming Expressway, the Beijing–Hong Kong–Macao Expressway, and the Lianyungang–Khorgos Expressway, traffic diversion schemes were designed based on engineering experiences. Although they are easy to implement, the impacts of the diversion schemes on the traffic conditions of the reconstructed expressways and their surrounding highways are neglected. To address this problem, with reference to traffic assignment theory, some researchers have developed traffic diversion approaches based on the user equilibrium (UE) model [1], the system optimum (SO) model [2,3], and the stochastic user equilibrium (SUE) model [4]. Traffic indicators, such as the degree of saturation, were usually adopted to evaluate the performance of the optimized traffic diversion scheme.
Nevertheless, in these studies, the traffic flow is measured by car units, which neglects the heterogeneity between cars and trucks. Kong et al. [5] found that truck penetration has a significant influence on traffic congestion and stability. Thus, incorporating the car–truck heterogeneity into traffic diversion models would help design car-/truck-specific diversion schemes and further improve the performance of the highway network around the reconstructed expressway. While a few studies [6,7] considered the car–truck heterogeneity, they assumed identical travel time for cars and trucks on any roadway link, which neglects their significant differences in traveling velocity. Additionally, in these traffic assignment-based approaches, it is assumed that the route choice is merely based on vehicle travel time. However, in a roadway network with expressways, the toll is also an important factor with a significant effect on the route choice.
From the perspective of the environment, vehicle exhaust emissions are the primary source of greenhouse gases and air pollution. The traffic diversion, which changes vehicle travel routes and network traffic conditions, would influence the amount of vehicle exhaust emissions. In the literature, various methods, such as Real Driving Emissions (RDEs) [8], MOVES [9], CMEM [10], MOBILE [11], and COPERT [12], have been proposed for estimating vehicle exhaust emissions at the micro or macro level. Among them, the COPERT model can estimate the emissions of CO2 and typical air pollutants for different types of vehicles based on their average velocity [13]. Thus, it is quite suitable for quantifying the environmental impacts of the traffic diversion schemes.
To overcome the above limitations, we construct the impedance functions of roadway links for cars and trucks, where their differences in travel time, value of time, and toll charges are explicitly considered. Then, a UE-based traffic diversion model for cars and trucks is developed, in which the car-/truck-specific link impedance functions are incorporated. A path-based solution algorithm using the method of successive averages (MSAs) is proposed for solving the model. In addition to the traffic efficiency, the vehicle exhaust emissions of the traffic diversion scheme are also evaluated based on the COPERT model. Lastly, the proposed methods are demonstrated by a case study in Guangdong Province, China.
2. Preliminaries
2.1. Description of Traffic Diversion Network
The traffic diversion network for expressway reconstruction and expansion projects usually consists of the reconstructed expressway and its surrounding roadways. Various road types, such as expressways, national and provincial arterials, and urban streets, may exist in the network. These roads can be classified as tolled or non-tolled based on fee collection. Mathematically, the network is defined as , where is the set of nodes, is the set of links, and is the set of tolled links with . denotes the set of origin–destination (OD) pairs in network . Moreover, and represent the sets of feasible paths for cars and trucks, respectively, between each OD pair in the network.
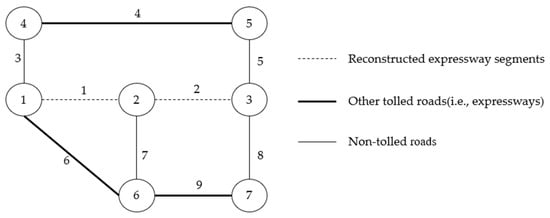
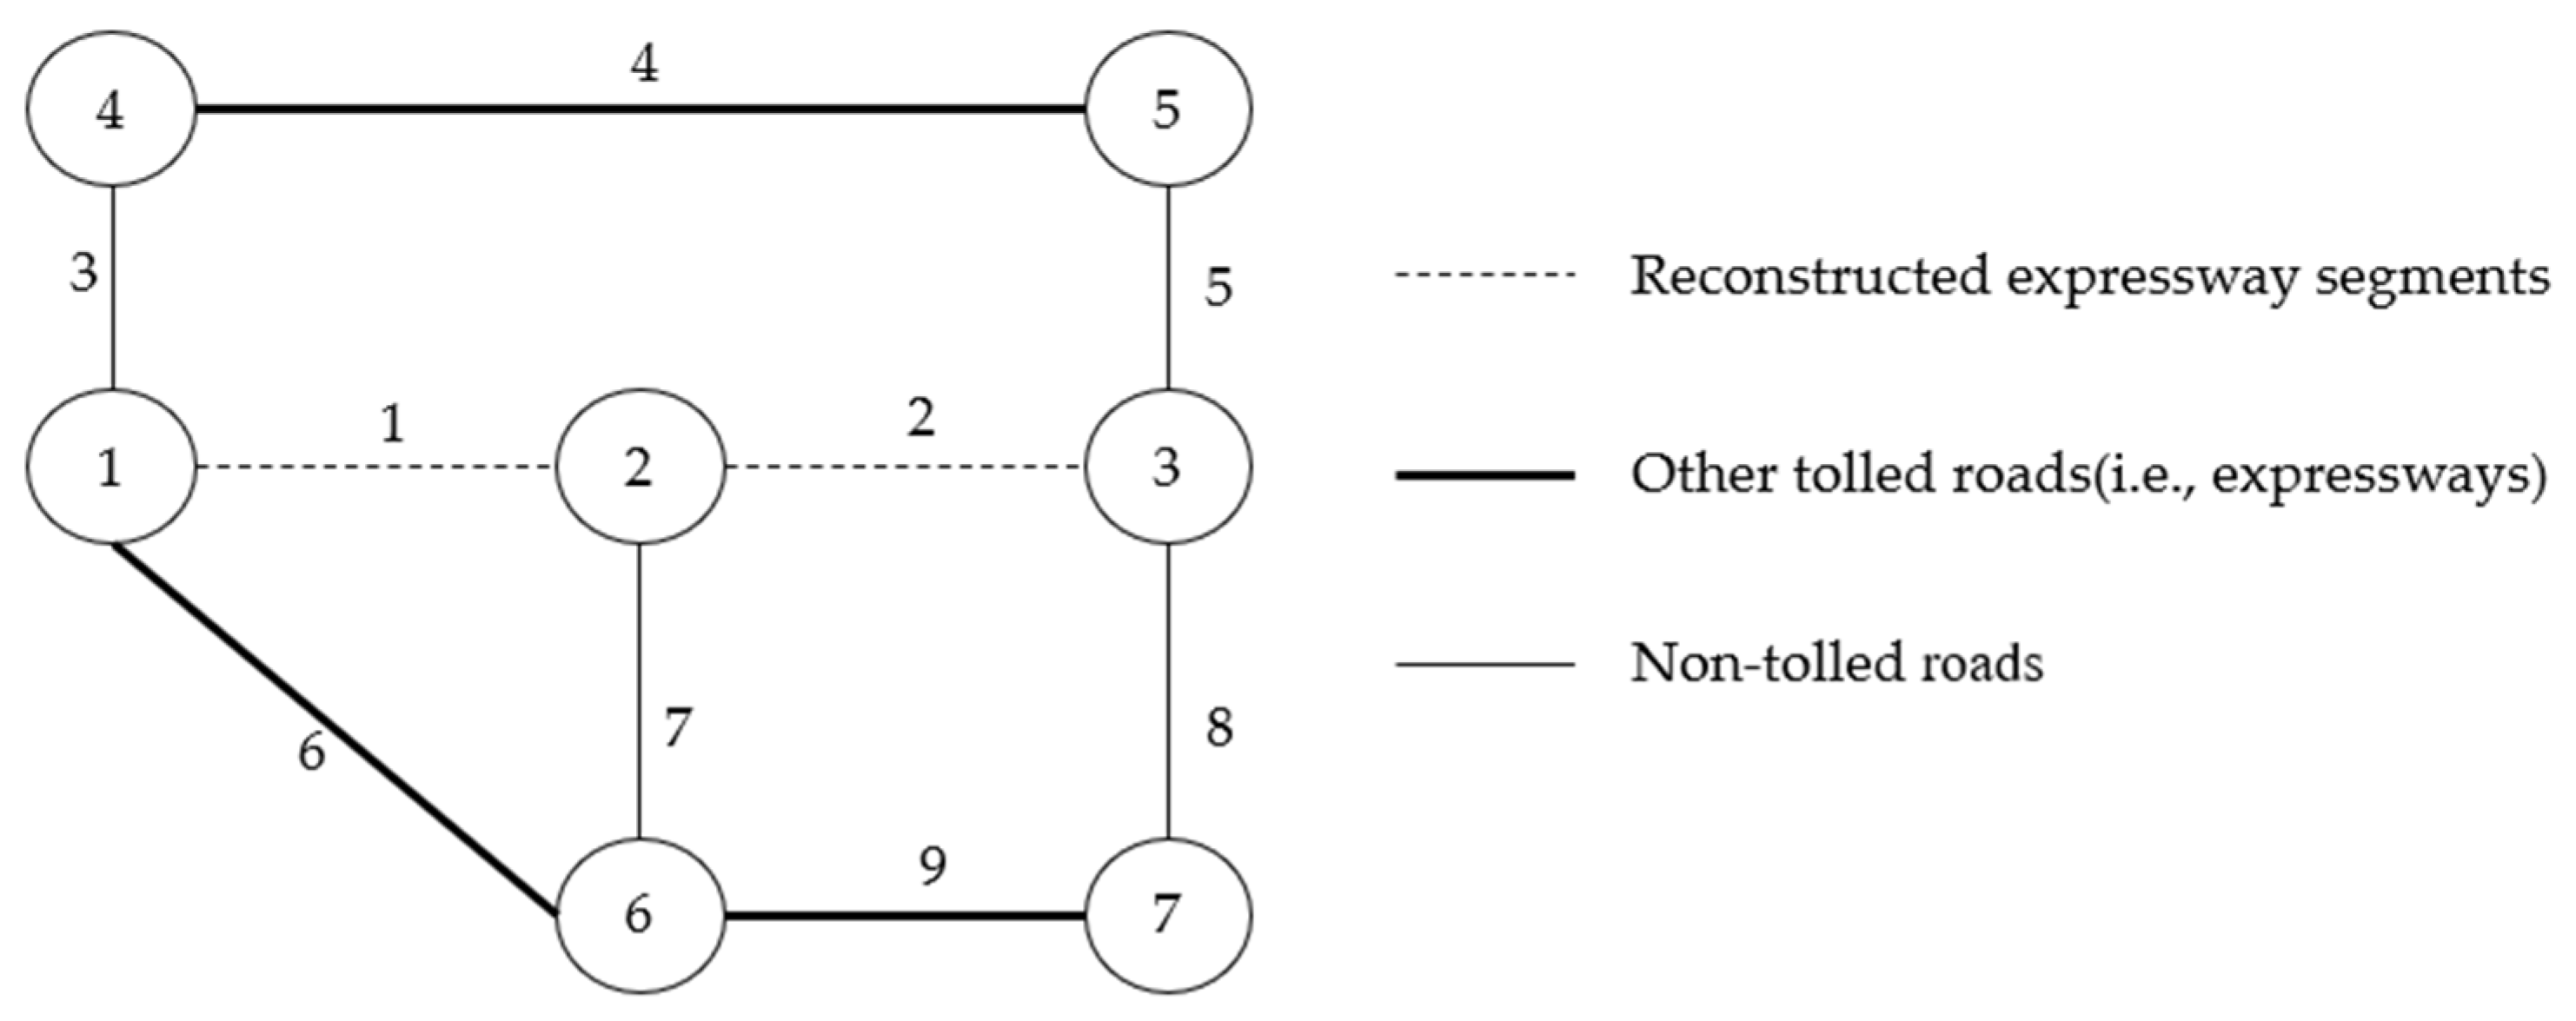
Figure 1 shows an example of a traffic diversion network with seven nodes and nine bidirectional links. The numbers on the links indicate their identifiers. In the figure, dashed lines represent the reconstructed expressway segments. Thick solid lines represent other tolled roads (i.e., expressways), and thin solid lines represent non-tolled roads.
Figure 1.
Schematic diagram of divergence road network (Numbers in circles denote node IDs, and numbers beside the links denote link IDs).
The traffic demand of cars and trucks between OD pair is denoted as and , respectively. Then, the traffic flow conservation for each vehicle type can be expressed as the following equations:
where and are the traffic volumes of cars and trucks on path between OD pair , respectively.
The link flow is the key determinant of travel time, which is an important component of its impedance. The traffic volumes of cars and trucks on link are denoted as and , respectively, which can be computed as
where is an indicator variable: , if link is on path between OD pair , and otherwise.
2.2. Generalized Link Impedance Functions for Cars and Trucks
In reality, drivers choose the travel path among the alternatives, taking many aspects into consideration, such as travel time, cost, safety, comfort, and even personal preferences [14]. This multi-criteria decision process is often made according to the total impedance of links within each feasible path. Thus, the link impedance functions serve as an important basis of model development for traffic planning and traffic diversion. However, in the previous studies, only the travel time was used to measure the link impedance, which is usually formulated by the BPR function.
In the diversion network for expressway reconstruction and expansion, some roads are tolled. As a result, the road toll should also be included in the link impedance [15]. Then, generalized link impedance functions are developed by combining the travel time and road toll. Given the differences between cars and trucks in travel velocity, toll rate, and time value, the generalized link impedance functions for each vehicle type are formulated. Specifically, the impedance functions for cars and trucks are expressed as
where and represent the generalized impedance for cars and trucks on link , respectively. and are the time value coefficients for cars and trucks, respectively, which are used to convert the travel time into monetary expenses. and represent the free-flow time for cars and trucks on link , respectively. Due to the better motor performance and higher velocity limits of cars, is usually less than . is the car equivalent factor for trucks, and is the truck equivalent factor for cars. indicates the capacity of link measured by car units, while indicates the capacity measured by trucks. and are the car-specific parameters, while and are the truck-specific parameters. and denote the toll rates for cars and trucks on link , respectively. For tolled roads, ; for non-tolled roads, . is the length of link .
Based on the link impedance functions, the path impedance of cars and trucks on path between OD pairs , and respectively, is calculated as
3. Traffic Diversion Model with Car–Truck Heterogeneity and Its Solution Algorithm
3.1. Traffic Diversion Model Considering Car–Truck Heterogeneity
The capacity of the reconstructed expressway would be reduced due to the occupied lanes by workloads. The traffic flow should be split among the surrounding roads to avoid severe traffic congestion. The traffic would reach a new equilibrium within the traffic diversion network. Following the classic UE theory, the OD demand is usually treated as an exogenous and fixed input, and drivers are assumed to choose routes according to the principle of minimum generalized travel cost [16]. The new equilibrium state must satisfy the following conditions:
where and represent the minimum path impedance for cars and trucks between OD pairs , respectively.
Thus, the traffic diversion model for expressway reconstruction and expansion with heterogeneity between cars and trucks is developed by Formulations (1)–(14). Similar to the work by Yao et al. [17], it can be transformed to a mathematical programming model as follows:
Proposition 1.
Model (1)–(14) has a solution , if and only if the optimal value of the mathematical programming model is 0.
Proof of Proposition 1.
If there is a solution for model (1)–(14), then the complementarity conditions in Equations (13) and (14) hold.
So,
That is, the value of the objective function (15) could be 0. Meanwhile, according to constraints (9)–(12), . It means that the objective function is nonnegative. Thus, the optimal value of the objective function is 0 if there is a solution for model (1)–(14).
On the other side, if the optimal value of the objective function is 0, the solution must satisfy Equations (13) and (14), because and , according to constraints (9)–(12).
Therefore, model (1)–(14) has a solution , if and only if the optimal value of the mathematical programming model is 0. □
3.2. Algorithm for Solving the Traffic Diversion Model
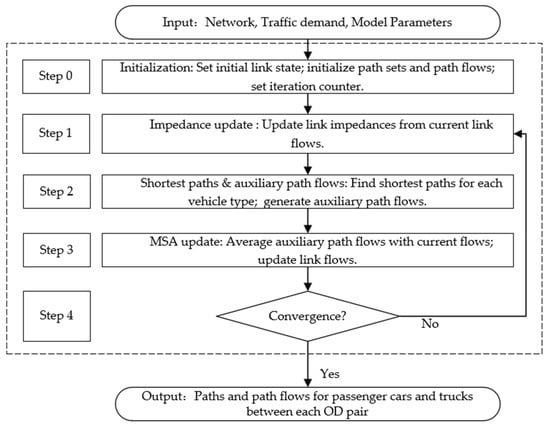
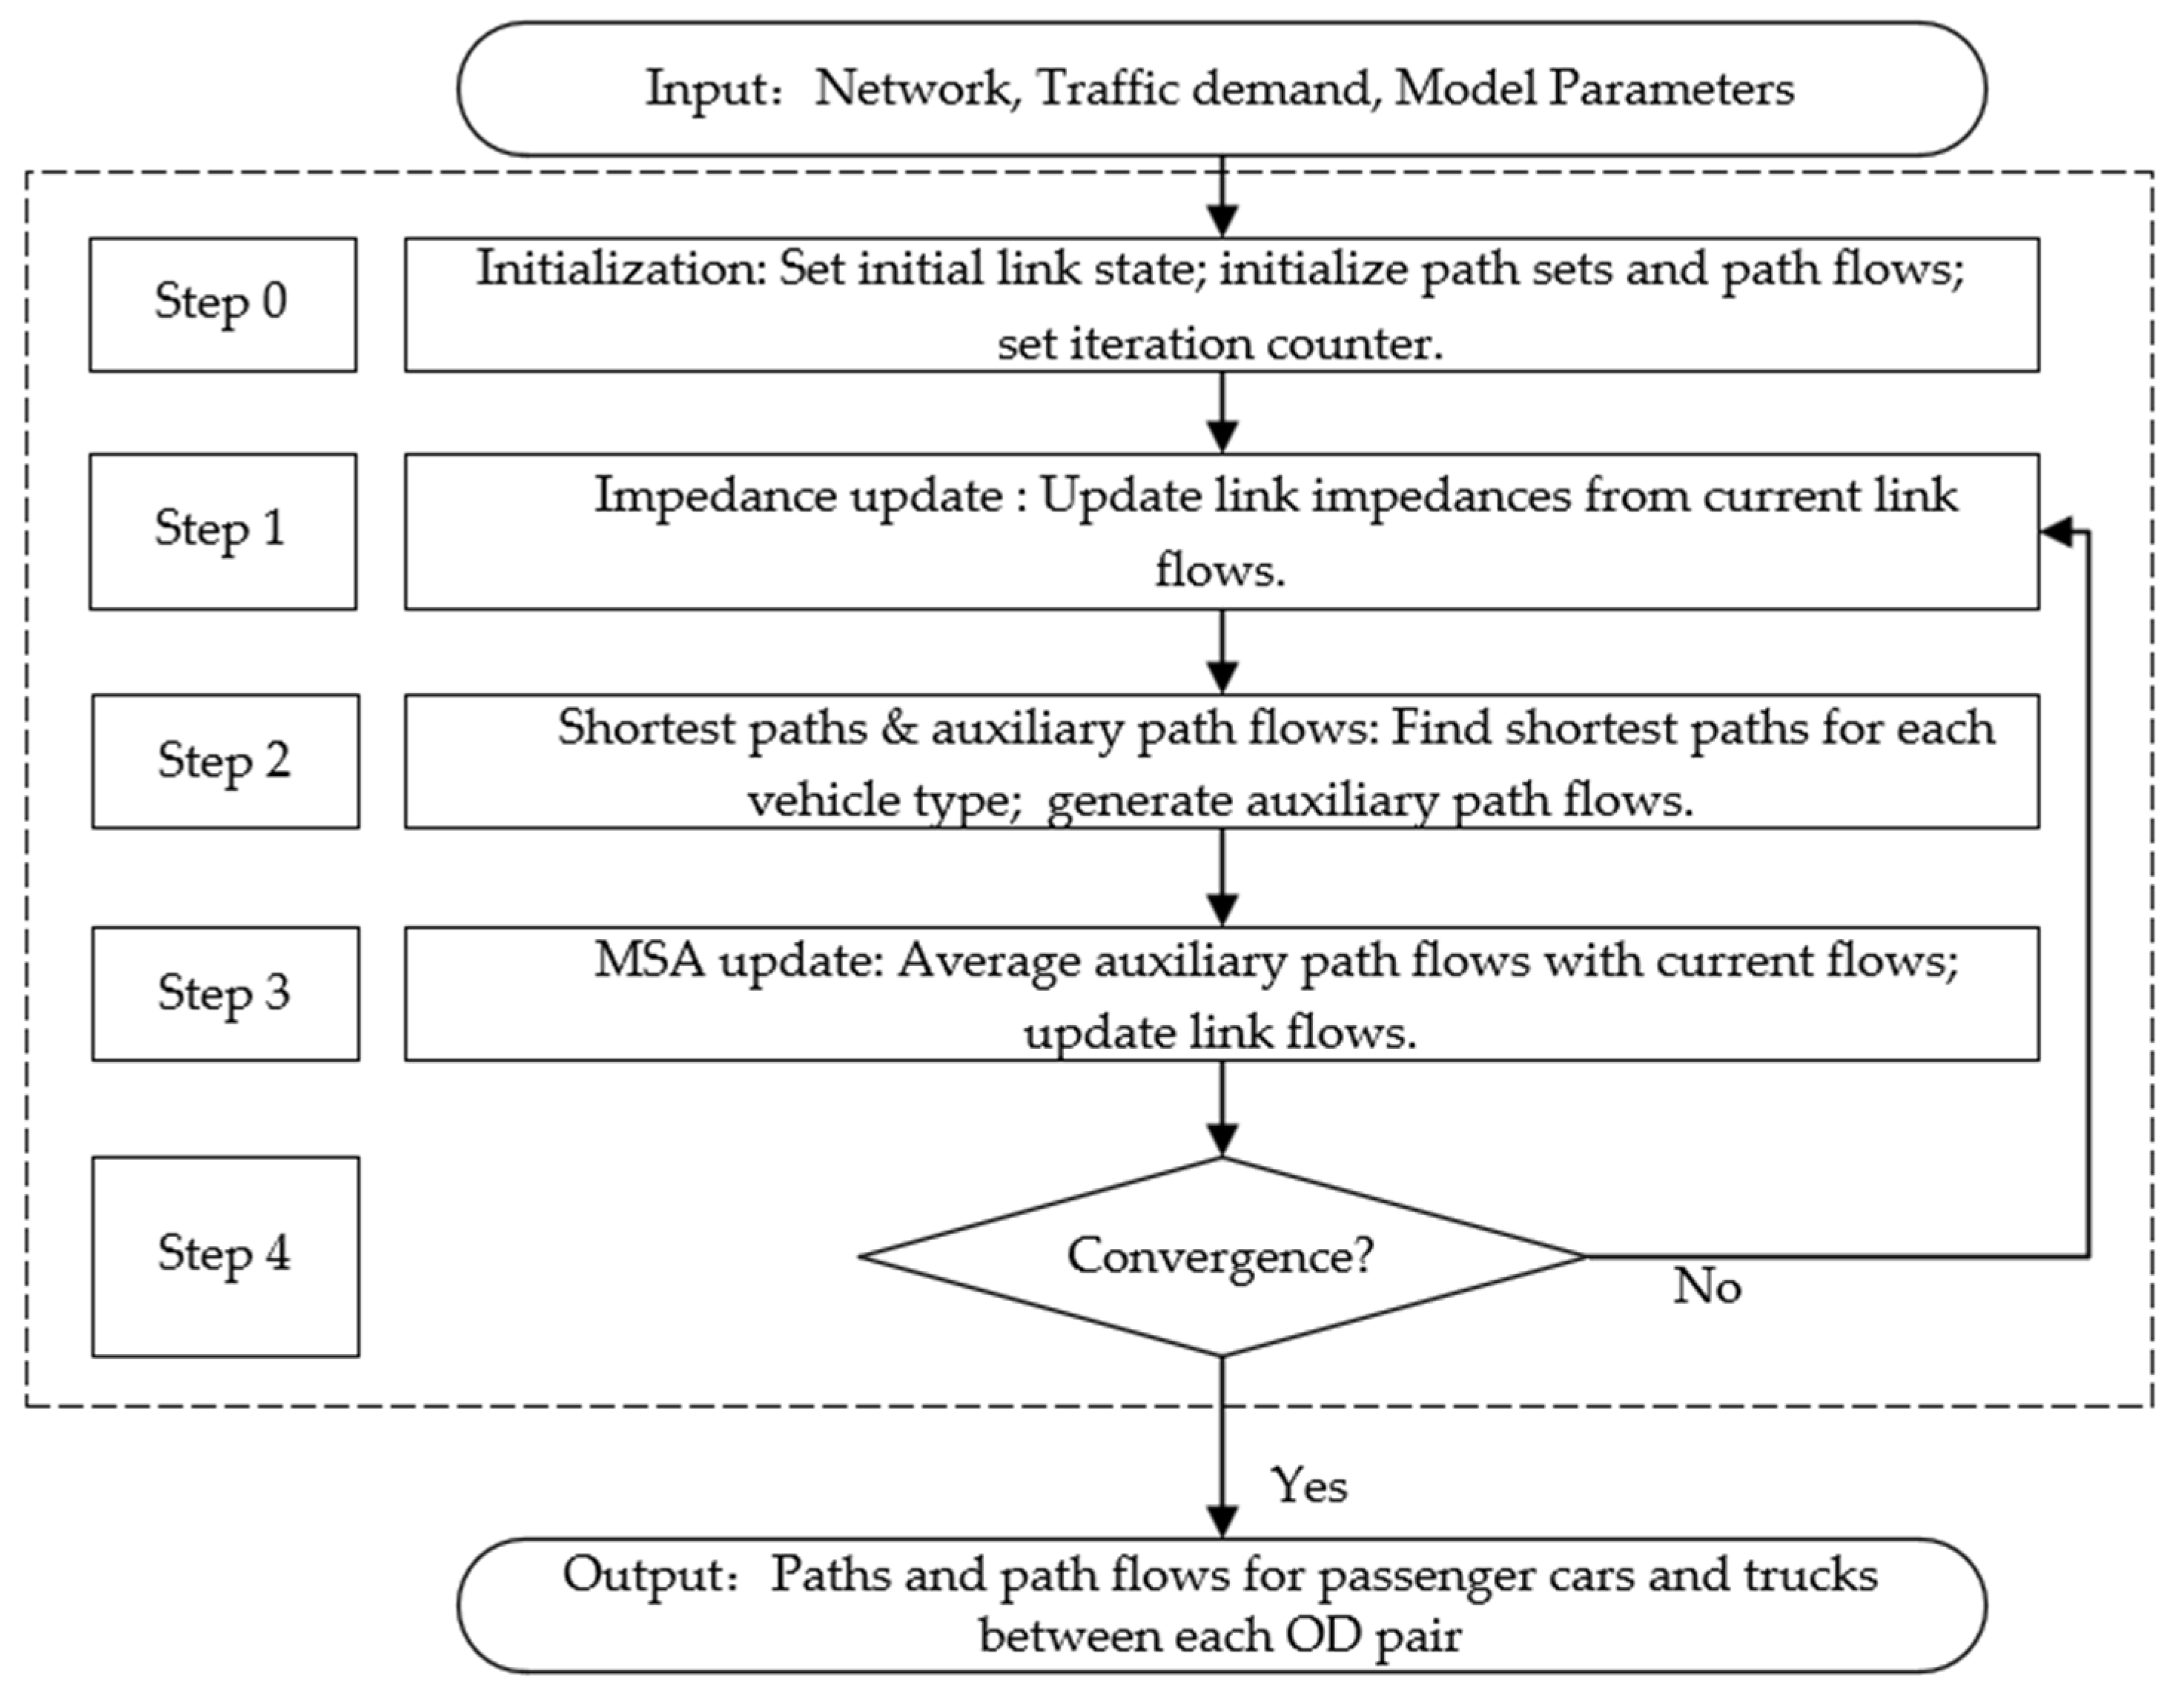
With references to the previous studies [18,19,20], a path-based algorithm, which is based on MSA, is designed for solving the above traffic diversion model. In each iteration, link impedances are updated based on the link flows from the previous iteration, and the shortest paths (auxiliary paths) for cars and trucks are identified accordingly. An all-or-nothing assignment is then performed to generate auxiliary path flows. Sequentially, path flows are updated using the MSA. The process repeats until the convergence condition is met. The algorithm flowchart is shown in Figure 2.
Figure 2.
Flowchart of algorithm.
The specific algorithm steps are presented in Algorithm 1:
| Algorithm 1: Path-Based Algorithm Using MSA |
| Input: Diversion network ; free-flow time on links for cars ; free-flow time on links for trucks ; car traffic demand ; truck traffic demand ; BPR function parameters , , , ; car equivalents , ; link capacities , ; toll rates , ; link lengths ; values of time , ; convergence accuracy ; maximum number of iterations . Output: Diversion path sets , ; path flows , . Step 0: Initialization. For all , set . For all , set , . Initialize for and for . Set . Step 1: Update link impedances. Given and , update the link impedances and according to Equation (5) and Equation (6), respectively. Step 2: Perform an all-or-nothing assignment and update generated path sets. For each , solve the shortest paths under and by Dijkstra’s algorithm; denote the shortest paths and their impedances as , and , . For each if , then . For each if , then . For each and , compute using Equation (7). For each and , compute using Equation (8). For each , generate the auxiliary path flows: for cars, set if , and otherwise; for trucks, set if , and otherwise. Step 3: Update path flows using MSA. For each and , update . For each and , update . For all , update link flows and using Equations (3) and (4). Step 4: Convergence check. If or , then stop the iteration; otherwise, let , and return to Step 1. |
4. Calculation Method for Vehicle Exhaust Emissions in Traffic Diversion Network
Vehicle exhaust emission is influenced by many factors, including traffic volume, vehicle type, travel velocity, travel distance, etc. [21]. To quantify the environmental impact of traffic diversion schemes, a calculation method for vehicle exhaust emissions in diversion networks is designed, based on the COPERT model. The COPERT model, developed by the European Environment Agency, provides specific emission factors for different vehicle types, which can effectively account for the differences between cars and trucks in exhaust emissions. Since CO2 is the main component of vehicle exhaust, and CO, HC, and NOx are the main pollutants, the emission calculations for diversion networks focus on the four gases. The specific formulas are as follows:
In the above equations, represents the total vehicle exhaust emissions in the network. denotes the emission amount for gas type (CO2, CO, HC, or NOx). Moreover, is the emission factor for gas generated by vehicle type (car or truck) on link . According to the COPERT model, the calculation formula of the emission factors for CO2 and the exhaust pollutants is expressed as follows, respectively:
where , , are the fuel consumption reduction factor, fuel calorific value, and fuel-based CO2 emission factor for vehicle type , respectively. , , , , , , , , , , , , , and are the parameters specific to the vehicle type and gas type for the COPERT model calculations. The values of the above factors and parameters can be found in the guidebook of the COPERT model [22]. denotes the average travel velocity of vehicle type on link , and is computed as
where represents the travel time for vehicle type on link . It is formulated as
5. Numerical Examples
5.1. Diversion Network
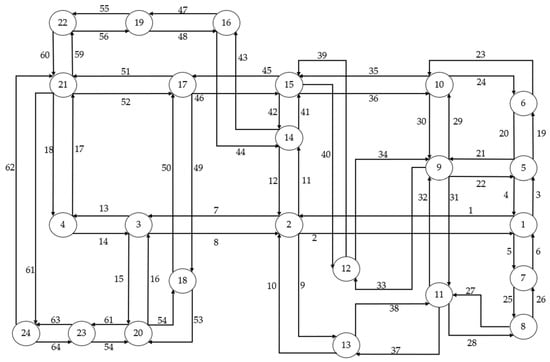
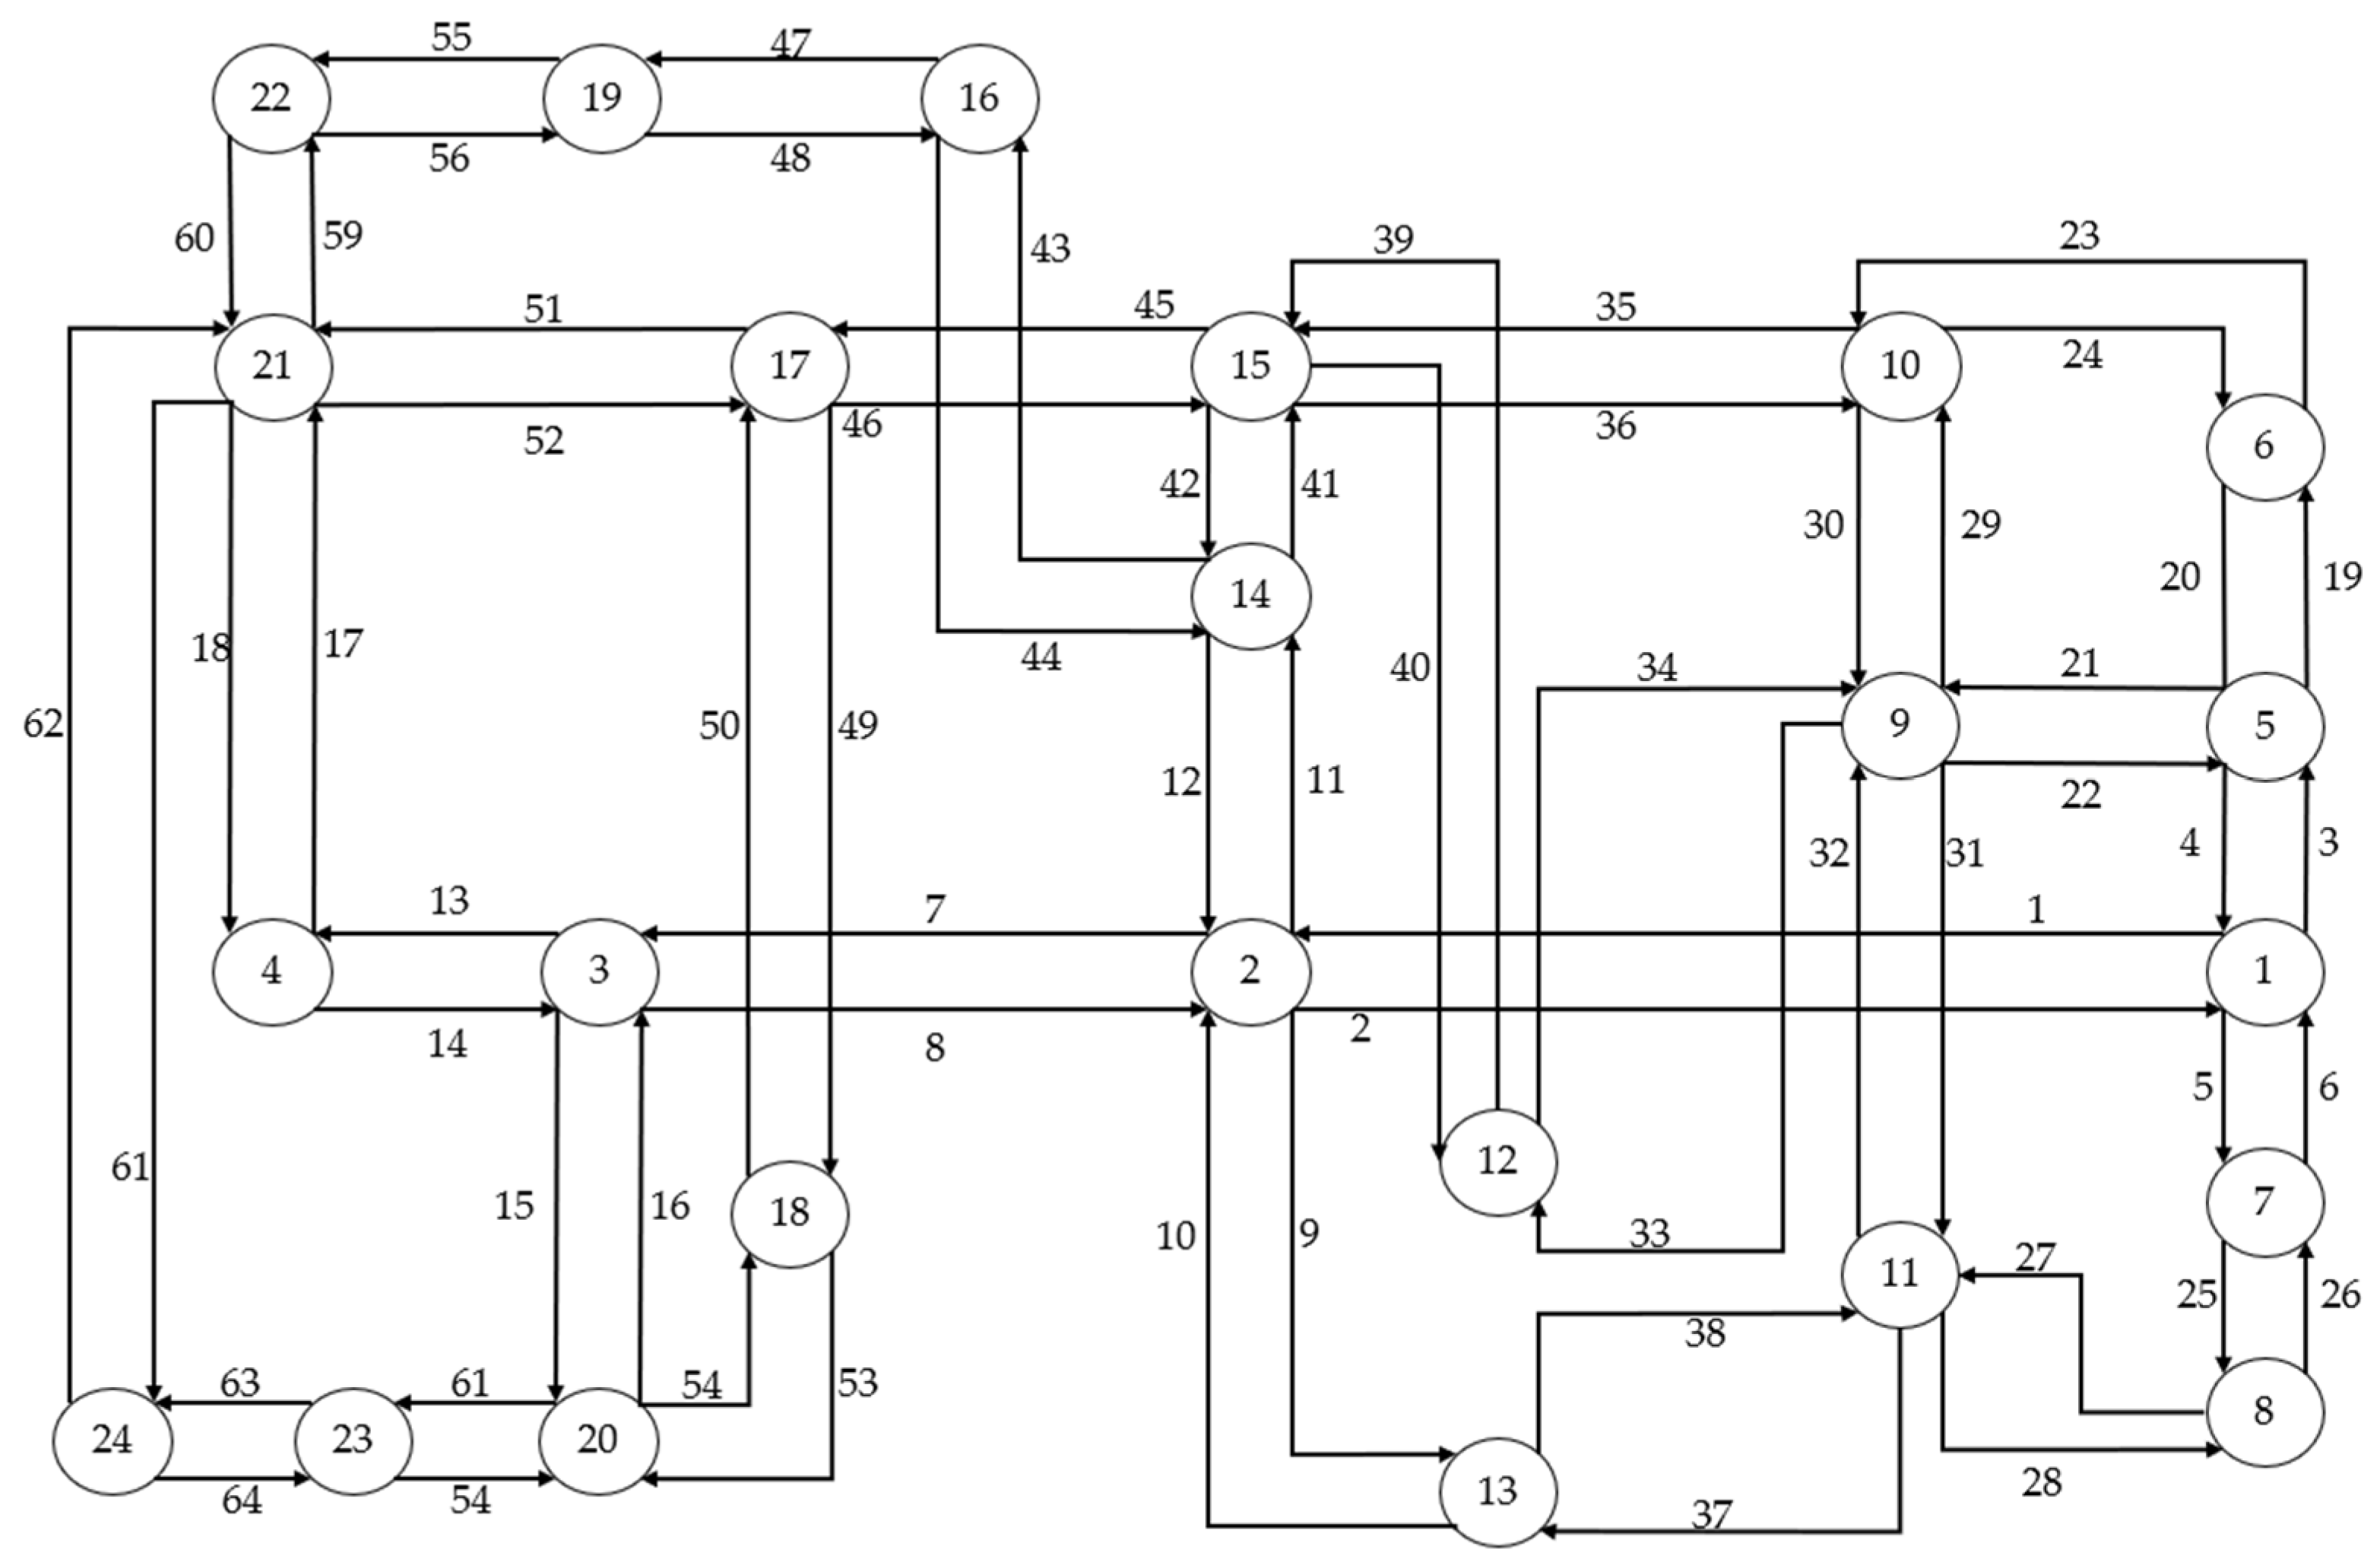
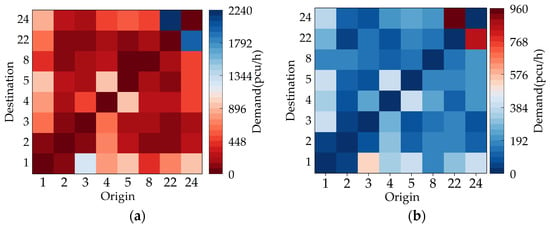
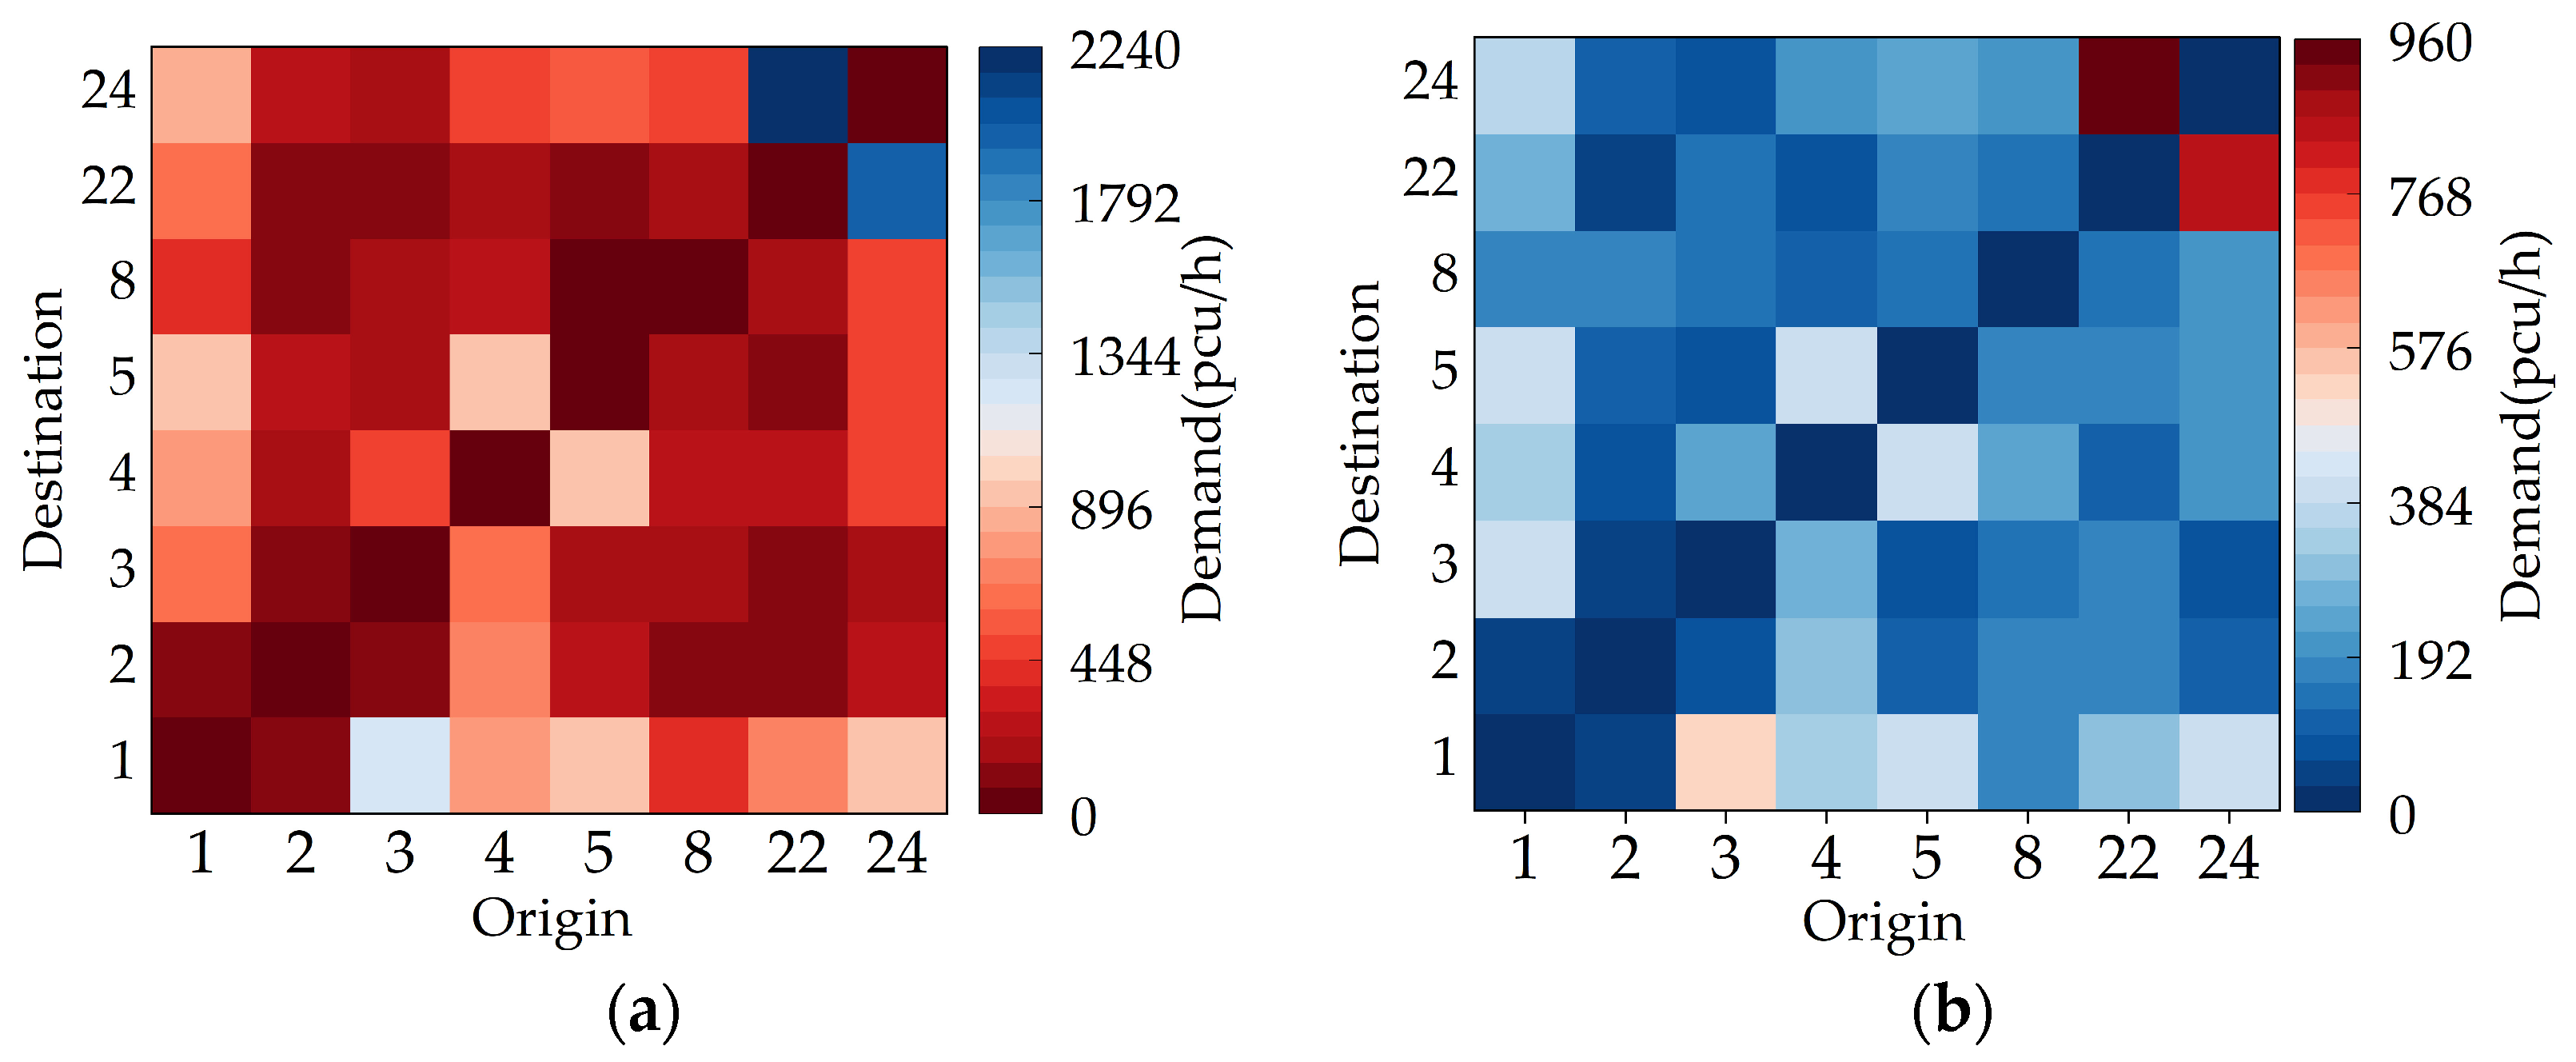
The proposed traffic diversion model, solution algorithm, and calculation method for vehicle exhaust emissions are applied in an expressway reconstruction and expansion project in Guangdong, China. Figure 3 displays the topology of the diversion network, which consists of 24 nodes and 64 links. The links 1, 4, 5, 8, 9, and 11 represent the expressways under reconstruction. The speed limits on the reconstructed expressway are set to 80 km/h for cars and 60 km/h for trucks. The capacity of the reconstructed expressway is reduced to 2869 pcu/h. Moreover, the link capacity for trucks is 50% of that for cars [23]. The detailed information on link length and capacity, free flow time and toll rates for cars and trucks are summarized in Appendix A, Table A1, while the OD data for cars and trucks are provided in Appendix A, Table A2 and Table A3, respectively. Figure 4 shows the corresponding heat maps of car and truck OD volumes.
Figure 3.
Topology of diversion network (Numbers in circles denote node IDs, and numbers beside the links denote link IDs).
Figure 4.
Heat maps of traffic demand: (a) car; (b) truck.
5.2. Evaluation of Traffic Efficiency and Exhaust Emissions in Traffic Diversion Network
5.2.1. Traffic Conditions Before Reconstruction and Expansion
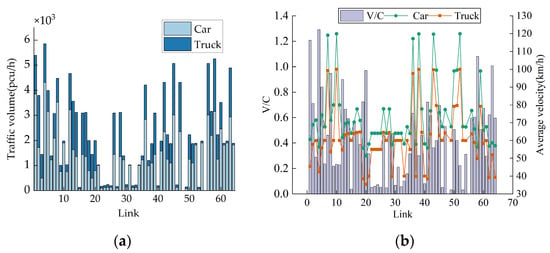
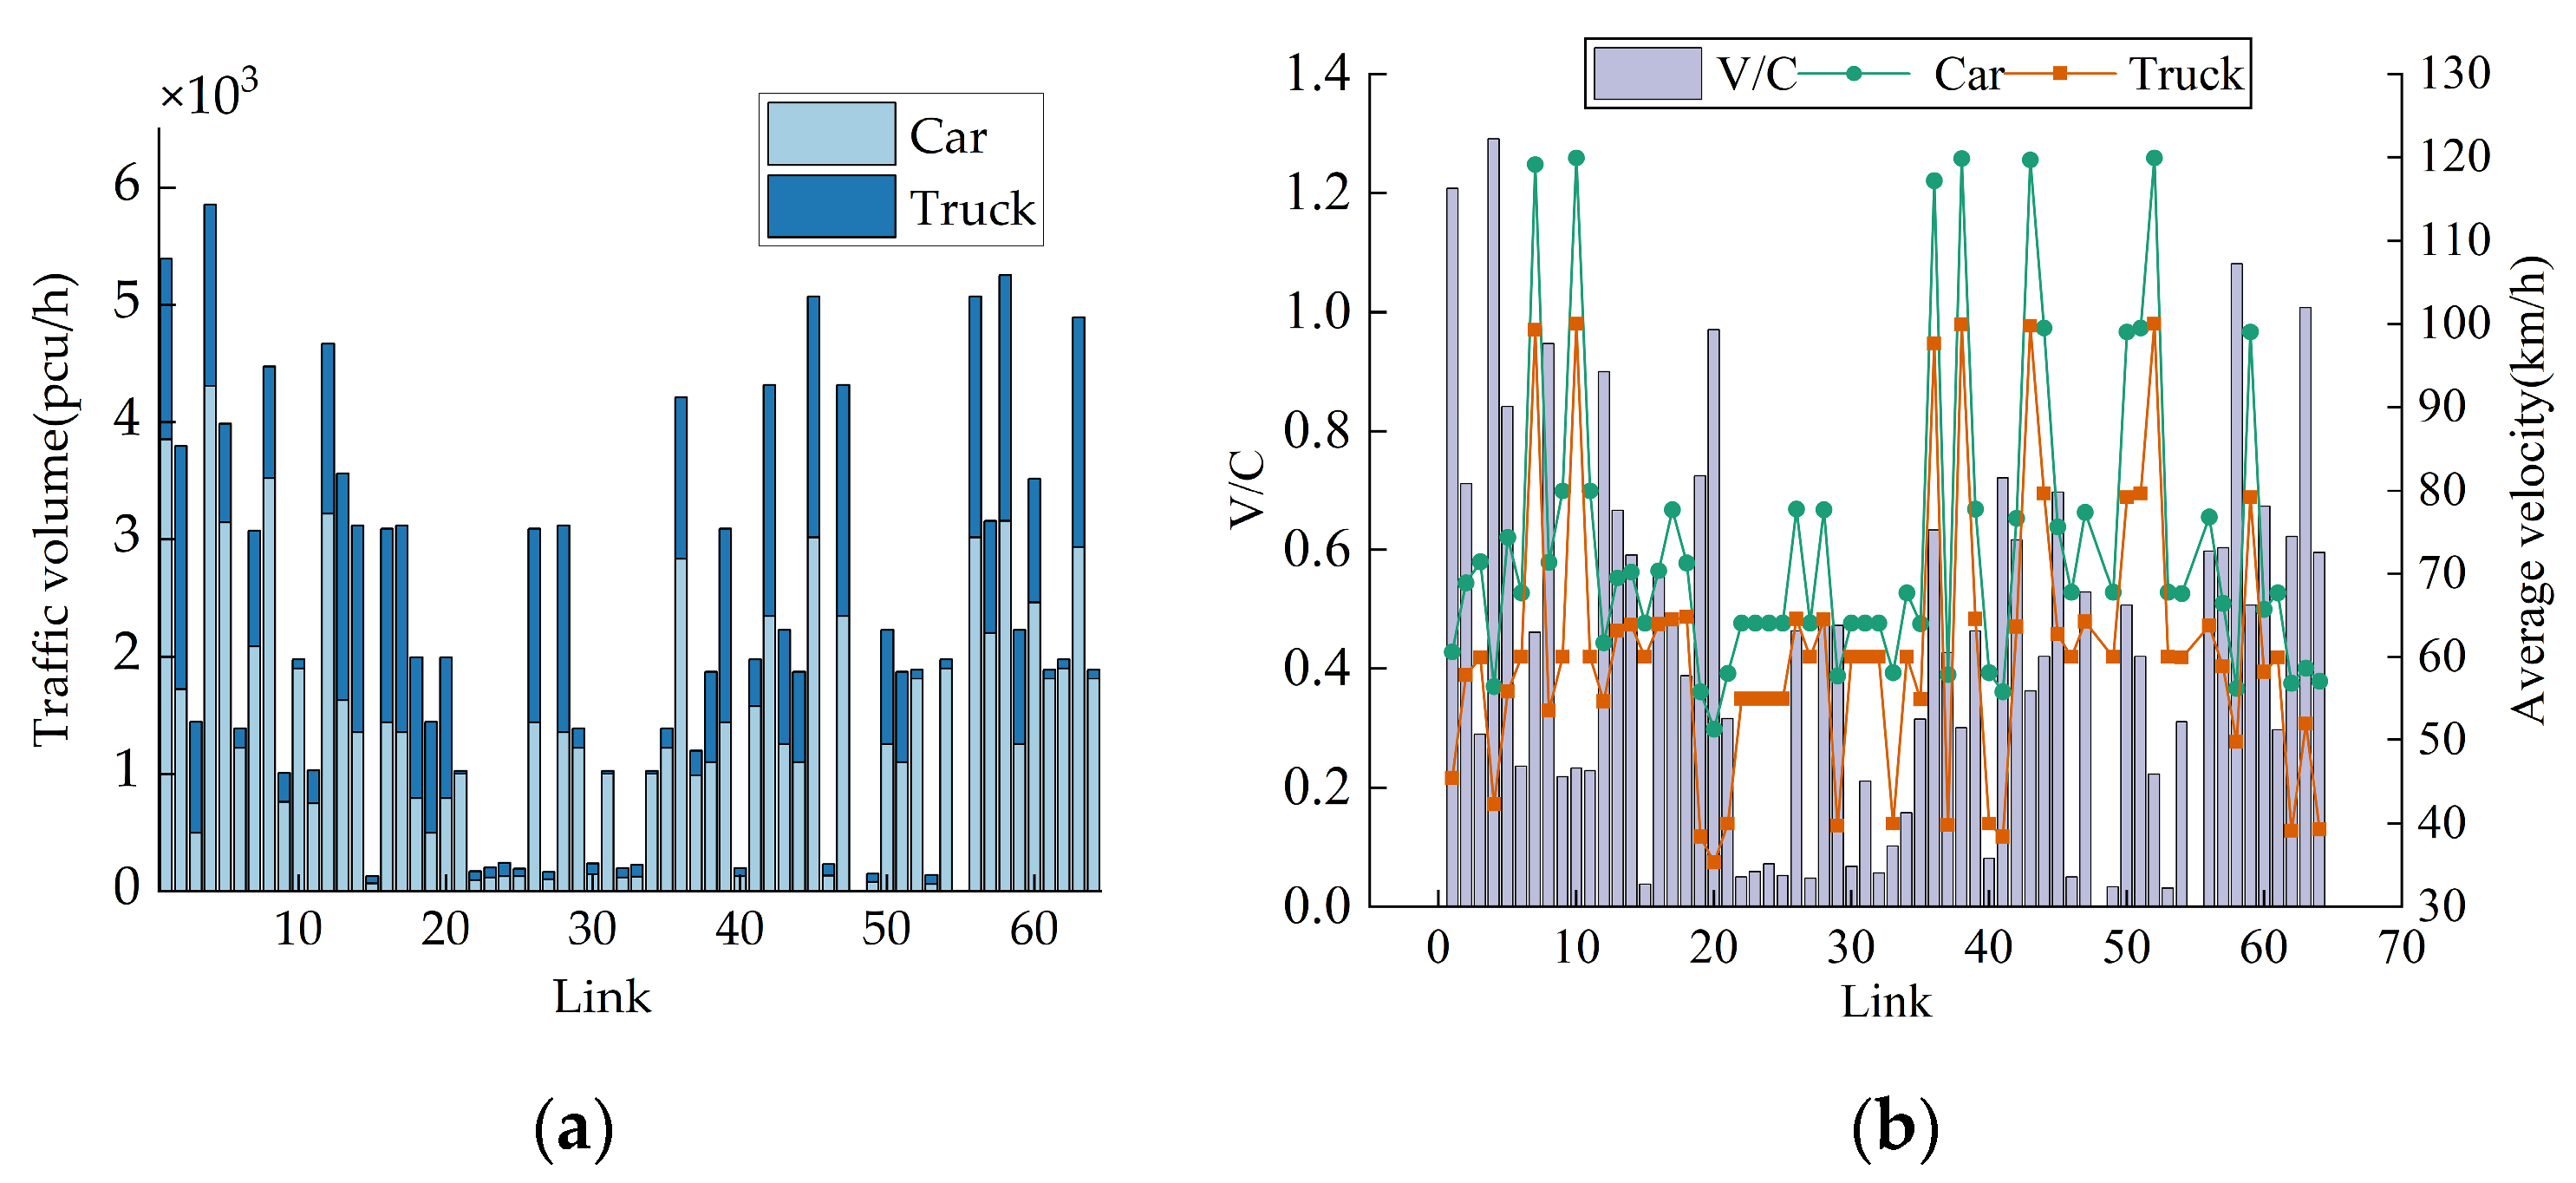
Figure 5 shows the traffic conditions for all links in the diversion network before reconstruction and expansion. Among them, the Volume-to-Capacity (V/C) ratios for 46 (71.9%) links are less than 0.6, indicating smooth traffic flow; the V/C ratios for 10 (15.6%) links are between 0.6 and 0.75, indicating favorable driving conditions; the V/C ratios for 4 (6.3%) links are between 0.75 and 1, suggesting potential congestion; and, in particular, the V/C ratios for 4 links (i.e., 1, 4, 58, and 63) are greater than 1, suggesting significant congestion. Regarding the reconstructed expressway segments, the V/C ratios for links 1 and 4 exceed 1, while those for links 5 and 8 are 0.84 and 0.94, respectively, which justify the necessity of their reconstruction and expansion. Due to the variations in link traffic volumes and road classifications, the average velocity across all links varies widely. However, on the same link, the average velocity of cars is significantly higher than that of trucks.
Figure 5.
Traffic parameters of all links before reconstruction and expansion: (a) traffic volume; (b) Volume-to-Capacity ratio (V/C) and average velocity.
5.2.2. Traffic Conditions During Reconstruction Without Diversion
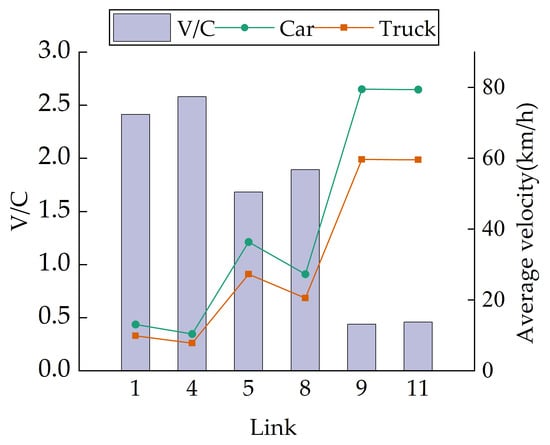
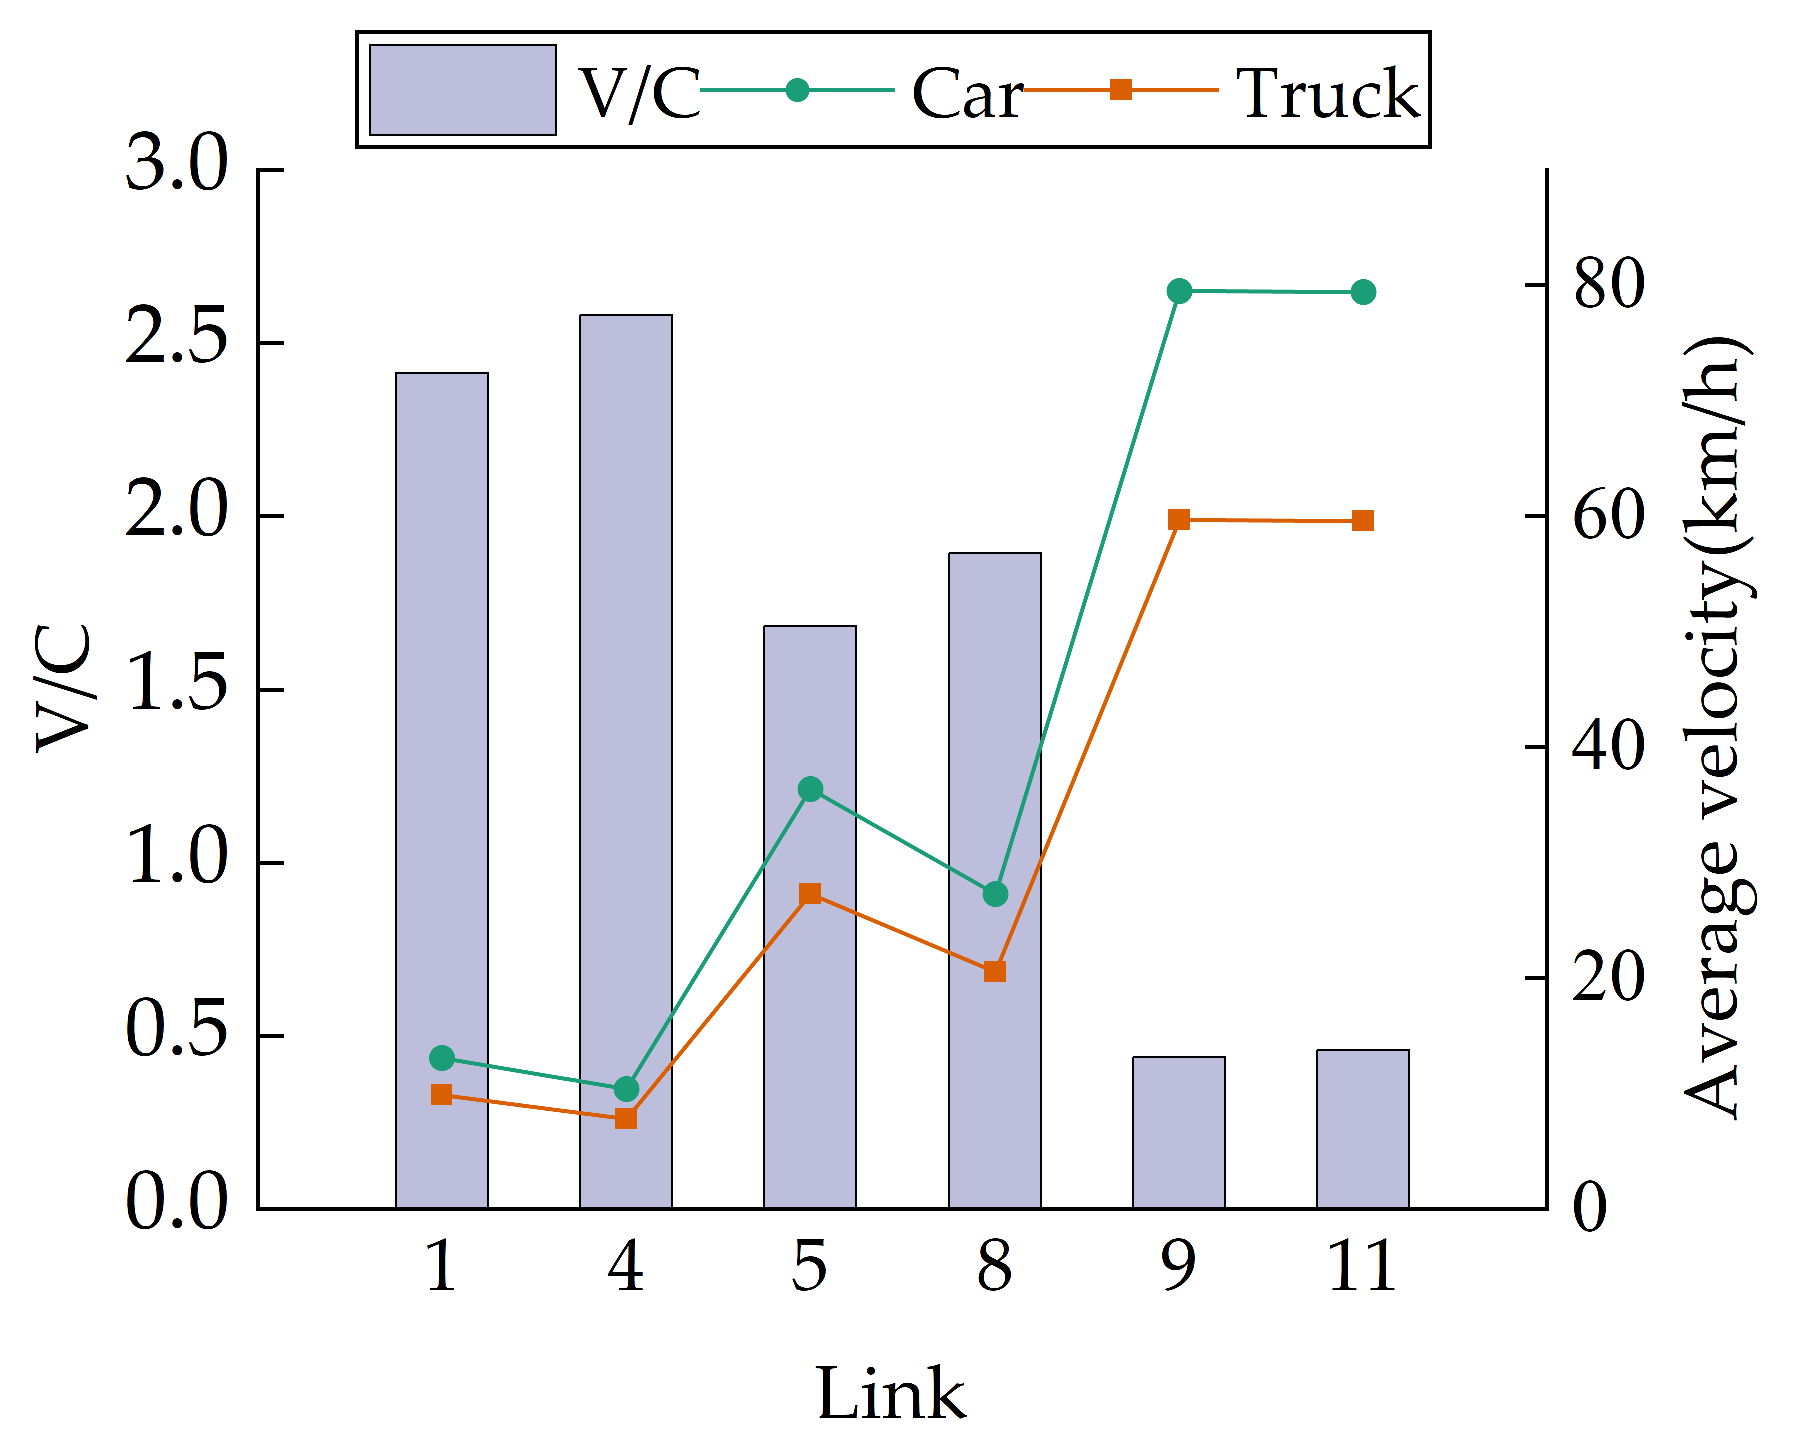
If no traffic diversion measures are implemented during the expressway reconstruction and expansion project, the traffic distribution in the network remains in its original state, as shown in Figure 5a. Consequently, the V/C ratios on the reconstructed links would increase dramatically. As shown in Figure 6, the V/C ratios on links 1, 4, 5, and 8 exceed 1, with traffic volumes far surpassing capacity. It would result in severe traffic congestion on these links. On the reconstructed expressway links, the average velocity of cars falls below 42 km/h, with a minimum of 10.4 km/h on link 4. Similarly, the average velocity of trucks drops below 31 km/h, with a minimum of 7.8 km/h.
Figure 6.
Volume-to-Capacity ratio (V/C) and average velocity of the reconstructed links without diversion.
5.2.3. Traffic Conditions During Reconstruction with Diversion
To design a refined traffic diversion scheme, the traffic diversion model and solution algorithm are applied in the expressway reconstruction and expansion project. The algorithm and the calculation method for vehicle exhaust emissions are programmed in MATLAB R2024b software. The values of the relevant parameters are set and summarized in Table 1. Specifically, , , , , , are determined with reference to the FHWA Traffic Data Computation Method Pocket Guide [23], while and are derived from the Guangdong Statistical Yearbook 2025 [24].
Table 1.
Parameters of model and algorithm.
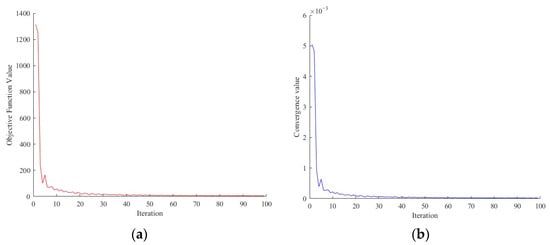
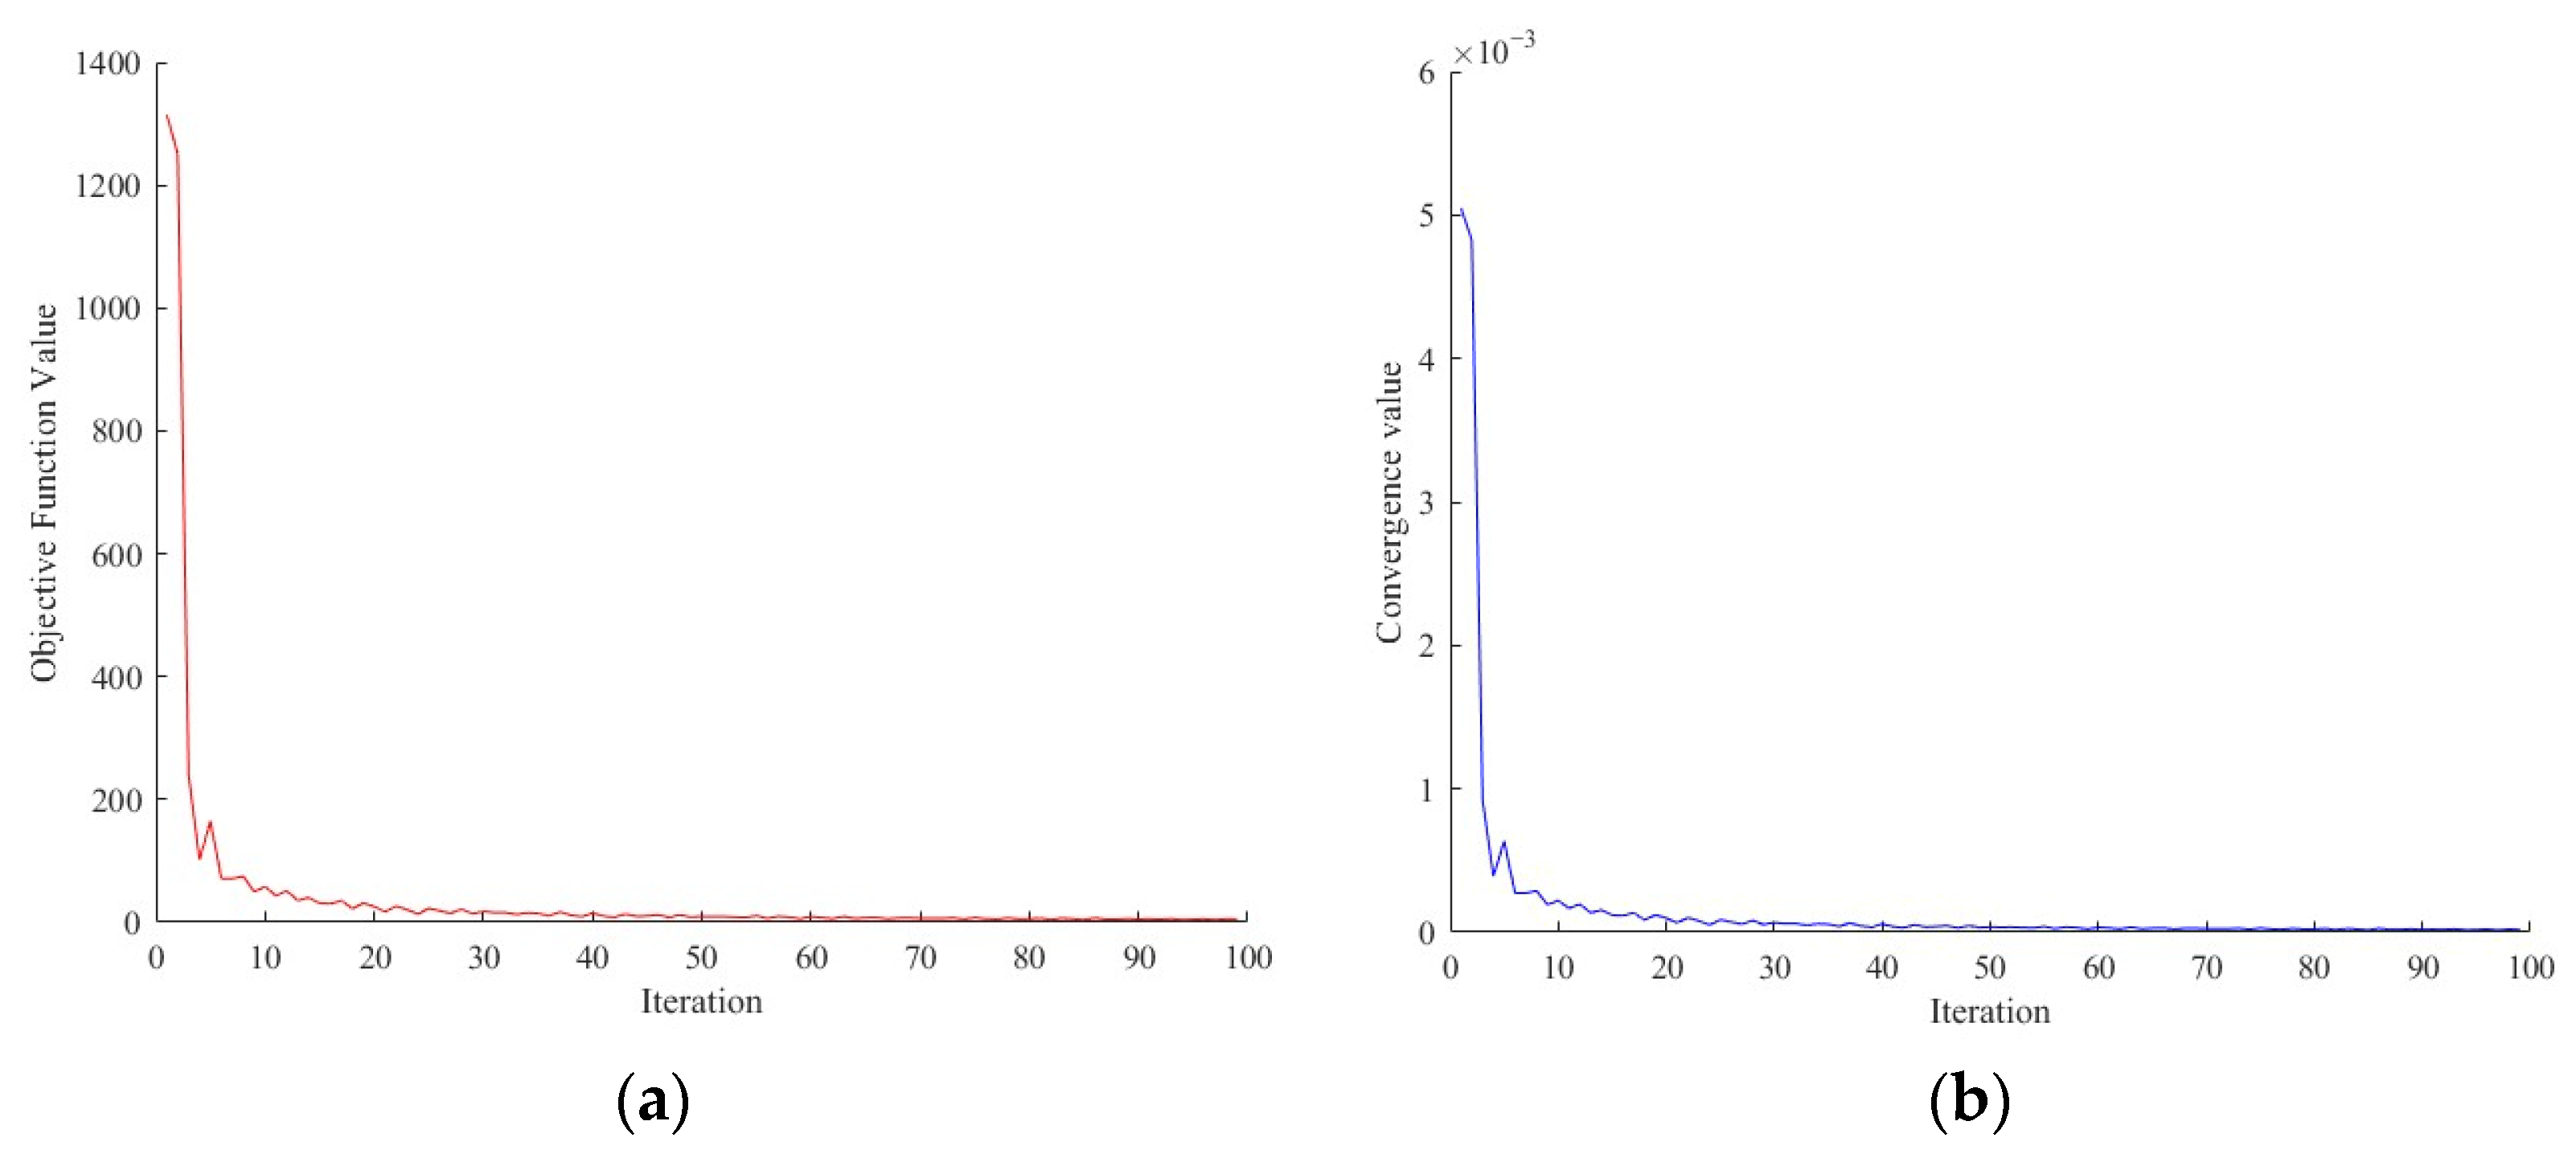
Figure 7 displays the convergence of the proposed solution algorithm. The figure shows that the objective function value decreases rapidly in the first 20 iterations; then, it decreases slowly and gradually approaches zero, which indicates a good convergence performance of the algorithm. The optimized traffic diversion scheme, i.e., the diversion paths for each OD pair between the four nodes on the reconstructed expressway, is summarized in Appendix A, Table A4. The different diversion path sets for cars and trucks for certain OD pairs further justify the necessity of accounting for their heterogeneity in developing traffic diversion models.
Figure 7.
Algorithm convergence procedure: (a) target value; (b) convergence accuracy.
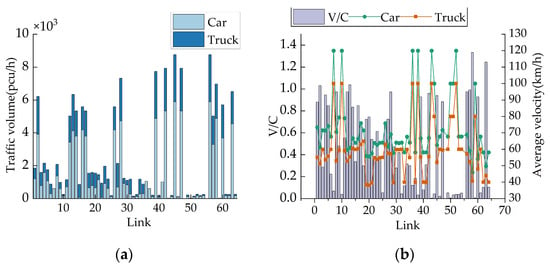
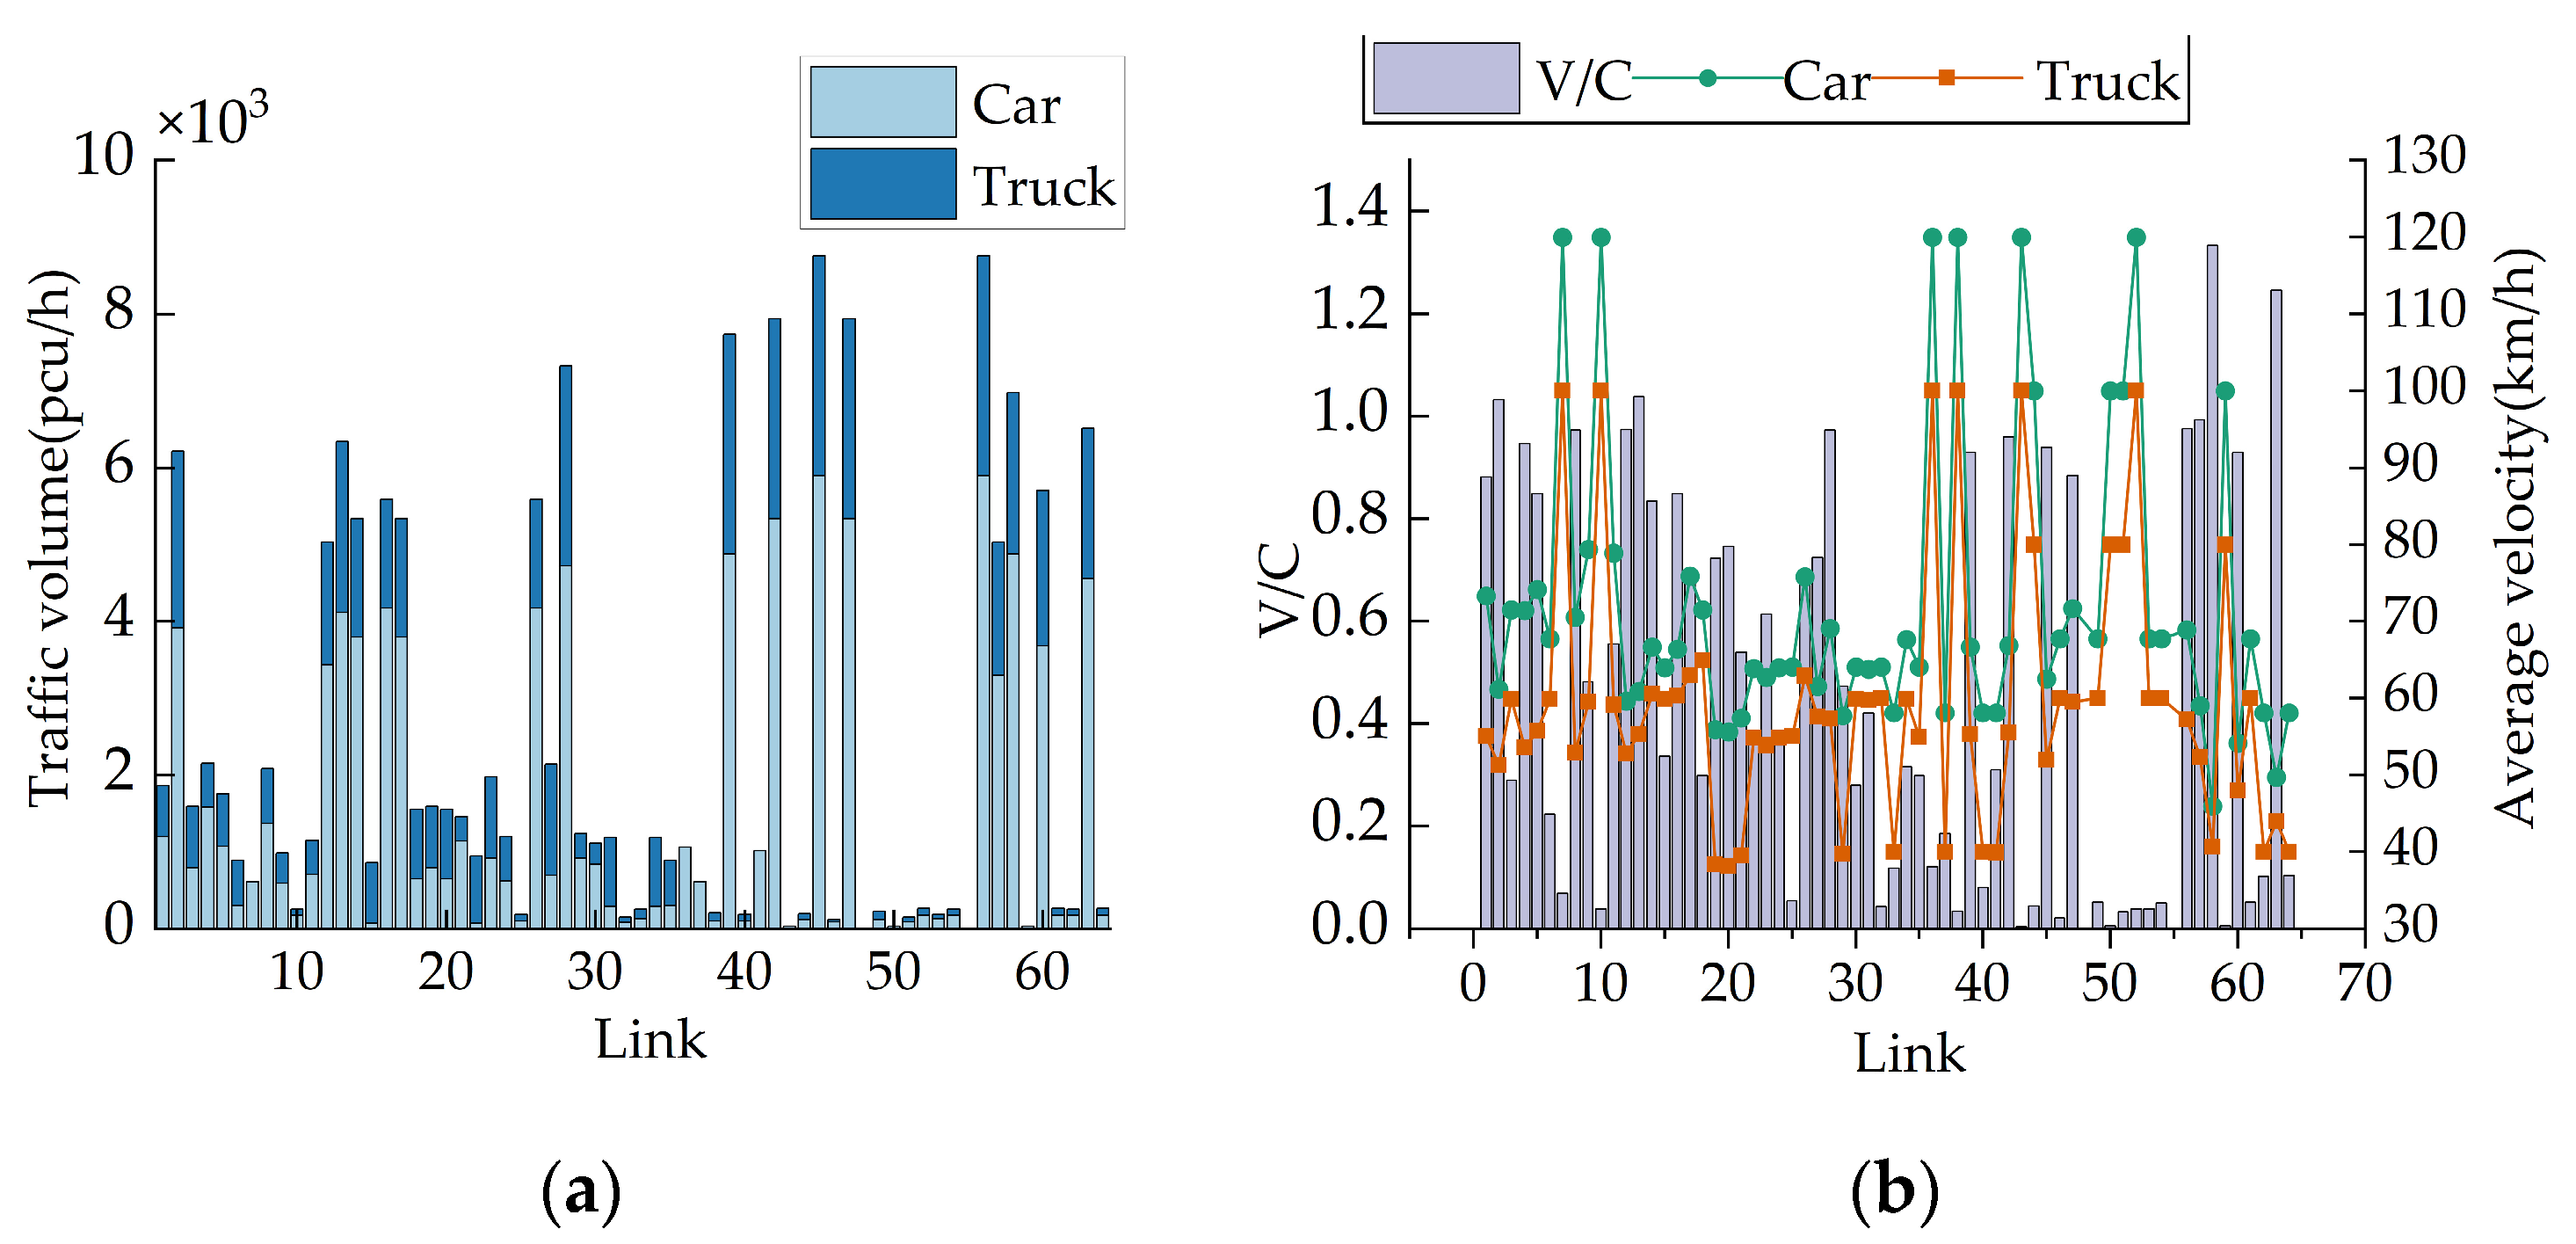
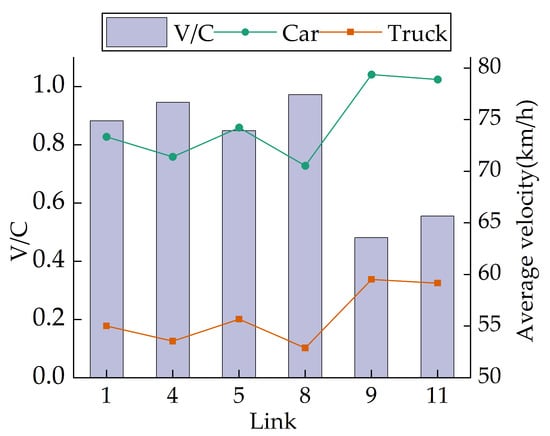
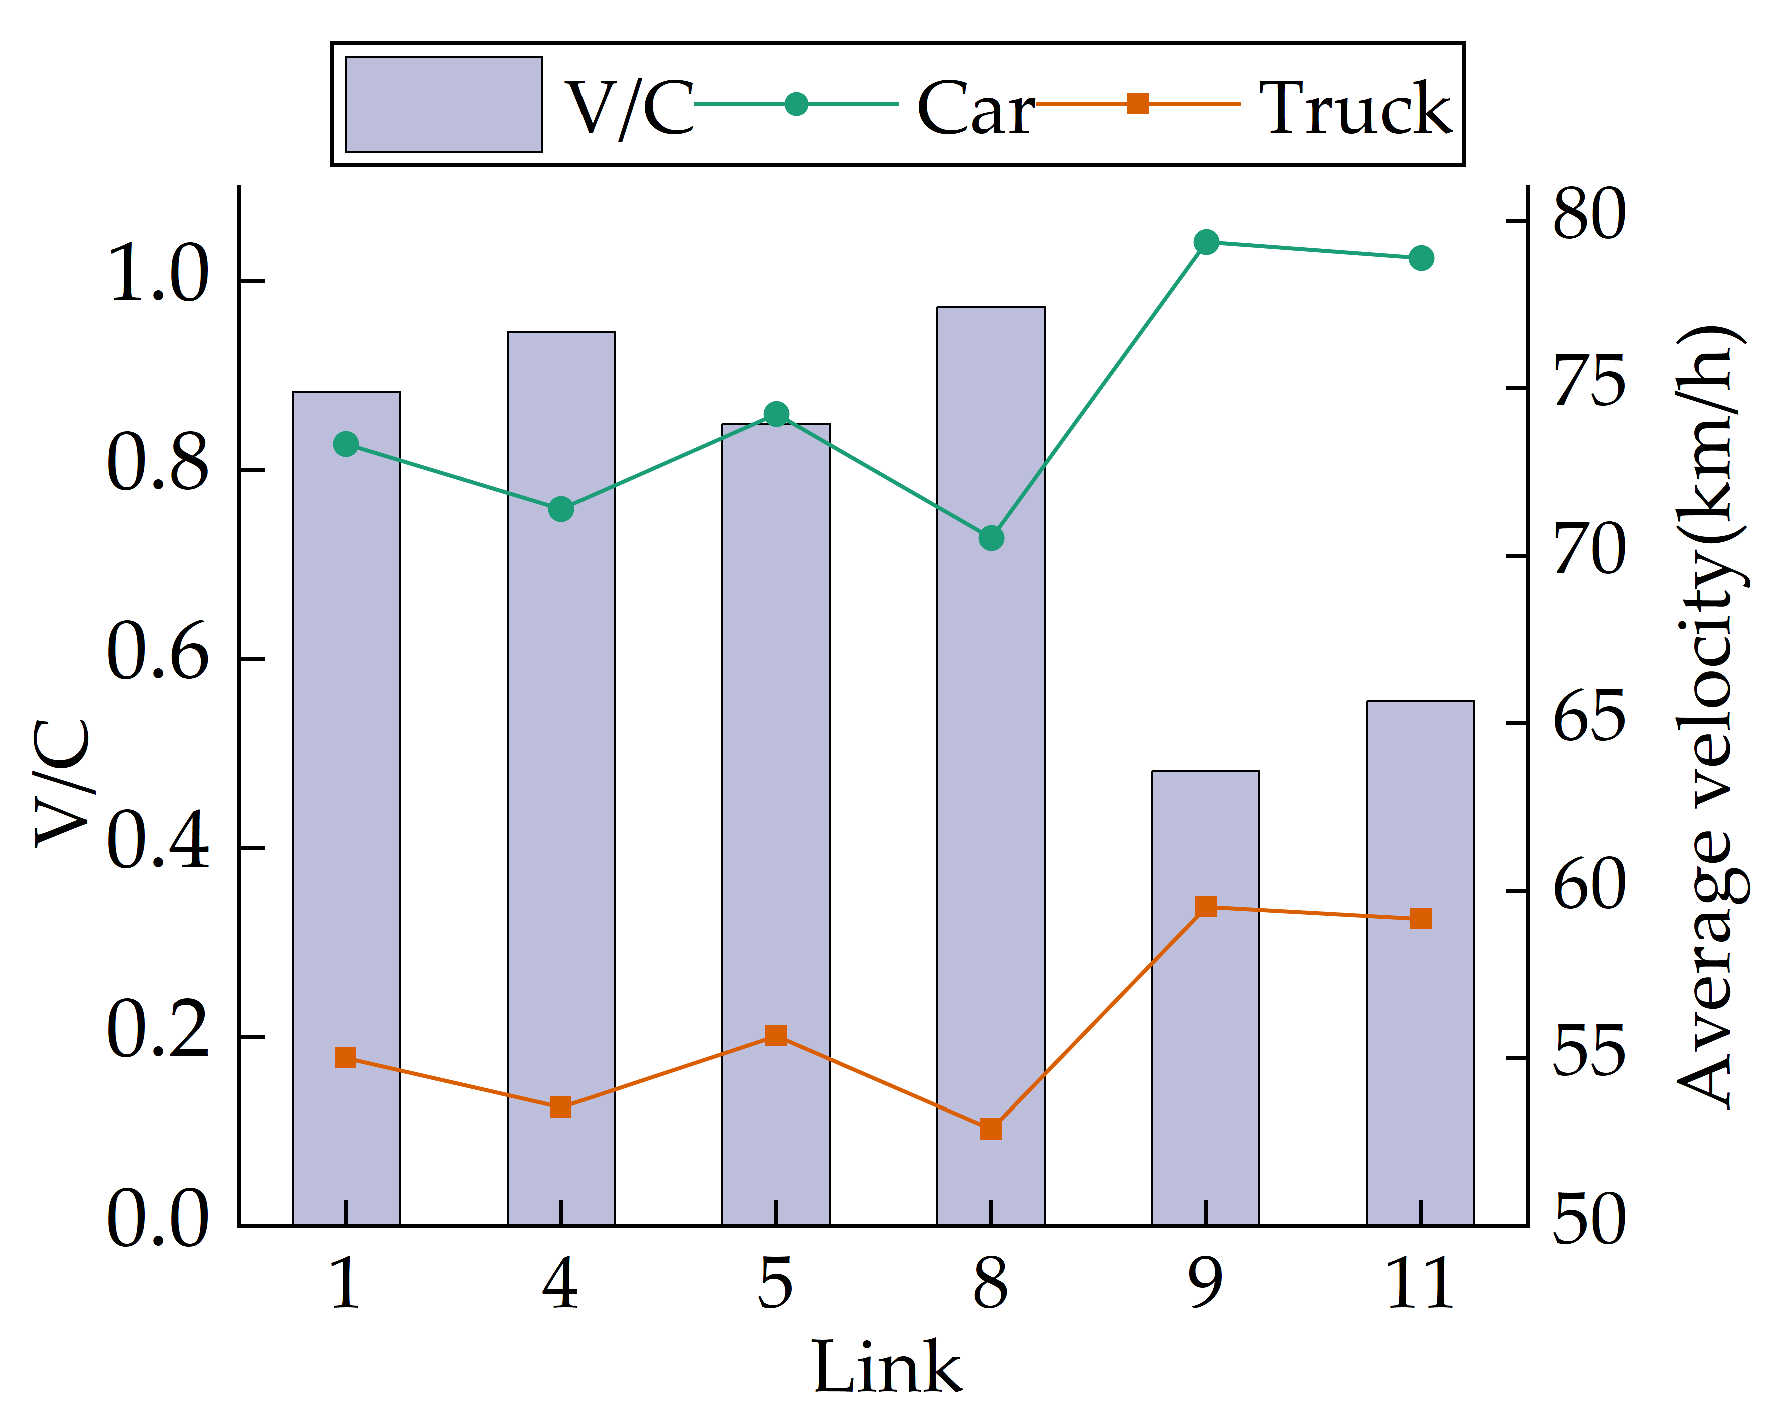
Figure 8 presents the traffic conditions for all links with diversion during the reconstruction and expansion project. Within the network, the numbers of the links with a V/C ratio below 0.6, between 0.6 and 0.75, between 0.75 and 1, and over 1, are 39 (60.9%), 6 (9.4%), 15 (23.4%), and 4 (6.3%), respectively. Regarding the reconstructed links, as shown in Figure 9, their V/C ratios are all less than 1, while the car average velocity increases to 70–80 km/h and the truck average velocity ranges between 50 and 60 km/h, which means there are good traffic conditions on the reconstructed expressway.
Figure 8.
Traffic parameters of all links with diversion: (a) traffic volume; (b) Volume-to-Capacity ratio (V/C) and average velocity.
Figure 9.
Volume-to-Capacity ratio (V/C) and average velocity of the reconstructed links with diversion.
5.2.4. Comparison of Traffic Efficiency and Exhaust Emissions with and Without Traffic Diversion
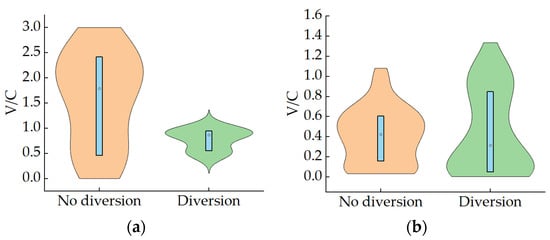
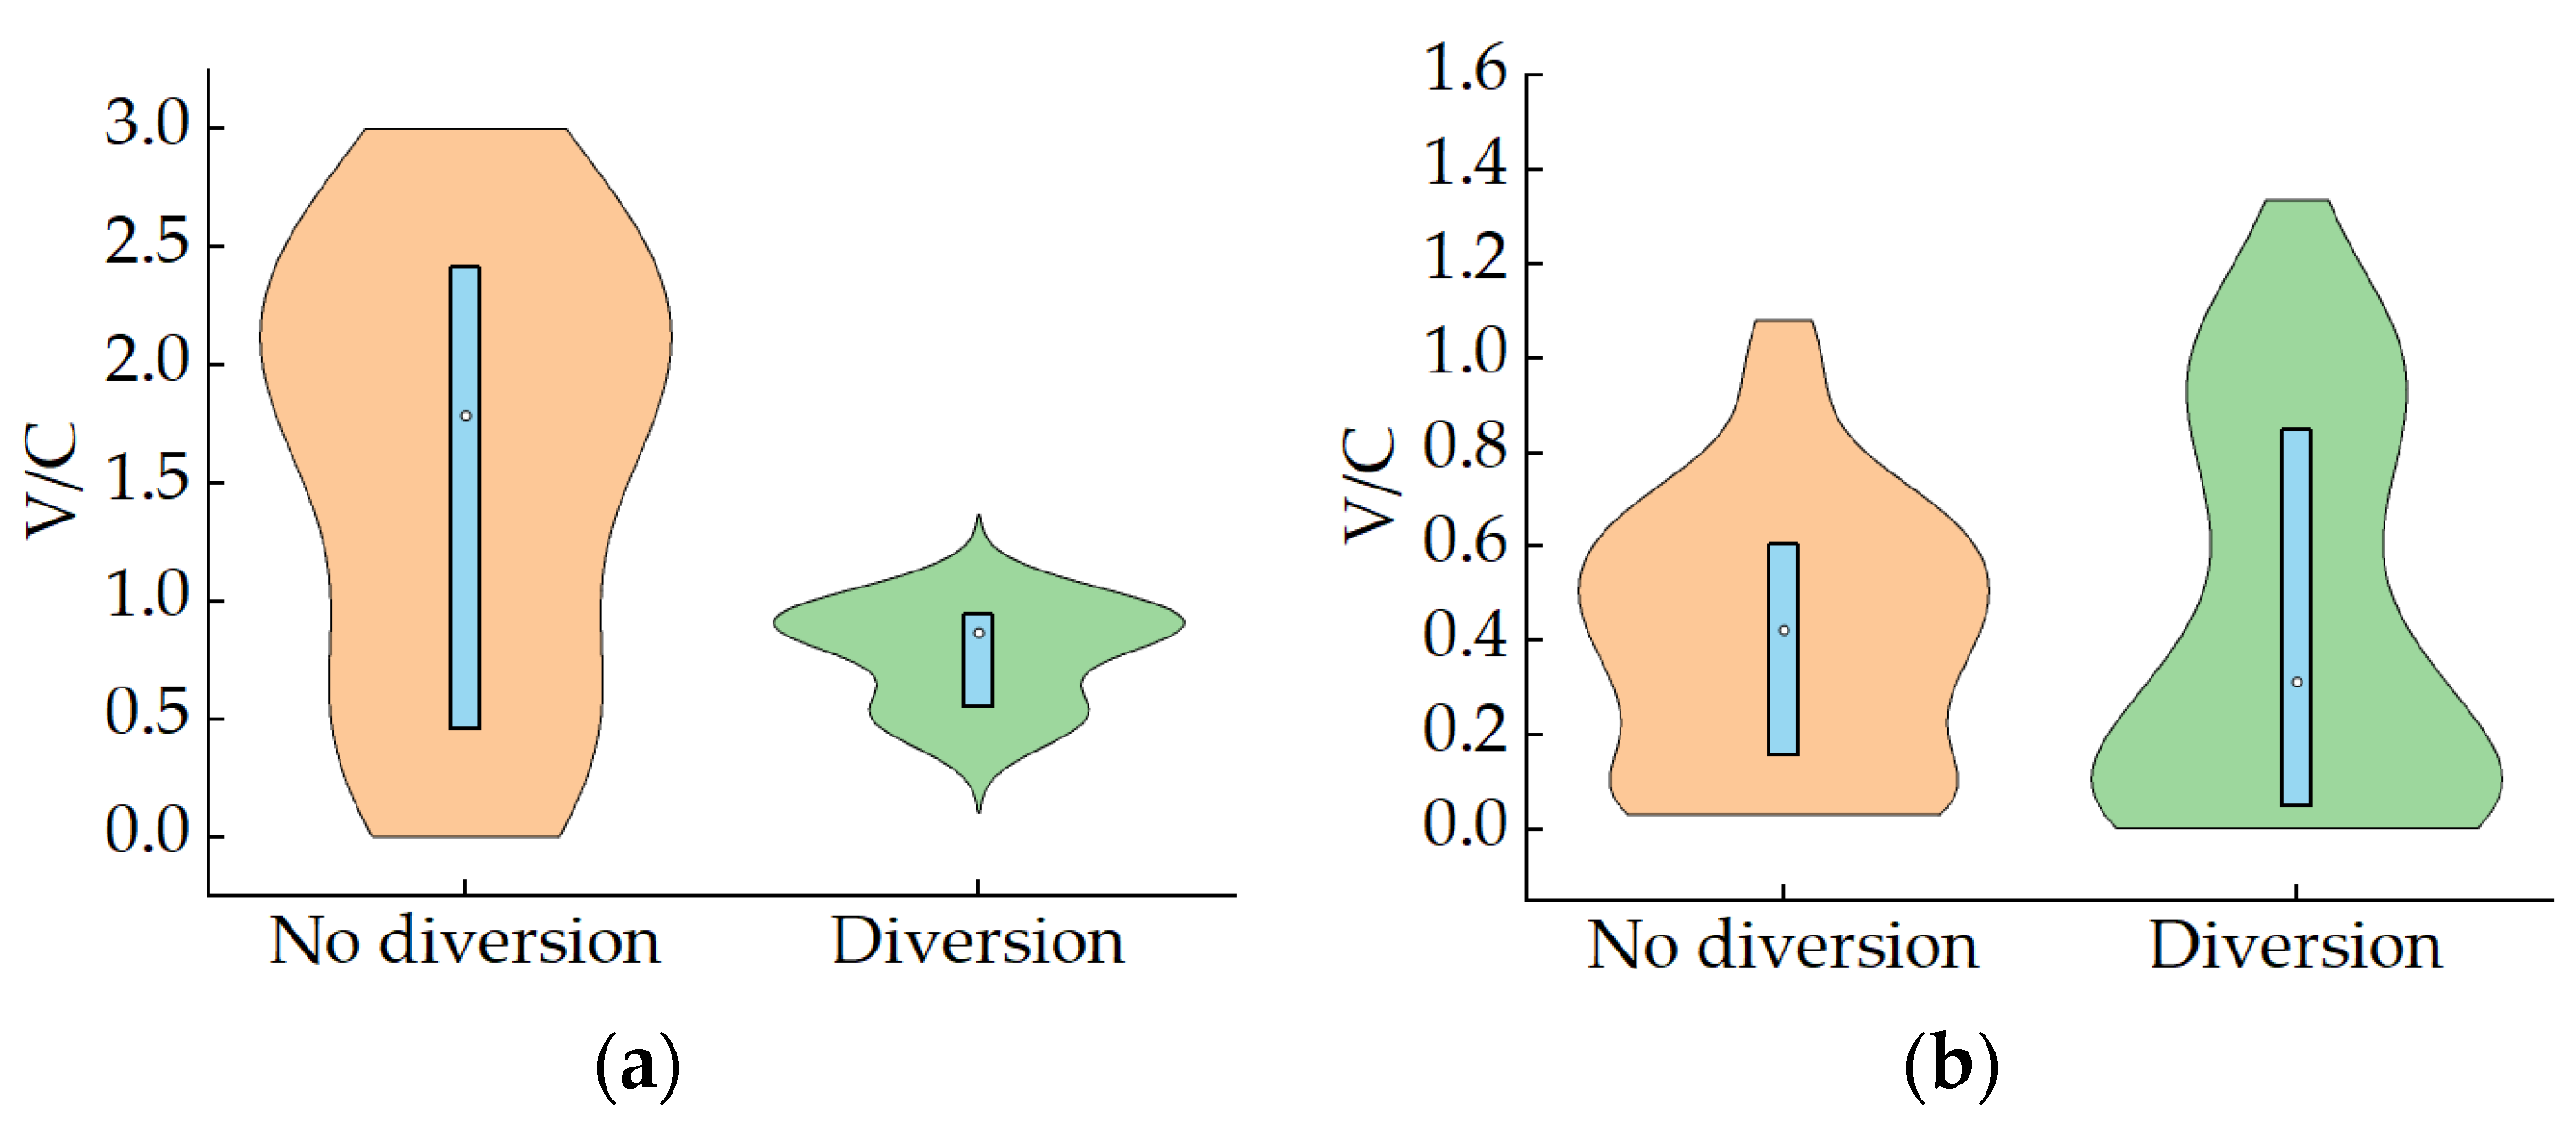
To further justify the necessity of traffic diversion and demonstrate the performance of the diversion scheme, the traffic efficiency and exhaust emissions in the network with and without traffic diversion are compared. Specifically, the distributions of the V/C on reconstructed links and on other links with and without diversion, which are depicted as violin plots, are shown in Figure 10. For the reconstructed links, the traffic diversion significantly decreases the median V/C from 1.79 to 0.86, while making the violin plot vary from a broad peak in the high V/C range to a more concentrated shape in the lower V/C range, as shown in Figure 10a. It suggests a considerable overall improvement in traffic conditions on the reconstructed links. In contrast, the traffic diversion increases the V/C ratios on a proportion of other links. Nonetheless, the median V/C is slightly decreased. That is, the traffic conditions on the other link are not significantly deteriorated by the traffic diversion.
Figure 10.
Comparison of Volume-to-Capacity ratio (V/C) without and with diversion during reconstruction and expansion: (a) V/C of reconstructed links; (b) V/C of other links (Blue bars indicate the 25th–75th percentiles and dot indicates the median values).
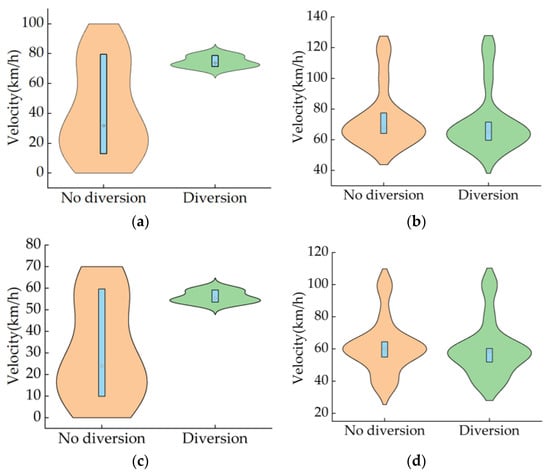
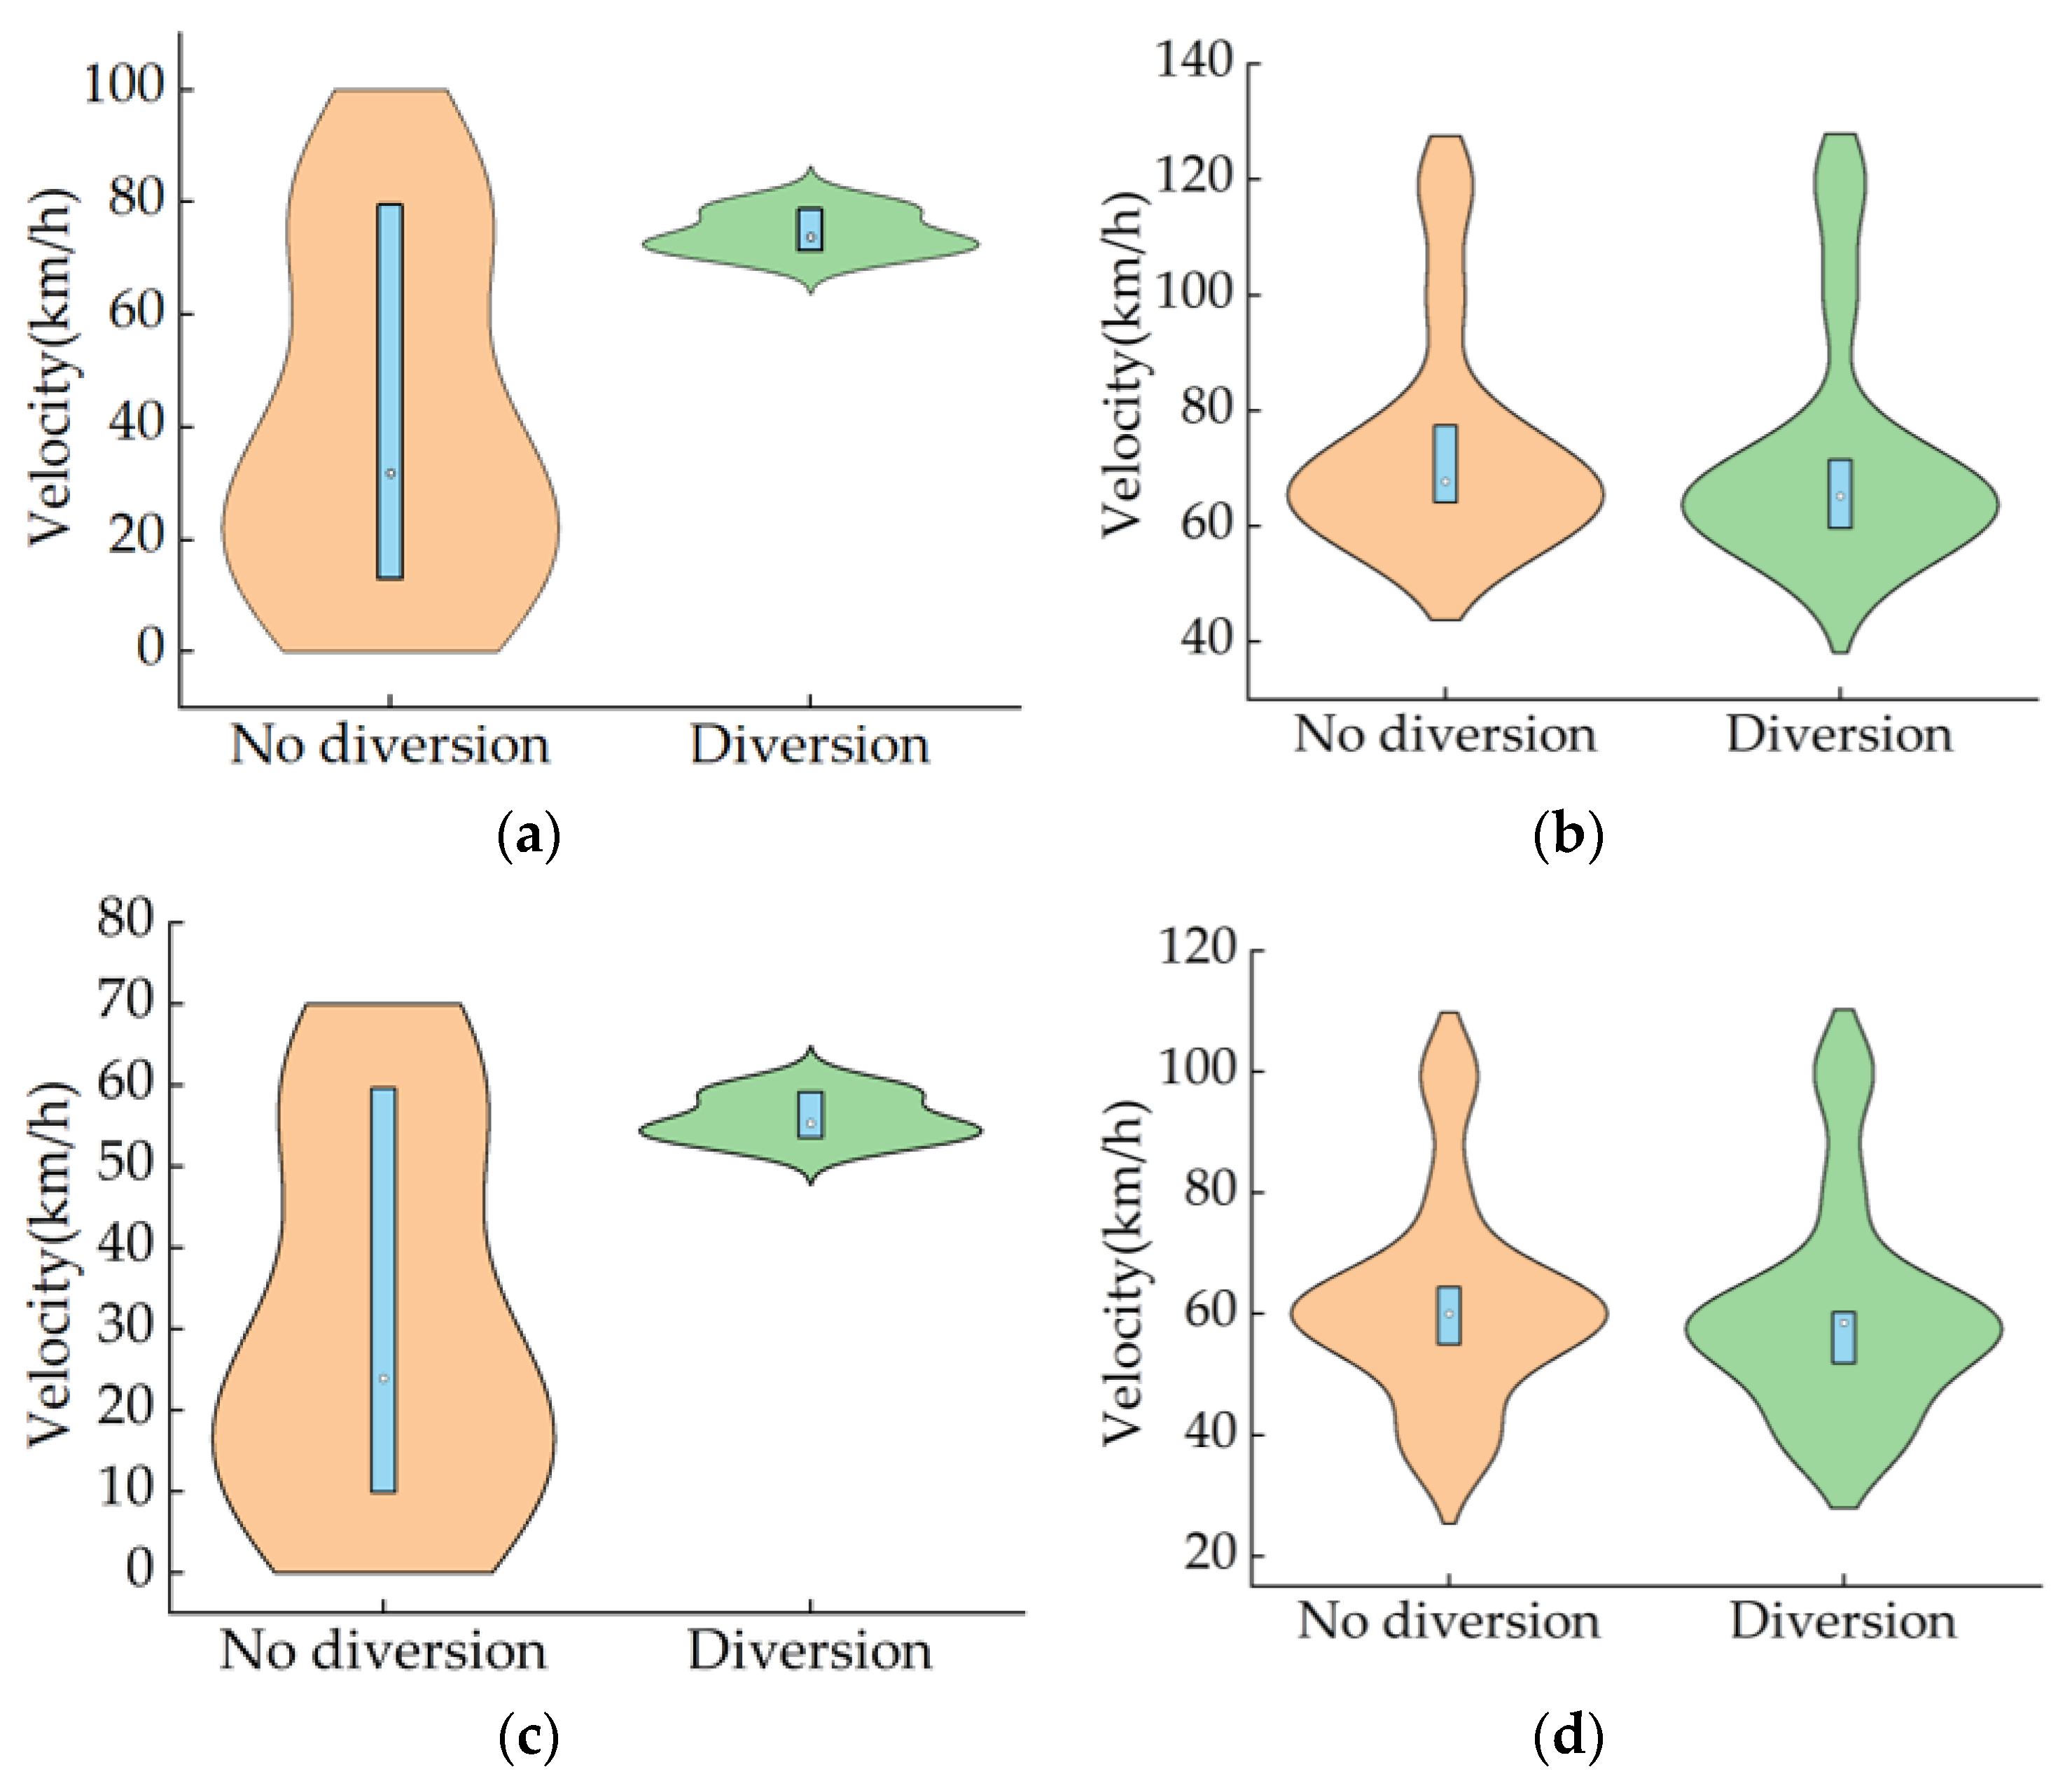
Figure 11 displays the distributions of average velocities of cars and trucks across the links with and without the diversion. The traffic diversion makes the velocity distributions of cars and trucks shift upward, as shown in Figure 11a,c. The median velocities of cars and trucks dramatically increase from 31.8 km/h to 73.7 km/h (+131.7%) and from 23.8 km/h to 55.3 km/h (+132.3%), respectively, which implies a transition from congested low-velocity conditions to higher-velocity conditions. On other links, due to the traffic scheme, the median velocities of cars and trucks slightly decrease, from 67.7 km/h to 65.2 km/h (−3.7%) and from 59.9 km/h to 58.5 km/h (−2.3%), respectively. Overall, the traffic efficiency on the reconstructed links would be significantly improved by the traffic diversion, which would merely result in a slight or even negligible effect on that of other links within the network. It is reasonable, since the levels of service (indicated by their V/C indicators) of these links are high. Splitting a proportion of traffic flow from the reconstructed expressway to them would not worsen their traffic conditions.
Figure 11.
Comparison of average velocity without and with diversion during reconstruction and expansion: (a) average velocity of cars on reconstructed links; (b) average velocity of cars on other links; (c) average velocity of trucks on reconstructed links; (d) average velocity of trucks on other links (Blue bars indicate the 25th–75th percentiles and dot indicates the median values).
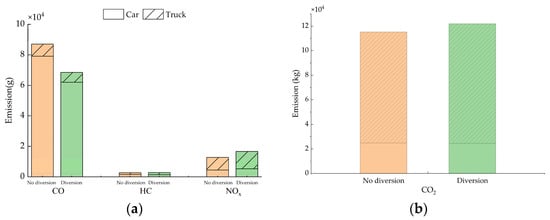
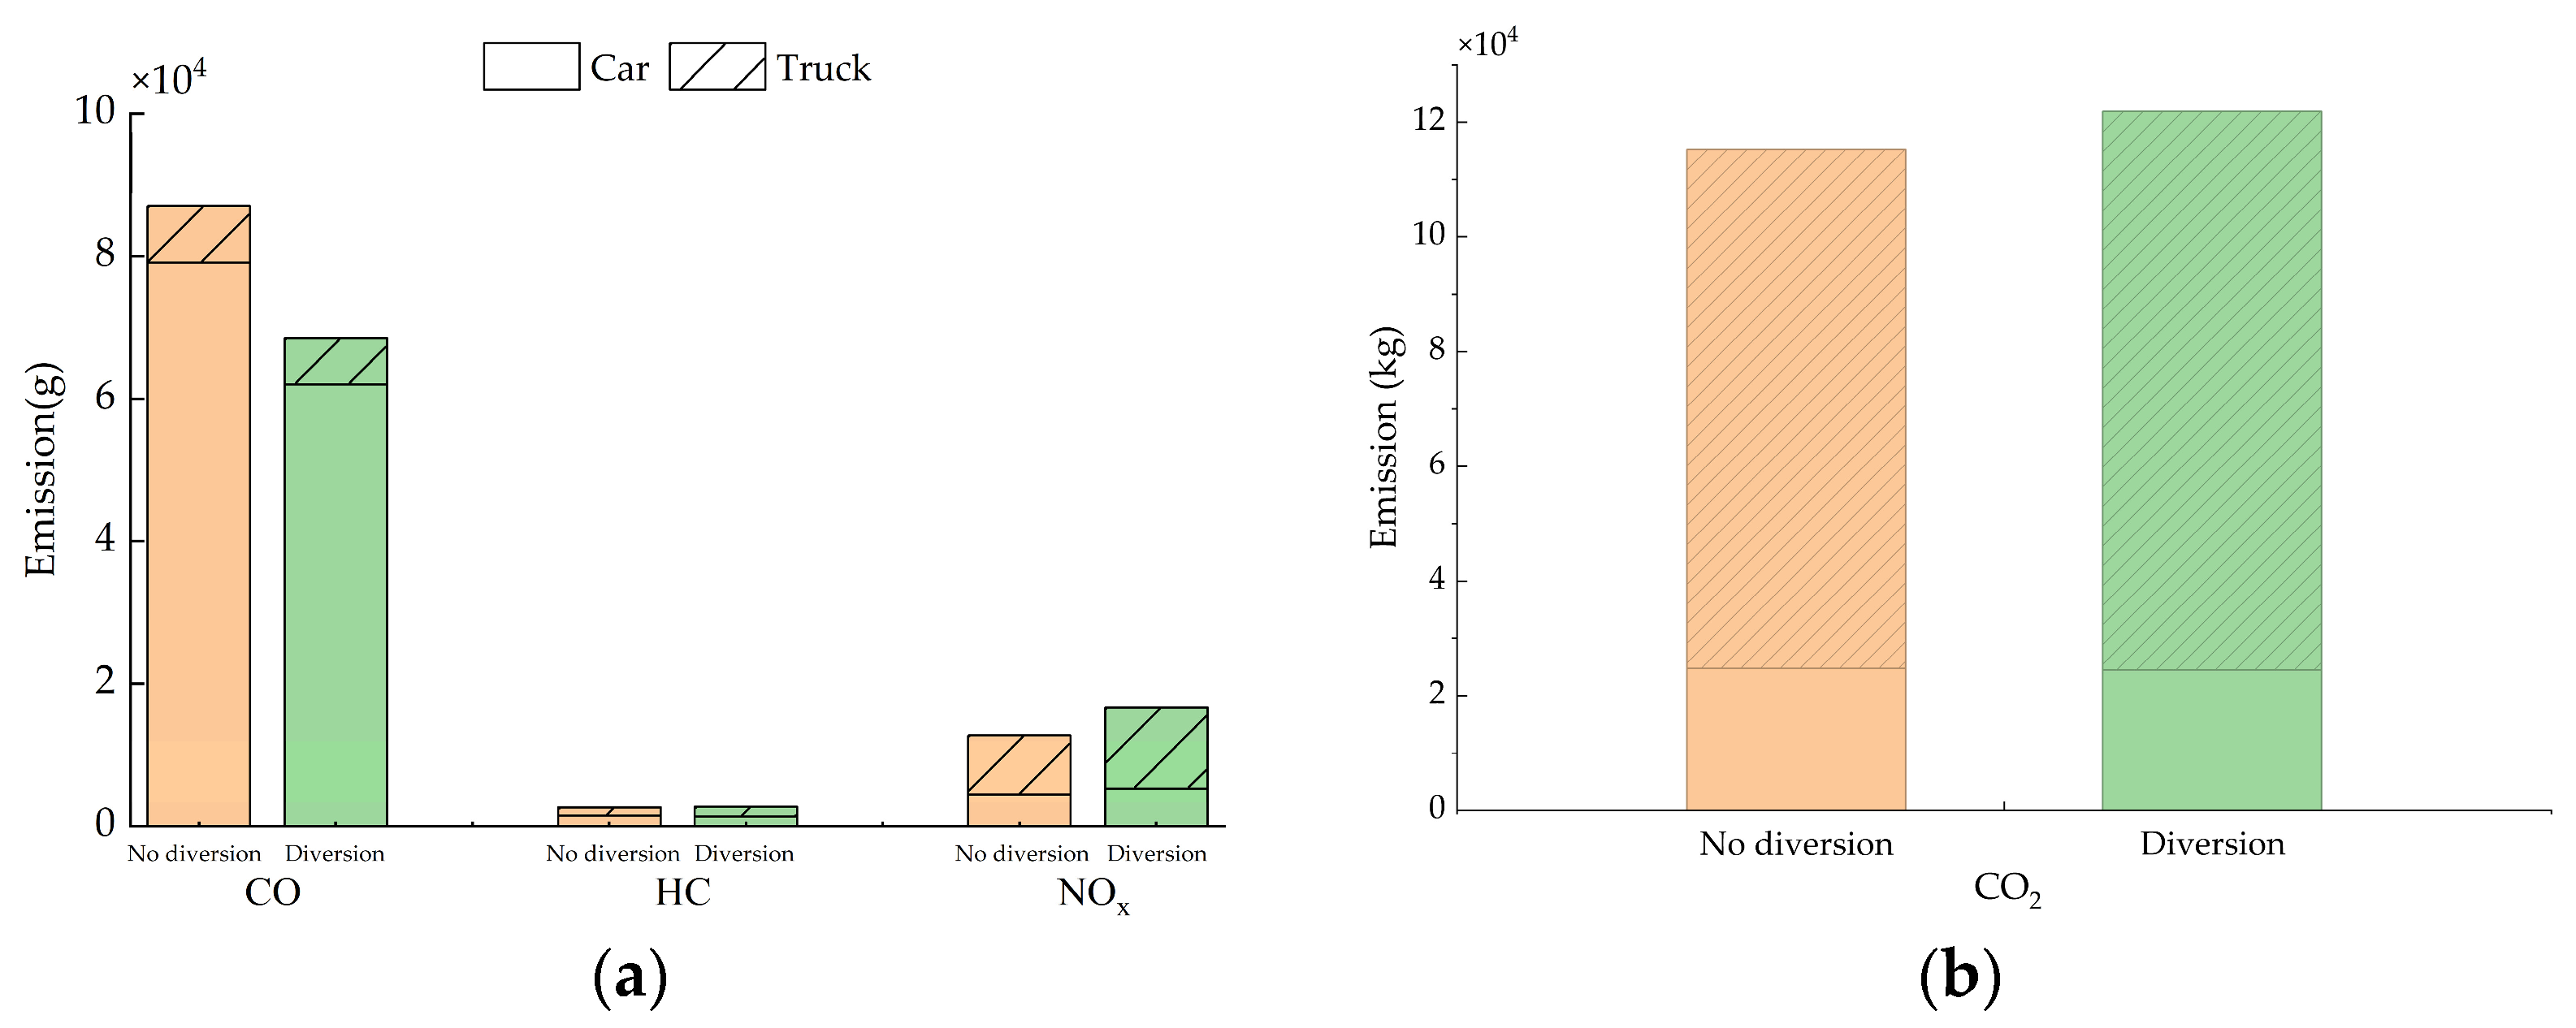
Figure 12 shows the vehicle exhaust emissions in the network with and without traffic diversion. As shown in Figure 12a, when there is no diversion, the emissions of CO, HC, and NOx per unit time are 87,033 g, 2730 g, and 12,780 g, respectively, for a total of 102,545 g. When the traffic diversion scheme is conducted, the emissions of CO, HC, and NOx per unit time are 68,548 g, 2793 g, and 16,740 g, respectively, with a total of 88,082 g. Comparing the two situations, the traffic diversion makes CO emissions decrease by 21.2%, HC emissions remain nearly constant, NOx emissions increase by 30.9%, and the total emissions decrease by 14.1%. The findings justify the ability of the traffic diversion in reducing vehicle exhaust pollutant emissions. In addition, cars are the primary contributors to CO emissions. Its per unit time emissions are decreased from 79,119 g to 62,070 g by the traffic diversion. Trucks are the main contributors to NOx emissions, with their per-unit-time emissions increasing from 8292 g to 11,393 g. The increased NOx emissions may be caused by the decreased average velocity of trucks.
Figure 12.
Comparison of vehicle exhaust emissions without and with diversion: (a) exhaust pollutant emissions; (b) CO2 emissions.
According to Figure 12b, without diversion, the CO2 emissions per unit time of cars and trucks are 24,776 kg and 90,418 kg, respectively, for a total of 115,194 kg. When the traffic diversion scheme is implemented, the CO2 emissions per unit time of cars and trucks are 24,451 kg and 97,425 kg, respectively, for a total of 121,876 kg. Compared with the case without diversion, traffic diversion decreases the CO2 emissions of cars by 1.3%, but increases the CO2 emissions of trucks by 7.7%, resulting in an increase of 5.8% in total CO2 emissions. It may be attributed to the fact that the detoured trucks due to traffic diversion consume more fuel and thereby lead to more CO2 emissions.
6. Conclusions
This study proposes a traffic diversion model considering the car–truck heterogeneity for expressway reconstruction and expansion. In the model, the generalized link impedance functions for cars and trucks are formulated by combining their travel time and link toll. A path-based algorithm using the MSA is designed for solving the model. In addition, a method for estimating the vehicle exhaust emissions in the traffic diversion network is developed, based on the COPERT model.
The results of a case study of an expressway reconstruction and expansion project in Guangdong Province, China indicate that the traffic diversion scheme optimized by the proposed model and algorithm significantly improve the traffic efficiency on the reconstructed links: The median V/C decreases by 0.93; the median car velocity increases by 41.9 km/h; and the median truck velocity increase by 31.5 km/h. Meanwhile, it slightly reduces the traffic efficiency on the other links within the network. In addition, the traffic diversion scheme reduces the vehicle exhaust pollutant emissions in the network by 16.9%, while increasing the CO2 emissions by 5.8%.
Although the effectiveness of the traffic diversion method is validated, it is based on fixed travel demand and perfect rational route choice behaviors. Extending it to elastic demand scenarios or incorporating stochastic route choice behaviors are promising directions for future research. In addition, only the heterogeneity between cars and trucks is considered, because the research focuses on expressway reconstruction and expansion projects. If the traffic diversion method was extended to urban roads, the heterogeneities between cars and other vehicles (e.g., motorcycles, light-duty vehicles, buses) should also be considered. In addition, exploring the effects of intelligent transportation systems and the penetration of electric vehicles on the performance of traffic diversion would also be a good direction for future research [25].
Author Contributions
Conceptualization, Q.Z. and X.W.; methodology, F.L.; software, X.L.; validation, Q.Z. and X.W.; formal analysis, F.L.; investigation, X.L.; resources, X.L.; data curation, X.L.; writing—original draft preparation, Q.Z. and F.L.; writing—review and editing, X.L. and X.W.; visualization, F.L. and X.L.; supervision, Q.Z.; project administration, X.W.; funding acquisition, Q.Z. and X.W. All authors have read and agreed to the published version of the manuscript.
Funding
This research was funded by the National Natural Science Foundation of China (grant number 72471091), the Natural Science Foundation of Guangdong Province, China (grant numbers 2025A1515010398 and 2025A1515011696), and the Guangdong S&T Program (grant number 2024A1111120009).
Data Availability Statement
The original contributions presented in this study are included in the article. Further inquiries can be directed to the corresponding author.
Conflicts of Interest
The authors declare no conflicts of interest.
Appendix A
Table A1.
Parameters of links.
Table A2.
OD matrix of cars.
Table A3.
OD matrix of trucks.
Table A4.
Diversion scheme.
References
- Ryu, S.; Chen, A.; Choi, K. Solving the combined modal split and traffic assignment problem with two types of transit impedance function. Eur. J. Oper. Res. 2017, 257, 870–880. [Google Scholar] [CrossRef] [Scilit]
- Wang, J.; Zhang, S.R.; Li, H. Traffic divergence model of freeway during reconstruction based on system optimization. J. Chang’an Univ. Nat. Sci. Ed. 2008, 5, 95–98. [Google Scholar]
- Memarian, A.; Rosenberger, J.M.; Mattingly, S.P.; Williams, J.C.; Hashemi, H. An optimization-based traffic diversion model during construction closures. Comput.-Aided Civ. Infrastruct. Eng. 2019, 34, 1087–1099. [Google Scholar] [CrossRef] [Scilit]
- Jiang, L.; Lang, Y.Q. The application of stochastic user equilibrium model to traffic diverging during highway expanding construction. Appl. Mech. Mater. 2011, 97, 391–396. [Google Scholar] [CrossRef] [Scilit]
- Kong, D.; Sun, L.; Li, J.; Xu, Y. Modeling cars and trucks in the heterogeneous traffic based on car–truck combination effect using cellular automata. Phys. A Stat. Mech. Appl. 2021, 562, 125329. [Google Scholar] [CrossRef] [Scilit]
- de Andrade, G.R.; Chen, Z.; Elefteriadou, L.; Yin, Y. Multiclass traffic assignment problem with flow-dependent passenger car equivalent value of trucks. Transp. Res. Rec. 2017, 2667, 131–141. [Google Scholar] [CrossRef] [Scilit]
- Thomas, J.; Srinivasan, K.K.; Arasan, V.T. Vehicle class wise speed-volume models for heterogeneous traffic. Transport 2012, 27, 206–217. [Google Scholar] [CrossRef] [Scilit]
- Andrych-Zalewska, M.; Chłopek, Z.; Lasocki, J.; Merkisz, J.; Pielecha, J. A stochastic approach to the analysis of pollutant emissions and fuel consumption of motor vehicles driven in real traffic. Appl. Sci. 2024, 14, 11346. [Google Scholar] [CrossRef] [Scilit]
- Chen, S.; Du, Z.; Shi, X.; Liu, Y.; Li, S.; Shao, C.; Steve-Harold, K. MOVES-Beijing-based high spatial and temporal resolution ammonia emissions from road traffic in Beijing. Atmos. Environ. 2021, 256, 118443. [Google Scholar] [CrossRef] [Scilit]
- Zhang, K.; Batterman, S.; Dion, F. Vehicle emissions in congestion: Comparison of work zone, rush hour and free-flow conditions. Atmos. Environ. 2011, 45, 1929–1939. [Google Scholar] [CrossRef] [Scilit]
- Sun, Z.; Hao, P.; Ban, X.; Yang, D. Trajectory-based vehicle energy/emissions estimation for signalized arterials using mobile sensing data. Transp. Res. Part D Transp. Environ. 2015, 34, 27–40. [Google Scholar] [CrossRef] [Scilit]
- Song, X.; Hao, Y.; Zhang, C.; Peng, J.; Zhu, X. Vehicular emission trends in the Pan-Yangtze River Delta in China between 1999 and 2013. J. Clean. Prod. 2016, 137, 1045–1054. [Google Scholar] [CrossRef] [Scilit]
- Jia, T.; Qi, J. Vehicle emission models and their applications in China: A comprehensive review. J. Traffic Transp. Eng. (Engl. Ed.) 2025, 12, 1855–1877. [Google Scholar] [CrossRef] [Scilit]
- Gong, L.; Fan, W. Optimizing scheduling of long-term highway work zone projects. Int. J. Transp. Sci. Technol. 2016, 5, 17–27. [Google Scholar] [CrossRef] [Scilit]
- Liu, Z.; Wang, S.; Meng, Q. Optimal joint distance and time toll for cordon-based congestion pricing. Transp. Res. Part B Methodol. 2014, 69, 81–97. [Google Scholar] [CrossRef] [Scilit]
- Wardrop, J.G. Some theoretical aspects of road traffic research. Proc. Inst. Civ. Eng. 1952, 1, 325–362. [Google Scholar] [CrossRef] [Scilit]
- Yao, J.; Shi, F.; Zhou, Z.; Qin, J. Combinatorial optimization of exclusive bus lanes and bus frequencies in multi-modal transportation network. J. Transp. Eng. 2012, 138, 1422–1429. [Google Scholar] [CrossRef] [Scilit]
- Huang, W.; Xu, G.; Lo, H.K. Pareto-optimal sustainable transportation network design under spatial queuing. Netw. Spat. Econ. 2020, 20, 637–673. [Google Scholar] [CrossRef] [Scilit]
- Zhang, X.; Zhang, S.; Luo, W.; Tang, J. Analysis of cascading failures and recovery in freeway network under the impact of incidents. Appl. Sci. 2025, 15, 7276. [Google Scholar] [CrossRef] [Scilit]
- Kuang, A.W.; Huang, Z.X. A research on mixed stochastic user equilibrium model based on generalized travel disutility under ATIS. In Proceedings of the 2010 International Conference on Intelligent Computation Technology and Automation, Changsha, China, 11–12 May 2010. [Google Scholar]
- Aga, A.G.; Arsedi, A.N.; Huluka, A.W. Predictive analysis of passenger vehicle emissions and fuel consumption in Addis Ababa, Ethiopia using COPERT based on vehicle growth forecasting. Atmos. Environ. X 2025, 28, 100385. [Google Scholar] [CrossRef] [Scilit]
- European Environment Agency. EMEP/EEA Air Pollutant Emission Inventory Guidebook 2023: Technical Guidance to Prepare National Emission Inventories; Publications Office of the European Union: Luxembourg, 2023. [Google Scholar]
- Federal Highway Administration. Traffic Data Computation Method Pocket Guide; Publication No. FHWA-PL-18-027; Federal Highway Administration: Washington, DC, USA, 2018.
- Guangdong Provincial Bureau of Statistics. Guangdong Statistical Yearbook 2025. Available online: https://stats.gd.gov.cn/gdtjnj/content/post_4810393.html (accessed on 19 March 2026).
- Kłos, M.J.; Sierpiński, G. The Optimization of Intelligent Transport Systems: Planning, Energy Efficiency and Environmental Responsibility. Energies 2025, 18, 4518. [Google Scholar] [CrossRef] [Scilit]

Disclaimer/Publisher’s Note: The statements, opinions and data contained in all publications are solely those of the individual author(s) and contributor(s) and not of MDPI and/or the editor(s). MDPI and/or the editor(s) disclaim responsibility for any injury to people or property resulting from any ideas, methods, instructions or products referred to in the content. |
© 2026 by the authors. Licensee MDPI, Basel, Switzerland. This article is an open access article distributed under the terms and conditions of the Creative Commons Attribution (CC BY) license.