


Abstract
The study reports on the essential level of details in simulations during the development of structural components if reliability-based design is used to ensure their quality and operational safety. A general method, which is initially introduced, is then applied to an indicator spring of a fuse element during assembly and operation stages. First, it is proven that design of simulations based on orthogonal arrays which includes variations of form, material properties and operating conditions within expected scatter limits provides a comparable determination of the scale parameter for the two-parameter Weibull distribution as the experimental observations of the same process. The shape parameter of the distribution tends to be underestimated by the simulations resulting in a higher scatter of the expected properties than experimentally measured. Next, it is shown that the maximum likelihood method to determine representative parameters of the scatter of assembly and operation stages provides a better match with experimental data than the median rank regression. Finally, a high reliability of the indication has been calculated for the fuse element if both the scatter of the assembly and the operation conditions were considered.
1. Introduction
A probabilistic approach to design of mechanical structures has a crucial advantage as compared to the conventional deterministic approach with safety factors [1,2,3,4]. Namely, an objective and direct measure for uncertainty contains a very strong piece of information regarding the effectiveness of the design [5,6]. Moreover, since the effectiveness of the design is closely related to quality and safety of mechanical components, a proof of structural quality and safety can be drawn with greater confidence if the uncertainties are also considered during the analysis [7,8,9]. Conversely however, a setback of probabilistic approach to mechanical design is a time-consuming and costly procedure as it requires reliable experimental data to ensure trustworthy predictions [1,10,11,12,13,14]. Paradoxically, a more systematic inclusion of reliability analyses within the design process could drastically reduce the overall cost of development and the risk of failure of mechanical components [15].
Typically, simulations of structural behaviour using the finite element analysis (FEA) and deterministic approach suppose constant geometry of mechanical components and material data represented by material parameters which are most commonly determined for a pre-defined probability of failure [16,17,18]. Arfa et al. [16] applied the finite element technique in a recent study to model the laminated beam and extract the mass and stiffness matrices for the bending vibration. Ho and Lee [17] developed a robust numerical procedure for the limit state analysis of structures using an adaptive edge-based smoothed finite element method and applied it to a number of engineering problems including a perforated plate subjected to in-plane tension, a cantilever beam subjected to shearing load, a simple frame and two cracked plates. Gamez-Montero and Bernat-Maso [18] used constant Young’s modulus, density, and Poisson’s coefficient in FE simulations during the design of numerical simulations to assess contact stress in gerotor pumps. The boundary conditions are typically also kept constant during the analyses with deterministic approach [17,19]. In a recent study by Pham and Cuong-Le [19], constant boundary conditions including simple supports, clamps or prescribed displacements have been assigned to analyse oscillation and buckling of a skew-nanoplate manufactured from piezoelectric materials in a hygro-temperature environment using the finite element approach. Šeruga et al. [20] predicted the damage of a thermomechanically loaded exhaust muffler using realistic boundary conditions during the operation. In another study by Schmidt et al. [21] on numerical investigation of N-joints from high-strength square hollow sections, constant boundary conditions in FEA were derived from the support conditions used in the component tests. These assumptions provide a good insight into the behaviour of components under scrutiny and help researchers and engineers to explain potential issues with operation or improve the design. Additionally, the analyses are least time-consuming as no iterations or modifications in the analyses are needed.
For a reliability-based evaluation of a mechanical component, variations of either mechanical properties, material parameters or boundary conditions are necessary as reported by several recent studies. Hao et al. [12] showed that FEA in combination with isogeometric analysis can be used for reliability predictions of composite variable-stiffness panels with curvilinear fiber paths subjected to buckling. Zheng et al. [22] constructed Gaussian process-based surrogate models from FE simulation results to estimate the properties of salt caverns with less time-consuming calculations. Likewise, Yoo et al. [1] have studied options with multi-fidelity models to generate surrogate models using input and output pairs calculated by FEA. Similarly, Hassanien et al. [23] proved that FEA and reliability analysis are applicable to consider the scatter of measurement uncertainties and component properties using surrogate models to establish the probability of failure. Hosseinzadeh et al. [13] varied material properties and load of a 3D bracket with hole to solve static structural reanalysis problems. Studies by Glavan et al. [24] and Škrlec et al. [25] used FEA to simulate variable properties of mechanical joints and plate-like specimens, respectively. Mikelj et al. [26] showed that the variation of boundary conditions has to be considered for cast-iron manhole covers in order to correctly design the geometry. Recent challenges including FEA in the reliability studies also involve training of physics-informed neural networks (PINNs) with FEA results of realistic engineering problems [10].
Although several recent studies have proven the importance of consideration of uncertainties, this study highlights the importance of representative experimental data, processing of experimental data and performance of structural FEA. Specifically, it shows that expertise and experiences are important when a full geometrical model is prepared for a structural analysis as the outcomes of the simulation results directly reflect potential simplifications and assumptions made during the preparation stage of the simulations. The main aim of the study is to show that simulations using structural FEA can facilitate the reliability estimation of mechanical components even if the simplest two-level design of simulations is performed. The secondary aim is to analyse the effect of interpretation of simulation results to the reliability predictions if care is not taken during the post-processing stage. A safety assembly within an electric fuse to indicate the operation is chosen as an example for the reliability-based design. Fuses are electro-mechanical elements that are installed in all electric circuits, including domestic appliances, industrial electric systems, electric motors and devices, electric vehicles and photovoltaics [27,28,29,30,31]. They are intentionally designed to be weak, allowing them to interrupt the electric circuit during overloads or short-circuit conditions which consequently safeguards the users and sensitive electronic components [28,32]. Reliability and safety are thus essential characteristics of the fuse design. The remainder of the paper is organised as follows. Section 2 gives an overview of uncertainty source and the framework for statistical model calibration and validation. Section 3 presents the results of the simulations and experiments in the presence of recognised uncertainties. Section 4 discusses the reasons for the obtained results of simulations and experiments. Section 5 summarises the main outcomes of the study.
2. Method
In general, mechanical properties , material parameters and boundary conditions at any location of a mechanical component can be prescribed as
which means that they stand for arbitrary variables depending either on form, material or operation, respectively. Output function of the mechanical component can then be derived with respect to the arbitrary variables as
and it also represents an arbitrary variable. However, as typically the random distribution of the form properties, material parameters or boundary conditions are not known for every location of a mechanical component separately, the output function of the mechanical component can be expressed directly as
and can be gained either by simulations or experiments, respectively. The scatter can then be conveniently described as which represents probability density function of the output function in the observed direction. If the mechanical component is in interaction with another mechanical component, then similarly the output of the other mechanical component can be written as
and it also stands for an arbitrary variable. The scatter can be described as which stands for probability density function of the output function in the same direction as for the output function . A successful interaction of the two mechanical components in the observed direction can now be written as
which can also be interpreted as the reliability of the interaction. According to the interference theory [33], represents the current limit of the inner integral among all possible values given by the limits of the outer integral. Typically, two-parameter Weibull distributions are used in reliability engineering [34,35], so the outputs of the interacting mechanical components from Equation (5) can be written as
where and represent the scale parameters, and and stand for the shape parameters of the output functions of the interacting components. If the outputs of the interacting mechanical components are given in terms of functions that take non-negative values only, then Equations (5) and (6) yield equivalent results if the limits of integration change into
and
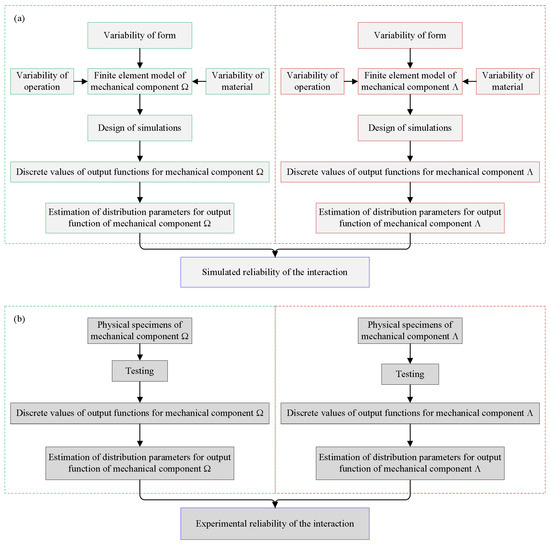
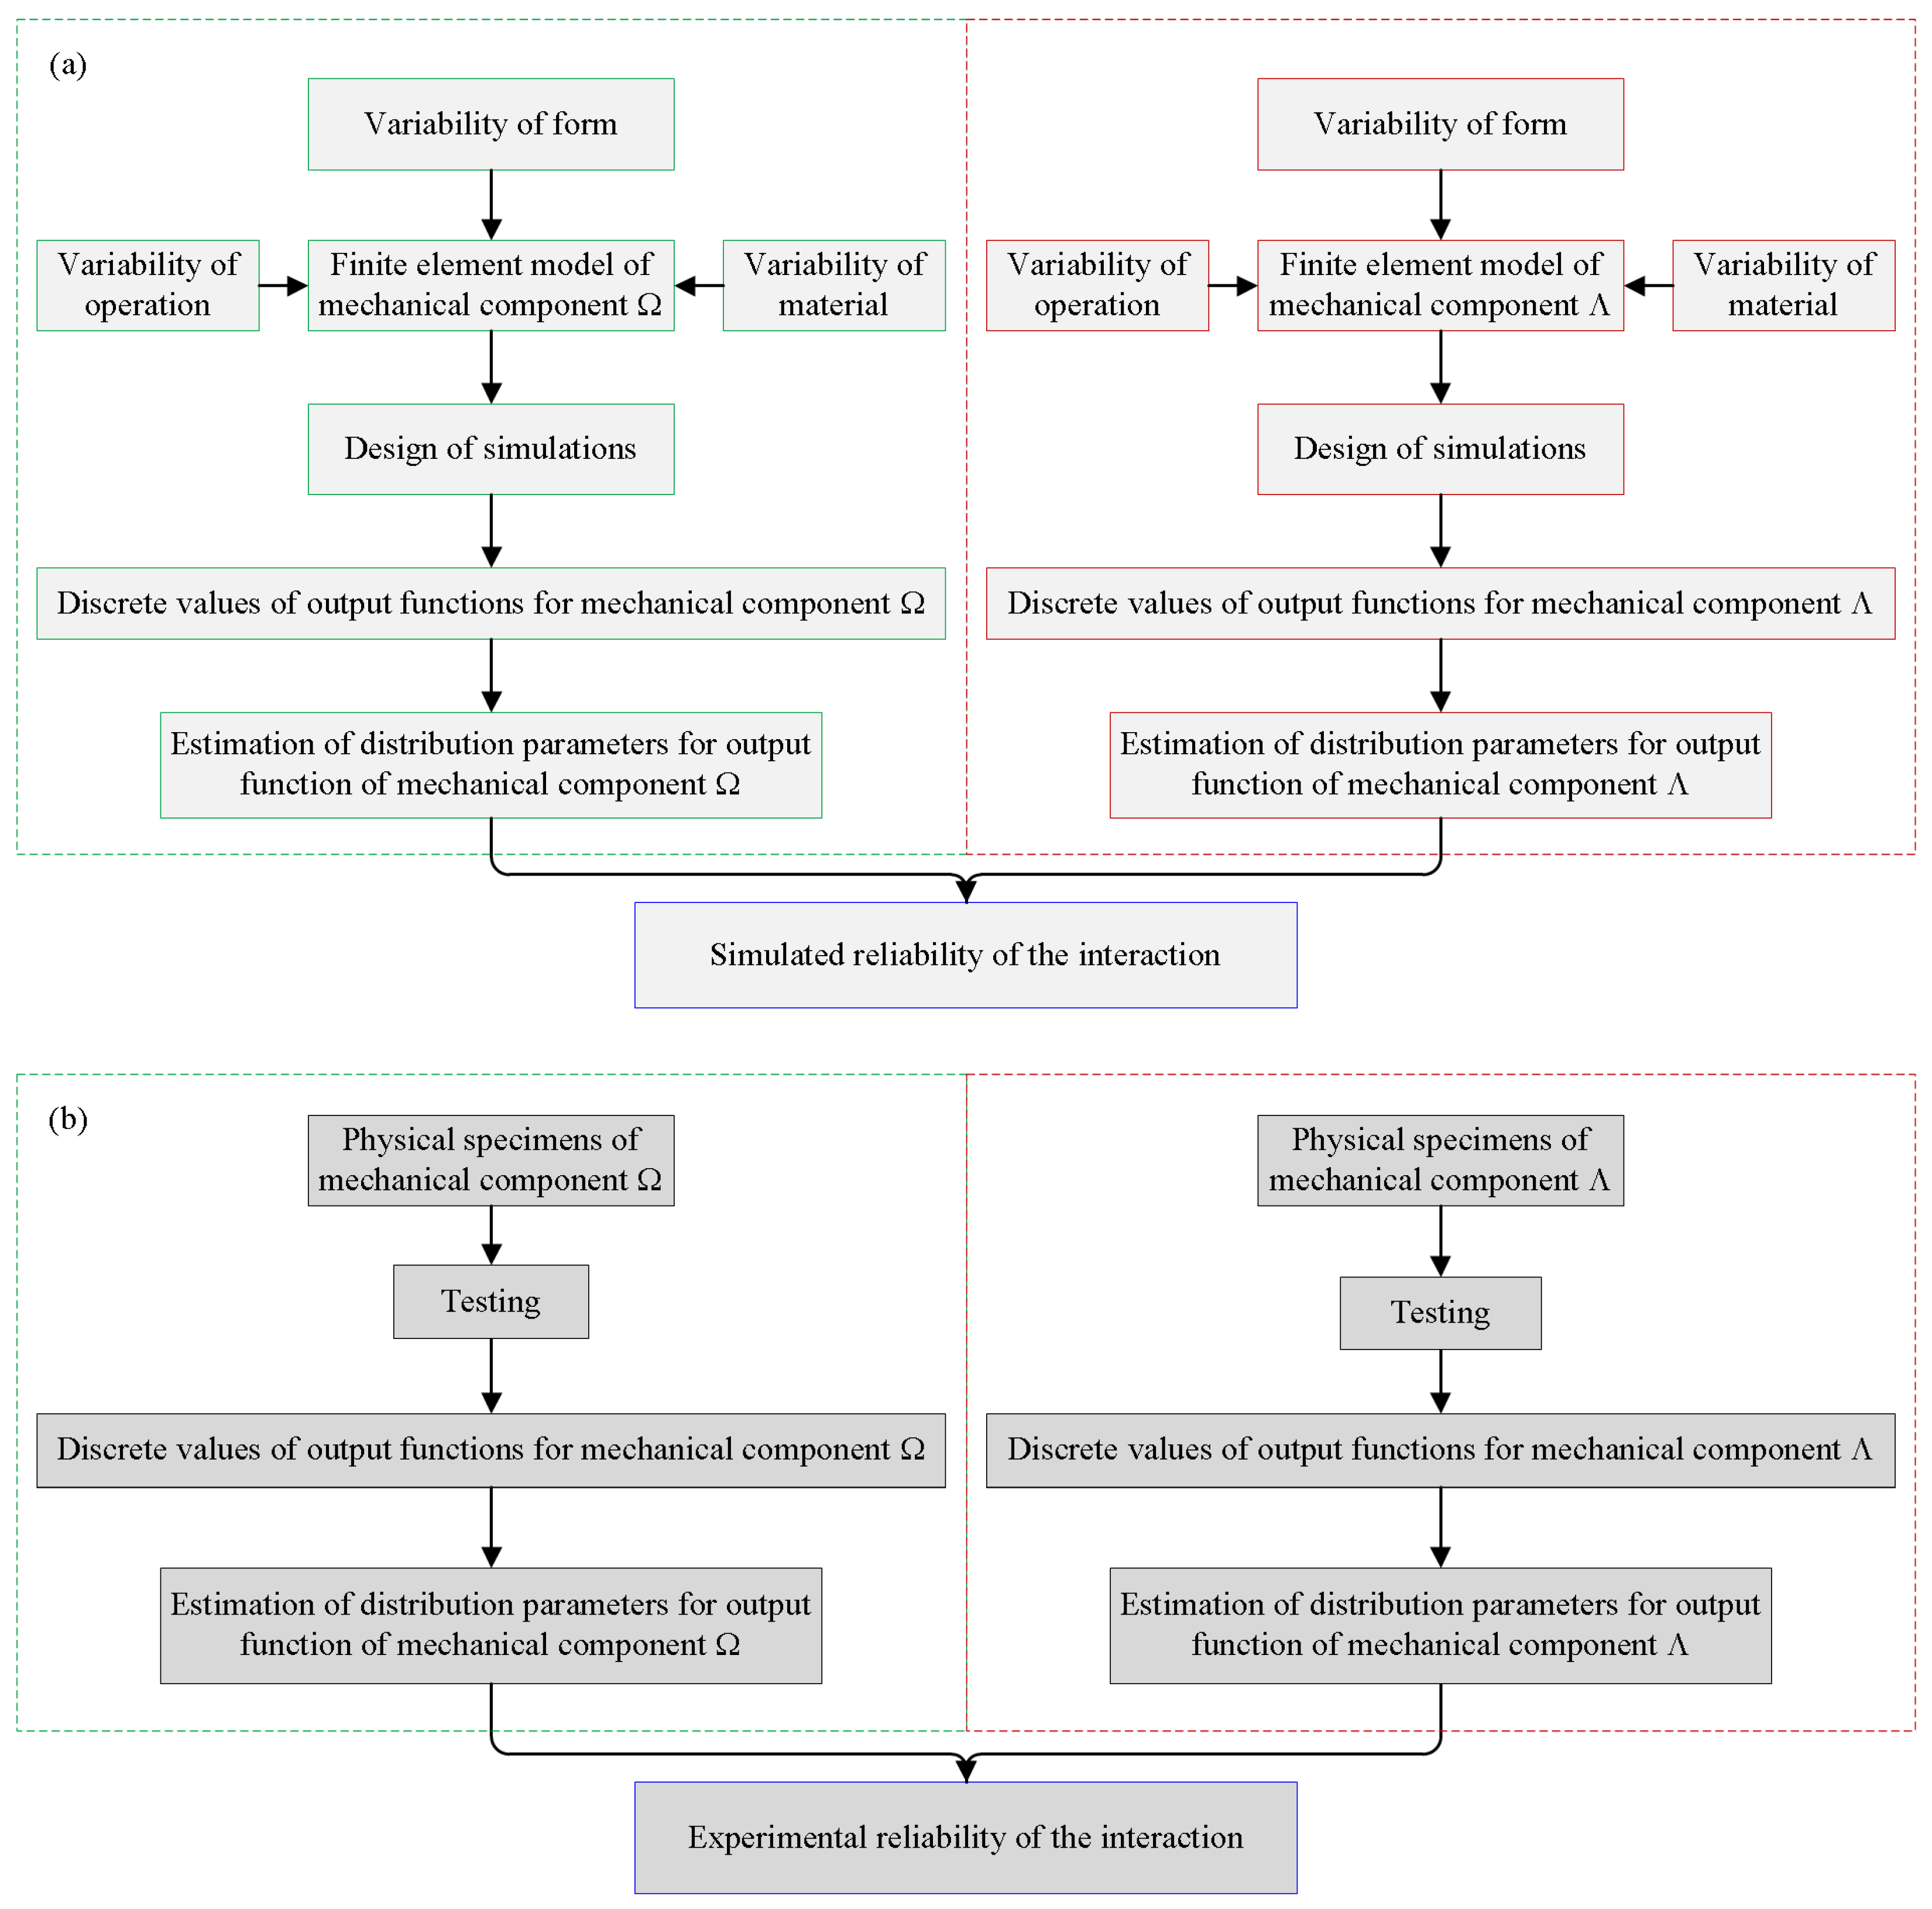
Flowchart of reliability assessment in case of scattered output functions for interacting components and is given in Figure 1 if either simulations or experiments are used to gain the data. Importantly, the reliability can also be estimated if the output function for one of the components is gained by simulations and for the other one by experiments.
Figure 1.
Flowchart of reliability assessment using (a) simulations or (b) experiments.
2.1. Estimation of Parameters
Several estimation methods can be utilised for the determination of representative parameters of Weibull distribution [36,37,38,39], including the maximum likelihood estimation (MLE) as the most conventional method [36,39] and the median rank regression (MRR) for its simplicity [39,40,41].
The MLE method defines the likelihood function L for a random variable x with Weibull distribution as
where is the number of available experimental results and is the vector of material parameters and . The aim is to find such a set of material parameters which maximises the likelihood function L. Since the likelihood function and its logarithm have the same maximum, its logarithmic form for Weibull distribution is used in the calculation,
By equating partial derivatives of the logarithmic likelihood function with respect to the material parameters to zero,
the material parameters and can be gained by the use of numerical methods. Procedure following Equations (10)–(12) must be repeated for each participating mechanical component.
The MMR method first assumes the median rank position for available experimental results according to Benard and Bos-Levenbach [42] as
Now applying the two-parameter Weibull cumulative distribution [34,35] for the i-th result as
material parameters and can be expressed as
which can be solved for available experimental results by least squares regression as
and
Again, procedure following Equations (13), (16) and (17) must be repeated for each participating mechanical component.
2.2. Application to Operation of an Electric Fuse and Indicator Spring
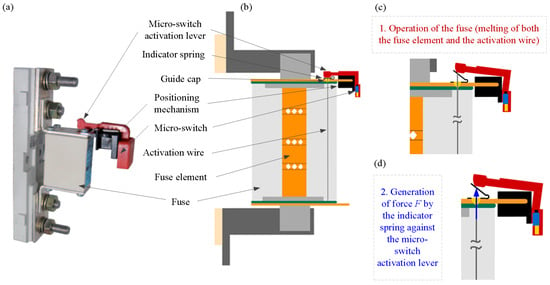
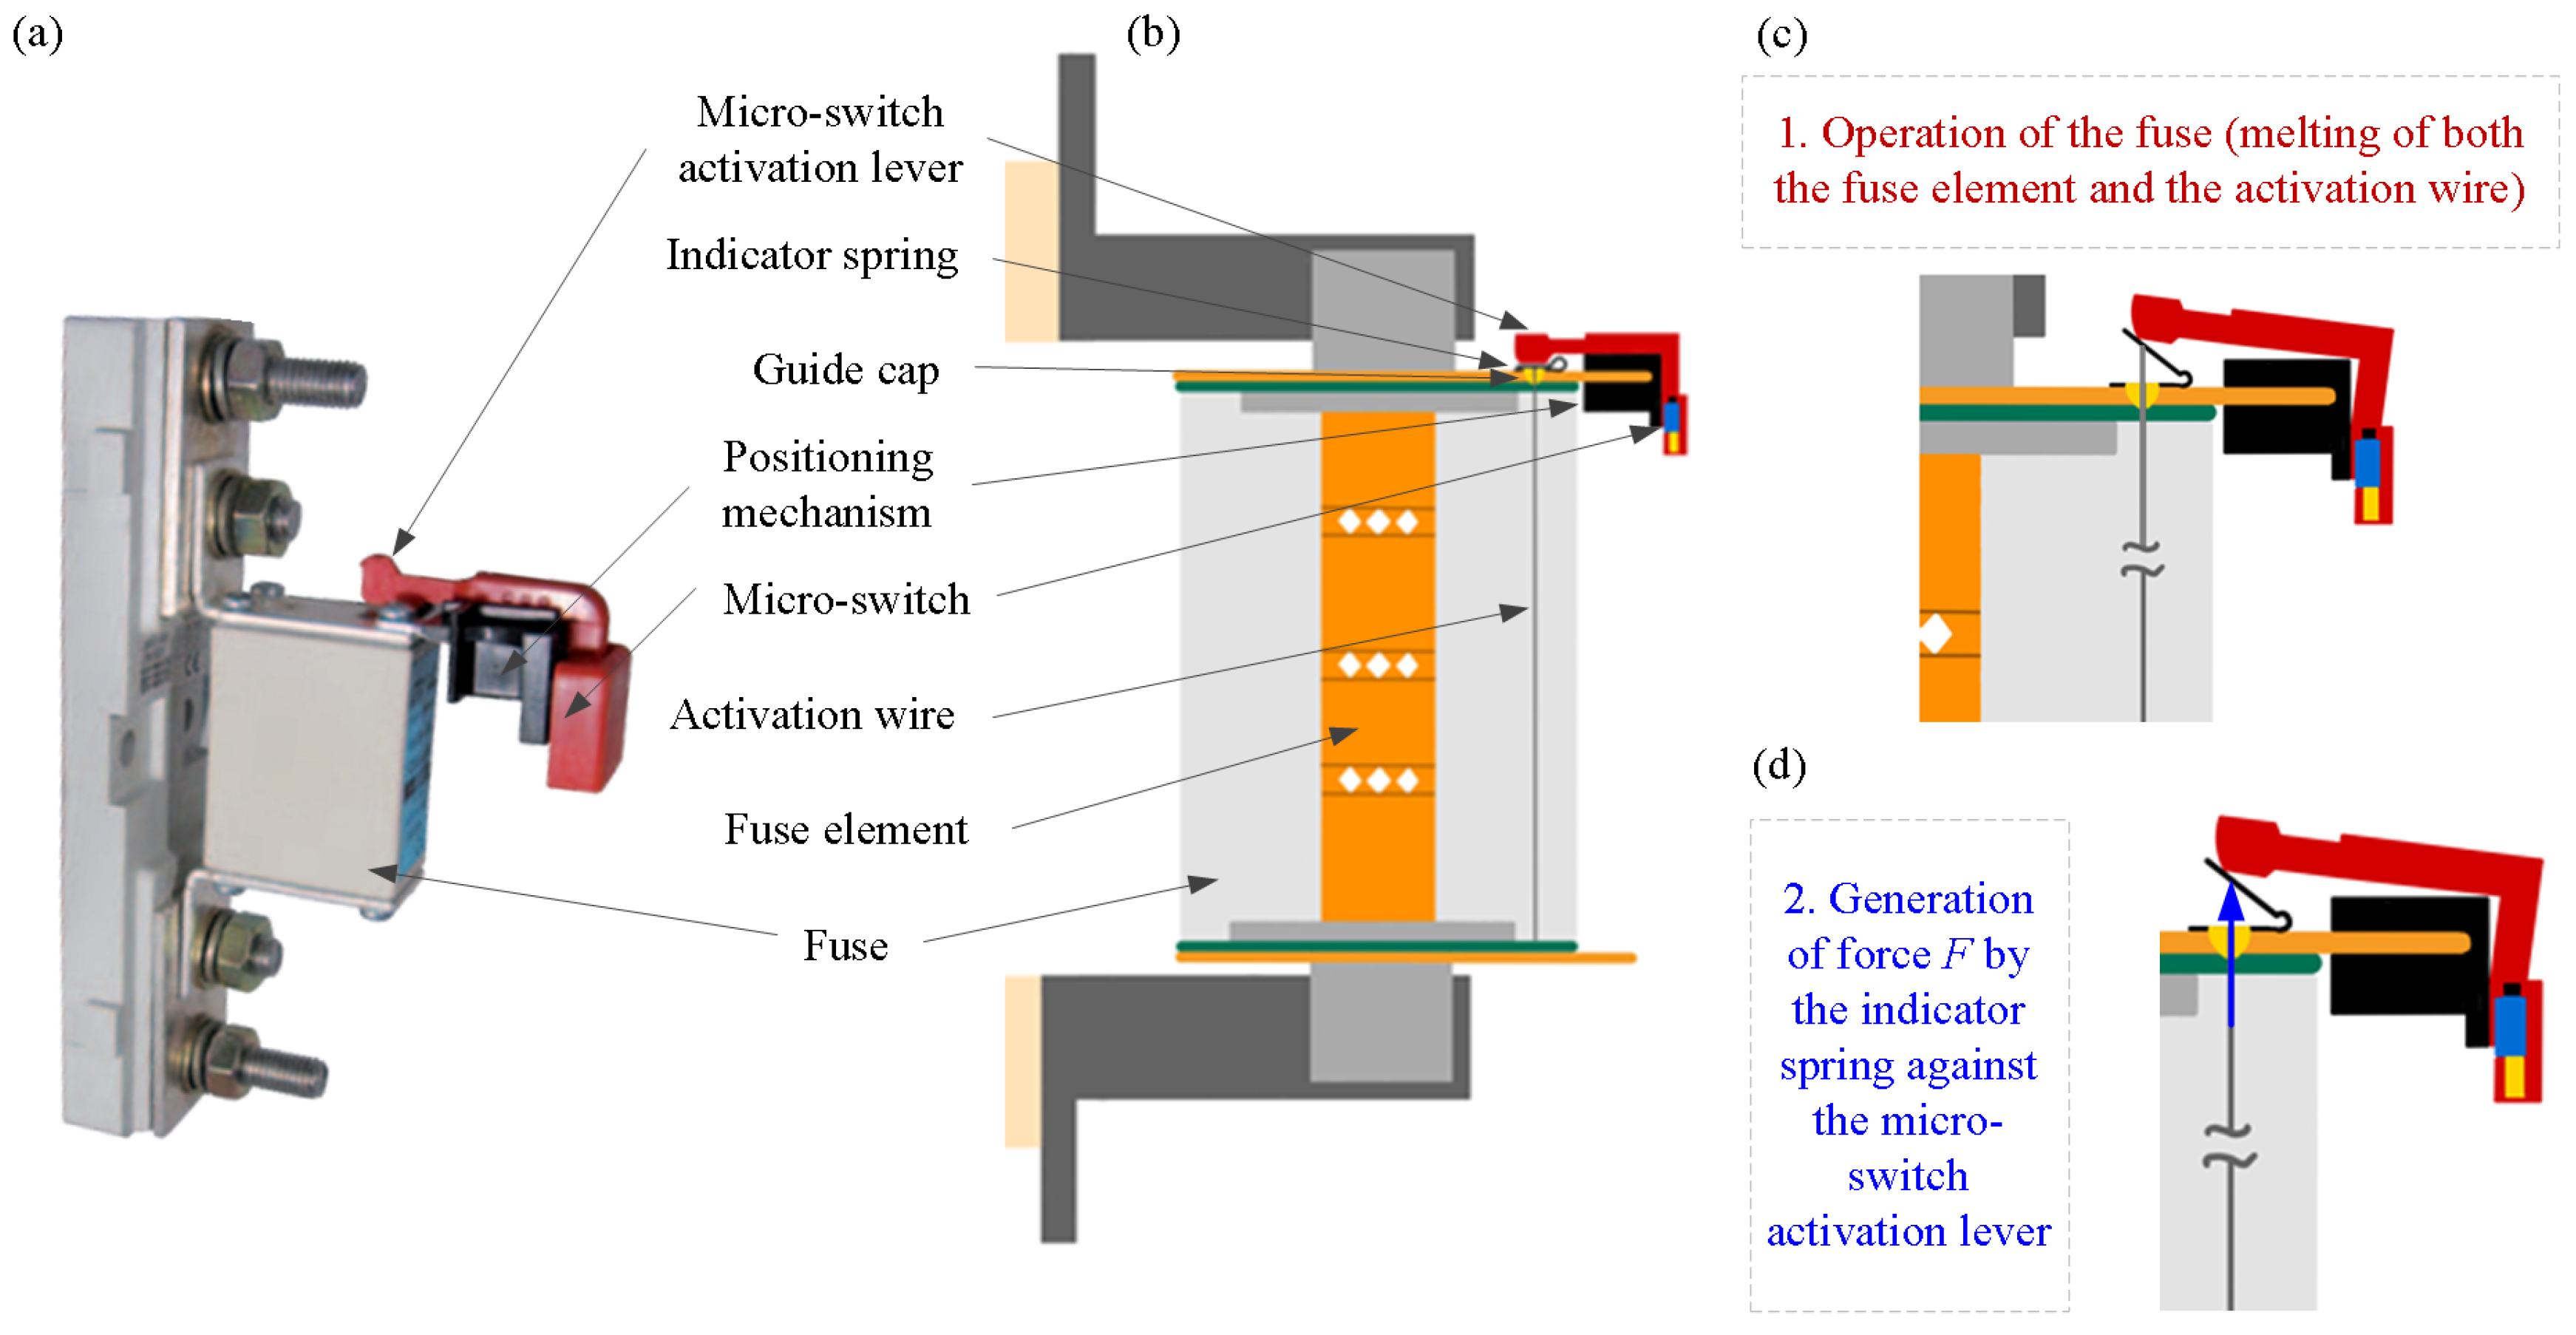
The operation of an electric fuse is ensured by a built-in fuse element which melts upon the overload during operation [27,29,43]. A typical assembly of an electric fuse is shown in Figure 2a,b. The fuse operation can be indicated by a visual element signaling that the fuse must be replaced after fault clearance and before restoring the electric circuit. The fuse operation can also release a pre-strained indicator spring by melting the activation wire (Figure 2c,d). The released indicator spring then activates a micro-switch which can be connected either to a light source or to a remote control equipment, both intended to identify the activated fuse. This is especially important in electric systems containing multiple fuse units [27,44]. The activation of micro-switch stands for function in Equation (3) and the operation of indicator spring stands for function in Equation (4).
Figure 2.
Assembly of an electric fuse: (a) as mounted in an electric circuit, (b) typical elements shown in a cross-section, (c) during operation and (d) generation of force for indication of operation.
The force F which is generated as an output of an indicator spring can thus be expressed as
where and represent geometric and material properties of the indicator spring (thickness of the indicator spring, yield stress of the material and its strain at rupture, respectively). Manufacturing conditions are simulated by the initial position of the indicator spring h and positioning of the activation wire onto the indicator spring d. Variables and stand for the friction coefficients between the indicator spring and the micro-switch activation lever, and the indicator spring and the guide cap, respectively. Finally, the operating condition of the indicator spring is represented by the displacement of the indicator spring u at fuse operation. Apart from the displacement of the spring which is intrinsically connected to the rigidity of the spring and therefore to the spatial observation of the fuse after the operation, all other parameters can be considered as arbitrary variables depending either on form, material or operation as described in Equation (4).
The simulations in this study have been carried out using finite element (FE) analysis in Abaqus 6.13-5. Structural shell elements S3 and S4R for the indicator spring and the micro-switch activation lever (767 finite elements), and structural volume elements 3D10 for the guide cap (5046 finite elements) have been used to create the finite element mesh of the assembly as shown in Figure 3a. The key performance indicators of the mesh were default values for the aspect ratio (greater than 5) and the geometric deviation factor (greater than 0.2) set in the mesh pre-processor of Abaqus. The thickness of the indicator spring sheet metal could vary between and . The elastoplastic material properties of X12 CrNi 17-7 steel sheet metal were modelled using a bilinear material model. Elastic modulus was kept constant at E = 210,000 MPa, whilst yield stress and strain at rupture were varied between and , and between and , respectively. The tensile stress of the material was determined with measurements at . Penetration of the parts within the assembly was prevented by contacts in normal direction between the guide cap and the indicator spring, and the indicator spring and the micro-switch activation lever. Tangential loads in contacts were transferred by varying coefficients of friction in range . The boundary conditions of the simulations first considered a pre-assembly step (Figure 3b—step 0) where the activation wire was attached to the indicator spring within a diameter of . However, the activation wire was represented in the simulations by prescribed position of the wire attachment point to the indicator spring. Next, the indicator spring was pre-strained using the activation wire with precision of which was considered as the assembly step (Figure 3c—step 1). Finally, the operation of the fuse and consequently also the operation of the indicator spring was simulated by following the generation of the force in y-direction once the activation wire was released (Figure 3a). Specifically, the generation of the force was recorded at three steps (steps 2, 3 and 4). The positions of the micro-switch activation lever in steps 2, 3 and 4 (depicted in Figure 3d–f) were directly comparable to experimentally measured displacements explained in detail in Section 2.4. The post-processing of the simulation results using the proposed methodology for the reliability assessment is summarised in Figure 4.
Figure 3.
Finite element analysis of the indicator spring: (a) finite element mesh, (b) pre-assembly position in step 0, (c) assembly position in step 1, (d) operation of fuse in step 2, (e) intermediate step (step 3) and (f) final position of the indicator spring (step 4). The stress results are shown for simulation #1 from Table 1.
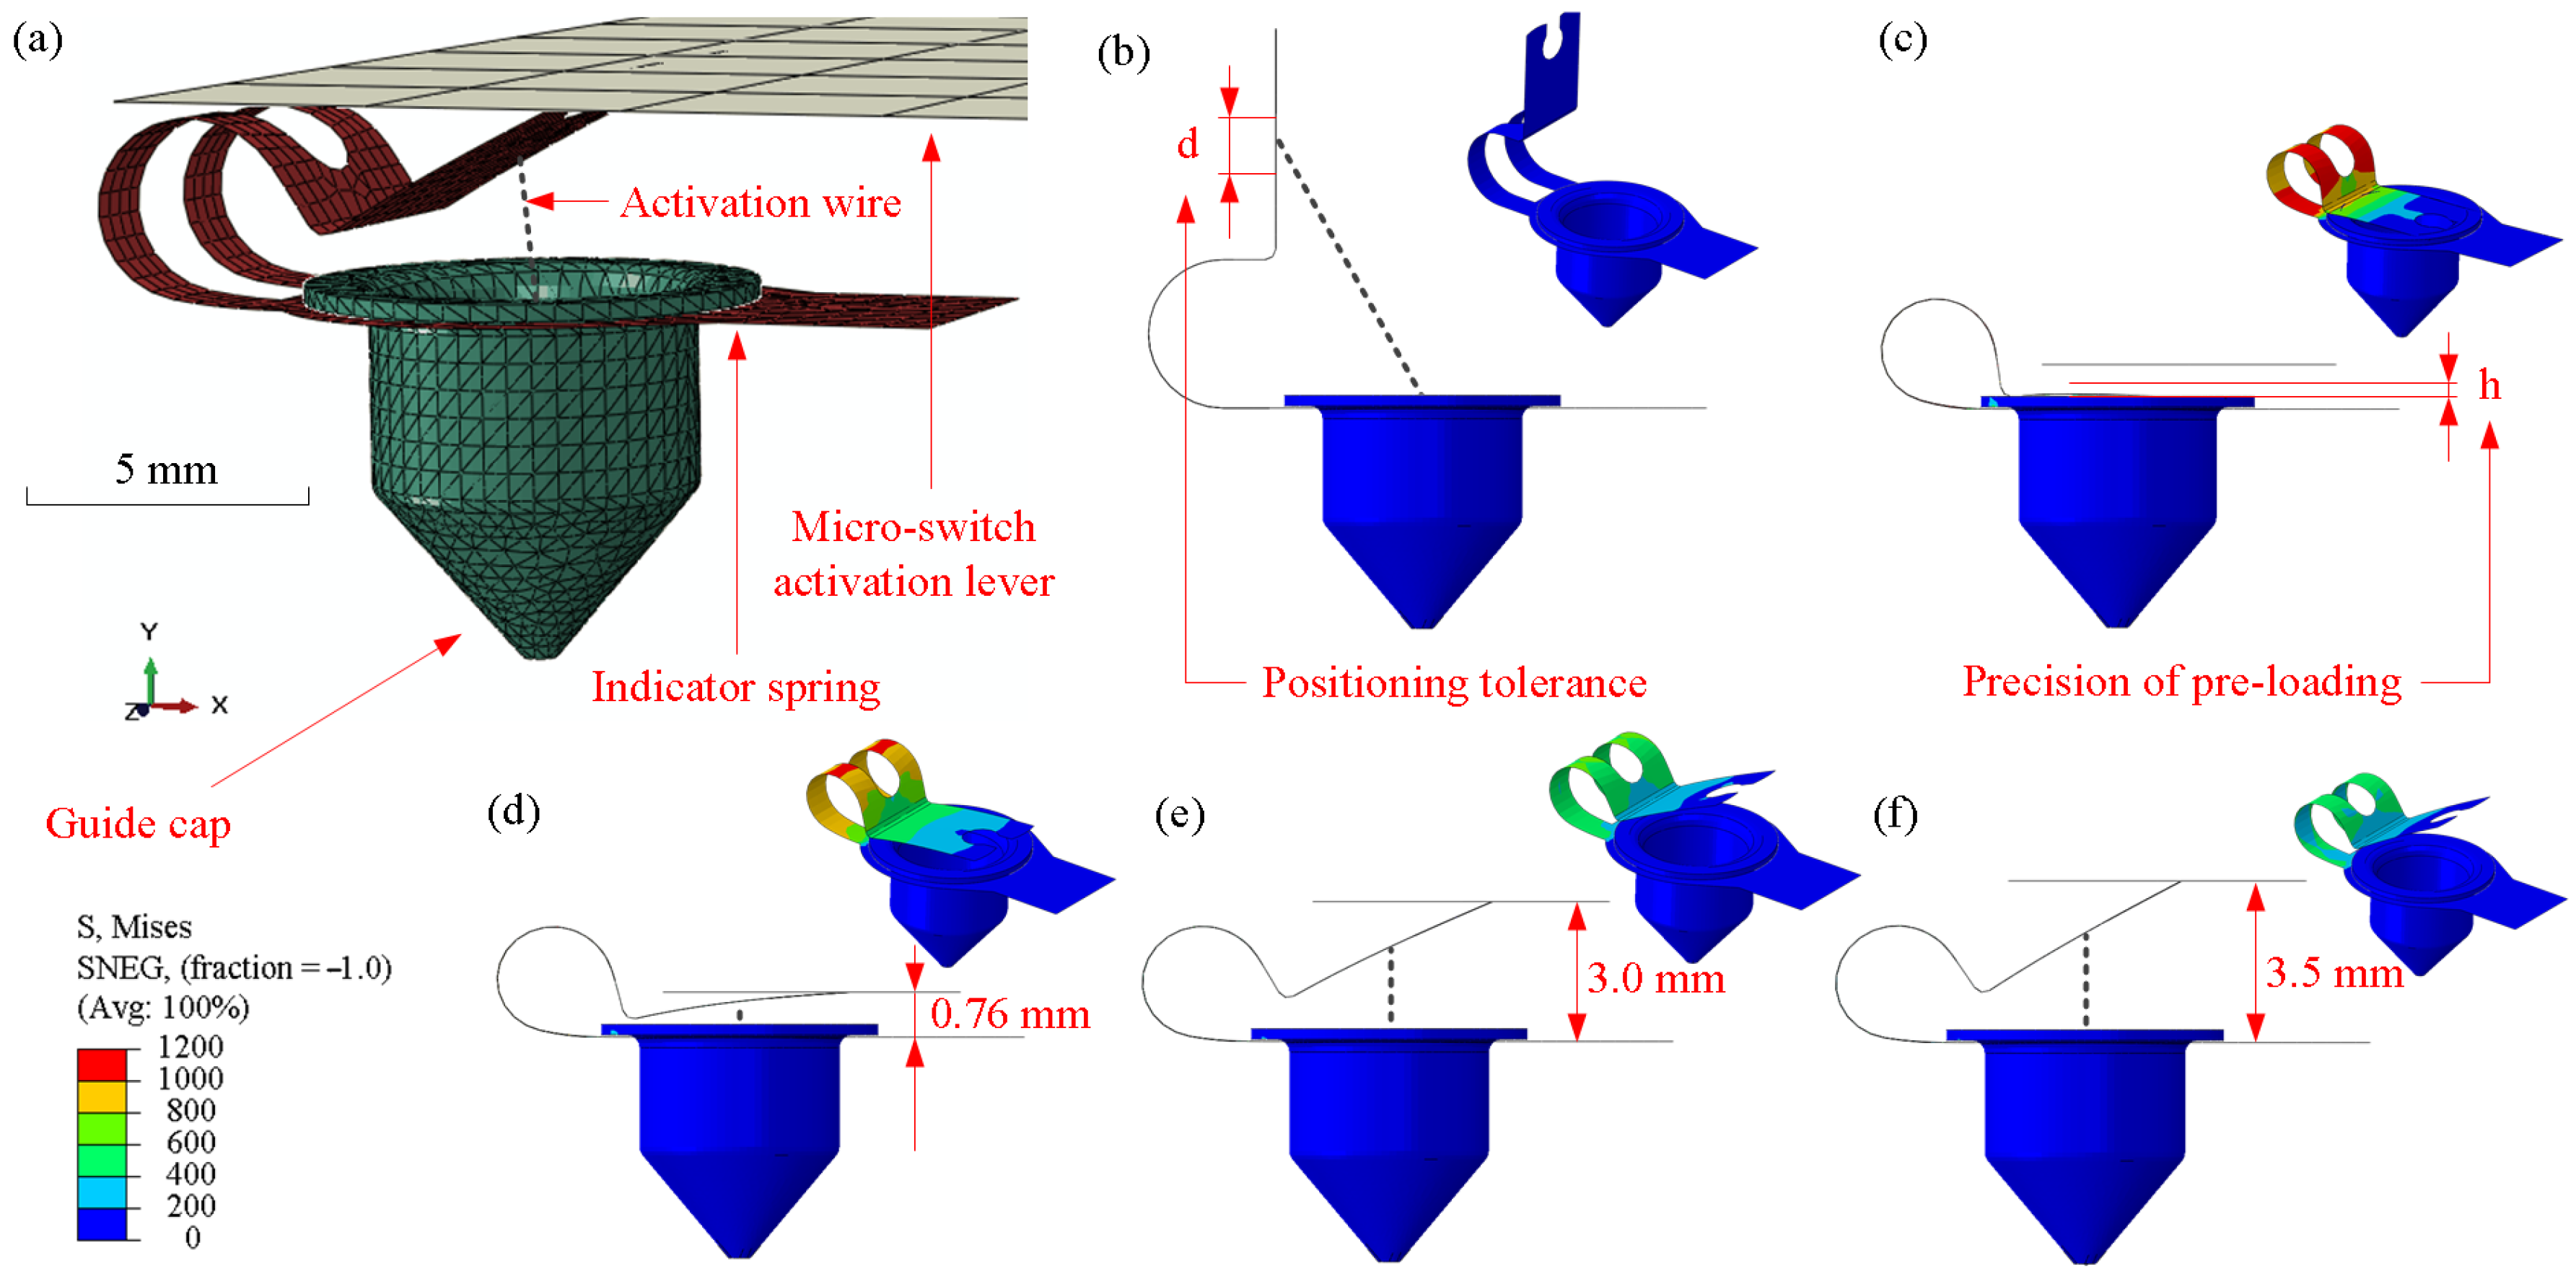
Figure 4.
Application of reliability-based design to the operation of the fuse: (1) Simulation of the force using structural FEA of the indicator spring, guide cap and micro-switch activation lever, (2) simulated force results for indicator spring using orthogonal arrays, (3) estimation of Weibull parameters for simulated force results of indicator springs, (4) experimental force determination for both indicator springs and micro-switches, (5) experimental force results for micro-switches, (6) estimation of Weibull parameters for simulated force results of micro-switches, (7) experimental force results for indicator springs, (8) estimation of Weibull parameters for experimental force results of indicator springs, (9) comparison of simulated and experimental force distributions for indicator spring and (10) reliability assessment for the operation of the fuse.
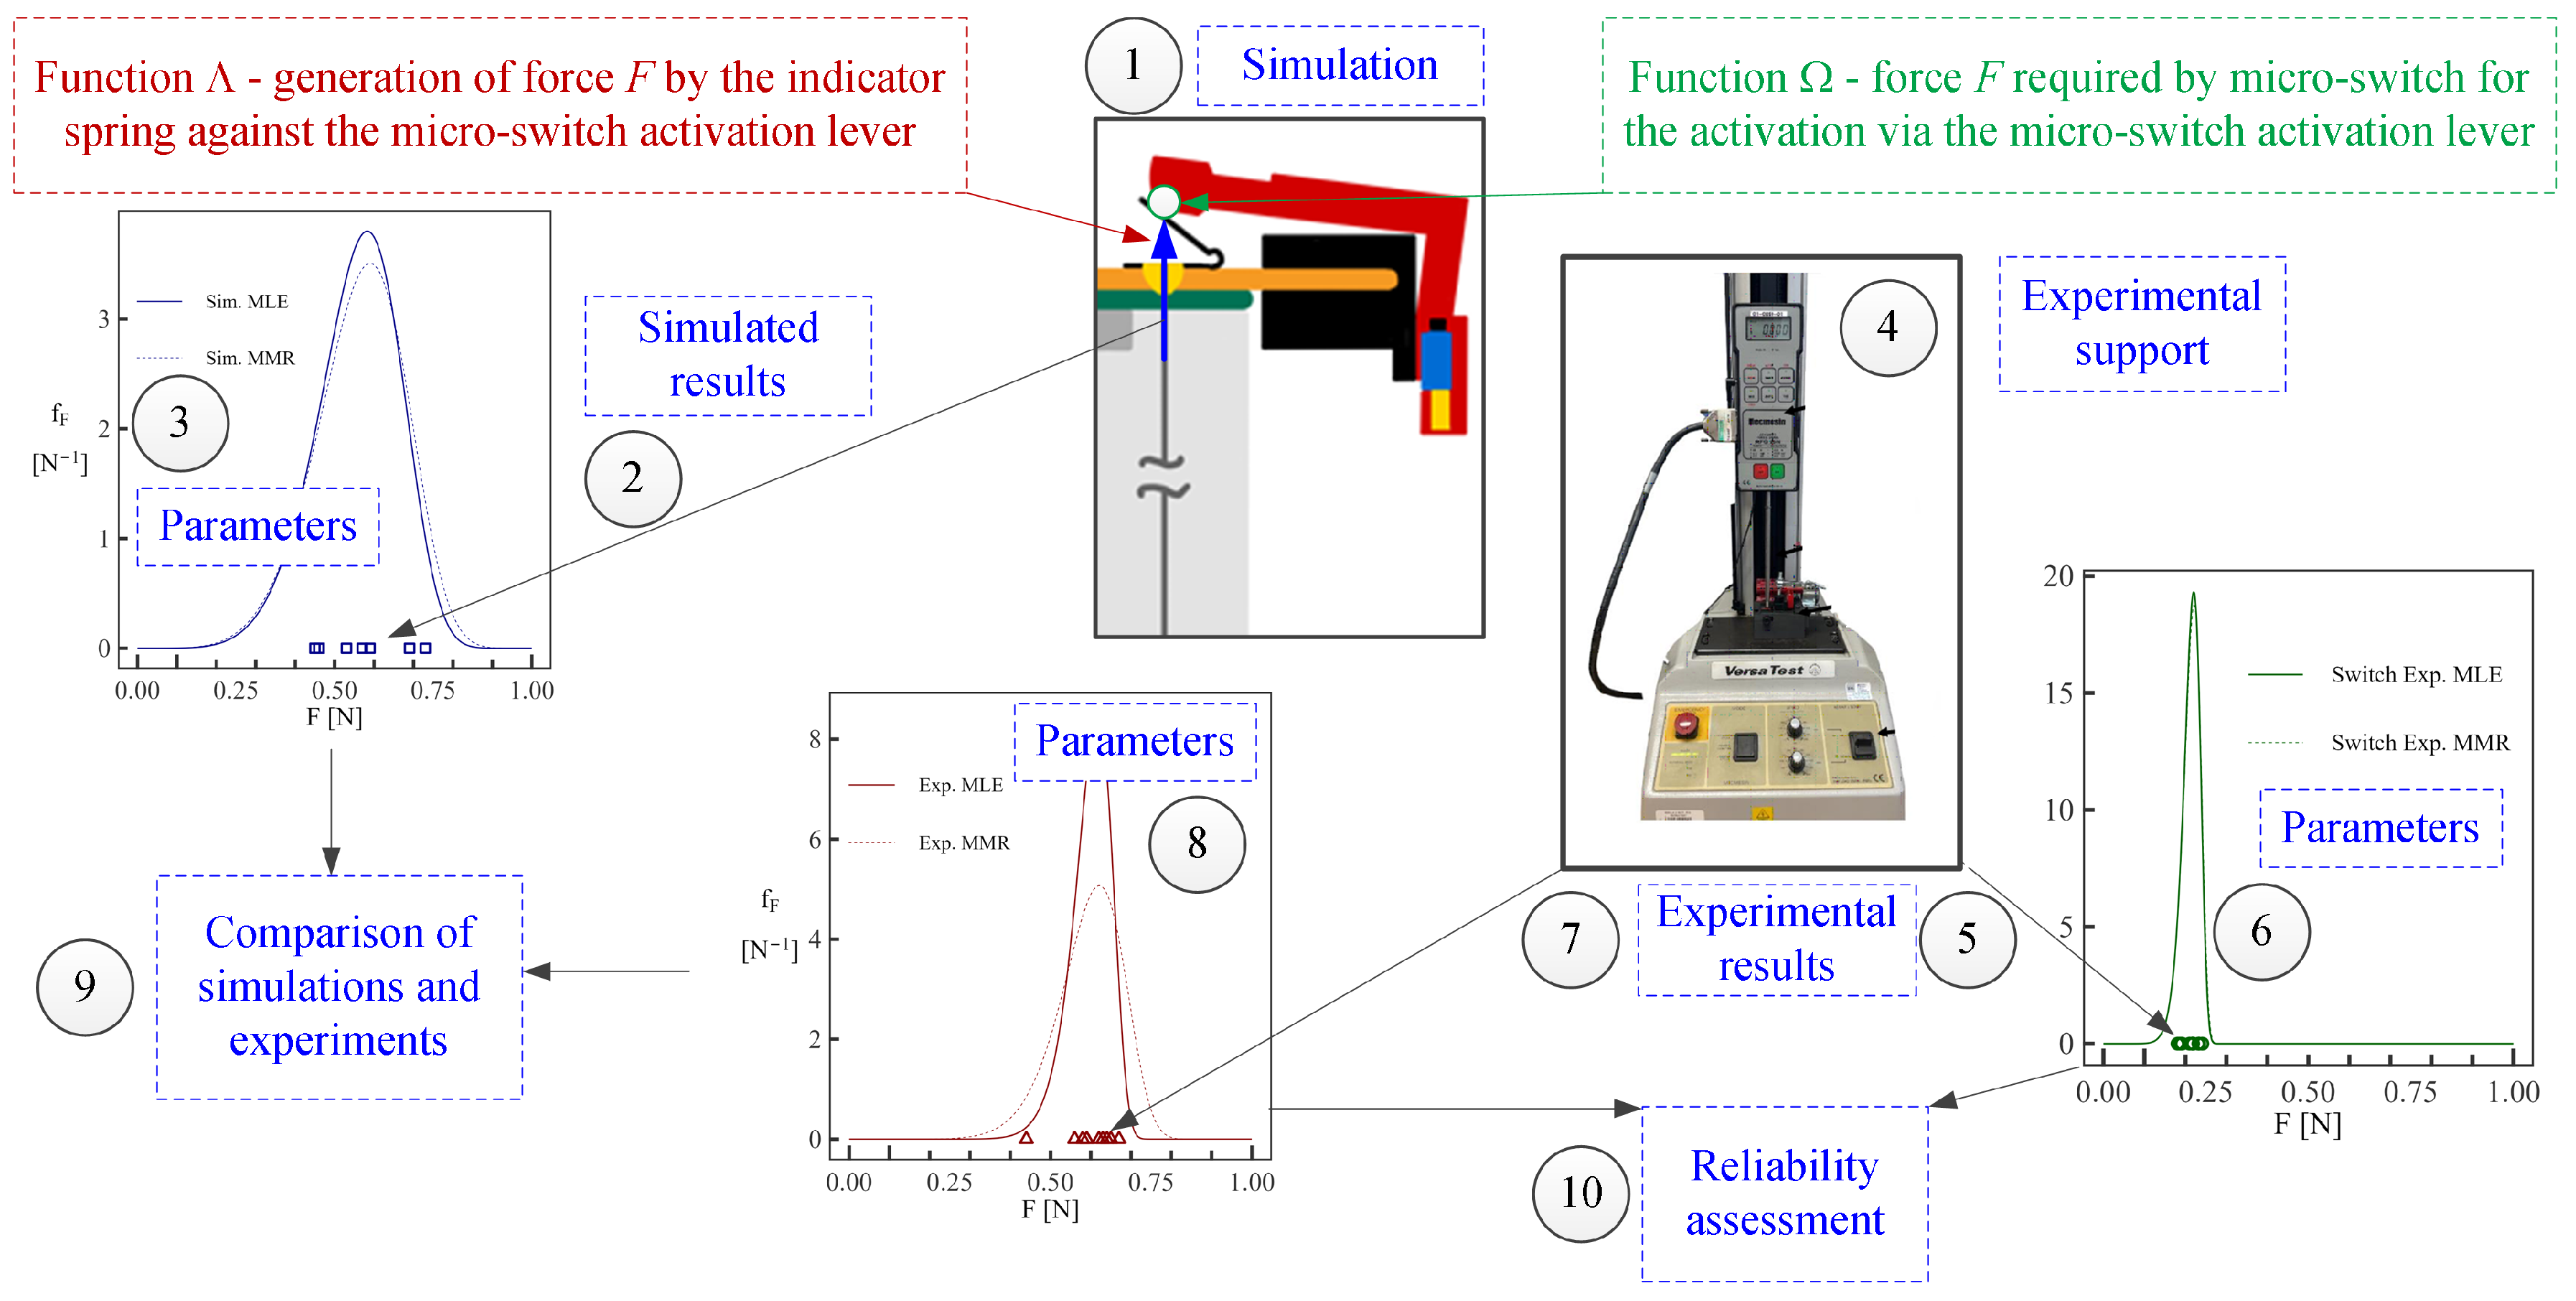
Table 1.
Orthogonal array according to Taguchi methodology [45] chosen for simulations of indicator spring with 7 influencing factors.
2.3. Design of Simulations
After identification of the influential factors, an orthogonal array according to Taguchi methodology [45] has been chosen to estimate the scatter of the output function of the mechanical component where x, y and z stand for the number of simulations, the number of factor levels and the number of influential factors, respectively. The simulation setups during this study are given in Table 1. The factor levels have been chosen with the limiting values of the prescribed scatter for individual factors as given in Section 2.2. Although multilevel influential factors provide a better insight into the behaviour of mechanical components under scrutiny and also allow for a higher confidence into influence of factors and their combinations [46], the intention of the present study was the introduction of the reliability assessment to electro-mechanical components with the simplest two-level design of simulations.
2.4. Experimental Support
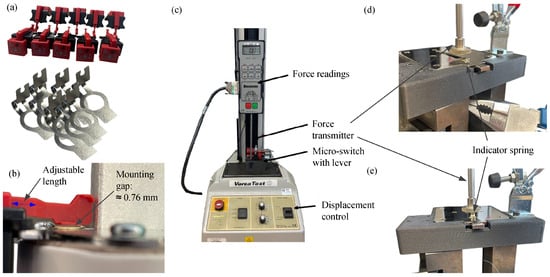
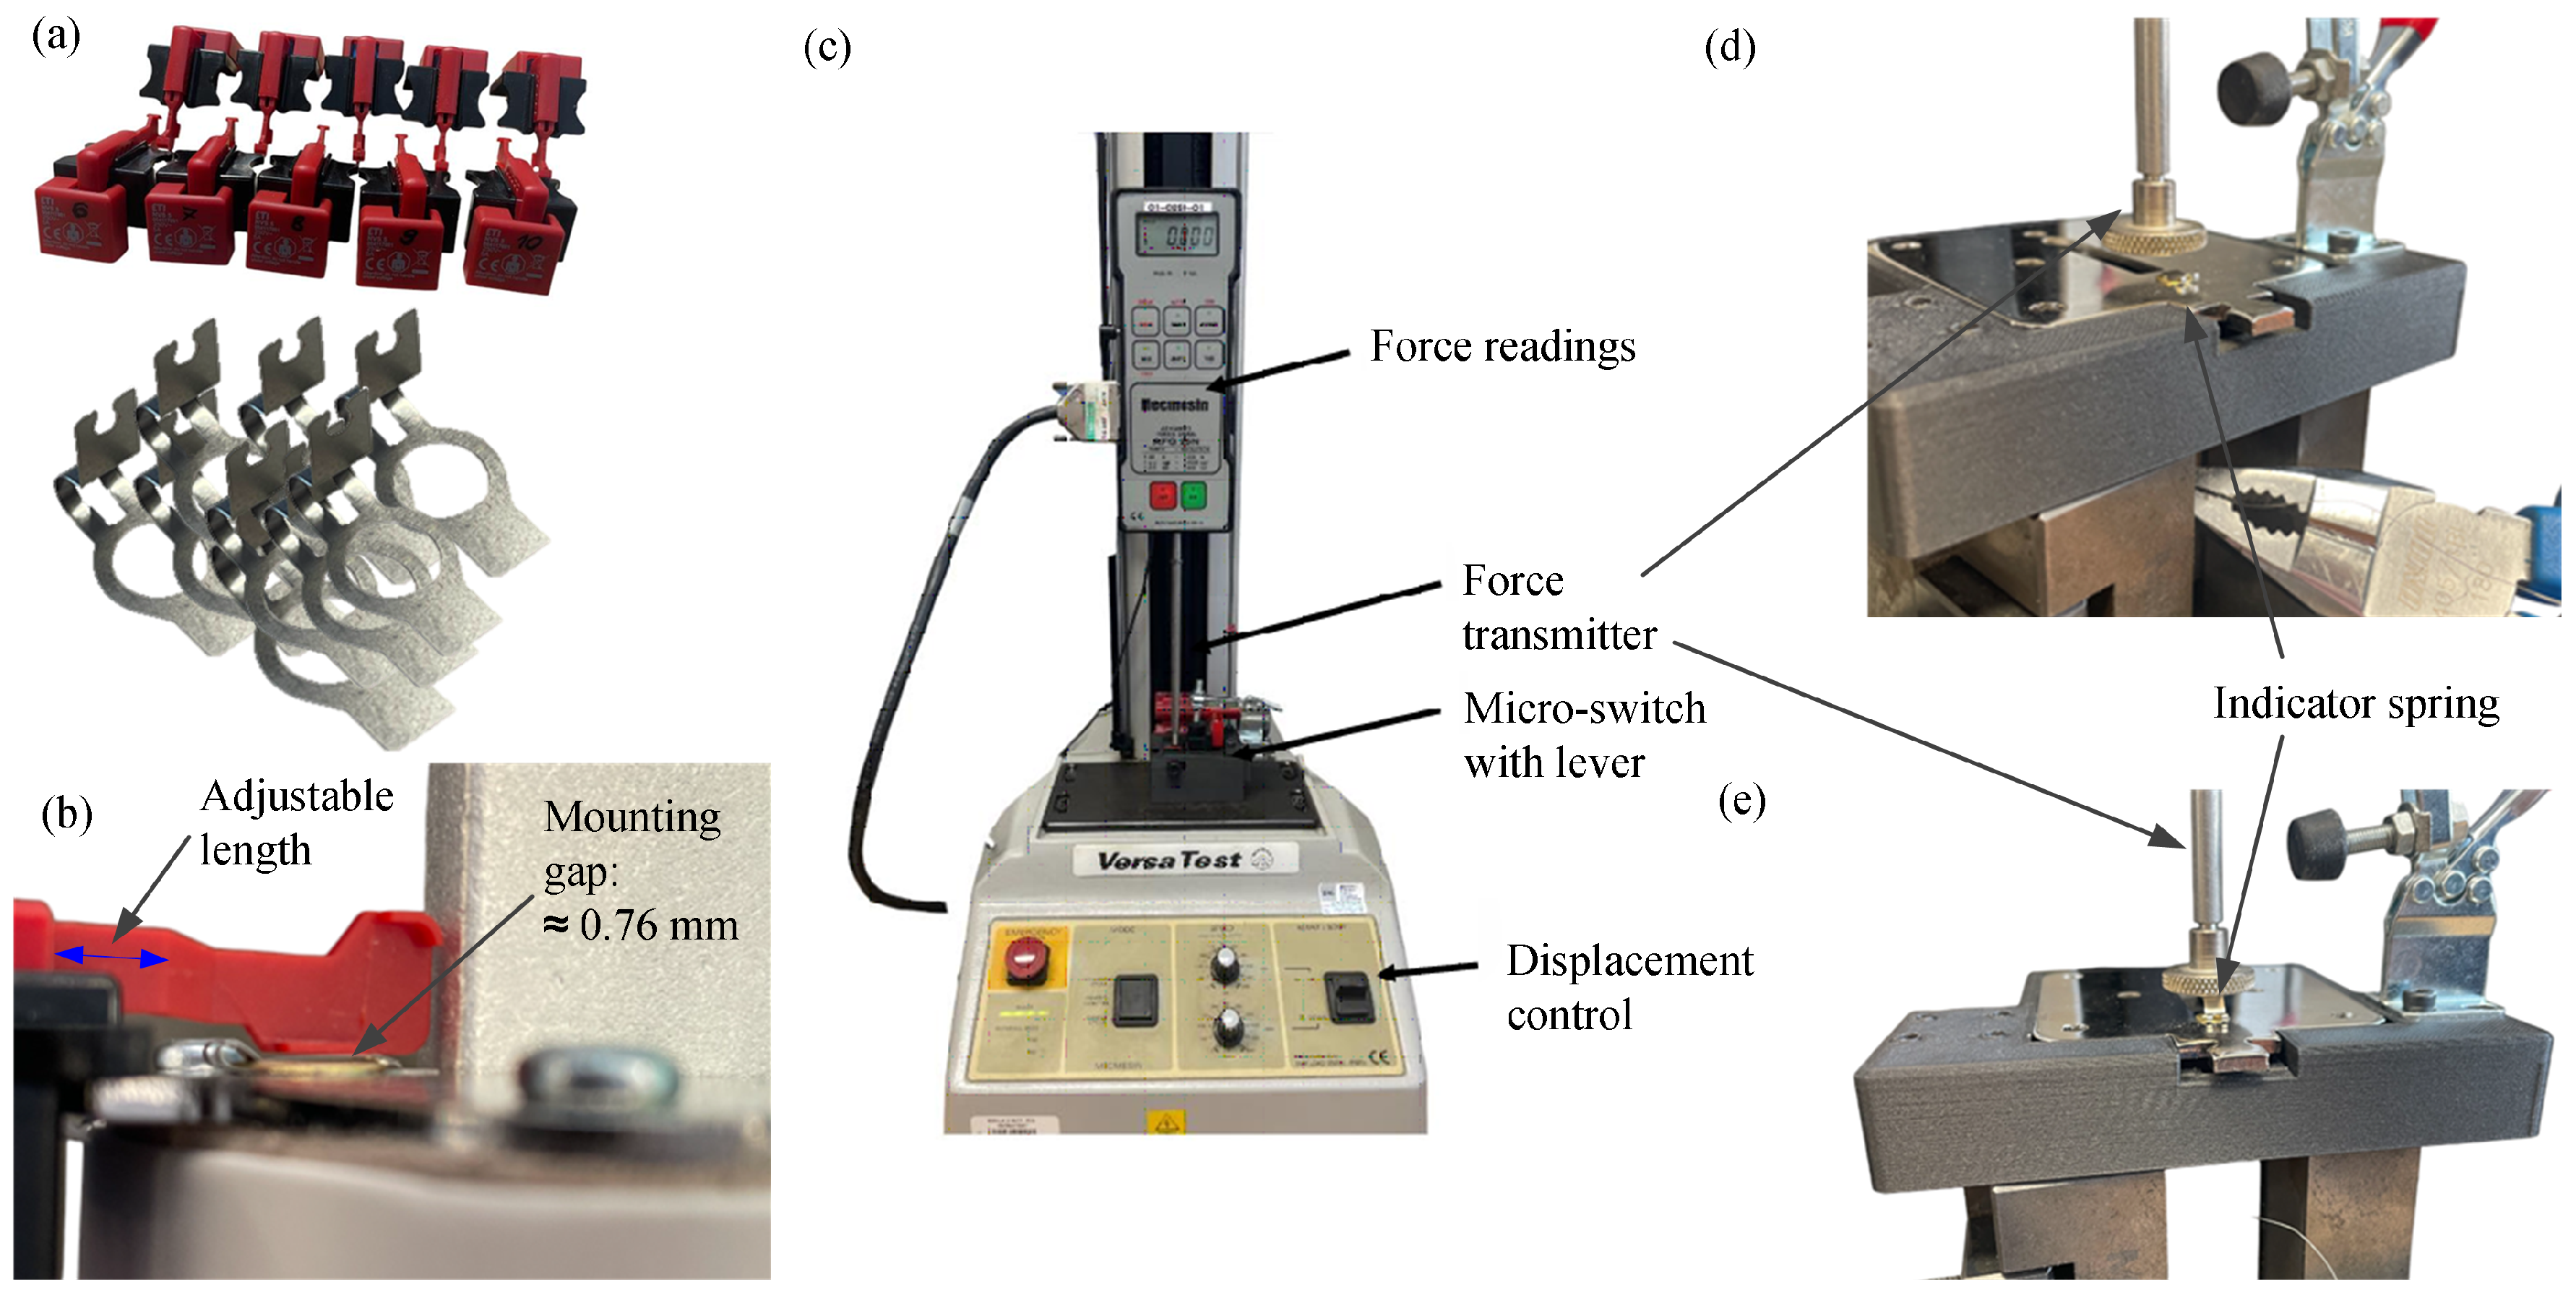
Apart from the tensile testing of X12 CrNi 17-7 steel sheet metal and geometry measurements prior to simulations to estimate the scatter of material, form and operating conditions as given in Section 2.2, two experiments (given in Figure 5) have been designed to measure both the force needed to activate the micro-switch and the force produced by the indicator spring at predefined displacements, respectively. Ten micro-switches and ten indicator springs (Figure 5a) have been randomly chosen and placed onto bespoke mountings which enabled the same positioning as on the fuse assembly (Figure 5b–d). Force-measuring equipment Mecmesin VersaTest with Advanced Force Gauge (AFG) of nominal 25 N and accuracy of of full scale has been used to measure the forces during the displacement-controlled loading of either the micro-switches or indicator springs, respectively (Figure 5c and Figure 5e).
Figure 5.
Experimental setup: (a) micro-switches with activation levers and indicator springs, (b) typical assembly with typical mounting gap, (c) force-measuring equipment, (d) mounting of indicator springs and (e) measurement of force during the activation of the spring.
The typical design of the fuse requires mm of displacement of the indicator spring before the initial contact with the activation lever of the micro-switch is established (Figure 5b) and between and mm of displacement before the micro-switch changes from “off” to “on” position. The latter displacement value varies due to the slightly adjustable length of the activation lever between position 1 being the shortest lever and position 3 being the longest lever (Figure 5b). Consequently, the force required to activate the micro-switch with the length of the activation lever in position 1 will be higher than that in position 3. The same circumstances were thus carried out during the experiments. The activation forces of the micro-switches and indicator springs were measured at displacements and mm, respectively. Moreover, the measurements of forces were repeated three times for every micro-switch in every position of the activation lever whilst only one set of measurements of forces was performed per indicator spring. The reason for that was the fact that the material of the indicator spring exceeds the yield stress of the material during assembly and hence the spring does not return into the pre-assembly position after the operation of the fuse.
3. Results
Initially, it can be observed that the absolute values of the forces are small (within a few N) as the analysed assembly is small in size (Figure 3a). Nevertheless, the mechanical stresses that are generated in the indicator spring are high, reaching beyond the yield stress of the material especially during the assembly stage (Figure 3c). The stresses are then decreasing with increasing displacement of the spring as can be seen in Figure 3d–f, but still keep at considerably high values.
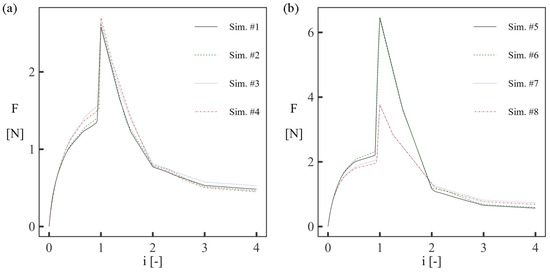
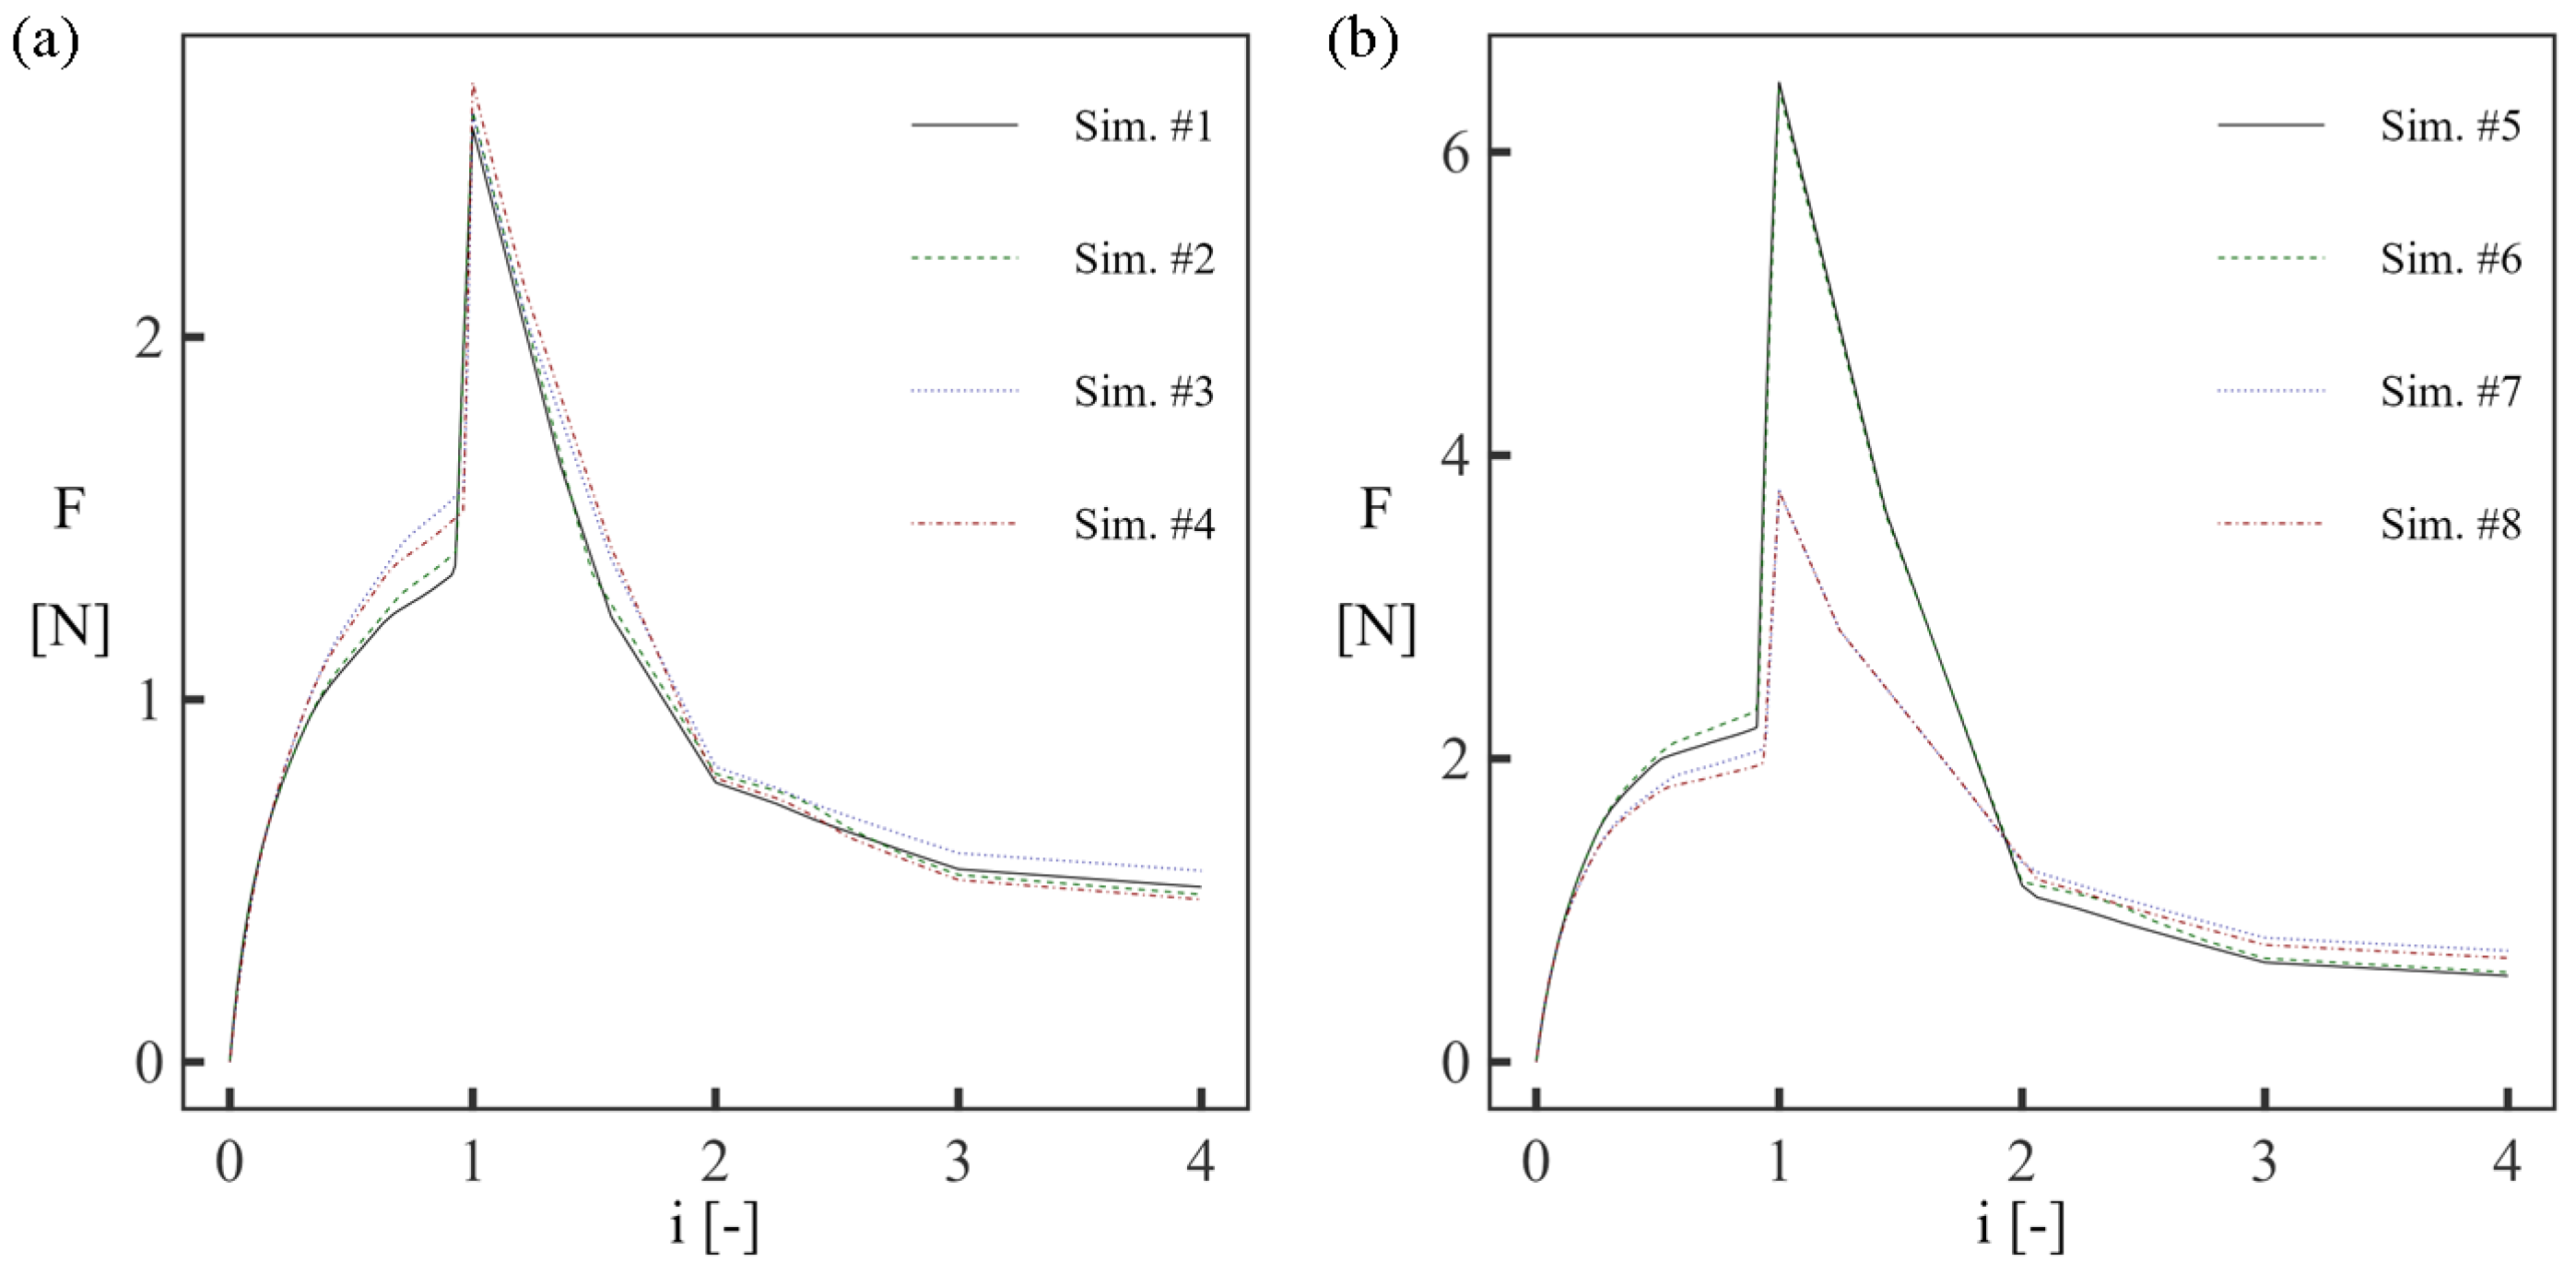
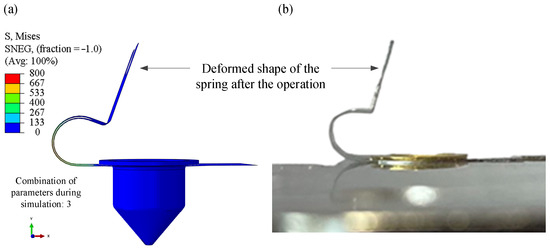
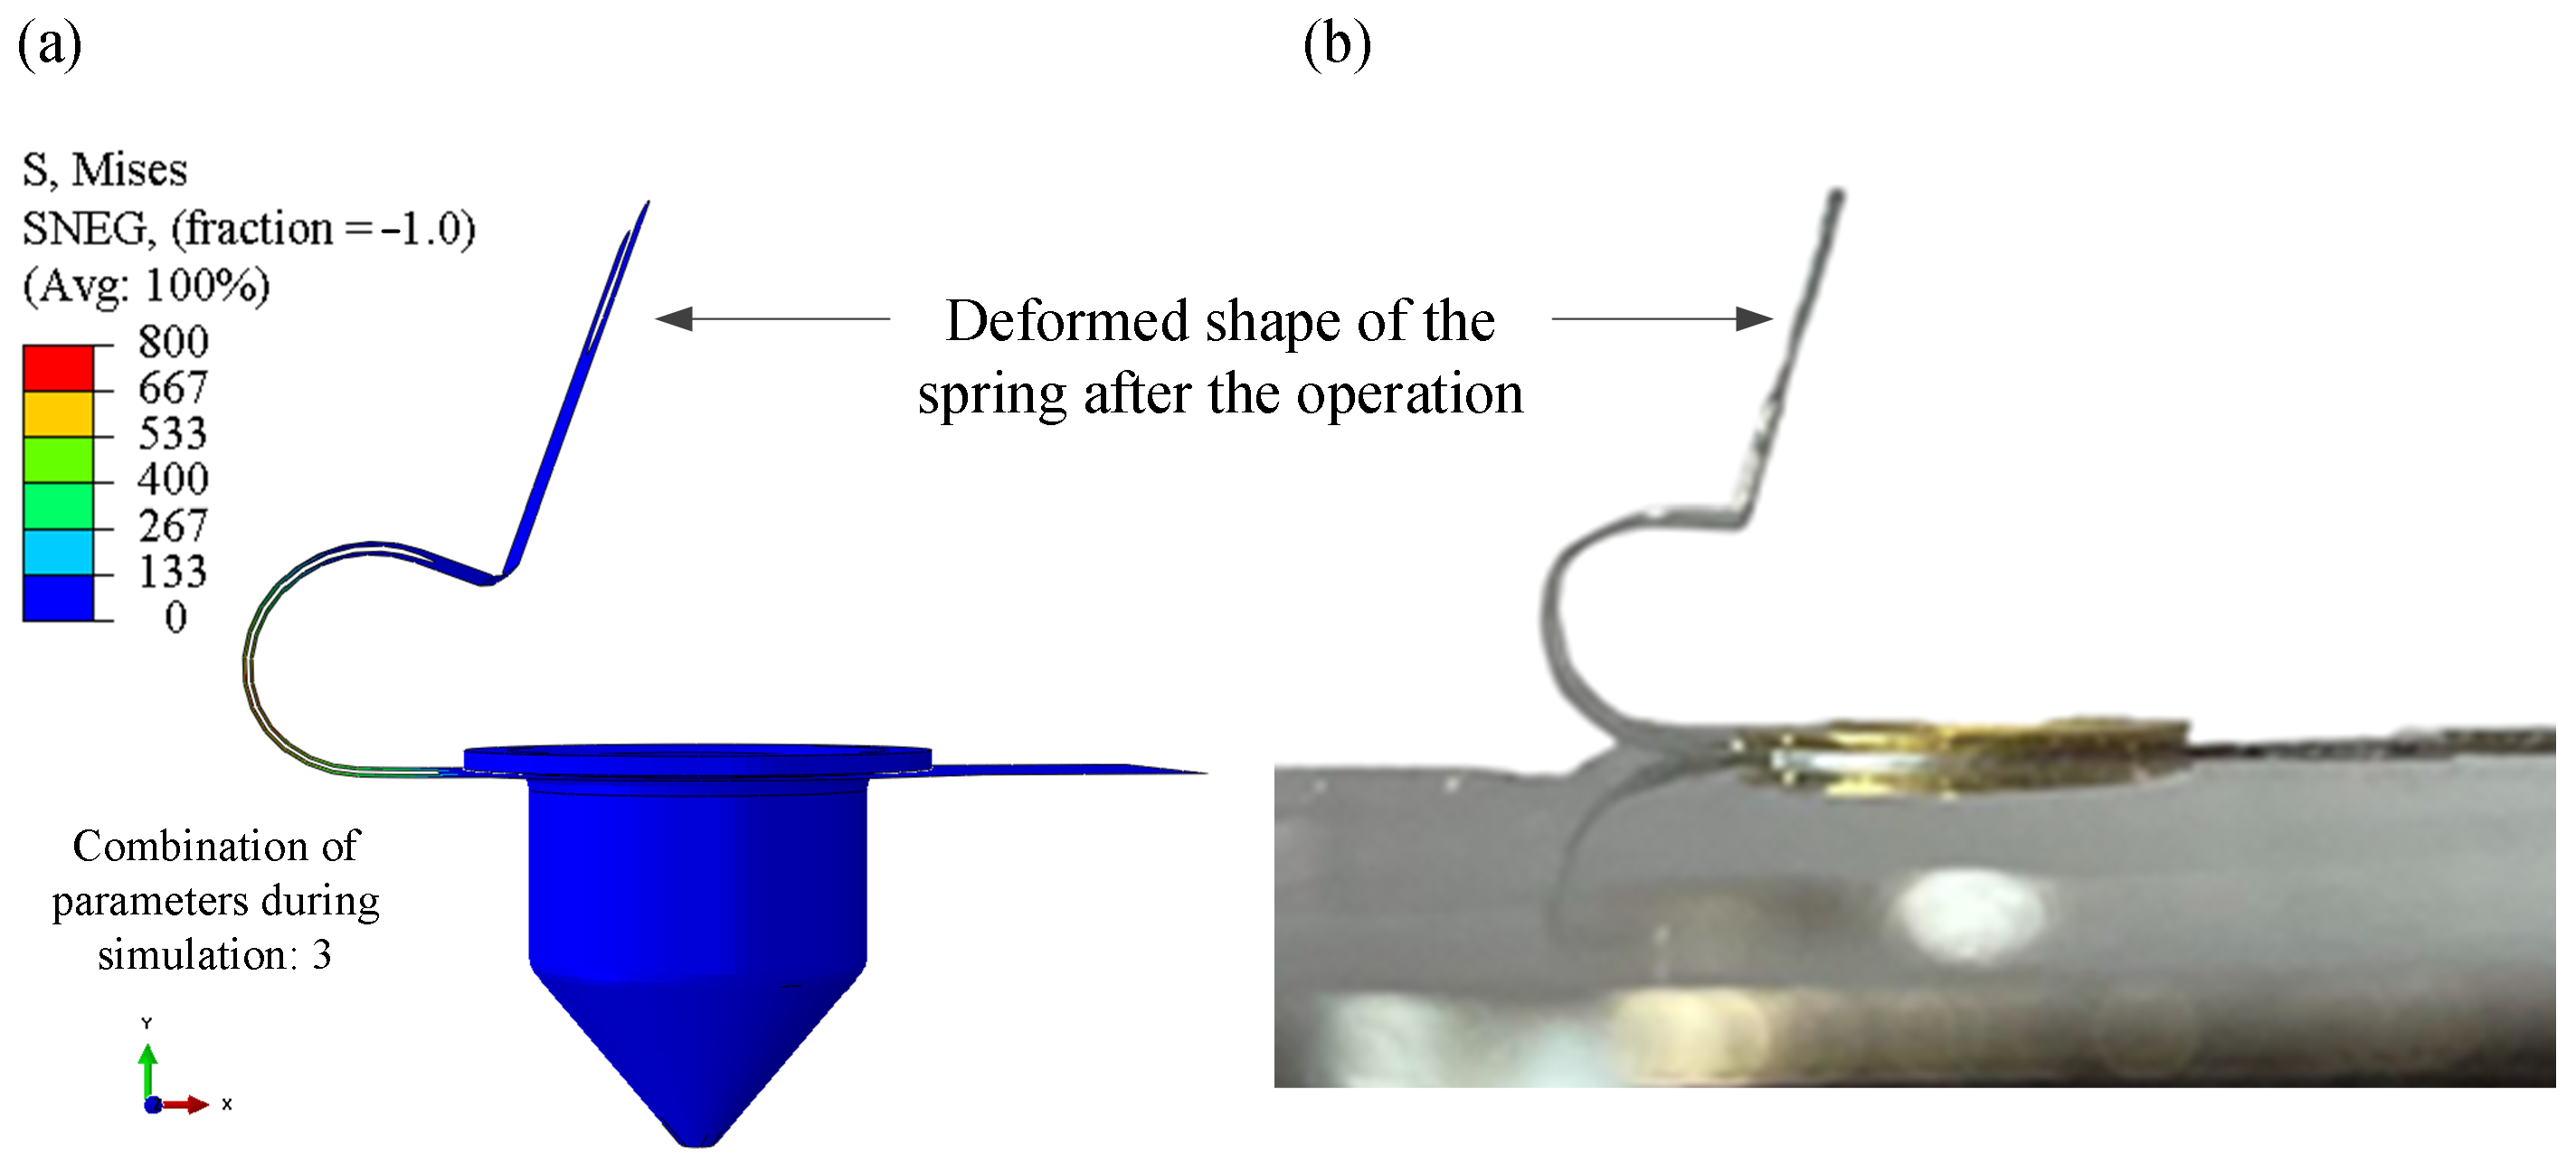
Furthermore, if the results of the simulations are presented as the output force of the indicator spring during the stages of assembly and operation (Figure 6), it can be noticed in general that the pre-assembly stage in step 0 (positioning of the activation wire) does not require any mechanical force whilst the highest force is required during the assembly stage (step 1). The force generated by the indicator spring then drops after the operation of the fuse with increasing displacement between steps 1 and 4. The indicator spring does not return into the pre-assembly position which can be clearly seen by comparison of the simulated response and the experiment in Figure 7. The differences between the force signals due to the scatter of material properties, form and boundary conditions are discussed in Section 4.
Figure 6.
Simulated force during mounting and operation of indicator springs: (a) simulations #1–#4 and (b) simulations #5–#8. Different scales on y-axes have been used to emphasize the differences between the simulations.
Figure 7.
Shape comparison of indicator springs after the end of operation: (a) stress results for simulation #1 from Table 1 and (b) physical specimen.
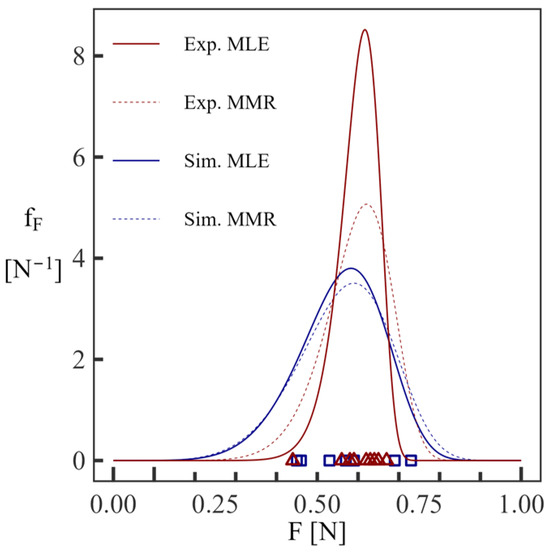
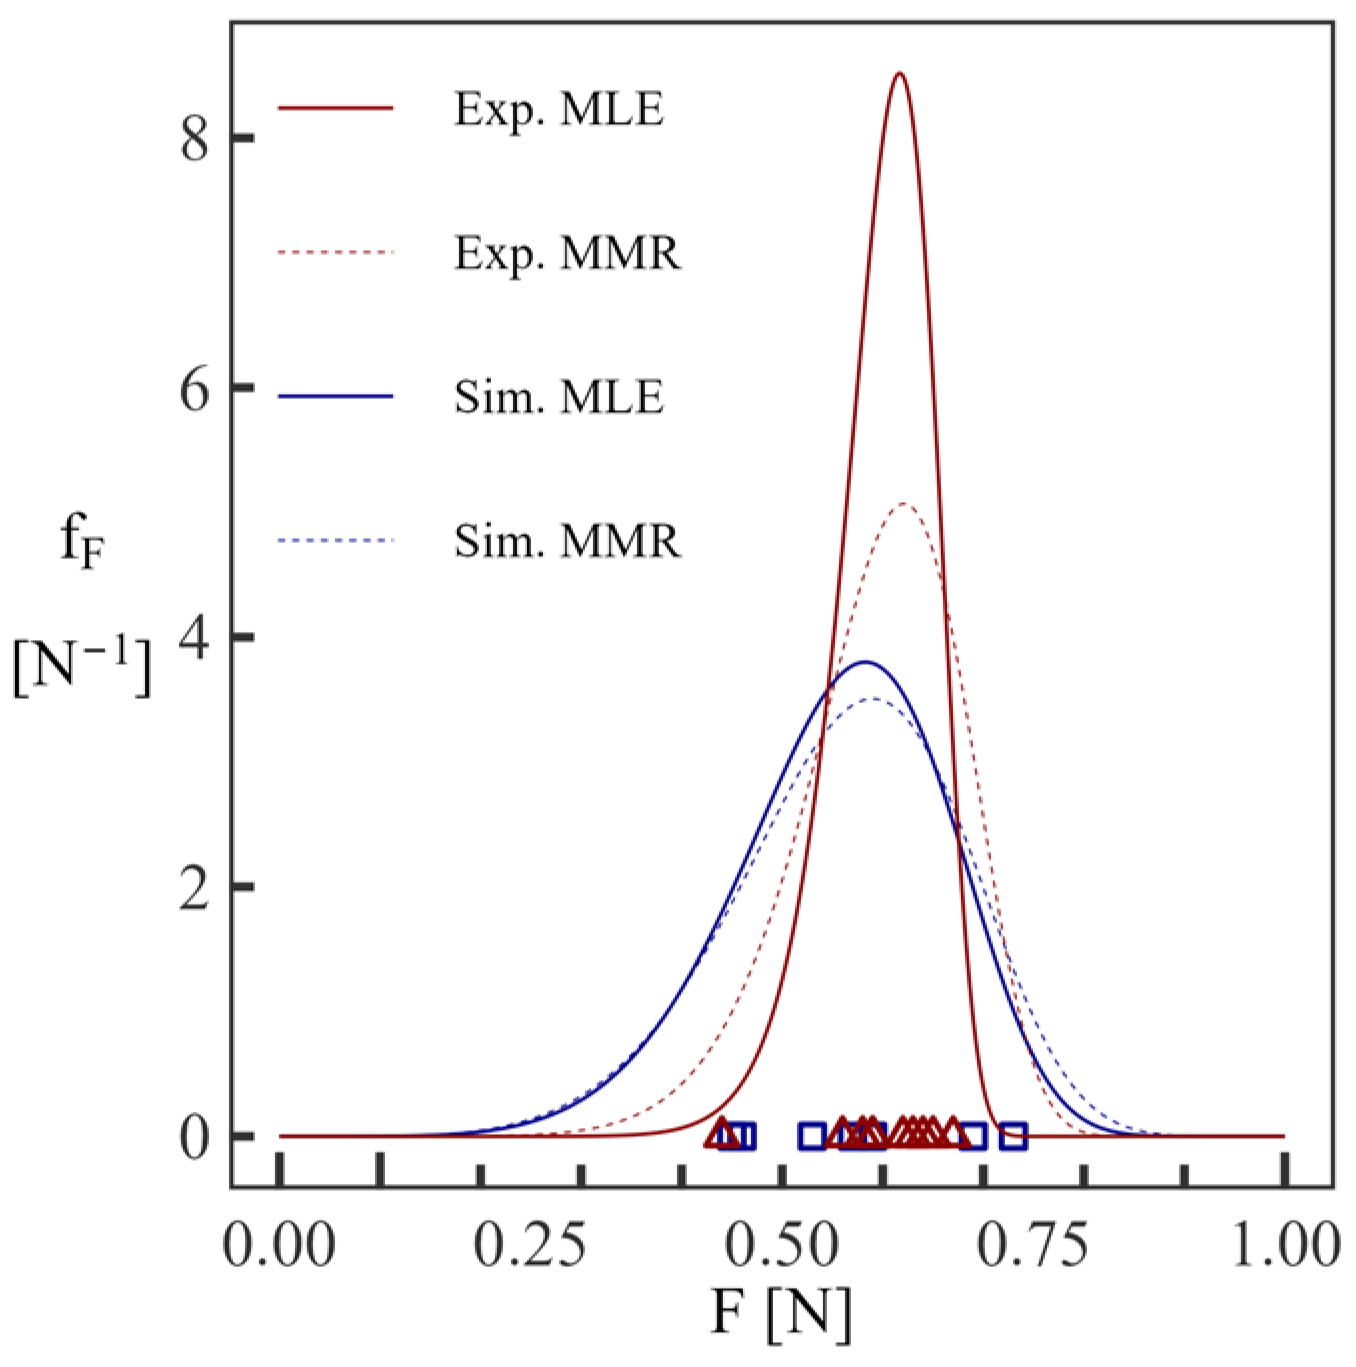
The comparison of distribution of forces generated by the indicator spring reveals that the Weibull scale parameters can be reliably simulated whilst a higher difference is observed for the Weibull shape parameters (Table 2 and Table 3, and Figure 8). A considerable difference is also observed for the Weibull shape parameters between the methods used to determine their values. For both the simulation of the indicator spring force and the experimental measurement, lower values of the shape parameter have been calculated using the MMR method. The result is thus a wider shape of the distribution curve around the same scale parameter.
Table 2.
Determination of Weibull shape parameter for indicator spring and micro-switch at three activation lever positions.
Table 3.
Determination of Weibull scale parameter for indicator spring and micro-switch at three activation lever positions.
Figure 8.
Distribution of indicator spring forces based on simulations and experiments. Squares and triangles represent simulated and experimental data points, respectively.
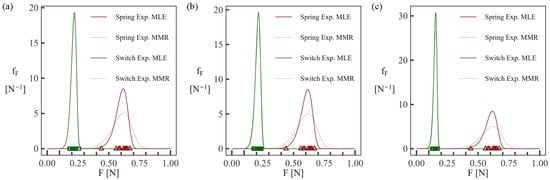
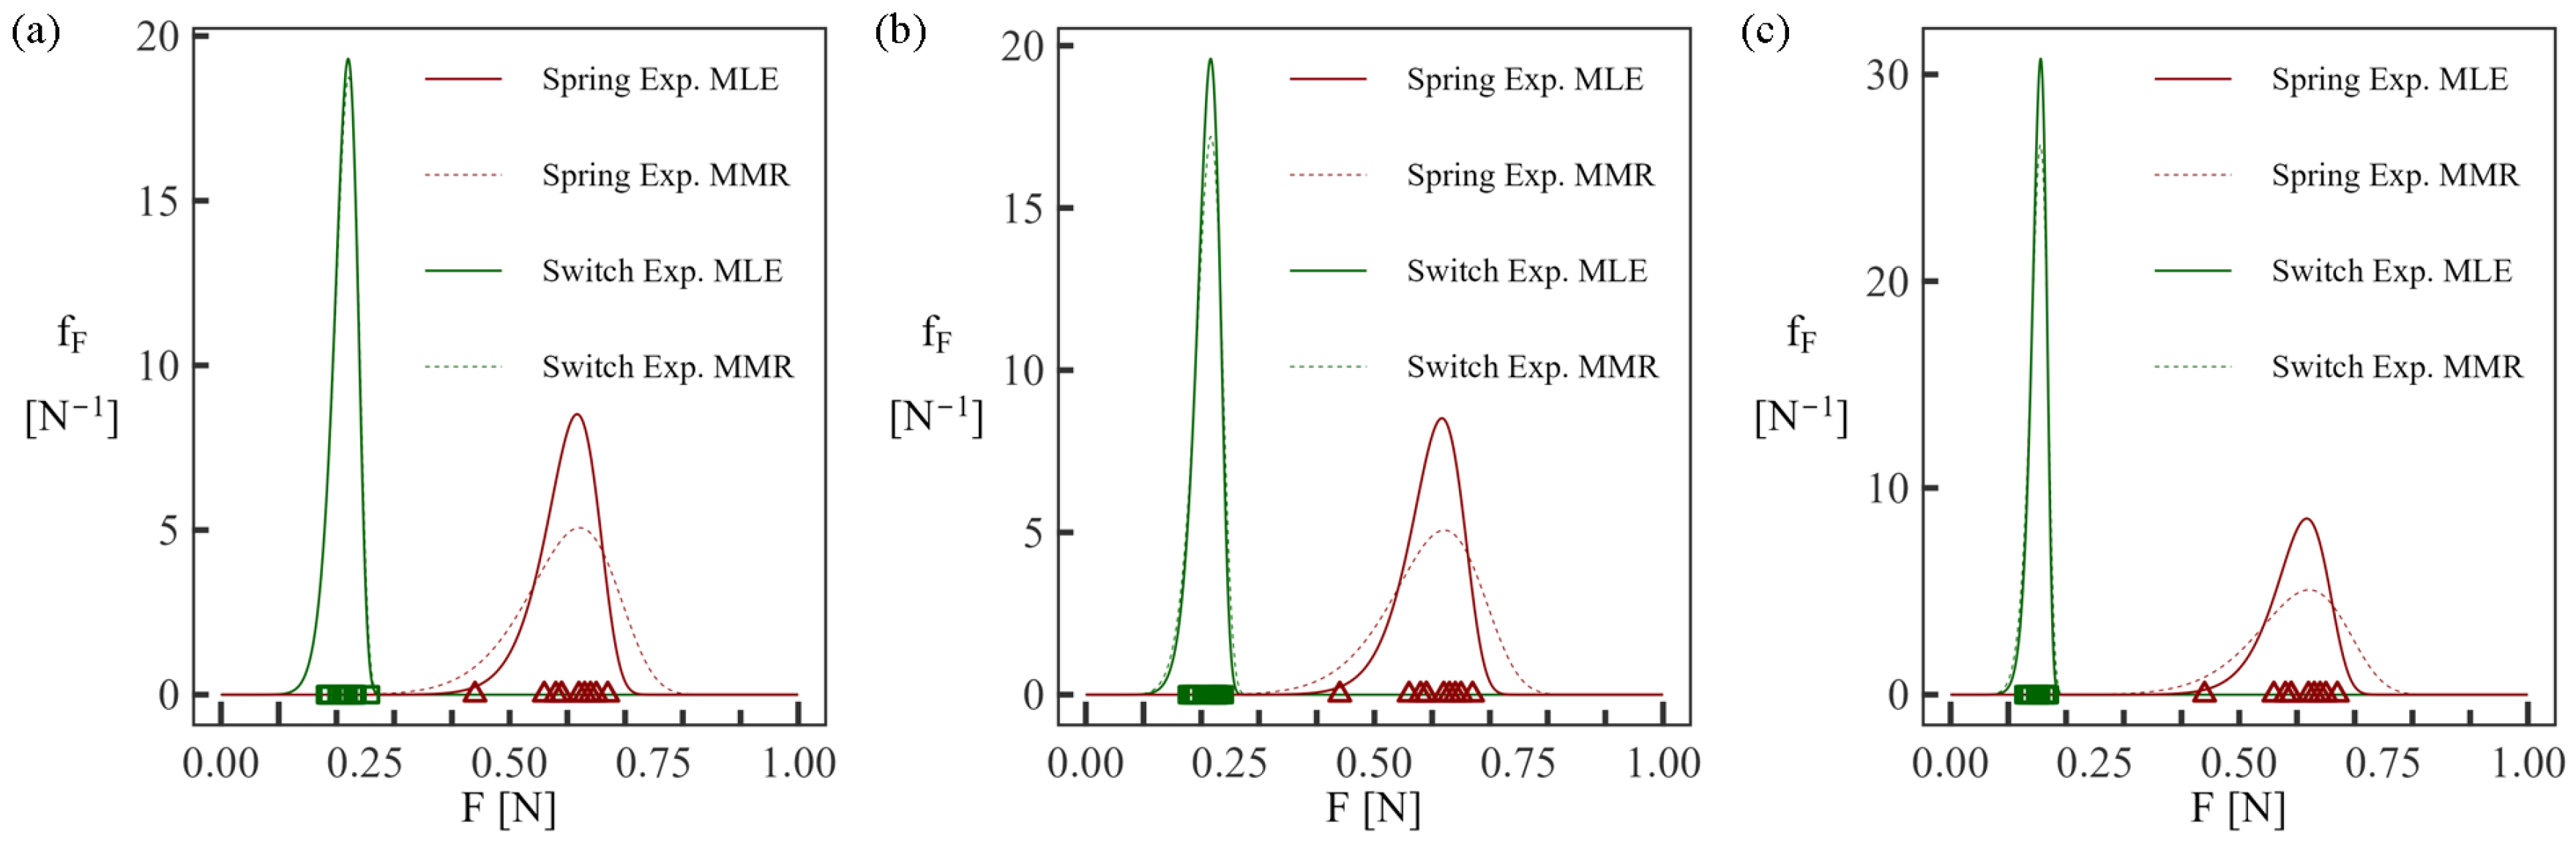
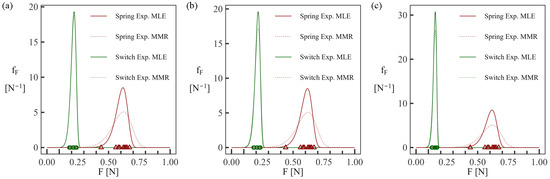
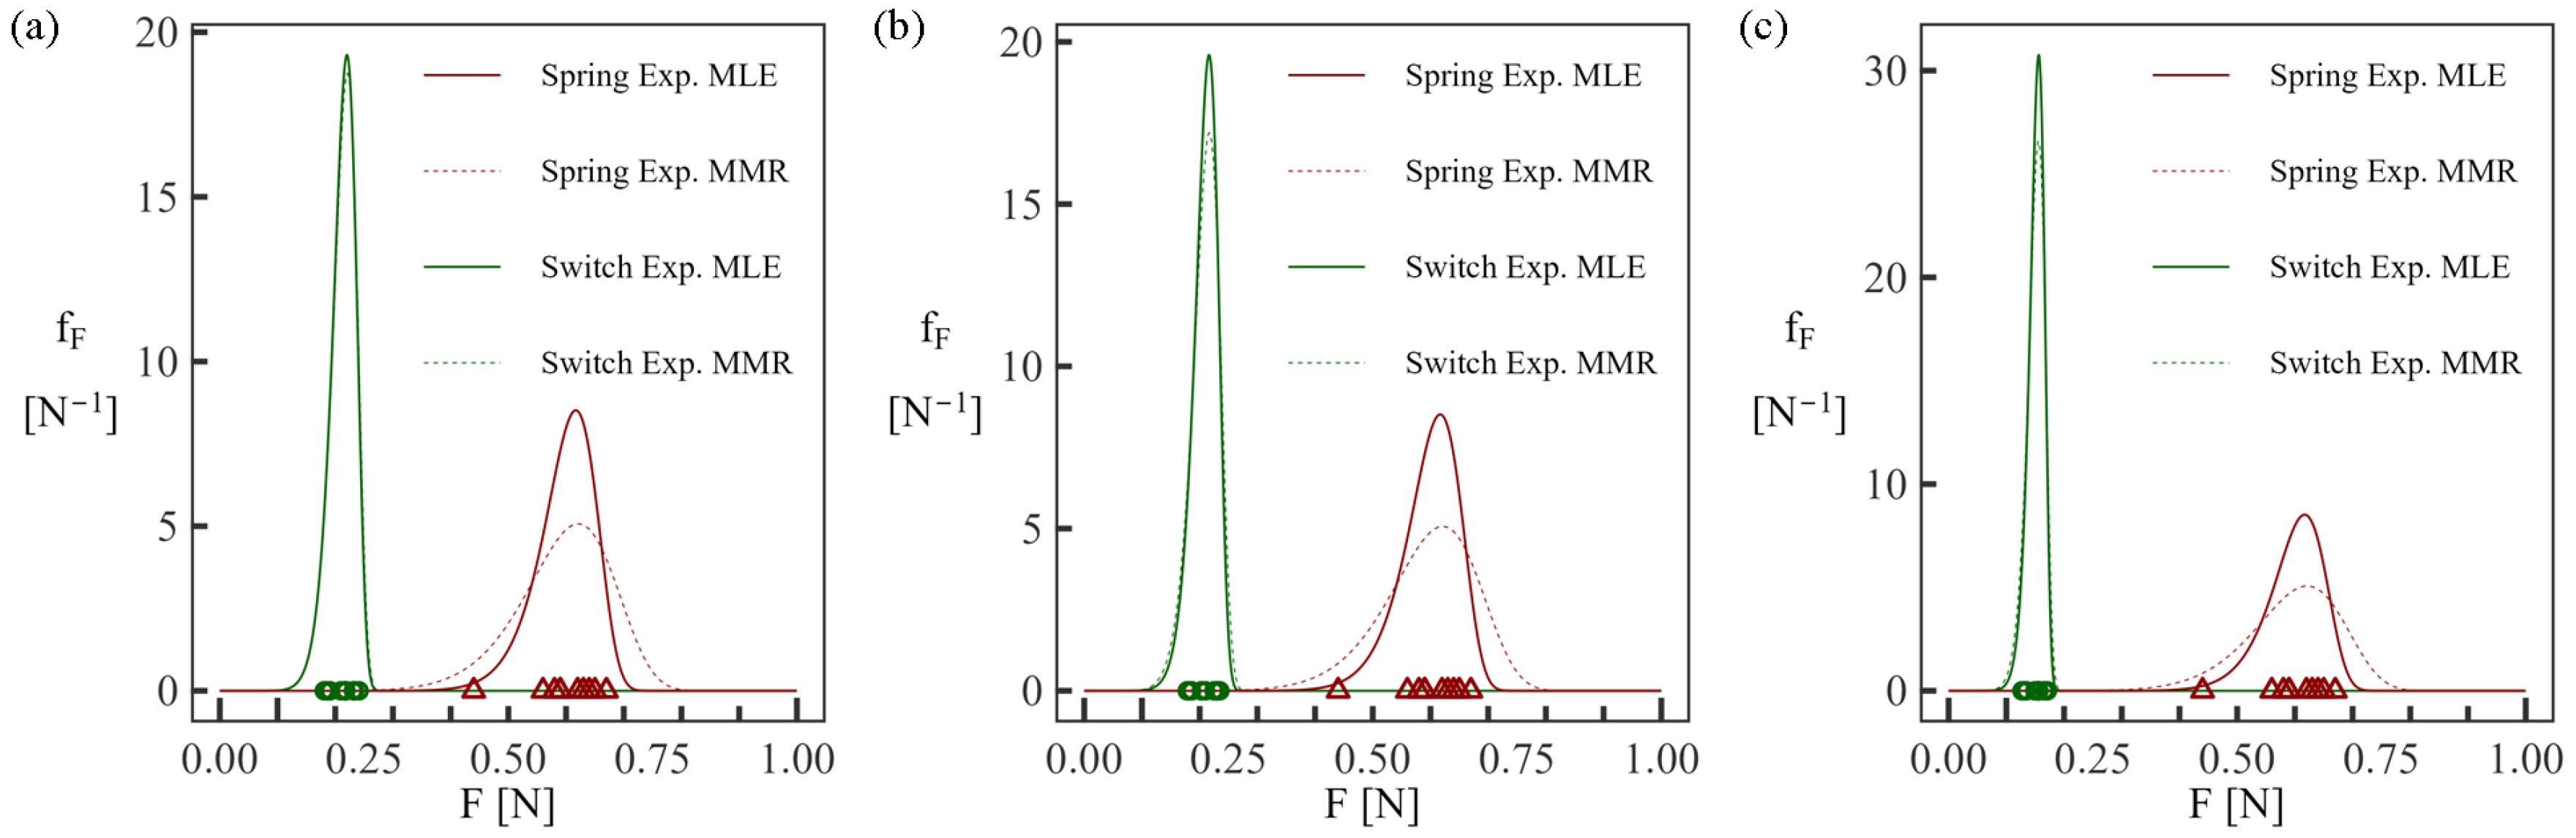
In general, if the activation force of the micro-switch at step 4 is exceeded by the generated force of the indicator spring, a successful indication of the fuse operation can be assumed. However, typical activation forces depend on the length of the micro-switch levers as reported previously [47]. If scattered micro-switch activation forces and a constant indicator spring force are then considered in the assessment of reliability, a very high (and potentially overestimated) reliability can be predicted for the indication of the fuse operation as reported in [48]. However, a constant indicator spring force is not a realistic scenario as the scatter is intrinsically introduced due to the influence of form, material and operation as shown in this study (Section 2). Hence if the scatter of both quantities (force generated by the indicator spring and activation force of the micro-switch) is considered, the reliability of the indication of fuse operation drops as compared to the previous scenario. Nevertheless, a high absolute value of reliability can still be expected based on the positions of force distributions as given in Figure 9 and Figure 10. Specifically, reliability of the indication of fuse operation can be calculated with respect to the observed indicator spring force at step 4 for any of the positions of the micro-switch activation lever according to Equation (6) with the activation of the micro-switch and the operation of indicator spring denoted by and , respectively. Results of the calculation are given in Table 4 where two-parameter Weibull distributions have been considered for both the micro-switch and the indicator spring with experimentally determined values of the parameters using the MLE method for all data as given in Table 2 and Table 3.
Figure 9.
Distribution of switch and spring forces considering individual micro-switch results (a) in micro-switch position 1, (b) in micro-switch position 2 and (c) in micro-switch position 3. Squares and triangles represent experimental data points for the switch and spring forces, respectively.
Figure 10.
Distribution of switch and spring forces considering averaged micro-switch results (a) in micro-switch position 1, (b) in micro-switch position 2 and (c) in micro-switch position 3. Circles and triangles represent experimental data points for the switch and spring forces, respectively.
Table 4.
Reliability of the indication of fuse operation based on Weibull distribution determined using MLE method for all data.
4. Discussion
The highest force peak (up to 6 N) as shown in Figure 6b appears just before the end of the assembly stage when the indicator spring is flattened onto the guide cap. The initial position of the indicator spring h in combination with the thickness of the sheet metal seems to play the biggest role for the size of this force due to the plastic deformation of the indicator spring (Figure 3 and Figure 6). Namely, the pre-assembly step causes plastic deformation of the curved geometry of the indicator spring which consequently raises the stresses beyond the yield limit of the X12 CrNi 17-7 steel sheet metal (Figure 3c). As it is shown in Figure 6b, only a slight reduction of the initial position, which is controlled by the variable h in simulations, can reduce the maximum force that the indicator spring is able to generate. This is most obviously expressed by the sizes of the force peaks in Figure 6. Other variables, e.g., material properties and , coefficients of friction and and attachment position of the activation wire d cause a similar effect to the force generation of the indicator spring but to a considerably lower extent as pointed out in Figure 6a.
Performing simulations at various boundary conditions within the expected limits and according to a plan of e.g., Taguchi orthogonal arrays can offer an opportunity to consider reliability estimations of mechanical components during early stages of the product development. Comparable values for the estimated Weibull scale parameter have been determined with either simulations or experiments. However, a higher discrepancy has been observed for the shape parameter as the expected limits of the factors can be easily exceeded in simulations. Consequently, a lower value of the shape parameter is therefore gained by the simulations which results in a broader scatter of the generated force as compared to the experimental observations (Figure 8). Specifically, Taguchi orthogonal arrays considered limit values of the factors in simulations whilst the experimental observations did not occur in the limit states. As a result, the scatter of simulated values is higher than the scatter of experimental values. Furthermore, as less data were generated for the spring force from the simulations, a lower and more comparable value of the Weibull shape parameter has been observed between the MMR and MLE methods. The difference increased for the evaluation of the same parameter considering a bigger set of experimental measurements both for the indicator spring and the micro-switch. The value of parameter especially differs for the experimental data of the indicator spring between the methods as one of the results differs from the others more than in the simulation result set (Figure 8). The latter result complies with the observations of a previous study on the comparison of the MMR and MLE methods for bigger data sets [39]. For the determination of the Weibull shape parameter from either individual consideration of the micro-switch measurements or the averaged switch results, minimal variations have been determined for each of the activation lever positions (Table 2 and Table 3). The reason for this results is a narrow scatter of micro-switch activation force measurements which is exhibited in Figure 9 and Figure 10.
Comparison of calculated reliability results in Table 4 reveals that the position of the activation lever of the micro-switch plays a crucial role for the successful indication of the electric fuse operation under the given form, material and manufacturing procedure (assembly stage) of the indicator spring. Although the calculated reliability is high for any of the positions, position 3 ensures that potentially only 1 in 662 million could be faulty to perform its required function. Nevertheless, the tail behaviour of the Weibull distribution is known to be highly sensitive to the shape parameter . Considering a small number of experimental data in this study, the uncertainty of its value is non-negligible, and extrapolated tail probabilities should thus be interpreted with caution. The values reported in Table 4 are therefore intended as comparative estimates rather than statistically certifiable absolute failure probabilities. Other assemblies (different types of micro-switches or indicator springs) and their reliability could be evaluated following the same methodology.
5. Conclusions
A methodology has been proposed that enables reliability-based structural design of mechanical systems. It has been shown that finite element simulations with approximately estimated form, material and operational conditions of mechanical components in the assembly can be joined with orthogonal arrays to carry out the base for the reliability estimation. If the output function of the mechanical system is described by a two-parameter Weibull function, the scale parameter of the distribution is comparable to the experimental observations whilst experimentally observed scatter tends to be overestimated by the simulations. The value of the shape parameter in this study has been underestimated by the simulations as it depended on the limit values of the influential factors in the simulations.
The sensitivity study has been demonstrated on the indication assembly of an electric fuse comprising a guide cap, an indicator spring and an activation lever of the indication micro-switch. A good match between the simulated and experimentally observed spring force has been observed. Maximum likelihood estimation method provided suitable parameter values for the representation of the force distribution with Weibull distribution for the observed experimental values of both the indicator spring and the micro-switch activation. The assembly stage of the indicator spring turned out to be decisive in the determination of the force at the time of fuse operation. A high reliability of the indication has been calculated which considered both the scatter of the indicator spring and the micro-switch activation forces.
The shape of the indicator spring in the present study did not vary although other geometric details apart from the sheet metal thickness could be varied. A simple two-level design of simulations was employed although a multilevel factorial design would certainly provide additional insight into the behaviour of the assembly. These research topics remain open for future investigations.
Author Contributions
Conceptualization, D.Š., L.N., M.N. and J.K.; methodology, D.Š., M.N. and J.K.; experiment, L.N.; validation, D.Š., L.N., M.N. and J.K.; formal analysis, D.Š. and L.N.; investigation, D.Š. and L.N.; resources, D.Š., L.N., M.N. and J.K.; data curation, D.Š. and L.N.; writing—original draft preparation, D.Š.; writing—review and editing, D.Š., L.N., M.N. and J.K.; visualization, D.Š. and L.N.; supervision, D.Š.; project administration, D.Š.; funding acquisition, L.N., M.N. and J.K. All authors agree to be accountable for all aspects of the work in ensuring that questions related to the accuracy or integrity of any part of the work are appropriately investigated and resolved. All authors have read and agreed to the published version of the manuscript.
Funding
Eti Elektroelement d.o.o. financially supported the experimental part of the research. The authors also acknowledge financial support from the Slovenian Research and Innovation Agency (research core funding no. P2-0182 entitled Development Evaluation). The supporting sources had no involvement in the research.
Data Availability Statement
The data can be made available on request.
Conflicts of Interest
Authors Domen Šeruga, Marko Nagode and Jernej Klemenc declare no conflicts of interest. Author Lovro Novak was employed by the company Eti Elektroelement d.o.o. The remaining authors declare that the research was conducted in the absence of any commercial or financial relationships that could be construed as a potential conflict of interest.
References
- Yoo, K.; Bacarreza, O.; Aliabadi, M.H.F. A novel multi-fidelity modelling-based framework for reliability-based design optimisation of composite structures. Eng. Comput. 2022, 38, 595–608. [Google Scholar] [CrossRef] [Scilit]
- Lee, G.; Kim, W.; Oh, H.; Youn, B.D.; Kim, N.H. Review of statistical model calibration and validation—from the perspective of uncertainty structures. Struct. Multidiscip. Optim. 2019, 60, 1619–1644. [Google Scholar] [CrossRef] [Scilit]
- Deng, P.; Huo, S.; Zhao, C.; Li, Q.; Wang, X.; Lu, T.; Parthasarathy, R. Inverse structural design of flexible electronics based on improved random forest. Mech. Adv. Mater. Struct. 2025, 1–22. [Google Scholar] [CrossRef] [Scilit]
- Zhang, X.; Shao, W.; Liu, Y.; Fan, X.; Shi, R. Stochastic Blade Pitch Angle Analysis of Controllable Pitch Propeller Based on Deep Neural Networks. Modelling 2025, 6, 54. [Google Scholar] [CrossRef] [Scilit]
- Acar, E.; Bayrak, G.; Jung, Y.; Lee, I.; Ramu, P.; Ravichandran, S.S. Modeling, analysis, and optimization under uncertainties: A review. Struct. Multidiscip. Optim. 2021, 64, 2909–2945. [Google Scholar] [CrossRef] [Scilit]
- Mridha, R.H.; Tan, K.T. Effect of cohesive properties on the impact behavior and damage progression of hybrid sandwich composites. Mech. Adv. Mater. Struct. 2025, 2591837. [Google Scholar] [CrossRef] [Scilit]
- Tavera-Sainz, J.G.; Minor-Popocatl, H.; Aguilar-Mejía, O.; Miranda-Perez, A.F. Improving laser welding penetration depth process capability for automotive seat adjusters. Qual. Eng. 2025, 1–15. [Google Scholar] [CrossRef] [Scilit]
- Wilke, R.A.; Lo, S.M.S. Accelerated failure time analysis for industrial life modeling in presence of unknown dependent and independent censoring. Qual. Eng. 2025, 37, 571–582. [Google Scholar] [CrossRef] [Scilit]
- Dong, C.; Wu, Y.; Jiang, H. A Novel Weak Fault Feature Extraction Method Based on Tensor Decomposition Model for Bearings. Modelling 2025, 6, 102. [Google Scholar] [CrossRef] [Scilit]
- Hu, W.; Cheng, S.; Yan, J.; Cheng, J.; Peng, X.; Cho, H.; Lee, I. Reliability-based design optimization: A state-of-the-art review of its methodologies, applications, and challenges. Struct. Multidiscip. Optim. 2024, 67, 168. [Google Scholar] [CrossRef] [Scilit]
- Uschold, B. Calculating process capability of circular position tolerances. Qual. Eng. 2025, 37, 668–676. [Google Scholar] [CrossRef] [Scilit]
- Hao, P.; Yang, H.; Wang, Y.; Liu, X.; Wang, B.; Li, G. Efficient reliability-based design optimization of composite structures via isogeometric analysis. Reliab. Eng. Syst. Saf. 2021, 209, 107465. [Google Scholar] [CrossRef] [Scilit]
- Hosseinzadeh, Y.; Taghizadieh, N.; Jalili, S. A new structural reanalysis approach based on the polynomial-type extrapolation methods. Struct. Multidiscip. Optim. 2018, 58, 1033–1049. [Google Scholar] [CrossRef] [Scilit]
- Lai, X.; Huang, J.; Zhang, Y.; Wang, C.; Zhang, X. A general methodology for reliability-based robust design optimization of computation-intensive engineering problems. J. Comput. Des. Eng. 2022, 9, 2151–2169. [Google Scholar] [CrossRef] [Scilit]
- Chun, J. Reliability-Based Design Optimization of Structures Using Complex-Step Approximation with Sensitivity Analysis. Appl. Sci. 2021, 11, 4708. [Google Scholar] [CrossRef] [Scilit]
- Arfa, H.; Bouchoucha, F.; Debbich, H.; Aouadi, K.; Ben Ammar, Y.; Nouveau, C. Wave propagation in laminated structure through wave finite element method. Int. J. Mech. Mater. Des. 2025, 21, 1903–1916. [Google Scholar] [CrossRef] [Scilit]
- Ho, P.L.H.; Lee, C. Adaptive quadtree edge-based smoothed finite element method for limit state analysis of structures. Int. J. Mech. Mater. Des. 2024, 20, 1191–1207. [Google Scholar] [CrossRef] [Scilit]
- Gamez-Montero, P.J.; Bernat-Maso, E. Taguchi Techniques as an Effective Simulation-Based Strategy in the Design of Numerical Simulations to Assess Contact Stress in Gerotor Pumps. Energies 2022, 15, 7138. [Google Scholar] [CrossRef] [Scilit]
- Pham, Q.H.; Cuong-Le, T. Nonlocal strain gradient finite element model for dynamic buckling analysis of non-uniform thickness piezoelectric skew-nanoplate considering surface effect. Int. J. Mech. Mater. Des. 2025, 21, 1723–1753. [Google Scholar] [CrossRef] [Scilit]
- Šeruga, D.; Hansenne, E.; Haesen, V.; Nagode, M. Durability prediction of EN 1.4512 exhaust mufflers under thermomechanical loading. Int. J. Mech. Sci. 2014, 84, 199–207. [Google Scholar] [CrossRef] [Scilit]
- Schmidt, J.; Bochmann, T.; Rust, B.; Stroetmann, R.; Münch, A.; Weidner, P.; Ummenhofer, T. Numerical investigation of N-joints from high-strength square hollow sections. Steel Constr. 2025, 18, 150–163. [Google Scholar] [CrossRef] [Scilit]
- Zheng, Z.; Xu, Y.; Hamdan, B.; Kohtz, S.; Costa, P.; Costa, A.; Morais, C.; Wang, P. Reliability-based optimization of offshore salt caverns for CO2 abatement. In Proceedings of the ASME 2022 International Design Engineering Technical Conferences and Computers and Information in Engineering Conference, St. Louis, MI, USA, 14–17 August 2022. [Google Scholar] [CrossRef] [Scilit]
- Hassanien, S.; Kainat, M.; Adeeb, S.; Langer, D. On the Use of Surrogate Models in Reliability-Based Analysis of Dented Pipes. In Volume 2: Pipeline Safety Management Systems; Project Management, Design, Construction and Environmental Issues; Strain Based Design; Risk and Reliability; Northern Offshore and Production Pipelines, Proceedings of the 2016 11th International Pipeline Conference, Calgary, AB, Canada, 26–30 September 2016; ASME: New York, NY, USA, 2016. [Google Scholar] [CrossRef] [Scilit]
- Glavan, M.; Klemenc, J.; Malnarič, V.; Šeruga, D. Incorporation of a Simplified Mechanical Joint Model into Numerical Analysis. Stroj. Vestn. J. Mech. Eng. 2022, 68, 3–13. [Google Scholar] [CrossRef] [Scilit]
- Škrlec, A.; Kocjan, T.; Nagode, M.; Klemenc, J. Modelling a Response of Complex-Phase Steel at High Strain Rates. Materials 2024, 17, 2302. [Google Scholar] [CrossRef] [Scilit] [PubMed]
- Mikelj, M.; Nagode, M.; Klemenc, J.; Šeruga, D. Influence of Operating Conditions on a Cast-Iron Manhole Cover. Technologies 2022, 10, 127. [Google Scholar] [CrossRef] [Scilit]
- Coman, P.T.; Petrushenko, D.; Darcy, E.C.; White, R.E. Electrical-thermal modeling and electrical design optimization of fuses in a nickel bus-plate for a Li-ion battery pack. J. Energy Storage 2024, 86, 111226. [Google Scholar] [CrossRef] [Scilit]
- Bayliss, C.; Hardy, B. Chapter 11—Fuses and Miniature Circuit Breakers. In Transmission and Distribution Electrical Engineering, 4th ed.; Bayliss, C., Hardy, B., Eds.; Newnes: Oxford, UK, 2012; pp. 361–395. [Google Scholar] [CrossRef] [Scilit]
- Todorov, G.; Kamberov, K. EV fuse design cost reduction based on Thermal-Electric Conduction analyses. Case Stud. Therm. Eng. 2020, 21, 100692. [Google Scholar] [CrossRef] [Scilit]
- Hajimohammadi, F.; Fani, B.; Sadeghkhani, I. Fuse saving scheme in highly photovoltaic-integrated distribution networks. Int. Trans. Electr. Energy Syst. 2020, 30, e12148. [Google Scholar] [CrossRef] [Scilit]
- Osmani, K.; Haddad, A.; Lemenand, T.; Castanier, B.; Alkhedher, M.; Ramadan, M. A critical review of PV systems’ faults with the relevant detection methods. Energy Nexus 2023, 12, 100257. [Google Scholar] [CrossRef] [Scilit]
- Torres, E.; Mazón, A.; Fernández, E.; Zamora, I.; Pérez, J. Thermal performance of back-up current-limiting fuses. Electr. Power Syst. Res. 2010, 80, 1469–1476. [Google Scholar] [CrossRef] [Scilit]
- Ebeling, C.E. An Introduction to Reliability and Maintainability Engineering; McGraw-Hill: Dayton, OH, USA, 1997. [Google Scholar]
- Weibull, W. A Statistical Distribution Function of Wide Applicability. J. Appl. Mech. 1951, 18, 293–297. [Google Scholar] [CrossRef] [Scilit]
- Paul, S.K.; Nayak Majila, A.; Fernando, D.C. Statistical analysis of uniaxial tensile and fatigue data of Ti-685 alloy at different temperatures. Forces Mech. 2021, 4, 100046. [Google Scholar] [CrossRef] [Scilit]
- Yang, X.; Xie, L.; Chen, J.; Zhao, B.; Wang, K. Estimation of Weibull distribution using the back-propagation neural network for fatigue failure data. Probabilistic Eng. Mech. 2025, 82, 103828. [Google Scholar] [CrossRef] [Scilit]
- Jiang, H.; Wang, J.; Wu, J.; Geng, W. Comparison of numerical methods and metaheuristic optimization algorithms for estimating parameters for wind energy potential assessment in low wind regions. Renew. Sustain. Energy Rev. 2017, 69, 1199–1217. [Google Scholar] [CrossRef] [Scilit]
- Teimouri, M.; Nadarajah, S. A simple estimator for the Weibull shape parameter. Int. J. Struct. Stab. Dyn. 2012, 12, 395–402. [Google Scholar] [CrossRef] [Scilit]
- Genschel, U.; Meeker, W.Q. A Comparison of Maximum Likelihood and Median-Rank Regression for Weibull Estimation. Qual. Eng. 2010, 22, 236–255. [Google Scholar] [CrossRef] [Scilit]
- Herd, G.R. Estimation of Reliability from Incomplete Data. In Proceedings of the 6th National Symposium on Reliability and Quality Control, Washington, DC, USA, 11–13 January 1960; IEEE: New York, NY, USA, 1960; pp. 202–217. [Google Scholar]
- Johnson, L.G. The Statistical Treatment of Fatigue Experiments; Elsevier Publishing Company: Amsterdam, The Netherlands, 1964. [Google Scholar]
- Benard, A.; Bos-Levenbach, E.C. Het uitzetten van waarnemingen op waarschijnlijkheids-papier (The plotting of observations on probability paper). Stat. Neerl. 1953, 7, 163–173. [Google Scholar] [CrossRef] [Scilit]
- IEC 60269-1; Low-Voltage Fuses—Part 1: General Requirements. International Electrotechnical Commission: Geneva, Switzerland, 2006.
- Plunkett, S.T.; Chen, C.; Rojaee, R.; Doherty, P.; Sik Oh, Y.; Galazutdinova, Y.; Krishnamurthy, M.; Al-Hallaj, S. Enhancing thermal safety in lithium-ion battery packs through parallel cell ’current dumping’ mitigation. Appl. Energy 2021, 286, 116495. [Google Scholar] [CrossRef] [Scilit]
- Mori, T.; Tsai, S.C. Taguchi Methods: Benefits, Impacts, Mathematics, Statistics and Applications; ASME Press: New York, NY, USA, 2011. [Google Scholar] [CrossRef] [Scilit]
- Jankovic, A.; Chaudhary, G.; Goia, F. Designing the design of experiments (DOE)—An investigation on the influence of different factorial designs on the characterization of complex systems. Energy Build. 2021, 250, 111298. [Google Scholar] [CrossRef] [Scilit]
- Novak, L.; Herman, B.; Klemenc, J.; Nagode, M.; Šeruga, D. Determination of operating conditions of indicator springs. Svet Stroj. (World Mech. Eng.) 2024, 13, 82–83. (In Slovene) [Google Scholar] [CrossRef] [Scilit]
- Šeruga, D.; Novak, L.; Nagode, M.; Klemenc, J. Simulation-based structural design and reliability evaluation of an indicator spring. In Integrity-Reliability-Failure in Engineering, Materials, Manufacturing and Biomechanics: Proceedings of the IRF2025: 8th International Conference on Integrity-Reliability-Failure, Porto, Portugal, 15–18 July 2025; Silva Gomes, J.F., Meguid, S.A., Eds.; FEUP: Porto, Portugal, 2025. [Google Scholar] [CrossRef] [Scilit]

Disclaimer/Publisher’s Note: The statements, opinions and data contained in all publications are solely those of the individual author(s) and contributor(s) and not of MDPI and/or the editor(s). MDPI and/or the editor(s) disclaim responsibility for any injury to people or property resulting from any ideas, methods, instructions or products referred to in the content. |
© 2026 by the authors. Licensee MDPI, Basel, Switzerland. This article is an open access article distributed under the terms and conditions of the Creative Commons Attribution (CC BY) license.