


Abstract
When a material is subjected to external forces, it undergoes internal mechanical deformations. To measure this type of deformation, mechanical sensors such as load cells, strain gauges, etc., are typically used. These sensors convert mechanical energy into electrical energy, which can then be displayed on electronic displays. Noninvasive methods can be used to measure deformations in materials. These methods use light as a measurement medium. These include non-destructive optical testing (Ronchi test, Foucault test, etc.) and interferometric testing. Among the most commonly used interferometers for strain measurement are shearography configurations, as they are suitable for measuring in-plane or out-of-plane deformations. In the present work, the deformations of four rectangular pieces made of materials used in the automotive and aerospace industries will be analyzed: 6061 aluminum, as well as 304, 1045, and 4041 steels. The analysis will be performed using optical interferometry, using a shearing interferometer, with shear in the direction of the applied compression force, in a Y-shape. In addition, the results will be compared with a Wheatstone bridge arrangement made with four strain gauges, as well as with finite element analysis. Compressive forces of 491 N to 2453 N were applied to each sample, yielding different fringe patterns in the obtained interferograms. When processed to obtain their respective phases, the proposed materials exhibited different elasticity. The interferometric results were compared with those obtained with strain gauges, which were placed on the opposite side of the test objects. Furthermore, the interferometric results reliably reflect the results obtained with the finite element analysis, showing the deformation of the material when the compressive force is applied vertically.
1. Introduction
Mechanical stress analysis in materials is a fundamental discipline in engineering and applied physics, as it provides valuable information about the structural integrity and mechanical behavior of solids under external loads. Understanding how a material responds to tension, compression, torsion, or bending is essential for predicting its performance, ensuring its safety, and improving the design of mechanical and structural systems; for example, in the automotive industry, they can be: the chassis, doors, car-body, seats, etc. Traditionally, this type of analysis has been performed using destructive or semi-destructive techniques, such as tensile tests, hardness measurements, or strain gauge applications. In the automotive industry, different materials are used depending on the application, ranging from lightweight materials such as aluminum for structures or parts where weight is the primary concern and corrosion is the main issue. Similarly, parts that require specific heat treatment, where hardness is needed in certain areas, while other parts require materials that are easy to work with and inexpensive in these cases, basic carbon steels are commonly used. For components in constant contact with water, stainless steels are typically used. Different materials are used for each of these applications, which is why it is important to study them [1]. Although effective, these methods can alter or damage the specimen under test, which is not suitable for components that must remain functional after inspection. In this context, non-destructive optical techniques have emerged as powerful alternatives, capable of detecting micro-deformations and stresses without physically contacting or damaging the object [2]. Among them, optical interferometry stands out as one of the most precise and versatile methods, which rely on the interference of coherent light waves to measure minute displacements, refractive index variations, and surface deformations with nanometric accuracy. This technique is based on the superposition of two or more electromagnetic wavefronts, generating constructive and destructive interference patterns that encode information about the optical path differences introduced by the deformation of the sample [3]. Speckle interferometry is an optical technique based on the phenomenon of light interference or interference patterns, whereby two or more light waves overlap to produce patterns of bright and dark fringes. These patterns contain valuable information about differences in the path length of light, allowing for the highly precise analysis and measurement of various physical properties with high precision. In this method, light is split into two beams that travel along different paths and then recombine, producing an interference pattern. The study of these fringes allows for the detection of very small changes in distance, shape, or refractive index, making interferometry a fundamental tool in science and engineering. Speckle interferometry is applied in areas such as surface measurement, material quality control, and the development of high precision optical instruments, and is widely used in devices such as the interferometer. A particularly attractive variant of this technique is digital phase-shifting shearing interferometry (DPSSI), which combines the advantages of digital image acquisition with the high sensitivity of phase-shifting interferometry. In DPSSI, two slightly sheared wavefronts originating from the same object interfere, producing a fringe pattern directly related to the gradient of deformation between adjacent points of the surface. This approach eliminates the need for a separate reference beam and provides high immunity to external vibrations and thermal fluctuations, making it ideal for scientific laboratories and industrial environments [4].
In recent years, several authors have contributed to the improvement of the accuracy and applicability of shear interferometry. For example, in 2004, Casillas et al. introduced a stroboscopic electronic speckle shearing pattern interferometry (ESSPI) technique for precise vibration amplitude estimation [5], while, in 2008, Blum et al. demonstrated its potential for industrial non-destructive testing, using a multichannel random quadrature interferometer [6]. Later, in 2013, Francis explored shearography for composite materials, improving fringe contrast and phase sensitivity [7], and in 2019 Yan et al. developed configurations suitable for specular surfaces [8]. In 2021, Sun et al. further advanced the field by integrating frequency-modulated continuous-wave (FMCW) laser interferometry for the real-time measurement of moving surfaces [9].
Building upon this foundation, in early 2025, our laboratory used a Michelson interferometer, in shearing configuration, to evaluate mechanical deformations in aluminum samples, comparing the interferometric results of the 4-step phase shift algorithms. This study demonstrated the system’s ability to detect the effects of tensile or compressive forces on micrometer scales, validating the optical approach as a reliable alternative for stress analysis in metallic materials [10]. Subsequently, our laboratory team extended the method to the study of ceramic electrical insulators (cylindrical-toroidal geometric distribution), materials widely used in power transmission systems, which present challenges for traditional sensors due to their complex geometry and brittle nature. Using compressive loads of up to 2453 N, that work successfully visualized three-dimensional phase deformations and confirmed the suitability of the optical setup for non-metallic materials and those that do not have a rectangular geometry [11].
Given these advances, the present work represents the next step in a line of research focused on the quantitative validation and optimization of interferometric methods for material deformation analysis. Specifically, this kind of study aims to enhance the mechanical and optical stability of the experimental setup, improve the quality of the interferometric fringes, and compare optical results with complementary measurements obtained from mechanical sensors such as strain gauges and load cells. Through these developments, the goal is to consolidate digital shearing interferometry as a standard non-destructive technique for the precise characterization of metallic, ceramic, and composite materials, expanding its potential applications in the fields of structural health monitoring, micro electromechanical systems (MEMS), and industrial quality control, among others.
The automotive and aerospace industries share many materials for the construction of their assembly, fastening and support parts, such as steel, aluminum, and plastics, among others [12,13,14]. In this document, a deformation study of four of these materials (without heat treatment) is addressed: 1045 steel, 4041 carbon steel, 304 stainless steel, and 6061 aluminum. For example, 1045 steel is used for gears and parts that undergo a specific thermal treatment; chassis, doors, and structures are made with 4041 steel; 304 stainless steel is applied for pump blades; and 6061 aluminum is used in the manufacture of transmission cases and engine blocks [15,16,17,18].
The purpose of this work is to analyze the deformation behavior of four rectangular metal parts made of materials used in the automotive and aerospace industries: 6061 aluminum, as well as 304, 1045, and 4041 steels. The study is conducted using shear interferometry to observe the phase behavior of the four materials when subjected to a compressive force of up to approximately 2.5 kN (in intervals of approximately 0.5 kN). At the same time, the deformation of each of these metals will be measured with a strain gauge array (Wheatstone bridge) placed on the opposite side of each of the parts under test. These results were corroborated with their simulation in SolidWorks (Design Premium for Students 2026).
In the following sections, the methodologies used for phase shift interferometry; the methodologies to measure strain in materials, and the measurement of strains using strain gauges are explained. The experimental setup is then described. Finally, in the last three sections the experimental results, their discussion, and the conclusions of the work are presented.
2. Materials and Methods
Optical metrology is a discipline of optics whose main objective is to measure objects or physical activity on the object itself (mechanical, thermal, etc.) through the analysis of optical phenomena such as interference, polarization, refraction, and diffraction, among others. These types of measurements can be performed with the help of optical devices such as interferometers, polarimeters, refractometers, diffractometers, etc. The great advantage of interferometry over other measuring techniques is that they use light as a unit of measurement, achieving very high resolutions, since they depend on the wavelength of the laser used, in addition to being a non-invasive technique [19]. One of the most common applications in interferometry is the analysis of material deformations. This requires that the material in question be subjected to mechanical stresses, such as compression, tension, etc. [20]. In this document, only mechanical stresses in compression will be worked out.
2.1. Strain and Stress in Materials
Compression is a mechanical stress that occurs in the material when equal and opposite forces approach each other [21].
When a force is applied to a material (stress), it can be through compression, tension, or torsional moment. Stress () is calculated by the material’s cross-sectional area [22] as
where and F are the original cross-sectional area and the force applied to the material, respectively.
When an external load is applied to a material, a strain occurs; this is the internal deformation experienced by the material when subjected to that external force. This results in a change in the shape or size of the material due to the load applied at that time. The deformation produced by strain can be elastic (temporary) or plastic (permanent), depending on the recovery of the material to its original shape after removing the load. The strain () is mathematically expressed as a dimensionless ratio, representing the fraction of deformation relative to the original length of the material [22], given by
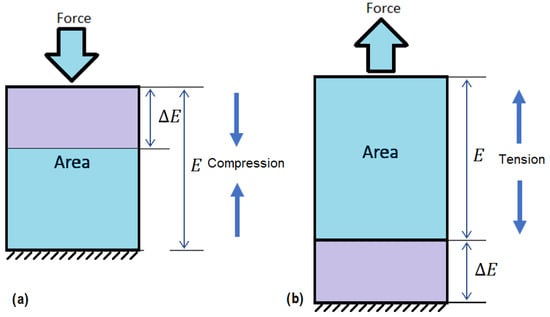
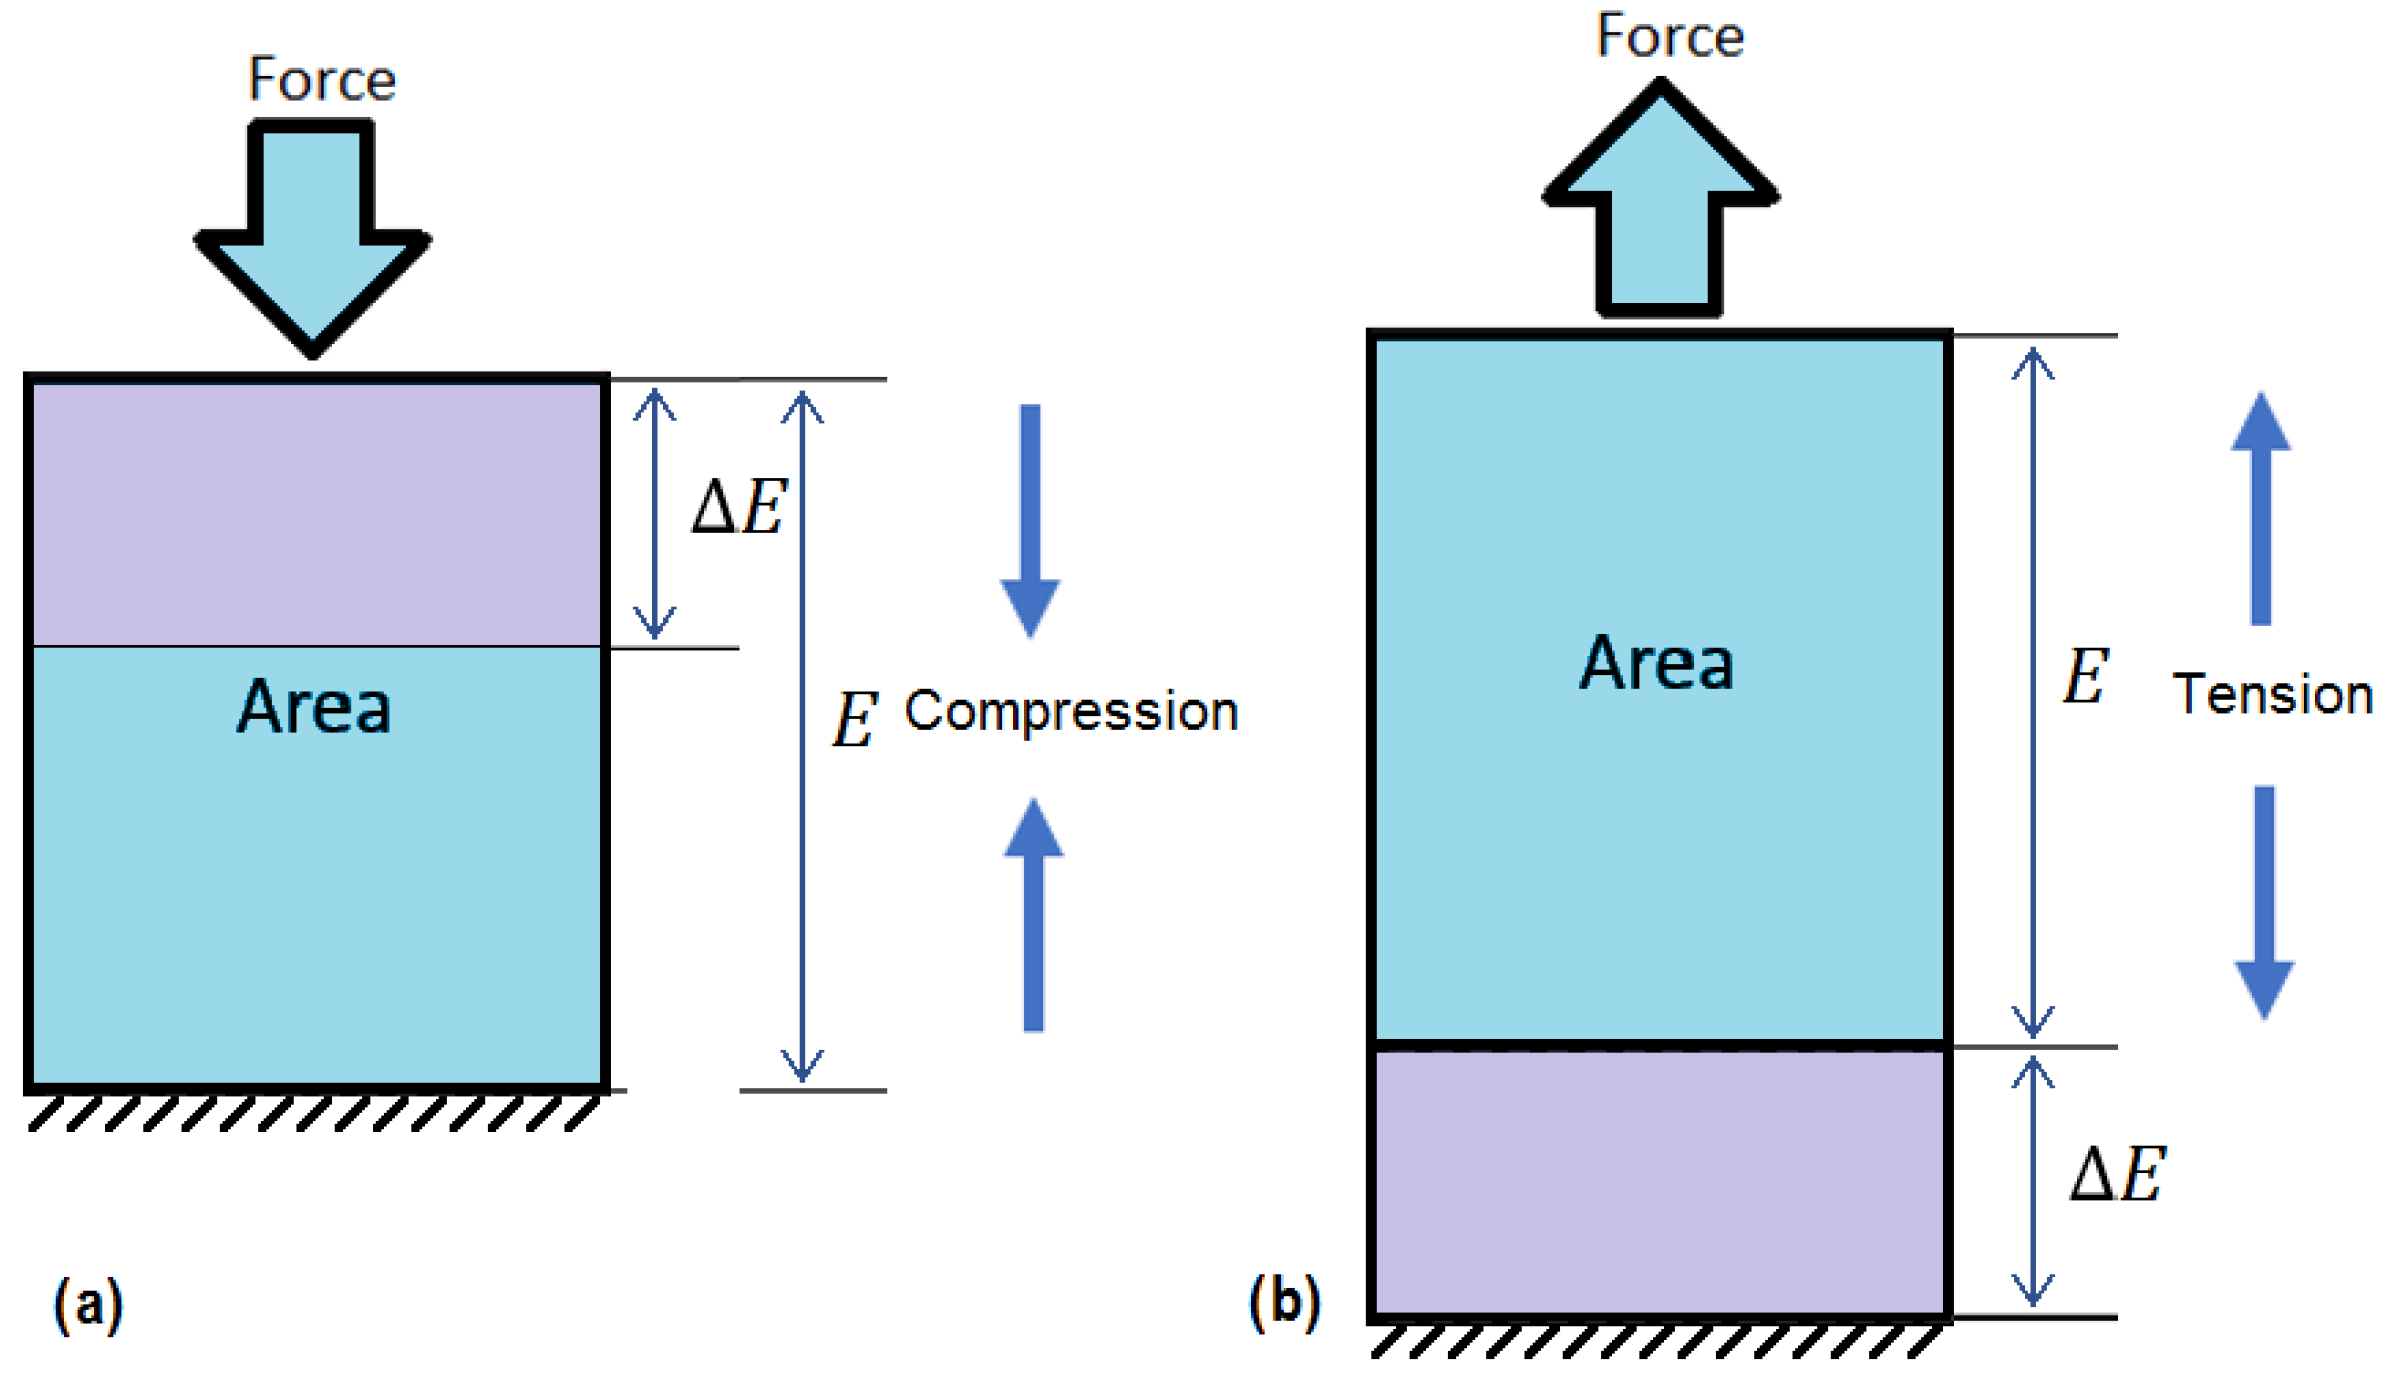
where and E represent the elongation of the material and the original length of the same material, respectively. In Figure 1a, it can be observed that, when applying an external force in the direction of the material, it is subjected to a compressive force, while when applying the external force in the opposite direction to the material, it will be subjected to a tensile force. In Figure 1b, it can be observed how the test material elongated when subjected to tensile forces.
Figure 1.
(a) Stress is a fundamental concept in mechanics of materials that describes how internal forces develop within a material when external forces are applied. (b) Strain is defined as the ratio of the change in dimension to the original dimension when a mechanical stress is applied.
2.2. Strain Gauges
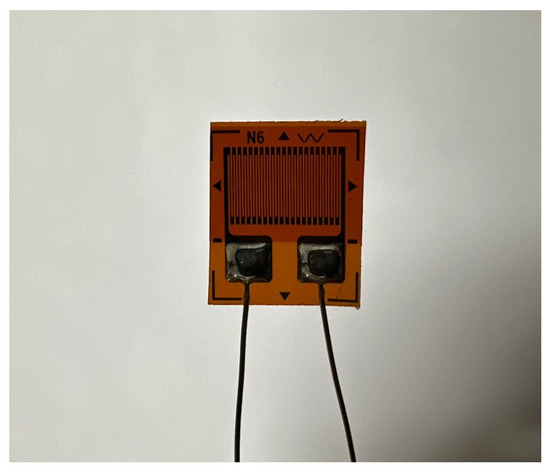
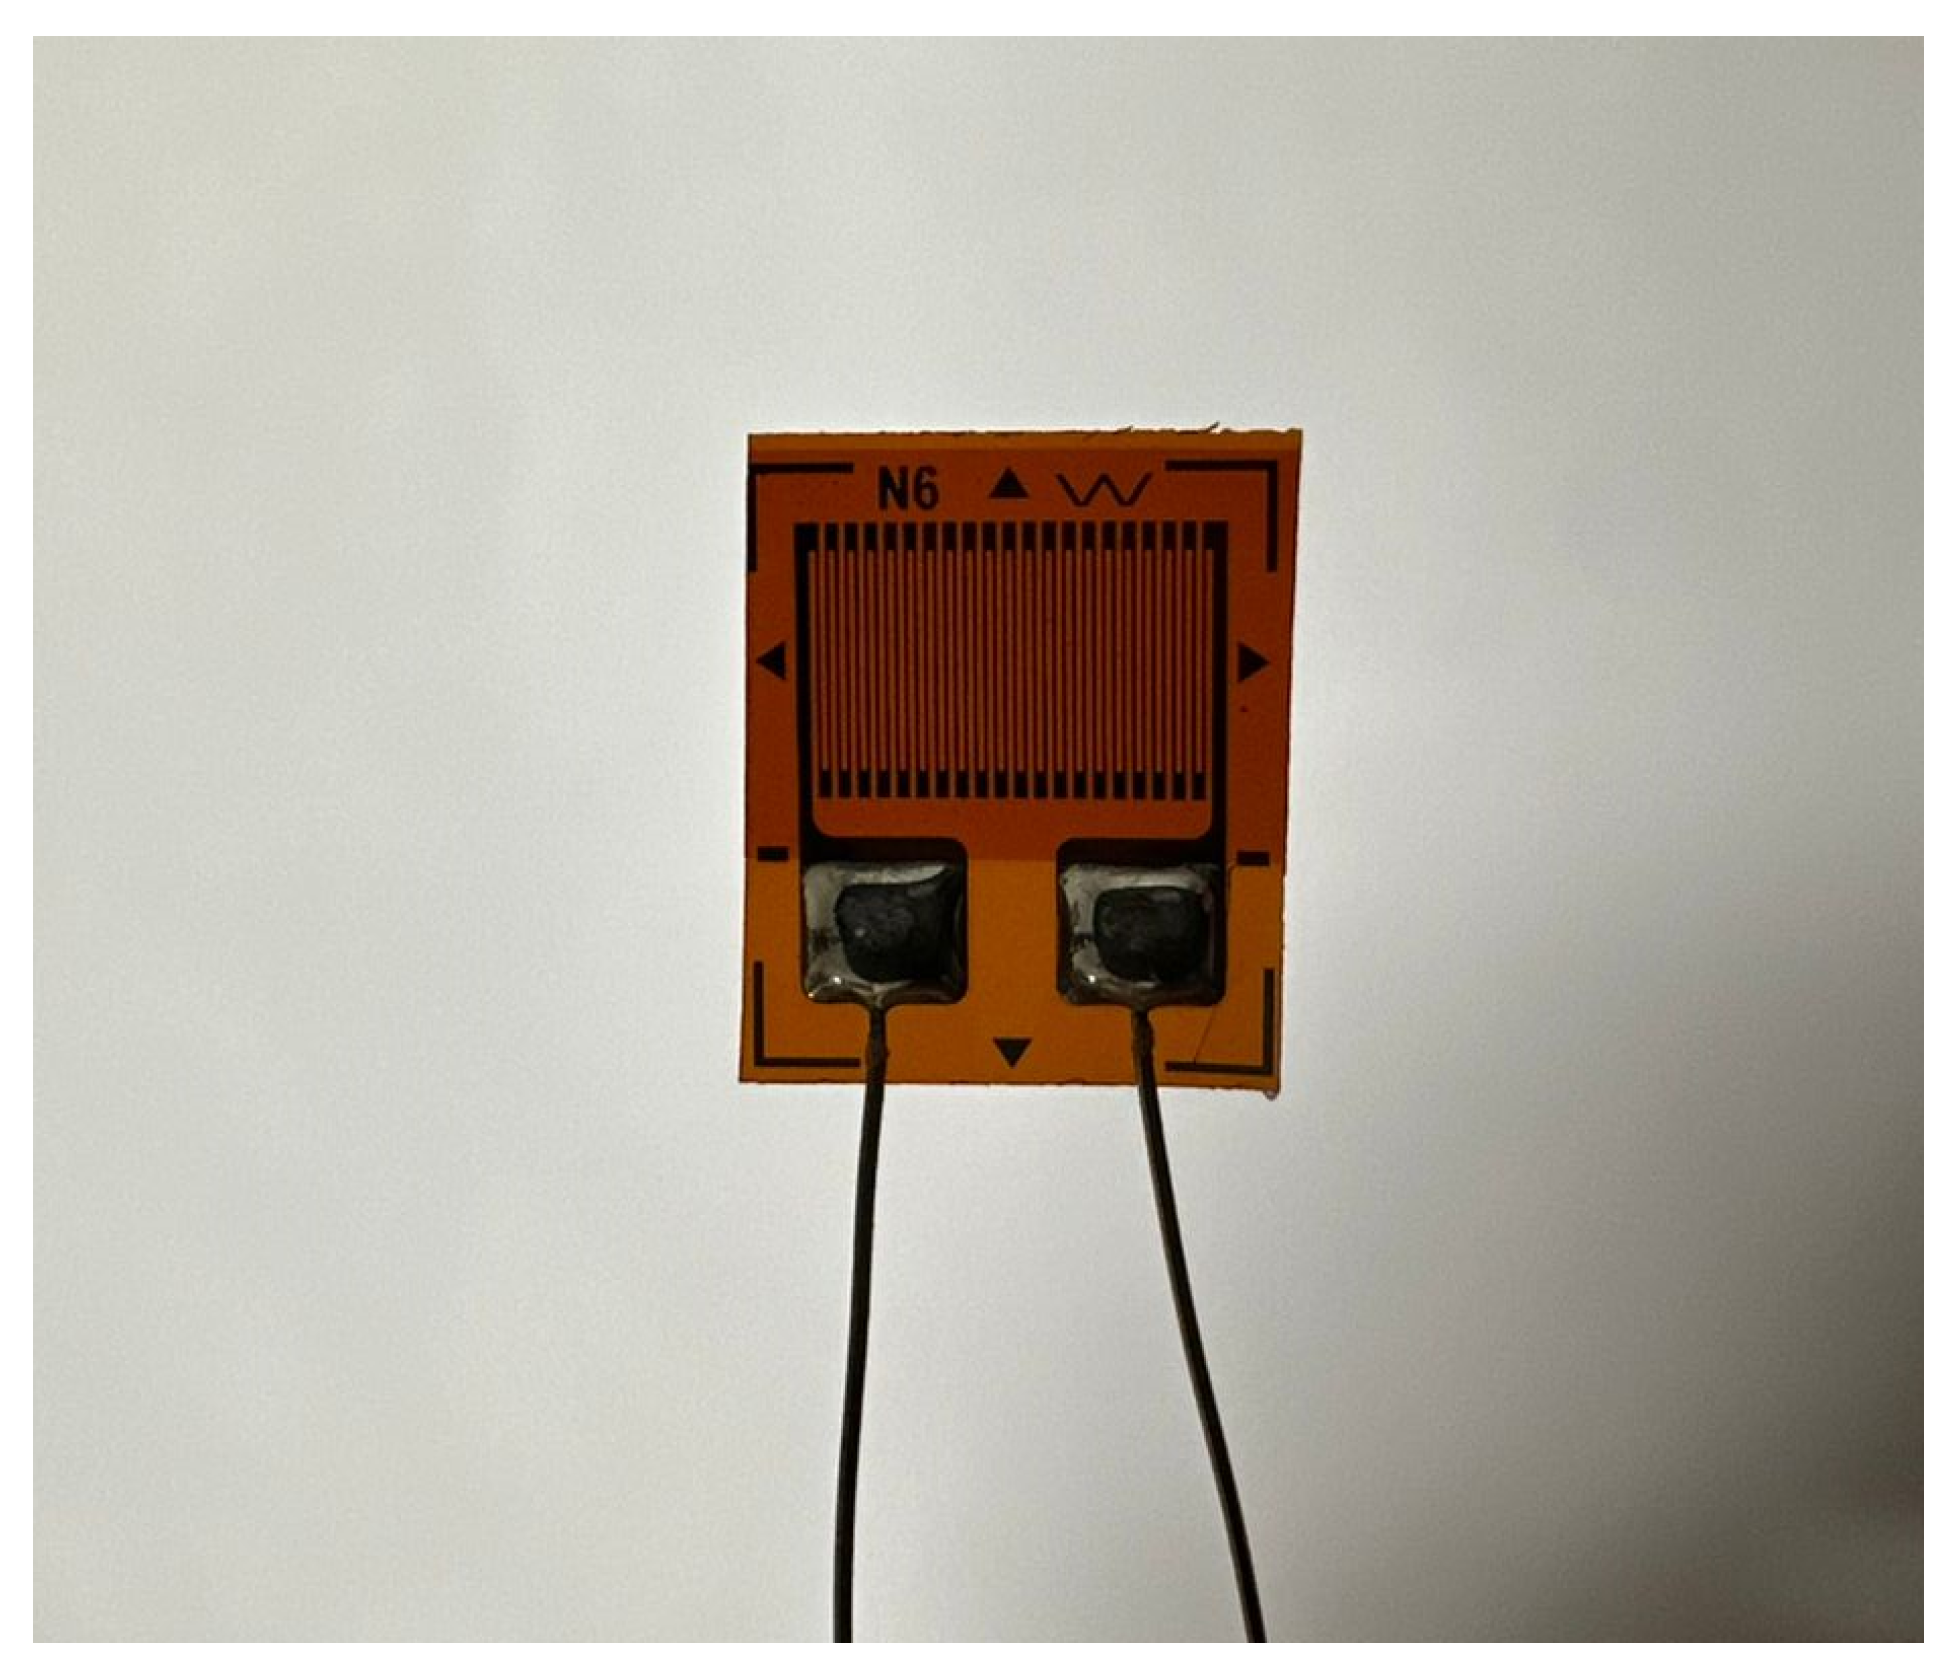
Strain gauges are devices designed to measure the strain, which is understood to be the change in shape or dimension of a material in response to an applied force. Among their main advantages are their low cost, high accuracy, and ease of implementation, even in areas where structural or mechanical evaluations are required. Strain gauges present several challenges to users; one is that measurement occurs only in the specific area where the gauge is placed on the specimen. To address this issue, electrical configurations, such as full bridges or half-bridges, are employed. Another challenge is that they are considered semi-invasive measurement tools, as they must be bonded to the specimen or object under test; the adhesive used can be corrosive to certain types of materials. Figure 2 shows a general-purpose strain gauge, similar to those used in the experimental design described in Section 2.4. A strain gauge typically functions as a transducer that converts mechanical strain into an electrical signal. This conversion is accomplished by a Wheatstone bridge circuit, which consists of a configuration of four resistors strategically arranged to detect small changes in resistance with high sensitivity.
Figure 2.
A strain gauge is a sensor used to measure strain in a material or structure; it converts mechanical strain into a measurable change in electrical resistance.
In strain gauge applications, all resistors in the bridge are initially balanced, which produces an output voltage in millivolts (mV) in the absence of mechanical stress. However, when a load is applied, this balance is disturbed, and an output signal proportional to the strain experienced by the material is generated. Strain gauges are delicate and highly accurate devices that are used to measure deformations in materials and structures. Their use is essential in structural analysis and material strength studies, as they allow for more accurate and representative calculations of the real behavior. One of the key aspects to guarantee the accuracy of the measurements and the reliability of the data collected is the correct adhesion of the strain gauge to the surface of the material to be evaluated. It is important to note that all strain gauges have an inherent margin of error, which is especially relevant in applications that require a high degree of accuracy. These errors are usually specified by the manufacturer in the data sheets or in the technical specifications of the device. Then, the strain derived from Equation (2) can be rewritten as
where , R and are the increase in resistance with respect to the gauge deformation, the gauge resistance and the strain gauge factor, respectively. Furthermore, the ratio is known as the relative electrical change in the strain gauge. The strain , often expressed in micro-strain, is ; this means that the object is deformed by of its original length, or 1 parts per million (ppm). The deformation of the gauge is also related to the excitation voltages of the same and the output voltage transduced by the gauge , that is
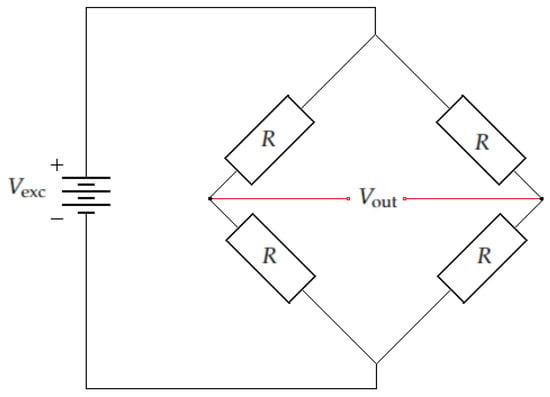
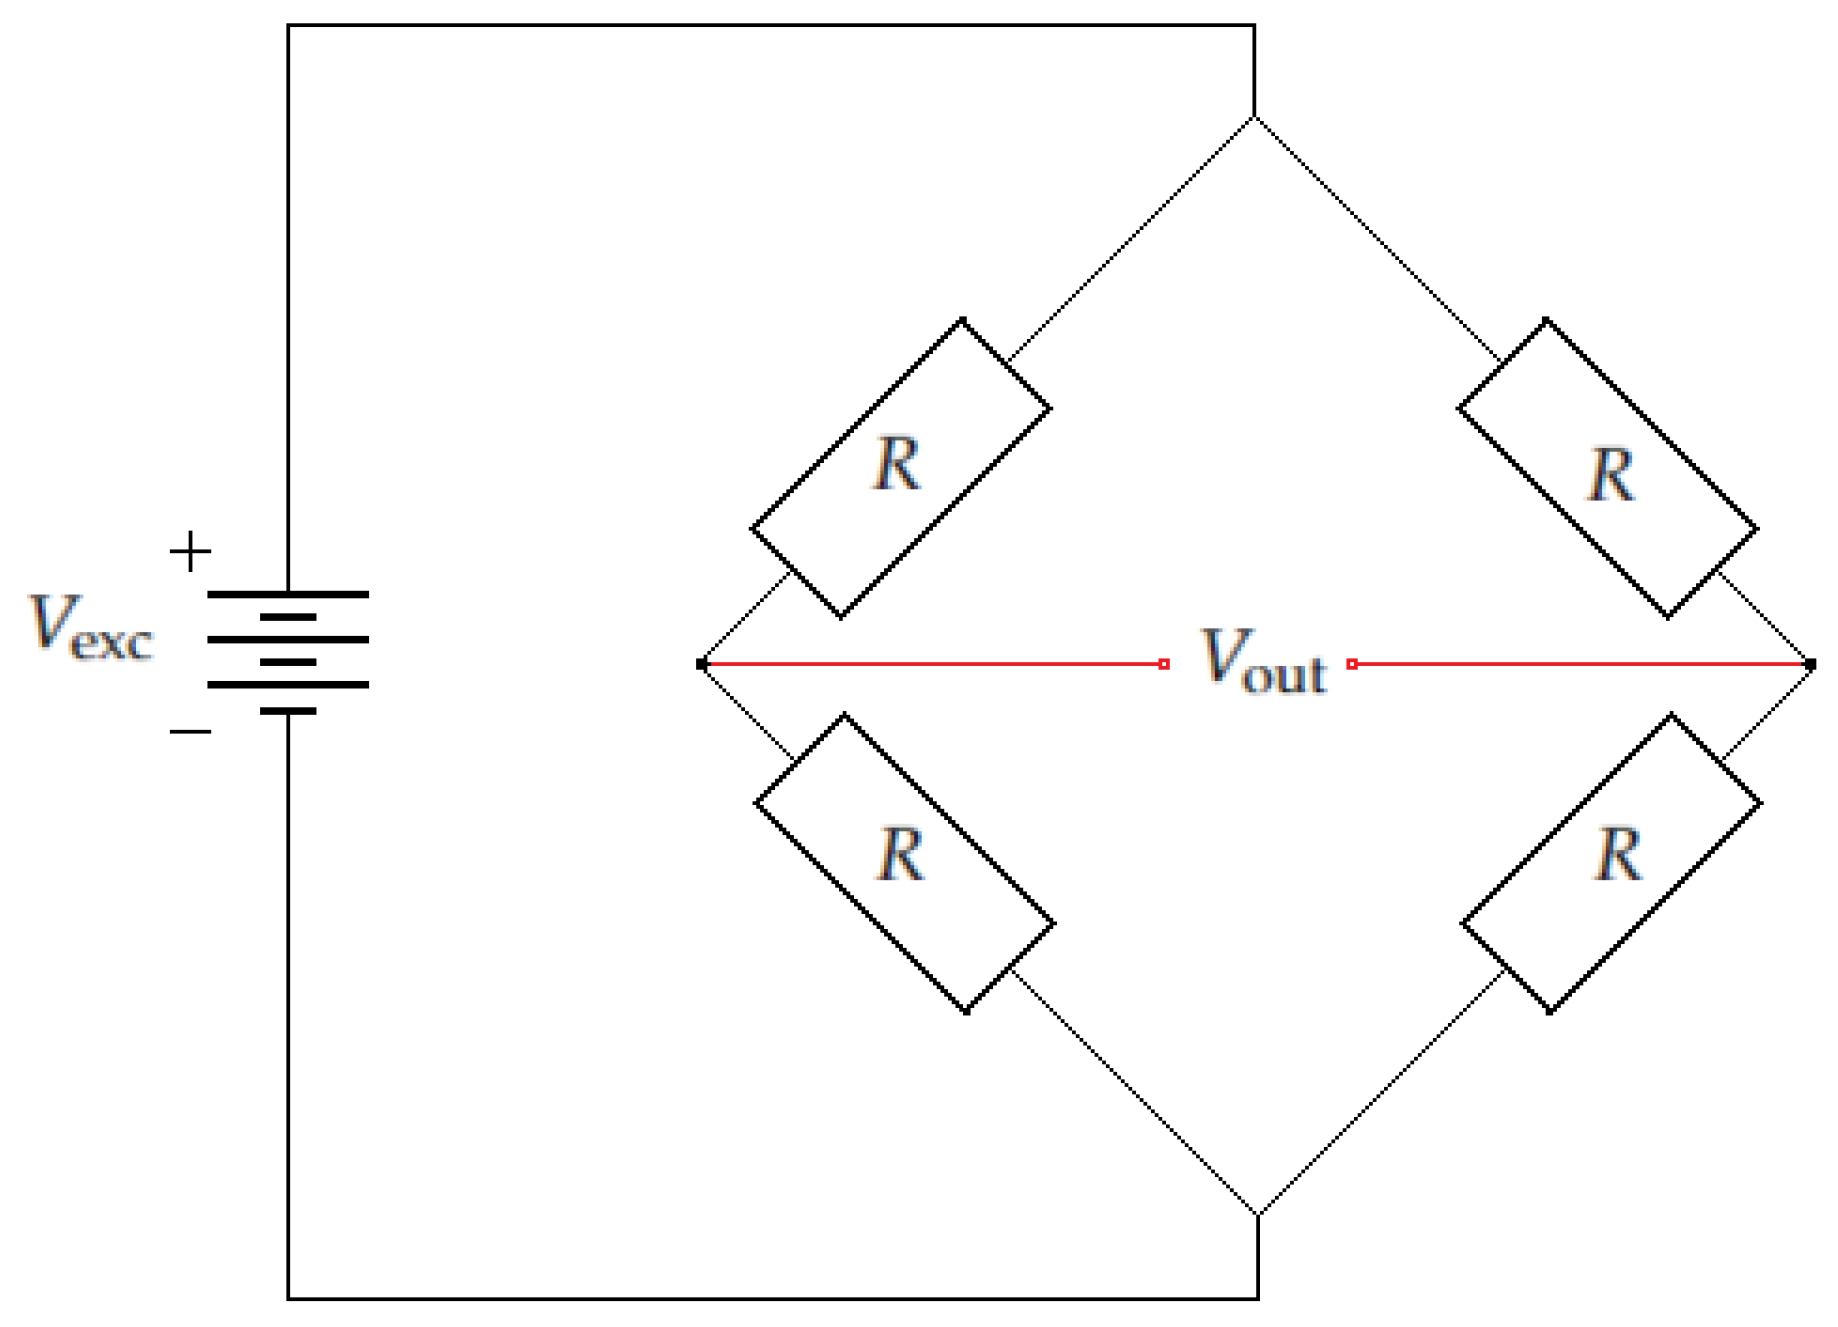
using a full bridge configuration with four strain gauges in a Wheatstone bridge circuit according to Figure 3 offers a significant advantage over the or bridge configurations, because the use of all four strain gauges contributes to improved bridge balance, improves measurement sensitivity and accuracy; in this case, it is necessary to use Equation (4) [23].
Figure 3.
A Wheatstone bridge is an electrical circuit used to measure an unknown resistance very accurately by balancing two legs of a bridge circuit.
With this setup, it is possible to measure the deformation in our experiment, since this is a semi-invasive, non-destructive test. The Wheatstone bridge is powered by applying a voltage source between two opposite nodes of the bridge, typically 5 or 10 V, so that the imbalance caused by changes in resistance, such as those produced by a strain gauge, can be measured.
2.3. Phase Shifting Interferometry (PSI)
Optical interferometry is a non-destructive measurement technique that employs the principle of interference and superposition of waves to obtain detailed information about the physical properties of the object being measured or the test object (where the interference fringe patterns are observed). These physical properties of the object can include distances, shape, temperature, variations in a medium, etc. The intensity of the fringe pattern produced by interference observed in an amplitude-splitting interferometer can be modeled by the general phase-shift equation, described by
where I is the intensity of the noise-free interference fringe pattern; A is the background intensity with a possible absence of noise; B is the amplitude modulation; is the phase term; are the spatial coordinates of the physical quantity under testing; is the component of the shift between interferograms; and j is the number of interferograms used by the PSI algorithm. For the present work, the 4-step algorithm was used, that is, and the steps of [24].
In order to solve the phase in Equation (5), the interferograms that contain the same trigonometric function (sin or cos) are subtracted, then divided, and a tangent function is found, finally obtaining the enveloped phase by applying an arctangent function [25], that is
The detailed procedure for obtaining Equation (6) for the 4-step phase shifting algorithm can be found in Ref. [10]. Due to the asymptotic discontinuities of the tangent function, the phase obtained in Equation (6) is wrapped () between these discontinuities, with a range of . In order to obtain the unwrapped phase (), phase unwrapping algorithms are applied, depending on the type of fringe pattern obtained in the interferograms and on the wrapped phase. For this work, the least squares algorithm was applied to obtain the unwrapped phase [26]. It is worth mentioning that the unwrapped phase obtained with the least squares algorithm for open fringes is a very good approximation of the real phase, that is, .
2.4. Experimental Set-Up
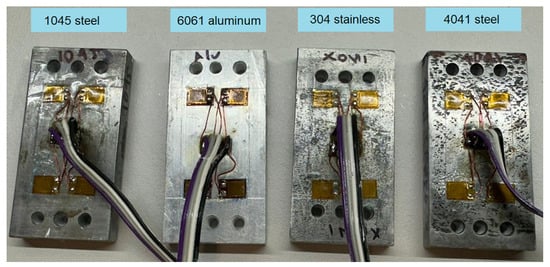
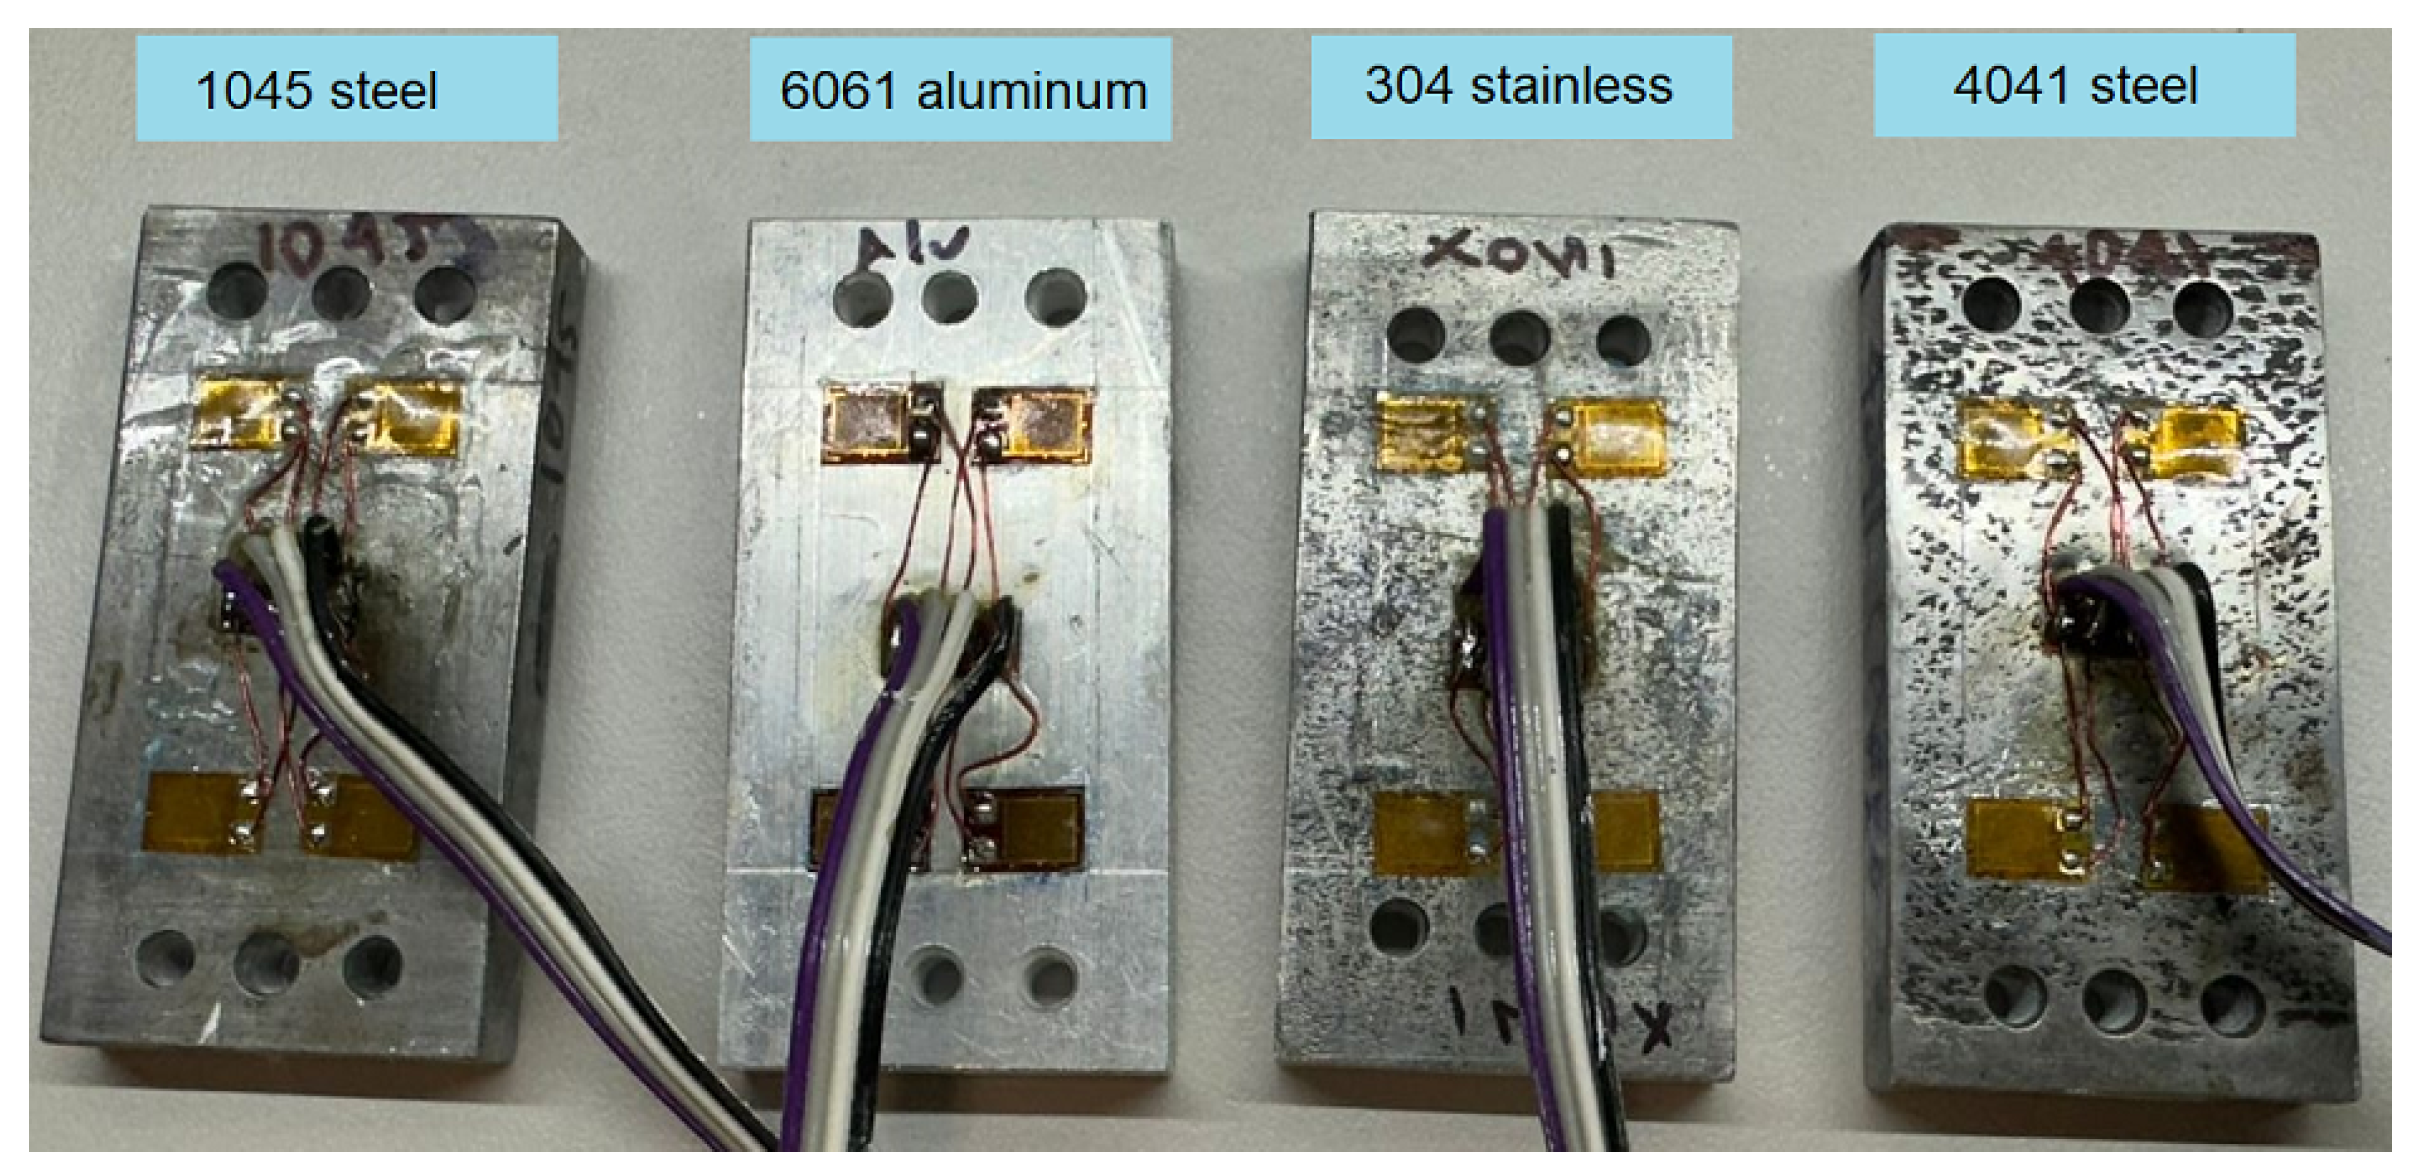
The test objects to be measured were four rectangular metal pieces with the following dimensions: mm in height, width, and thickness, respectively. These four pieces were of the next materials, namely 4041 carbon steel, 1045 steel, 304 stainless steel, and 6061 aluminum, which were without heat treatment; that is, they are the raw materials in their original state (or green materials). Where heat treatment is the controlled thermal process to transform mechanical properties of a material [27]. To complement interferometric analysis, Wheatstone bridges were added to each of the test objects or samples to be studied, placing them on the back of the four samples, as seen in Figure 4. As can be seen, the Wheatstone bridges were arranged with four strain gauges in a horizontal position (perpendicular to applied force) [28]. Figure 3 shows the Wheatstone bridge diagram used in each of the samples. The bridge parameters used were , V, and an internal strain gauge temperature of 24.5 °C.
Figure 4.
Four strain gauges are attached to each specimen, strategically placed on the sections to be analyzed, taking care to position them in the same location and orientation on each specimen.
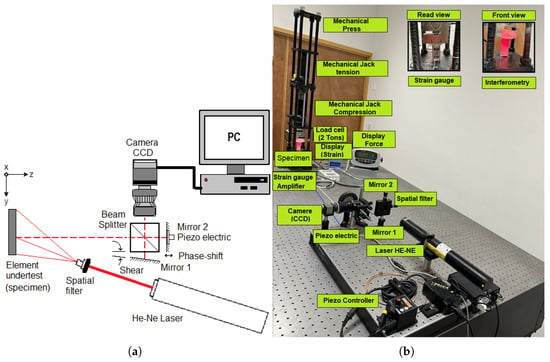
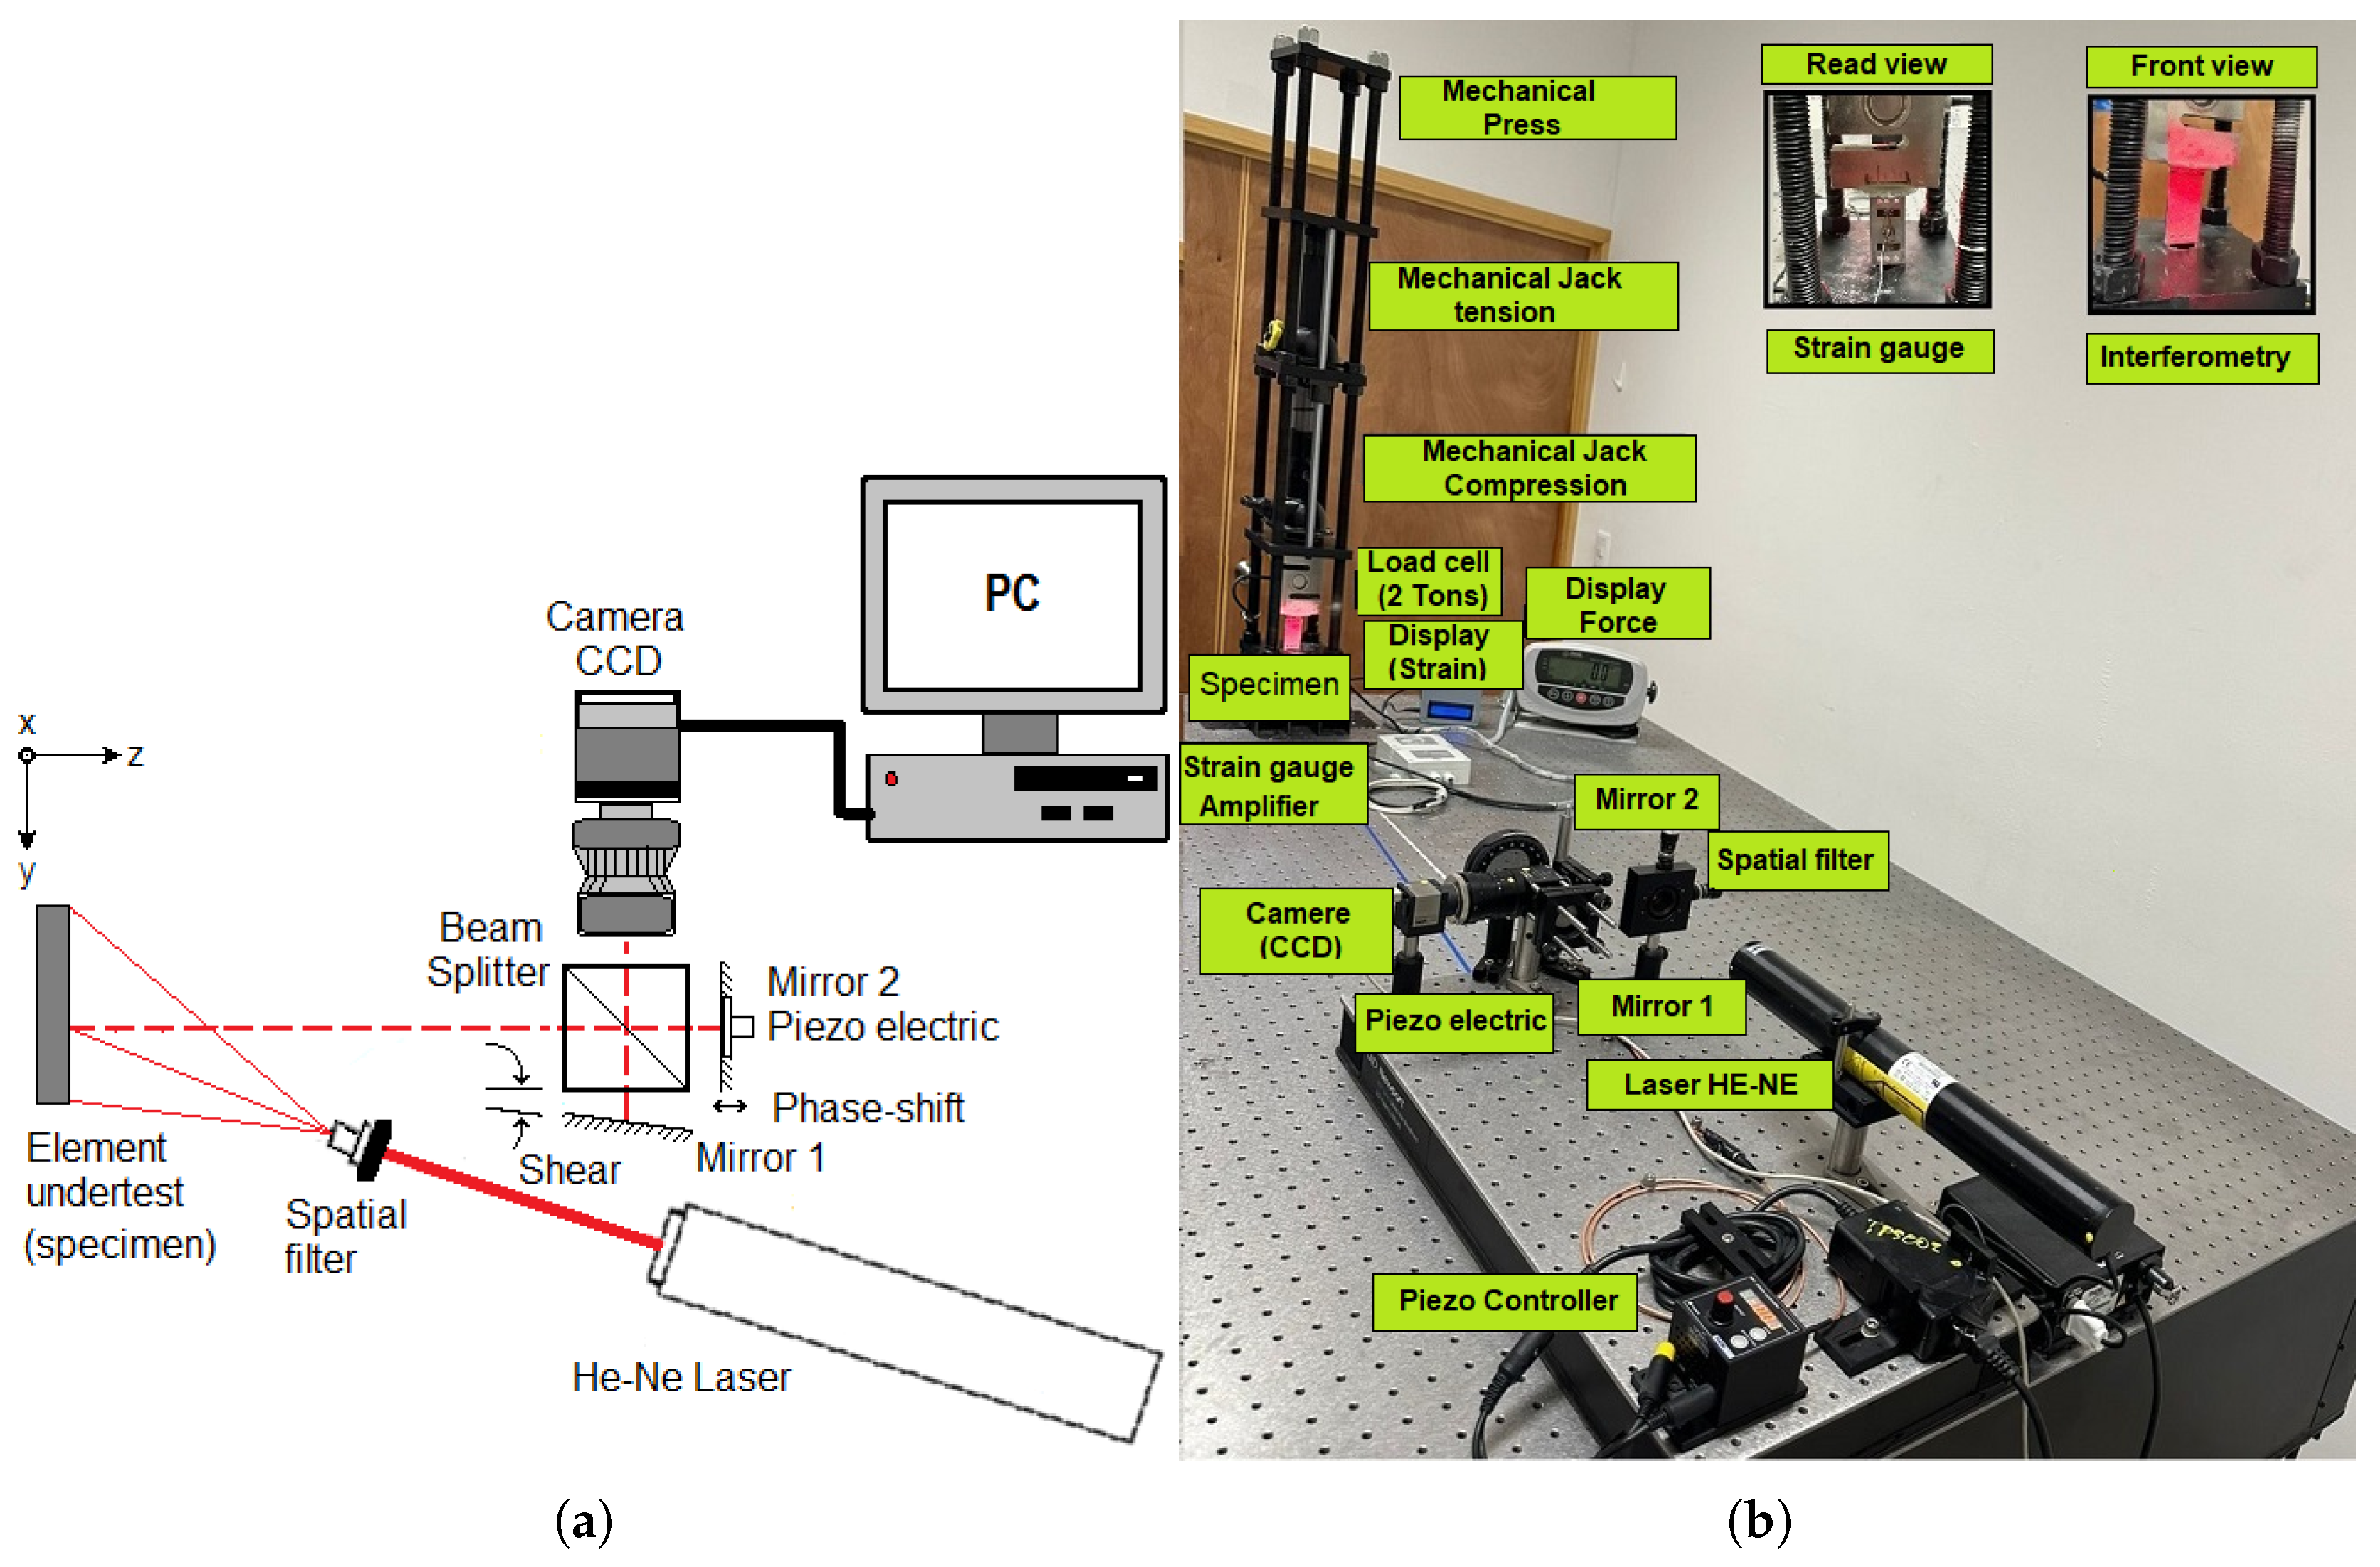
The optical diagram of the shearing interferometer used is observed in Figure 5a, and consists of a 5 mW He-Ne laser (Thorlabs HNL050L), coupled to a Michelson-type configuration and a spatial filtering system to divergent light and fully illuminate the surface under test. The Michelson configuration contains two mirrors: the first mirror (Mirror 1), which acts as a shear tuner (in this case in the vertical Y direction), as well as a second mirror (Mirror 2), which acts as a phase shift tuner, by means of a piezoelectric attached to the mirror. In addition to a beam splitter cube (50:50), which allows light to be distributed between the two mirrors, subsequently joining both light beams at the splitter output, where the optical interference phenomenon occurs. Finally, there is a CCD camera to capture each interferogram or interference photograph. Figure 5b shows a photograph of the complete experimental setup, with the mechanical press incorporated into the optical interferometer. The mechanical press is equipped with two 2-ton jacks and a 2-ton load cell. Forces ranging from 0 to 2 tons can be applied to the press in both directions (tension and compression).
Figure 5.
Shearing interferometer applied to measure compression deformations which are applied to rectangular metal pieces: (a) optical diagram and (b) picture of the experiment.
Laser-frequency noise does not necessarily impose a significant phase-noise floor in a shearing interferometer if the two interfering beams have nearly equal optical path lengths. However, frequency drift can eventually contribute to the phase error during the four sequential phase-shifted exposures included in this work, if in any of the experiments this case is detected, then the following expression can quantify the fluctuation [25]:
where , , c and are the optical path difference between the two interfering beams, the laser-frequency fluctuation, the speed of light in vacuum, and the phase fluctuation or phase error produced by variations in the laser frequency, respectively. It is worth noting that the temperature remained constant at 22.5 °C throughout the experiment; this falls within the laser’s operating parameters and does not induce thermal expansion in the samples being analyzed.
3. Results
To analyze compression forces, 4 pieces of metal structure made of different materials from the automotive and aerospace industries (4041 carbon steel, 1045 steel, 304 stainless steel, and 6061 aluminum) were assembled between two fixed planes. A 2-ton mechanical jack was installed in the first plane to apply compressive force (0 to 2453 N) during different stages of the experiment.
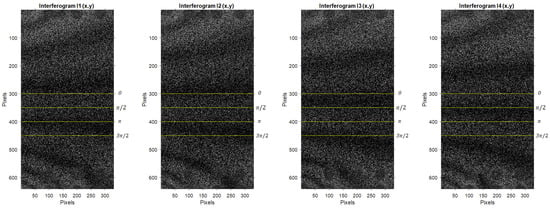
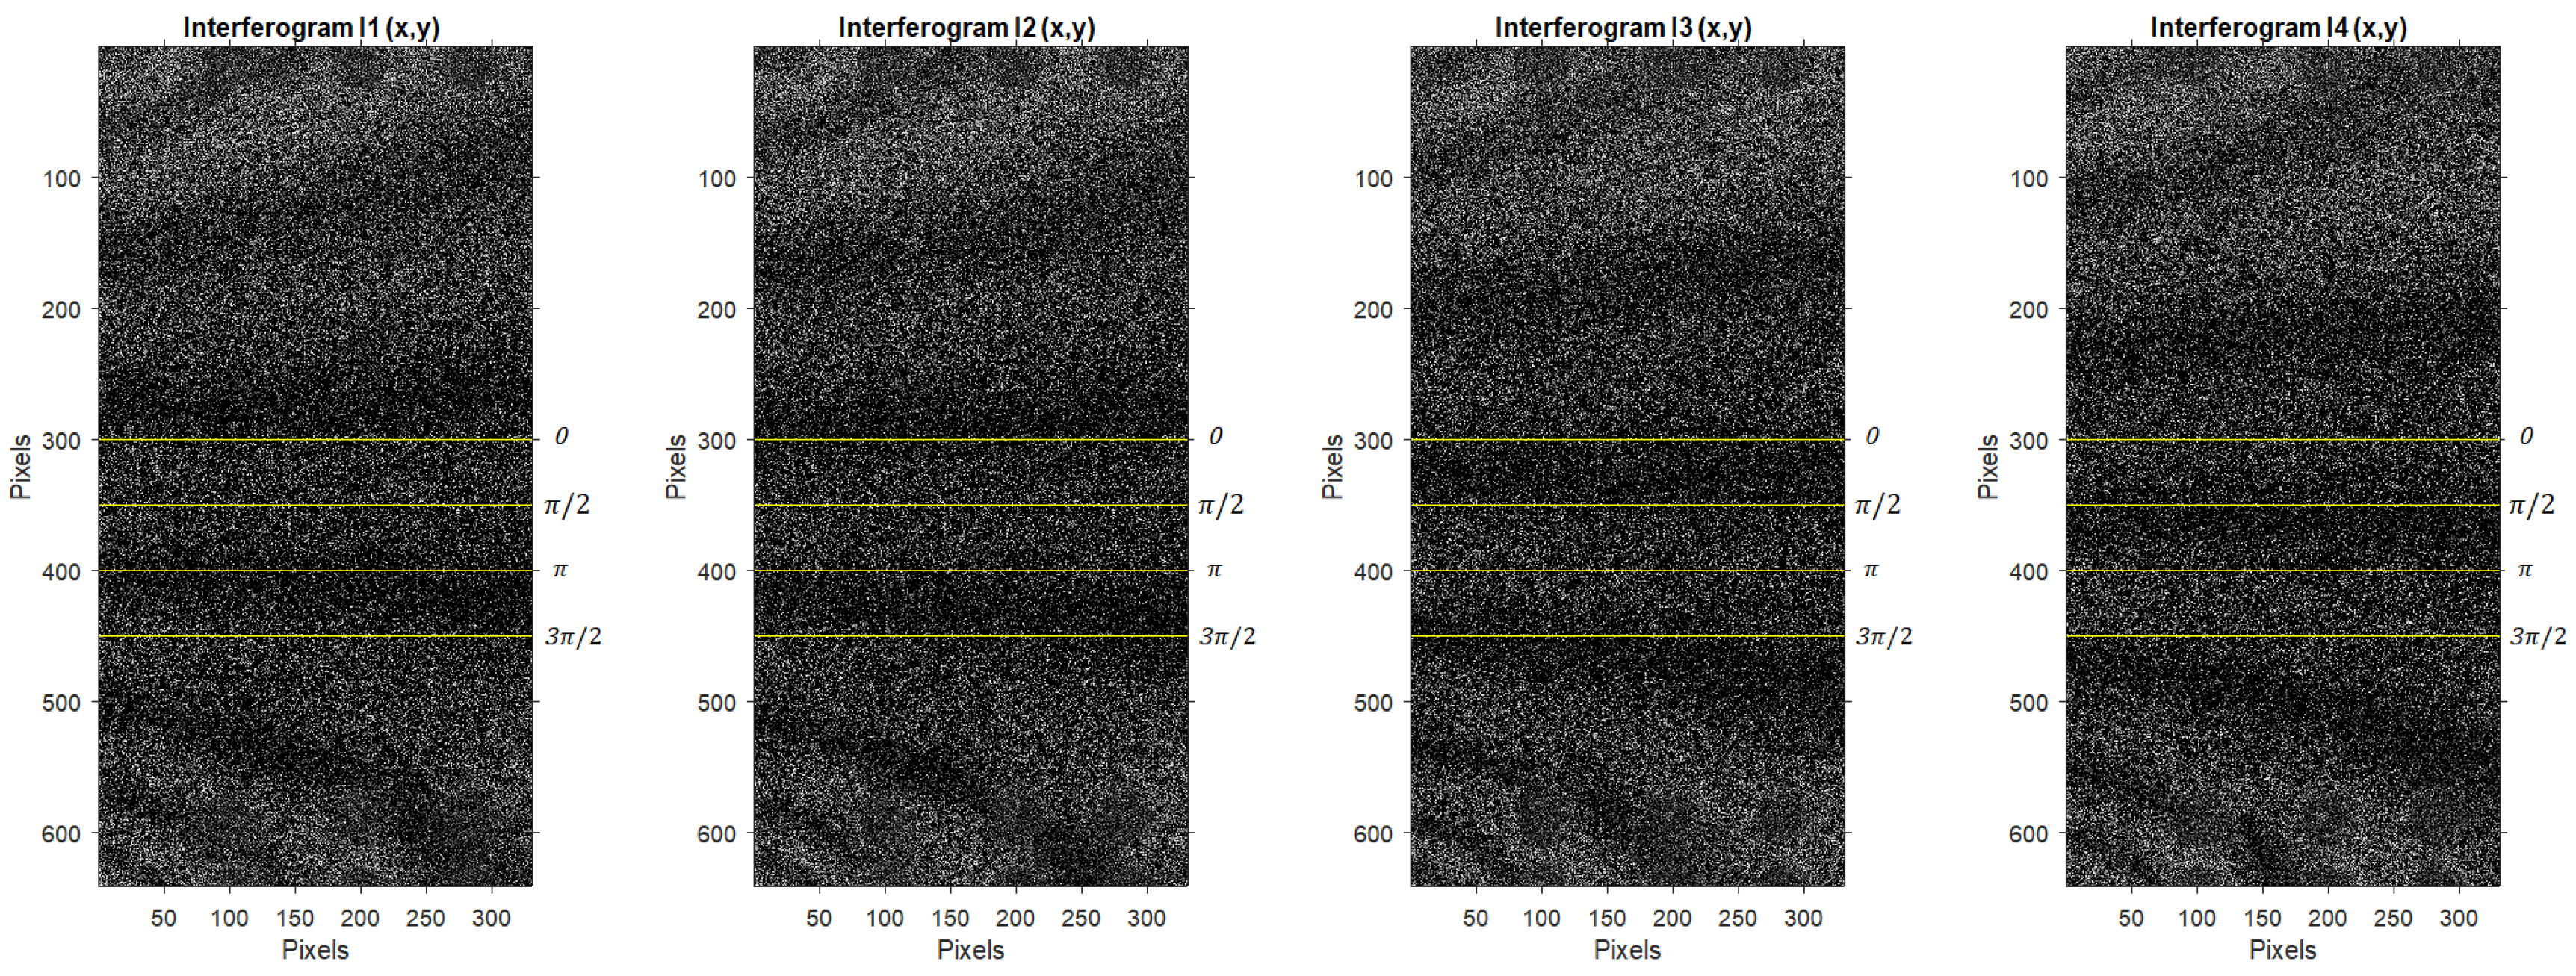
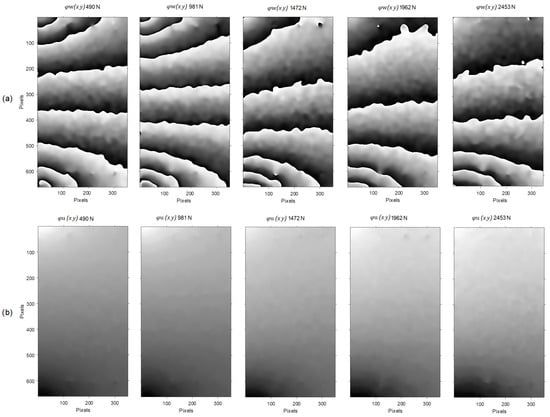
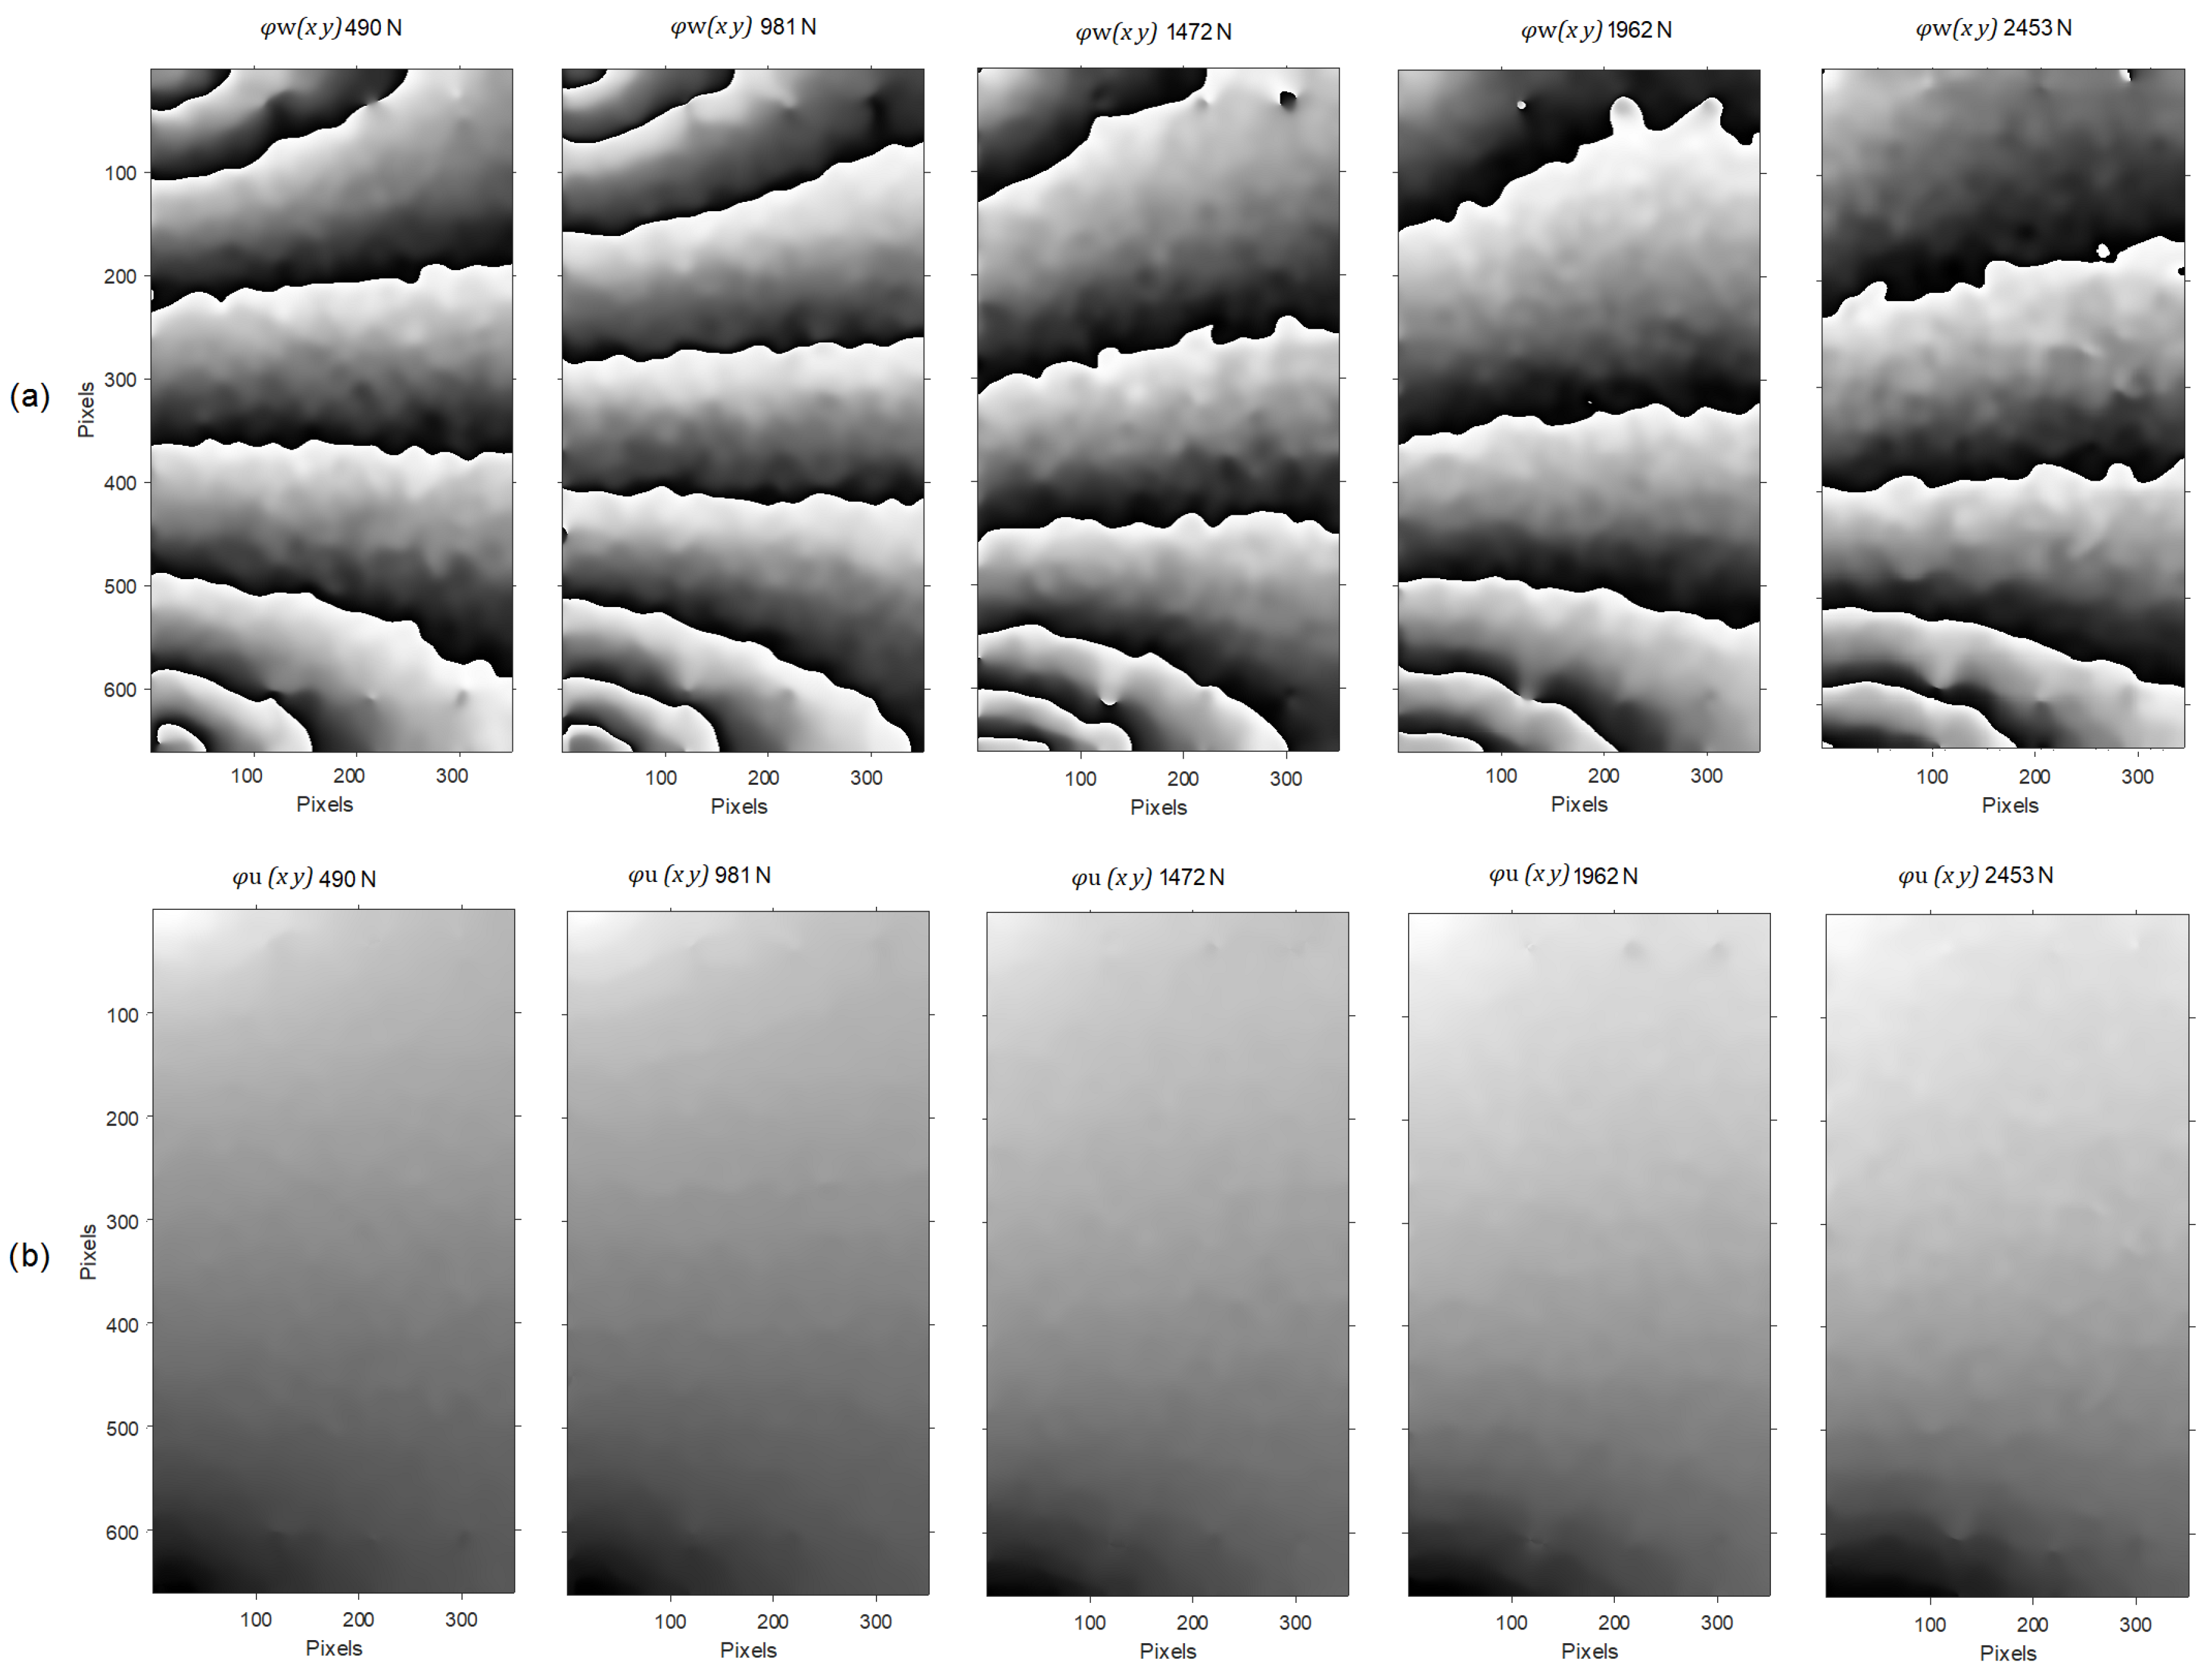
The objects under test (samples or specimens) will be placed at the bottom of the press, in series with a load cell, the latter to accurately monitor the force applied by the mechanical jack, as shown at the bottom of Figure 5b. When compression mechanical stress is applied to the element under test (6061 Aluminum) using a shear of 8mm in Y (vertical direction), it is capable of producing interference fringes, as the interferogram shows in Figure 6. By applying voltage to the piezoelectric system, other phase-shifted interferograms were obtained, that is , and , respectively. With the four interferograms, the wrapped phase expressed in Equation (6) was obtained, which is observed in Figure 7a. The unwrapped phase is obtained by applying the least squares phase unwrap algorithm to ; then the unwrapped phase of sample 4041 is shown in Figure 7b.
Figure 6.
Phase shift to Aluminum with an applied force of 981 N. Four interferograms , , and are obtained at four phase steps and , respectively.
Figure 7.
Deformation of 6061 aluminum, with force increments from 50 kg to 250 kg (491 N–2453 N), respectively, where (a) wrapped phases and (b) unwrapped phases .
The same procedure was performed to obtain the interferograms and their respective phases for the other test elements.
4. Discussion
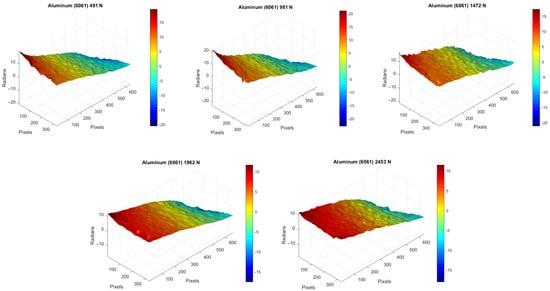
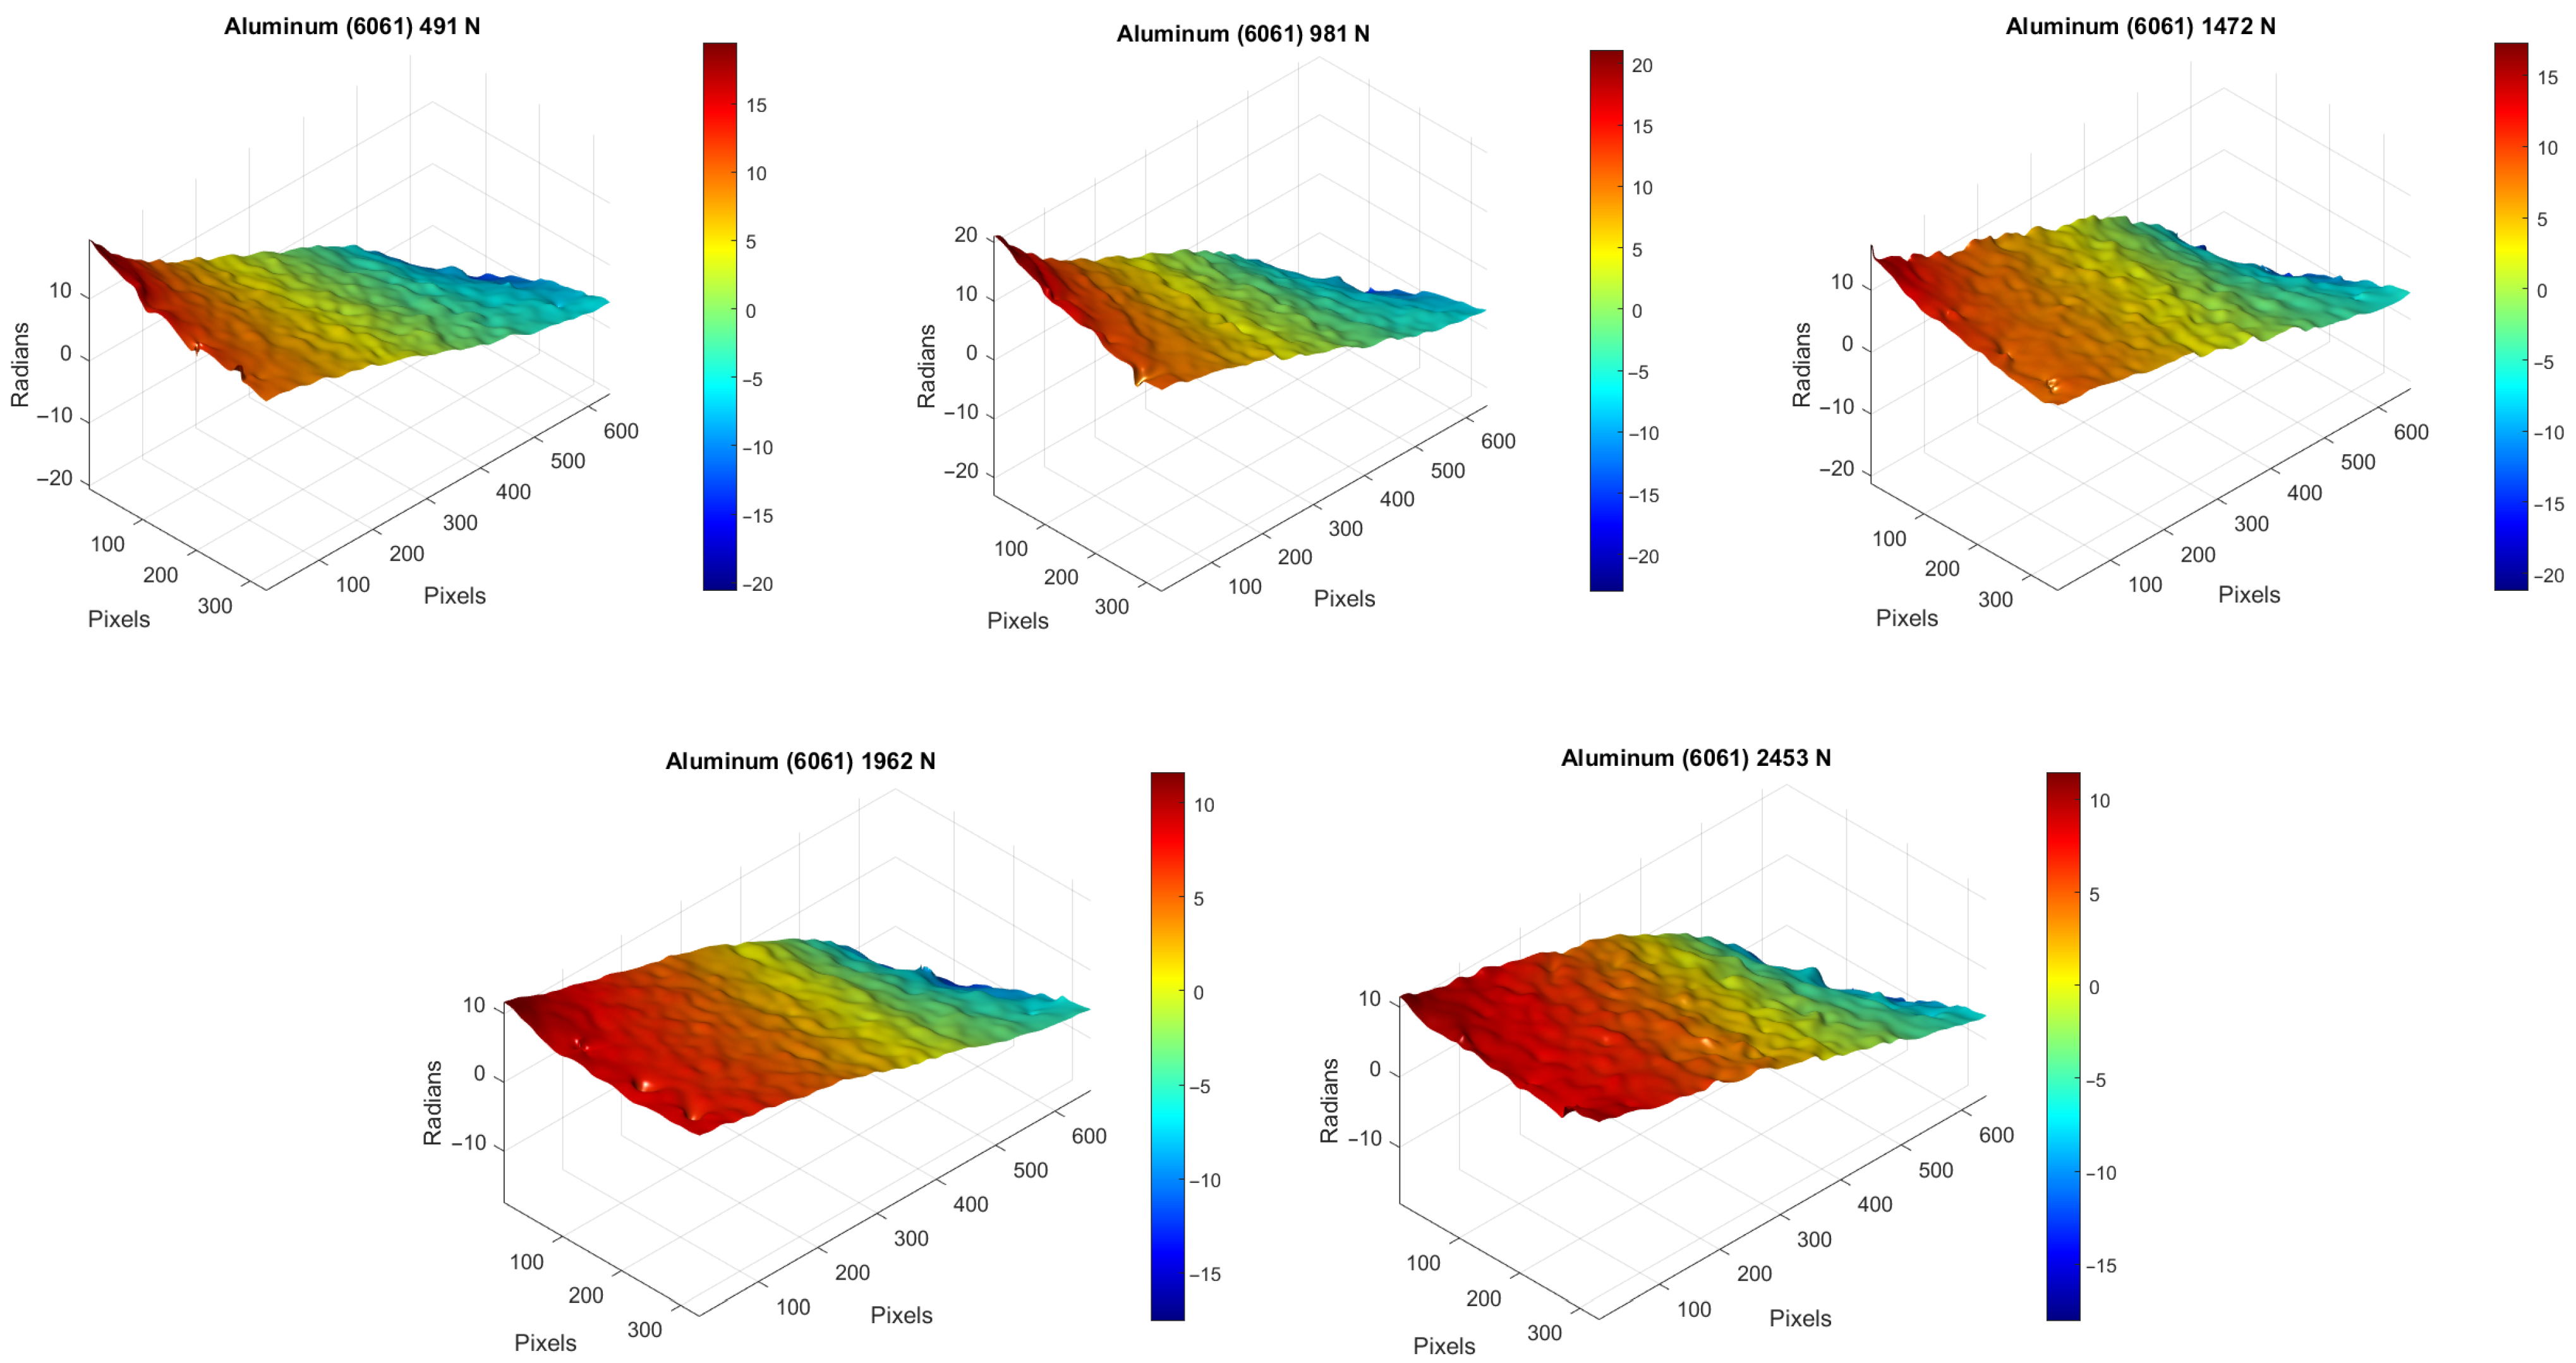
Figure 8 shows the developed phases of the samples subjected to five different forces.
Figure 8.
Unwrapped phases : 3D view of a 6061 aluminum specimen subjected to different mechanical stresses ranging from 491 N to 2453 N.
This stability is evident in the smoothness of the phase curve, compared to the other materials tested, as seen in the data in Table 1.
Table 1.
Comparison across different materials studied with shearing interferometry vs applied force. Here, Max, Min, P-V and SNR as the maximum, minimum, peak-to-valley and signal-to-noise ratio values of the unwrapped phases of the samples, respectively.
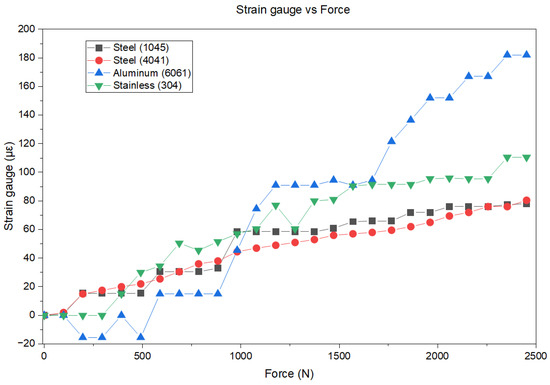
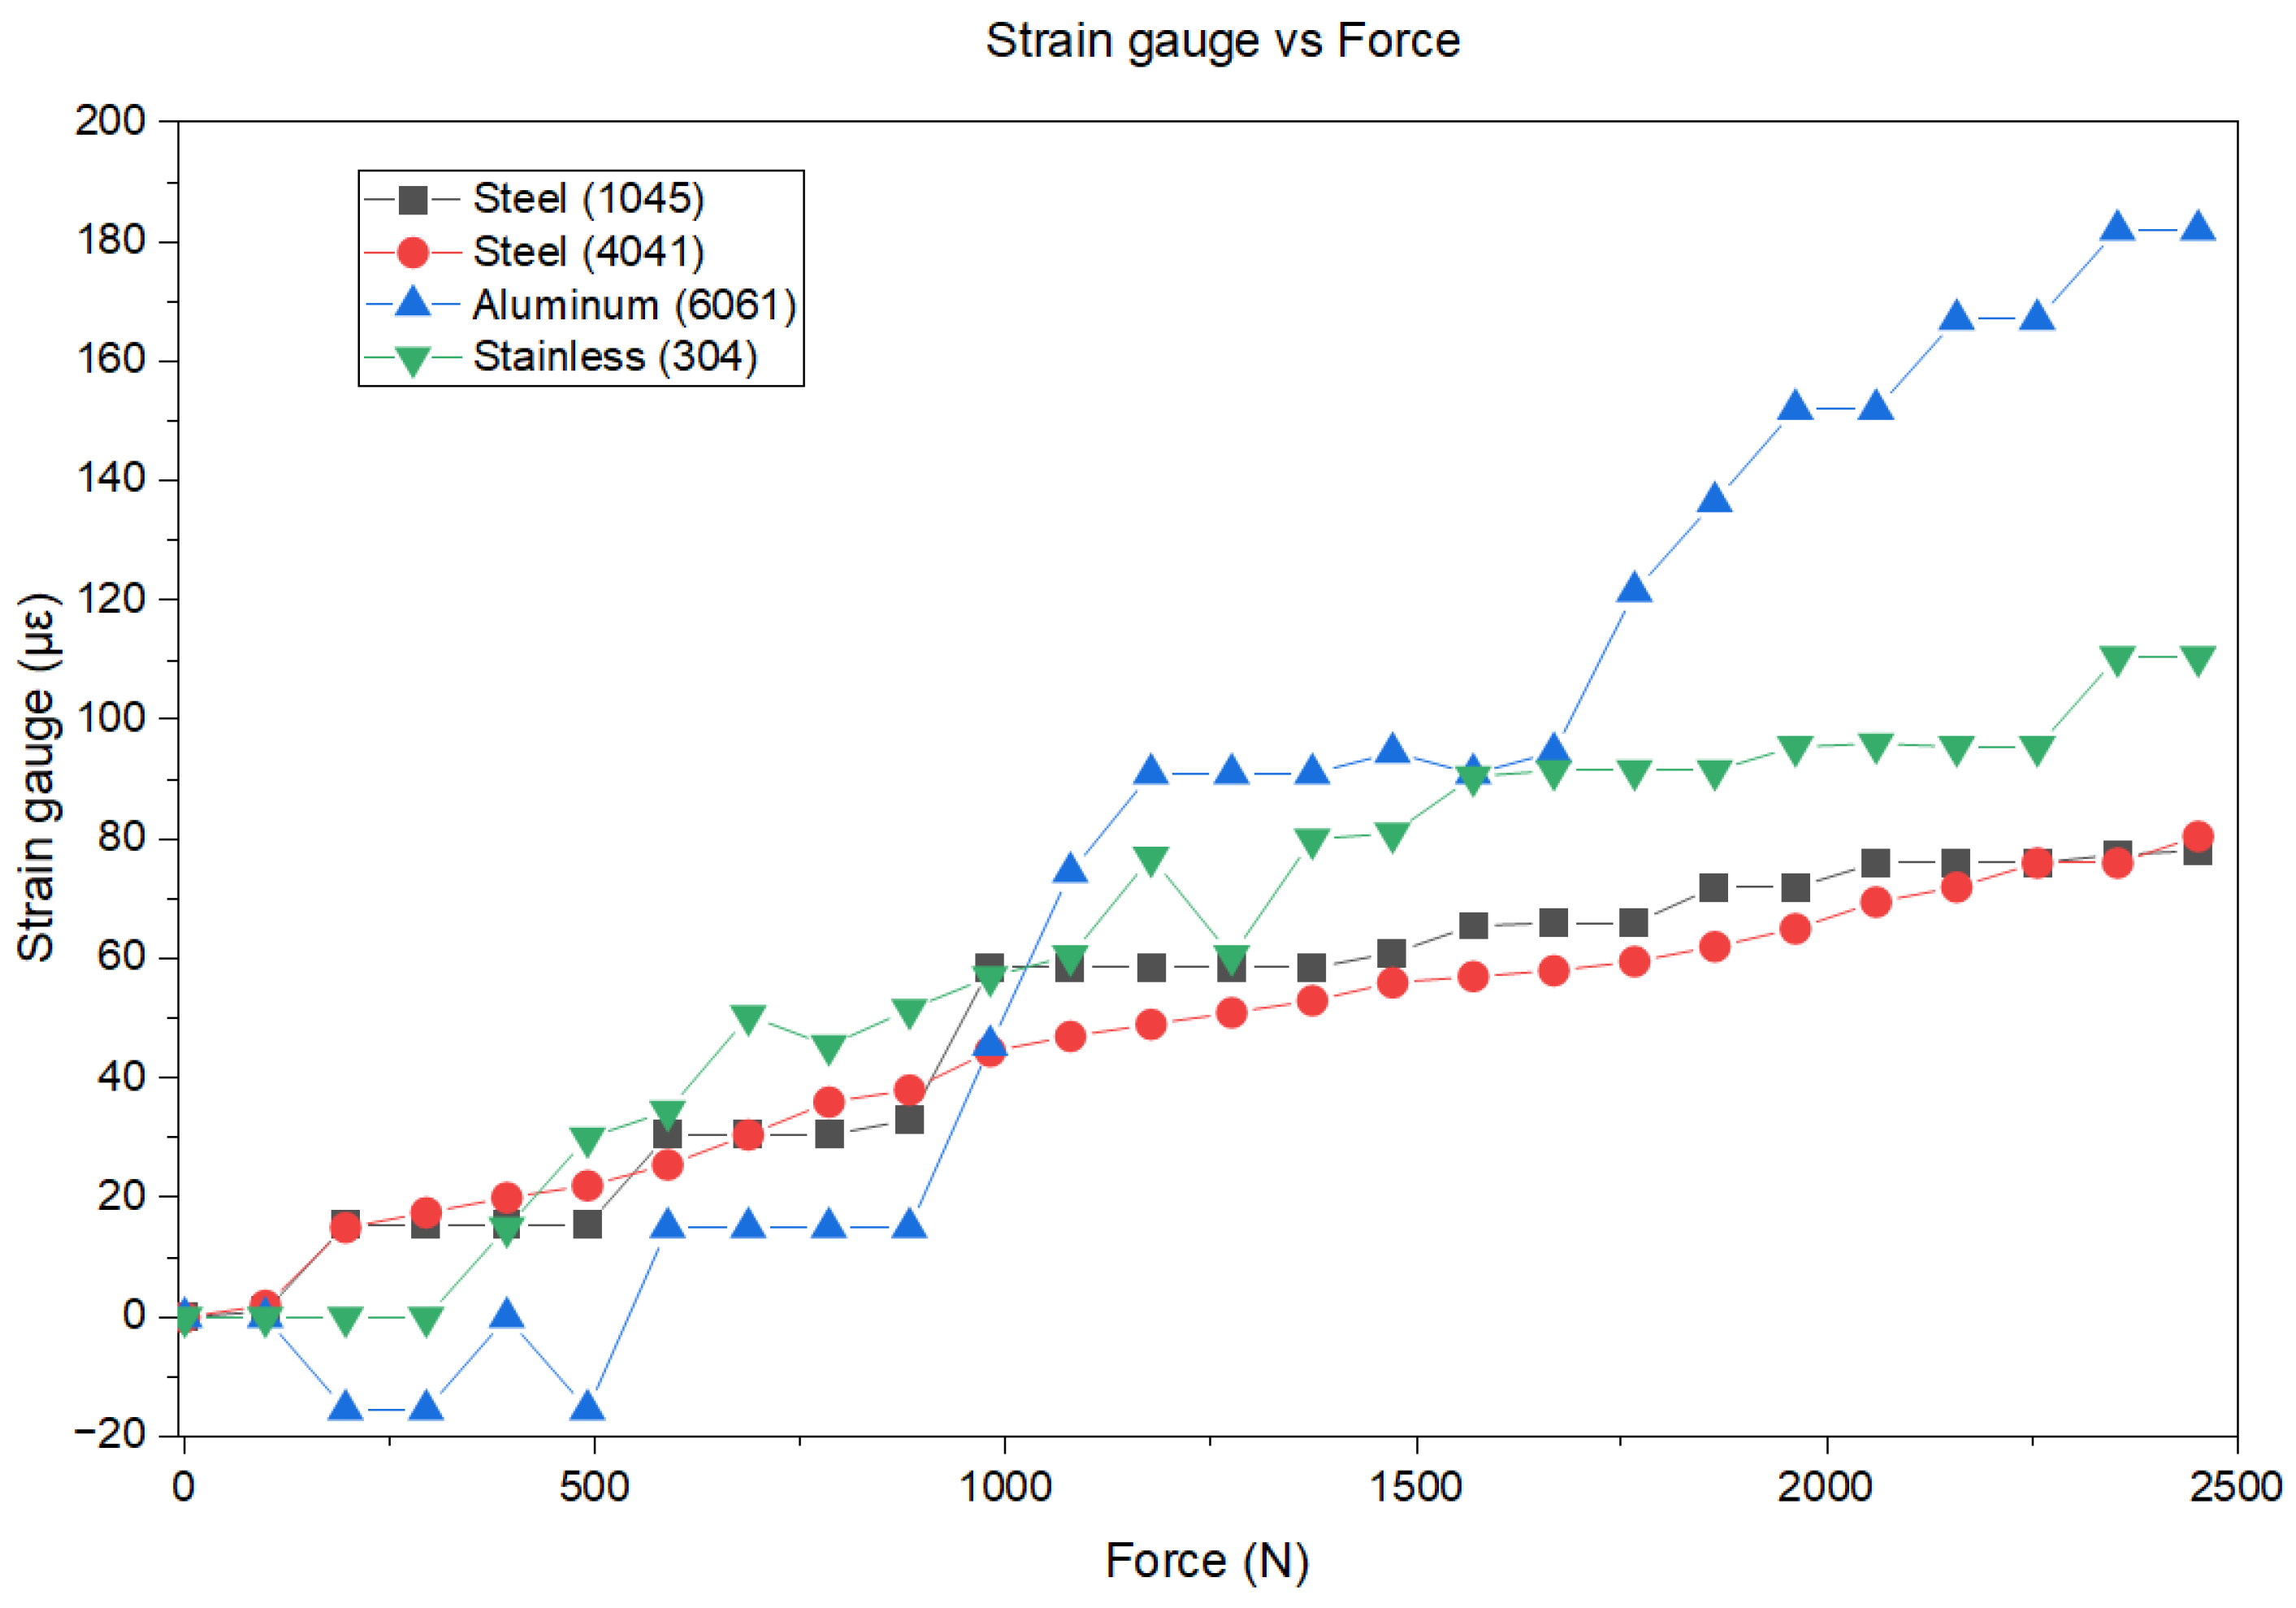
In addition, an analysis of the deformation of the aforementioned materials (steel and aluminum) was carried out using strain gauges, applying compressive forces from 0 to 2453 N, with intervals of approximately ≈98 N (same interval employed in the interferometric tests), as shown in Table 2. When performing the Wheatstone bridge analysis, Figure 9 shows that 6061 aluminum exhibits the greatest deformation compared to the other materials. Carbon steels 4041 and 1045 behave very similarly, while 304 stainless steel shows the most distinct behavior, as expected due to its higher hardness.
Table 2.
Strain measurements for different force values. These values were measured with strain gauges.
Figure 9.
The response of the strain gauges under compressive loading was evaluated over a force range from 0 N to 2453 N, applied in approximately 100 N increments.
Furthermore, it is observed that 4041 carbon steel deforms the least, followed closely by 1045 steel; 304 stainless steel, on the other hand, shows considerable deformation and has a rebound effect as it recovers to the relaxed state when the external force is removed. These data can be corroborated with the statistics in Table 1, noting that the data deviate more for 6061 aluminum and 304 stainless steel, indicating a lower material hardness.
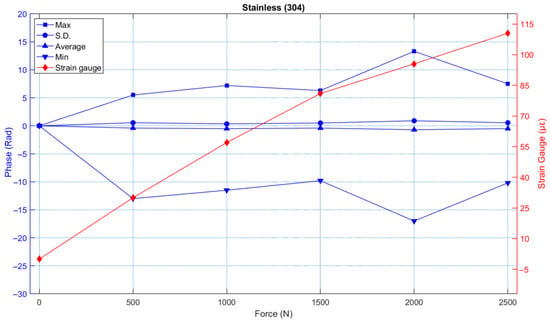
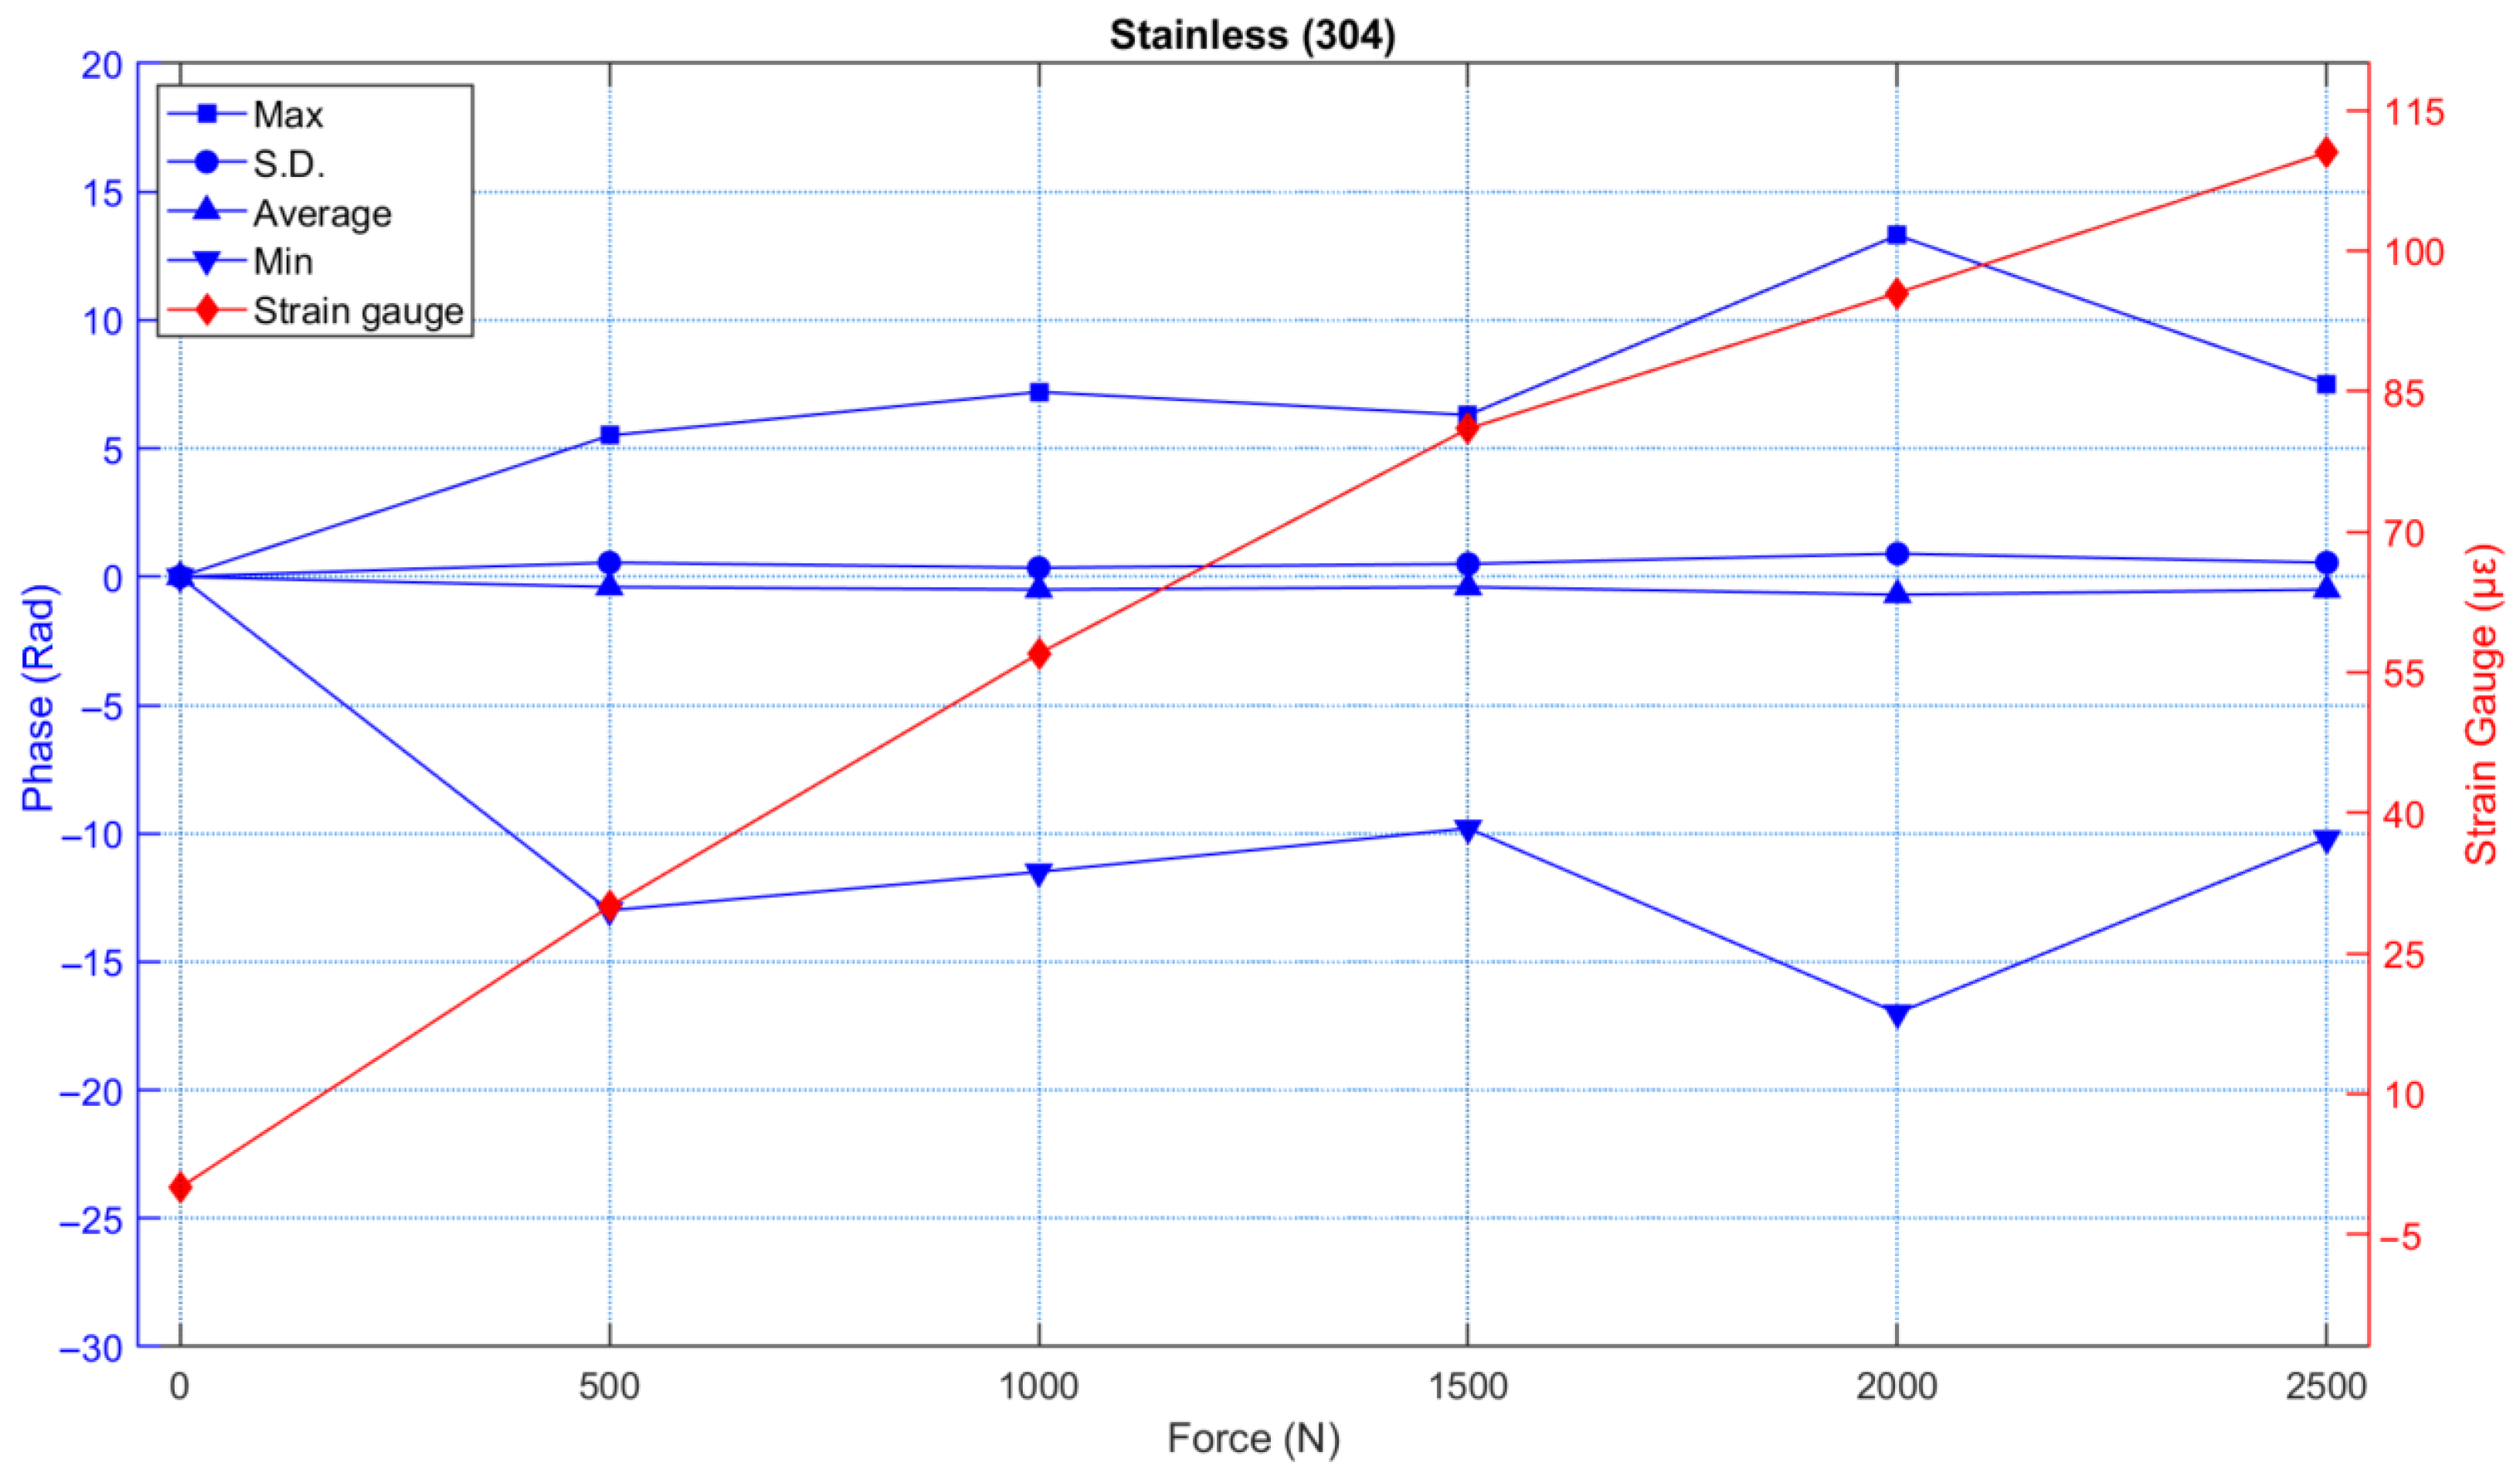
The results of the strain gauges were compared with the average obtained from the phases of the interferometric analysis. Figure 10 shows an example of the behavior of 304 stainless steel. This figure shows that as the material deforms, the strain gauge value increases (see the red graph). However, it is also observed that as the force increases, the phase obtained from the interferograms remains almost constant. This is because the interferometric analysis is performed in 50 kg (491 N) intervals and the experiment is repeated in each of these intervals. Otherwise, the interference fringes would disappear as the compression force increases. The results of these statistics are shown in blue graphs.
Figure 10.
Strain gauge vs. interferometric phase, a test for the 304 stainless. Here, the values of Max, S.D., Average and Min represent the maximum, standard deviation, average and minimum of the values in the developed phases of the sample to be measured.
It should be noted that interference fringes in a shearing interferometer (resulting from speckle) are obtained by subtracting two images: the first serves as the reference, and the second is the sample being measured. In this experiment, all reference images were captured at a load 10 kg (98.1 N) lower than that of the sample being measured; this explains why the deformations observed with the interferometer remain relatively constant in Figure 10.
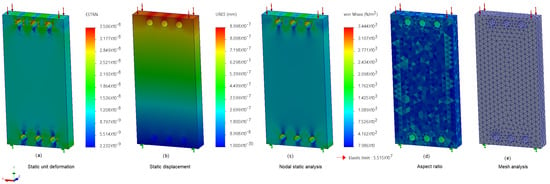
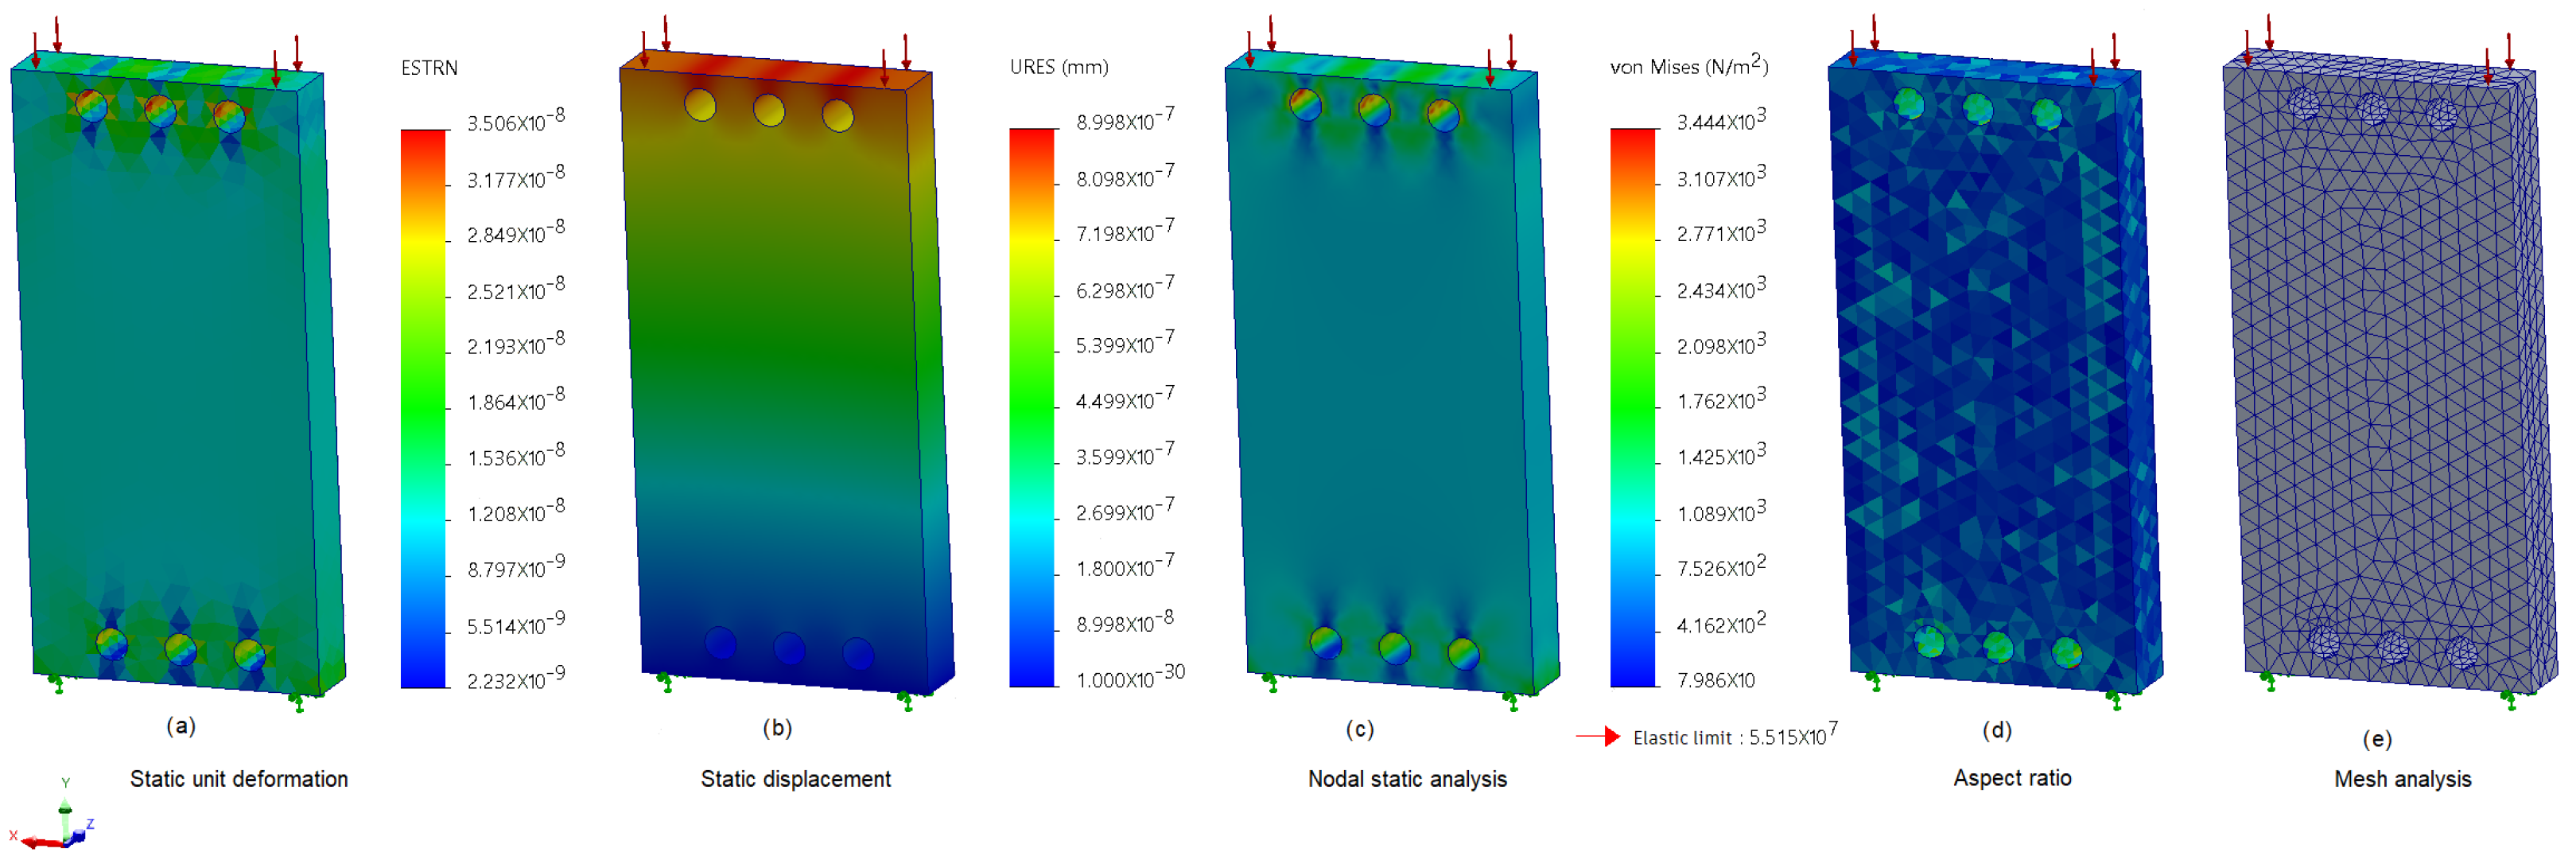
Finally, the compression test was numerically simulated using the SolidWorks Simulation finite element analysis (FEA) module for the 4041 carbon steel specimen, as shown in Figure 11. A compressive load of 50 kg, equivalent to approximately 490.5 N, was applied vertically to the specimen. The corresponding equivalent strain, displacement field, and von Mises stress distribution are presented in Figure 11a–c, respectively. The finite-element mesh was additionally evaluated through the element aspect ratio and mesh distribution, shown in Figure 11d and Figure 11e, respectively. The numerical predictions are consistent with the deformation measured experimentally by both shearing interferometry and the strain gauge configuration. This agreement provides additional validation of the interferometric measurements and confirms the capability of the proposed optical approach to characterize the deformation produced by compressive loading of the 4041 carbon steel specimen. Therefore, the SolidWorks analysis agrees with the interferometric measurement, as it can be observed that the maximum and minimum gradients of Figure 8 occur at the edges, while SolidWorks also achieves maximum and minimum displacements mainly in Figure 11b.
Figure 11.
SolidWorks Simulation finite element analysis of the 4041 carbon steel specimen subjected to a vertical compressive load of 50 kg (490.5 N): (a) equivalent strain; (b) displacement field; (c) von Mises stress; (d) element aspect ratio; and (e) finite-element mesh.
5. Conclusions
When loads are applied to an metal (steel or aluminum for our case), the solid deforms and the effect of the loads is transmitted throughout the metal. Once the external force is no longer applied, these external loads induce internal forces and reactions to bring the solid into a state of equilibrium. In the automotive and aerospace industries, it is important to know the hardness or flexibility of the materials used to manufacture auto or aircraft parts in order to ensure passenger safety, as well as the performance and durability of the vehicle or aircraft being manufactured. Therefore, it is important to understand how each of these materials deforms in order to ensure appropriate application and avoid exceeding the elastic limit of each material.
By applying shearing interferometry, the compressive forces applied to each of the elements under test can be clearly observed. For this study, the following metals were used: 4041 carbon steel, 1045 steel, 304 stainless steel, and 6061 aluminum. Furthermore, with this method, it is possible to analyze the phase deformation, in 2D or 3D, of each of the metal parts and thus observe the effects of compression over each material. It was observed that with shearing interferometry, deformations can be observed with a resolution in the order of the wavelength used in the interferometer (632.8 nm of a He-Ne laser).
Strain gauges, by their nature as transducers, indicate (electrically) how the object under test is deforming and provide a 1D view of what happens to the metal part when an external force is applied. However, with gauges, the behavior of the metal plate cannot be seen in 2D or 3D, unlike with interferometric analysis. Furthermore, the resolution depends on the quality of the gauge and the electrical arrangement used. In this work, the resolution of the gauges is lower than that of interferometric analysis. However, it is very interesting to have both methods simultaneously, i.e., both interferometry and bridges with gauges, which complement the study of metal deformation commonly used in the automotive or aerospace industries.
Linear static analysis calculates displacements, strains, stresses, and reaction forces under the effect of applied loads, where SolidWorks software helps to evaluate different methods or analysis as static unit deformation and displacement, nodal static and mesh analysis, as well as the aspect ratio. These types of simulations greatly help us understand what happens internally within the analyzed samples.
Author Contributions
Conceptualization, E.J.R.-O., M.M.-G.; methodology, E.J.R.-O., F.G.P.-L., J.M.-M., F.J.C.-R., S.A.-R. and M.M.-G.; software, E.J.R.-O., F.G.P.-L., J.M.-M. and M.M.-G.; validation, E.J.R.-O., F.G.P.-L., J.M.-M., F.J.C.-R., S.A.-R. and M.M.-G.; formal analysis, E.J.R.-O., F.G.P.-L., J.M.-M., S.A.-R. and M.M.-G.; investigation, E.J.R.-O., F.G.P.-L., J.M.-M., F.J.C.-R., S.A.-R. and M.M.-G.; resources, E.J.R.-O., F.J.C.-R. and M.M.-G.; data curation, E.J.R.-O., F.G.P.-L., J.M.-M., S.A.-R. and M.M.-G.; writing—original draft preparation, E.J.R.-O., F.G.P.-L., J.M.-M., F.J.C.-R., S.A.-R. and M.M.-G.; writing—review and editing, E.J.R.-O., F.G.P.-L., J.M.-M., F.J.C.-R., S.A.-R. and M.M.-G.; visualization, E.J.R.-O., F.G.P.-L., J.M.-M., S.A.-R. and M.M.-G.; supervision, E.J.R.-O., F.G.P.-L., J.M.-M., F.J.C.-R., S.A.-R. and M.M.-G. All authors have read and agreed to the published version of the manuscript.
Funding
The authors acknowledge the financial support from the "Programa de Apoyo a la mejora en las condiciones de producción de los miembros del SNII y SNCA" (PROSNII 2025 and 2026) grants 282877 and 289517, respectively.
Data Availability Statement
The original contributions presented in the study are included in the article; further inquiries can be directed to the corresponding author or the rest of the authors.
Acknowledgments
The authors also express their gratitude to both the Rector’s Office and the Research and Postgraduate Coordination of CULagos for the efforts made to obtain the financial resources in order to pay this publication. And MEng. Ernesto J. Ruiz Ortega would also like to acknowledge financial support through a SECIHTI scholarship, CVU 472092.
Conflicts of Interest
The authors declare no conflicts of interest.
Abbreviations
The following abbreviations are used in this manuscript:
| DPSSI | Digital Phase-Shifting Shearing Interferometry |
| ESSPI | Electronic Speckle Shearing Pattern Interferometry |
| FMCW | Frequency-Modulated Continuous-Wave |
| He-Ne | Helium Neon |
| laser | Light Amplification by Stimulated Emission of Radiation |
| MEMS | Micro Electro-Mechanical Systems |
| ppm | parts per million |
| PSI | Phase Shifting Interferometry |
| 1D | one dimension |
| 2D | two dimensions |
| 3D | three dimensions |
References
- Callister, W.D.; Rethwisch, D.G. Materials Science and Engineering: An Introduction, 10th ed.; Wiley: Hoboken, NJ, USA, 2018. [Google Scholar]
- Strojnik, M.; Páez, G.; Mantravadi, M.V. Chapter 4. Lateral Shearing Interferometers. In Optical Shop Testing, 3rd ed.; Malacara, D., Ed.; John Wiley & Sons, Inc.: Hoboken, NJ, USA, 2007; pp. 122–184. [Google Scholar]
- Hecht, E. Optics, 5th ed.; Pearson Education Limited: Essex, UK, 2017; pp. 398–456. [Google Scholar]
- Owner-Petersen, M. Digital speckle pattern shearing interferometry: Limitations and prospects. Appl. Opt. 1991, 30, 2730–2738. [Google Scholar] [CrossRef] [Scilit]
- Casillas, F.J.; Davila, A.; Rothberg, S.J.; Garnica, G. Small amplitude estimation of mechanical vibrations using electronic speckle shearing pattern interferometry. Opt. Eng. 2004, 43, 880–887. [Google Scholar] [CrossRef] [Scilit]
- Blum, T.; Pouet, B.; Breugnot, S.; Clémenceau, P. Non-destructive testing using multi-channel random-quadrature interferometer. In AIP Conference Proceedings, Review of Quantitative Nondestructive Evaluation; American Institute of Physics: College Park, MD, USA, 2008; Volume 27, CP975, pp. 239–246. [Google Scholar]
- Francis, D. Chapter 4. Non-destructive evaluation (NDE) of composites: Introduction to shearography. In Non-Destructive Evaluation (NDE) of Polymer Matrix Composites; Karbhari, V.M., Ed.; Woodhead Publishing: Cambridge, UK, 2013; pp. 56–83. [Google Scholar]
- Yan, P.; Wang, Y.; Sun, F.; Lu, Y.; Liu, L.; Zhao, Q. Shearography for non-destructive testing of specular reflecting objects using scattered light illumination. Opt. Laser Technol. 2019, 112, 453–457. [Google Scholar] [CrossRef] [Scilit]
- Sun, B.; Zheng, G.; Zhang, X. Application of contact laser interferometry in precise displacement measurement. Measurement 2021, 174, 108959. [Google Scholar] [CrossRef] [Scilit]
- Ruiz-Ortega, E.J.; Casillas Rodriguez, F.J.; Muñoz-Maciel, J.; Peña-Lecona, F.G.; Mora-Gonzalez, M. Chapter 15. Measure Deformations in Materials Applied Interferometry and Mechanical Sensors. In Complex Systems and Their Applications; Tlelo-Cuautle, E., Campos-Canton, E., Gilardi-Velazquez, H.E., Huerta-Cuellar, G., Eds.; Springer Nature: Cham, Switzerland, 2025; pp. 295–311. [Google Scholar]
- Ruiz-Ortega, E.J.; Casillas-Rodriguez, F.J.; Peña-Lecona, F.G.; Muñoz-Maciel, J.; Mora-Gonzalez, M. Analysis of electrical insulator using optical interferometry. In Proceedings of the 2025 IEEE International Autumn Meeting on Power, Electronics and Computing (ROPEC), Ixtapa, Mexico, 12–14 November 2025; pp. 1–6. [Google Scholar]
- Yang, L.X.; Hung, Y.Y. Digital sherography for nondestructive evaluation and application in automotive and aerospace industries. In Proceedings of the 16th World Conference on NDT, Montreal, QC, Canada, 30 August–3 September 2004. ID534. [Google Scholar]
- Zhao, Q.; Dan, X.; Sun, F.; Wang, Y.; Wu, S.; Yang, L. Digital Shearography for NDT: Phase Measurement Technique and Recent Developments. Appl. Sci. 2018, 8, 2662. [Google Scholar] [CrossRef] [Scilit]
- Hernandez, F.C.R.; Ramírez, J.M.H.; Mackay, R. Al-Si Alloys. Automotive, Aeronautical, and Aerospace Applications; Springer International Publishing AG: Cham, Switzerland, 2017; pp. 163–171. [Google Scholar]
- Li, S.; Yue, X.; Li, Q.; Peng, H.; Dong, B.; Liu, T.; Yang, H.; Fan, J.; Shu, S.; Qiu, F.; et al. Development and applications of aluminum alloys for aerospace industry. J. Mater. Res. Technol. 2023, 27, 944–983. [Google Scholar] [CrossRef] [Scilit]
- Balakrishnan, T.S.; Sultan, M.T.H.; Shahar, F.S.; Saravanakumar, Y.N.; Chandran, N.K. Chapter 7. Aerospace steel: Properties, processing, and applications. In Aerospace Materials; Sultan, M.T.H., Uthayakumar, M., Korniejenko, K., Mashinini, P.M., Najeeb, M.I., Krishnamoorthy, R.R., Eds.; Elsevier: Amsterdam, The Netherlands, 2025; pp. 275–290. [Google Scholar]
- Why Steel Is the Backbone of the Automotive Industry! Available online: https://steelandpipesupply.com/blogs/news/steel-in-automotive-industry (accessed on 11 October 2025).
- Types of Automotive Steel and Their Usage in Modern Vehicles. Available online: https://proleantech.com/automotive-steel-and-usage/ (accessed on 11 October 2025).
- Mora González, M. Metrología óptica, el arte de medir sin tocar. In Ciencia en CULagos. Un Acercamiento al Interior del Ámbito Científico en la Atenas de Jalisco; Aparicio Fernández, M.R., Mejía Sánchez, J.E., Mesa Cornejo, V.M., Eds.; CULagos Ediciones: Lagos de Moreno, Mexico, 2021; pp. 135–147. [Google Scholar]
- Sirohi, R.S. (Ed.) Chapter 4. Interferometry, Introduction to Optical Metrology, 2nd ed.; CRC Press: Boca Raton, FL, USA, 2015; pp. 85–108. [Google Scholar]
- Alzate, E.J.; Ocampo, J.W.M.; Ortega, C.A.S. Medidores de deformación por resistencia: Galgas extensiométricas. Sci. Tech. 2007, 13, 7–12. [Google Scholar]
- Beer, F.P.; Johnston, E.R., Jr.; DeWolf, J.T.; Mazurek, D.F. Mecánica de Materiales, 6th ed.; McGraw-Hill: Ciudad de México, Mexico, 2009; pp. 42–50. [Google Scholar]
- Murray, W.M.; Miller, W.R. The Bonded Electrical Resistance Strain Gage: An Introduction; Oxford University Press: New York, NY, USA, 1992; pp. 157–172. [Google Scholar]
- Quintanar-Sotelo, C.O.; Casillas-Rodriguez, F.J.; Muñoz-Maciel, J.; Peña-Lecona, F.G.; Mora-Gonzalez, M. Enhanced frequency-guided method with particle swarm optimization for the phase recovery of a single interferogram. Appl. Sci. 2023, 13, 11969. [Google Scholar] [CrossRef] [Scilit]
- Schreiber, H.; Bruning, J.H. Chapter 14. Phase Shifting Interferometry. In Optical Shop Testing, 3rd ed.; Malacara, D., Ed.; John Wiley & Sons, Inc.: Hoboken, NJ, USA, 2007; pp. 547–666. [Google Scholar]
- Ghiglia, D.C.; Romero, L.A. Robust two-dimensional weighted and unweighted phase unwrap-ping that uses fast transforms and iterative methods. J. Opt. Soc. Am. A 1994, 11, 107–117. [Google Scholar] [CrossRef] [Scilit]
- Khan, N.Z.; Ul Islam, S.S.; Khan, M.M.; Siddiquee, A.N. Chapter 11.02. Steel heat treatment: Equipment and process design. In Comprehensive Materials Processing, 2nd ed.; Hashmi, S., Ed.; Elsevier: Dublin, Ireland, 2024; pp. 7–24. [Google Scholar]
- Window, A.L.; Holister, G.S. Strain Gauge Technology; Applied Science Publishers Ltd.: London, UK, 1982; pp. 11–18. [Google Scholar]

Disclaimer/Publisher’s Note: The statements, opinions and data contained in all publications are solely those of the individual author(s) and contributor(s) and not of MDPI and/or the editor(s). MDPI and/or the editor(s) disclaim responsibility for any injury to people or property resulting from any ideas, methods, instructions or products referred to in the content. |
© 2026 by the authors. Licensee MDPI, Basel, Switzerland. This article is an open access article distributed under the terms and conditions of the Creative Commons Attribution (CC BY) license.