


Abstract
Background and Aims: Patients with acute coronary syndrome (ACS) treated with percutaneous coronary intervention (PCI) have a residual risk of adverse events and all-cause mortality. Machine learning (ML) approaches may help integrate clinical, functional, and lifestyle information for risk assessment. This study aimed to develop and externally evaluate models for predicting all-cause mortality in patients enrolled in cardiac rehabilitation after PCI for ACS. Methods and Results: Data from 1261 patients (mean age 61 ± 11.1 years, 16.6% women) enrolled in cardiac rehabilitation after PCI for ACS were analysed using seven prediction algorithms and repeated stratified cross-validation. External validation was performed using the EU-CaRE dataset of 1386 patients and predictions were explained using the model-agnostic SHapley Additive exPlanation (SHAP) methodology. LightGBM and Random Forest achieved the highest AUC and balanced accuracy (mean AUC > 0.8). SVM also exceeded logistic regression on AUC, though logistic regression remained competitive. LightGBM achieved a balanced accuracy of 0.87, sensitivity of 0.86, and specificity of 0.88. External evaluation yielded sensitivity of 0.78 and specificity of 0.73 in the PCI-treated cohort; specificity was 0.60 in the broader CAD cohort. After omission of predictors unavailable in EU-CaRE, the AUC was 0.816 with seven and 0.812 with six predictors. The highest SHAP values for impact on the model were detected for the variables “diabetes”, “physical exercise capacity (METs achieved during stress test)”, “average daily sitting duration”, “statin use”, “history of family heart disease”, “number of affected vessels”, “revascularization history”, “serum creatinine levels”, and “chronic hepatopathy”. The model was rated as “neutral” using the independent validation screening tool. Conclusions: ML models showed potential for predicting all-cause mortality in patients enrolled in cardiac rehabilitation after PCI for ACS. After prospective validation and assessment of clinical utility, the model may support clinicians in identifying patients at higher risk who could benefit from intensified treatment and lifestyle interventions. The small number of deaths and limitations of the evaluation procedure warrant cautious interpretation.
1. Introduction
Acute coronary syndrome (ACS), including ST-elevation myocardial infarction (STEMI), non-ST elevation myocardial infarction (NSTEMI), and unstable angina, represents a significant public health concern due to associated morbidity and mortality rates [1,2]. Percutaneous coronary intervention (PCI) has emerged as the predominant treatment strategy for ACS, significantly improving immediate and long-term outcomes [3,4]. Following PCI for ACS, patients remain at risk of adverse events associated with both clinical and procedural factors [5]. Importantly, adverse events and all-cause mortality continue to occur even among patients enrolled in cardiac rehabilitation after ACS [6]. Risk stratification at the start of rehabilitation may therefore help identify patients who could benefit from closer follow-up and individualized secondary prevention, including remote monitoring where appropriate.
Traditional statistical risk assessment models are incapable of incorporating the complex and dynamic nature of post-intervention conditions as they have not been designed to factor the impact of treatments administered during hospital stays as well as occurrence of or changes in comorbidities such as heart failure, diabetes, and chronic kidney disease [7]. In recent years, machine learning (ML) has shown promising results in harnessing this complexity, offering a novel approach to adaptive risk stratification by unbiased learning from complex clinical data and identifying patterns not readily apparent to traditional statistical methods. In cardiovascular medicine, ML models have already demonstrated enhanced predictive accuracy for various outcomes, including mortality [8,9,10,11,12,13].
ML-based models predicting all-cause mortality in ACS patients treated with PCI have not yet reached clinical practice. Three unresolved issues contribute to this gap. First, most models offer limited explainability and act as a “black box” for clinicians, which reduces acceptance. Second, external validation is often missing. Systematic reviews found that only 27% to 55% of ML-based prediction models had been externally validated [14,15]. In cardiovascular risk prediction, all external validations were performed by the original investigators and none independently [14]. Two recent ML models for 1-year mortality after ACS were evaluated only internally [10,13]. In addition, recent ML models for mortality after ACS rely mainly on variables from the acute phase. The most frequent predictors are age, sex, blood pressure, heart rate, Killip class, serum creatinine, blood glucose and haemoglobin [15]. Exercise capacity and sedentary behaviour are rarely considered, although both are strongly associated with mortality [16,17,18].
Currently, most existing scores, including the widely used TIMI (Thrombolysis in Myocardial Infarction) [19], focus on short-term (during hospitalization, up to 30 days) outcomes [11,20,21,22] or specific causes of death [7]. The GRACE (Global Registry of Acute Coronary Events) score [23,24] is another broadly used tool for risk stratification in patients with ACS. While still valuable, it is used in clinical practice to estimate admission to 6-month mortality, and it is based on older treatment standards and patient populations. Significant advances in ACS treatment, evolving patient demographics, improved diagnostic technologies, as well as updated clinical guidelines, highlight the need for potential updates or new risk assessment tools. Entry into cardiac rehabilitation (CR) offers a practical time point for such risk stratification. At this stage, the acute treatment phase is completed and data on exercise capacity, sedentary behaviour and psychosocial status become available. A model that combines routine clinical data with exercise testing and lifestyle information at CR entry could therefore help to identify patients who need intensified secondary prevention and closer follow-up.
Thus, the current study aimed to develop and validate a model with high overall accuracy for the prediction of all-cause mortality in patients post-PCI using ML models based on data routinely available at CR entry. This study addresses the issues outlined above in four ways. Methodologically, we compared seven ML algorithms using 50 repeats of 4-fold stratified cross-validation and selected features with a genetic algorithm. For external validation, we applied the model to two cohorts from a European multicentre study, one including ACS patients treated with PCI and one including a broader population of patients with coronary artery disease (CAD). For interpretability, we explained individual predictions using Shapley values and rated replicability with the independent validation score [14]. Unlike TIMI and GRACE, the model uses data available at CR entry, including exercise capacity and sedentary behaviour, and predicts all-cause mortality within three years of the index admission. Ultimately, an ML-based prediction tool may potentially add to individualized patient management, improving long-term outcomes post-PCI.
2. Methods
2.1. Approach to the Problem
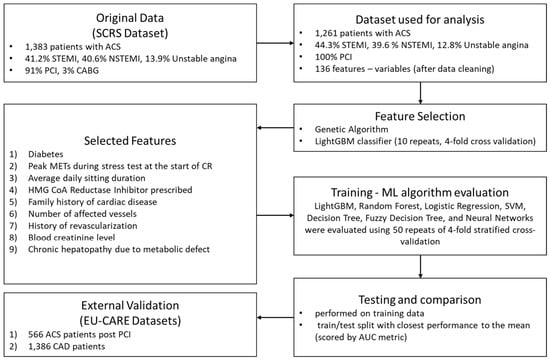
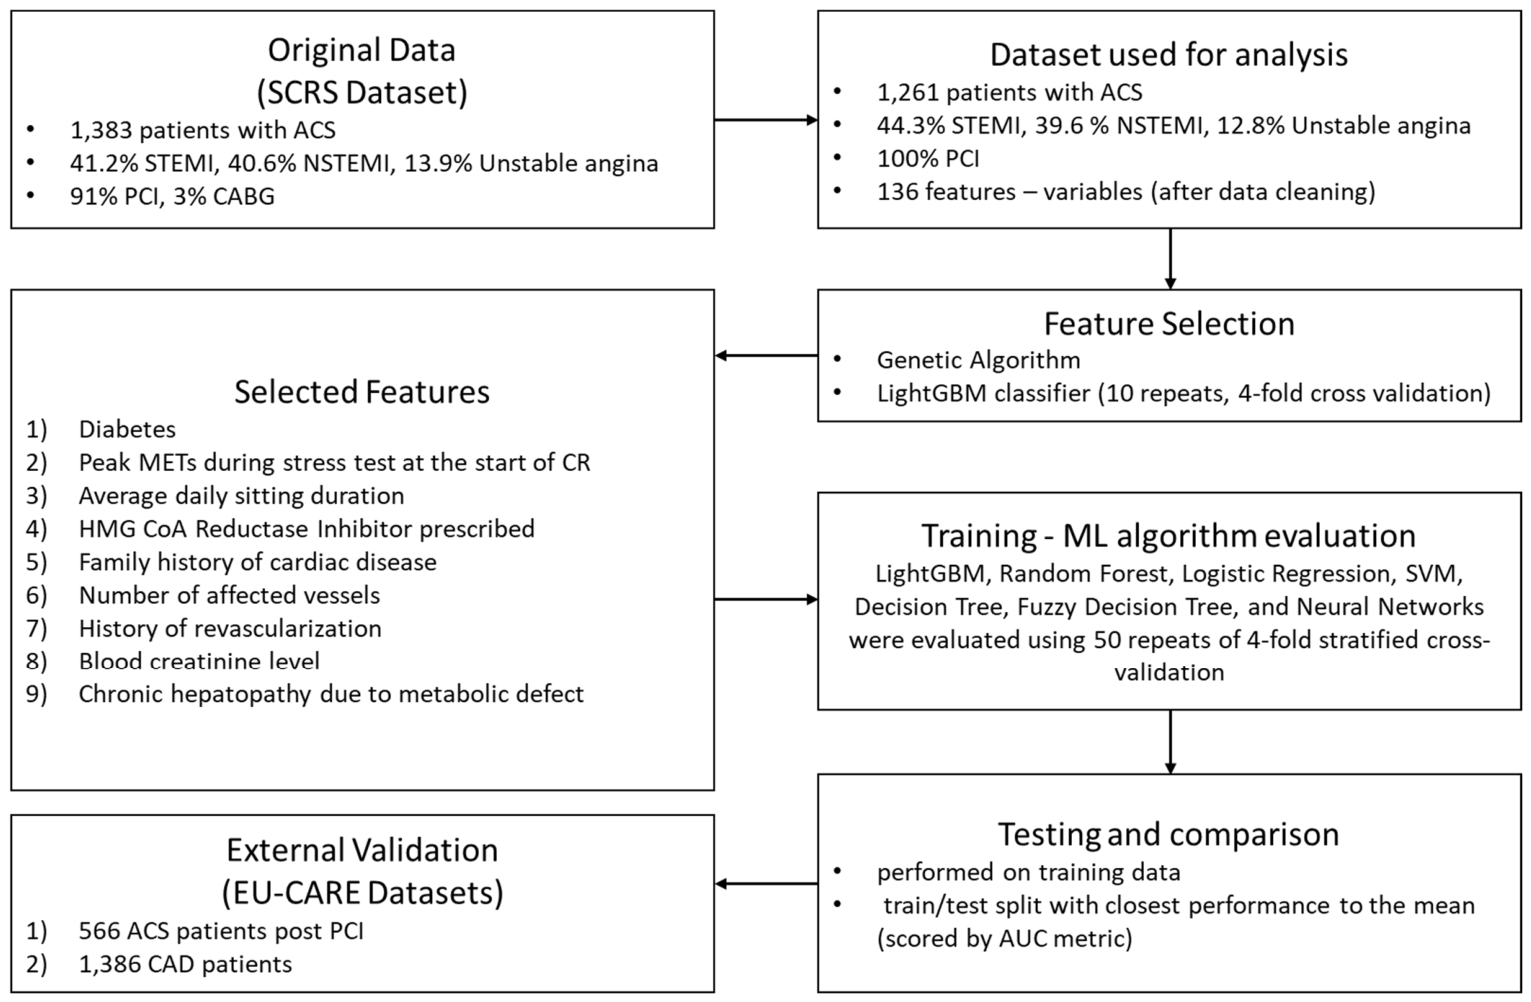
This study developed an ML model to predict all-cause mortality in cardiac patients using data from patients enrolled in the CR Program at Servizio Galego de Saude (SERGAS) at Hospital Clínico Universitario de Santiago de Compostela from January 2015 to December 2020. Data used for model development included information on 1261 patients who underwent PCI due to STEMI, NSTEMI, or unstable angina. The dataset comprised detailed patient information including clinical and hospitalization data, demographics, socioeconomic factors, medical history, laboratory tests, data from cardiopulmonary exercise testing (CPET) and lifestyle questionnaires assessed as described elsewhere [25,26]. The approach aimed to reflect the complex interplay of mainly cardiovascular and other (non-cardiovascular) factors, focusing on all-cause mortality as the outcome. Seven ML algorithms were evaluated using 50 repeats of a 4-fold stratified cross-validation, enhancing the robustness of the results and ensuring the model’s stability and accuracy across different data splits (Figure 1). For external validation, data from the EU-CaRE observational study (1633 consenting patients from eight European CR centres) was used, and final validation was conducted in two groups, ACS patients post-PCI (n = 566) and a broader population of CAD patients treated by PCI, CABG or without invasive procedures (n = 1386). The model’s predictions were explained using the model-agnostic SHapley Additive exPlanation (SHAP) methodology [27].
Figure 1.
Study flow chart indicating the process of feature selection, training of machine learning (ML) models, external validation and testing for the prediction of all-cause mortality in patients with acute coronary syndrome (ACS).
2.2. Training Dataset
Data for training the prediction model was retrieved from a well-defined sample of patients enrolled in the Santiago de Compostela CR program from SERGAS (SCRS dataset). Patients with angiographically documented CAD who provided informed consent were included, and 1261 of them had been treated by PCI (mean age of 61 years). The primary reasons for initial hospitalizations were STEMI (44.3%), NSTEMI (39.6%), or unstable angina (12.8%). Patient data was collected on site at enrolment for CR (first visit), and events were documented until September 2021 by extracting data from the central EHR (mean follow-up period = 12.0 ± 20.9 months). Data included demographic details, socioeconomic factors, medical history (including comorbidities), laboratory test results, medication, health-related lifestyle questionnaires, clinical data, patient-reported outcomes, as well as CPET and cause of death (Table 1). Patient characteristics are provided in Table 2. This study, which conformed to the principles outlined in the Declaration of Helsinki, was approved by the local ethics committee, Comité De Ética De La Investigación De Santiago-Lugo (registry code 2015/486).
Table 1.
Patient data by category used for machine learning.
Table 2.
Description of the training and external validation datasets.
2.3. Outcome Definition
To capture the overall impact of both cardiovascular and non-cardiovascular factors, all-cause mortality was documented by assessing the participating patients’ central EHR. The Galician healthcare system is organized centrally, including information on disease, treatment and death provided by general practitioners, cardiologists and hospitals. The EHRs were assessed throughout the year 2021 to retrieve date and cause of death. The outcome was defined as all-cause death within three years of the index admission. This definition yielded 28 deaths in the development cohort.
2.4. Feature Selection and Algorithm Pretesting
To identify variables with predictive potential, different algorithms were applied and the random mutation implementation of the Genetic Algorithm for feature selection had the best performance. The Genetic Algorithm used a population of 10 candidate subsets, a maximum of 5000 generations, and stopping after 700 generations without fitness improvement. Two parents were selected by steady-state selection with single-point crossover; fitness combined transformed cross-validated ROC-AUC and sparsity through their geometric means. To compute the AUC score for the fitness function, 10 repeats of 4-fold cross-validation were used. The LightGBM classifier [28] was used for the scoring with the following hyperparameters: subsample = 0.35, subsample_freq = 4, extra_trees = True, colsample_bytree = 1.0, feature_fraction_bynode = 1.0, reg_alpha = 6 × 10⁻⁷, reg_lambda = 0.03, learning_rate = 0.001, linear_lambda = 6.6 × 10⁻⁷, max_depth = 34, min_child_samples = 1, n_estimators = 80, objective = ‘cross_entropy’. Missing values were handled by LightGBM’s internal missingness technique, in which missingness is directly encoded into the predictor as if it were a naturally occurring category. Missing values were handled by the native LightGBM procedure, which learns during tree construction to which branch missing values are assigned. A mutation was applied with a probability of 0.08 for bad solutions and 0.04 for good solutions. Detailed hyperparameters and methodology are available in the Supplemental Material. The analysis was not fully nested, and genetic-algorithm feature selection was performed on the full development dataset before repeated stratified cross-validation. The genetic algorithm selected ten predictors. One of them was removed manually after robustness experiments, leaving the nine predictors used for all models.
2.5. Model Development and Performance Evaluation
To predict all-cause mortality following percutaneous coronary intervention (PCI), seven ML algorithms were developed and evaluated. The algorithms included LightGBM, Random Forest, Logistic Regression, Support Vector Machine (SVM), Decision Tree, Fuzzy Decision Tree, and Neural Network. The input features for all models were selected using a genetic algorithm and ranked based on their importance through SHAP values. The most important features identified were:
- Diabetes;
- Peak metabolic equivalent (MET) achieved during the initial stress test;
- Average daily sitting duration;
- Prescription of statins at the start of CR;
- Family history of heart disease;
- Number of affected vessels;
- History of revascularization;
- Blood creatinine levels;
- Diagnosis of chronic hepatopathy due to metabolic defects.
For these features, data were missing for exercise capacity (19.0%), sitting time (9.7%), serum creatinine (6.2%), and diseased-vessel count (0.3%), while other variables were complete (Supplementary Table S4). A rigorous performance evaluation process was applied using 50 repeats of 4-fold stratified cross-validation to ensure model stability and generalizability across different data splits. The dataset was divided into four parts, with each part serving as the test set in different iterations, ensuring that the models were evaluated across a representative range of patient profiles. For internal evaluation, the classification threshold of each test fold was set to the value that maximized the product of sensitivity and specificity in that fold. For external evaluation, thresholds were adjusted to the observed mortality incidence in the corresponding external cohort. Key performance metrics, including AUC, specificity, sensitivity, accuracy, and balanced accuracy, were compared across all models. AUC is reported as the mean and standard deviation across the 200 test folds. Threshold-dependent metrics are reported for the representative test fold whose AUC was closest to the mean AUC. For LightGBM, precision, recall, F1-score and the Matthews correlation coefficient (MCC) were additionally calculated from the confusion matrices of the representative internal test fold and the external PCI cohort.
2.6. External Validation and AI-Ms Replicability Evaluation
For external validation, data from a European multicentre cohort (EU-CaRE) was used, which enrolled patients during the same period, starting enrolment in 2015. The EU-CaRE study investigated the efficacy of CR programs across eight European centres (Switzerland, Denmark, Germany, France, Italy, The Netherlands and Spain) as described elsewhere [25,29]. In brief, 1633 patients participating in CR programs were enrolled between September 2015 and January 2018. Data collected covered demographic details, the index event, socioeconomic status, comprehensive medical history including comorbidities, lifestyle factors, clinical data, self-reported patient outcomes, and CPET. This study was approved by the respective local medical ethics committees and registered at trialregister.nl (NTR5306 and NTR5308). The participants gave written informed consent before inclusion in this study, which aligned with the principles set forth in the Declaration of Helsinki. During the one-year follow-up visit for the EU-CaRE study, patients were required to attend to the clinic in person. The EHR and local databases or paper records (depending on the centre) were subsequently reviewed to identify any events or deaths if the patient did not attend the appointment. After harmonization (matching of not missing variables between the datasets, adjustment of encodings/units, identifying comorbidities from free text, categorizing patients), the resulting validation datasets encompass (A) data from 566 patients with ACS treated with PCI as well as (B) a broader population of CAD patients treated by PCI, CABG or without invasive procedures (1386 patients) (Table 2). In the additional analyses described below, model calibration was assessed using reliability diagrams comparing predicted probabilities to observed positive class frequencies, with Brier scores computed to quantify calibration performance for the LGBM model and its Platt scaling and isotonic regression-calibrated variants. For AI-Ms replicability evaluation, the independent validation score (IVS) was used [14]. The IVS contains five score items: transparency, performance, feasibility of reproduction, risk of reproduction, and clinical implication. Depending on the grading, IVS overall scores are “strongly recommended”, “recommended”, “neutral”, “warning”, and “not recommended”.
2.7. Additional Sensitivity and Calibration Analyses
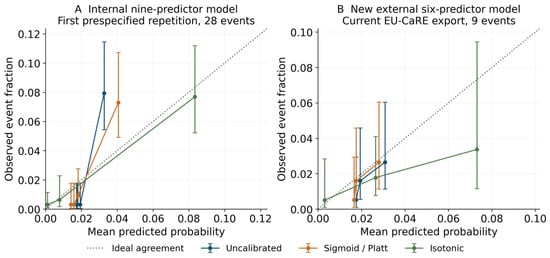
Additional analyses were performed with the nine selected predictors and 28 deaths. The analyses used 50 repetitions of fourfold stratified cross-validation with a fixed seed of 42 and identical outer partitions for models with nine, seven and six predictors. Each patient contributed one held-out prediction per repetition. Metrics were calculated for each complete out-of-fold prediction vector and then averaged across repetitions. Missing predictor values were retained for LightGBM handling, and no development records were excluded because of missing predictors. The seven-predictor model omitted sitting duration and diseased-vessel count, which were unavailable in EU-CaRE. The six-predictor model additionally omitted chronic hepatopathy as it was coded from free text and held uncertainty in EU-CaRE. An age sensitivity analysis evaluated held-out predictions of the nine-predictor model only in development patients aged 65 to 90 years, the age range observed in EU-CaRE, while the models were trained in the full-cohort training partitions. For a new external evaluation, six-predictor models were fitted in the full development cohort and evaluated in the current harmonized EU-CaRE PCI dataset of 566 patients. The Brier score was used as a measure of overall probabilistic accuracy. For internal calibration, sigmoid calibrators according to Platt and isotonic calibrators were fitted on fourfold cross-fitted scores within each outer training partition and applied to the corresponding test fold. External calibrators were fitted on development data only. Calibration-in-the-large was estimated with the logit of the predicted probability as offset and the slope fixed at one, and a separate logistic recalibration estimated intercept and slope jointly. Reliability diagrams with quantile bins and Wilson intervals for observed event fractions show the first prespecified internal repetition and the external evaluation. Calibration was therefore nested within the training partitions, whereas the original feature selection remained non-nested.
3. Results
3.1. Training and Test Performance
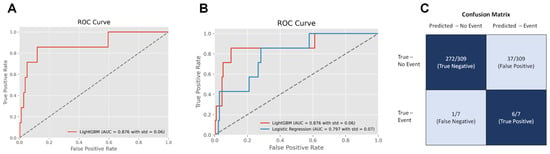
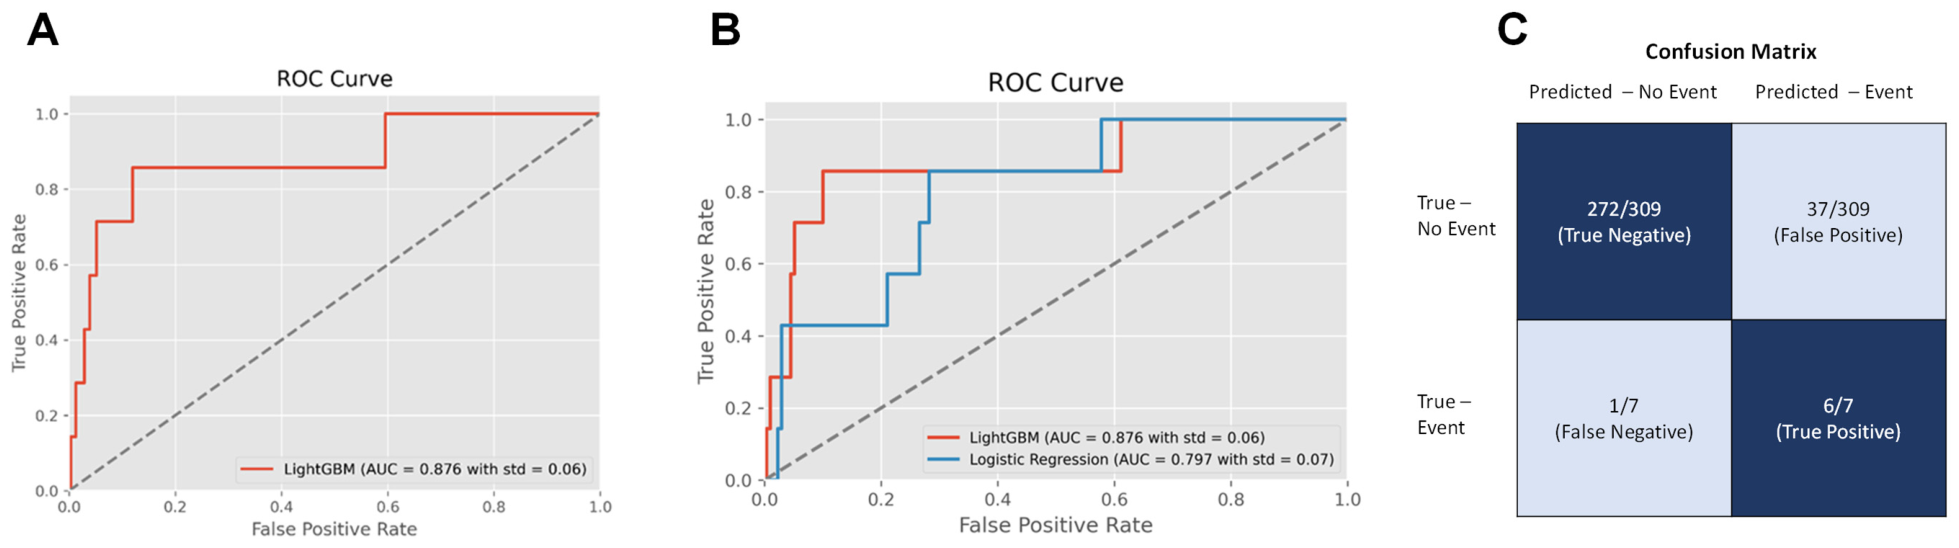
The evaluation of the seven ML algorithms (Table 3) resulted in LightGBM and Random Forest achieving the highest AUC and balanced accuracy; SVM also exceeded logistic regression in AUC. Among these, LightGBM had the highest mean AUC and achieved a balanced accuracy of 0.87, with a sensitivity of 0.86 and a specificity of 0.88. These threshold-dependent values refer to the representative test fold whose AUC was closest to the mean AUC, using the threshold that maximized the product of sensitivity and specificity in this fold. The receiver operating characteristic (ROC) curve of LightGBM is shown in Figure 2. The confusion matrix (Figure 2) for the LightGBM model demonstrated an ability to accurately classify patients, with a true positive rate of 85.7% and a true negative rate of 88%. The false positive and false negative rates were 12% and 14.3%, respectively. In this representative test fold of 316 patients with seven deaths, the model achieved a precision of 13.95%, a recall of 85.71%, an F1-score of 0.240 and an MCC of 0.317, calculated from 6 true positives, 37 false positives, 1 false negative and 272 true negatives. These values describe a single fold rather than averages across the 200 cross-validation folds.
Table 3.
Comparison of different ML models for the prediction of all-cause mortality.
Figure 2.
The LightGBM model predicts all-cause mortality with high overall accuracy. (A,B) ROC curve indicating the performance of the LightGBM model compared to logistic regression in the test dataset. Dashed line represents a random classifier. (C) Confusion matrix for a representative test fold (n = 316) from the 50 × 4-fold cross-validation. Upper left: true negative (88%), lower left: false negative (14.3%), upper right: false positive (12%), lower right: true positive (85.7%). AUC, area under the curve; LightGBM, light gradient-boosting machine.
3.2. Feature Importance—Shap Values
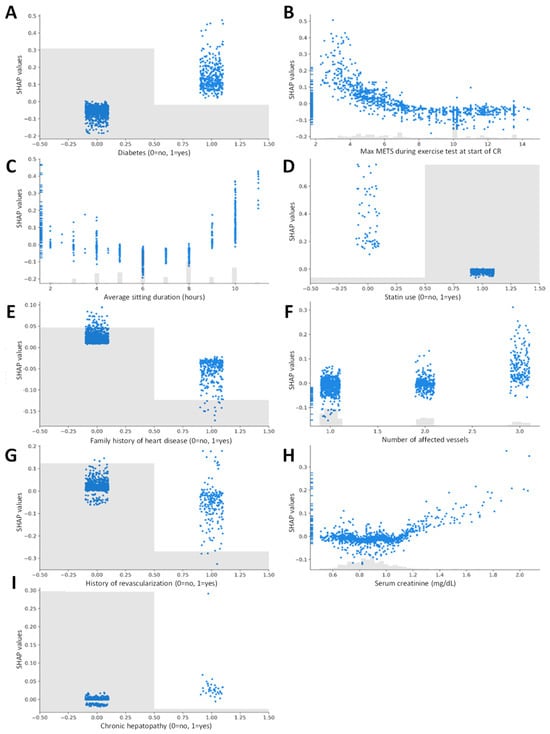
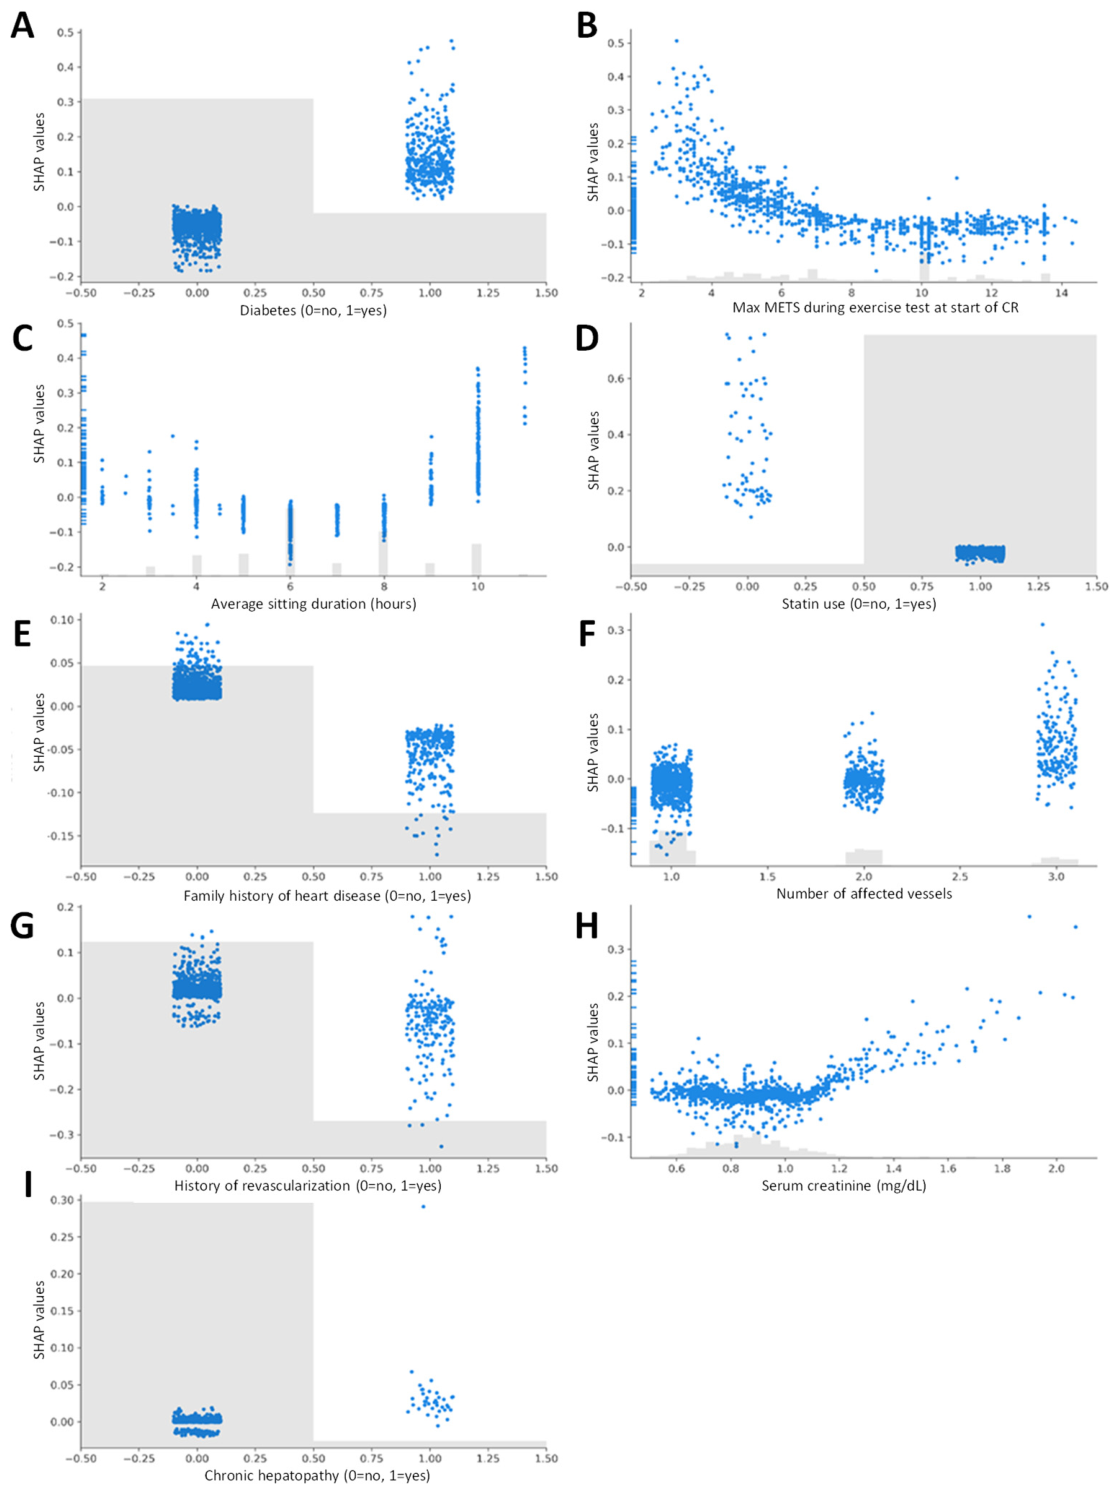
SHAP dependence plots were used to describe how the nine selected predictors contributed to individual model predictions (Figure 3). Lower exercise capacity, particularly values below approximately 6 METs, tended to contribute to higher mortality predictions. Sitting durations of approximately 9 h or more per day also tended to contribute toward higher predictions. These patterns are descriptive and do not establish validated clinical cut-offs. Statin non-use, diabetes, three-vessel disease and higher serum creatinine generally contributed toward higher mortality predictions, whereas a documented family history of heart disease and a history of revascularization generally contributed toward lower predictions. Chronic hepatopathy due to a metabolic defect showed a small positive contribution. These findings describe associations learned by the model and should not be interpreted as causal effects or statistically established associations with observed mortality.
Figure 3.
SHAP dependence plots for the nine selected predictors. The horizontal axis shows the predictor value, and the vertical axis shows its SHAP contribution to the model output for mortality. (A) SHAP values by diabetes status, (B) SHAP values versus exercise capacity, (C) SHAP values versus sitting duration, (D) SHAP values by statin use, (E) SHAP values by family medical history, (F) SHAP values versus number of affected coronary arteries, (G) SHAP values by revascularization history, (H) SHAP values versus creatinine level, (I) SHAP values by metabolic hepatopathy status. Each blue point represents an individual patient in the development dataset. Positive SHAP values indicate contributions toward a higher model output for mortality relative to the baseline output, whereas negative values indicate contributions toward a lower output. Larger absolute SHAP values indicate stronger contributions, irrespective of direction. The grey histograms show the distributions of predictor values. These plots describe the behaviour of the fitted model and do not establish statistical significance, causal effects, or validated clinical cut-offs.
3.3. External Validation and AI-Ms Replicability Evaluation
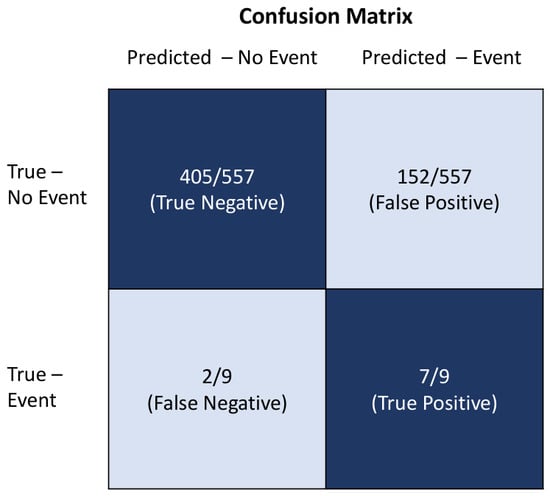
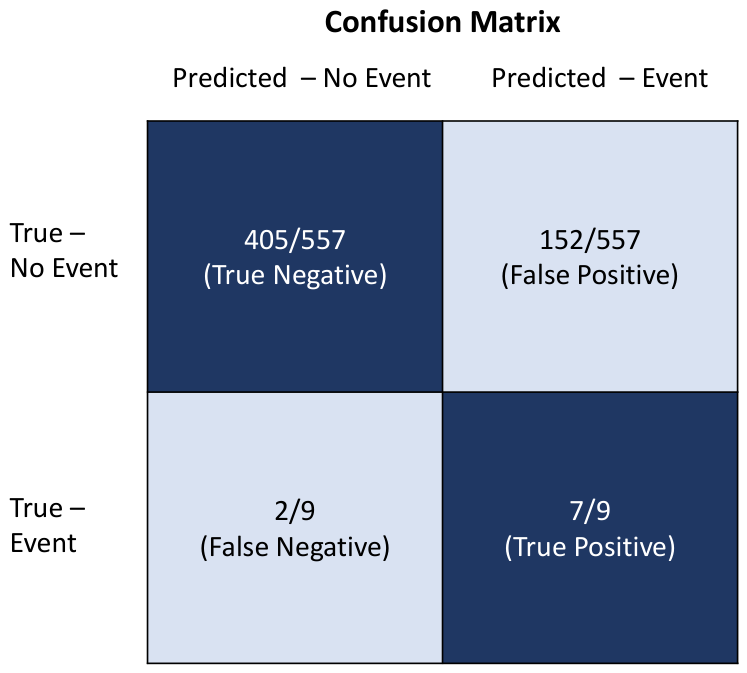
To assess the accuracy and generalizability of the identified model, we applied the LightGBM algorithm to two EU-CaRE datasets. In the external cohort of ACS patients treated with PCI, sensitivity was 0.78 and specificity was 0.73 at a threshold adjusted using the cohort’s observed mortality rate (Figure 4). This was achieved despite a considerable constraint—information on predictive variables “sitting duration” and “number of affected vessels” was not available in the external EU-Care dataset. Among the other predictors, missingness was 6.5% for serum creatinine, 4.8% for exercise capacity, 0.5% for family history of heart disease and 0.2% for diabetes, while statin treatment and history of revascularization were complete (Supplementary Table S4). Chronic hepatopathy had been derived from free-text assessments during harmonization and was removed due to uncertainty when applied to a different dataset including different languages. In the PCI cohort, the model achieved a precision of 4.40%, a recall of 77.78%, an F1-score of 0.083 and an MCC of 0.141, calculated from 7 true positives, 152 false positives, 2 false negatives and 405 true negatives (Figure 4). As expected, the model’s performance on the larger and less-comparable dataset including patients not only treated with PCI was lower at a sensitivity of 0.7 and a specificity of 0.6. Using the IVS scoring system [14], the LightGBM achieved Grade II for transparency, performance and feasibility of reproduction and Grade III for risk of reproduction and clinical implication, with an overall rating of “neutral” (Table 4).
Figure 4.
Validation of the LightGBM model. Confusion matrix depicting the model performance in the validation dataset (n = 566 patients post-PCI). Upper left: true negative (72.7%), lower left: false negative (22.2%), upper right: false positive (27.3%), lower right: true positive (77.8%). AUC, area under the curve; LightGBM, light gradient-boosting machine.
Table 4.
Results of the Independent Validation Score (IVS) for AI-Ms replicability evaluation.
3.4. Additional Performance and Sensitivity Analyses
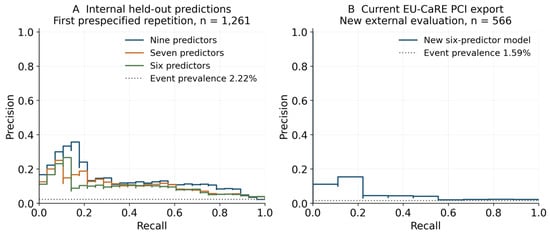
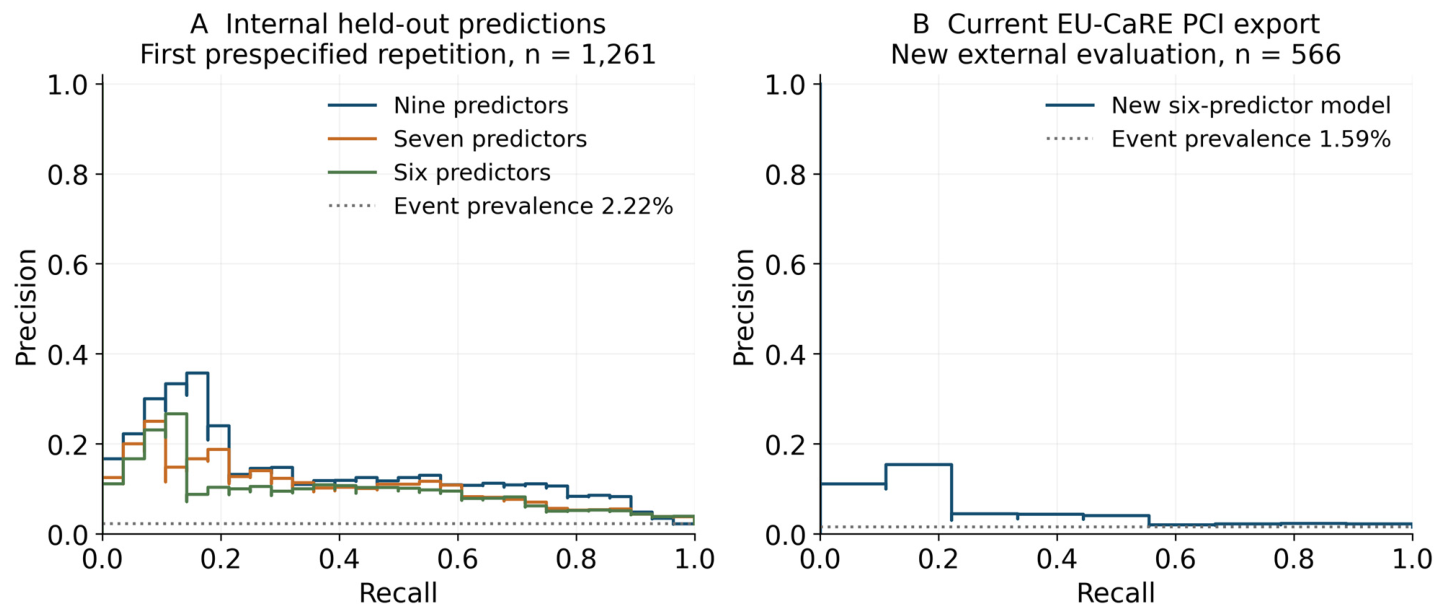
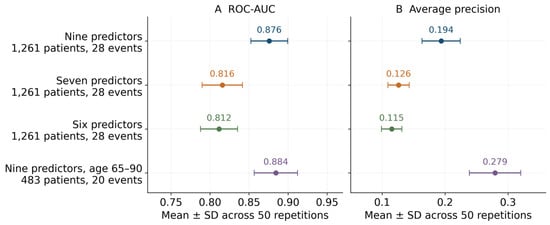
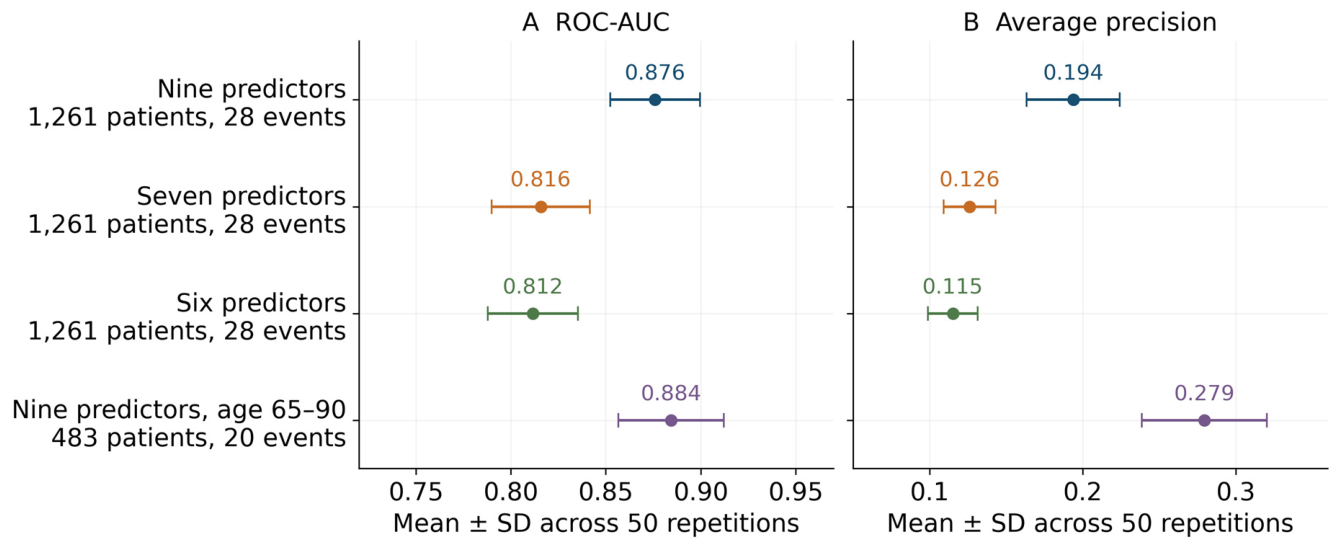
To further test the generalizability of the findings, additional performance and sensitivity analyses were performed. The nine-predictor model reached a mean ROC-AUC of 0.876 with an SD of 0.024, a PR-AUC of 0.181 and an AP of 0.194 (Supplementary Table S2, Figure 5 and Figure 6). With identical outer partitions, omission of sitting duration and diseased-vessel count reduced the mean ROC-AUC to 0.816 and the AP to 0.126. Additional omission of chronic hepatopathy resulted in a ROC-AUC of 0.812 and an AP of 0.115. The six-predictor model reached a ROC-AUC of 0.683, a PR-AUC of 0.042 and an AP of 0.054 in the EU-CaRE PCI cohort. Among patients aged 65 to 90 years, held-out predictions of the nine-predictor model covered 483 patients with 20 deaths. The mean ROC-AUC in this subset was 0.884 with an SD of 0.028, compared to 0.876 in the full cohort, and the AP was 0.279. Event prevalence was higher in this subgroup than in the full cohort, at 4.14% versus 2.22.
Figure 5.
Precision-recall curves from additional analyses. (A) Held-out predictions of the first prespecified internal repetition with seed 42, comprising 1261 patients and 28 events. (B) New uncalibrated six-predictor model in the current EU-CaRE PCI dataset of 566 patients with nine events. Dotted lines indicate event prevalence.
Figure 6.
Predictor omission and age sensitivity analysis. Points show mean ROC-AUC in panel (A) and mean average precision in panel (B) across 50 repetitions. Bars show one between-repetition SD and are not confidence intervals. Seven predictors exclude sitting duration and diseased-vessel count, and six predictors additionally exclude chronic hepatopathy. The age analysis evaluates the nine-predictor model only in patients aged 65 to 90 years without restricting training.
3.5. Calibration in the Additional Analyses
For the internal nine-predictor model, the mean Brier score was 0.02085, calibration-in-the-large was 0.022 and the calibration slope 2.414. Sigmoid calibration resulted in values of 0.02102, −0.038 and 1.047, and isotonic calibration in values of 0.02055, −0.022 and 0.675 (Supplementary Table S3, Figure 7). For the new uncalibrated six-predictor model in EU-CaRE, the Brier score was 0.01556, calibration-in-the-large −0.360 and the calibration slope 1.538. After sigmoid and isotonic calibration, the Brier scores were 0.01561 and 0.01603.
Figure 7.
Reliability diagrams for the additional analyses. (A) Internal nine-predictor model in the first prespecified repetition with four quantile bins. (B) External six-predictor models with three quantile bins. Calibrators were fitted on development data only. Points show bin means, and bars show 95% Wilson intervals for the observed event fractions, not confidence bands for a fitted calibration curve. The dotted diagonal indicates ideal agreement.
4. Discussion
The current study aimed to develop an explainable algorithm for individual mortality risk prediction in patients with ACS after PCI using an ML approach. Our results suggest that based on the developed solution, individualized patient management for improving long-term outcomes could be achieved based on standard clinical assessments and electronic health record data.
In recent years, ML has been used in all fields of medicine to predict future outcomes and help clinical decision-making. However, prediction models developed by ML in the field of cardiology have been criticised for intransparency [14], which limits acceptance and prevents their use in clinical practice. Our transparent approach resulted in a prognostic model to assess mortality in ACS patients with STEMI, NSTEMI, or unstable angina treated with PCI. The model demonstrated an overall accuracy of 88% in the representative test fold (balanced accuracy of 0.87), suggesting a strong predictive capability, which was further substantiated by high values for specificity (0.88) and sensitivity (0.86). Comparing the model performance to other ML prediction tools in medicine may be of interest. For instance, a recent meta-analysis [30] reported a pooled AUC of ML–based breast cancer risk prediction models at 0.73 (95% CI, 0.66–0.80). For patients with COPD, a recent meta-analysis reported a pooled AUC on the internal validation datasets of 0.78 (95% CI, 0.73–0.84) for deep learning models and 0.77 (95% CI, 0.73–0.80) for (conventional) ML studies in the prediction of mortality, with no significant differences between the approaches [31]. Of note, out of 18 studies included in the analysis, only 5 models were externally validated with a pooled AUC of 0.67 (95% CI, 0.62–0.72). More specifically, AI-based prediction models in cardiovascular disease have recently been assessed for model replicability and only 10 models were rated as “recommended” (281 and 187 were “not recommended” or labelled “warning,” respectively) [14]. Application of the used IVS scoring system to our model resulted in the label “neutral”.
The value of ML for mortality risk prediction in patients with ACS has also recently been reviewed in a meta-analysis [15]. The authors reported findings from models that had been externally validated and suggested decreasing accuracy with longer time-to-event, with the highest pooled AUCs for in-hospital mortality and lower values for ≥1-year prediction. However, the systematic review included only three studies predicting 2-year mortality, and no study with a longer prediction period was included. Supplementary Table S1 compares the present model with 15 published ML models for mortality after ACS or PCI. These models were developed in cohorts with 38 to more than 20,000 deaths, and most use data collected at admission or discharge. Eight models for mortality at 1 year or longer were validated externally or temporally and reached AUCs between 0.71 and 0.93 in these validations, four of them with SHAP-based explanations. The present model differs as it uses data available at CR entry, including exercise capacity and sedentary behaviour. Differences in outcome definition, prediction horizon and study population limit the direct comparison of AUC values across studies. Hosseini et al. reported a random-forest AUC of 0.866 for one-year mortality after PCI in 9073 patients with 340 deaths, based on an internal split into training and test data [10]. Weichwald et al. derived the eight-variable SPUM-ACS score for one-year mortality in 1892 patients with ACS and 80 deaths and evaluated it by internal cross-validation [13]. In the current work, external evaluation yielded sensitivity of 0.78 and specificity of 0.73 in the PCI-treated cohort. Because the classification threshold was informed by the observed mortality rate in that cohort, these estimates do not establish performance at a prespecified threshold in future patients. As two of the nine most influential predictors were therefore handled as missing, the external validation does not fully evaluate the model as specified. In additional analyses, refitted models without these predictors showed lower internal discrimination. Moreover, the broader follow-up period in the SCRS datasets compared to the EU-CaRE dataset could potentially impact the sensitivity and specificity of any predictive models or tests applied to these datasets. In addition, the EU-CaRE PCI cohort was older and had lower exercise capacity than the development cohort, with a mean age of 73 versus 61 years and mean peak METs of 4.9 versus 7.8, and LVEF and several cardiovascular risk factors differed. These differences may alter baseline mortality and the relationships between predictors and outcome and may thereby affect calibration and discrimination. With regard to explainability, the findings of our analysis are largely in line with known risk factors in CAD patients. Diabetes was included as a significant predictor of mortality, reinforcing the well-established link between diabetes and poor cardiovascular outcomes due to a range of factors, including the elevated atherosclerotic burden [32,33]. The observation that poor cardiopulmonary fitness, indicated by a peak MET value below 6 at the start of a CR program, indicates increased mortality risk aligns with studies that have demonstrated a strong correlation between MET levels and the future risk of cardiovascular events in individuals both with and without pre-existing heart disease [16]. Specifically, a lower MET value is linked to higher mortality risks, particularly in patients with CAD. In the context of CR, patients with low fitness levels (defined as < 5 METs) face a higher mortality risk compared to those with moderate (5–8 METs) or high (>8 METs) fitness levels. Additionally, an increase of 1 MET in exercise capacity, as measured by a stress test, is significantly associated with a reduced risk of all-cause mortality and coronary heart/cardiovascular disease events. The finding that sedentary behaviour, quantified as sitting for 9 h or more daily in our study, was identified as a factor contributing to mortality prediction is particularly salient given the increasing recognition of sedentary lifestyle as a risk factor for mortality [17,18,34]. Together, these identified factors indicate the usefulness and necessity of documenting sedentary behaviour and exercise capacity, which can be done with relatively little effort using short, standardized questionnaires and routine exercise stress tests. Notably, not being treated with statins at the start of the CR program was associated with increased risk, supporting the extensive body of evidence advocating for statin therapy in reducing mortality post-cardiac events through cholesterol reduction and pleiotropic effects [35]. Interestingly, patients with a family history of heart disease or a history of revascularization exhibited a decreased risk of mortality, which may reflect a heightened awareness and intensified management of cardiovascular risk factors among these individuals as indicated in past and recent guidelines [35]. Given the small number of events, these apparently protective associations should be regarded as hypothesis-generating and may reflect residual confounding or overfitting rather than true protective effects. Similar inverse associations have been reported in other cohorts. In a registry of 542,008 patients with a first MI, in-hospital mortality decreased with the number of traditional risk factors, including family history, and patients with more risk factors were younger [36]. A recent ML model also found family history of premature coronary disease to be associated with better 1-year survival after STEMI [37]. For prior revascularization, selection into CR may contribute, because only patients who had survived earlier events and were fit enough to participate were included. Age was available as a candidate variable but was not included in the final nine-predictor model. Overlap in predictive information between age, exercise capacity and serum creatinine is one possible explanation. However, this was not directly assessed, and the omission of age should not be interpreted as evidence that its prognostic information was adequately represented by the selected predictors.
The extent of atherosclerosis, in particular reflected by the diagnosis of 3-vessel disease, was a strong predictor of increased mortality, emphasizing the severity of systemic CAD as a determinant of prognosis [38]. In addition, elevated creatinine levels were indicative of increased mortality risk, highlighting current knowledge that renal dysfunction and chronic kidney disease are important prognostic factors in cardiac patients [39,40]. Lastly, chronic hepatopathy due to metabolic defects, while only slightly increasing the risk of mortality, signals the necessity to consider and manage comorbidities in the comprehensive care of patients post-cardiac events. Our findings are in line with the most relevant studies [10,12,13] and reviews [15,41] in the field, highlighting common factors (creatinine levels and diabetes) and their impacts on cardiovascular health. Even though the present model does not include factors frequently met in the other scores and studies, such as age, blood pressure, haemoglobin and heart failure, it includes variables that are not part of established risk scores, such as lifestyle factors (sitting duration), medication use (HMG CoA reductase inhibitor), family history, and the extent of cardiac disease (affected vessel count, revascularization history). The model described in this work offers a broader perspective on individual patient risks and health status and can still be derived from standard clinical assessments and electronic health record data.
Limitations
While our study was performed on a well-defined dataset and used external validation of the identified model, some limitations may exist. Both cohorts comprise cardiac-rehabilitation participants (i.e., patients well enough to enrol in CR) with correspondingly low mortality (1.4–2.2%). Results may not generalise to unselected ACS-PCI populations, and the model is not directly comparable to GRACE/TIMI, which were derived in unselected admissions; thus, no head-to-head comparison on identical data was performed. Risk of bias from handling missing data may have occurred even though LightGBM has an effective built-in mechanism to handle missing data. Missing values can influence both tree splits and SHAP attributions, so missing inputs do not necessarily contribute zero. Differences in recording practices between cohorts may also change SHAP magnitudes and rankings. Our training dataset was medium-sized, and the number of events was low, but consistent with other studies and registries. With only 28 events in total, per-fold performance estimates are unstable and should be interpreted as indicative rather than precise until tested in a larger group. The difference in mean AUC between LightGBM and logistic regression, 0.88 versus 0.80, does not establish a statistically reliable or clinically relevant advantage of the more complex model, as no paired statistical comparison is available. Feature selection before cross-validation and the use of outcomes in the evaluation data to determine classification thresholds may have introduced optimism into the reported performance estimates. The nested calibration in the additional analyses does not correct optimism arising from this feature selection. A key limitation is the comparability of the datasets due to differences in geographical coverage, cultural diversity, follow-up periods, and functional evaluations, which may introduce variability and affect the interpretation of outcomes in cross-study comparisons. However, the presence of overlapping data categories like demographics, socioeconomic status, medical history, and patient-reported outcomes provides a common ground for comparative analysis. Considering the setting of data collection, the model is solely applicable to PCI populations eligible for cardiac rehabilitation and cannot be directly generalized to unselected, consecutively admitted ACS-PCI patients. Although the outcome was defined as death within three years of the index admission, 607 surviving patients had a shorter recorded follow-up and follow-up intervals were missing for 11 patients, so complete three-year ascertainment is not established. Follow-up in EU-CaRE was approximately one year. The predictions should therefore not be interpreted as validated risks at a common time horizon, and a fixed-horizon, time-to-event formulation is a priority for future work. The present study did not assess clinical utility. Decision curve analysis, reclassification against established scores and cost–benefit analysis should be part of a prospective evaluation before the model is used in clinical practice.
5. Conclusions
In conclusion, our model provides a nuanced understanding of the multifactorial nature of mortality risk following PCI in CAD patients with ACS. The external validation suggested the identification of true positive cases and indicated the need to assess sedentary behaviour and exercise capacity. After prospective validation, the model may help clinicians and CR nurses to identify patients at higher risk who could benefit from intensified treatment and lifestyle interventions.
Supplementary Materials
The following supporting information can be downloaded at https://www.mdpi.com/article/10.3390/ai7110450/s1, Table S1: Published machine learning models for mortality prediction after acute coronary syndrome or percutaneous coronary intervention compared with the present model.; Table S2: Additional probability metrics and sensitivity analyses; Table S3: Calibration in the additional analyses; Table S4: Predictor availability in the audited development and external data.
Author Contributions
B.S. and D.G. were responsible for the conceptualization and supervision of the study. C.P.-G., A.W.J.V.H. and E.D.K. handled data curation. D.G., N.P. and V.T. developed, trained, and validated the machine learning models, i.e., developed the methodology. B.S., D.G., M.S.-F., C.P.-G. and F.C.M. contributed to the formal analysis and interpretation of the results. B.S. and D.G. drafted the original manuscript and were responsible for visualization, while M.S.-F., F.C.M., C.P.-G., A.W.J.V.H. and E.D.K. reviewed and edited the manuscript, providing important intellectual input. All authors have read and agreed to the published version of the manuscript.
Funding
This work received funding from the European Union’s Horizon 2020 research and innovation program under grant agreement No 101017424. EU-CaRE was funded under grant agreement No 634439.
Institutional Review Board Statement
This study was conducted in accordance with the guidelines of the Declaration of Helsinki, and approved by the Institutional Ethics Committee of Comité De Ética De La Investigación De Santiago-Lugo (protocol code 2015/486).
Informed Consent Statement
Informed consent was obtained from all subjects involved in the study.
Data Availability Statement
The raw data supporting the conclusions of this article will be made available by the authors upon reasonable request following a review of any applicable privacy, legal, or ethical restrictions.
Acknowledgments
We greatly acknowledge the cooperation of all participants without whom this study could not have been realized. Declaration of generative AI and AI-assisted technologies in the manuscript preparation process: During the preparation of this work, the authors used Claude (Opus 4.8) for proofreading and consistency checks and ChatGPT (GPT-6.1 Sol) for the preparation of analysis code for the additional analyses and for consistency checks. The additional numerical results were generated by executable analysis scripts applied to the study data. After using these tools, the authors reviewed and edited the content as needed and take full responsibility for the content of the published article.
Conflicts of Interest
The authors declare no conflicts of interest.
References
- Luengo-Fernandez, R.; Walli-Attaei, M.; Gray, A.; Torbica, A.; Maggioni, A.P.; Huculeci, R.; Bairami, F.; Aboyans, V.; Timmis, A.D.; Vardas, P.; et al. Economic burden of cardiovascular diseases in the European Union: A population-based cost study. Eur. Heart J. 2023, 44, 4752–4767. [Google Scholar] [CrossRef] [Scilit] [PubMed] [PubMed Central]
- Kolansky, D.M. Acute coronary syndromes: Morbidity, mortality, and pharmacoeconomic burden. Am. J. Manag. Care 2009, 15, S36–S41. [Google Scholar] [PubMed]
- Lawton, J.S.; Tamis-Holland, J.E.; Bangalore, S.; Bates, E.R.; Beckie, T.M.; Bischoff, J.M.; Bittl, J.A.; Cohen, M.G.; DiMaio, J.M.; Don, C.W.; et al. 2021 ACC/AHA/SCAI Guideline for Coronary Artery Revascularization: Executive Summary: A Report of the American College of Cardiology/American Heart Association Joint Committee on Clinical Practice Guidelines. Circulation 2022, 145, e4–e17. [Google Scholar] [CrossRef] [Scilit] [PubMed]
- Neumann, F.J.; Sousa-Uva, M.; Ahlsson, A.; Alfonso, F.; Banning, A.P.; Benedetto, U.; Byrne, R.A.; Collet, J.-P.; Falk, V.; Head, S.J.; et al. 2018 ESC/EACTS Guidelines on myocardial revascularization. Eur. Heart J. 2019, 40, 87–165. [Google Scholar] [CrossRef] [Scilit] [PubMed]
- Kang, J.; Park, K.W.; Lee, H.S.; Zheng, C.; Rhee, T.M.; Ki, Y.J.; Chang, M.; Han, J.-K.; Yang, H.-M.; Kang, H.-J.; et al. Relative Impact of Clinical Risk Versus Procedural Risk on Clinical Outcomes After Percutaneous Coronary Intervention. Circ. Cardiovasc. Interv. 2021, 14, e009642. [Google Scholar] [CrossRef] [Scilit] [PubMed]
- Choi, H.E.; Kim, C.; Lee, D.J.; Joo, J.E.; Kim, H.S. Participation and Prognostic Impact of Cardiac Rehabilitation After Acute Coronary Syndrome: Big-Data Study of the Korean National Health Insurance Service. J. Korean Med. Sci. 2023, 38, e119. [Google Scholar] [CrossRef] [Scilit] [PubMed] [PubMed Central]
- Buccheri, S.; D’Arrigo, P.; Franchina, G.; Capodanno, D. Risk Stratification in Patients with Coronary Artery Disease: A Practical Walkthrough in the Landscape of Prognostic Risk Models. Interv. Cardiol. 2018, 13, 112–120. [Google Scholar] [CrossRef] [Scilit] [PubMed] [PubMed Central]
- D’Ascenzo, F.; De Filippo, O.; Gallone, G.; Mittone, G.; Deriu, M.A.; Iannaccone, M.; Ariza-Solé, A.; Liebetrau, C.; Manzano-Fernández, S.; Quadri, G.; et al. Machine learning-based prediction of adverse events following an acute coronary syndrome (PRAISE): A modelling study of pooled datasets. Lancet 2021, 397, 199–207. [Google Scholar] [CrossRef] [Scilit] [PubMed]
- Motwani, M.; Dey, D.; Berman, D.S.; Germano, G.; Achenbach, S.; Al-Mallah, M.H.; Andreini, D.; Budoff, M.J.; Cademartiri, F.; Callister, T.Q.; et al. Machine learning for prediction of all-cause mortality in patients with suspected coronary artery disease: A 5-year multicentre prospective registry analysis. Eur. Heart J. 2017, 38, 500–507. [Google Scholar] [CrossRef] [Scilit] [PubMed] [PubMed Central]
- Hosseini, K.; Behnoush, A.H.; Khalaji, A.; Etemadi, A.; Soleimani, H.; Pasebani, Y.; Jenab, Y.; Masoudkabir, F.; Tajdini, M.; Mehrani, M.; et al. Machine learning prediction of one-year mortality after percutaneous coronary intervention in acute coronary syndrome patients. Int. J. Cardiol. 2024, 409, 132191. [Google Scholar] [CrossRef] [Scilit] [PubMed]
- Tarabanis, C.; Kalampokis, E.; Khalil, M.; Alviar, C.L.; Chinitz, L.A.; Jankelson, L. Explainable SHAP-XGBoost models for in-hospital mortality after myocardial infarction. Cardiovasc. Digit. Health J. 2023, 4, 126–132. [Google Scholar] [CrossRef] [Scilit] [PubMed] [PubMed Central]
- Song, L.; Li, Y.; Nie, S.; Feng, Z.; Liu, Y.; Ding, F.; Gong, L.; Liu, L.; Yang, G.; Gong, L.; et al. Using machine learning to predict adverse events in acute coronary syndrome: A retrospective study. Clin. Cardiol. 2023, 46, 1594–1602. [Google Scholar] [CrossRef] [Scilit] [PubMed] [PubMed Central]
- Weichwald, S.; Candreva, A.; Burkholz, R.; Klingenberg, R.; Räber, L.; Heg, D.; Manka, R.; Gencer, B.; Mach, F.; Nanchen, D.; et al. Improving 1-year mortality prediction in ACS patients using machine learning. Eur. Heart J. Acute Cardiovasc. Care 2021, 10, 855–865. [Google Scholar] [CrossRef] [Scilit] [PubMed] [PubMed Central]
- Cai, Y.; Cai, Y.Q.; Tang, L.Y.; Wang, Y.H.; Gong, M.; Jing, T.C.; Li, H.-J.; Li-Ling, J.; Hu, W.; Yin, Z.; et al. Artificial intelligence in the risk prediction models of cardiovascular disease and development of an independent validation screening tool: A systematic review. BMC Med. 2024, 22, 56. [Google Scholar] [CrossRef] [Scilit] [PubMed] [PubMed Central]
- Zhang, X.; Wang, X.; Xu, L.; Liu, J.; Ren, P.; Wu, H. The predictive value of machine learning for mortality risk in patients with acute coronary syndromes: A systematic review and meta-analysis. Eur. J. Med. Res. 2023, 28, 451. [Google Scholar] [CrossRef] [Scilit] [PubMed] [PubMed Central]
- Martin, B.J.; Arena, R.; Haykowsky, M.; Hauer, T.; Austford, L.D.; Knudtson, M.; Aggarwal, S.; Stone, J.A.; Aggarwal, S.; Stone, J.A. Cardiovascular fitness and mortality after contemporary cardiac rehabilitation. Mayo Clin. Proc. 2013, 88, 455–463. [Google Scholar] [CrossRef] [Scilit] [PubMed]
- Banach, M.; Lewek, J.; Surma, S.; Penson, P.E.; Sahebkar, A.; Martin, S.S.; Bajraktari, G.; Henein, M.Y.; Reiner, Ž.; Bielecka-Dąbrowa, A.; et al. The association between daily step count and all-cause and cardiovascular mortality: A meta-analysis. Eur. J. Prev. Cardiol. 2023, 30, 1975–1985. [Google Scholar] [CrossRef] [Scilit] [PubMed]
- Patterson, R.; McNamara, E.; Tainio, M.; de Sá, T.H.; Smith, A.D.; Sharp, S.J.; Edwards, P.; Woodcock, J.; Brage, S.; Wijndaele, K. Sedentary behaviour and risk of all-cause, cardiovascular and cancer mortality, and incident type 2 diabetes: A systematic review and dose response meta-analysis. Eur. J. Epidemiol. 2018, 33, 811–829. [Google Scholar] [CrossRef] [Scilit] [PubMed] [PubMed Central]
- Antman, E.M.; Cohen, M.; Bernink, P.J.; McCabe, C.H.; Horacek, T.; Papuchis, G.; Mautner, B.; Corbalan, R.; Radley, D.; Braunwald, E. The TIMI risk score for unstable angina/non–ST elevation MI: A method for prognostication and therapeutic decision making. JAMA 2000, 284, 835–842. [Google Scholar] [CrossRef] [Scilit] [PubMed]
- Hadanny, A.; Shouval, R.; Wu, J.; Shlomo, N.; Unger, R.; Zahger, D.; Matetzky, S.; Goldenberg, I.; Beigel, R.; Gale, C.; et al. Predicting 30-day mortality after ST elevation myocardial infarction: Machine learning-based random forest and its external validation using two independent nationwide datasets. J. Cardiol. 2021, 78, 439–446. [Google Scholar] [CrossRef] [Scilit] [PubMed]
- Shi, B.; Wang, H.Y.; Liu, J.; Cai, Z.; Song, C.; Yin, D.; Wang, H.; Dong, Q.; Song, W.; Dou, K. Prognostic Value of Machine-Learning-Based PRAISE Score for Ischemic and Bleeding Events in Patients with Acute Coronary Syndrome Undergoing Percutaneous Coronary Intervention. J. Am. Heart Assoc. 2023, 12, e025812. [Google Scholar] [CrossRef] [Scilit] [PubMed] [PubMed Central]
- Sherazi, S.W.A.; Zheng, H.; Lee, J.Y. A Machine Learning-Based Applied Prediction Model for Identification of Acute Coronary Syndrome (ACS) Outcomes and Mortality in Patients during the Hospital Stay. Sensors 2023, 23, 1351. [Google Scholar] [CrossRef] [Scilit] [PubMed] [PubMed Central]
- Eagle, K.A.; Lim, M.J.; Dabbous, O.H.; Pieper, K.S.; Goldberg, R.J.; Van de Werf, F.; Goodman, S.G.; Granger, C.B.; Steg, P.G.; Gore, J.M.; et al. A validated prediction model for all forms of acute coronary syndrome: Estimating the risk of 6-month postdischarge death in an international registry. JAMA 2004, 291, 2727–2733. [Google Scholar] [CrossRef] [Scilit] [PubMed]
- Fox, K.A.; Dabbous, O.H.; Goldberg, R.J.; Pieper, K.S.; Eagle, K.A.; Van de Werf, F.; Avezum, Á.; Goodman, S.G.; Flather, M.D.; Anderson, F.A.; et al. Prediction of risk of death and myocardial infarction in the six months after presentation with acute coronary syndrome: Prospective multinational observational study (GRACE). BMJ 2006, 333, 1091. [Google Scholar] [CrossRef] [Scilit] [PubMed] [PubMed Central]
- Prescott, E.; Eser, P.; Mikkelsen, N.; Holdgaard, A.; Marcin, T.; Wilhelm, M.; Gil, C.P.; González-Juanatey, J.R.; Moatemri, F.; Iliou, M.C.; et al. Cardiac rehabilitation of elderly patients in eight rehabilitation units in western Europe: Outcome data from the EU-CaRE multi-centre observational study. Eur. J. Prev. Cardiol. 2020, 27, 1716–1729. [Google Scholar] [CrossRef] [Scilit] [PubMed]
- Prescott, E.; Mikkelsen, N.; Holdgaard, A.; Eser, P.; Marcin, T.; Wilhelm, M.; Gil, C.P.; González-Juanatey, J.R.; Moatemri, F.; Iliou, M.C.; et al. Cardiac rehabilitation in the elderly patient in eight rehabilitation units in Western Europe: Baseline data from the EU-CaRE multicentre observational study. Eur. J. Prev. Cardiol. 2019, 26, 1052–1063. [Google Scholar] [CrossRef] [Scilit] [PubMed]
- Lundberg, S.M.; Lee, S.I. A unified approach to interpreting model predictions. In Proceedings of the 31st Conference on Neural Information Processing Systems (NIPS 2017); Curran Associates, Inc.: Long Beach, CA, USA, 2017; pp. 4765–4774. [Google Scholar]
- Ke, G.; Meng, Q.; Finley, T.; Wang, T.; Chen, W.; Ma, W.; Ye, Q.; Liu, T.Y. LightGBM: A highly efficient gradient boosting decision tree. In Proceedings of the 31st International Conference on Neural Information Processing Systems; Curran Associates Inc.: Long Beach, CA, USA, 2017; pp. 3149–3157. [Google Scholar]
- Prescott, E.; Meindersma, E.P.; van der Velde, A.E.; Gonzalez-Juanatey, J.R.; Iliou, M.C.; Ardissino, D.; Zoccai, G.B.; Zeymer, U.; Prins, L.F.; Hof, A.W.V.; et al. A EUropean study on effectiveness and sustainability of current Cardiac Rehabilitation programmes in the Elderly: Design of the EU-CaRE randomised controlled trial. Eur. J. Prev. Cardiol. 2016, 23, 27–40. [Google Scholar] [CrossRef] [Scilit] [PubMed]
- Gao, Y.; Li, S.; Jin, Y.; Zhou, L.; Sun, S.; Xu, X.; Li, S.; Yang, H.; Zhang, Q.; Wang, Y.; et al. An Assessment of the Predictive Performance of Current Machine Learning-Based Breast Cancer Risk Prediction Models: Systematic Review. JMIR Public Health Surveill. 2022, 8, e35750. [Google Scholar] [CrossRef] [Scilit] [PubMed] [PubMed Central]
- Smith, L.A.; Oakden-Rayner, L.; Bird, A.; Zeng, M.; To, M.S.; Mukherjee, S.; Palmer, L.J. Machine learning and deep learning predictive models for long-term prognosis in patients with chronic obstructive pulmonary disease: A systematic review and meta-analysis. Lancet Digit. Health 2023, 5, e872–e881. [Google Scholar] [CrossRef] [Scilit] [PubMed]
- Katakami, N. Mechanism of Development of Atherosclerosis and Cardiovascular Disease in Diabetes Mellitus. J. Atheroscler. Thromb. 2018, 25, 27–39. [Google Scholar] [CrossRef] [Scilit] [PubMed] [PubMed Central]
- The Emerging Risk Factors Collaboration. Diabetes mellitus, fasting blood glucose concentration, and risk of vascular disease: A collaborative meta-analysis of 102 prospective studies. Lancet 2010, 375, 2215–2222. [Google Scholar] [CrossRef] [Scilit] [PubMed] [PubMed Central]
- Stens, N.A.; Bakker, E.A.; Mañas, A.; Buffart, L.M.; Ortega, F.B.; Lee, D.C.; Thompson, P.D.; Thijssen, D.H.; Eijsvogels, T.M. Relationship of Daily Step Counts to All-Cause Mortality and Cardiovascular Events. J. Am. Coll. Cardiol. 2023, 82, 1483–1494. [Google Scholar] [CrossRef] [Scilit] [PubMed]
- Byrne, R.A.; Rossello, X.; Coughlan, J.J.; Barbato, E.; Berry, C.; Chieffo, A.; Claeys, M.J.; Dan, G.-A.; Dweck, M.R.; Galbraith, M.; et al. 2023 ESC Guidelines for the management of acute coronary syndromes. Eur. Heart J. 2023, 44, 3720–3826. [Google Scholar] [CrossRef] [Scilit] [PubMed]
- Canto, J.G.; Kiefe, C.I.; Rogers, W.J.; Peterson, E.D.; Frederick, P.D.; French, W.J.; Gibson, C.M.; Pollack, C.V.; Ornato, J.P.; Zalenski, R.J.; et al. Number of coronary heart disease risk factors and mortality in patients with first myocardial infarction. JAMA 2011, 306, 2120–2127. [Google Scholar] [CrossRef] [Scilit] [PubMed] [PubMed Central]
- Sritharan, H.P.; Nguyen, H.; Ciofani, J.L.; Bhindi, R.; Allahwala, U.K. Development and validation of a machine learning model for prediction of 1-year mortality following ST-elevation myocardial infarction: A retrospective cohort study. BMJ Open 2026, 16, e101656. [Google Scholar] [CrossRef] [Scilit] [PubMed] [PubMed Central]
- Min, J.K.; Dunning, A.; Lin, F.Y.; Achenbach, S.; Al-Mallah, M.; Budoff, M.J.; Cademartiri, F.; Callister, T.Q.; Chang, H.-J.; Cheng, V.; et al. Age- and sex-related differences in all-cause mortality risk based on coronary computed tomography angiography findings results from the International Multicenter CONFIRM (Coronary CT Angiography Evaluation for Clinical Outcomes: An International Multicenter Registry) of 23,854 patients without known coronary artery disease. J. Am. Coll. Cardiol. 2011, 58, 849–860. [Google Scholar] [CrossRef] [Scilit] [PubMed]
- Engelbertz, C.; Pinnschmidt, H.O.; Freisinger, E.; Reinecke, H.; Schmitz, B.; Fobker, M.; Schmieder, R.E.; Wegscheider, K.; Breithardt, G.; Pavenstädt, H.; et al. Sex-specific differences and long-term outcome of patients with coronary artery disease and chronic kidney disease: The Coronary Artery Disease and Renal Failure (CAD-REF) Registry. Clin. Res. Cardiol. Off. J. Ger. Card. Soc. 2021, 110, 1625–1636. [Google Scholar] [CrossRef] [Scilit] [PubMed] [PubMed Central]
- Engelbertz, C.; Reinecke, H.; Breithardt, G.; Schmieder, R.E.; Fobker, M.; Fischer, D.; Schmitz, B.; Pinnschmidt, H.O.; Wegscheider, K.; Pavenstädt, H.; et al. Two-year outcome and risk factors for mortality in patients with coronary artery disease and renal failure: The prospective, observational CAD-REF Registry. Int. J. Cardiol. 2017, 243, 65–72. [Google Scholar] [CrossRef] [Scilit] [PubMed]
- Chopannejad, S.; Sadoughi, F.; Bagherzadeh, R.; Shekarchi, S. Predicting Major Adverse Cardiovascular Events in Acute Coronary Syndrome: A Scoping Review of Machine Learning Approaches. Appl. Clin. Inform. 2022, 13, 720–740. [Google Scholar] [CrossRef] [Scilit] [PubMed] [PubMed Central]

Disclaimer/Publisher’s Note: The statements, opinions and data contained in all publications are solely those of the individual author(s) and contributor(s) and not of MDPI and/or the editor(s). MDPI and/or the editor(s) disclaim responsibility for any injury to people or property resulting from any ideas, methods, instructions or products referred to in the content. |
© 2026 by the authors. Licensee MDPI, Basel, Switzerland. This article is an open access article distributed under the terms and conditions of the Creative Commons Attribution (CC BY) license.