


Abstract
Warfarin dosing is complicated by wide inter-patient variability driven by genetic, demographic, and pharmacological factors. Although machine learning approaches to dose prediction have been widely studied, published evaluations are frequently affected by analysis-domain data leakage, small held-out sets, and an absence of calibration and fairness assessment across ancestry subgroups. We describe WarfaRisk, a nine-phase open-source machine learning pipeline for warfarin dose prediction evaluated on two public International Warfarin Pharmacogenetics Consortium (IWPC) cohorts ( and , the latter a non-independent secondary consistency check) using fixed patient-level splits and a single documented random seed. The pipeline incorporates leakage-free preprocessing, nested clinical and pharmacogenomic feature ablation across nine model architectures, leave-one-ancestry-out portability assessment with a cross-model robustness check, conformal prediction calibration reported at subgroup resolution, and individual-level SHapley Additive exPlanations (SHAP) feature attribution. The nine-architecture ablation results reported here are from the primary cohort, IWPC-6256; the complete two-cohort comparison is reported in a companion evaluation manuscript. A prototype web-based clinical decision support interface integrates dose recommendation, uncertainty quantification, and SHAP explainability with a Fast Healthcare Interoperability Resources (FHIR) R4 endpoint. In preliminary evaluation on a single fixed held-out split, Model Agnostic Prediction Interval Estimator (MAPIE) cross-conformal (5-fold CV+) prediction achieves coverage close to its nominal target when measured across each cohort as a whole. When this coverage is instead stratified by ancestry, a different pattern emerges: coverage for African-ancestry patients falls well short, a gap the aggregate number hides, plausibly explained by alleles missing from the standard IWPC genotype panel and supported by independent pharmacogenetic literature, though not directly demonstrated in this dataset. These findings indicate that subgroup-level calibration reporting is necessary, not optional, since its absence can let a model appear well-calibrated in aggregate while failing a specific population in practice.
1. Introduction
Warfarin remains one of the most widely used oral anticoagulants worldwide despite growing adoption of direct oral anticoagulants (DOACs) [1], and continues to be indicated for stroke prevention in atrial fibrillation, treatment of venous thromboembolism, and mechanical heart valve replacement [2]. Its narrow therapeutic index makes correct dosing clinically decisive: under-dosing risks thromboembolic events while over-dosing risks major hemorrhage, and the stable therapeutic dose varies up to ten-fold across patients due to genetic, demographic, and drug interaction effects [3]. This dosing challenge has made warfarin one of the most-studied targets in both pharmacogenomics and, increasingly, clinical machine learning (ML).
Published reviews of ML approaches to warfarin dosing [4,5,6] identify several recurring methodological limitations that make cross-study comparisons difficult and may inflate reported accuracy. These include preprocessing before train–test splitting, which lets test-set information influence training, and small held-out sets that produce unstable metrics; some prior work reports confidence intervals for point-accuracy metrics, but calibration and prediction-interval coverage are rarely reported, and per-subgroup calibration reporting remains rarer still. To our knowledge, no published warfarin dosing study has simultaneously applied ancestry group exclusion and evaluated per-subgroup calibration on the same dataset and fixed split. Separately, the genotype panel most published work relies on, from the International Warfarin Pharmacogenetics Consortium (IWPC), omits CYP2C9*5 (rs28371686), CYP2C9*6 (rs9332131), CYP2C9*8 (rs7900194), and CYP2C9*11 (rs28371685) alleles alongside rs12777823, variants that are disproportionately relevant to patients of African descent [7], a gap invisible to aggregate evaluation metrics. Four independent studies quantify this gap’s consequences directly. Cosgun et al. show that replacing a fixed low-dimensional genotype panel with genome-wide SNP data and a random-forest regressor raises variance explained for African-American dose prediction to , more than double the ∼27% typically reported for this population under standard panels [8]. Perera et al. independently identify rs12777823, in the CYP2C gene cluster upstream of CYP2C18, as explaining approximately 5% of dose variance in African-ancestry patients on its own, roughly what CYP2C9*2 (rs1799853) and CYP2C9*3 (rs1057910) explain in European-ancestry patients but far more than the 1–2% those same variants explain in African Americans; adding it to the IWPC algorithm improves variance explained by 21% relative to the panel without it [9]. Drozda et al. show what this gap costs in practice: the warfarindosing.org algorithm over-predicted dose by a median of 2.2 mg/day in CYP2C9 variant carriers and 1.2–2.0 mg/day in rs12777823 heterozygotes and homozygotes, a bias that a modified algorithm incorporating both variants corrects essentially to zero (predicted 6.6 mg/day against an observed 6.6 mg/day, ) [10], and Gottlieb et al. show that imputing tissue-specific gene expression correlated with rs12777823 partially recovers the accuracy lost when the variant itself is unavailable [11]. More recently, targeted genotyping of rs28371686 and genome-wide screens for copy-number variation have continued to refine which African-ancestry variants a complete dosing model should include [12,13].
This paper describes WarfaRisk, a nine-phase open-source ML pipeline that addresses these methodological gaps within a single reproducible system. Six core pipeline phases are fully implemented and evaluated on two separate public IWPC cohorts; three extension phases are implemented and under active validation; a prototype web-based clinical decision support interface is integrated with a Fast Healthcare Interoperability Resources (FHIR) R4 endpoint. The central finding is that conformal prediction coverage looks close to nominal when averaged across a cohort, yet specific ancestry subgroups fall well short once the aggregate is unpacked, a gap that population-level evaluation alone cannot reveal.
Section 2, Section 3 and Section 4 cover related work, system design, and a clinical use case scenario. Section 5 describes the prototype clinical interface. Section 6 reports preliminary evaluation results, Section 7 covers implementation and artifact availability, Section 8 discusses implications and prototype maturity, and Section 9 concludes.
2. Related Work
2.1. Machine Learning for Warfarin Dosing
The dominant approach in the warfarin dosing literature is supervised regression on cohort data using clinical and pharmacogenomic features. The foundational IWPC pharmacogenetic equation [2] remains the reference clinical baseline, derived from 4043 patients across 21 centers; Gage et al. [14] independently derived a similar equation incorporating amiodarone use and target INR range. CYP2C9 and VKORC1 variants together explain the majority of inter-patient dose variance [3,7], motivating the continued use of pharmacogenomic features even as purely clinical ML models improve.
Subsequent ML studies have tested linear models, random forests, gradient boosting, stacking ensembles [15], feedforward and deep neural networks [16,17], and hybrid pharmacokinetic-ML approaches [6]. Truda and Marais [18] provide one of the more rigorous multi-model comparisons using a common software framework, though without ancestry-stratified or calibration evaluation. Petch et al. [19] demonstrate ML-based dose optimization for atrial fibrillation patients, while Steiner et al. [20] and Asiimwe et al. [21] address dosing in Latin American and sub-Saharan African populations, respectively, two of the few studies that center non-European cohorts. Fulop et al. [4] and Asiimwe et al. [5] both conclude that reported accuracy improvements across the literature are difficult to compare because preprocessing and splitting protocols vary substantially between studies. WarfaRisk closes this gap at the infrastructure level: split files are fixed and distributed, a leakage audit runs before any training begins, and all nine model families are scored on the same held-out patients under one documented seed.
2.2. Calibration and Uncertainty in Clinical ML
Calibration refers to the alignment between a model’s stated confidence and empirical outcome frequencies (for classifiers) or the empirical coverage of prediction intervals (for regressors). Poorly calibrated models pose a clinical risk because they may appear confident despite producing incorrect predictions. Conformal prediction provides distribution-free coverage guarantees and has seen growing adoption in clinical settings [22]. Standard conformal prediction, including the 5-fold CV+ variant used for the primary MAPIE result in this manuscript, guarantees only marginal coverage across the full population; conditional or Mondrian conformal methods [23] extend the guarantee to pre-specified subgroups directly, at the cost of requiring per-group calibration data, and are the appropriate comparator for the subgroup-coverage gap reported in Section 6.2. Neither guarantee extends to individual-level calibration, that is, validity conditional on a specific patient’s full covariate profile rather than on group membership; exact conditional coverage of this kind is provably unattainable by any distribution-free method without further distributional assumptions [24], so the group-conditional result reported below should not be read as certifying that any single patient’s interval is correctly calibrated for that patient specifically. We implement and directly benchmark a Mondrian conformal predictor against MAPIE below (Section 6.2), rather than treating this comparison as future work; the subgroup-coverage gap itself is presented as an expected consequence of marginal-only calibration, not a novel property of conformal prediction. Despite growing adoption, calibration reporting remains rare in the warfarin dosing literature [4], and no published warfarin dosing study, as far as we are aware, stratifies prediction interval coverage by ancestry.
2.3. Fairness and Ancestry Stratification
Disparate model performance across demographic and ancestry subgroups is a well-documented problem in clinical AI [25,26]. For warfarin specifically, the relevance is concrete: the rs28371686, rs9332131, rs7900194, and rs28371685 alleles (absent from the standard IWPC genotyping panel) are disproportionately prevalent in patients of African descent and substantially affect warfarin metabolism [7]. This panel gap has a measurable dosing consequence for African-ancestry patients, detailed above with specific effect sizes from four independent studies [8,9,10,11] and more recent work [12,13]. This genotype panel gap means that models trained and evaluated on IWPC data may be systematically under-specified for African-ancestry patients, and no evaluation protocol currently in use, to our knowledge, makes this gap visible. Similar concerns exist for Middle Eastern and North African populations, where CYP2C9 and VKORC1 allele frequencies differ from both European and African-ancestry reference populations [27,28], yet representation in the IWPC cohort is limited. WarfaRisk responds to this gap with leave-one-ancestry-out evaluation and per-subgroup calibration reporting, both computed on the same fixed dataset and split; a planned extension will carry the same framework to MENA populations using locally available allele-frequency data.
2.4. Reproducibility in Clinical ML
McDermott et al. [29] trace much of clinical ML’s irreproducibility to three recurring causes: preprocessing that is not held consistent across folds, seeds left unfixed, and splits that are never released. WarfaRisk addresses each directly: preprocessing is fit exclusively on the training fold, every random seed is fixed and documented, and split files ship with the open-source repository.
3. System Design
3.1. Overview
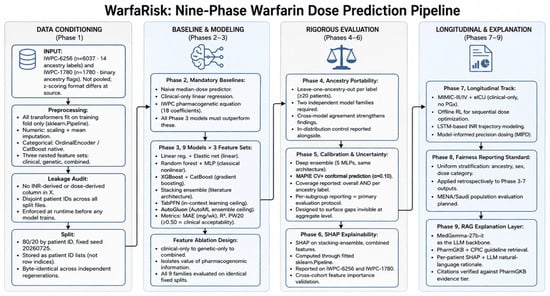
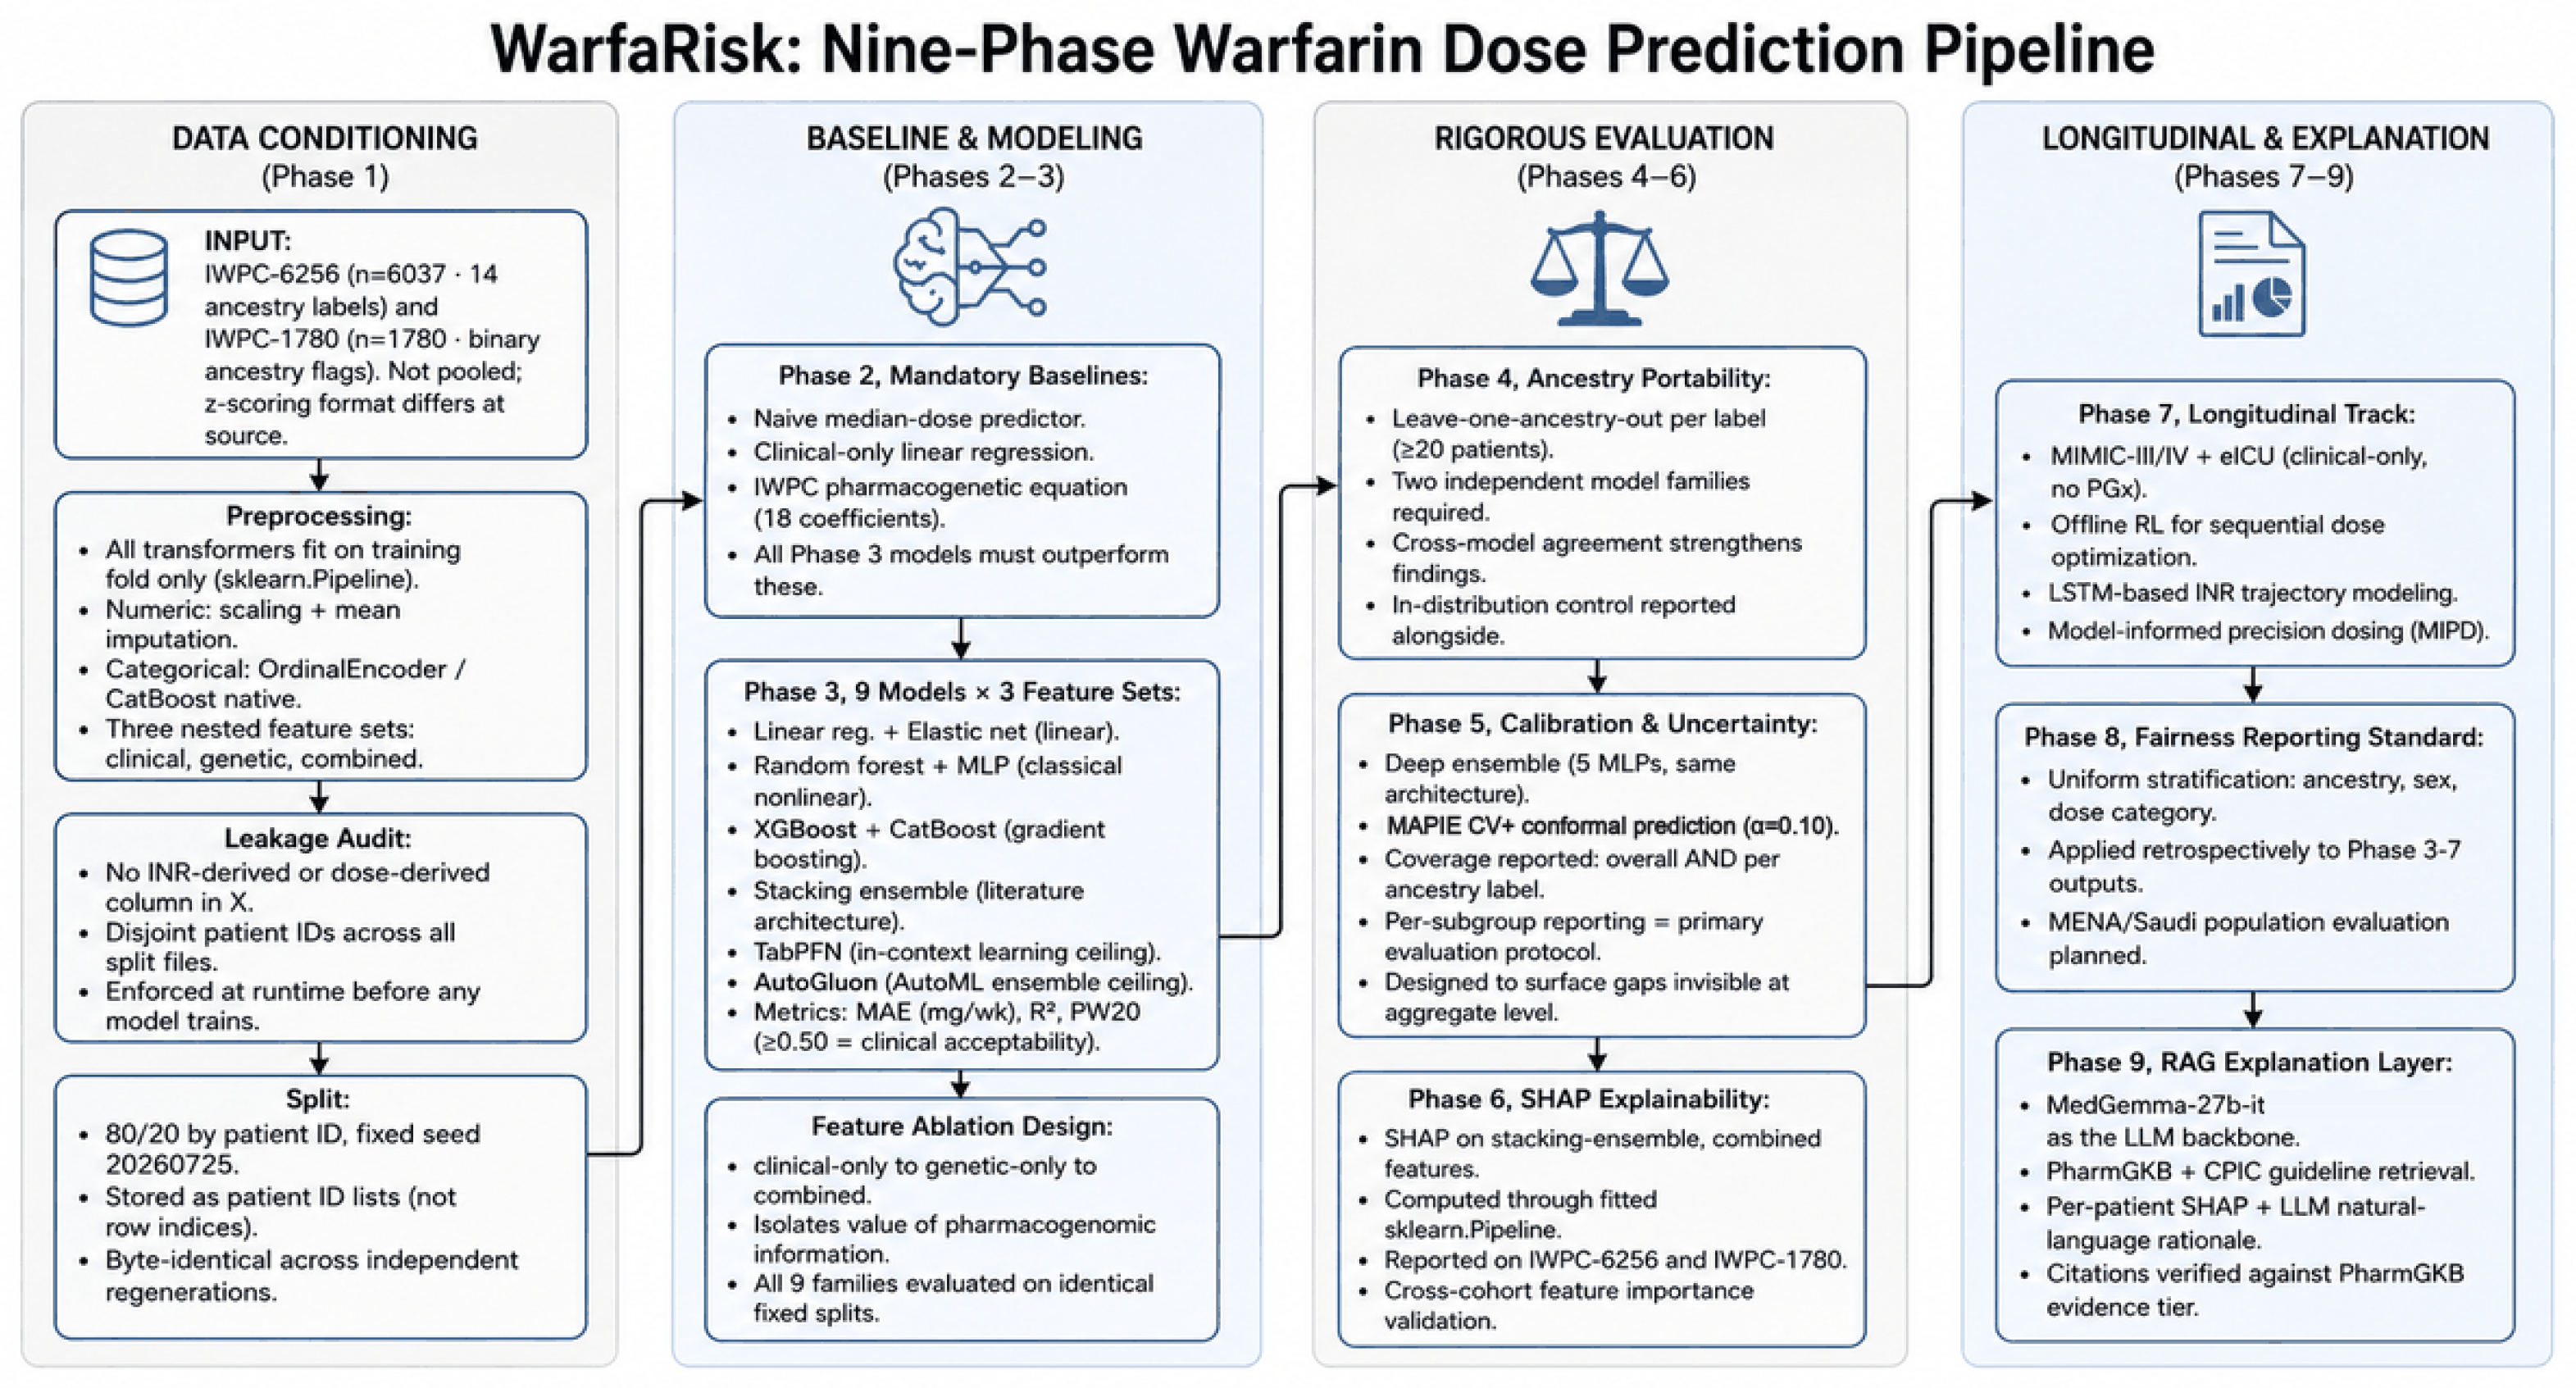
Figure 1 shows WarfaRisk’s nine-phase architecture. Phases 1–6 form the core evaluated pipeline; Phases 7–9 are implemented extensions at prototype stage. The pipeline is structured as a modular Python 3.11 package with one module per phase; each phase is invoked explicitly, so no computation executes unless called, enabling safe use in both interactive and automated environments. All phases consume the same fixed patient-level split files, ensuring that every reported metric is directly comparable across experiments.
Figure 1.
WarfaRisk’s nine-phase pipeline architecture. Phases 1–6 form the fully evaluated core; Phases 7–9 extend the pipeline with longitudinal dosing, fairness reporting, and SHAP-conditioned RAG-based LLM explanations (open-weight backend, MedGemma-27b-it, served via Hugging Face Inference Providers, with local execution a planned next step). All phases consume the same fixed split files. Diagram image generated with the assistance of ChatGPT (GPT-5.6, OpenAI); pipeline structure and content designed and verified by the authors.
Generative artificial intelligence (GenAI) disclosure: ChatGPT (GPT-5.6, OpenAI) was used to assist in generating the visual layout of the pipeline diagram in Figure 1 and, to a limited extent, in language editing of the manuscript text. The pipeline’s structure and technical content were designed and verified by the authors, who reviewed and edited all AI-assisted output and take full responsibility for the content of this publication. No GenAI tool was used for study design, data collection, analysis, interpretation, or generation of scientific conclusions.
3.2. Data and Feature Architecture
WarfaRisk is built on two public IWPC cohorts, both derived from the same International Warfarin Pharmacogenetics Consortium data release hosted by PharmGKB. IWPC-6256 ( after cleaning, primary cohort), redistributed via the warfit_learn benchmarking package [18], provides rich ancestry labels (14 distinct values with ≥20 patients each), continuous age/weight/height, and a multi-tier CYP2C9 star-allele consensus. Ancestry labels are IWPC’s own self-reported Race (Reported) field, used verbatim rather than harmonized into a controlled vocabulary; each patient carries exactly one such value, so labels that appear similar (Black, Black or African American, African-American) are mutually exclusive as recorded, not overlapping sets, though they plausibly represent a single population recorded under different site-specific labels. This field is missing for 506 of 6037 IWPC-6256 patients (8.4%; 87 of 1207 in the held-out test fold, 7.2%); these patients are included in every aggregate metric but excluded from per-ancestry tables. These labels are used throughout as a proxy for population-level CYP2C9/VKORC1 allele-frequency differences, not as validated clinical categories. IWPC-1780 (, secondary cohort used as a non-independent consistency check), redistributed via the simsl R package 0.2.1 [30], uses binary ancestry flags (Black, Asian) and pre-z-scored continuous features; it is not pooled with IWPC-6256 because z-scoring at source prevents a common preprocessing pipeline. Patient-level independence between the two cohorts cannot be verified given the identifiers available in either public release (see Section 8.5).
Each cohort is processed into three nested feature sets: clinical (age, weight, height, indication, comorbidity flags for diabetes, heart failure, and smoking, comedication flags for amiodarone, statins, and enzyme inducers), genetic (CYP2C9 star-allele consensus encoded as an ordinal metabolizer score, VKORC1 1639G>A (rs9923231) consensus as a categorical), and combined (union of both). The nested structure enables a controlled ablation of genetic information value, which is the central modeling question for clinical deployment in settings where genotyping may not be available.
Both cohorts are split 80/20 by patient ID with a fixed seed (20260725). Patient-level split membership files are distributed with the repository. Two independent regenerations from the same seed produced byte-identical splits, confirming determinism.
The IWPC cohort under-represents Middle Eastern and North African populations, which have distinct CYP2C9 and VKORC1 allele frequencies from European and African-ancestry reference populations [27,28]. A planned Phase 8 extension will test IWPC-trained models on Saudi and Gulf population data from the collaborating institutions.
The genetic signal motivating the combined feature set is substantial: in IWPC-6256, VKORC1 1639G>A (rs9923231) genotype alone stratifies weekly dose strongly, with the AA homozygous group requiring roughly half the dose of the GG group.
3.3. Phase 1: Data Conditioning and Leakage Audit
All imputation and scaling transformers are fit exclusively on the training fold before being applied to the test fold. Categorical genotype columns are encoded natively where supported or via ordinal encoding for models that require numeric input; target-encoding and any statistic derived from dose values is strictly excluded.
Before any model is trained, a leakage audit module executes 11 checks: (1) no INR-derived column in X, (2) no dose-derived column in X, (3) disjoint patient IDs across train and test for all five split files, (4) imputer fitted only on train, (5) scaler fitted only on train, (6) no cross-split statistics used in encoding, and (7)–(11) analogous checks for IWPC-1780. These checks cover transformations this pipeline itself performs; they cannot detect leakage introduced upstream, before the data reach this pipeline. IWPC-1780’s continuous covariates are z-scored at the source using the full released sample, prior to any split this pipeline applies, a limitation discussed in Section 8.5. The audit is enforced at runtime; any failure raises an exception that halts the pipeline before a single model weight is updated.
3.4. Phase 2: Mandatory Baselines
Three baselines set the performance floor for all subsequent comparisons. The naive median-dose predictor always outputs the training-fold median dose. The clinical-only linear regression uses only the clinical feature set. The IWPC pharmacogenetic equation implements the published square-root-of-dose formula [2], with coefficients transcribed from the widely published, widely cited form of the equation rather than re-derived from the original paper’s table, providing a pharmacology-grounded reference that incorporates both clinical and genetic factors. Every model evaluated in Phase 3 is assessed against all three baselines; results that do not exceed the IWPC pharmacogenetic equation offer no demonstrated advantage over the currently recommended clinical formula.
3.5. Phase 3: Nested Feature Ablation
Nine model architectures are trained on each of the three feature sets on the identical fixed splits: linear regression and elastic net (linear baselines), random forest and MLP (classical nonlinear), XGBoost and CatBoost [31] (gradient boosting; CatBoost designated as the production comparator due to its native handling of categorical genotype encodings), stacking ensemble [15] (inspired by the design of the literature’s best-reported method, with different base learners), TabPFN [32] (in-context learning, zero-hyperparameter-tuning ceiling), and AutoGluon [33] with its highest quality preset and a per-model time limit of 600 s (automated ensemble, accuracy ceiling). No architecture’s hyperparameters were tuned against the held-out test set: the other eight architectures use fixed hyperparameters rather than a search procedure, TabPFN performs no hyperparameter search by design, and AutoGluon’s automated model selection operates only on the training fold; every architecture’s test fold is used exactly once, for final evaluation.
All models report three metrics: MAE (mg/week, primary; lower is better), (variance explained; higher is better), and PW20 (proportion of predictions within 20% of the true dose, the performance criterion IWPC used to assess clinically meaningful accuracy [2]; we report PW20 ≥ 0.50 as a commonly cited reference point in the ML literature, not as an IWPC-defined universal threshold).
3.6. Phase 4: Ancestry-Stratified Portability Validation
For every ancestry label with ≥20 patients in the test set, two different model architectures (stacking ensemble and CatBoost) are each retrained on the full training set excluding all patients with that label, then evaluated only on the held-out label group. An in-distribution control (trained on all labels, tested on the label) is reported alongside. Using two architectures on the same data, features, outcomes, and split is not independent statistical verification, since neither the data nor the split differs between them; agreement between the two is better described as robustness across model classes, ruling out an artifact of one architecture’s inductive bias, rather than proof of a genuine subgroup effect. Disagreement between the two is reported as inconclusive. IWPC-6256 yields 14 evaluable labels; IWPC-1780 yields three.
3.7. Phase 5: Calibration at Subgroup Resolution
Three approaches to predictive uncertainty are evaluated. The deep ensemble is an ensemble of five point-prediction MLPs with identical architecture but different random seeds; it uses the inter-model mean as the point prediction and mean ± 1.645 as a nominal 90% band. The inter-model spread captures model disagreement only. Unlike the full deep-ensemble method of Lakshminarayanan et al. [34], whose members also predict a noise variance, these members are point predictors, so the band omits the noise term, assumes Gaussian errors, and has no coverage guarantee. It is an uncalibrated baseline for comparison with the conformal methods. MAPIE (Model Agnostic Prediction Interval Estimator) [22] applies cross-conformal prediction () wrapped around the fitted stacking-ensemble model. Calibration uses MAPIE’s CrossConformalRegressor class (requires MAPIE 1.4 or newer), applying its CV+ variant with the default absolute-residual nonconformity score, which rotates the calibration role across five internal folds of the training set (n = 4830; approximately 966 patients per fold) rather than holding out one fixed subset; every training-fold patient is therefore used for calibration in exactly one fold and never calibrates the same fold used to fit the model in that rotation, providing a coverage guarantee that holds marginally under the exchangeability assumption (formally at least for CV+, and typically close to in practice). The held-out test fold () is not involved in fitting or calibration at any point; it is used only for the final coverage evaluation reported below. A Mondrian (group-conditional) split conformal predictor is implemented directly against the same fitted stacking-ensemble model: 20% of the training fold is held out as a single calibration set (unlike the CV+ procedure above), and a separate nonconformity quantile is computed per ancestry label from that label’s own calibration residuals, rather than one pooled quantile across all patients. Ancestry labels with fewer than 10 calibration points are pooled into the overall calibration set instead of receiving an unstable quantile computed from too few points; this pooling threshold is a stated implementation choice, not a property of Mondrian conformal prediction itself.
Calibration is evaluated as empirical coverage: the fraction of test patients whose true dose falls within the stated 90% interval. Coverage is reported both overall and per ancestry label, enabling subgroup calibration failures to surface even when aggregate coverage appears nominal. This per-subgroup reporting protocol is the primary evaluation innovation WarfaRisk introduces; it requires no changes to the underlying models, only to the analysis stage.
3.8. Phase 6: SHAP Explainability
SHapley Additive exPlanations (SHAP) [35] feature attributions are computed for the stacking-ensemble model trained on the combined feature set, using a tabular masker constructed from the training data. Attribution is computed through the fitted preprocessing pipeline, ensuring that SHAP values reflect the full transformation applied to each input feature. Mean absolute SHAP values are reported for both IWPC-6256 and IWPC-1780 to assess consistency of feature importance across cohorts. The background set for SHAP’s model-agnostic explainer is a fixed 200-patient subsample of the input data (seed 0, distinct from the pipeline’s standard seed 20260725 used elsewhere), chosen for computational tractability at this project’s scale rather than the full cohort. Categorical features are integer-coded for SHAP’s internal perturbation step only; the wrapped prediction function decodes these back to their original categories before calling the actual fitted pipeline, which one-hot encodes internally, so the reported attributions describe the model that was actually trained, not a separate model refit on integer codes. Explanation stability is assessed by cross-validating the SHAP ranking against an independently fit Explainable Boosting Machine, a glass-box model whose feature contributions are exact rather than a post hoc approximation; this comparison is reported in the companion evaluation manuscript rather than reproduced here.
3.9. Phase 7: Longitudinal Dosing Track
This phase extends the pipeline to longitudinal dosing scenarios by incorporating sequential INR time-series data from MIMIC-III/IV [36,37] and eICU [38]. Because these ICU datasets contain no genotype information, Phase 7 constitutes a deliberate clinical-only test of the pipeline, distinct from the pharmacogenomic evaluation conducted in Phases 3–5.
Three uncertainty-aware sequential modeling approaches are implemented: offline reinforcement learning [39,40], long short-term memory (LSTM) trajectory modeling [41], and model-informed precision dosing simulation [42]. Each approach is evaluated against the MIMIC-III warfarin benchmark of Wani and Abeer [43], extended here with the ancestry-stratified fairness reporting protocol of Phase 5.
3.10. Phase 8: Fairness Reporting Standardization
A uniform fairness-reporting standard is enforced across all result tables in Phase 8, stratified by ancestry, sex, and dose category and applied retrospectively to the outputs of Phases 3–7. The reporting protocol follows the recommendations of Obermeyer et al. [25] and is extended with the per-subgroup calibration assessment of Phase 5, ensuring that fairness evaluation encompasses prediction interval reliability at subgroup resolution and is not limited to accuracy metrics alone.
This retrospective standardization enables direct comparison of fairness outcomes across all nine model families and both cohorts without requiring any modification to the underlying models or evaluation splits.
3.11. Phase 9: Retrieval-Augmented Explanation
A retrieval-augmented generation (RAG) explanation layer is implemented in Phase 9, grounded in PharmGKB/CPIC guideline text [7,44] and per-patient SHAP attributions from Phase 6. The retrieval corpus is open-weight and hosted locally. The generator is the domain-specialized, open-weight MedGemma-27b-it [45], served through Hugging Face’s Inference Providers in the current interface build, with a 60 s timeout and an explicit error returned rather than failing silently. Running this model locally instead, for fully offline hospital-intranet deployments, is the intended design and a planned next step, not yet how the current interface build operates. A prototype-level check of three sample calls to the Hugging Face path completed in 10.4–24.4 s; a larger-scale benchmark is identified as a next step. The retrieval query itself is SHAP-conditioned rather than fixed: it is built from the specific patient’s own top-ranked SHAP feature-attribution names, plus the ancestry-subgroup calibration status when coverage is sub-nominal, so the passages retrieved adapt to what is actually driving that patient’s prediction rather than a generic ancestry-and-genotype template.
Each citation in the generated dosing rationale is verified against the PharmGKB evidence tier before inclusion, ensuring that natural-language explanations are grounded in evidence-ranked pharmacogenomic literature rather than model-generated assertions.
Concurrent work has applied retrieval-augmented generation to pharmacogenomics more broadly: PGxRAG [46] wraps four base LLMs with a retrieval index built from PharmGKB/ClinPGx, CPIC, KNMP, and FDA guideline text to answer general, drug- and condition-agnostic pharmacogenomics questions. WarfaRisk’s Phase 9 differs in scope and integration rather than in the RAG mechanism itself: it is warfarin-specific, retrieves passages alongside a specific patient’s SHAP feature attributions from a live trained model rather than answering a standalone query, and adds a citation-faithfulness verification step that checks every bracketed citation in the generated text against the retrieved passages and SHAP outputs before display, flagging any unverified claim in the interface rather than presenting it as equally grounded.
4. Clinical Use Case
The scenario below is a hypothetical walkthrough, not an actual clinical encounter or a demonstrated outcome, consistent with the prototype’s TRL 4–5 status and the absence of prospective clinical evaluation discussed in Section 8.
WarfaRisk is designed for use at the point of warfarin initiation, when a clinician must choose a starting dose without the benefit of serial INR measurements. The model itself is trained to predict a patient’s stable maintenance dose, the dose that keeps INR in therapeutic range once treatment has equilibrated, not a starting-dose algorithm in its own right; using a predicted stable dose to inform an initial dosing decision, then titrating by INR as usual, mirrors how CPIC-endorsed pharmacogenetic algorithms are already applied in practice [7], but the safety of that specific initiation-time application is a separate question from the accuracy of the underlying stable-dose prediction, and has not been independently validated here. Consider a 68-year-old male patient of Han Chinese ancestry presenting for anticoagulation for newly diagnosed atrial fibrillation, with a body weight of 72 kg, no amiodarone use, and available CYP2C9/VKORC1 genotyping. Standard practice initiates warfarin at 5 mg/day and titrates over 2–4 weeks; WarfaRisk illustrates how a genetics-informed alternative starting point could be presented, pending the prospective clinical evaluation discussed in Section 8.
Given the patient’s combined clinical and genetic features, WarfaRisk returns: (i) a point prediction of stable therapeutic weekly dose from the fitted stacking-ensemble model; (ii) a 90% conformal prediction interval (MAPIE), together with a flag if the patient’s ancestry group has empirical sub-group coverage below nominal; (iii) a SHAP attribution showing which features drove the prediction, ordered by absolute importance, with VKORC1 genotype expected to dominate.
For this patient, Phase 4 data may indicate a portability penalty if the patient’s ancestry group was systematically underrepresented in training, and this is surfaced as a flag in the interface. Phase 5 calibration data also let the system distinguish between aggregate coverage, which may appear acceptable, and per-ancestry subgroup coverage, which may differ substantially. For patient populations where the IWPC genotype panel is known to be incomplete (such as African-ancestry patients who lack rs28371686/rs9332131/rs7900194/rs28371685 allele data), the interface displays an explicit calibration caveat alongside the prediction interval. A system that surfaces this distinction explicitly at the point of care is qualitatively different from one that reports only a population-level accuracy figure.
5. Prototype Clinical Interface
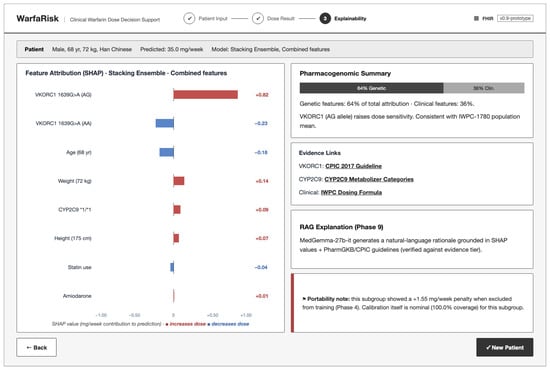
WarfaRisk includes a prototype web-based clinical decision support interface that exposes the Phase 3–6 pipeline outputs at the point of care. This label describes the interface’s intended role, not a validated clinical tool: none of its functions, dose recommendation, calibration flag, portability flag, or SHAP explanation, have undergone formal safety validation, and clinical-readiness should not be inferred until they are. The interface is implemented as a single-page application served by a lightweight Python 3.11 backend, designed for operation within a hospital intranet without requiring external network connectivity. Figure 2, Figure 3, Figure 4 and Figure 5 illustrate the three-screen prototype interface corresponding directly to the clinical decision workflow: patient data entry, dose recommendation with uncertainty quantification, and feature attribution for explainability.
Figure 2.
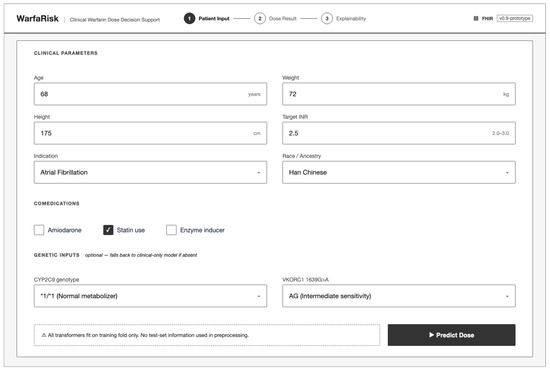
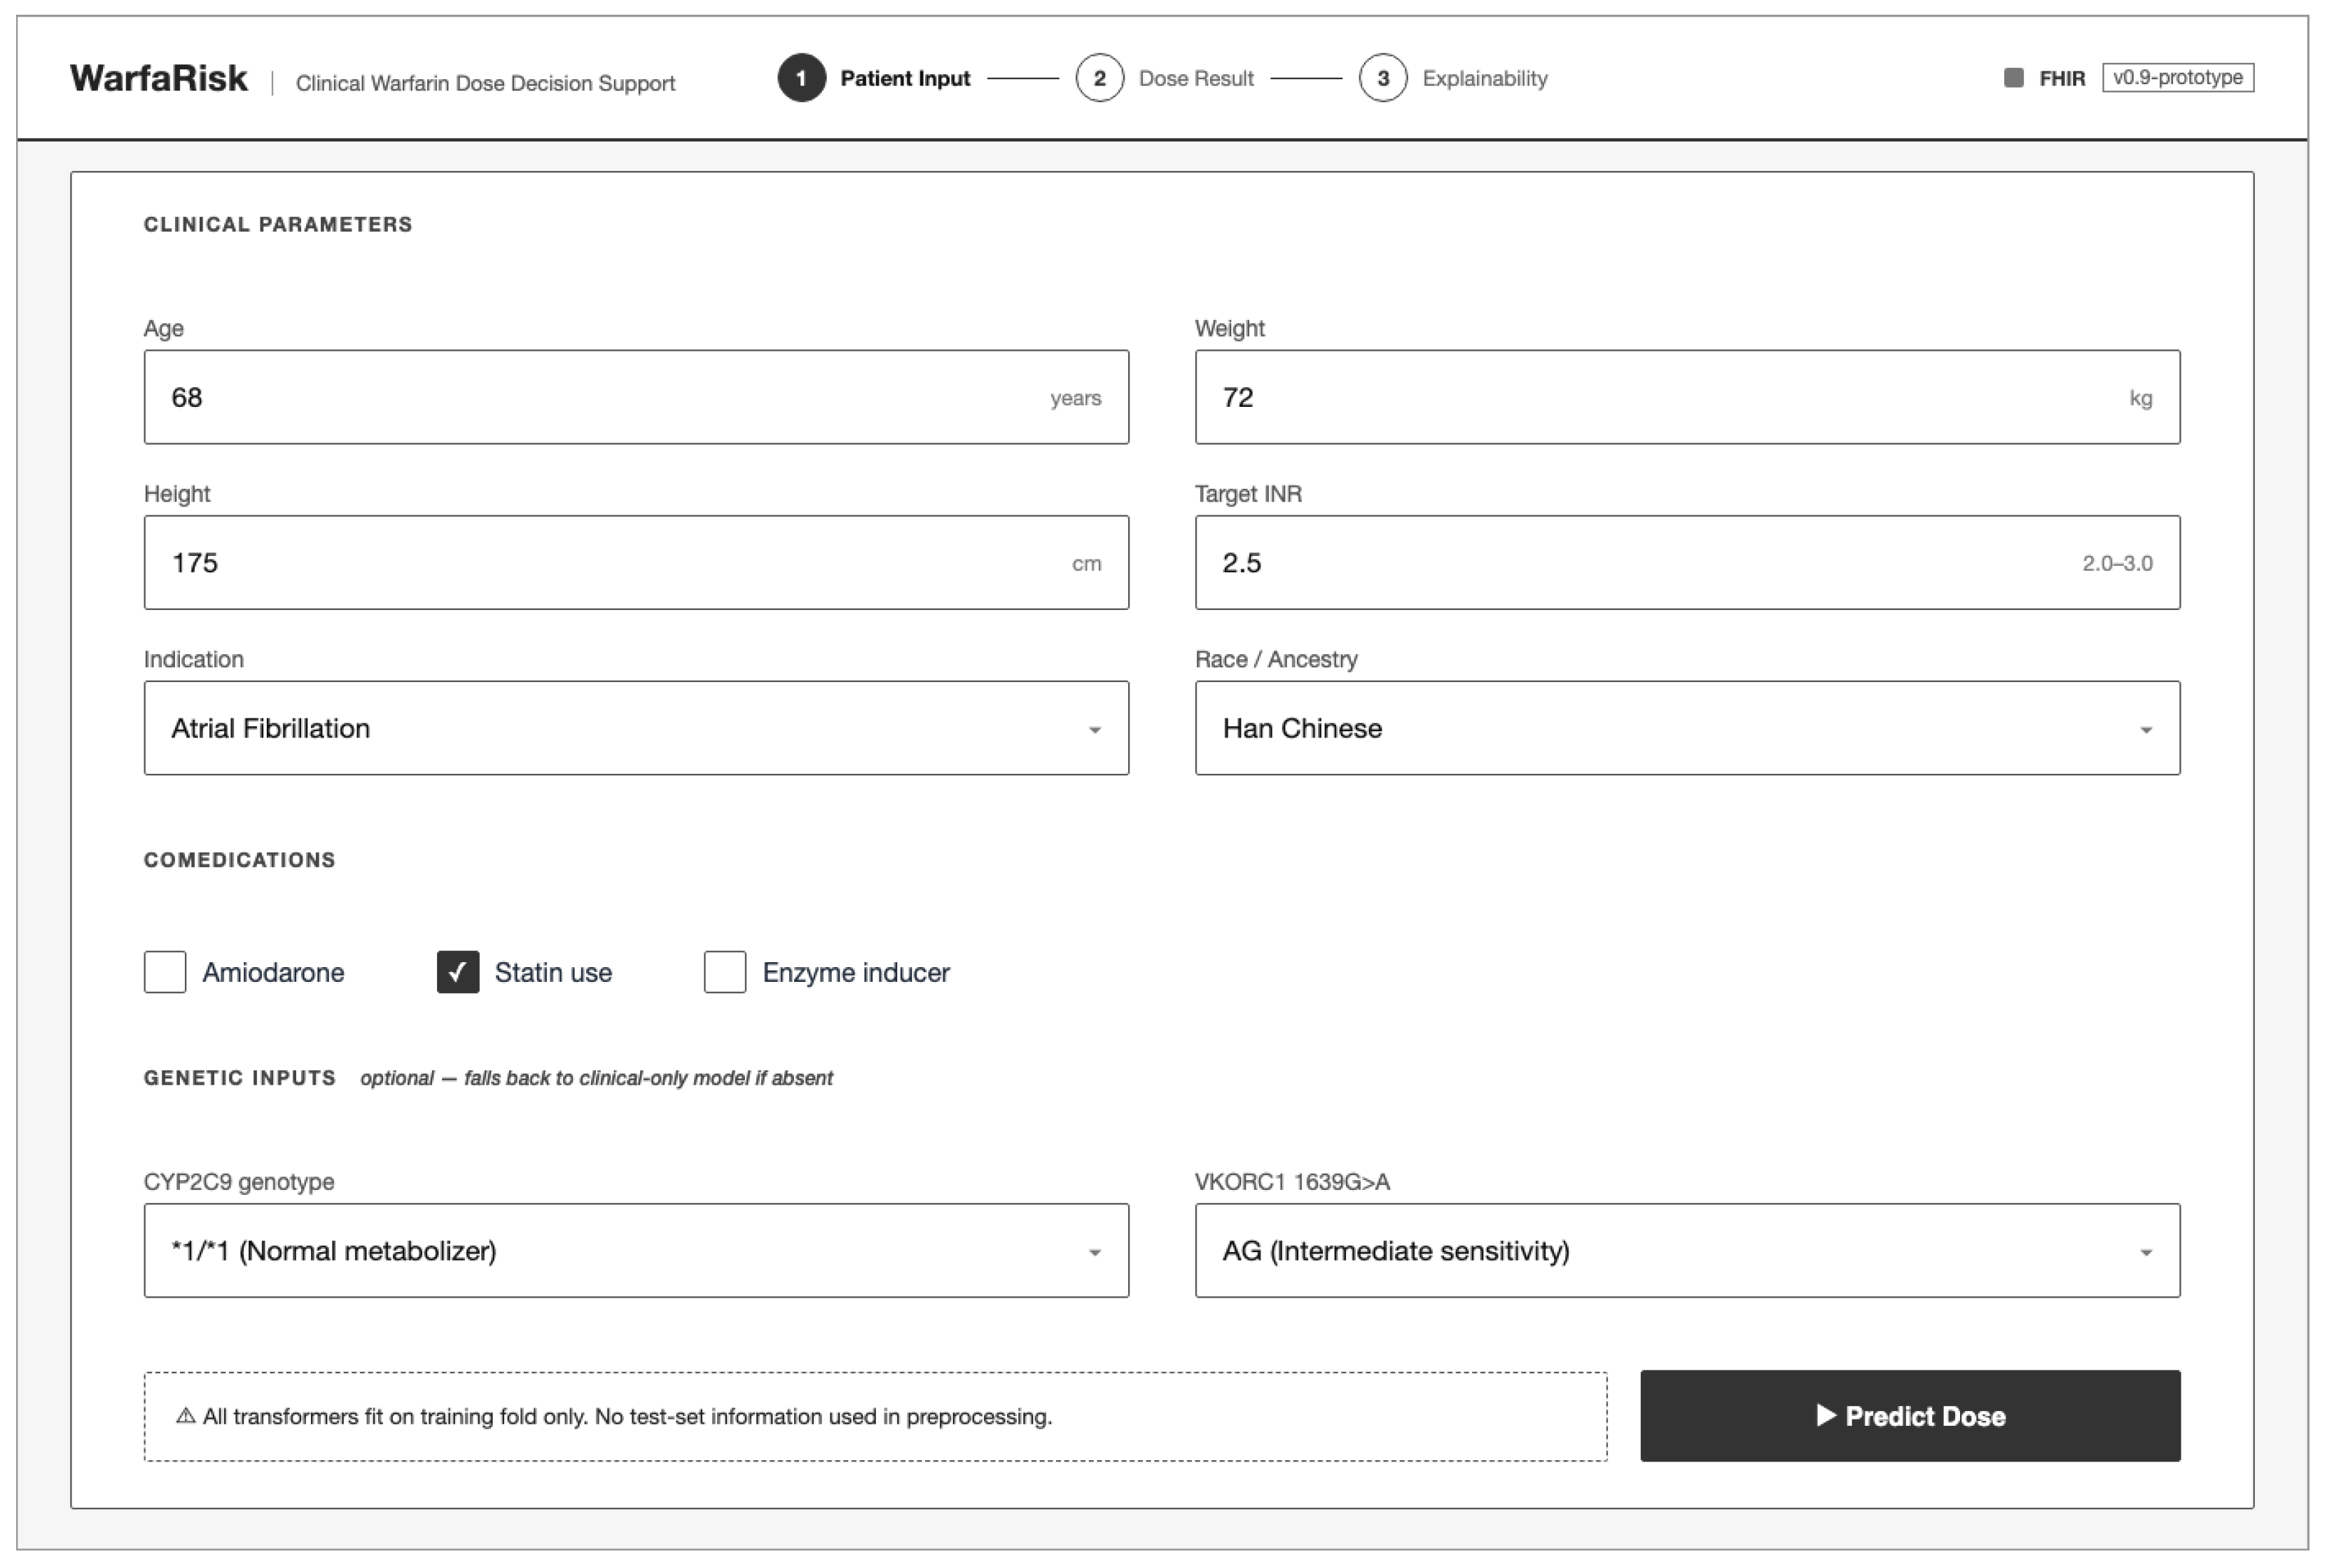
WarfaRisk patient data entry screen. Structured input form accepting clinical parameters (age, weight, height, indication, comedications) and optional pharmacogenomic inputs (CYP2C9 star-allele, VKORC1 genotype). Ancestry field activates subgroup-specific calibration warnings but is not encoded as a predictive feature.
Figure 3.
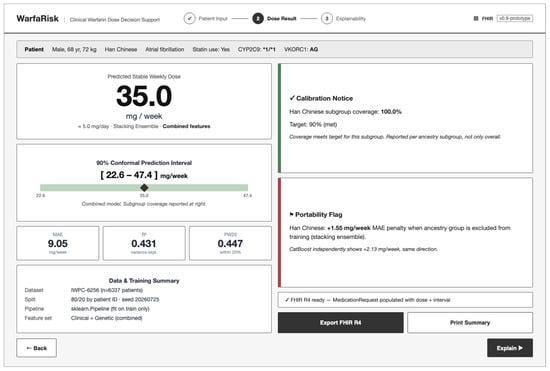
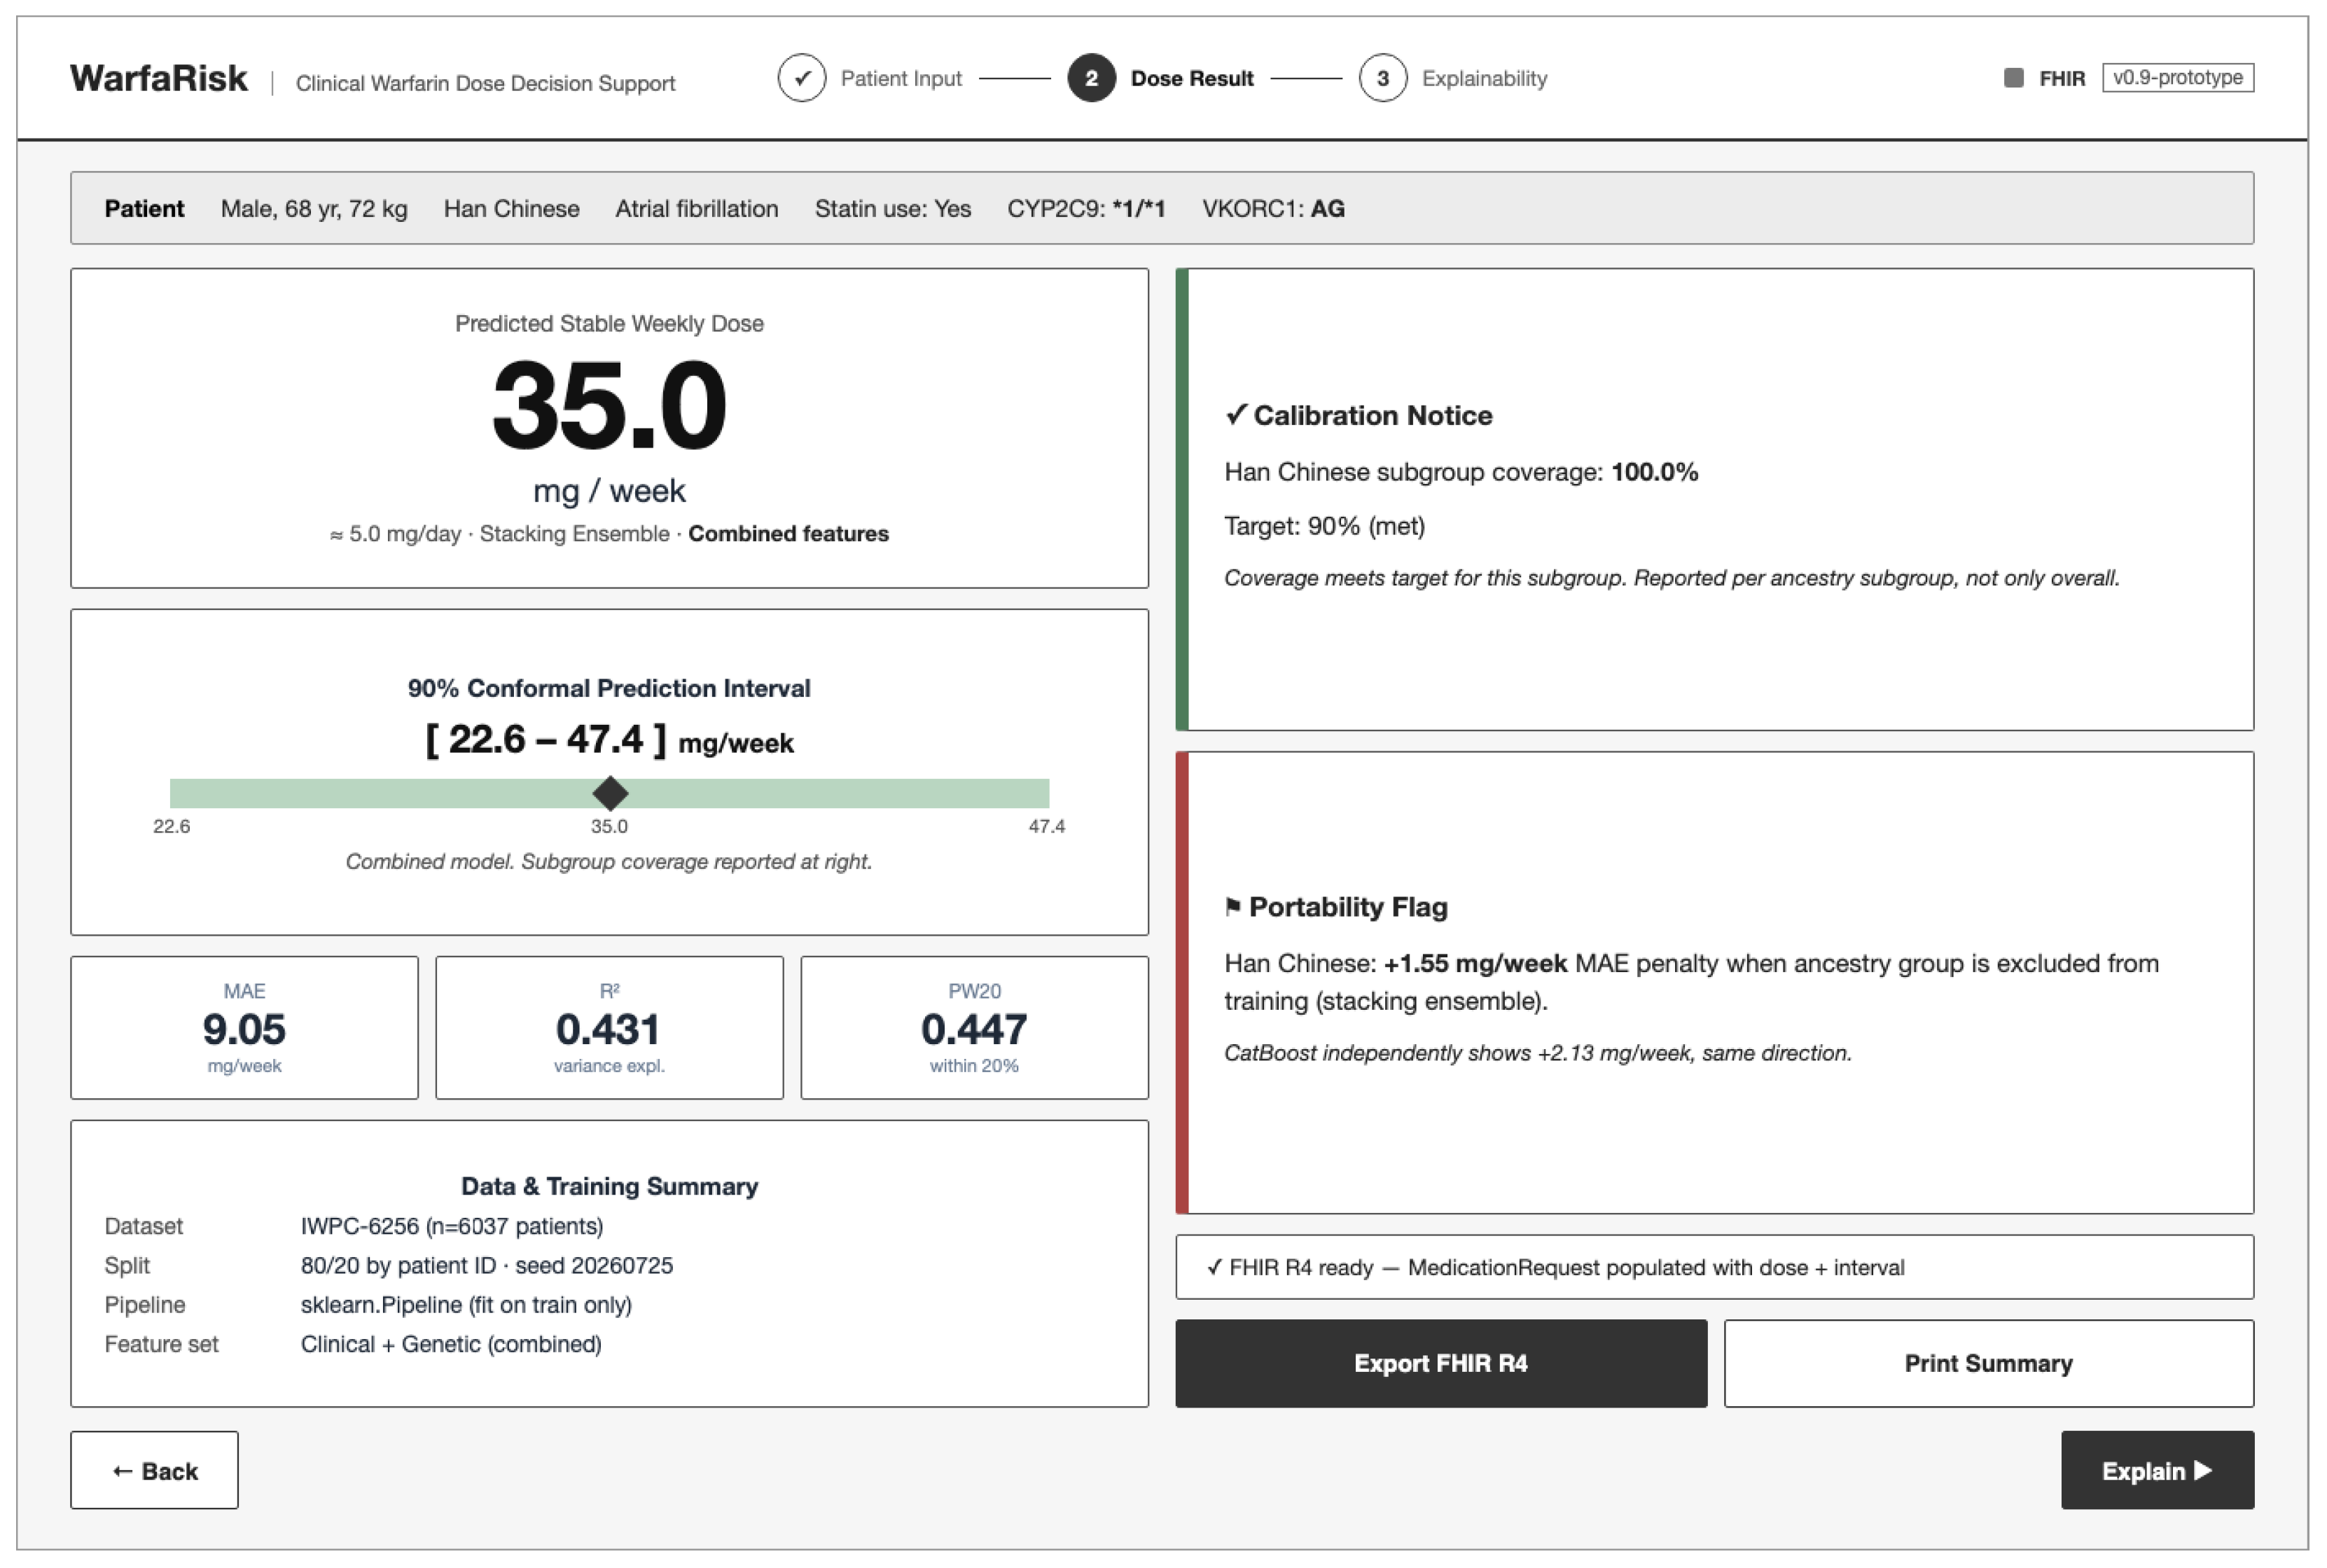
WarfaRisk dose recommendation screen. Predicted stable weekly dose (35.0 mg/week) with 90% conformal prediction interval [22.6–47.4] derived from MAPIE cross-conformal (CV+) prediction. Calibration notice (green: 100.0% Han Chinese subgroup coverage, meets the 90% target) and portability flag (+1.55 mg/week MAE penalty when Han Chinese ancestry is excluded from training, stacking ensemble; CatBoost agrees at +2.13 mg/week) surface fairness findings from Phases 4–5 (all values are illustrative, from a low-fidelity mockup), illustrating that calibration and portability are independent failure modes: this subgroup is well calibrated but still shows a portability penalty.
Figure 4.
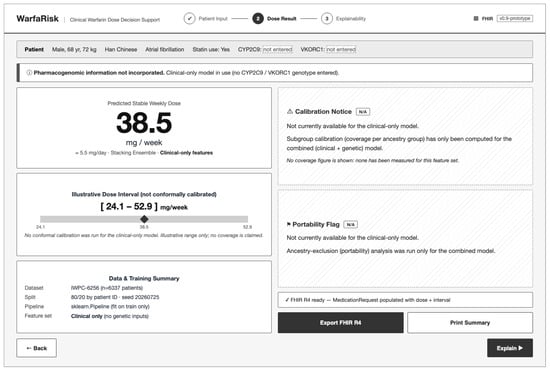
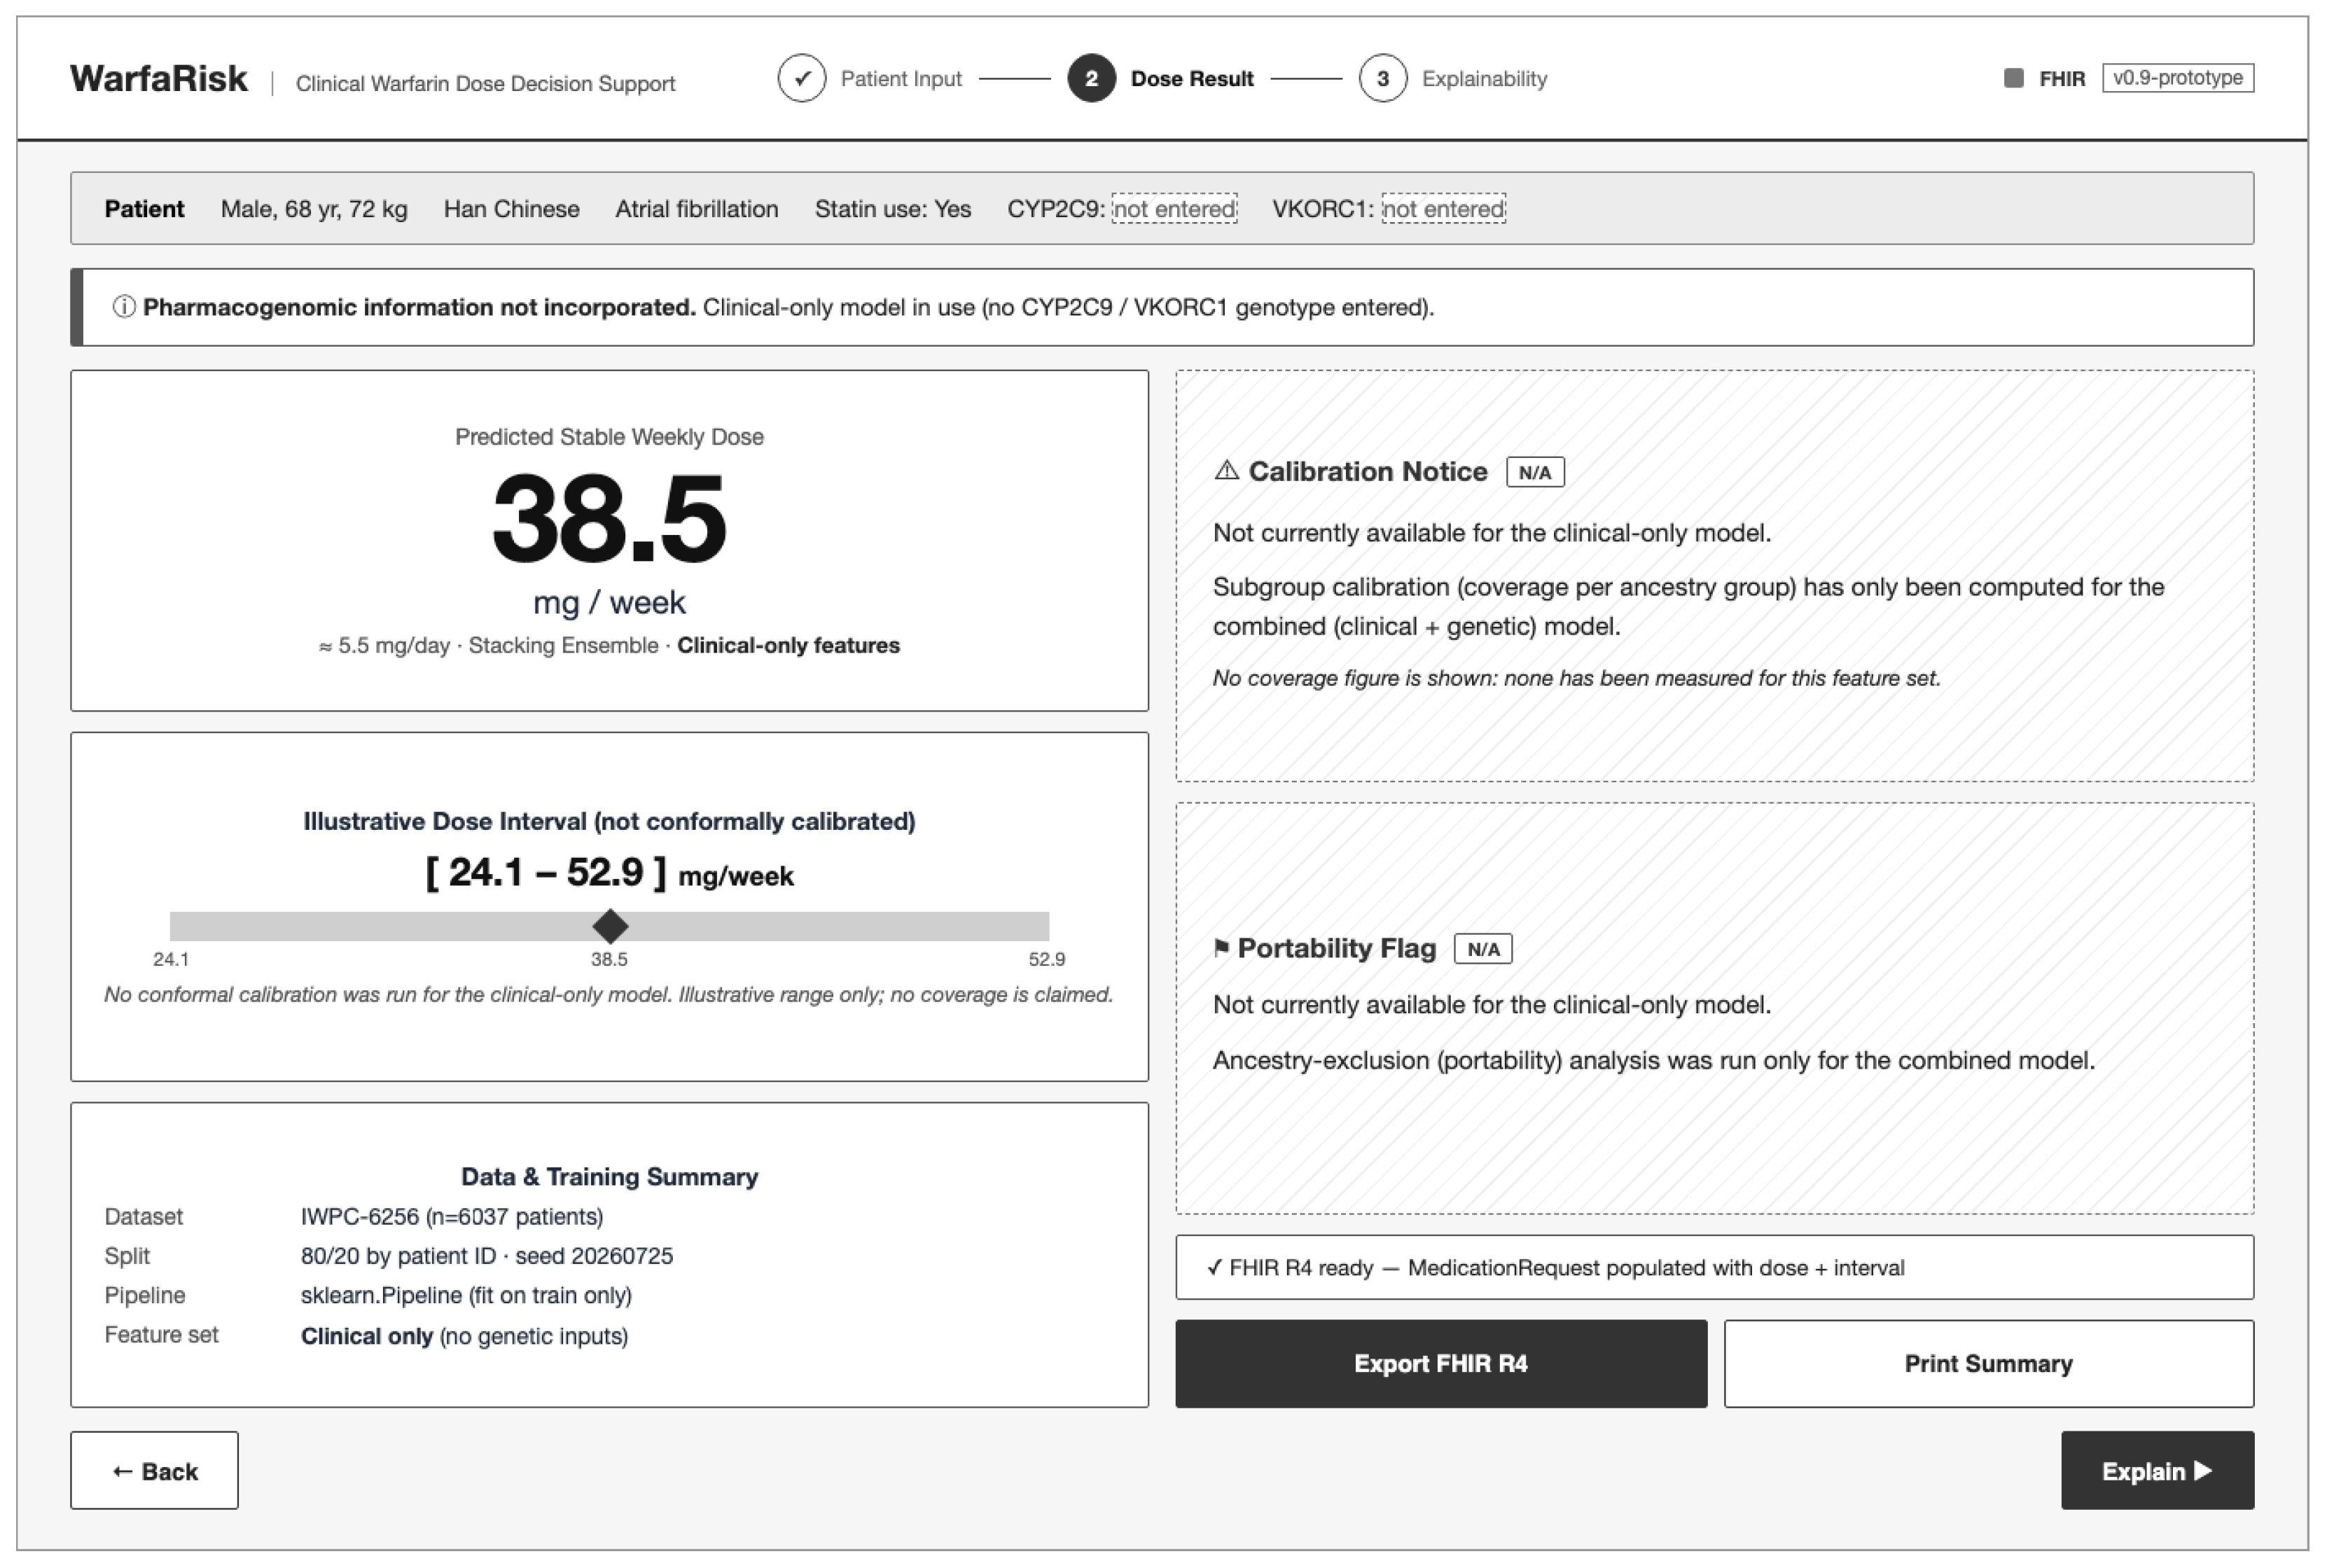
WarfaRisk dose recommendation screen, clinical-only fallback (same hypothetical patient as Figure 3, genotype not entered). Dose and interval are illustrative; calibration notice and portability flag are marked not available for this feature set.
Figure 5.
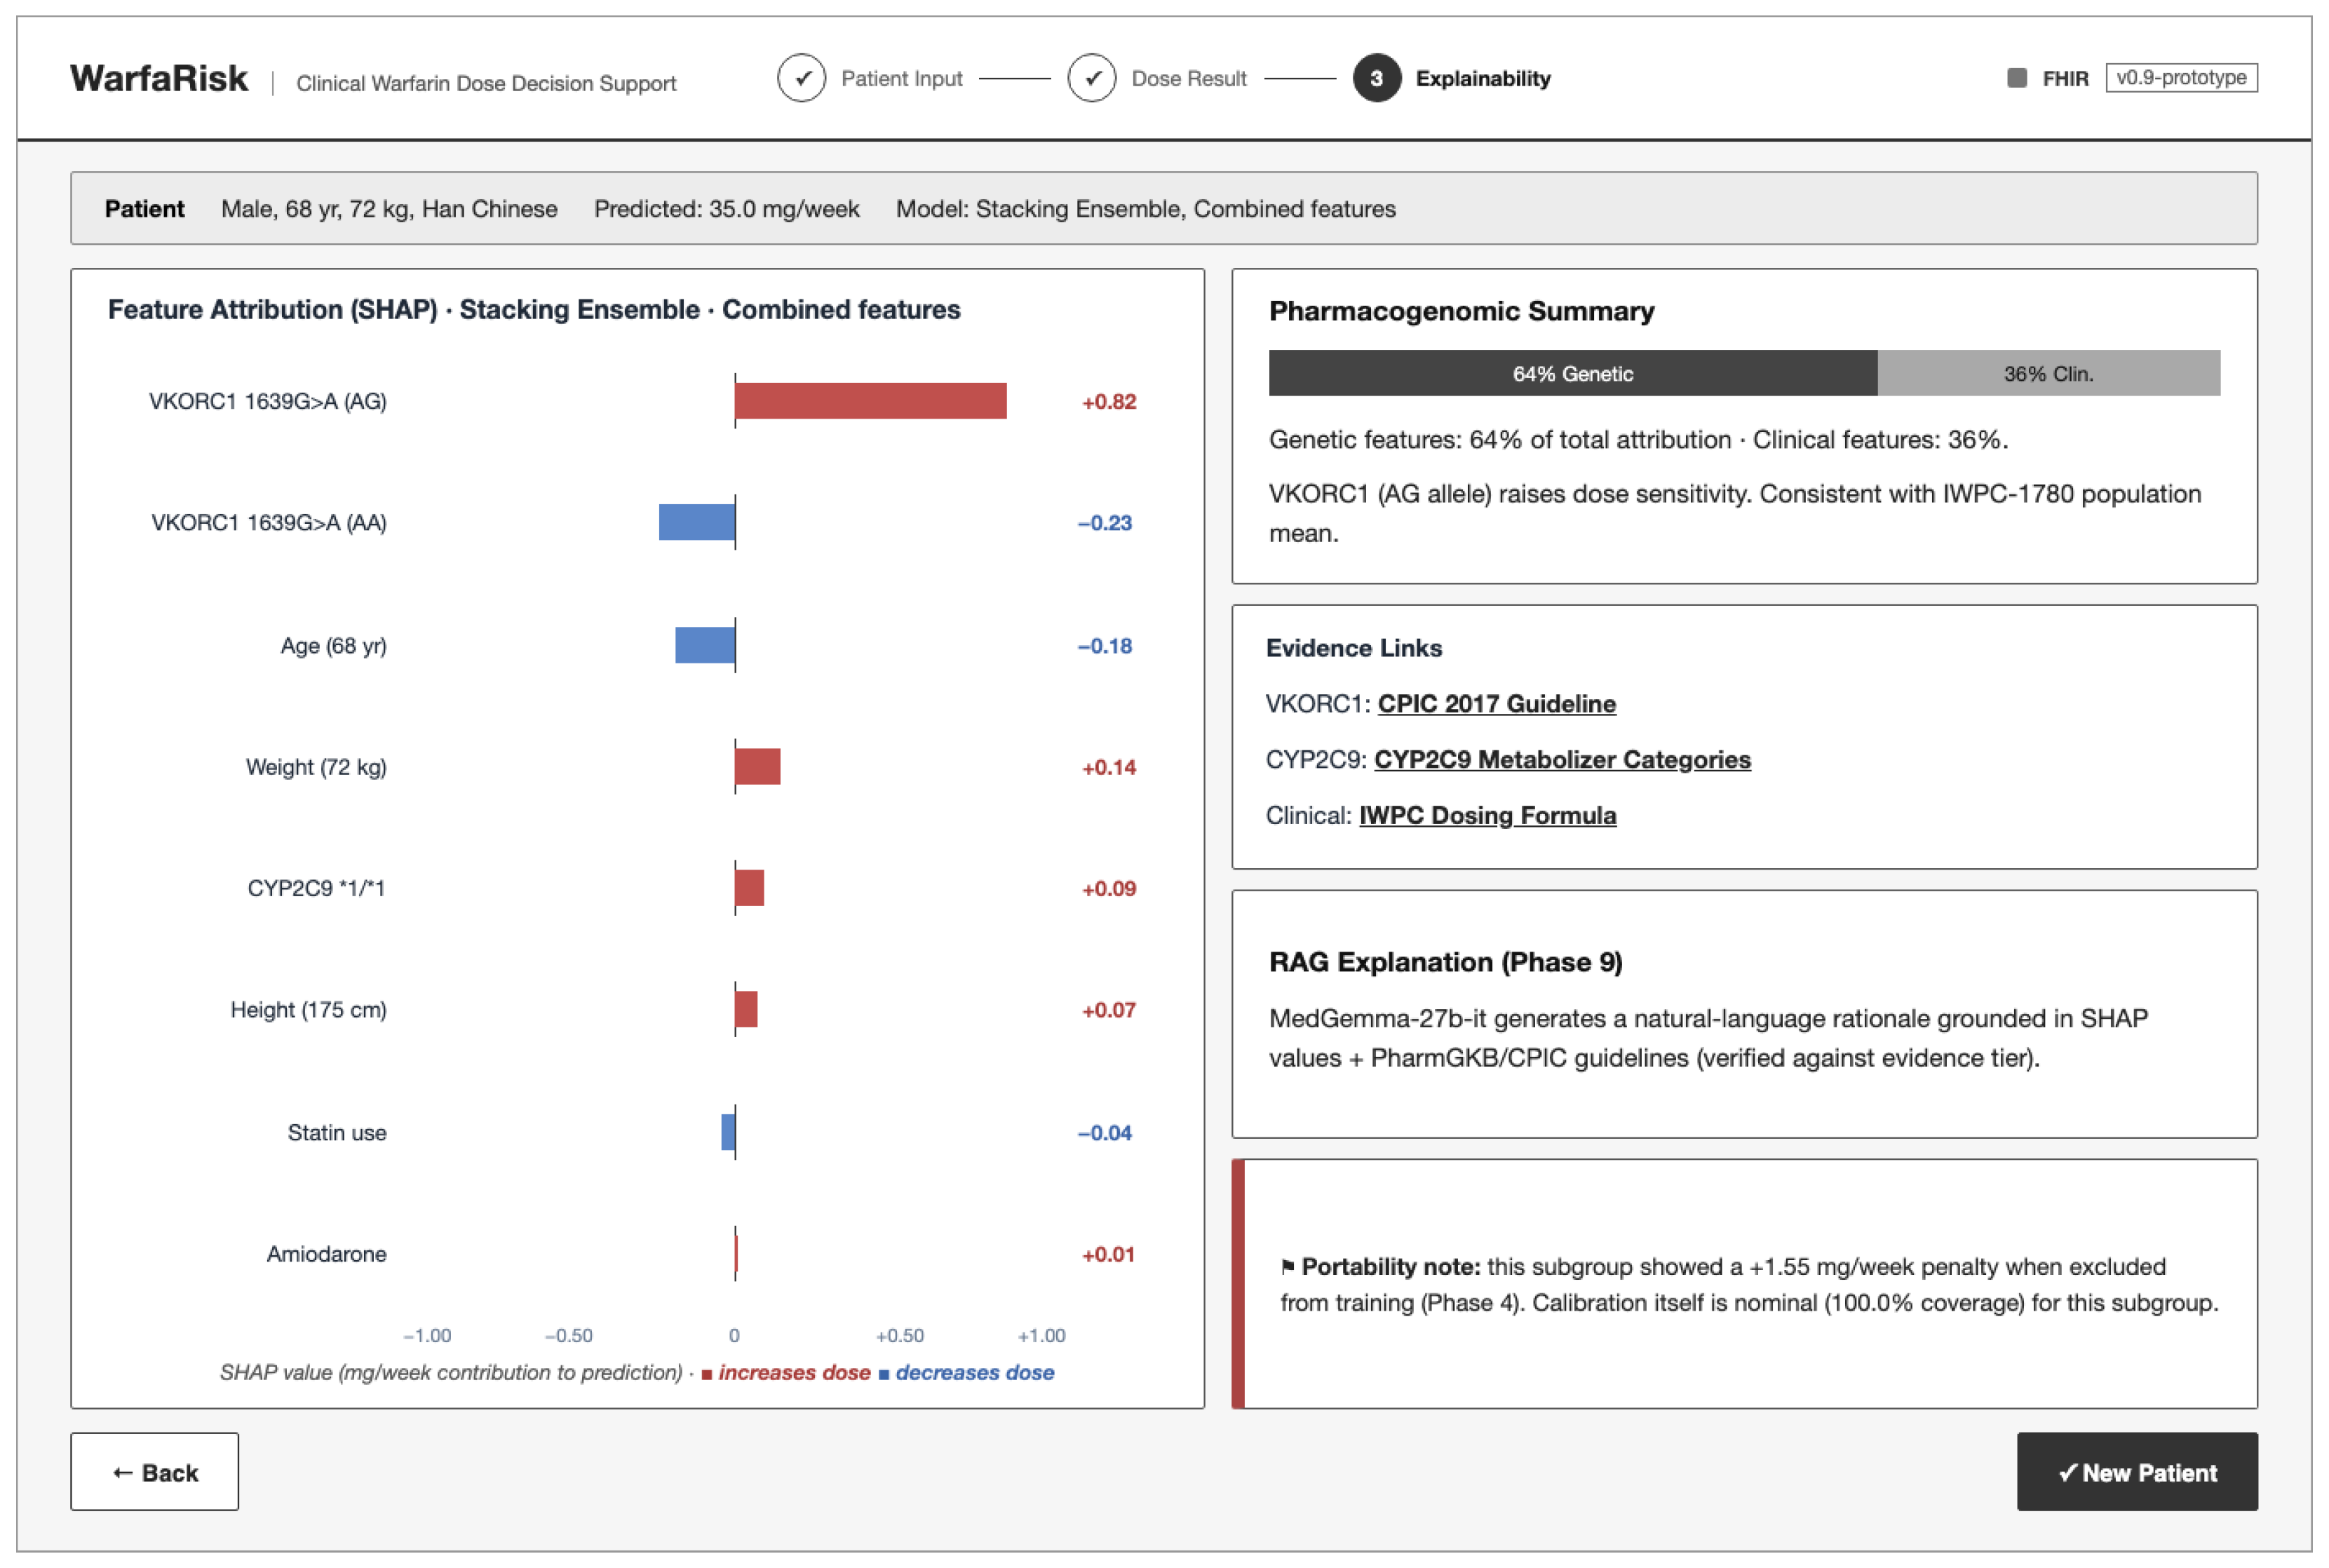
WarfaRisk SHAP explainability screen. Individual-level feature attributions from the stacking ensemble: VKORC1 1639G>A (rs9923231) (AG) is the dominant driver (+0.82 mg/week); clinical features account for 36% of total attribution. Evidence links connect genetic features to CPIC/PharmGKB guidelines; the RAG Explanation card (Phase 9) shows the SHAP-conditioned, citation-verified natural-language rationale.
5.1. Patient Data Entry
Figure 2’s input panel accepts the minimal feature set required for the combined model: age (years), weight (kg), height (cm), target INR range, indication for anticoagulation, and binary comedication flags for amiodarone, statins, and enzyme inducers. Genetic inputs (CYP2C9 star-allele consensus and VKORC1 1639G>A (rs9923231) genotype) are marked optional; if absent, the system automatically falls back to the clinical-only model and displays a prominent notice that pharmacogenomic information was not incorporated. An ancestry field accepts the IWPC label taxonomy and is used solely to activate subgroup-specific calibration warnings; it is not encoded as a predictive feature. Phase 4’s portability analysis and Phase 5’s calibration analysis were run only for the combined feature set; falling back to the clinical-only model leaves the calibration notice, portability flag, and conformal interval undefined for that feature set, marked accordingly in Figure 4, with feature-set-specific analysis planned as future work.
Input validation enforces physiologically plausible ranges on the two continuous inputs (weight 30–200 kg, age 18–100 years); this range check is the only input-validation algorithm currently implemented. Broader out-of-distribution detection across the full mixed categorical and continuous feature space is not implemented, so no formal rejection-rate estimate is available; this is a concrete next step. Validation is performed client-side before transmission, enabling offline use in low-connectivity settings and reducing unnecessary server round-trips. All entered data are processed in memory and are not persisted to disk by the prototype implementation; logging and audit-trail requirements for clinical deployment are deferred to the institution’s EHR layer via FHIR integration.
5.2. Dose Recommendation Display
Figure 3 presents three tiers of output, ordered by clinical urgency. At the top, the predicted stable weekly dose in mg/week is displayed in large type alongside its 90% conformal prediction interval derived from MAPIE cross-conformal (CV+) prediction wrapped around the fitted stacking-ensemble model. The interval is color-coded by calibration quality, using the same exact binomial test introduced in Section 6.2 rather than an arbitrary numeric cutoff: green when the patient’s ancestry subgroup meets the 90% nominal target, red when coverage falls below target and the deficit is statistically significant after Benjamini–Hochberg correction, and amber when coverage falls below target but the subgroup is either not statistically distinguishable from nominal or too small to test. This directly surfaces the systematic failure described in Section 6.2 for African-ancestry labels, while avoiding a false-precision warning for subgroups whose apparent shortfall could plausibly be sampling noise.
Beside the interval, a plain-language calibration notice conveys the color code without requiring the clinician to interpret statistical terminology. For ancestry subgroups where per-group coverage has been measured below the nominal 90% target, the notice reads approximately: “Prediction interval reliability for this ancestry group is below the intended 90%. Dose selection for this patient should incorporate additional clinical judgment.” An ancestry portability flag is rendered separately when Phase 4 data indicate a leave-one-group-out penalty for the patient’s ancestry label, providing independent evidence about out-of-distribution risk that is conceptually distinct from calibration coverage.
5.3. Explainability Panel
Figure 5 renders individual-level SHAP feature attributions computed for the specific submitted patient, not the population-level mean values described in Section 6.3. Each feature is shown as a horizontal bar: values increasing the predicted dose appear in red; values decreasing it appear in blue; the raw SHAP contribution in mg/week is displayed numerically. The panel serves two clinical functions: verifying that the prediction is driven by expected features (VKORC1, age, weight) and flagging unusual attributions that may indicate data entry errors or an out-of-distribution patient.
A collapsible evidence section links each genetic feature to its pharmacogenomic evidence base: VKORC1 attributions link to the relevant CPIC 2017 guideline text [7]; CYP2C9 attributions link to published metabolizer-category effect sizes; clinical features link to the IWPC dosing formula [2]. This grounding is generated by the Phase 9 retrieval-augmented LLM explanation layer described in Section 3.11, but can be replaced by a static lookup table for deployments that cannot support LLM inference.
5.4. Technical Architecture and Deployment Readiness
The interface is implemented as a lightweight web application with a REST API backend and a browser-based frontend requiring no build toolchain. The backend loads fitted model artifacts on startup and holds them in memory; a dose prediction is served in under 100 ms on CPU hardware. The SHAP computation adds approximately 300–500 ms and is performed asynchronously so the dose recommendation is displayed before attribution is ready.
FHIR R4 integration is implemented at prototype stage for a single, narrow round trip: a dedicated endpoint accepts a MedicationRequest resource and returns a MedicationRequest with the predicted dose and 90% interval populated in the dosage instruction field. A MedicationRequest alone cannot carry the full set of clinical inputs this pipeline requires; in a complete implementation, height and weight would map to Observation resources (LOINC 8302-2 and 29463-7, respectively), CYP2C9/VKORC1 genotype would map to Observation resources following the HL7 FHIR Genomics Reporting Implementation Guide, indication would map to a Condition resource or the MedicationRequest.reasonCode field, and target INR would map to an Observation or Goal resource. This multi-resource mapping, along with formal FHIR profiles, extensions, and unit conformance to UCUM, is not yet implemented. This integration enables the interface to receive patient data directly from an EHR without manual re-entry, potentially reducing manual-entry transcription errors, though this benefit has not been empirically measured. The dose-recommendation round trip has been exercised against a local mock FHIR endpoint; no formal conformance-testing procedure against official FHIR resource profiles has been carried out for any endpoint, a concrete next step.
6. Preliminary Evaluation
This section reports prototype-stage findings on IWPC-6256, intended to demonstrate that the evaluation framework operates as designed and to illustrate the type of findings the methodology surfaces. Comprehensive multi-model, multi-cohort results are reserved for the full evaluation paper currently in preparation.
6.1. Framework Verification
An initial run of Phases 1–6 on IWPC-6256 confirmed that the leakage audit, fixed-split discipline, and conformal calibration pipeline all execute without error. The mandatory baseline check operated correctly: the naive median predictor (MAE 12.34 mg/week, PW20 0.342), clinical-only linear regression (MAE 10.86, 0.222, PW20 0.354), and the published IWPC pharmacogenetic equation (MAE 9.18, 0.413, PW20 0.429) produced results consistent with the literature, confirming that the evaluation harness is correctly configured before any experimental model is introduced. A guideline-based Gage equation [14] baseline was considered but not included: its Target INR term is missing for 4269 of 6037 patients (70.7%) in this cohort, and imputing it for most patients would substitute a constant for one of the equation’s genuine inputs rather than fairly evaluate the published algorithm.
Adding pharmacogenomic features (CYP2C9, VKORC1) to clinical-only models improved MAE across all nine tested architectures on IWPC-6256, confirming genetic information remains useful within the IWPC genotype panel’s constraints. The strongest combined-feature result, from AutoGluon, reached MAE 8.55 mg/week ( 0.475, PW20 0.466), improving on the IWPC equation baseline as a point estimate, but still short of the PW20 ≥ 0.50 reference point discussed above. No confidence interval is available for this comparison, since per-patient predictions were not retained for the AutoGluon run; a paired comparison against the stacking ensemble, a weaker but retained architecture, is in the Supplementary Materials (Table S2). The shortfall is consistent with the known panel limitation in Section 3.2; extending the genotype panel and applying a variance-stabilizing target transform are next steps for closing it. A single-model consistency check on the non-independent secondary cohort, IWPC-1780, using CatBoost only, shows the same pattern: MAE improves from 10.31 mg/week (clinical-only) to 8.72 mg/week (combined, test patients). A full nine-architecture, two-cohort comparison is reported in the companion evaluation paper.
6.2. Key Methodological Finding: Calibration Gap
The most consequential result at this stage concerns calibration, not accuracy. The coverage figures below come from the single fixed 80/20 split (1207 test patients) and have not been re-estimated across alternative splits, so they describe this split rather than stable estimates. Averaged across IWPC-6256, MAPIE cross-conformal prediction (5-fold CV+, ) reaches 89.8% coverage against its 90% target (95% bootstrap CI [88.1%, 91.5%]), with a mean interval width of 37.7 mg/week (median 37.7), which alone would look adequate. Split by ancestry label, however, labels that plausibly capture Black/African-American patients fall to 60–82% against the same target, plausibly explained by alleles the IWPC panel omits, consistent with the pharmacogenetic evidence cited above though not directly demonstrated here. The interval does not widen to compensate: these four labels’ mean width (37.6–38.1 mg/week) is indistinguishable from the 37.7 mg/week overall figure, so the interval is equally confident whether it is right 60% or 82% of the time for a given ancestry group. This gap is invisible at the aggregate level and appears only with Phase 5’s per-subgroup reporting, motivating that design choice. An exact binomial test against the 90% target, Benjamini–Hochberg-corrected across the 12 labels with at least 10 patients, confirms two of these four, African-American and Black or African American, as statistically significant; Black’s 82.2% does not survive correction, and the fourth, African American (), is too small to test (Supplementary Materials, Table S4). In a sensitivity analysis that pools the four labels into one group of 154 test patients, MAPIE coverage is 74.0% (95% CI [66.4%, 80.8%]). This is significantly below the 90% target (adjusted p below 0.001), so the shortfall remains.
By contrast, the deep-ensemble baseline, an uncalibrated interval, covered only 24.9% of IWPC-6256 test patients against the 90% nominal level, because the spread between five similar MLPs reflects model disagreement only and omits the noise term. It is a baseline here, not a usable uncertainty method.
To test whether a group-conditional method closes the coverage gap MAPIE cannot close by construction, we implemented a Mondrian split conformal predictor (Section 2) and benchmarked it against the MAPIE coverage above. Coverage improves for the two largest under-covered labels: Black rises from 82.2% under MAPIE to 93.2% under Mondrian, and African-American from 62.5% to 87.5%. Black or African American improves from 69.2% to 78.8%. The smallest label, African American (), is unchanged at 60.0%, since it falls below the 10-point pooling threshold and receives the same quantile MAPIE would produce. Coverage falls for some other labels, most notably Japanese (95.9% to 89.4%): a fixed calibration budget spread across more groups costs some groups coverage to gain it for others. These gains come with wider intervals. Mean width rises from about 38 mg/week under MAPIE to 48.8 for Black, 41.5 for Black or African American, and 69.6 for African-American, while Japanese narrows to 28.8. Widths and calibration-set sizes for every label are in the Supplementary Materials (Table S4). Pooling the four labels into one calibration group raises Mondrian coverage for these patients to 89.6% (95% CI [83.7%, 93.9%]), compared with 86.4% when each label is calibrated separately, but the mean interval is wider (51.1 mg/week, against 37.8 for MAPIE). So, Mondrian addresses the calibration-method problem for adequately sized subgroups, but not the sample-size problem in the smallest labels, which no conformal method can fix.
6.3. Explainability Framework
The Phase 6 SHAP module produced feature attributions consistent with the pharmacogenomic literature [3,7]: VKORC1 genotype emerged as the dominant predictor, followed by age and weight, with genetic features collectively accounting for roughly 64% of total attribution on IWPC-1780. This consistency with established pharmacology is a plausibility check, not proof that the stacking ensemble learned this structure causally rather than a correlation that happens to align with known biology; SHAP attribution alone cannot distinguish the two. A stronger check, cross-validating the SHAP ranking against an independently fit glass-box model, is reported in the companion evaluation manuscript. Per-subgroup SHAP comparisons across ancestry groups are beyond the scope of this preliminary evaluation and are identified as a direction for the full evaluation; the population-level pattern reported here should not be assumed to hold uniformly.
7. Implementation and Availability
7.1. Software Architecture
WarfaRisk is implemented as a Python 3.11 package with a flat phase-module structure, one module per pipeline phase, sharing a common utilities layer for paths, metrics, logging, and model upload. Dependencies are managed via per-phase extras so that installing only the libraries required for a given phase does not affect other environments. Every experiment attempt, including failed runs, is appended to an uncurated audit log. Curated results are promoted to the main results record only after independent verification of the log file, output artifact, and (where applicable) Hugging Face upload.
7.2. Reproducibility Guarantees
Patient-level splits are stored as lists of patient IDs rather than row indices, ensuring they remain valid if rows are reordered. The leakage audit module must pass all 11 checks before any Phase 3 model is allowed to execute; this is enforced at runtime, not just at code-review time. All random seeds are documented in a centralized seed file and injected at experiment start across all randomized libraries.
7.3. Model Availability
Trained model artifacts for each pipeline phase are versioned using Hugging Face repositories, with one repository per (phase, model family, cohort) combination. Each repository includes the fitted model artifact, a metrics record covering all reported evaluation figures, and a model card describing the training configuration. Artifact uploads are gated on an independent verification step: the artifact is confirmed reachable and the corresponding metrics match the experiment log before the result is promoted to the curated results record. Repositories were made public on 10 August 2026.
8. Discussion
8.1. Evaluation Protocol and Reproducibility
A recurring observation in the warfarin dosing literature is that reported error figures vary considerably across studies even when comparable model families and datasets are used [4]. This variation is partly attributable to differences in preprocessing protocols and the size of held-out evaluation sets, which can produce statistically unstable metrics when small. WarfaRisk’s fixed split files, mandatory pre-training leakage audit, and single documented seed, applied uniformly across all nine architectures, are intended to remove this source of variability, so that reported differences in performance reflect model behavior rather than differences in evaluation protocol. The framework is designed to make methodological choices transparent and independently reproducible, rather than to assert a performance advantage from any particular model architecture.
8.2. Contribution of Pharmacogenomic Features
Preliminary evaluation indicated that pharmacogenomic features contributed consistently to prediction accuracy across all nine model architectures examined on the primary cohort, IWPC-6256, and across clinical-only and combined feature sets; a CatBoost-only consistency check on the non-independent secondary cohort, IWPC-1780, showed the same qualitative pattern, though the full nine-architecture ablation for that cohort is reported in the companion evaluation manuscript. This finding is consistent with the established pharmacogenomic literature on VKORC1 and CYP2C9 [2,3] and suggests that genetic information remains informative even within the constraints of the current IWPC genotype panel. The absence of the rs28371686, rs9332131, rs7900194, and rs28371685 alleles from that panel is a known limitation for African-ancestry patients; the marginal contribution of available genetic features in this subgroup should therefore be interpreted cautiously until a more complete panel is available [7].
8.3. Calibration and Subgroup Fairness
The core calibration result is that, on the fixed split evaluated here, aggregate coverage near the 90% target is undercut by a real shortfall once African-ancestry patients are considered on their own. This pattern fits squarely within the broader algorithmic fairness literature, where population-level metrics have repeatedly been shown to mask disparate outcomes for minority subgroups [25]; warfarin dosing is not an exception to this known failure mode. We note that this heterogeneous subgroup coverage is an expected consequence of conformal prediction’s marginal-only guarantee (Section 2), not a new statistical failure mode; the contribution we claim is a reporting protocol establishing that per-subgroup calibration should be assessed and disclosed as standard practice, not a claim about conformal prediction’s own properties. This gap translates into a concrete risk at the point of care: for the two labels whose coverage deficit is statistically significant after correction, Black or African American and African-American, the true stable dose falls outside the stated 90% interval for roughly 1 in 3 patients, against roughly 1 in 10 patients overall. This is a qualitative translation of the coverage figures already reported, not a new outcome analysis; a prospective study relating interval miss rate to observed bleeding or thromboembolic events is necessary future work.
WarfaRisk’s evaluation framework keeps two related failure modes separate, deliberately. Phase 4’s portability analysis asks whether a model trained without a given ancestry group still generalizes to it. Phase 5’s calibration analysis asks a different question: whether prediction intervals are sized correctly for each subgroup even when that subgroup was part of training all along. A model can pass one test and fail the other, so neither analysis alone is sufficient for judging equity in clinical use.
For African-ancestry subgroups in the IWPC cohort, the observed calibration disparity is plausibly attributable to the absence of the relevant CYP2C9 alleles from the genotype panel, which produces prediction residuals with a distribution that differs from the majority-ancestry training population. The point-accuracy consequence of this gap cannot be addressed by post hoc calibration adjustment; it requires extended genotyping, consistent with CPIC recommendations [7]. The calibration gap specifically is a separate question, and our own Mondrian-versus-MAPIE comparison (Section 6.2) shows it is more addressable than the accuracy gap: a group-conditional conformal method recovers much of the coverage shortfall for the Black and African-American labels (to 93.2% and 87.5%), though Black or African American reaches only 78.8%, and it cannot rescue ancestry labels too small to support their own calibration quantile. Subgroup-specific recalibration is therefore a genuine, demonstrated mitigation for the calibration problem specifically, even though it leaves both the underlying genotype-panel gap and the smallest-subgroup coverage problem unresolved.
8.4. Prototype Maturity and Path to Clinical Validation
WarfaRisk currently corresponds to approximately Technology Readiness Level (TRL) 4–5: the core pipeline has been evaluated on two separate public IWPC cohorts, and the clinical interface has been integrated with a sandboxed FHIR endpoint under representative inputs. Progression toward clinical deployment would require, as successive steps, a retrospective chart review comparing pipeline predictions to institutional dosing decisions, a prospective feasibility pilot with INR time-in-range as a primary outcome under appropriate clinician oversight, and regulatory assessment under the applicable software as a medical device (SaMD) framework.
8.5. Limitations
Several limitations should be acknowledged when interpreting these findings. IWPC-6256 and IWPC-1780 are both redistributions of the same underlying IWPC data collection by different research groups, and patient-level independence between them cannot be verified: IWPC-1780 carries no shared identifier with IWPC-6256’s PharmGKB Subject ID, only a sequential row index, and its continuous covariates are z-scored at the source without published scaling parameters, preventing recovery of the original values. An approximate check using the non-scaled fields available in both releases (gender, VKORC1 and CYP2C9 genotype flags, and weekly dose rounded to the nearest mg) is inconclusive: 99.6% of IWPC-1780 patients match at least one IWPC-6256 patient on this combination, but the same check applied to two definitely disjoint random halves of IWPC-6256 itself collides 87.3% of the time, showing this key is too coarse to distinguish genuine overlap from coincidence. The two cohorts are evaluated and reported separately throughout, and any similarity in findings across them should not be read as independent replication. Separately, IWPC-1780’s continuous covariates (age, weight, height) are z-scored at the source using the full 1780-patient sample: their mean and standard deviation are exactly 0 and 1 across the complete sample, only possible if the scaling was computed before any train/test split existed. This pipeline’s leakage audit enforces train-only scaling for its own transformations (Section 3.2) but cannot detect this upstream step, since the original unscaled values are not published. This affects any IWPC-1780 result using these covariates, including the CatBoost consistency check in Section 6; IWPC-6256 is unaffected, since its continuous features are raw and scaled only within this pipeline’s own preprocessing. The IWPC genotype panel omits rs28371686, rs9332131, rs7900194, and rs28371685 alongside rs12777823; this is the most likely explanation for the observed subgroup calibration disparity. The underlying genotype-panel gap itself cannot be corrected post hoc, but the calibration disparity specifically is more addressable: Section 6.2’s group-conditional (Mondrian) comparator already recovers part of the coverage shortfall for adequately sized subgroups without new genotyping. African-ancestry patients in IWPC-6256 are distributed across four overlapping ancestry codes, Black (), Black or African American (), African-American (), and African American (), which would total 720 patients pooled but range down to 32 individually, fragmenting statistical power for the leave-one-ancestry-out analysis. This limited power is reflected directly in the significance testing reported in Section 6.2: only two of the four ancestry labels remain statistically significant after Benjamini–Hochberg correction, and the smallest () is too small to test at all. The pooled analysis in Section 6.2 avoids this fragmentation but treats the four labels as one population. The single fixed 80/20 split, while exactly reproducible, does not by itself quantify sampling uncertainty; repeated cross-validation, bootstrap confidence intervals, or a split-sensitivity analysis for the nested-ablation MAE//PW20 results are not available in this prototype, because those runs did not save their per-patient predictions, and are identified as a concrete next step. The same applies to the subgroup-calibration results for MAPIE and Mondrian. We claim only that the ancestry-coverage gap is present on this split, not that its size is stable across splits. A repeated-split audit is left to future work. The per-subgroup coverage figures reported above come from MAPIE’s cross-conformal (CV+) prediction, which guarantees only marginal coverage; a group-conditional (Mondrian) conformal method, benchmarked directly against it (Section 6.2), substantially improves coverage for the Black and African-American labels but leaves ancestry labels with fewer than 10 calibration points unimproved, since their residuals are necessarily pooled with the global calibration set to avoid an unstable per-group quantile; extending group-conditional calibration to very small subgroups, for example, ia hierarchical or partially pooled calibration, remains an open problem this prototype does not solve. Neither the marginal nor the group-conditional result establishes individual-level calibration for any specific patient, a stronger property that is provably unattainable by any distribution-free method [24]. SHAP attributions are reported only at the population level in this prototype; per-ancestry attribution comparisons, which could reveal additional fairness concerns, are planned for the full evaluation. All results are based on retrospective data; the prototype interface has not been evaluated prospectively or subjected to formal usability assessment by clinical staff.
9. Conclusions
We presented WarfaRisk, an open-source nine-phase ML pipeline and prototype clinical interface for warfarin dose prediction. The pipeline addresses five structural gaps in the existing evaluation literature (leakage, absent calibration, absent explainability, absent ancestry hold-out, and genotype panel inadequacy) within a single reproducible system that shares fixed split files, enforces a runtime leakage audit, and reports all metrics at subgroup resolution.
Methodologically, the prototype’s central contribution is showing that a calibration metric can look clinically acceptable in aggregate and still hide systematic under-coverage for a specific ancestry subgroup, invisible to any evaluation that never stratifies by population group. The point generalizes past warfarin. Any clinical ML system that reports calibration only at the population level risks the same blind spot for minority subgroups, whatever the clinical task. Per-subgroup calibration reporting belongs in the standard evaluation checklist, not the appendix.
The prototype currently operates at TRL 4–5. Planned extensions include a MENA-population evaluation phase using CYP2C9/VKORC1 allele frequencies specific to Saudi and Gulf populations [27], a longitudinal INR trajectory phase on MIMIC-III/IV, extending group-conditional calibration to ancestry labels too small for a stable per-group quantile, adding local execution of the Phase 9 generator for fully offline deployments with a corresponding response-time benchmark against the current cloud path, and a prospective feasibility pilot in collaboration with a clinical partner. The complete pipeline, fixed splits, and model artifacts are openly available for community extension and replication.
Supplementary Materials
The following supporting information can be downloaded at https://www.mdpi.com/article/10.3390/ai7100431/s1, Figure S1: Participant flow for IWPC-6256: raw public release, exclusion for missing therapeutic dose, and final analytic sample; Table S1: Ancestry label taxonomy and sample sizes for IWPC-6256 and IWPC-1780; Table S2: Paired model comparison and dose-stratified results (IWPC equation vs. stacking ensemble); Table S3: Model and calibration-method configuration, AutoGluon settings, and IWPC equation coefficients; Table S4: Calibration coverage with bootstrap confidence intervals and the Mondrian-conformal comparison (IWPC-6256 and IWPC-1780); Table S5: SHAP feature importance (IWPC-1780, stacking ensemble).
Author Contributions
Conceptualization, H.B.; methodology, H.B. and O.A.B.; software, H.B.; validation, O.A.B., S.A.M. and M.S.; formal analysis, H.B.; investigation, H.B.; resources, H.B.; data curation, H.B.; writing—original draft preparation, H.B.; writing—review and editing, M.M.A. and A.N.A.; visualization, H.B.; supervision, M.M.A. and A.N.A.; project administration, H.B.; funding acquisition, M.M.A. All authors have read and agreed to the published version of the manuscript.
Funding
This research received no external funding.
Institutional Review Board Statement
Not applicable. This is a retrospective study using only publicly available, de-identified datasets: the IWPC cohorts (via PharmGKB) and MIMIC-III/IV and eICU (via credentialed PhysioNet access). Each of these datasets was collected and de-identified under its originating institution’s own ethics review prior to public release, and no new human-subjects data were collected for the analyses reported here, so no additional institutional review was required for this work. The prospective feasibility pilot and MENA-population data collection described in the Conclusions will be conducted under separate institutional ethics review at the collaborating clinical sites.
Informed Consent Statement
Not applicable.
Data Availability Statement
The IWPC pharmacogenomic dataset is publicly available via the PharmGKB database. The pipeline’s source code (shared with the companion evaluation manuscript referenced throughout this paper) and the prototype clinical interface’s source code (frontend and backend) are both publicly available under the Apache License 2.0, at github.com/HasanBGit/WarfaRisk (accessed on 8 October 2026) and github.com/HasanBGit/WarfaRisk-Prototype-UI (accessed on 8 October 2026), respectively. Fixed split files, SHAP outputs, and trained model artifacts are hosted on the Hugging Face Hub under the HassanB4 account; all repositories were made public on 10 August 2026. MIMIC-III/IV [36,37] and eICU [38] require credentialed PhysioNet access.
Acknowledgments
The authors thank the Alfaisal AI Center at Alfaisal University for infrastructure support, the IWPC Consortium for making the pharmacogenomic dataset publicly available through PharmGKB, and the PhysioNet team for open access to MIMIC-III/IV and eICU. During preparation of this manuscript, the authors used ChatGPT (GPT-5.6, OpenAI) for minor editorial assistance and to generate the pipeline architecture figure (Figure 1). The authors reviewed and take full responsibility for the content of this publication.
Conflicts of Interest
The authors declare no conflicts of interest.
References
- Olie, R.H.; Winckers, K.; Rocca, B.; ten Cate, H. Oral Anticoagulants Beyond Warfarin. Annu. Rev. Pharmacol. Toxicol. 2024, 64, 551–575. [Google Scholar] [CrossRef] [Scilit] [PubMed]
- International Warfarin Pharmacogenetics Consortium. Estimation of the Warfarin Dose with Clinical and Pharmacogenetic Data. N. Engl. J. Med. 2009, 360, 753–764, Erratum in N. Engl. J. Med. 2009, 361, 1613. [Google Scholar] [CrossRef] [Scilit] [PubMed]
- Fung, E.; Patsopoulos, N.A.; Belknap, S.M.; O’Rourke, D.J.; Robb, J.F.; Anderson, J.L.; Shworak, N.W.; Moore, J.H. Effect of genetic variants, especially CYP2C9 and VKORC1, on the pharmacology of warfarin. Semin. Thromb. Hemost. 2012, 38, 893–904, Erratum in Semin. Thromb. Hemost. 2013, 39, 112. [Google Scholar] [CrossRef] [Scilit] [PubMed]
- Fülöp, P.; Tóth, Š.; Porubän, T.; Fülöpová, Z.; Borovská, A.; Dvorožňáková, M. Machine Learning for Warfarin Therapy: A Systematic Review. Pharmaceuticals 2025, 18, 1544. [Google Scholar] [CrossRef] [Scilit] [PubMed]
- Asiimwe, I.G.; Zhang, E.J.; Osanlou, R.; Jorgensen, A.L.; Pirmohamed, M. Warfarin dosing algorithms: A systematic review. Br. J. Clin. Pharmacol. 2021, 87, 1717–1729. [Google Scholar] [CrossRef] [Scilit] [PubMed]
- Fahmi, A.M.; Elewa, H.; El Jilany, I. Warfarin dosing strategies evolution and its progress in the era of precision medicine, a narrative review. Int. J. Clin. Pharm. 2022, 44, 599–607. [Google Scholar] [CrossRef] [Scilit] [PubMed]
- Johnson, J.A.; Caudle, K.E.; Gong, L.; Whirl-Carrillo, M.; Stein, C.M.; Scott, S.A.; Lee, M.T.M.; Gage, B.F.; Kimmel, S.E.; Perera, M.A.; et al. Clinical Pharmacogenetics Implementation Consortium (CPIC) Guideline for Pharmacogenetics-Guided Warfarin Dosing: 2017 Update. Clin. Pharmacol. Ther. 2017, 102, 397–404. [Google Scholar] [CrossRef] [Scilit] [PubMed]
- Cosgun, E.; Limdi, N.A.; Duarte, C.W. High-Dimensional Pharmacogenetic Prediction of a Continuous Trait Using Machine Learning Techniques with Application to Warfarin Dose Prediction in African Americans. Bioinformatics 2011, 27, 1384–1389. [Google Scholar] [CrossRef] [Scilit] [PubMed]
- Perera, M.A.; Cavallari, L.H.; Limdi, N.A.; Gamazon, E.R.; Konkashbaev, A.; Daneshjou, R.; Pluzhnikov, A.; Crawford, D.C.; Wang, J.; Liu, N.; et al. Genetic Variants Associated with Warfarin Dose in African-American Individuals: A Genome-Wide Association Study. Lancet 2013, 382, 790–796. [Google Scholar] [CrossRef] [Scilit] [PubMed]
- Drozda, K.; Wong, S.; Patel, S.R.; Bress, A.P.; Nutescu, E.A.; Kittles, R.A.; Cavallari, L.H. Poor Warfarin Dose Prediction with Pharmacogenetic Algorithms That Exclude Genotypes Important for African Americans. Pharmacogenet. Genom. 2015, 25, 73–81. [Google Scholar] [CrossRef] [Scilit] [PubMed]
- Gottlieb, A.; Daneshjou, R.; DeGorter, M.; Bourgeois, S.; Svensson, P.J.; Wadelius, M.; Deloukas, P.; Montgomery, S.B.; Altman, R.B. Cohort-Specific Imputation of Gene Expression Improves Prediction of Warfarin Dose for African Americans. Genome Med. 2017, 9, 98. [Google Scholar] [CrossRef] [Scilit] [PubMed]
- Lindley, K.J.; Limdi, N.A.; Cavallari, L.H.; Perera, M.A.; Lenzini, P.; Johnson, J.A.; Wu, A.H.; Ridker, P.M.; King, C.R.; Eby, C.S.; et al. Warfarin Dosing in Patients with CYP2C9*5 Variant Alleles. Clin. Pharmacol. Ther. 2022, 111, 950–955. [Google Scholar] [CrossRef] [Scilit] [PubMed]
- Zhang, H.; Alarcon, C.; Cavallari, L.H.; Nutescu, E.; Carvill, G.L.; Perera, M.A.; Hernandez, W. Genomewide Association Study Identifies Copy Number Variants Associated with Warfarin Dose Response and Risk of Venous Thromboembolism in African Americans. Clin. Pharmacol. Ther. 2023, 113, 624–633. [Google Scholar] [CrossRef] [Scilit] [PubMed]
- Gage, B.F.; Eby, C.; Johnson, J.A.; Deych, E.; Rieder, M.J.; Ridker, P.M.; Milligan, P.E.; Grice, G.; Lenzini, P.; Rettie, A.E.; et al. Use of Pharmacogenetic and Clinical Factors to Predict the Therapeutic Dose of Warfarin. Clin. Pharmacol. Ther. 2008, 84, 326–331, Corrigendum in Clin. Pharmacol. Ther. 2008, 84, 430. [Google Scholar] [CrossRef] [Scilit] [PubMed]
- Wang, M.; Qian, Y.; Yang, Y.; Chen, H.; Rao, W.F. Improved Stacking Ensemble Learning Based on Feature Selection to Accurately Predict Warfarin Dose. Front. Cardiovasc. Med. 2024, 10, 1320938. [Google Scholar] [CrossRef] [Scilit] [PubMed]
- Ma, W.; Li, H.; Dong, L.; Zhou, Q.; Fu, B.; Hou, J.l.; Wang, J.; Qin, W.; Chen, J. Warfarin maintenance dose prediction for Chinese after heart valve replacement by a feedforward neural network with equal stratified sampling. Sci. Rep. 2021, 11, 13778. [Google Scholar] [CrossRef] [Scilit] [PubMed]
- Dryden, L.; Song, J.; Valenzano, T.J.; Yang, Z.; Debnath, M.; Lin, R.; Topolovec-Vranic, J.; Mamdani, M.; Antoniou, T. Evaluation of Machine Learning Approaches for Predicting Warfarin Discharge Dose in Cardiac Surgery Patients: Retrospective Algorithm Development and Validation Study. JMIR Cardio 2023, 7, e47262. [Google Scholar] [CrossRef] [Scilit] [PubMed]
- Truda, G.; Marais, P. Evaluating Warfarin Dosing Models on Multiple Datasets with a Novel Software Framework and Evolutionary Optimisation. J. Biomed. Inform. 2021, 113, 103634. [Google Scholar] [CrossRef] [Scilit] [PubMed]
- Petch, J.; Nelson, W.; Wu, M.; Ghassemi, M.; Benz, A.; Fatemi, M.; Di, S.; Carnicelli, A.; Granger, C.; Giugliano, R.; et al. Optimizing warfarin dosing for patients with atrial fibrillation using machine learning. Sci. Rep. 2024, 14, 4516. [Google Scholar] [CrossRef] [Scilit] [PubMed]
- Steiner, H.E.; Giles, J.B.; Patterson, H.K.; Feng, J.; El Rouby, N.; Claudio, K.; Marcatto, L.R.; Tavares, L.C.; Galvez, J.M.; Calderon-Ospina, C.A.; et al. Machine Learning for Prediction of Stable Warfarin Dose in US Latinos and Latin Americans. Front. Pharmacol. 2021, 12, 749786. [Google Scholar] [CrossRef] [Scilit] [PubMed]
- Asiimwe, I.G.; Blockman, M.; Cohen, K.; Cupido, C.; Hutchinson, C.; Jacobson, B.; Lamorde, M.; Morgan, J.; Mouton, J.P.; Nakagaayi, D.; et al. Stable warfarin dose prediction in sub-Saharan African patients: A machine-learning approach and external validation of a clinical dose-initiation algorithm. CPT Pharmacomet. Syst. Pharmacol. 2022, 11, 20–29. [Google Scholar] [CrossRef] [Scilit] [PubMed]
- Taquet, V.; Blot, V.; Morzadec, T.; Lacombe, L.; Brunel, N. MAPIE: An Open-Source Library for Distribution-Free Uncertainty Quantification. arXiv 2022, arXiv:2207.12274. [Google Scholar] [CrossRef] [Scilit]
- Vovk, V.; Lindsay, D.; Nouretdinov, I. Mondrian Confidence Machine; Technical report; Royal Holloway, University of London: London, UK, 2003. [Google Scholar]
- Foygel Barber, R.; Candès, E.J.; Ramdas, A.; Tibshirani, R.J. The Limits of Distribution-Free Conditional Predictive Inference. Inf. Inference J. IMA 2021, 10, 455–482. [Google Scholar] [CrossRef] [Scilit]
- Obermeyer, Z.; Powers, B.; Vogeli, C.; Mullainathan, S. Dissecting Racial Bias in an Algorithm Used to Manage the Health of Populations. Science 2019, 366, 447–453. [Google Scholar] [CrossRef] [Scilit] [PubMed]
- Rajkomar, A.; Hardt, M.; Howell, M.D.; Corrado, G.; Chin, M.H. Ensuring Fairness in Machine Learning to Advance Health Equity. Ann. Intern. Med. 2018, 169, 866–872. [Google Scholar] [CrossRef] [Scilit] [PubMed]
- Jokhab, S.; AlRasheed, M.M.; Bakheet, D.; AlMomen, A.; AlAboud, N.; Kamali, F. The impact of CYP2C9, VKORC1, and CYP4F2 polymorphisms on warfarin dose requirement in Saudi patients. Front. Pharmacol. 2025, 16, 1547142. [Google Scholar] [CrossRef] [Scilit] [PubMed]
- El Rouby, N.; Shahin, M.H.; Bader, L.; Khalifa, S.I.; Elewa, H. Genomewide association analysis of warfarin dose requirements in Middle Eastern and North African populations. Clin. Transl. Sci. 2022, 15, 558–566. [Google Scholar] [CrossRef] [Scilit] [PubMed]
- McDermott, M.B.A.; Wang, S.; Marinsek, N.; Ranganath, R.; Foschini, L.; Ghassemi, M. Reproducibility in Machine Learning for Health Research: Still a Ways to Go. Sci. Transl. Med. 2021, 13, eabb1655. [Google Scholar] [CrossRef] [Scilit] [PubMed]
- Park, H.; Petkova, E.; Tarpey, T.; Ogden, R.T. A Single-Index Model with a Surface-Link for Optimizing Individualized Dose Rules. J. Comput. Graph. Stat. 2022, 31, 553–562. [Google Scholar] [CrossRef] [Scilit] [PubMed]
- Prokhorenkova, L.; Gusev, G.; Vorobev, A.; Dorogush, A.V.; Gulin, A. CatBoost: Unbiased Boosting with Categorical Features. In Proceedings of the Advances in Neural Information Processing Systems; NeurIPS: La Jolla, CA, USA, 2018; Volume 31. [Google Scholar]
- Hollmann, N.; Müller, S.; Purucker, L.; Krishnakumar, A.; Körfer, M.; Hoo, S.B.; Schirrmeister, R.T.; Hutter, F. Accurate Predictions on Small Data with a Tabular Foundation Model. Nature 2025, 637, 319–326. [Google Scholar] [CrossRef] [Scilit] [PubMed]
- Erickson, N.; Mueller, J.; Shirkov, A.; Zhang, H.; Larroy, P.; Li, M.; Smola, A. AutoGluon-Tabular: Robust and Accurate AutoML for Structured Data. arXiv 2020, arXiv:2003.06505. [Google Scholar]
- Lakshminarayanan, B.; Pritzel, A.; Blundell, C. Simple and Scalable Predictive Uncertainty Estimation using Deep Ensembles. In Proceedings of the Advances in Neural Information Processing Systems; Curran Associates, Inc.: Red Hook, NY, USA, 2017; Volume 30. [Google Scholar]
- Lundberg, S.M.; Lee, S.I. A Unified Approach to Interpreting Model Predictions. In Proceedings of the Advances in Neural Information Processing Systems; Curran Associates, Inc.: Red Hook, NY, USA, 2017; Volume 30. [Google Scholar]
- Johnson, A.E.W.; Pollard, T.J.; Shen, L.; Lehman, L.W.H.; Feng, M.; Ghassemi, M.; Moody, B.; Szolovits, P.; Celi, L.A.; Mark, R.G. MIMIC-III, a Freely Accessible Critical Care Database. Sci. Data 2016, 3, 160035. [Google Scholar] [CrossRef] [Scilit] [PubMed]
- Johnson, A.E.W.; Bulgarelli, L.; Shen, L.; Gayles, A.; Shammout, A.; Horng, S.; Pollard, T.J.; Hao, S.; Moody, B.; Gow, B.; et al. MIMIC-IV, a Freely Accessible Electronic Health Record Dataset. Sci. Data 2023, 10, 1, Correction in Sci. Data 2023, 10, 31. Correction in Sci. Data 2023, 10, 219. [Google Scholar] [CrossRef] [Scilit] [PubMed]
- Pollard, T.J.; Johnson, A.E.W.; Raffa, J.D.; Celi, L.A.; Mark, R.G.; Badawi, O. The eICU Collaborative Research Database, a Freely Available Multi-Center Database for Critical Care Research. Sci. Data 2018, 5, 180178. [Google Scholar] [CrossRef] [Scilit] [PubMed]
- Zeng, J.; Shao, J.; Lin, S.; Zhang, H.; Su, X.; Lian, X.; Zhao, Y.; Ji, X.; Zheng, Z. Optimizing the dynamic treatment regime of in-hospital warfarin anticoagulation in patients after surgical valve replacement using reinforcement learning. J. Am. Med. Inform. Assoc. 2022, 29, 1722–1732. [Google Scholar] [CrossRef] [Scilit] [PubMed]
- Anzabi Zadeh, S.; Street, W.N.; Thomas, B.W. Optimizing warfarin dosing using deep reinforcement learning. J. Biomed. Inform. 2023, 137, 104267. [Google Scholar] [CrossRef] [Scilit] [PubMed]
- Kuang, Y.; Liu, Y.; Pei, Q.; Ning, X.; Zou, Y.; Liu, L.; Song, L.; Guo, C.; Sun, Y.; Deng, K.; et al. Long Short-Term Memory Network for Development and Simulation of Warfarin Dosing Model Based on Time Series Anticoagulant Data. Front. Cardiovasc. Med. 2022, 9, 881111. [Google Scholar] [CrossRef] [Scilit] [PubMed]
- Augustin, D.; Lambert, B.; Robinson, M.; Wang, K.; Gavaghan, D. Simulating clinical trials for model-informed precision dosing: Using warfarin treatment as a use case. Front. Pharmacol. 2023, 14, 1270443. [Google Scholar] [CrossRef] [Scilit] [PubMed]
- Wani, A.A.; Abeer, F. Application of machine learning techniques for warfarin dosage prediction: A case study on the MIMIC-III dataset. PeerJ Comput. Sci. 2025, 11, e2612. [Google Scholar] [CrossRef] [Scilit] [PubMed]
- Whirl-Carrillo, M.; Huddart, R.; Gong, L.; Sangkuhl, K.; Thorn, C.F.; Whaley, R.; Klein, T.E. An Evidence-Based Framework for Evaluating Pharmacogenomics Knowledge for Personalized Medicine. Clin. Pharmacol. Ther. 2021, 110, 563–572. [Google Scholar] [CrossRef] [Scilit] [PubMed]
- Sellergren, A.; Kazemzadeh, S.; Jaroensri, T.; Kiraly, A.; Traverse, M.; Kohlberger, T.; Xu, S.; Jamil, F.; Hughes, C.; Lau, C.; et al. MedGemma Technical Report. arXiv 2025, arXiv:2507.05201. [Google Scholar]
- Borishetty, D.; Banda, P.; Andhi, N.; Desai, A.; Uppili, B.R.; Bobbili, D.R.; Iyer, G.R. PGxRAG: A Retrieval Augmented Generation Supported Pharmacogenomics Assistant. medRxiv 2025. [Google Scholar] [CrossRef] [Scilit]
Disclaimer/Publisher’s Note: The statements, opinions and data contained in all publications are solely those of the individual author(s) and contributor(s) and not of MDPI and/or the editor(s). MDPI and/or the editor(s) disclaim responsibility for any injury to people or property resulting from any ideas, methods, instructions or products referred to in the content. |
© 2026 by the authors. Licensee MDPI, Basel, Switzerland. This article is an open access article distributed under the terms and conditions of the Creative Commons Attribution (CC BY) license.