


Abstract
Artificial intelligence (AI) is increasingly used for tool-wear prediction in computer numerical control (CNC) machining, yet a high average accuracy can conceal systematic failure in the safety-critical high-wear region, where under-prediction makes a worn tool appear healthier than it is. This paper presents a trustworthy multimodal framework that audits, mitigates, and ultimately characterises this bias on the public MATWI dataset. A fusion model combining 512 image features with 84 force, acceleration, and acoustic features attains a strong test mean absolute error (MAE) of , outperforming image-only () and sensor-only () baselines. A signed, stratified bias audit nevertheless reveals a pronounced directional error: the model predicts the healthy region to within but under-predicts the worn region by approximately (worn-region MAE ), with the error deepening monotonically as wear increases. A three-stage mitigation pipeline—data-level resampling, cost-sensitive and relevance-based training, and post-hoc recalibration—reduces the worn-region error by for the combined pipeline and by up to for the best single-stage configuration, but cannot eliminate it, and only at a measurable cost to the well-sampled region. The residual bias persists across six regressor families sharing the same fused representation, with a 69– residual gap, and survives rigorous hyperparameter search and bias-aware loss functions behind an error floor. At every maintenance threshold evaluated the model produces a false-safe rate.Under the feature representation and sampling of this dataset, the bias is therefore not addressable by model family, mitigation strategy, or optimisation, which identifies data adequacy rather than model design as the binding constraint. The conclusion is scoped accordingly: alternative feature representations, generative augmentation, and domain adaptation were not evaluated and remain open. The contribution is a reusable protocol for distinguishing model-reducible from data-limited bias in safety-critical regression.
1. Introduction
Artificial intelligence (AI) and machine learning (ML) increasingly support predictive maintenance, quality control, and process optimisation by converting sensor and image data into earlier decisions [1,2,3,4,5]. However, shop-floor deployment requires more than high average accuracy because incorrect predictions can be costly or unsafe [1,6].
This gap is, at its core, a problem of trust. As manufacturing moves toward the human-centred model of Industry 5.0, in which an AI system recommends and a human operator decides [7,8,9,10], the operator must be able to tell when a recommendation can be relied upon. Trustworthy AI (TAI)—the reliability, robustness, transparency, fairness, and accountability properties set out in Figure 1—is the requirement that makes that judgement possible [2,6,11].
Figure 1.
Trustworthy Artificial Intelligence (TAI) for safe manufacturing AI, centred on reliability, robustness, transparency, fairness, and accountability.
This trust requirement is especially consequential in CNC tool-wear prediction. Underestimating wear in the high-wear region can delay replacement, increase scrap, and raise failure risk [5,12]. Trust therefore requires both good overall accuracy and evidence that errors are not systematically concentrated in this safety-critical region.
The experiments use the MATWI (Multimodal Automatic Tool Wear Inspection) dataset, which follows 17 carbide milling inserts from new condition to failure and pairs cutting-edge images with accelerometer, microphone, and force-table signals [12]. Flank wear spans approximately 0–450 m; MATWI also contains multiple wear types and material conditions that alter wear appearance [12,13]. These characteristics make MATWI a suitable setting for examining not only predictive accuracy, but also whether model error remains reliable across the wear range.
The problem also sits within the wider evolution of digital manufacturing. Industry 4.0 connected machines and sensors through cyber-physical and IIoT infrastructure, enabling continuous vibration, force, acoustic, and image acquisition and increasingly local inference [1,2,14]. Industry 5.0 re-centres the operator, positioning AI as decision support whose reliability depends on representative data [7,8,9]. This shift makes the quality and coverage of the data, rather than aggregate model accuracy alone, central to whether an AI recommendation can be trusted.
At the same time, manufacturing AI has expanded from conventional discriminative learning to generative augmentation, multimodal models, and increasingly agentic systems [14,15,16]. Transformer-based multimodal models [17] and multi-sensor fusion [18] combine complementary information, but remain constrained by labelled-data coverage; greater autonomy makes systematic error more consequential [16]. The increasing sophistication of these systems therefore strengthens the need to evaluate how reliably they behave in under-represented operating regions.
Major TAI frameworks converge on reliability and robustness, transparency and explainability, accountability, safety and security, and fairness [19,20,21]. These dimensions are directly relevant to operational variation, data-sparse predictions, traceability, and physical risk in machining. In this study, fairness is not demographic: MATWI contains no personal or protected-attribute data [22]. It denotes target-region fairness, meaning that regression performance should not systematically deteriorate in the safety-critical high-wear regime (≥200 m).
This target-region framing provides the basis for the paper’s use of bias. Bias is used in its technical sense: systematic, non-random error concentrated in an identifiable region [22]. The lifecycle taxonomy of Suresh and Guttag [23] is relevant because representation bias follows from scarce high-wear data, measurement and aggregation bias can arise from features, labels, materials, or wear types, and evaluation bias occurs when aggregate metrics hide regional failure. These mechanisms motivate staged mitigation and the disaggregated evaluation in Section 6.
The resulting technical challenge is two fold. First, high-wear observations are rare, so standard regression losses are dominated by dense low-wear regions and can pull high-wear predictions toward the centre [24,25]. This deep imbalanced regression problem [24,26] also increases overfitting risk in the sparse upper range. Second, models may exploit material or wear-type cues instead of robust wear features [27], which is plausible in MATWI because material and adhesive-wear differences alter appearance [12]. Black-box behaviour further weakens calibrated trust [6,11], while sensitivity to preprocessing, training settings, or leakage makes reproducibility essential [28,29].
These concerns shape the intended operating model. The system is human-in-the-loop decision support: after each milling pass, image and sensor data produce a continuous wear estimate with a 90% prediction interval and a binary inspection flag, while the operator retains the replacement decision. The critical failure is a false-safe result, where wear is underestimated and no inspection is triggered despite the tool approaching or exceeding its replacement limit (Figure S1).
Mitigating bias across the modelling lifecycle. Because bias can enter at several stages, this study evaluates mitigation through pre-processing, in-processing, and post-processing, with the methods and selection criteria defined in Section 5.6 and Section 5.7. This lifecycle view connects the trustworthiness problem identified above to the empirical mitigation strategy evaluated later in the paper.
The same requirement extends beyond model design to governance and assurance. Bias management is also a governance requirement (Table 1). Risk-based or principles-based frameworks in the EU, UK, United States, and India all require harmful-bias management [19,30,31,32,33,34,35]. International standards likewise emphasise fairness and accountable AI management [36,37,38]. Together, these technical and governance perspectives motivate an evaluation that asks not only whether a model is accurate, but also whether its errors are transparent, regionally reliable, and operationally acceptable.
Table 1.
Fairness across major AI-governance frameworks and standards.
Aim, Objectives, and Contributions
The aim of this work is to develop and evaluate a trustworthy multimodal framework for tool-wear prediction that reduces systematic underestimation in the safety-critical high-wear region. The objectives are:
- 1.
- Build a single-modality baseline. Develop an image-only wear-regression model without bias mitigation and evaluate it using standard and per-bin metrics (Model 1).
- 2.
- Build a multimodal engineering baseline. Fuse image features with force, acceleration, and acoustic features using bin-weighted regression and class-weighted classification (Model 2).
- 3.
- Carry out a bias audit. Quantify wear-distribution skew, wear-type imbalance, and cross-material confounding and summarise them in a bias table.
- 4.
- Apply a lifecycle bias-mitigation pipeline. Evaluate pre-processing (SMOTER, random over-sampling with Gaussian noise, and combined over/under-sampling), in-processing (cost-sensitive and relevance-based wear-bin weighting), and post-processing (residual recentring of the upper wear range) as defined in Section 5.6; select methods that reduce high-wear error without materially degrading the well-sampled region and combine them in Model 3.
- 5.
- Test model-independence and compare the three models. Evaluate image-only, multimodal, and mitigated models using MAE, RMSE, per-bin MAE gap, and signed high-wear bias, then repeat the audit and mitigation across XGBoost, Random Forest [39], LightGBM, CatBoost, support-vector regression, and a multilayer perceptron under the same fused-feature representation.
- 6.
- Test optimisation-independence and the accuracy–fairness trade-off. Apply rigorous hyperparameter search, including and regularisation, and bias-aware quantile and asymmetric losses; determine whether residual bias can be reduced further and identify the configuration offering the best high-wear target-region fairness for the lowest accuracy cost.
Contributions. This paper makes three contributions. First, it provides a reusable evaluation protocol combining signed, stratified bias auditing, target-region fairness metrics, and lifecycle mitigation. Second, it shows across six model families, tuned hyperparameters, and bias-aware losses that mitigation reduces but does not eliminate directional high-wear under-prediction. Third, it characterises the remaining bias as data-limited rather than model-reducible—that is, not addressable by any estimator, mitigation strategy, or objective tested over a fixed dataset and feature representation—in a real-world safety-relevant setting.
Together, these contributions distinguish bias that can be reduced through modelling from bias constrained by data coverage. The practical implication is that persistent high-wear underestimation ultimately requires more representative data collection in the operating conditions the model must predict, rather than indefinite algorithmic correction.
2. Related Work
Automated tool-condition monitoring has a long lineage in production engineering. The state of research and industrial practice was first consolidated by Byrne and co-workers [40], whose survey of cutting technology also documents the wear mechanisms that motivate it [41]. Teti and co-workers [42] provide the integrated account of sensor-based monitoring across the machining lifecycle, and the signal-processing methods on which indirect monitoring depends are reviewed by Zhu and co-workers [43]. More recent surveys of milling-specific monitoring [44] document the transition of these methods into data-driven practice. Across this literature the reported objective is consistently predictive accuracy, evaluated in aggregate.
The gap this work addresses is therefore specific. Prior studies of tool-wear prediction report aggregate accuracy—mean absolute error, RMSE, —averaged across the whole wear range, and do not audit the direction of the error within the safety-critical high-wear region. An aggregate figure cannot distinguish a model that errs symmetrically from one that systematically under-predicts precisely where under-prediction is dangerous. This paper audits that directional error, attempts to remove it across the modelling lifecycle, and asks whether what remains is a property of the model or of the data.
Table 2 positions this study across tool-wear prediction and bias-aware imbalanced regression. MATWI [12] provides multimodal data but evaluates vision only; Banda et al. [18] fuse process sensors without images; and Wibbeke et al. [25] study model-agnostic imbalanced regression outside tool wear and without the signed, region-stratified fairness audit used here. The present work combines image–sensor fusion, directional high-wear auditing, lifecycle mitigation, and model- and optimisation-independence tests. The comparison is deliberately by capability rather than by reported error. Published results on MATWI and on comparable tool-wear corpora are obtained under differing partitions, differing wear-range clipping conventions, and in several cases cut-level rather than tool-level splits, so a table of headline error figures placed side by side would compare protocols as much as models. The tool-level protocol adopted here is the more conservative of the alternatives, and the aggregate error reported in Section 6.4 should be read against that protocol rather than against figures obtained under looser ones.
Table 2.
Capability-based comparison with representative tool-wear and imbalanced-regression studies. ✓ indicates a stated focus and × an unaddressed capability; marks denote scope, not quality.
3. The MATWI Dataset
The Multimodal Tool Wear Images dataset (MATWI) follows seventeen carbide milling inserts through repeated CNC cutting passes to failure [12,45]. Each cut pairs a cutting-edge image, synchronised process-sensor recording, and expert flank-wear measurement, providing the multimodal and imbalanced data required for this study.
The modalities provide complementary views. Images directly show the cutting edge at pixels; accelerometer, microphone, and three force channels indirectly capture the machining response, with variable recording lengths and occasional channel inactivity. Expert flank wear in micrometres is the regression target.
Four inserts are excluded before modelling: Sets 2, 3, and 17 because of pervasive force-channel inactivity, and Set 14 because it was a pilot run with non-final cutting parameters. Whole-tool exclusion plus a per-cut requirement for valid image, sensor recording, and wear label reduces 1,803 raw rows to 1144 modelling cuts from thirteen tools and two materials.
Figure 2 shows the acquisition setup; full modality specifications, per-tool characteristics, and cut-level accounting are provided in Supplementary Section S1, Figures S1–S3, and Tables S1–S3.
Figure 2.
MATWI acquisition setup: each milling pass yields a cutting-edge image and synchronised multi-channel sensor recording [12].
4. Exploratory Data Analysis
Flank wear is strongly right-skewed: the median is near m, while the training partition contains only 78 cuts at or above m, 57 above m, and one at m (Figure 3). This reflects normal replacement practice and creates the rare high-wear regime central to the study.
Figure 3.
Flank-wear distribution across the 1144 modelling cuts, showing the sparse high-wear tail above m that motivates the audit in Section 6.11.
The consequence is measurable rather than merely anticipated.Expressed as an imbalance ratio, the most-populated wear bin outnumbers the least-populated by more than two orders of magnitude, and per-bin test error rises monotonically with wear, from m in the best-sampled bin to m in the sparsest, tracking the fall in bin occupancy from 235 cuts to one (Table 6). The relationship between sampling density and regional error is therefore observed, not inferred, and it is the empirical core of the argument developed in Section 6.11. This behaviour is the regression analogue of the class-imbalance effect long recognised in the general treatment of learning under skewed data [46], and it is the reason monitoring surveys stress evaluation over the full operating range rather than in aggregate [44].
Supplementary analyses establish four additional properties relevant to Section 5: wear coverage differs across tools (Figure S6); minority wear types motivate the binary inspection task in Section 6.9 (Figure S7); cutting parameters alone do not determine wear (Figure S8); and both image and sensor modalities carry partial wear signal (Figures S9–S11).
These results motivate feature-level fusion: images directly observe the wear scar but lose discrimination at high wear, whereas sensor descriptors provide complementary process information but are incomplete for some cuts.
5. Methodology
5.1. Overall Framework
The methodology first builds an image-only baseline and multimodal predictor (Objectives 1–2), then audits directional, region-stratified error, applies lifecycle mitigation, and tests whether residual bias depends on model family or optimisation (Objectives 3–6; Figure 4).
Figure 4.
Methodology: model construction (Objectives 1–2), followed by bias audit, lifecycle mitigation, and independence tests (Objectives 3–6).
5.2. Data Preparation and Experimental Split
All models use the curated MATWI corpus and tool-level partition of Section 4. Whole tools are assigned exclusively to train, validation, or test to prevent leakage, and flank wear is clipped at the valid upper training limit; these choices define a common basis for all comparisons (Section S1).
Protocol and Model Selection
The data are partitioned by whole tool. Training uses Sets 1, 5, 7, 8, 10 and 12 (501 cuts), validation uses Sets 6, 13 and 15 (247 cuts), and testing uses Sets 4, 9, 11 and 16 (396 cuts). No tool appears in more than one partition. A cut from a test tool therefore cannot appear in training at any wear stage. The feature scaler and the missing-value imputer are fitted on the training partition alone. Three further choices are made on the validation tools: the image-branch checkpoint, the early-stopping round of the fused regressor, and the decision threshold of the inspection classifier.
Two aspects of the selection procedure need to be stated plainly, because both limit how the mitigation results should be read. The first concerns which partition was used to choose methods. The mitigation methods that make up Model 3 were screened on test-partition metrics rather than on validation, and the hyperparameter comparison of Section 6.15 was scored the same way. Model 3 and the tuned configuration are therefore selected under an oracle protocol. Their reported figures are upper bounds on what an honest procedure would achieve, not estimates of deployed performance. The second concerns the validation tools themselves. They reach only m and contain 14 cuts at or above the m worn threshold, so a worn-region criterion computed on them rests on very few observations. Section 6.19 returns to both points.
Throughout, the regression target is flank wear clipped at , the upper limit of the training range; the un-clipped measurement is used only where the operational question requires it, namely the prediction-interval coverage of Section 6.7 and the ≥ bin of Table 13, and every such use is marked in the corresponding caption.
5.3. Image-Only Baseline (Objective 1)
The image-only baseline uses a ResNet-18 whose classification head is replaced by dropout and a scalar regression unit. Early layers are frozen and deeper blocks fine-tuned, limiting data demand while adapting high-level features to tool wear.
Training images are resized, augmented by crop, flip, small rotation, and mild colour jitter, then normalised; validation and test transforms are deterministic. Augmentation discourages reliance on incidental marks. The model uses Huber loss, AdamW, cosine annealing, and validation-based early stopping (Algorithm 1; Figure 5).
| Algorithm 1 Image-Only Wear-Regression Baseline (Objective 1) |
|
Figure 5.
Image-only baseline: augmented cutting-edge images pass through a partially fine-tuned ResNet-18 and scalar regression head.
5.4. Multimodal Model (Objective 2)
Model 2 adds process sensors through intermediate feature-level fusion: each modality is encoded separately, the fixed-length vectors are concatenated, and a single learner operates on the joint representation (Figure 6).
Figure 6.
Multimodal feature-level fusion: 512 image and 84 sensor features form a 596-dimensional vector used for wear regression, uncertainty estimation, and inspection classification.
Feature-level fusion is required because fixed-size images and variable-length, partially missing sensor time series cannot be combined directly. It also preserves cross-modal interactions that late averaging would discard.
Image branch: The image branch is the fine-tuned ResNet-18 of Section 5.3, reused as a feature extractor. After training, the activation of the network’s global average-pooling layer is taken, for each cut, as a 512-dimensional image feature vector summarising the visual evidence of wear.
Sensor branch: Variable-length recordings are reduced to 84 features. Acoustic data use Mel-Frequency Cepstral Coefficients (MFCC) and spectral descriptors; accelerometer and force channels use time- and frequency-domain statistics. Inactive channels are retained as missing values rather than zeros, and two cut-history features are appended. This lower-capacity representation is appropriate for the limited training corpus.
Fusion and prediction: The 512 image and 84 sensor features form a 596-dimensional vector. A training-only scaler standardises observed values while preserving NaNs, which XGBoost handles natively. Three quantile regressors provide the median wear estimate and 90% prediction interval; a classifier on the same features flags adhesive/combined wear, with its threshold selected on validation. Algorithm 2 gives the full settings.
| Algorithm 2 Multimodal Feature-Level Fusion: Training and Inference (Objective 2) |
|
The shared representation therefore supports a continuous regression branch and a binary inspection branch. This paper audits and mitigates the regression branch because directional high-wear under-prediction is the safety-critical continuous-imbalance problem; group-fairness mitigation of the classifier is reserved for future work (Section 7).
5.5. Bias Audit (Objective 3)
The audit is built on four quantities, defined as follows. Let denote the worn stratum, its complement, the true clipped wear of cut i, and the corresponding prediction. For a region , the regional error magnitude and the regional signed error are
The two are compared between regions through the regional disparity and the regional error ratio,
Each quantity does a different job. measures how accurate the model is within a region. records the direction of that error, which an absolute measure cannot: a negative value means the model under-predicts. D gives the gap between the two regions in micrometres, and gives the same gap as a ratio, so that means parity across the wear range.
The ratio plays the part that the disparate-impact ratio plays in classification fairness [47]. That measure is defined over discrete outcome rates, so it does not transfer to a continuous target. compares a protected region against a reference region instead of one demographic group against another. The observed value of means the model is four times less accurate in the worn region than in the healthy one. All four quantities carry bootstrap confidence intervals from resamples wherever a stratum holds enough cuts to support them.
The bias audit disaggregates the multimodal model by wear region, tool, material, and wear type, reporting both error magnitude and signed error. This exposes systematic high-wear under-prediction that aggregate accuracy can conceal and defines the target for mitigation.
5.6. Three-Stage Bias Mitigation (Objective 4)
Pre-processing screens SMOTER, ROGN, and WERCS; in-processing compares wear-bin and relevance-based weighting; and post-processing applies an upper-tail residual recentring of the predicted distribution. Candidates are selected by worn-region improvement net of healthy-region degradation, then combined to form Model 3.
5.7. Bias-Mitigation Toolkit: Selection and Scope
Methods were selected for a continuous high-wear target while preserving the wear signal. This makes imbalanced-regression methods appropriate for the regression branch, reserves group-fairness methods for the classifier, and excludes approaches that suppress feature–target dependence by construction.
Imbalanced-Regression Toolkit
Table 3 lists the imbalanced-regression methods, the lifecycle stage at which each acts, and its outcome in this study. The pre-processing methods are the SMOTE-for-regression family: SMOTER [48], which adapts the original SMOTE oversampling technique [49] to a continuous target through a relevance function; its Gaussian-noise extension (the basis of the ROGN scheme used here) [50]; and the combined over/under-sampling scheme WERCS [51]. The in-processing stage uses cost-sensitive wear-bin weighting and a relevance-based weighting derived from the Squared Error-Relevance Area (SERA) formulation [52], which is also used as the rare-target error metric throughout the regression arm. The post-processing stage applies an upper-tail residual recentring: the mean signed residual of the worn training stratum is added to every prediction exceeding the 75th percentile of the predicted distribution. This is a deterministic offset correction rather than a conformal procedure—it carries no finite-sample coverage guarantee—and is reported here only for its effect on the signed regional error. The conformalised-quantile-regression construction of [53] is used separately, in Section 6.7, for the prediction intervals. The collective outcome of these methods—documented in Section 6.12 and Section 6.14—is that the high-wear bias is reduced but not removed at the value level, which is the empirical basis for the data-limited finding within the fixed dataset and fused representation.
Table 3.
Imbalanced-regression toolkit used across pre-, in-, and post-processing stages.
5.8. Evaluation: Comparison and Trade-Off (Objectives 5 and 6)
One convention differs between the documented model and the comparison families and is recorded here because it bears on the interpretation of Section 6.14. The six comparison regressors are trained on a -transformed target and inverted at prediction time, a standard variance-stabilising choice for a strictly positive, right-skewed response; the model of Section 5.4 is trained directly on the clipped target under a quantile objective. The two conventions are not interchangeable, and this difference—together with the absence of quantile-specific tuning in the comparison families—accounts for their higher un-mitigated worn-region error.
Objective 5 compares the image-only, multimodal, and mitigated models using aggregate and disaggregated metrics. Objective 6 then evaluates the accuracy–target-region-fairness trade-off, always under the tool-level split of Section 5.2.
Two controls test whether residual bias is model- or optimisation-specific. Six regressor families are compared on the same fused features and split, varying only the regression head. The primary model is also subjected to hyperparameter search, regularisation, quantile losses, and asymmetric under-prediction penalties. Worn-region MAE is the controlling metric because it remains sensitive to error magnitude even when a high quantile reverses the error direction.
6. Results and Discussion
6.1. Experimental Data
Several distinct error quantities recur throughout this section. Because they are numerically similar and readily conflated, each is defined once here and used consistently thereafter. The worn-region MAE is the mean absolute error over test cuts whose true clipped wear is at least m. The signed worn-region under-prediction is the mean true worn wear minus the mean predicted worn wear; its sign carries the safety-relevant information, and it coincides numerically with the worn-region MAE whenever essentially every worn-region error points the same way, as it does here (m, against a worn-region MAE of m). The disparity is the worn-region MAE minus the healthy-region MAE. The mean residual gap reported in Section 6.14 is a different quantity again: it is the mean signed under-prediction across the six comparison regressor families after each has received its own best mitigation. It exceeds the m of the documented model because those families are trained without the quantile objective and tuning of Section 5.4 and on a log-transformed target, and their mean un-mitigated worn-region error is correspondingly higher—124 m in the single-run comparison (Table 16), rising to 144 m when the comparison is repeated over three seeds (Table 17).
To avoid ambiguity, the regional signed error in Equation (1) is defined as prediction minus truth, so negative values denote under-prediction. The positive worn-region under-prediction gap reported above is the opposite-signed quantity (true minus prediction), i.e., .
The final corpus contains 1144 cuts: 501 training, 247 validation, and 396 test cuts from disjoint tool sets defined in Section 5.2; full curation accounting is in Table S3. Wear spans 15–450 m in training, 30–210 m in validation, and 30–750 m in test. Missing force-derived features occur in 24, 43, and 48 vectors respectively and remain NaN for models that support them. The regression target is clipped at 450 m except where Section 6.7 explicitly uses the unclipped value.
6.2. Training of the Image Branch
The image branch follows Algorithm 1: partially fine-tuned ResNet-18, AdamW, cosine annealing, Huber loss (), and validation-based early stopping.
Validation MAE reached its minimum of at epoch six, then rose while training error continued to fall, so the epoch-six checkpoint was retained (Figure 7). At that checkpoint train and validation MAE were similar, but test MAE was (Table 4), indicating cross-tool distribution shift.
Figure 7.
Image-only ResNet-18 training trajectory. Validation MAE is minimised at epoch six; later divergence indicates overfitting.
Table 4.
Image-only baseline at the epoch selected on the validation tools, reported separately for each partition. Training and validation errors are similar while the test error is roughly larger, indicating that the test tools span operating conditions absent or under-represented in training.
A wear-bin-weighted image-only run reduced test MAE to and raised the maximum test prediction from 135 to , confirming that weighting mitigates output saturation. The headline image baseline remains the unweighted checkpoint actually used to construct the multimodal model, while weighting is evaluated systematically in Section 5.6.
6.3. Properties of the Feature Spaces
The fused vector contains 512 ResNet image features and 84 sensor/cut-history features. Three diagnostics assess whether this representation is informative and stable before downstream modelling.
Sensor features: Force descriptors dominate the strongest training correlations with wear (up to Spearman ); 49 of 84 features exceed and 17 exceed . No feature shows severe validation/test mean shift (), supporting the sensor branch as a stable fusion input.
Image features: All 512 ResNet activations correlate positively with wear (–, median ). The same median within individual training tools shows that the representation tracks within-tool wear progression rather than merely tool identity; strong inter-feature correlation is handled by the downstream boosted learner. Figure 8 summarises these correlations.
Figure 8.
Spearman correlation of the 512 ResNet features with wear; all are positive, with median .
The fusion produces well-formed inputs: After standardisation, the 596-dimensional fused training matrix has mean exactly 0 and standard deviation exactly 1 on the non-missing values, confirming that the scaler correctly excluded NaN positions when computing per-feature statistics. The matrix retains 312 NaN entries (24 training cuts × the number of features derived from the inactive force channel), and no image feature is missing. In the anchor model the NaN entries are passed unchanged to XGBoost, which assigns samples with a missing split-feature value to the default branch direction learned from observed training data, a behaviour verified to be stable across all 800 boosting rounds. In the audit and mitigation experiments the same features are imputed with the training-partition median before standardisation, since several of the comparison regressor families of Section 6.14 cannot accept missing values; the imputer and scaler are fitted on the training tools only and applied unchanged to the validation and test tools. The two conventions give equivalent aggregate error.
6.4. Aggregate Performance
Table 5 shows that fusion achieves test MAE versus for image-only and for sensor-only, improving on the better single modality by . Its validation MAE is , indicating little aggregate validation-to-test degradation.
Table 5.
Aggregate test performance. Fusion improves on the better single-modality baseline by ().
6.5. Performance Across the Wear Range
Aggregate performance hides the key result. Table 6 and Figure 9 disaggregate error by wear bin as sample counts fall from 235 cuts in the lowest bin to one in the highest.
Table 6.
Mean absolute error by wear bin over the 396 test cuts of the four held-out tools, with bin occupancy and bootstrap 95% confidence intervals from 10,000 resamples. Mean predictions are reported alongside the error for the image-only and fusion models. The image-only prediction stays within 54– across the four upper bins even as true wear rises to , evidencing a saturating output; fusion corrects this in the operational middle of the range but regresses in the sparsely populated upper bins. All fusion figures are from the same documented run (Model 2). The ≥450 m bin scores the single extreme cut against the clipped 450 m target; scored against its unclipped 750 m wear, as in Table 12 and Table 13, overall MAE is 30.9 m and worn-region MAE 85.5 m.
Figure 9.
Test MAE by wear bin. Error rises as high-wear sample counts fall; fusion improves the central range but remains biased in sparse upper bins.
- 1.
- Image-only saturation: Mean predictions remain only 54– across the four upper bins while true wear rises sharply, so MAE increases from 14 to . The image baseline therefore systematically underestimates increasing wear.
- 2.
- Fusion improves the operational middle: Fusion reduces MAE to in the 100– bin and in 200–, while its mean prediction rises with wear rather than saturating like the image-only model.
- 3.
- Fusion does not solve the very-high-wear region: In the two sparsest bins (300–449 and ≥450, and ) the fusion model’s mean prediction falls again, to 92 and , and its MAE rises to 208 and . The fusion still beats the image-only baseline in both bins but by less than the sensor-only model: in the 300– bin the sensor-only model achieves an MAE of , while the fusion reaches 208. The very-high-wear region is therefore the one stratum where adding the image features can hurt rather than help: a saturating image branch pulls the fused prediction back towards the abundant low-wear regime that it was effectively trained to recognise. This is not a defect of the fusion design but a direct consequence of the training distribution—a single training cut at ≥ and only 56 training cuts in 300–, 57 in total above , cannot, by gradient descent or by tree boosting, train any model to extrapolate further. The residual high-wear bias defines the target of the planned mitigation programme.
6.6. Performance Across Individual Tools
Per-tool results (Table 7; Figure 10 and Figure 11) show that error concentrates on tools reaching high wear. Signed bias is reported so negative values identify systematic underestimation.
Table 7.
Test-split performance decomposed by held-out tool, computed separately over the cuts of each of the four test tools. Signed bias is the mean prediction minus the mean true wear, so a negative value denotes under-prediction. Every image-only entry is negative, and the largest under-estimations fall on the two tools reaching the high-wear region (Sets 11 and 16). Fusion improves on the image-only model for three of the four tools and matches it on Set 9, the lowest-wear tool. Fusion figures are from the same documented run as Table 6, under the same clipped-target convention (overall MAE 30.2 m). Set 11 contains the single ≥ 450 m cut.
Figure 10.
Image-only predicted versus true wear by split and tool, showing test-set saturation at high wear.
Figure 11.
Predicted versus true test wear for image-only, sensor-only, and multimodal models. Fusion follows the ideal diagonal most closely.
The image-only model underestimates every test tool, with bias worsening from on low-wear Set 9 to on Set 16. Fusion reduces MAE by 48–66% on Sets 4, 11, and 16 and matches image-only on the easiest low-wear Set 9, concentrating its benefit on harder tools.
The dispersion across tools is itself informative. Taking the four test tools together, the fusion model’s mean absolute error is m with a standard deviation of 18.5 m across tools—a dispersion of the same order as the mean. This is the cross-tool variance that a single aggregate figure conceals, and it has a physical reading. The tools differ in workpiece material, cutting parameters, and the wear range they traverse (Table S2), so each test tool represents a partially shifted operating distribution rather than a fresh draw from the training distribution. Per-tool error therefore mixes model quality with inter-tool domain shift, and the contrast between Set 9 (m, a short run confined to the low-wear regime) and Set 16 (m, spanning to m) is largely the latter. This also means that the single fixed partition used throughout is one draw from a distribution of possible tool assignments whose spread is not negligible, a limitation recorded in Section 6.19.
6.7. Calibration of the Prediction Interval
The multimodal model’s nominal 90% interval has test coverage and mean width . The upper quantile required retraining without early stopping because the default criterion terminated at zero trees; after a fixed 400-tree run, quantile ordering is correct on of test rows.
Coverage is conservative in populated bins but fails on the single cut (Table 8; Figure 12), where the entire interval lies below the true wear. Conformal recalibration [53,56] slightly increases aggregate coverage and width but cannot correct a uniformly biased high-wear quantile estimate.
Table 8.
Empirical coverage of the nominal prediction interval by wear bin; coverage fails on the single extreme high-wear cut.
Figure 12.
Test prediction-interval coverage by wear bin; the interval is conservative in populated bins and fails in the extreme high-wear bin.
6.8. Where the Predictive Signal Comes from
Ablation retrains the fusion model while removing image, force/accelerometer, acoustic, or cut-history feature groups from the 596-dimensional representation; Table 9 reports the resulting test MAE.
Table 9.
Ablation of the fused representation. Each row removes one component from the full 596-dimensional fusion and reports the resulting test MAE and its change relative to the full model; the column is the quantity of interest. All differences are referenced to the ablation study’s own full-fusion baseline of , which differs from the headline of Table 5 only in how the single ≥ 450 m cut is scored: the ablation baseline uses the clipped 450 m target, whereas the headline uses the unclipped 750 m wear; the ranking is unaffected.
Ablation shows that both modalities matter: removing sensors raises MAE by and removing images by . Force/accelerometer features contribute more than acoustic features, consistent with Section 6.3, while removing cut-history slightly improves MAE, suggesting progression is already encoded in the other modalities.
6.9. Wear-Type Inspection Classifier
The original three-class wear-type classifier collapses to the majority flank class: despite accuracy, it detects none of the 96 combined-wear or 20 adhesion cases. The task is therefore reduced to binary flank versus “needs inspection” (Figure 13).
Figure 13.
Three-class test confusion matrix showing majority-class collapse onto flank wear.
The class-balanced binary model achieves ROC-AUC . Lowering the threshold from to the validation-selected raises inspection recall from to while keeping the false-alarm rate at and precision at (Table 10; Figure 14 and Figure 15).
Table 10.
Binary inspection-classifier operating points. The selected threshold increases recall while maintaining a low false-alarm rate.
Figure 14.
Binary inspection-classifier recall, precision, and false-alarm trade-off across decision thresholds.
Figure 15.
Binary inspection confusion matrices at and the selected , showing the recall gain from threshold adjustment.
6.10. Decision-Level Analysis at Maintenance Thresholds
Continuous MAE and signed bias do not directly express maintenance decisions, so predictions are also thresholded at 200, 300, and 350 m. A false-safe (FS) is a truly worn cut predicted safe; false-maintenance (FM) is a safe cut predicted worn.
The image-only model’s predictions are capped at 117.5 m on the test set; the fusion model reaches 191.9 m. Neither crosses any threshold, so every worn tool is missed and no unnecessary stop is triggered. Model 3 (mitigated) raises the worn-region mean prediction from 154 to 170 m but its maximum likewise stays below 200 m. The result—summarised in Table 11—is a 100% false-safe rate and 0% false-maintenance rate across all three models and all three thresholds. With only 4 test cuts at ≥m (Table 11) and 57 training cuts above that threshold, no supervised learner can flag values it has almost never seen: the decision-level failure is data-limited under the evaluated representation and is not removed by the tested algorithms.
Table 11.
Decision-level outcomes obtained by thresholding the continuous prediction of each model at three candidate maintenance limits, evaluated over the 396 test cuts. and are the numbers of test cuts with true clipped wear at or above, and below, the threshold. FN counts worn tools predicted safe, the dangerous miss; FP counts safe tools predicted worn, an unnecessary stop. FS and FM are the corresponding false-safe and false-maintenance rates. No prediction exceeds on the test set, so every worn tool is missed at every threshold. The Model 3 column reflects mitigation screened on the test partition (oracle protocol, Section 5.2), so it is an upper bound rather than a deployable operating point; even so, it changes no decision outcome.
6.11. Bias Audit of the Multimodal Model (Objective 3)
The audit uses the same multimodal model and held-out test tools as Section 6.4 and Table 5; only the reporting changes to signed and regional errors. Aggregate test MAE remains .
Disaggregation at reveals healthy-region MAE but worn-region MAE, a disparity. Mean worn wear is but is predicted at , an safety-relevant underestimation (Table 12).
Table 12.
Regional bias audit of the multimodal model, showing substantially larger and directionally biased error in the worn region. Computed from the documented multimodal run (Model 2). Scored against the clipped 450 m target, overall MAE is 30.2 m and worn-region MAE 80.4 m; scored against the unclipped 750 m wear of the single extreme cut, as in Table 13, they are 30.9 and 85.5 m.
Table 13 shows signed error deepening from to m as wear increases (Spearman between wear bin and absolute error). Bootstrap intervals are narrow and non-overlapping for the three populated bins (), confirming the trend; the bin confirms direction but not precise magnitude, and the bin cannot support an interval. The largest errors therefore coincide with the sparsest high-wear bins.
Table 13.
Per-bin signed error and MAE with bootstrap 95% confidence intervals; under-prediction deepens as the high-wear bins become sparse.
Figure 16 shows the same pattern visually: error increases as samples become sparse, predictions saturate below true high wear, and signed under-prediction deepens across the upper range.
Figure 16.
Multimodal bias audit: sample density, predicted-versus-true wear, signed error, and MAE all show worsening performance in the sparse high-wear region.
Per-tool and per-material decomposition shows that the effect follows the high-wear region rather than one tool or material; worn-region MAE is similar for CK45 () and RVS304 ().
6.12. Three-Stage Mitigation and the Mitigated Model (Objective 4)
Each mitigation stage was screened separately. ROGN, relevance-based weighting, and upper-range recentring were selected and combined as Model 3; Table 14 compares it with Model 2.
Table 14.
Model 3 versus Model 2. Lifecycle mitigation reduces worn-region error and disparity but increases healthy and overall error.
Model 3 reduces worn-region MAE by () and disparity from to , but raises healthy and overall error. The remaining worn gap shows that mitigation shifts predictions upward without recovering enough high-wear signal.
6.13. Three-Way Model Comparison (Objective 5)
Table 15 and Figure 17 compare Models 1-3: fusion substantially improves image-only accuracy, while mitigation trades some aggregate accuracy for lower high-wear disparity.
Table 15.
Three-way comparison of image-only, multimodal, and mitigated models across aggregate and regional error.
Figure 17.
Three-way comparison of signed error and regional performance, showing the gain from fusion and the partial high-wear correction from mitigation.
6.14. Model-Independence of the Residual Bias
To test model-independence, the audit-and-mitigation pipeline is repeated across six regressor families on the same fused features and tool split, varying only the regression head (Table 16).
Table 16.
Model-independence test on the test split. Every family is trained on the identical 596-dimensional fused representation and the identical tool-level partition, so the regressor is the only variable, and each receives its own independently screened mitigation. All six leave the worn region substantially under-predicted, with a residual gap of 69–. Values are from a single run at the base seed (42); each family receives its own screened mitigation. Across the six families the baseline worn-MAE averages 124 m and the residual gap 106 m. The per-family mitigation was screened on the test partition, under the oracle protocol of Section 5.2, so the mitigated figures are upper bounds.
After each family’s best mitigation, worn-region under-prediction remains 69– (mean ). SVR and MLP reduce the gap more than the tree ensembles but none removes it (Figure 18); the higher baseline errors reflect the deliberately standardised comparison protocol rather than a different conclusion.
Figure 18.
Residual high-wear bias across six regressor families before and after each family’s best mitigation.
Whether the differences between families can be distinguished from random variation is a question the single-run comparison above cannot settle. The comparison was therefore repeated over three random seeds, redrawing the resampler perturbations, the model initialisations, and the stochastic subsampling at each repeat; Table 17 reports the mean and standard deviation across repeats. The residual signed gap spans 92–m across all families and seeds, with a mean of m against a true worn-region mean of m, and the largest within-family standard deviation is m. The persistence of the gap is therefore an order of magnitude larger than the seed-to-seed variation and cannot be attributed to random initialisation. Two features of the table warrant comment. The mean un-mitigated worn-region error of these comparison families is m, well above the m of the documented model, which accounts for their larger residual gaps; and for one family (LightGBM) the mitigation pipeline increased the worn-region error on average. Neither observation weakens the conclusion. Both indicate that the limiting factor lies in the data rather than in the choice of estimator or mitigation method.
Table 17.
Seed sensitivity of the model-independence test. Each family was screened and re-fitted under three random seeds; values are mean ± standard deviation in . Residual gap is the signed worn-region under-prediction remaining after that family’s own best mitigation. All settings match Table 16, but values are the mean ± standard deviation over three seeds (42–44), so the baselines differ from the single-run figures in Table 16. The MLP is the most seed-sensitive family, so its three-seed baseline mean (205.4 m) sits well above its single-run value (92 m). Screening used the test partition (oracle protocol), as for Table 16.
6.15. Optimisation-Independence of the Residual Bias
The final control tests whether dedicated optimisation can close the gap. The model was subjected to a systematic hyperparameter search including and regularisation, and to two bias-aware loss functions designed to counter under-prediction. Table 18 reports the worn-region MAE and mean prediction for each configuration.
Table 18.
Optimisation-independence test: tuning and bias-aware losses do not reduce worn-region MAE below the observed error floor.
No optimisation reduces worn-region MAE below about . Tuning and asymmetric loss worsen under-prediction, whereas quantile loss overshoots the worn mean to without lowering MAE. Thus optimisation changes error direction but not the persistent error floor.
Two qualifications attach to this result. The first concerns how the tuned configuration was chosen. It was obtained by minimising worn-region error on the test partition itself (Section 5.2). The figure it reaches is therefore an oracle bound, not an achievable operating point. Read that way it is the stronger statement: even with full knowledge of the test outcome, no configuration in the search brings worn-region error below about m. Apart from the quantile configuration, which overshoots the worn mean to 306 m without lowering the MAE, the highest worn-region mean prediction any configuration reaches is 153 m against a true worn mean of 239 m. Repeating the search on the validation tools alone returns the same configuration and the same error, so test-set selection bought nothing here. The floor belongs to the data, not to the procedure that found it. The second qualification concerns stability. Across random seeds the standard deviation of worn-region MAE never exceeds m, while the best and worst configurations differ by 49 m. The ranking is therefore robust.
6.16. Accuracy–Target-Region Fairness Trade-Off (Objective 6)
Here, fairness means only target-region fairness: the worn-versus-healthy MAE disparity, not demographic fairness [22]. Table 19 sweeps mitigation intensity and shows that lower worn error is purchased with higher healthy-region error.
Table 19.
Accuracy–target-region-fairness trade-off across mitigation intensity.
Conservative weighting (Model 2) captures most of the available high-wear improvement at low healthy-region cost. More aggressive mitigation leaves a 67– residual gap, and relevance weighting alone slightly outperforms the combined pipeline, showing diminishing returns once data coverage becomes the binding constraint.
Reporting the trade-off is not the same as giving a practitioner a rule for navigating it. To close that gap, the “honest” selection criterion of Section 5.6 is stated formally as a scalar index. Let a candidate configuration be compared against a reference configuration, and define the worn-region gain and the healthy-region cost of that candidate as
is the improvement in worn-region error relative to the reference model, while is the increase in healthy-region error caused by the candidate configuration. The trade-off index is their weighted difference,
Here is the relative penalty assigned to healthy-region degradation (the proxy for an unnecessary stop) per unit benefit from reducing worn-region error. A candidate is preferred when . The cost ratio at which that preference reverses follows directly:
The value of comes from the operating context, not from the data. When a missed replacement is much more costly than an unnecessary stop, should be lower; when unnecessary stops carry greater relative cost, should be higher. Written this way, choosing a mitigation intensity becomes a single comparison: set from the shop floor, and prefer a candidate when its break-even ratio exceeds the chosen .
Applying Equations (3)–(5) to Table 19, with Model 2 as the reference, yields an explicit ranking of the available configurations. Relevance-based (SERA) weighting alone gives
so
The combined pipeline gives
giving
The comparison also brings out a relation the aggregate figures leave buried. On every metric in Table 19, relevance weighting on its own beats the combined pipeline: worn-region MAE versus , healthy-region MAE versus , overall MAE versus , and disparity versus . It therefore dominates the combined pipeline at every value of . The reason is that the stages interact. Resampling and relevance weighting both push predictions upward in the worn region, so applying them together overshoots in the healthy region without buying any further worn-region gain. Picking the best method at each stage and composing them, as Section 5.6 does, therefore need not produce the best composite. For this dataset we recommend the single-stage relevance-weighted configuration. The full lifecycle pipeline remains valuable, but as a diagnostic: it shows how far the complete toolkit can go.
6.17. Per-Material Analysis: CK45 and the Data-Adequacy Contrast
One methodological point must be stated before the result. The CK45-only experiment does not use the partition of Section 5.2. A CK45-only split constructed on the same principle would place every high-wear tool in a single partition and leave the training set with no worn cuts at all, making the audit impossible to compute. The experiment therefore uses a CK45-specific tool-wise split in which high-wear tools appear in both the training and test partitions. No cut is shared between partitions and no cut-level leakage occurs, but the two experiments are not directly comparable in absolute terms, and the comparison below should be read as a contrast in the direction of the effect rather than in its magnitude.
A CK45-only experiment tests whether material mixing causes the bias. The model is retrained and audited using a tool-wise CK45 split with high-wear tools represented in both partitions (Table 20).
Table 20.
Per-material analysis: CK45-only training improves aggregate accuracy but increases high-wear bias as worn-sample coverage decreases.
Restricting to CK45 improves aggregate MAE () but worsens the worn gap (), because it removes scarce high-wear examples contributed by the other material. The result therefore supports data availability, not material heterogeneity, as the main constraint.
RVS304 provides the complementary case: its tools are concentrated below about , leaving too few high-wear cuts for an independent audit. This absence itself illustrates why algorithmic mitigation cannot replace missing high-wear observations.
6.18. Synthesis: A Data-Limited Bias (Objective 6)
Overall, a aggregate MAE coexists with an ≈ high-wear under-prediction. Lifecycle mitigation reduces but does not remove it, and the residual persists across model families and optimisation settings.
Having held the data and the fused representation fixed while varying the model family, the mitigation strategy, the hyperparameters, and the loss function—and having observed worn-region error of similar magnitude throughout, under-predicting in every configuration except the quantile loss, which reverses the sign by overshooting without reducing the error—the most parsimonious explanation remaining within the space of interventions tested is the sampling of the data itself. Section 6.21 states the boundary conditions of this inference. The high-wear regime is too sparsely and unevenly sampled for any model to learn the mapping reliably; the information needed for accurate high-wear prediction is not present to be recovered. The per-material analysis of Section 6.17 reinforces this directly: restricting the model to a single material increases rather than decreases the gap, and the material lacking high-wear data cannot be audited at all.
Within that scope, the bias is therefore data-limited rather than model-reducible. The practical consequence for predictive maintenance is concrete: the protocol developed here—audit the high-wear bias, exhaust the lifecycle mitigation toolkit, and test the residual against model family and optimisation—allows a practitioner to determine when a bias is reducible by algorithmic means and when it is not. When, as here, the bias survives every algorithmic intervention, effort is better directed upstream, toward balanced and representative high-wear data collection at the acquisition stage, than toward further model or loss engineering. The same procedure applies to any new material or operating condition: it will reduce the bias but, absent adequate high-wear data, will not remove it.
Two further trade-offs bear on whether the framework is deployable, not merely accurate. The first is between accuracy and interpretability. The fused model combines hand-crafted sensor descriptors with a frozen image representation, and that choice was deliberate. The sensor half of the feature vector consists of named physical quantities, so a process engineer can read a per-feature attribution directly. The activations of an end-to-end network offer no such reading. The cost is that the image half stays opaque: the 512-dimensional representation cannot be interrogated feature by feature. What the design buys is partial interpretability, not full transparency. For the human-in-the-loop deployment described in Section 1 we judge that acceptable, but it is a trade rather than a free property.
The second trade-off is between the benefit of fusion and what it costs to compute. Every cut requires one ResNet-18 forward pass and the extraction of 84 statistical and spectral descriptors from five channels. The return is m of aggregate test error against the image-only baseline (Table 5). On modern hardware that cost sits comfortably inside the cycle time of a milling pass, so the exchange is favourable at the scale studied here. It would not automatically hold on a high-throughput line running inference at every pass across many spindles. There the limiting term is the sensor-feature extraction, not the network forward pass.
6.19. Limitations
Five limitations bound the interpretation of the results reported above.
- 1.
- Sample scarcity in the target region. The worn stratum of the test partition contains 58 of 396 cuts, of which 4 exceed m and 1 exceeds m. The training partition contains 78 cuts above m and 57 above m. Every worn-region statistic in this paper therefore rests on tens rather than hundreds of observations, and the highest-wear bins in particular should be read as indicative. This scarcity is not incidental to the study—it is the phenomenon under investigation—but it limits the precision of the estimates that characterise it.
- 2.
- Oracle selection. As stated in Section 5.2, the mitigation composition of Model 3 and the tuned configuration of Section 6.15 were selected on test-partition metrics. Their reported performance is an upper bound. The audit, the per-bin and per-tool decompositions, and the decision-level analysis involve no such selection.
- 3.
- A single fixed partition. All results derive from one tool-level split. The per-tool decomposition of Table 7 shows test-set MAE ranging from m on Set 9 to m on Set 16, a spread of the same order as the mean, so a different assignment of tools to partitions would shift the headline figures appreciably. Repeated tool-level resampling would quantify this and is left to future work.
- 4.
- The clipped target. The regression target is clipped at m. The single test cut whose true wear is m is therefore outside the range the model was trained to represent at all, and its error is reported against both conventions in Section 6.11.
- 5.
- Overfitting on a small corpus. With 501 training cuts and a 596-dimensional representation, overfitting is a live risk. It is directly observable in the image branch, whose validation error reaches its minimum of m at epoch six and rises to m by epoch fourteen. The fused model shows a smaller validation-to-test gap of m, but the margin is thin enough that the regularisation settings of Appendix A should be regarded as load-bearing rather than incidental. The risk is the one identified generally for multimodal models trained on limited industrial corpora [46], and it is the reason the reliability of the model is assessed here by region-stratified audit rather than by aggregate error alone.
6.20. Sensitivity Analyses and the Boundaries of the Present Evidence
The results above rest on a set of methodological choices whose influence has been tested to differing depths, and it is worth stating plainly how far that testing goes. The model-independence and optimisation-independence comparisons have been repeated across random seeds, and the dispersion reported in Table 17 is an order of magnitude smaller than the effect under study. The bootstrap intervals of Table 6 and Table 13 establish that the sign and rank of the per-bin bias are not artefacts of sampling. Four further sensitivities remain untested, and each is identified here so that the strength of the conclusion can be judged against them.
- 1.
- Mitigation hyperparameters. Each resampler and the post-hoc recentring is reported at a single configuration. The persistence of the residual gap across three structurally different pre-processing methods, two in-processing weightings, and a post-processing correction is indirect evidence that the conclusion is not configuration- specific, but it is not a substitute for a sweep across each method’s principal parameters, and no such sweep is reported here.
- 2.
- Within-branch composition. The ablation of Table 9 removes feature groups but does not probe inside either branch: the image representation is treated as a single block, and the sensor descriptors are not separated into time- and frequency-domain components. The relative contribution of the two modalities is therefore established; the internal structure of each is not.
- 3.
- The mechanism of the material effect. Section 6.17 attributes the widened gap under CK45-only training to reduced worn-sample count. This is consistent with the sampling argument of the paper but is not isolated experimentally: a controlled comparison at matched worn-sample count would be required to separate sample scarcity from any genuine difference in the identifiability of wear features across materials, and that comparison is not performed here.
- 4.
- Partition dependence. Every figure derives from a single tool-level split. The per-tool dispersion reported in Section 6.6 shows that a different assignment of tools to partitions would move the headline values appreciably, and repeated tool-level resampling—leave-one-tool-out over the thirteen retained tools—would quantify this directly. It has not been performed, and the single-split limitation stands.
None of these four bears on the direction of the finding, which is established by the audit rather than by the mitigation experiments, and each is a matter of how tightly the magnitude is bounded rather than whether the effect exists. They are nonetheless the sensitivities a reader should weigh, and they are the first items in the programme of work set out in Section 7.
6.21. Scope and Boundary Conditions of the Conclusion
The inference drawn above is conditional, and the conditions are worth stating precisely. Three elements were held fixed throughout: the MATWI corpus and its tool-level partition; the 596-dimensional fused representation formed from 512 ResNet-18 image features and 84 force, acceleration, and acoustic features; and the clipped regression target. Within that setting, four factors were varied—the regressor family (six families, Section 6.14), the mitigation stage and method (Section 6.12), the hyperparameter configuration, and the training objective (Section 6.15)—and none removed the directional high-wear error.
What follows is that the bias is not reducible by the interventions tested. What does not follow is that it is irreducible in principle. Several directions were not attempted and could plausibly alter the picture: alternative image backbones or learned sensor encoders in place of the frozen ResNet-18 representation; generative or physics-informed synthesis of high-wear samples; domain adaptation across tools or workpiece materials; and additional sensing modalities such as spindle current or thermal imaging. Each of these changes the representation or the data rather than the estimator, and the present evidence speaks only to the estimator.
The representation carries limitations of its own, and three are characteristic of multimodal industrial data. The first is missing modalities. One force channel is inactive for a substantial minority of cuts, so those records are imputed rather than measured and the sensor branch works from a partly reconstructed input. The second is representational loss. The acoustic and force features are hand-crafted summaries, not learned encodings. Information in the raw waveform may therefore never reach the fused vector, and transient events such as edge chipping are the likeliest casualties. The third is sensor drift. No correction is applied for slow instrumental change over a tool’s life. Gradual drift in the accelerometer or force-table response is thus confounded with the gradual wear it is meant to measure, and within a single tool run the two cannot be separated. Measurement noise is not modelled separately; stochastic sensor noise is absorbed into the hand-crafted descriptors and therefore remains an unquantified source of uncertainty in the fused representation. These are properties of the available data and its representation, not of the models compared, and they are precisely the properties that a targeted acquisition campaign would address.
Finally, the conclusion is specific to this corpus. MATWI is a single dataset of 13 usable tools, and the high-wear regime is represented by 78 training cuts above , of which 57exceed and one exceeds . A dataset with denser high-wear coverage might well support accurate prediction where this one does not; establishing that is the natural next step, and it is a data-collection step rather than a modelling one.
7. Conclusions
This study asks whether safety-critical high-wear under-prediction can be removed by lifecycle mitigation or is constrained by the available data. The protocol combines signed auditing, staged mitigation, and model- and optimisation-independence tests.
The audit’s most consequential finding is a decision-level one: at every maintenance threshold evaluated—200, 300, and m—no prediction from any of the three models crosses the threshold, giving a false-safe rate and a false-maintenance rate on the held-out tools. An aggregate mean absolute error of m therefore coexists with a system that would never once have triggered a replacement decision. The regional audit found approximately of high-wear under-prediction. Mitigation reduced but did not remove the bias, while six model families retained a mean residual gap of 106 m in the single-run comparison (Table 16), and 124 m averaged over three seeds (Table 17) and optimisation tests retained an approximately worn-region error floor.
Taken together, these results establish that the bias is data-limited under the representation evaluated here. Having held the data and the fused feature representation fixed while varying the model, the mitigation strategy, the hyperparameters, and the loss function, and having observed worn-region error of similar magnitude throughout, under-predicting in every configuration except the quantile loss, which reverses the sign by overshooting without reducing the error, the explanation that remains within the space of interventions tested is the sparse and uneven sampling of the high-wear regime. Section 6.21 sets out what was held fixed and what was not attempted, and the claim should be read against those boundaries. The contribution is therefore a reproducible way to distinguish model-reducible from data-limited bias and to identify when further tuning should give way to targeted high-wear data collection.
The conclusion is limited to this dataset and representation: richer sensing or denser high-wear data may change the result. Under the evaluated conditions, however, data adequacy is the binding constraint. Future work proceeds along three lines. The first completes the sensitivity programme identified in Section 6.20: hyperparameter sweeps across the mitigation methods, a within-branch ablation separating the time- and frequency-domain sensor descriptors, a matched-sample-size comparison isolating the mechanism of the per-material effect, and leave-one-tool-out resampling to remove the single-partition limitation. These tighten the bounds on the magnitude of the residual bias without altering its direction, and they are the immediate next steps rather than long-term aims. The second extends the protocol to additional datasets and materials and pursues targeted high-wear acquisition along four concrete routes. (i) Accelerated tool-failure trials, in which inserts are deliberately run to and beyond the replacement limit under controlled conditions, would populate the 300– band that the present corpus represents with 57 training cuts; this is the most direct remedy for the sparsity the audit identifies. (ii) Transfer learning from related machining corpora would test whether high-wear structure learned elsewhere is portable, and would separate representation limits from sample-count limits. (iii) Generative or physics-informed synthesis of high-wear cuts would supply training density where measurement is expensive, though it must be validated against the audit rather than against aggregate error, since a generator trained on the same skewed corpus may reproduce its bias. (iv) An industrial pilot with human-in-the-loop verification would establish whether the residual bias is operationally tolerable when an operator retains the replacement decision, and would supply the real-world high-wear observations that laboratory trials cannot. The third extends the study to fairness mitigation of the binary inspection classifier, testing whether its discrete decision admits a fairer operating point than the continuous regression branch.
Supplementary Materials
The following supporting information can be downloaded at https://www.mdpi.com/article/10.3390/ai7100400/s1.
Author Contributions
Conceptualisation, M.N.A. and Z.A.F.; Methodology, M.N.A. and Z.A.F.; Writing—original draft preparation, M.N.A.; Writing—review and editing, M.N.A., Z.A.F., M.A.F. and E.H.; and Supervision, A.S. All authors have read and agreed to the published version of the manuscript.
Funding
This research was funded by Innovate UK under High-Value Manufacturing Catapult (HVMC) 2026/27.
Institutional Review Board Statement
Not applicable.
Informed Consent Statement
Not applicable.
Data Availability Statement
The MATWI dataset analysed in this study is publicly available from the source cited in [12]. All figures and tables were produced from the analysis pipeline described in Section 5; the pipeline, including the feature-extraction, audit, and mitigation notebooks and the exact tool-level partition used, is available from the corresponding author on request and will be deposited in a public repository on acceptance. Further inquiries can be directed to the corresponding author.
Conflicts of Interest
The authors declare no conflicts of interest.
Abbreviations
The following abbreviations are used in this manuscript:
| AdamW | Adam optimiser with decoupled weight decay |
| AI | Artificial Intelligence |
| AI Act | European Union Artificial Intelligence Act |
| ARIA | Advanced Research and Invention Agency |
| AUC | Area Under the Curve |
| CI | Confidence Interval |
| CK45 | CK45 carbon steel (workpiece material) |
| CNC | Computer Numerical Control |
| CNN | Convolutional Neural Network |
| GAN | Generative Adversarial Network |
| IEEE | Institute of Electrical and Electronics Engineers |
| IIoT | Industrial Internet of Things |
| ISO/IEC | International Organization for Standardization/International Electrotechnical Commission |
| JPEG | Joint Photographic Experts Group |
| LLM | Large Language Model |
| MAE | Mean Absolute Error |
| MATWI | Multimodal Automatic Tool Wear Inspection |
| MFCC | Mel-Frequency Cepstral Coefficients |
| ML | Machine Learning |
| MLP | Multilayer Perceptron |
| MQTT | Message Queuing Telemetry Transport |
| NaN | Not a Number |
| NIST | National Institute of Standards and Technology |
| OECD | Organisation for Economic Co-operation and Development |
| ResNet | Residual Network |
| RGB | Red–Green–Blue (colour image) |
| RMS | Root Mean Square |
| RMSE | Root Mean Square Error |
| ROC | Receiver Operating Characteristic |
| ROGN | Random Over-sampling with Gaussian Noise |
| RVS304 | RVS 304 stainless steel (workpiece material) |
| SERA | Squared Error-Relevance Area |
| SMOGN | SMOTE for Regression with Gaussian Noise |
| SMOTER | Synthetic Minority Over-sampling Technique for Regression |
| SVR | Support Vector Regression |
| TAI | Trustworthy Artificial Intelligence |
| WERCS | Weighted Relevance-based Combination Strategy |
| XGBoost | Extreme Gradient Boosting |
Appendix A. Architecture, Hyperparameters, and Training Protocol
The settings listed below govern every result reported in Section 6. They are collected here to provide a single reference for reproduction, complementing the procedural descriptions of Section 5.
Table A1.
Complete architecture, hyperparameter, and training-protocol settings.
References
- Plathottam, S.J.; Rzonca, A.; Lakhnori, R.; Iloeje, C.O. A review of artificial intelligence applications in manufacturing operations. J. Adv. Manuf. Process. 2023, 5, e10159. [Google Scholar] [CrossRef] [Scilit]
- Ahangar, M.N.; Farhat, Z.A.; Sivanathan, A. AI trustworthiness in manufacturing: Challenges, toolkits, and the path to Industry 5.0. Sensors 2025, 25, 4357. [Google Scholar] [CrossRef] [Scilit] [PubMed]
- Ahangar, M.N.; Farhat, Z.A.; Sivanathan, A.; Ketheesram, N.; Kaur, S. Explainable AI-Driven Quality and Condition Monitoring in Smart Manufacturing. Sensors 2026, 26, 911. [Google Scholar] [CrossRef] [Scilit] [PubMed]
- Ucar, A.; Karakose, M.; Kırımça, N. Artificial intelligence for predictive maintenance applications: Key components, trustworthiness, and future trends. Appl. Sci. 2024, 14, 898. [Google Scholar] [CrossRef] [Scilit]
- Nasir, V.; Sassani, F. A review on deep learning in machining and tool monitoring: Methods, opportunities, and challenges. Int. J. Adv. Manuf. Technol. 2021, 115, 2683–2709. [Google Scholar] [CrossRef] [Scilit]
- Brintrup, A.; Baryannis, G.; Tiwari, A.; Ratchev, S.; Martinez-Arellano, G.; Singh, J. Trustworthy, responsible and ethical artificial intelligence in manufacturing and supply chains: Synthesis and emerging research questions. Data-Centric Eng. 2025, 6, e53. [Google Scholar] [CrossRef] [Scilit]
- Sun, X.; Song, Y. Unlocking the synergy: Increasing productivity through human–AI collaboration in the Industry 5.0 era. Comput. Ind. Eng. 2025, 200, 110657. [Google Scholar] [CrossRef] [Scilit]
- Martini, B.; Bellisario, D.; Coletti, P. Human-centered and sustainable artificial intelligence in Industry 5.0: Challenges and perspectives. Sustainability 2024, 16, 5448. [Google Scholar] [CrossRef] [Scilit]
- Callari, T.C.; Curzi, Y.; Lohse, N. Realising human-robot collaboration in manufacturing? A journey towards Industry 5.0 amid organisational paradoxical tensions. Technol. Forecast. Soc. Change 2025, 219, 124249. [Google Scholar] [CrossRef] [Scilit]
- Li, D.; Liu, S.; Wang, B.; Yu, C.; Zheng, P.; Li, W. Trustworthy AI for human-centric smart manufacturing: A survey. J. Manuf. Syst. 2025, 78, 308–327. [Google Scholar] [CrossRef] [Scilit]
- Tzionis, G.; Mouratidis, P.; Kougka, G.; Gialampoukidis, I.; Vrochidis, S. A review of explainable AI methods and their application in manufacturing systems. Discov. Appl. Sci. 2026, 8, 52. [Google Scholar] [CrossRef] [Scilit]
- De Pauw, L.; Jacobs, T.; Goedemé, T. MATWI: A multimodal automatic tool wear inspection dataset and baseline algorithms. In Proceedings of the Computer Vision Systems (ICVS 2023); Lecture Notes in Computer Science; Springer: Cham, Switzerland, 2023; Volume 14253, pp. 255–269. [Google Scholar] [CrossRef] [Scilit]
- Si, S.; Mu, D.; Si, Z. Intelligent tool wear prediction based on deep learning PSD-CVT model. Sci. Rep. 2024, 14, 20754. [Google Scholar] [CrossRef] [Scilit] [PubMed]
- Hu, Y.; Jia, Q.; Yao, Y.; Lee, Y.; Lee, M.; Wang, C.; Zhou, X.; Xie, R.; Yu, F.R. Industrial Internet of Things intelligence empowering smart manufacturing: A literature review. IEEE Internet Things J. 2024, 11, 19143–19167. [Google Scholar] [CrossRef] [Scilit]
- Bai, D.; Li, G.; Jiang, D.; Yun, J.; Tao, B.; Jiang, G.; Sun, Y.; Ju, Z. Surface defect detection methods for industrial products with imbalanced samples: A review of progress in the 2020s. Eng. Appl. Artif. Intell. 2024, 130, 107697. [Google Scholar] [CrossRef] [Scilit]
- Ren, Y.; Liu, Y.; Ji, T.; Xu, X. AI agents and agentic AI—Navigating a plethora of concepts for future manufacturing. J. Manuf. Syst. 2025, 82, 845–867. [Google Scholar] [CrossRef] [Scilit]
- Vaswani, A.; Shazeer, N.; Parmar, N.; Uszkoreit, J.; Jones, L.; Gomez, A.N.; Kaiser, Ł.; Polosukhin, I. Attention Is All You Need. In Proceedings of the Advances in Neural Information Processing Systems 30, Long Beach, CA, USA, 4–9 December 2017; pp. 5998–6008. [Google Scholar]
- Kumar, A.; Vasu, V. Tool wear prediction using multi-sensor data fusion and attention-based deep learning. Prod. Eng. 2025, 19, 455–471. [Google Scholar] [CrossRef] [Scilit]
- National Institute of Standards and Technology. Artificial Intelligence Risk Management Framework (AI RMF 1.0); Technical Report NIST AI 100-1; U.S. Department of Commerce: Gaithersburg, MD, USA, 2023. [CrossRef] [Scilit]
- Organisation for Economic Co-operation and Development. Recommendation of the Council on Artificial Intelligence; OECD/LEGAL/0449; Organisation for Economic Co-operation and Development: Paris, France, 2019; Amended 2024. [Google Scholar]
- Li, B.; Qi, P.; Liu, B.; Di, S.; Liu, J.; Pei, J.; Yi, J.; Zhou, B. Trustworthy AI: From principles to practices. ACM Comput. Surv. 2023, 55, 1–46. [Google Scholar] [CrossRef] [Scilit]
- Mehrabi, N.; Morstatter, F.; Saxena, N.; Lerman, K.; Galstyan, A. A survey on bias and fairness in machine learning. ACM Comput. Surv. 2021, 54, 1–35. [Google Scholar] [CrossRef] [Scilit]
- Suresh, H.; Guttag, J. A framework for understanding sources of harm throughout the machine learning life cycle. In Proceedings of the 1st ACM Conference on Equity and Access in Algorithms, Mechanisms, and Optimization (EAAMO), New York, NY, USA, 5–9 October 2021; pp. 1–9. [Google Scholar] [CrossRef] [Scilit]
- Puetz, N.C.; Brandt, J.U.; Hilbert, M.; Raponi, E.; Bäck, T.; Bartz-Beielstein, T. Deconstructing deep imbalanced regression: A comprehensive review and experimental evaluation. Artif. Intell. Rev. 2026, 59, 135. [Google Scholar] [CrossRef] [Scilit]
- Wibbeke, J.; Rohjans, S.; Rauh, A. Model-agnostic mitigation strategies of data imbalance for regression. arXiv 2025, arXiv:2506.01486. [Google Scholar] [CrossRef] [Scilit]
- Keramati, M.; Meng, L.; Evans, R.D. ConR: Contrastive regularizer for deep imbalanced regression. In Proceedings of the International Conference on Learning Representations (ICLR), Vienna, Austria, 7–11 May 2024. [Google Scholar]
- Du, Y.; Yan, J.; Chen, Y.; Liu, J.; Zhao, S.; She, Q.; Wu, H.; Wang, H.; Qin, B. Less learn shortcut: Analyzing and mitigating learning of spurious feature-label correlation. arXiv 2023, arXiv:2205.12593. [Google Scholar] [CrossRef] [Scilit]
- Semmelrock, H.; Kopeinik, S.; Theiler, D.; Ross-Hellauer, T.; Kowald, D. Reproducibility in machine learning-driven research. arXiv 2023, arXiv:2307.10320. [Google Scholar] [CrossRef] [Scilit]
- Kapoor, S.; Narayanan, A. Leakage and the reproducibility crisis in machine-learning-based science. Patterns 2023, 4, 100804. [Google Scholar] [CrossRef] [Scilit] [PubMed]
- European Parliament and Council of the European Union. Regulation (EU) 2024/1689 Laying Down Harmonised Rules on Artificial Intelligence (Artificial Intelligence Act); Official Journal of the European Union, L Series; European Parliament and Council of the European Union: Strasbourg, France, 2024. [Google Scholar]
- Office for Artificial Intelligence; Department for Digital, Culture, Media and Sport; Department for Business, Energy and Industrial Strategy. National AI Strategy; Technical Report Command Paper CP 525; HM Government: London, UK, 2021.
- Department for Science, Innovation and Technology. A Pro-Innovation Approach to AI Regulation; Technical Report Command Paper CP 815; HM Government: London, UK, 2023.
- Advanced Research and Invention Agency (ARIA). Safeguarded AI: Constructing Guaranteed Safety. Programme Thesis, ARIA, London, UK, 2024. Available online: https://www.aria.org.uk/ (accessed on 14 July 2026).
- Ministry of Electronics and Information Technology (MeitY). India AI Governance Guidelines; Government of India: New Delhi, India, 2025.
- NITI Aayog. Responsible AI for All: Approach Document for India; Government of India: New Delhi, India, 2021.
- ISO/IEC TR 24028:2020; Information Technology—Artificial Intelligence—Overview of Trustworthiness in Artificial Intelligence. ISO: Geneva, Switzerland, 2020.
- ISO/IEC 42001:2023; Information Technology—Artificial Intelligence—Management System. ISO: Geneva, Switzerland, 2023.
- IEEE. Ethically Aligned Design: A Vision for Prioritizing Human Well-Being with Autonomous and Intelligent Systems, 1st ed.; IEEE: Piscataway, NJ, USA, 2019. [Google Scholar]
- Breiman, L. Random Forests. Mach. Learn. 2001, 45, 5–32. [Google Scholar] [CrossRef] [Scilit]
- Byrne, G.; Dornfeld, D.; Inasaki, I.; Ketteler, G.; König, W.; Teti, R. Tool Condition Monitoring (TCM)—The Status of Research and Industrial Application. CIRP Ann. 1995, 44, 541–567. [Google Scholar] [CrossRef] [Scilit]
- Byrne, G.; Dornfeld, D.; Denkena, B. Advancing Cutting Technology. CIRP Ann. 2003, 52, 483–507. [Google Scholar] [CrossRef] [Scilit]
- Teti, R.; Jemielniak, K.; O’Donnell, G.; Dornfeld, D. Advanced Monitoring of Machining Operations. CIRP Ann. 2010, 59, 717–739. [Google Scholar] [CrossRef] [Scilit]
- Zhu, K.; Wong, Y.S.; Hong, G.S. Wavelet Analysis of Sensor Signals for Tool Condition Monitoring: A Review and Some New Results. Int. J. Mach. Tools Manuf. 2009, 49, 537–553. [Google Scholar] [CrossRef] [Scilit]
- Zhou, Y.; Xue, W. Review of Tool Condition Monitoring Methods in Milling Processes. Int. J. Adv. Manuf. Technol. 2018, 96, 2509–2532. [Google Scholar] [CrossRef] [Scilit]
- De Pauw, L.; Jacobs, T.; Goedemé, T. Replication Data for: MATWI: A Multimodal Automatic Tool Wear Inspection Dataset, 2025. KU Leuven RDR, 2025, Version 1.0 [Dataset]. Available online: https://rdr.kuleuven.be/dataset.xhtml?persistentId=doi:10.48804/GK6LHH (accessed on 24 September 2026). [PubMed]
- Goodfellow, I.; Bengio, Y.; Courville, A. Deep Learning; MIT Press: Cambridge, MA, USA, 2016. [Google Scholar]
- Barocas, S.; Hardt, M.; Narayanan, A. Fairness and Machine Learning: Limitations and Opportunities; MIT Press: Cambridge, MA, USA, 2023. [Google Scholar]
- Torgo, L.; Ribeiro, R.P.; Pfahringer, B.; Branco, P. SMOTE for Regression. In Proceedings of the Progress in Artificial Intelligence (EPIA 2013); Lecture Notes in Computer Science; Springer: Cham, Switzerland, 2013; Volume 8154, pp. 378–389. [Google Scholar] [CrossRef] [Scilit]
- Chawla, N.V.; Bowyer, K.W.; Hall, L.O.; Kegelmeyer, W.P. SMOTE: Synthetic Minority Over-sampling Technique. J. Artif. Intell. Res. 2002, 16, 321–357. [Google Scholar] [CrossRef] [Scilit]
- Branco, P.; Torgo, L.; Ribeiro, R.P. SMOGN: A Pre-processing Approach for Imbalanced Regression. In Proceedings of the First International Workshop on Learning with Imbalanced Domains: Theory and Applications; Proceedings of Machine Learning Research; PMLR: Cambridge, MA, USA, 2017; Volume 74, pp. 36–50. [Google Scholar]
- Branco, P.; Torgo, L.; Ribeiro, R.P. Pre-processing approaches for imbalanced distributions in regression. Neurocomputing 2019, 343, 76–99. [Google Scholar] [CrossRef] [Scilit]
- Ribeiro, R.P.; Moniz, N. Imbalanced regression and extreme value prediction. Mach. Learn. 2020, 109, 1803–1835. [Google Scholar] [CrossRef] [Scilit]
- Romano, Y.; Patterson, E.; Candès, E.J. Conformalized Quantile Regression. In Proceedings of the Advances in Neural Information Processing Systems (NeurIPS), Vancouver, BC, Canada, 8–14 December 2019; Volume 32, pp. 3543–3553. [Google Scholar]
- Wu, W.; Kunz, N.; Branco, P. ImbalancedLearningRegression—A Python Package to Tackle the Imbalanced Regression Problem. In Proceedings of the Machine Learning and Knowledge Discovery in Databases (ECML PKDD); Demonstration Track.; Springer: Cham, Switzerland, 2022; pp. 645–648. [Google Scholar] [CrossRef] [Scilit]
- Chen, T.; Guestrin, C. XGBoost: A Scalable Tree Boosting System. In Proceedings of the 22nd ACM SIGKDD International Conference on Knowledge Discovery and Data Mining (KDD); ACM: New York, NY, USA, 2016; pp. 785–794. [Google Scholar] [CrossRef] [Scilit]
- Taquet, V.; Blot, V.; Morzadec, T.; Lacombe, L.; Brunel, N. MAPIE: An Open-Source Library for Distribution-Free Uncertainty Quantification. arXiv 2022, arXiv:2207.12274. [Google Scholar]
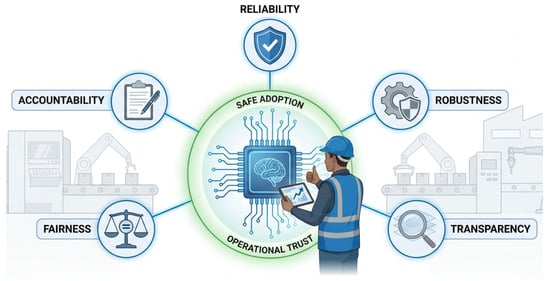
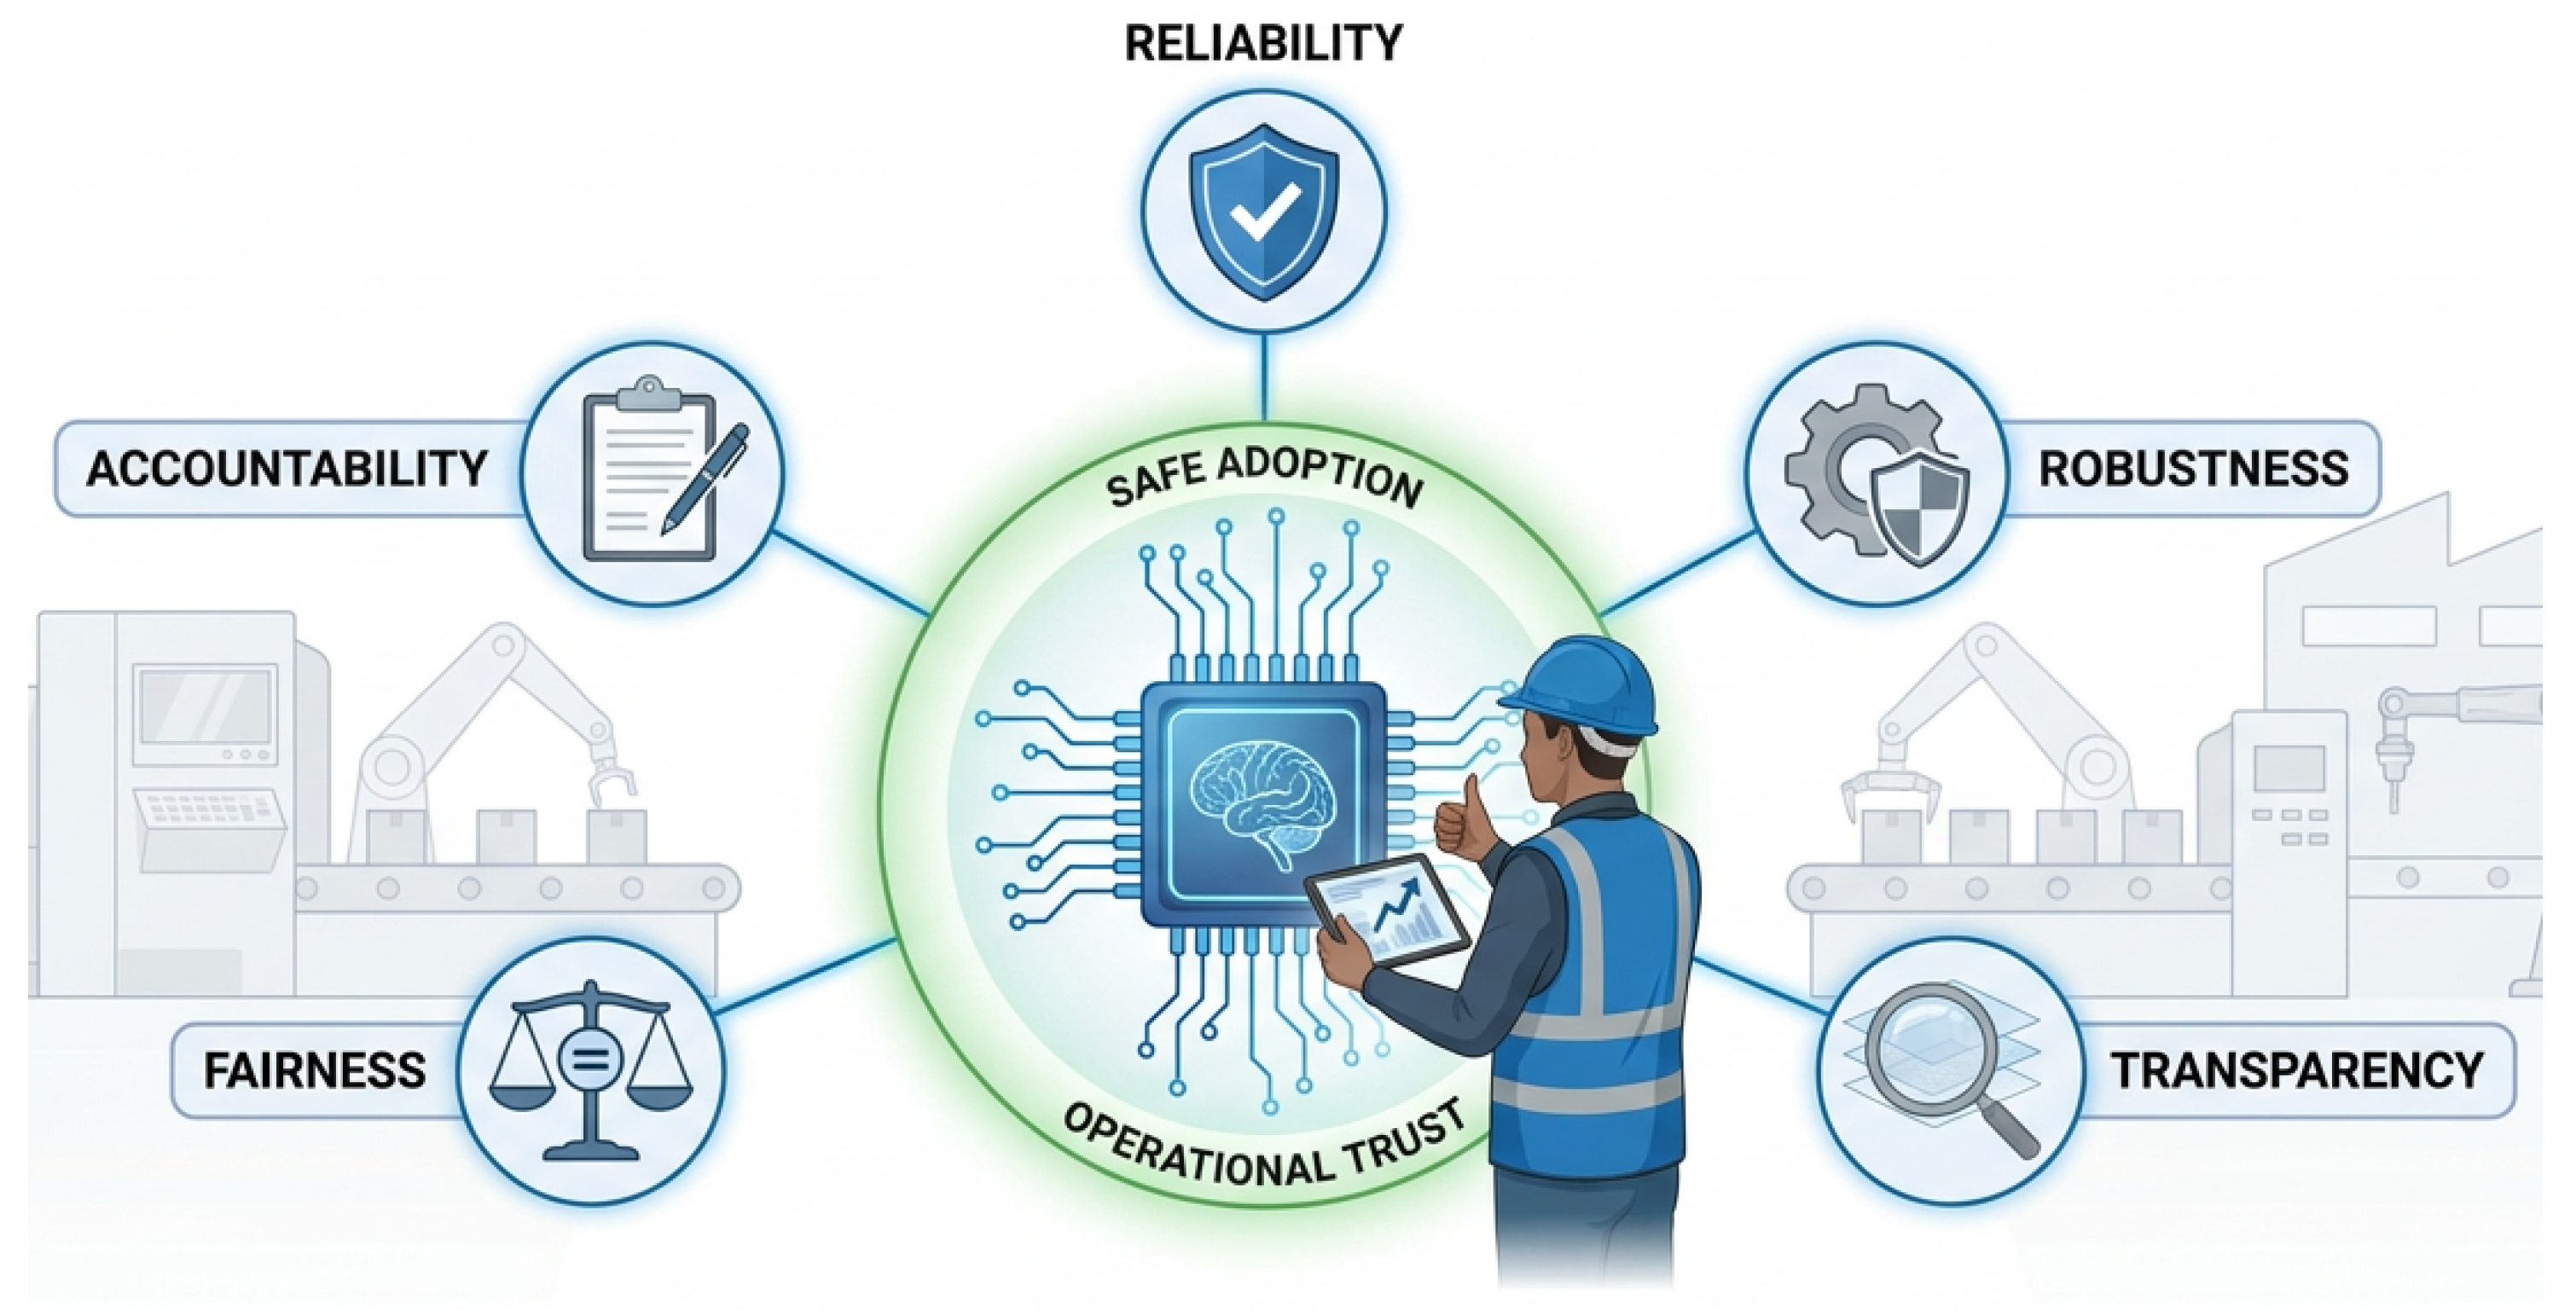
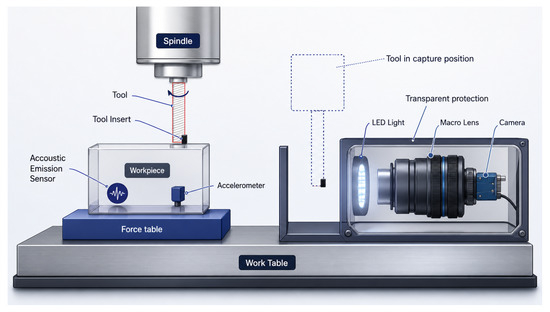
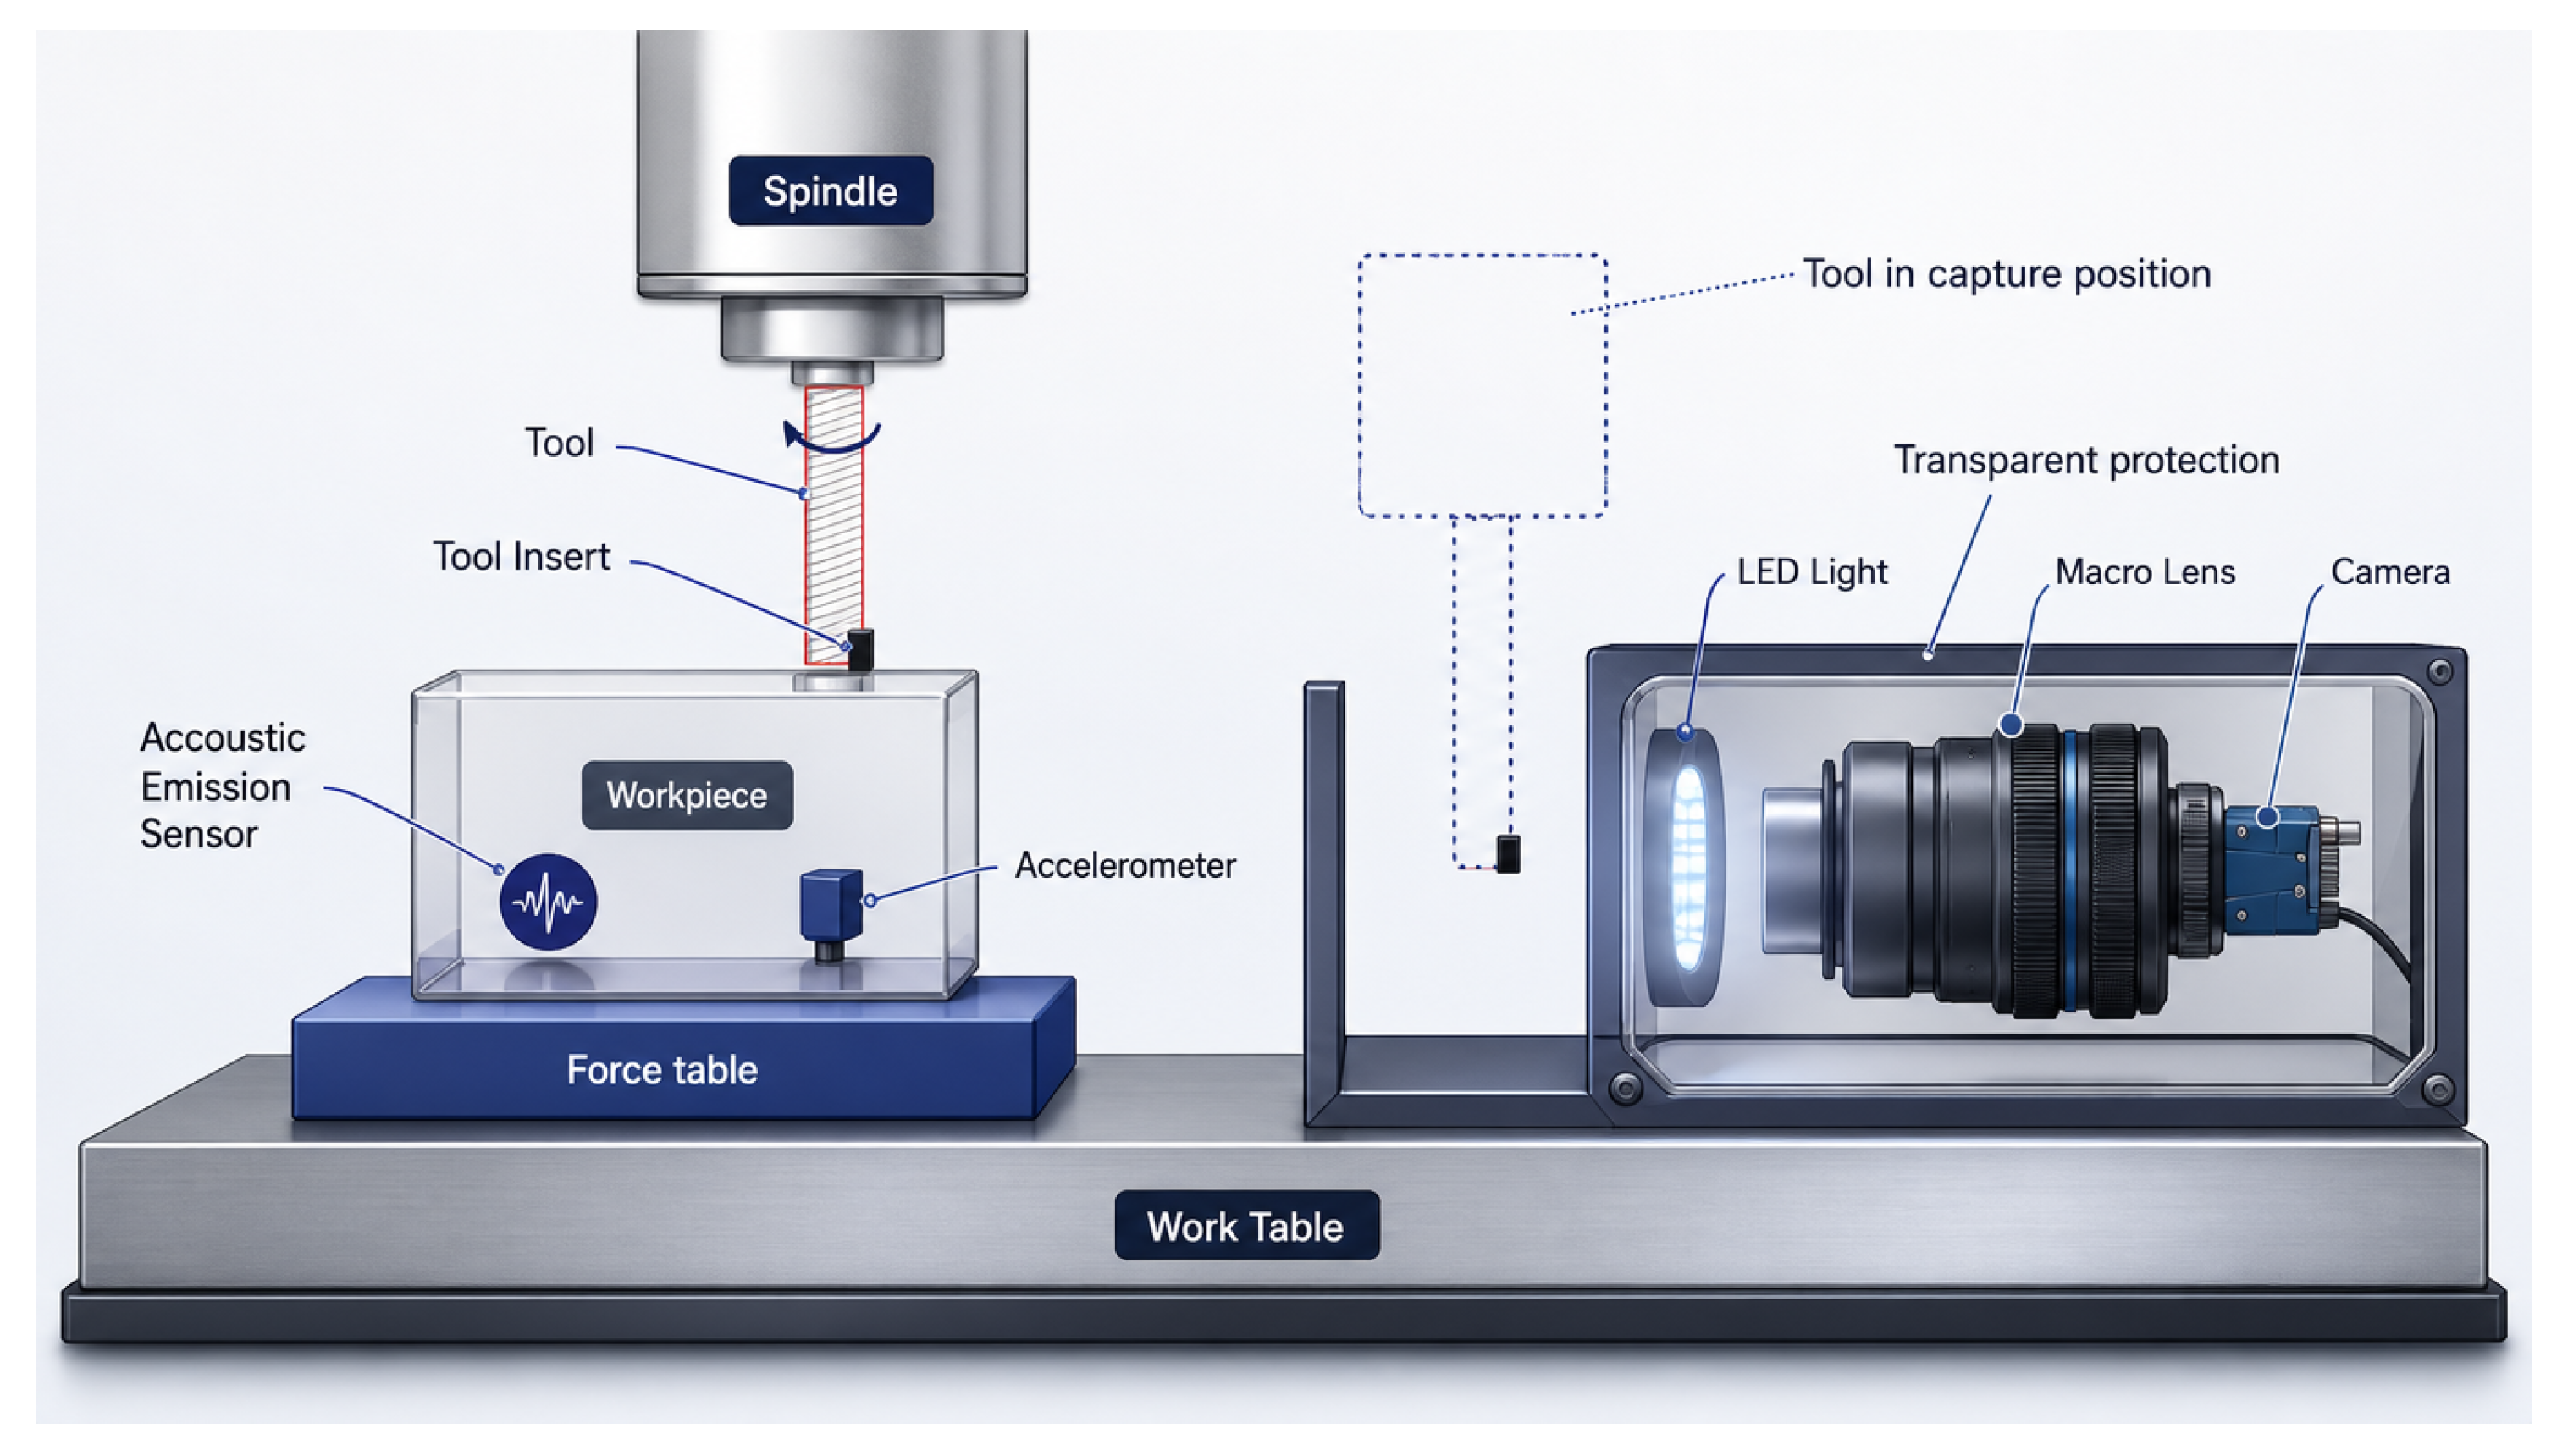
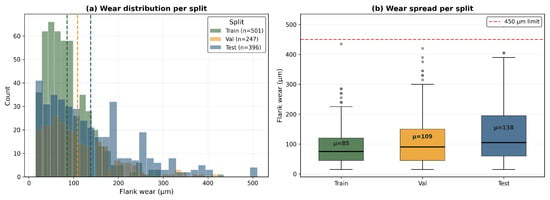
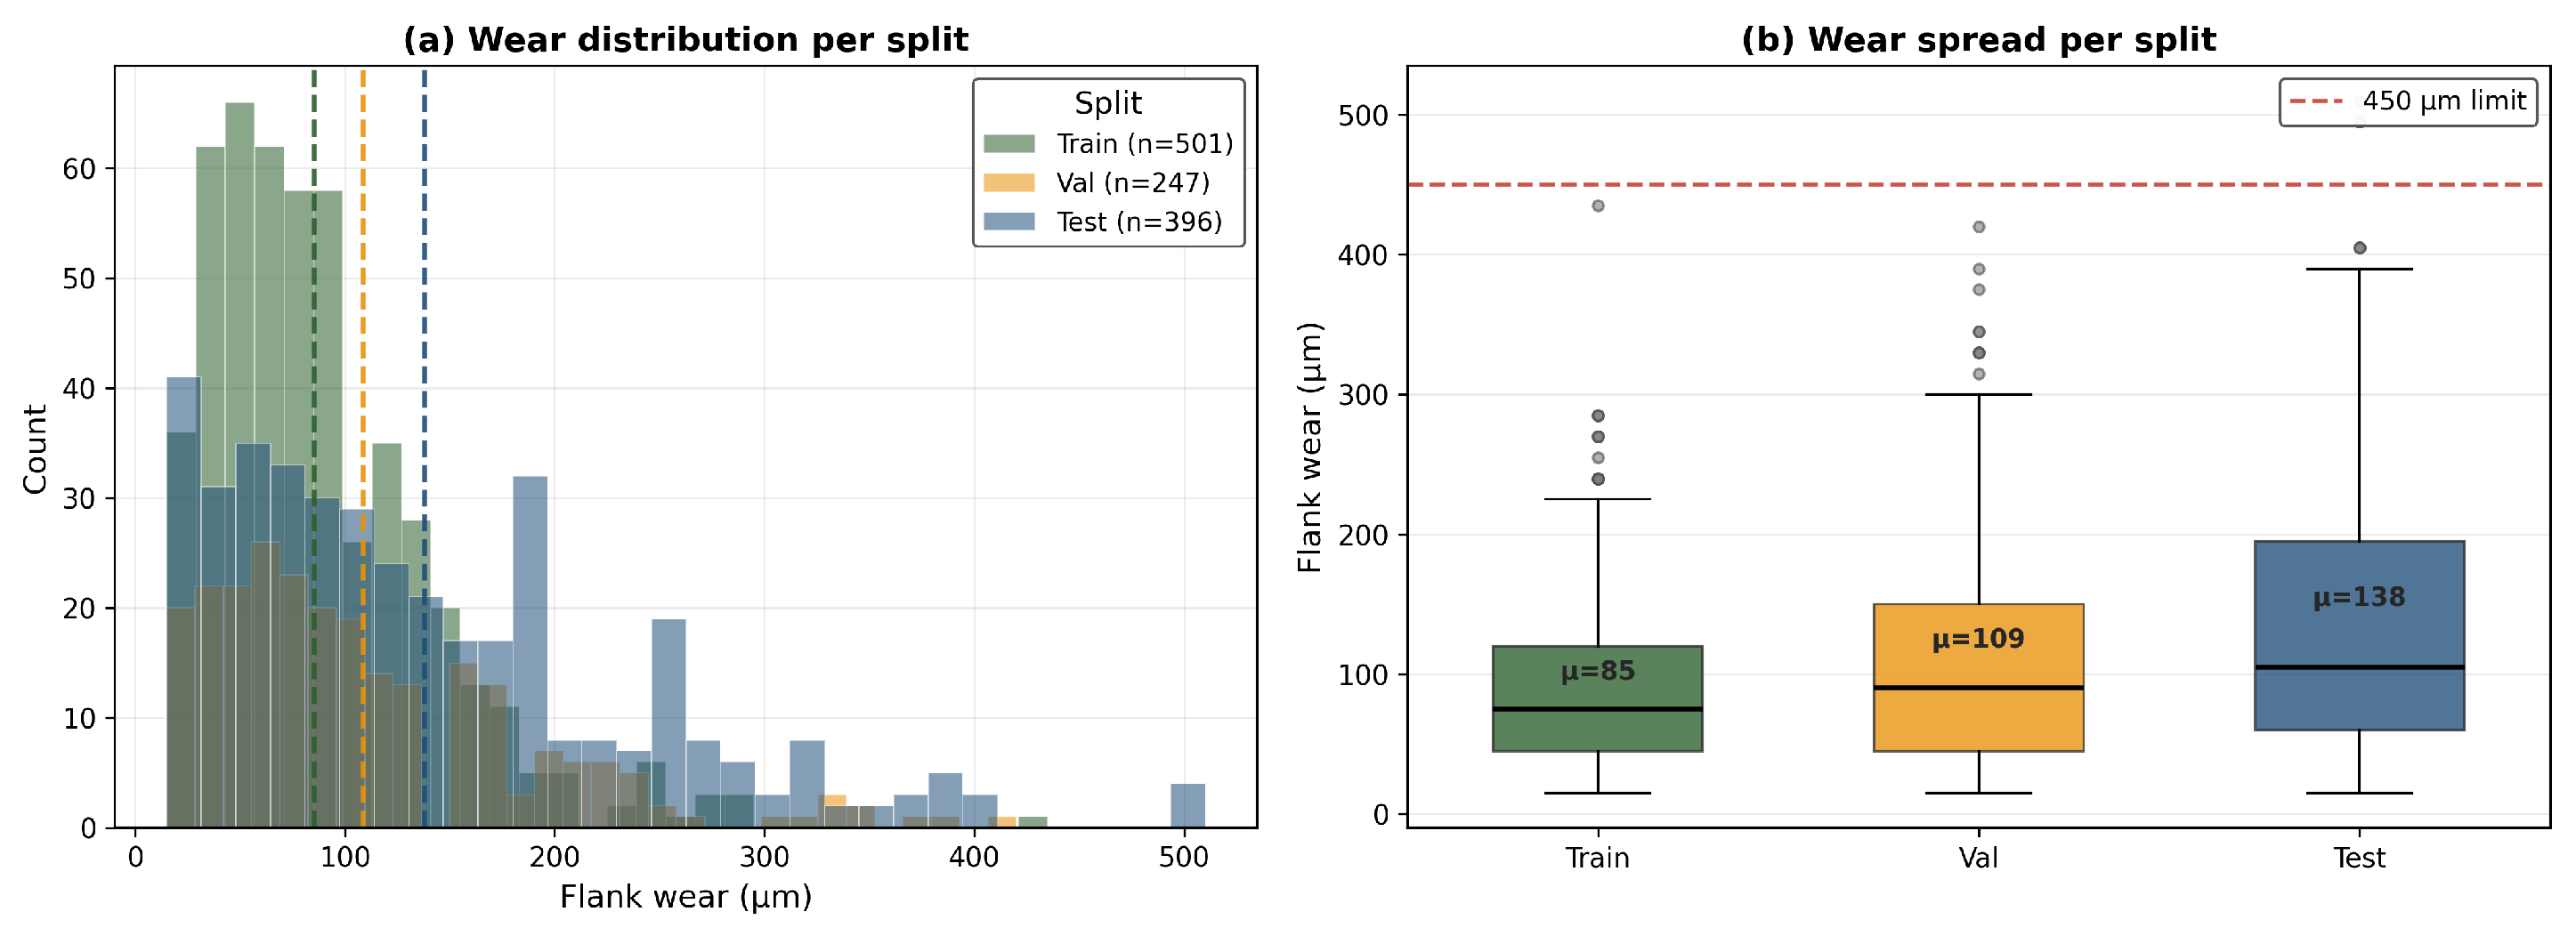
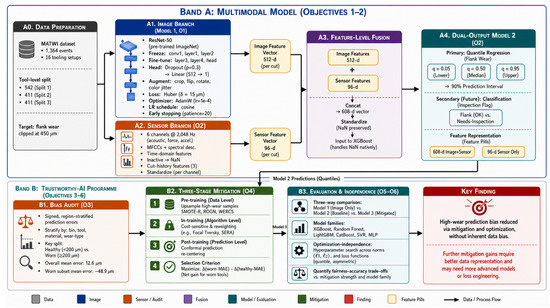
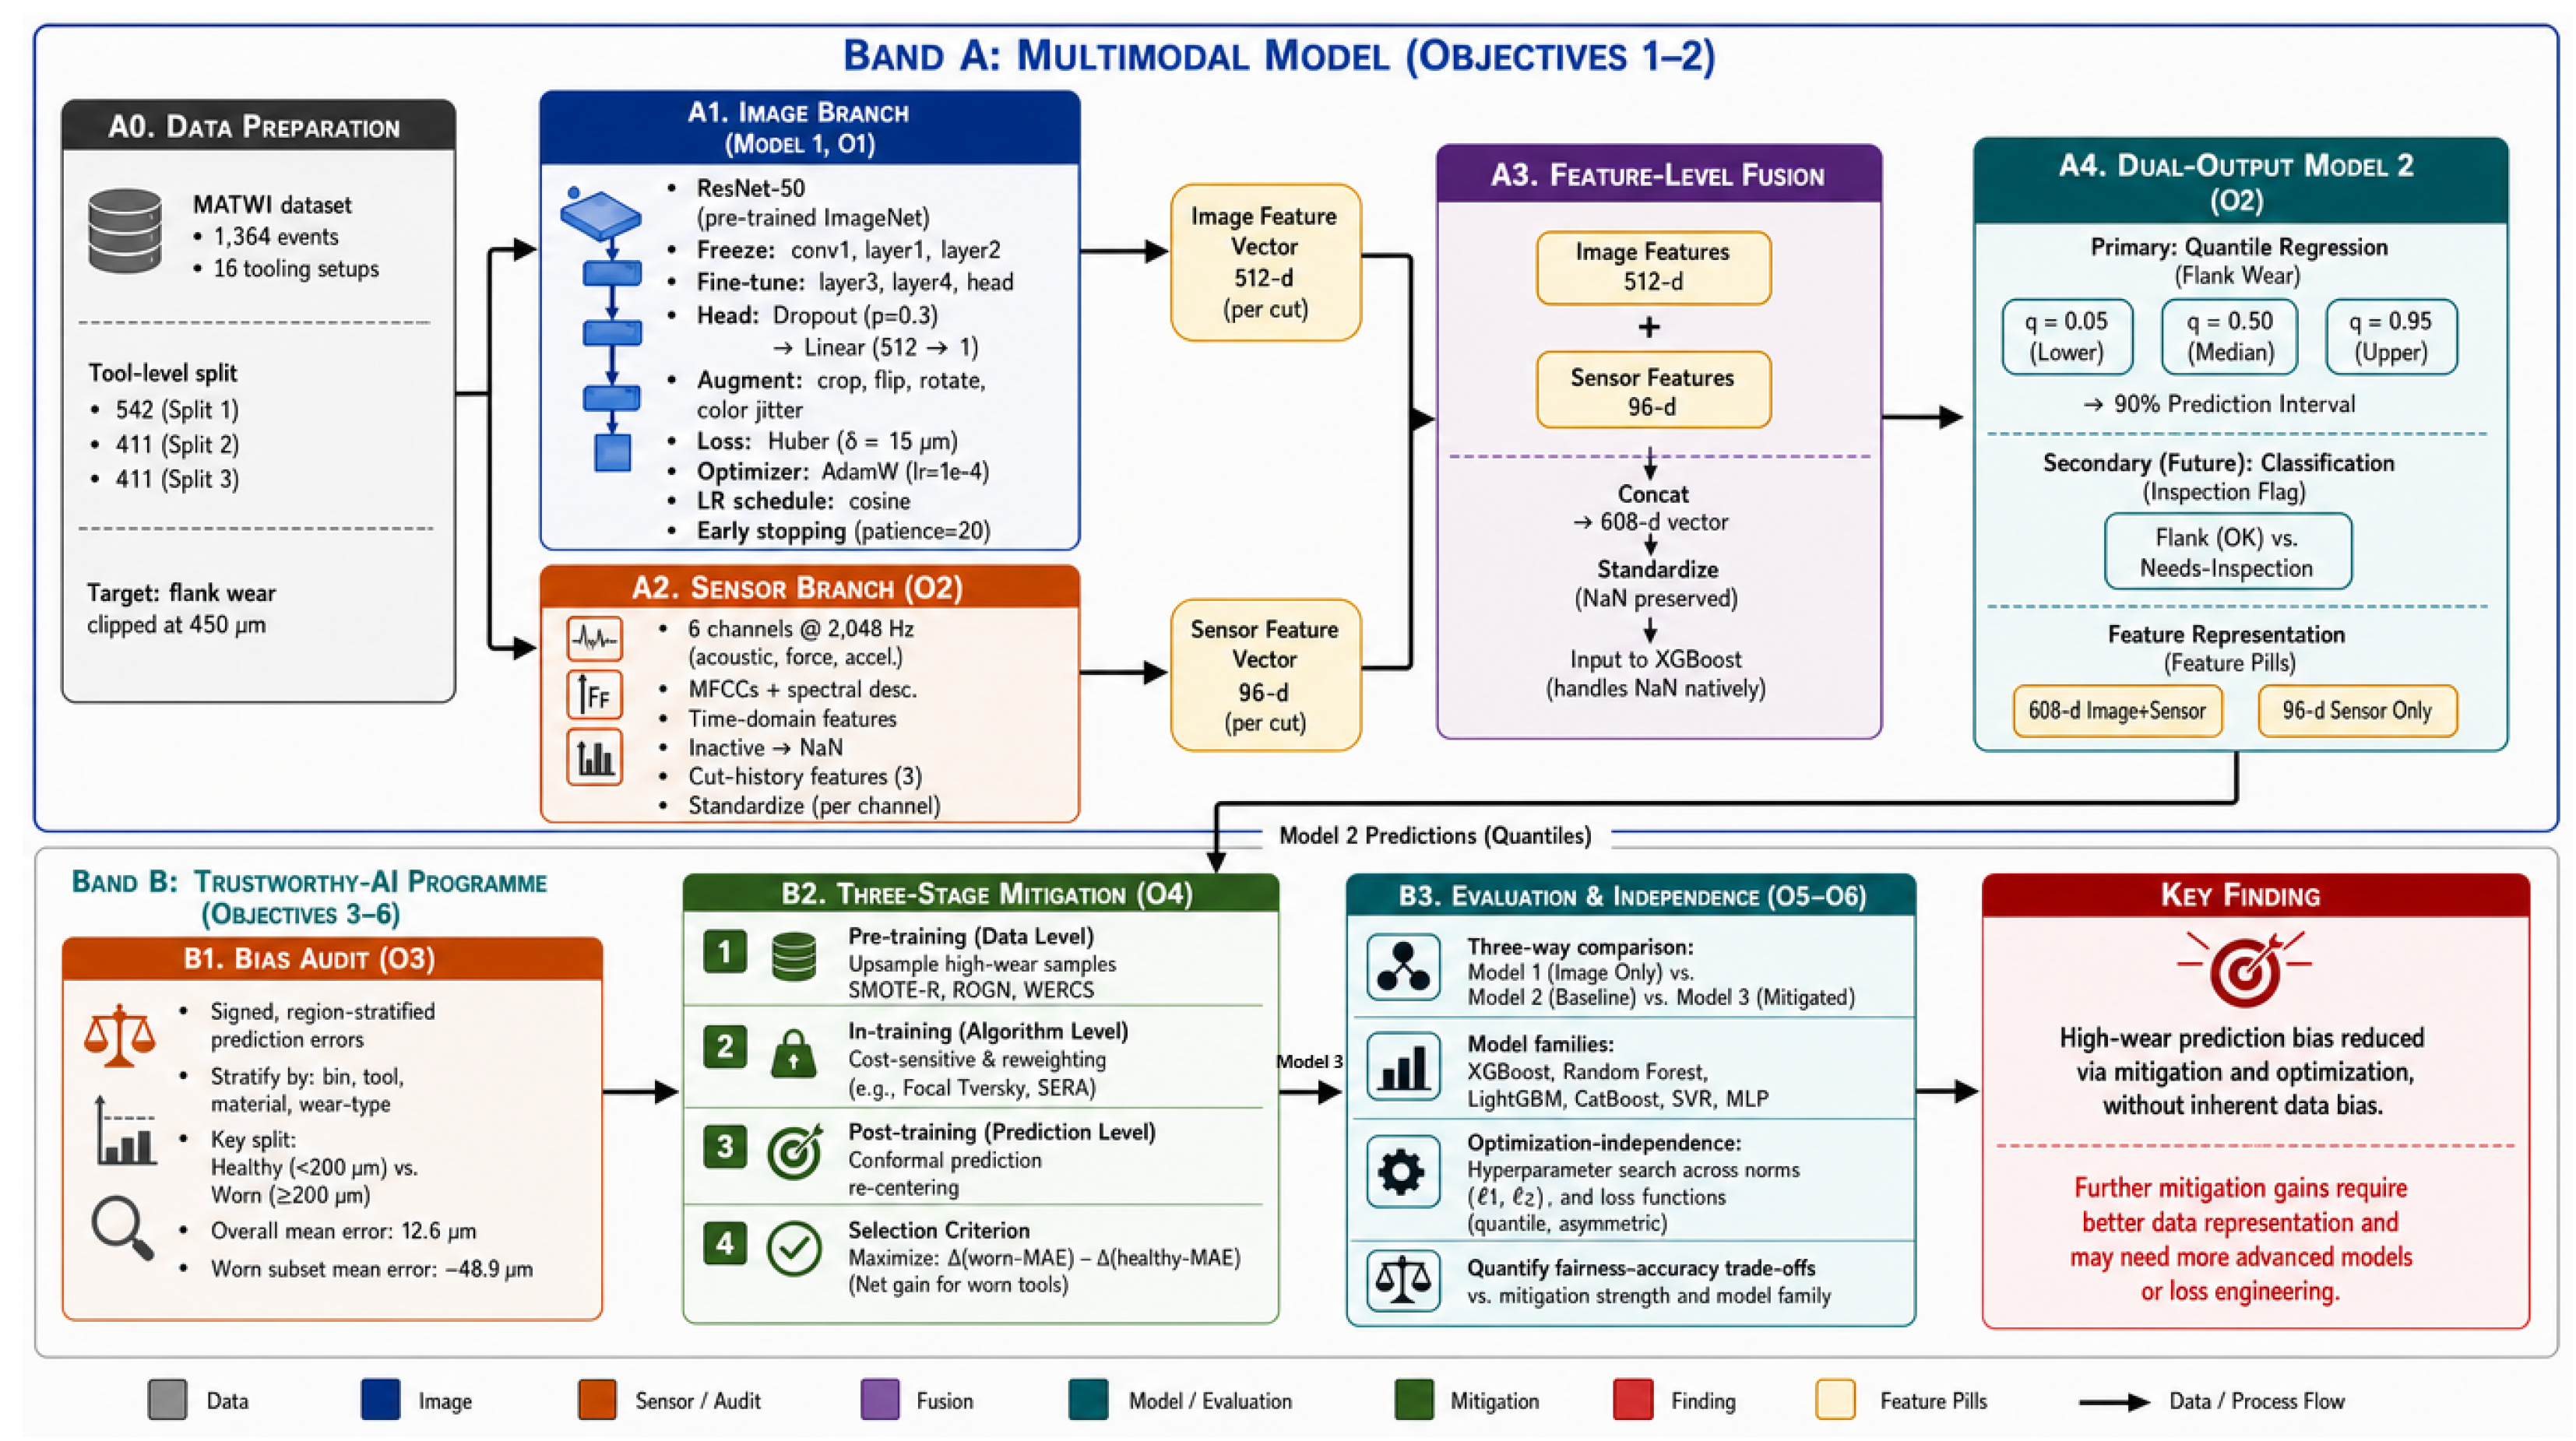
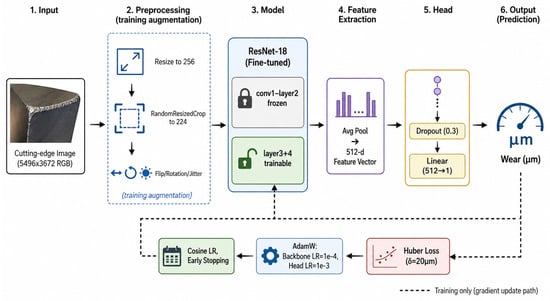
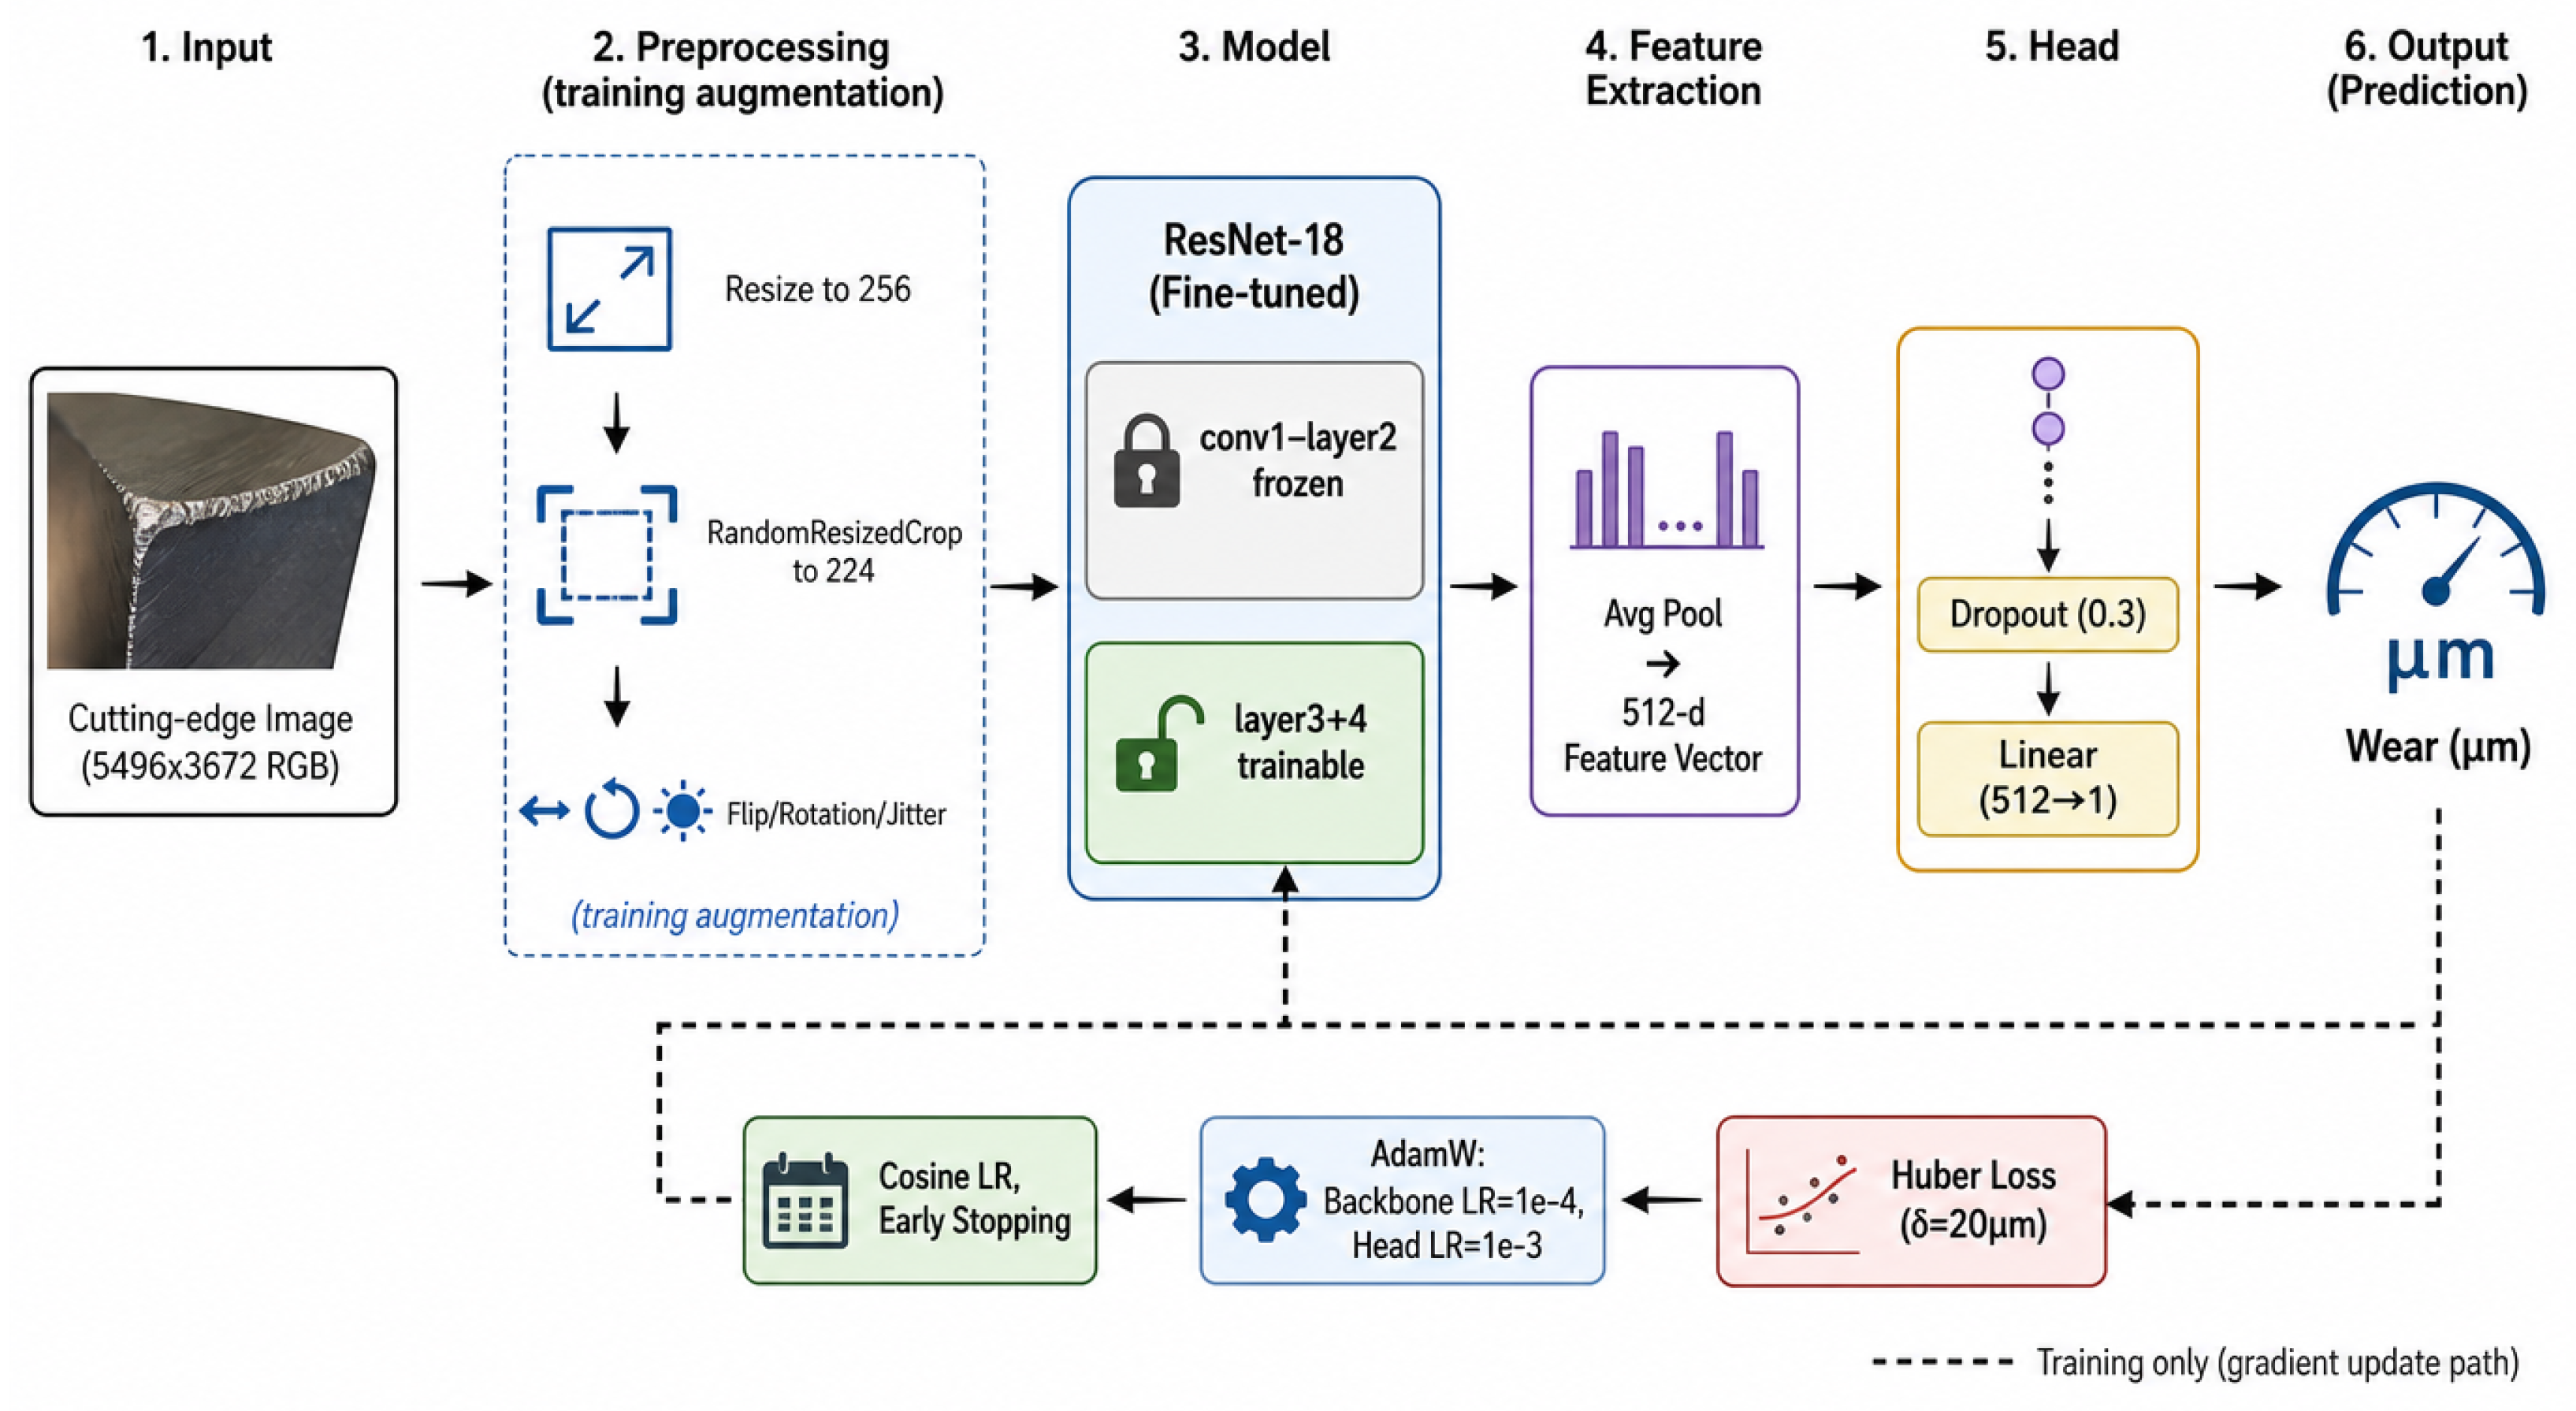
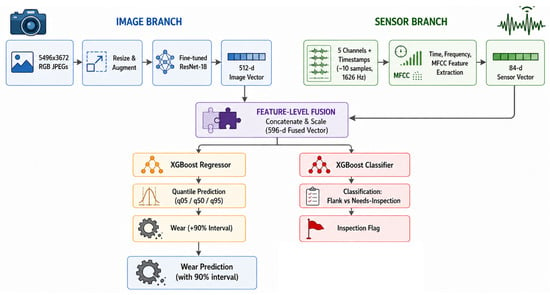
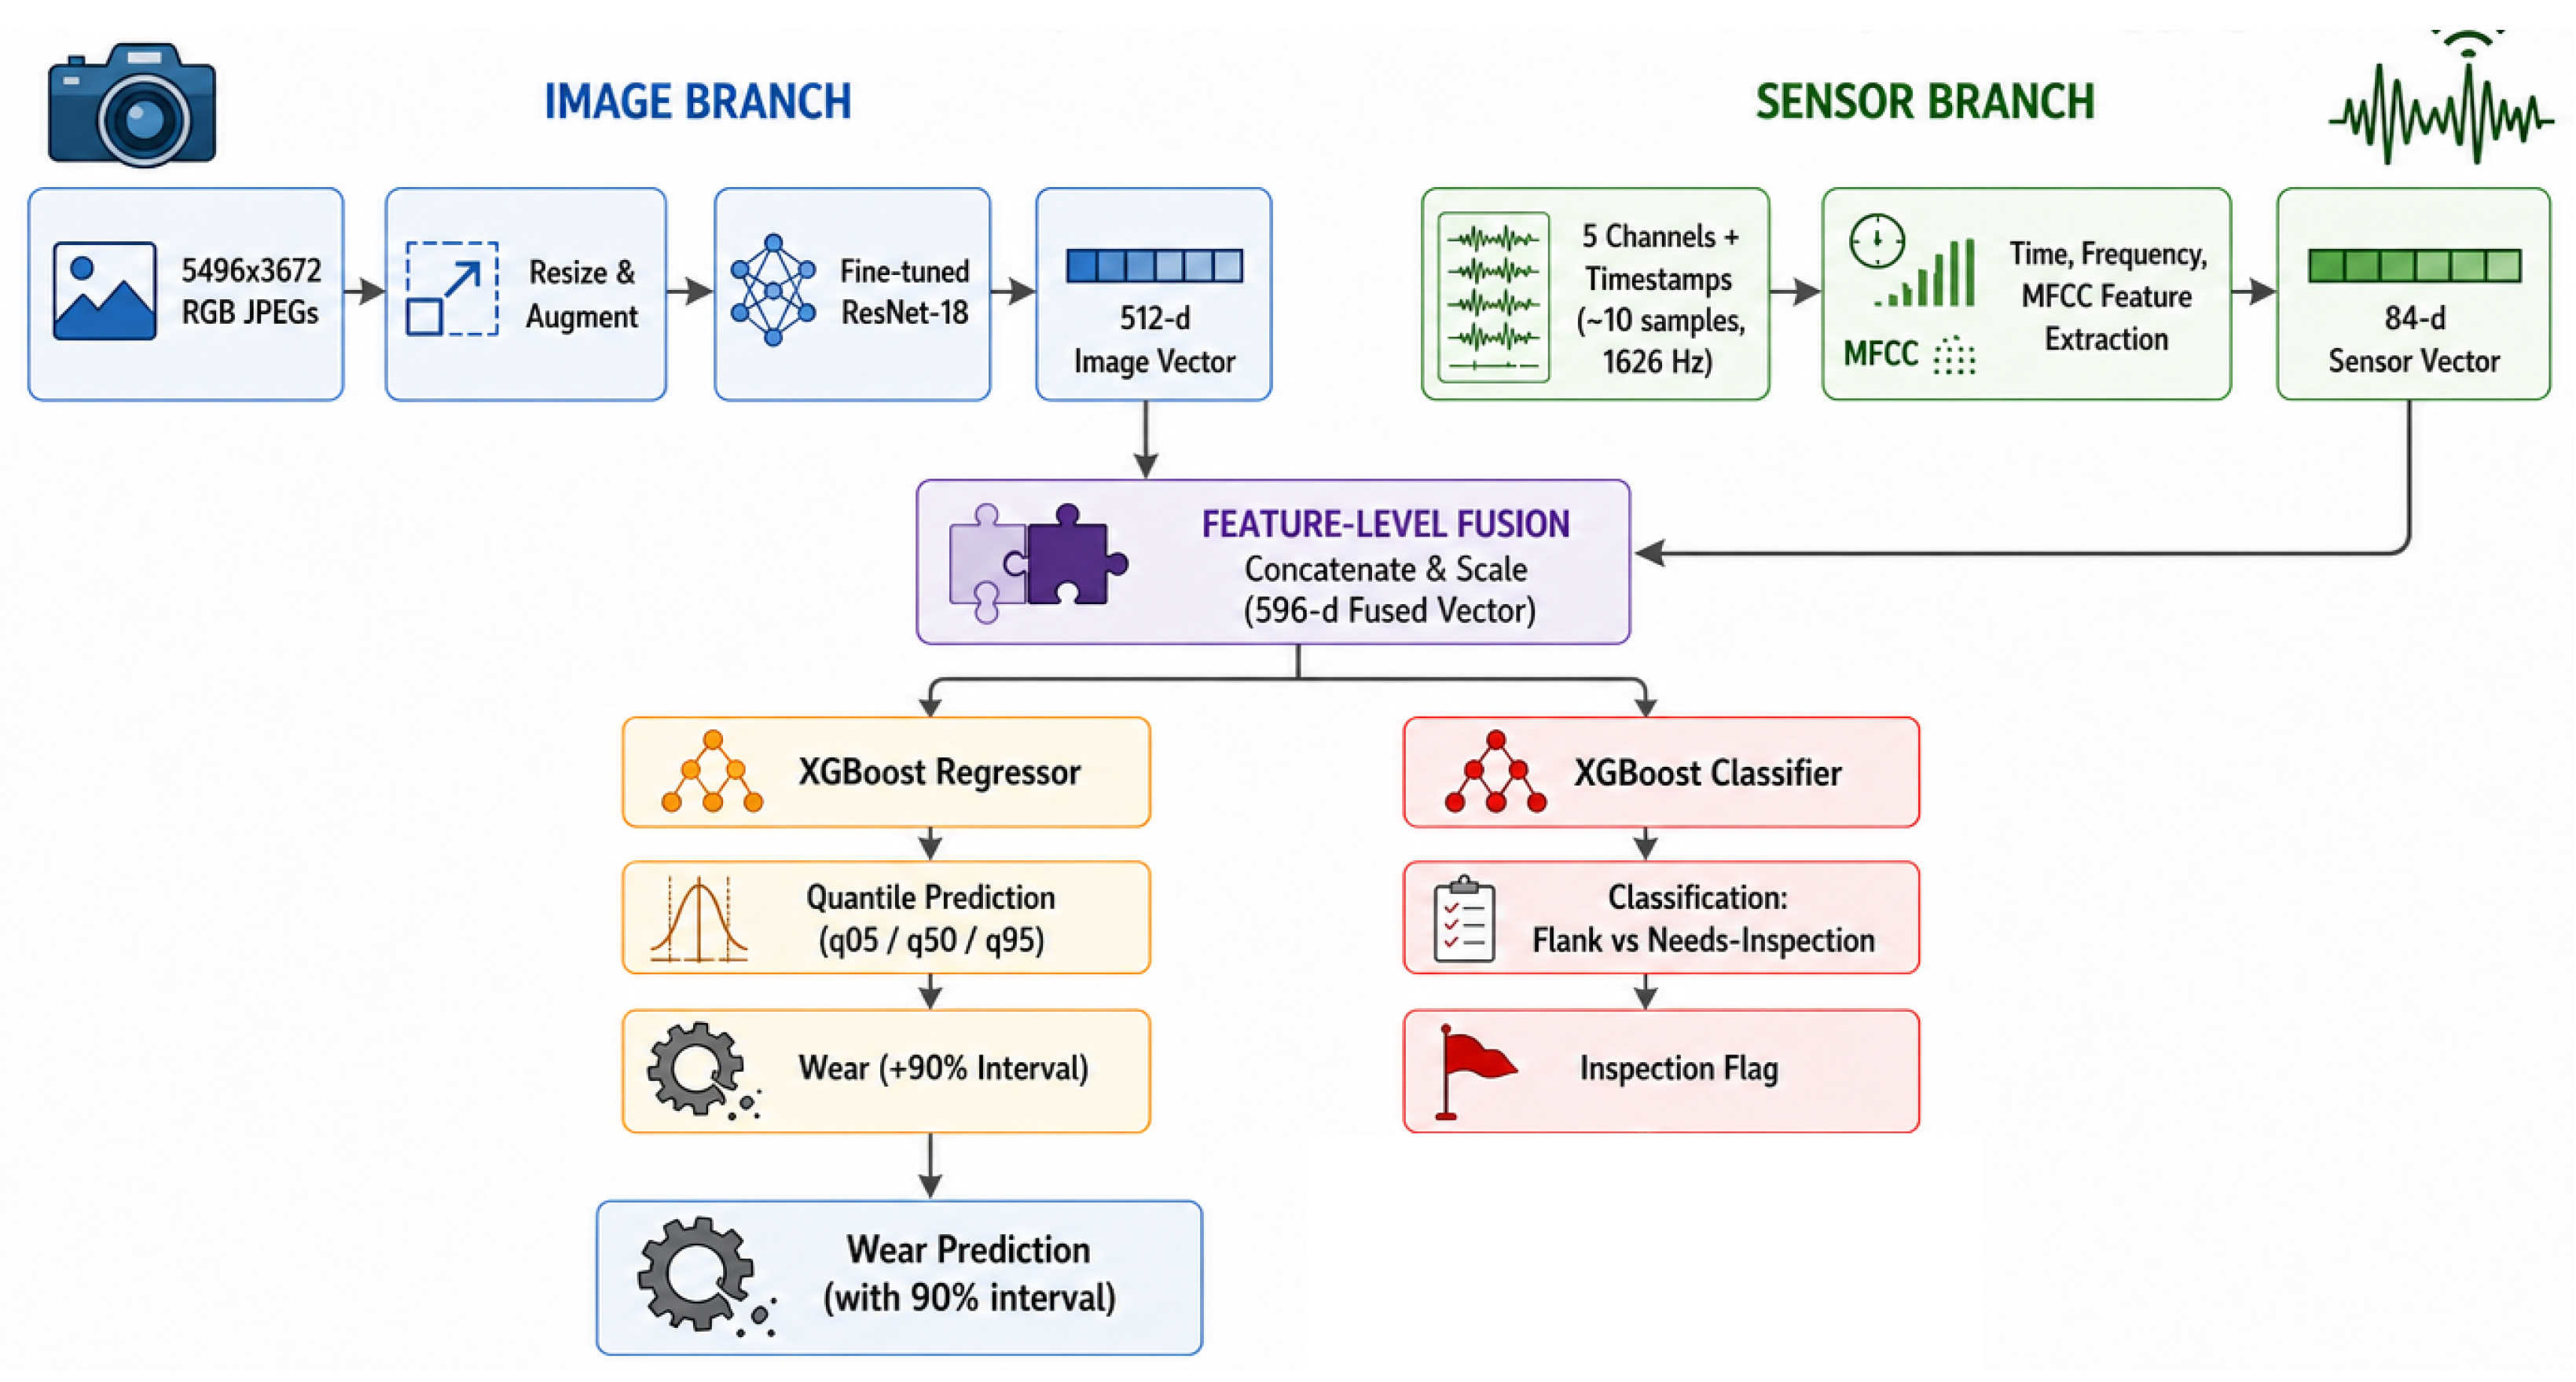
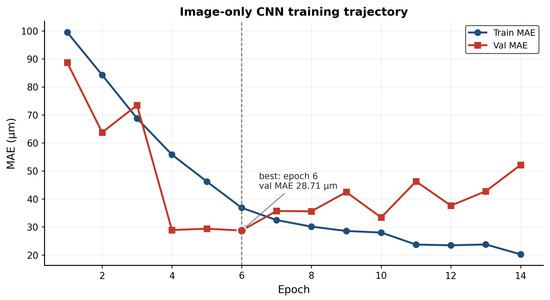
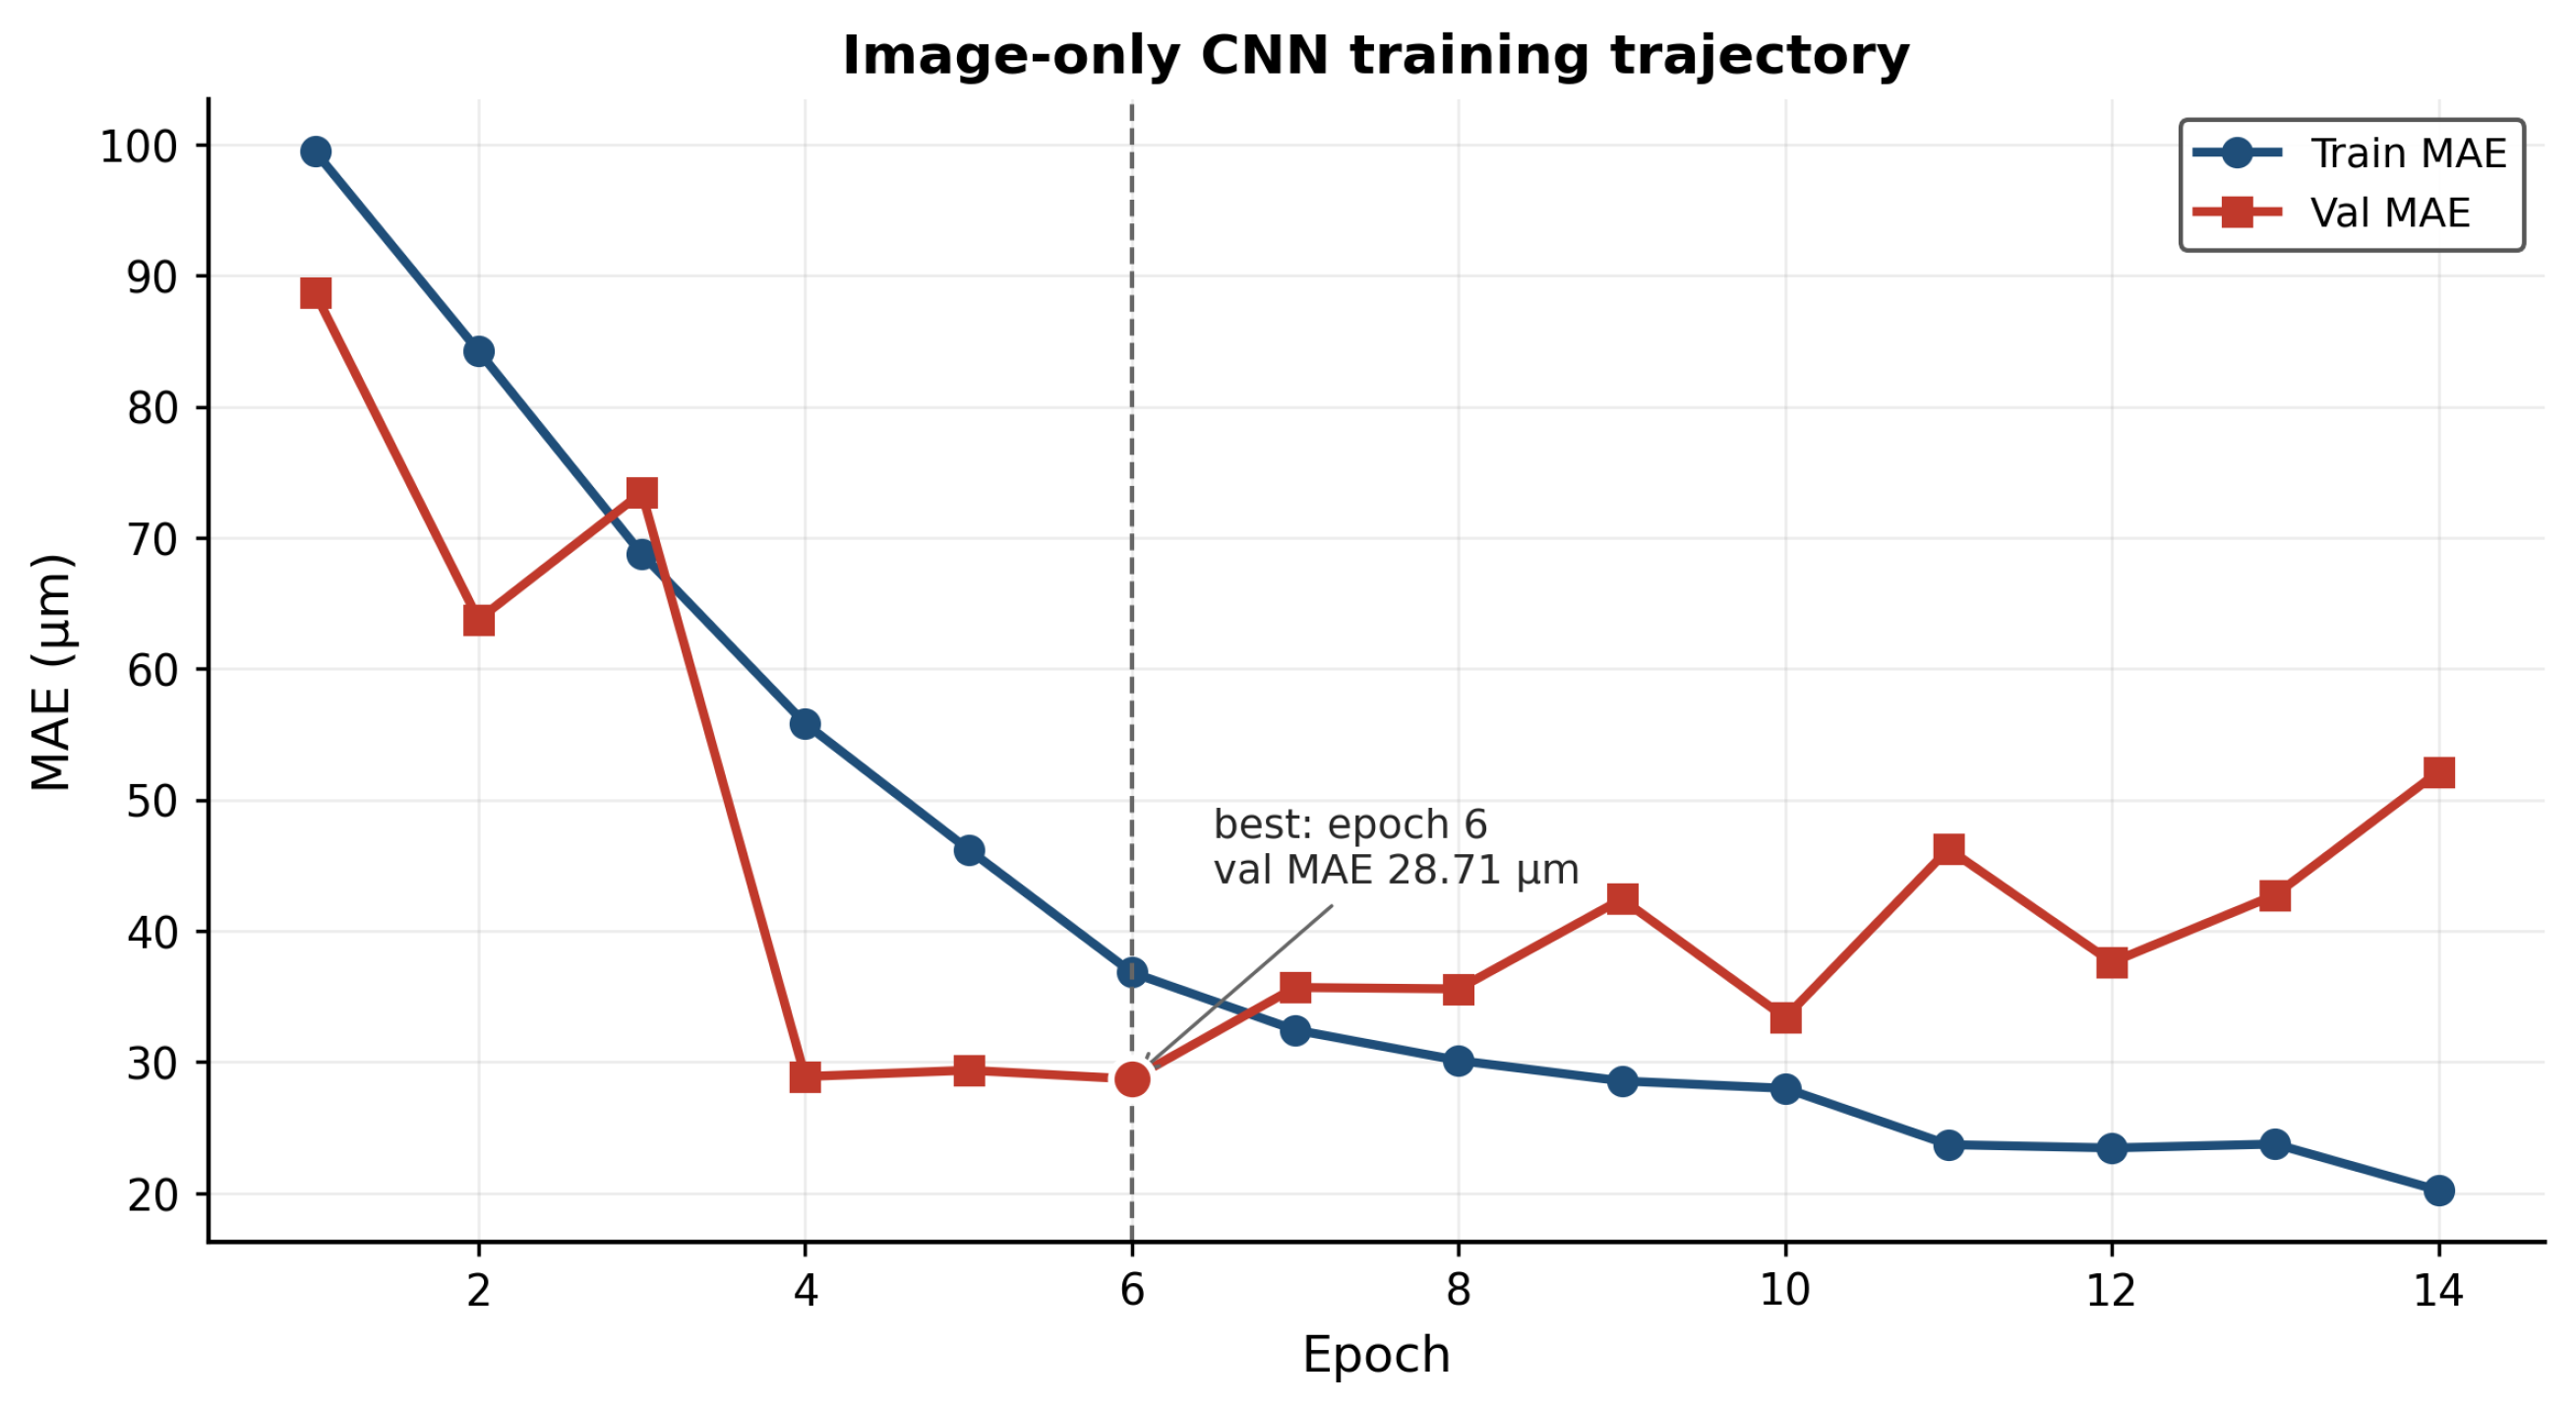
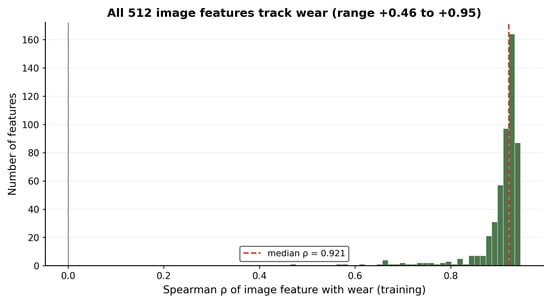
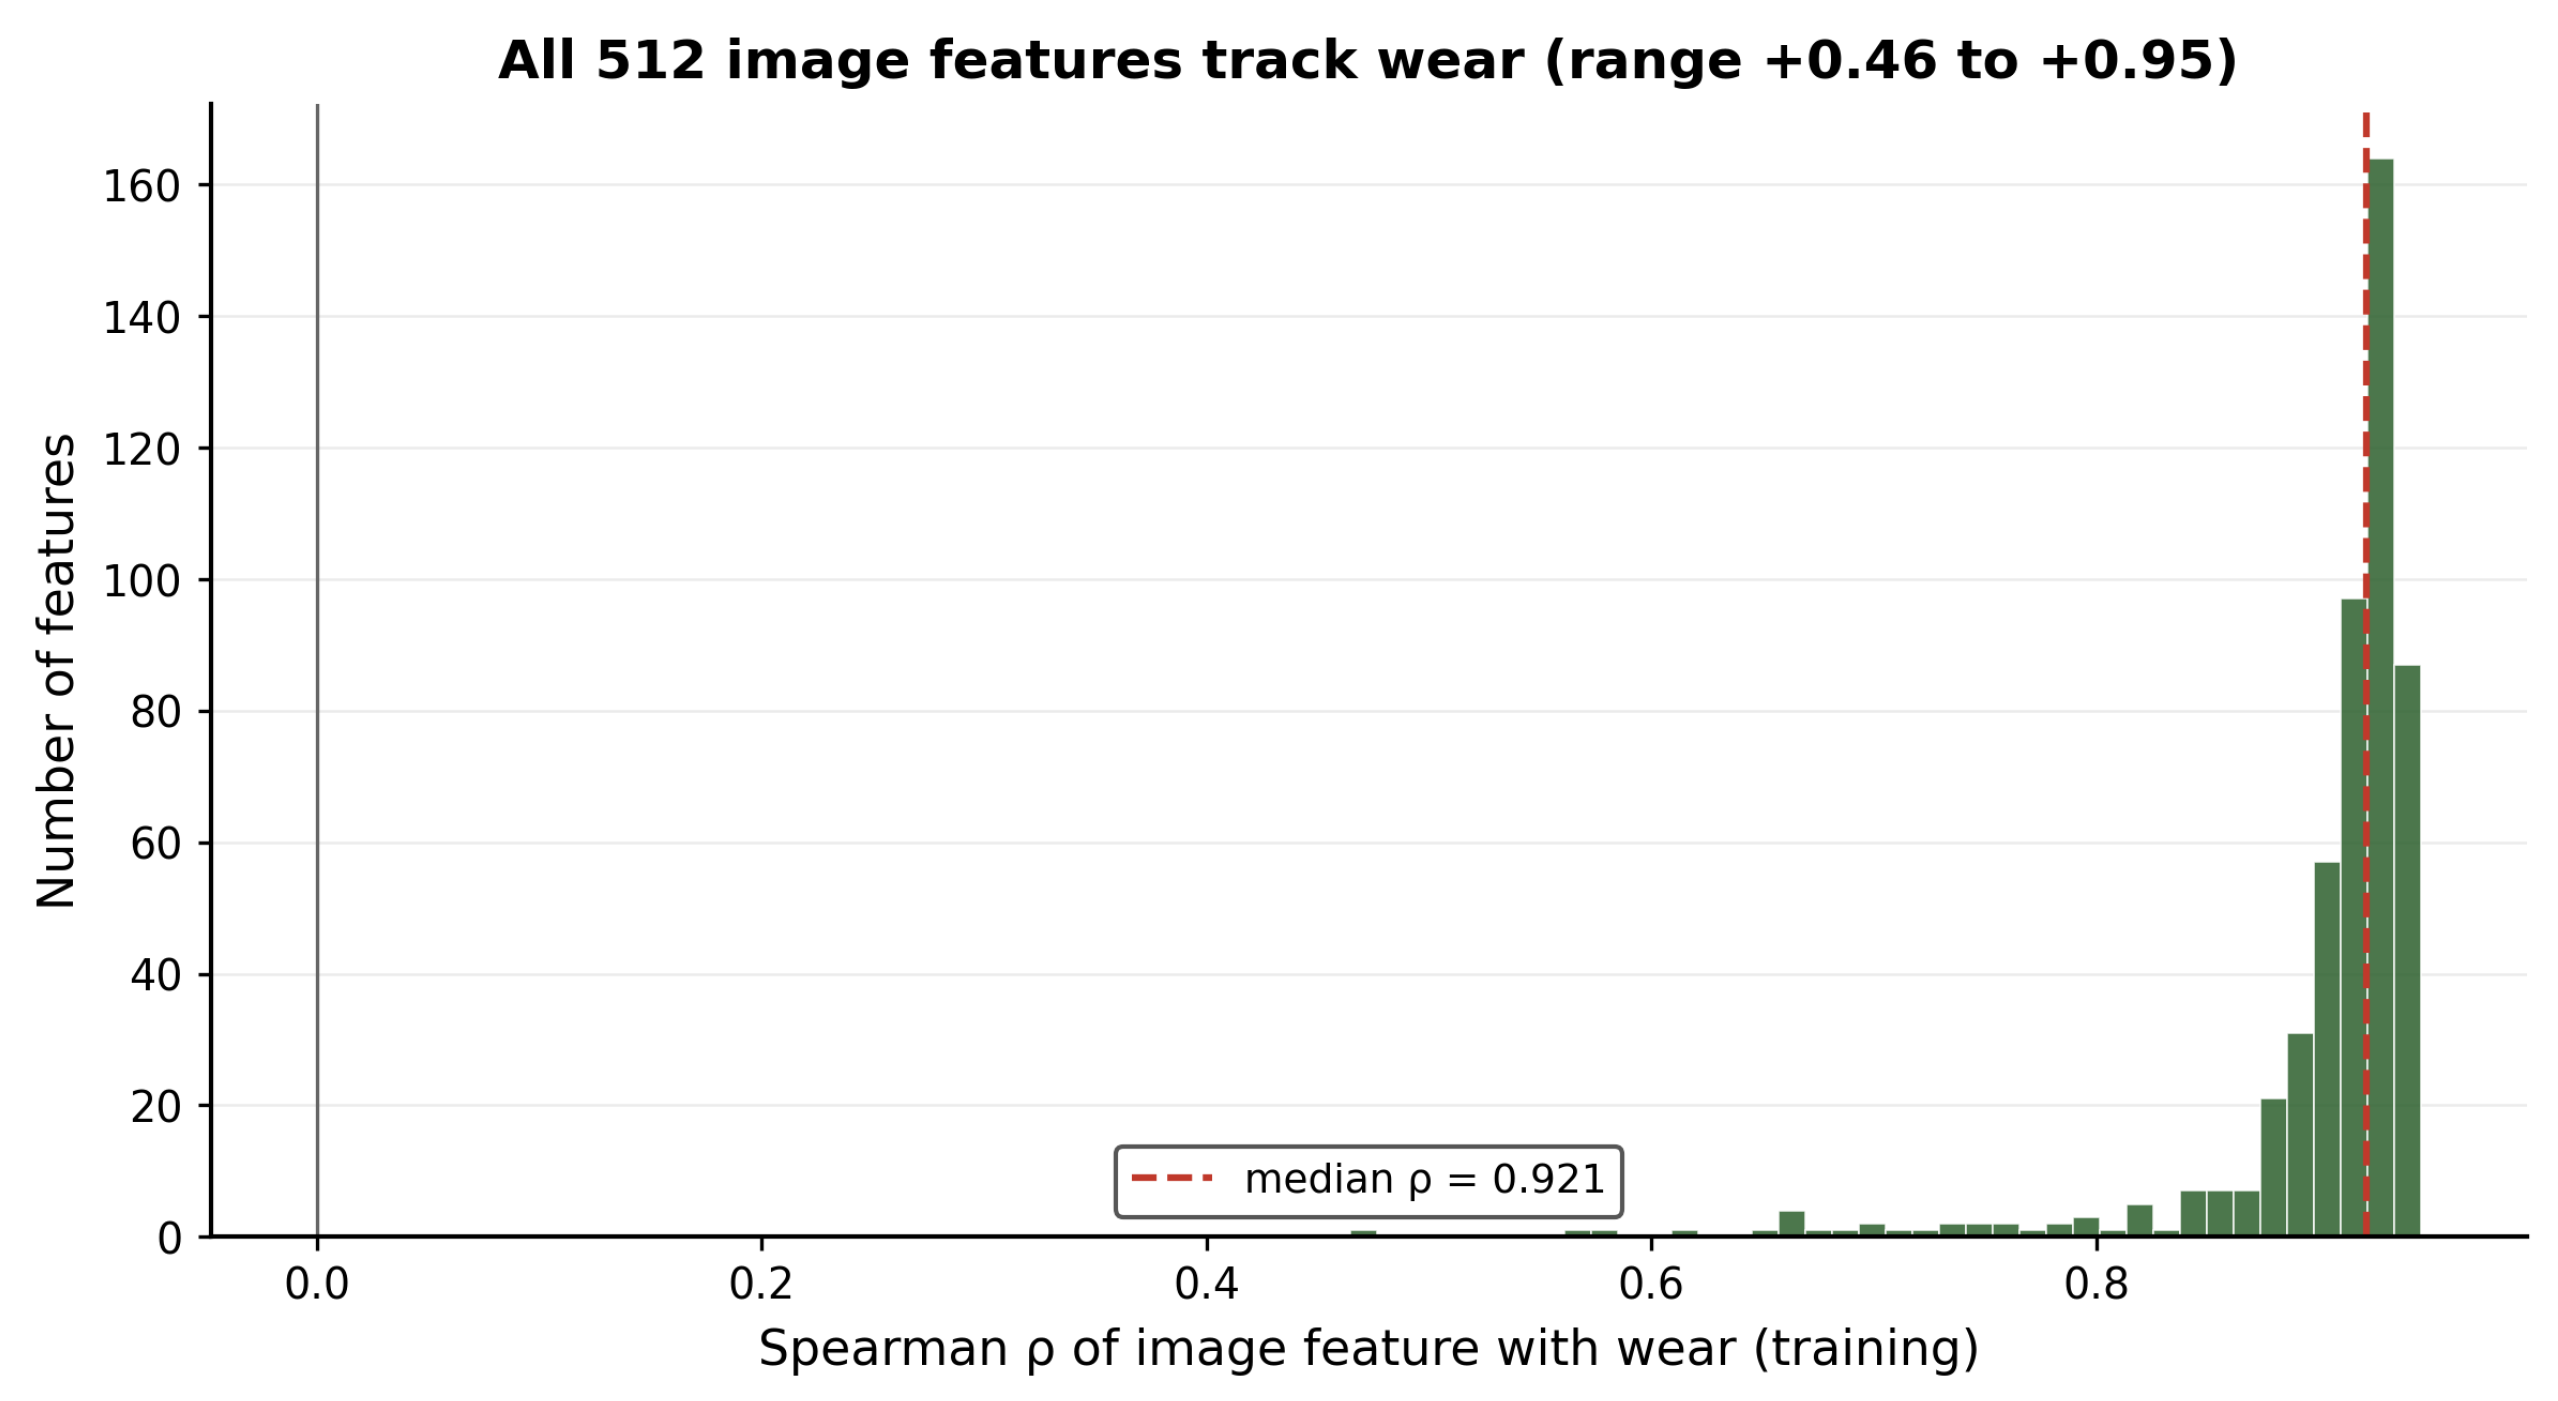
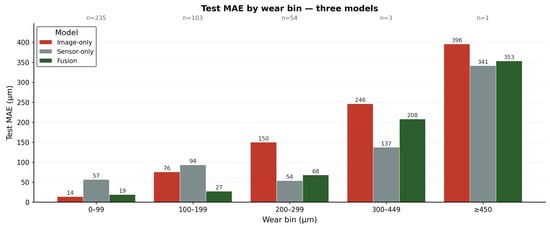
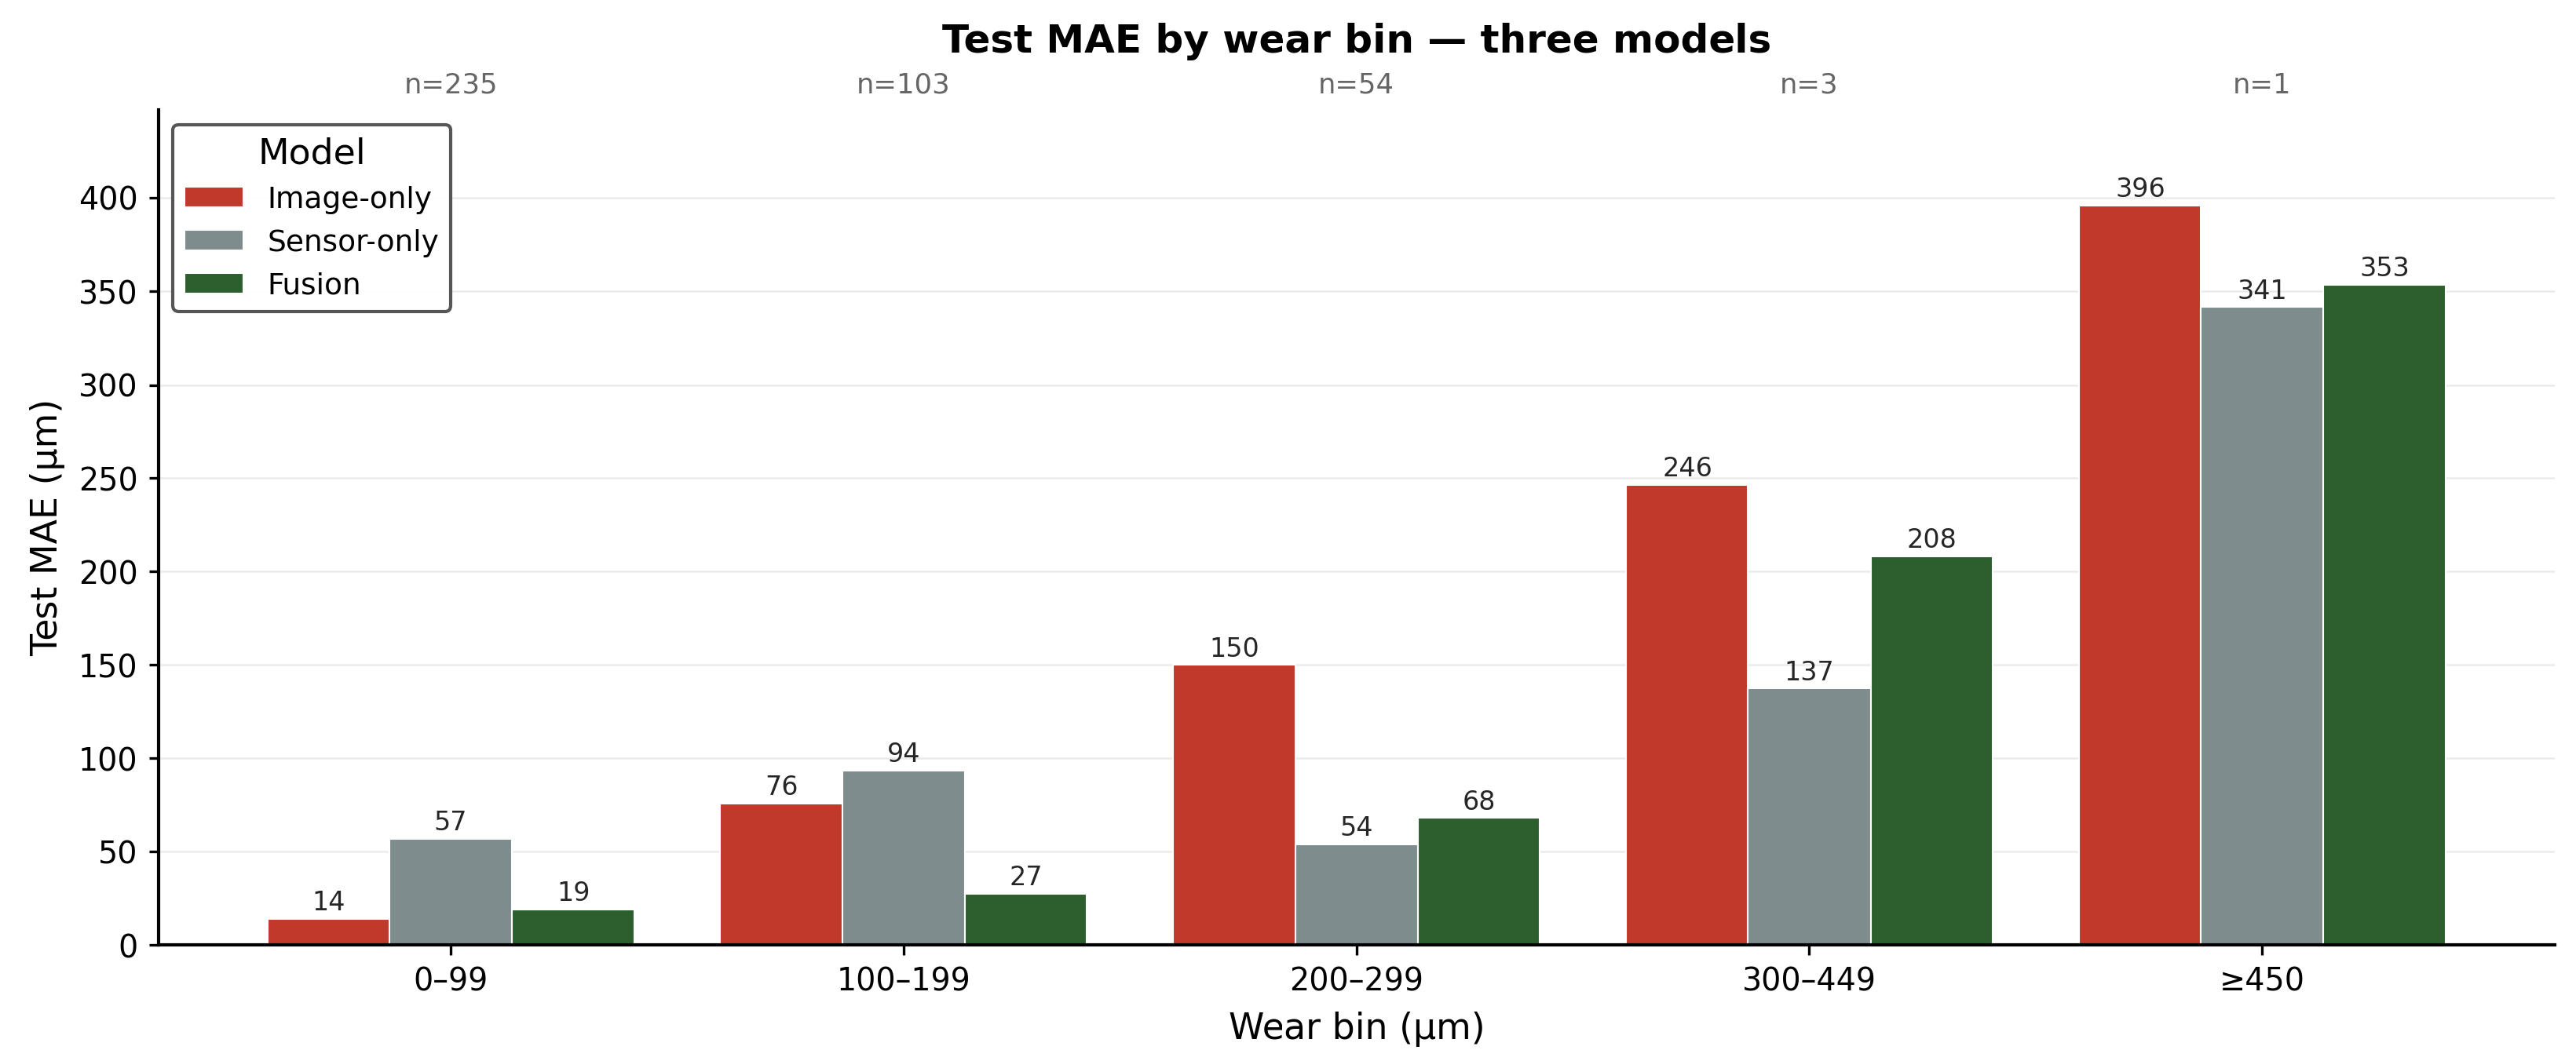
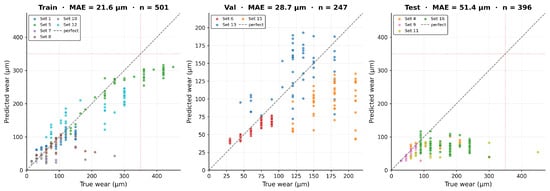
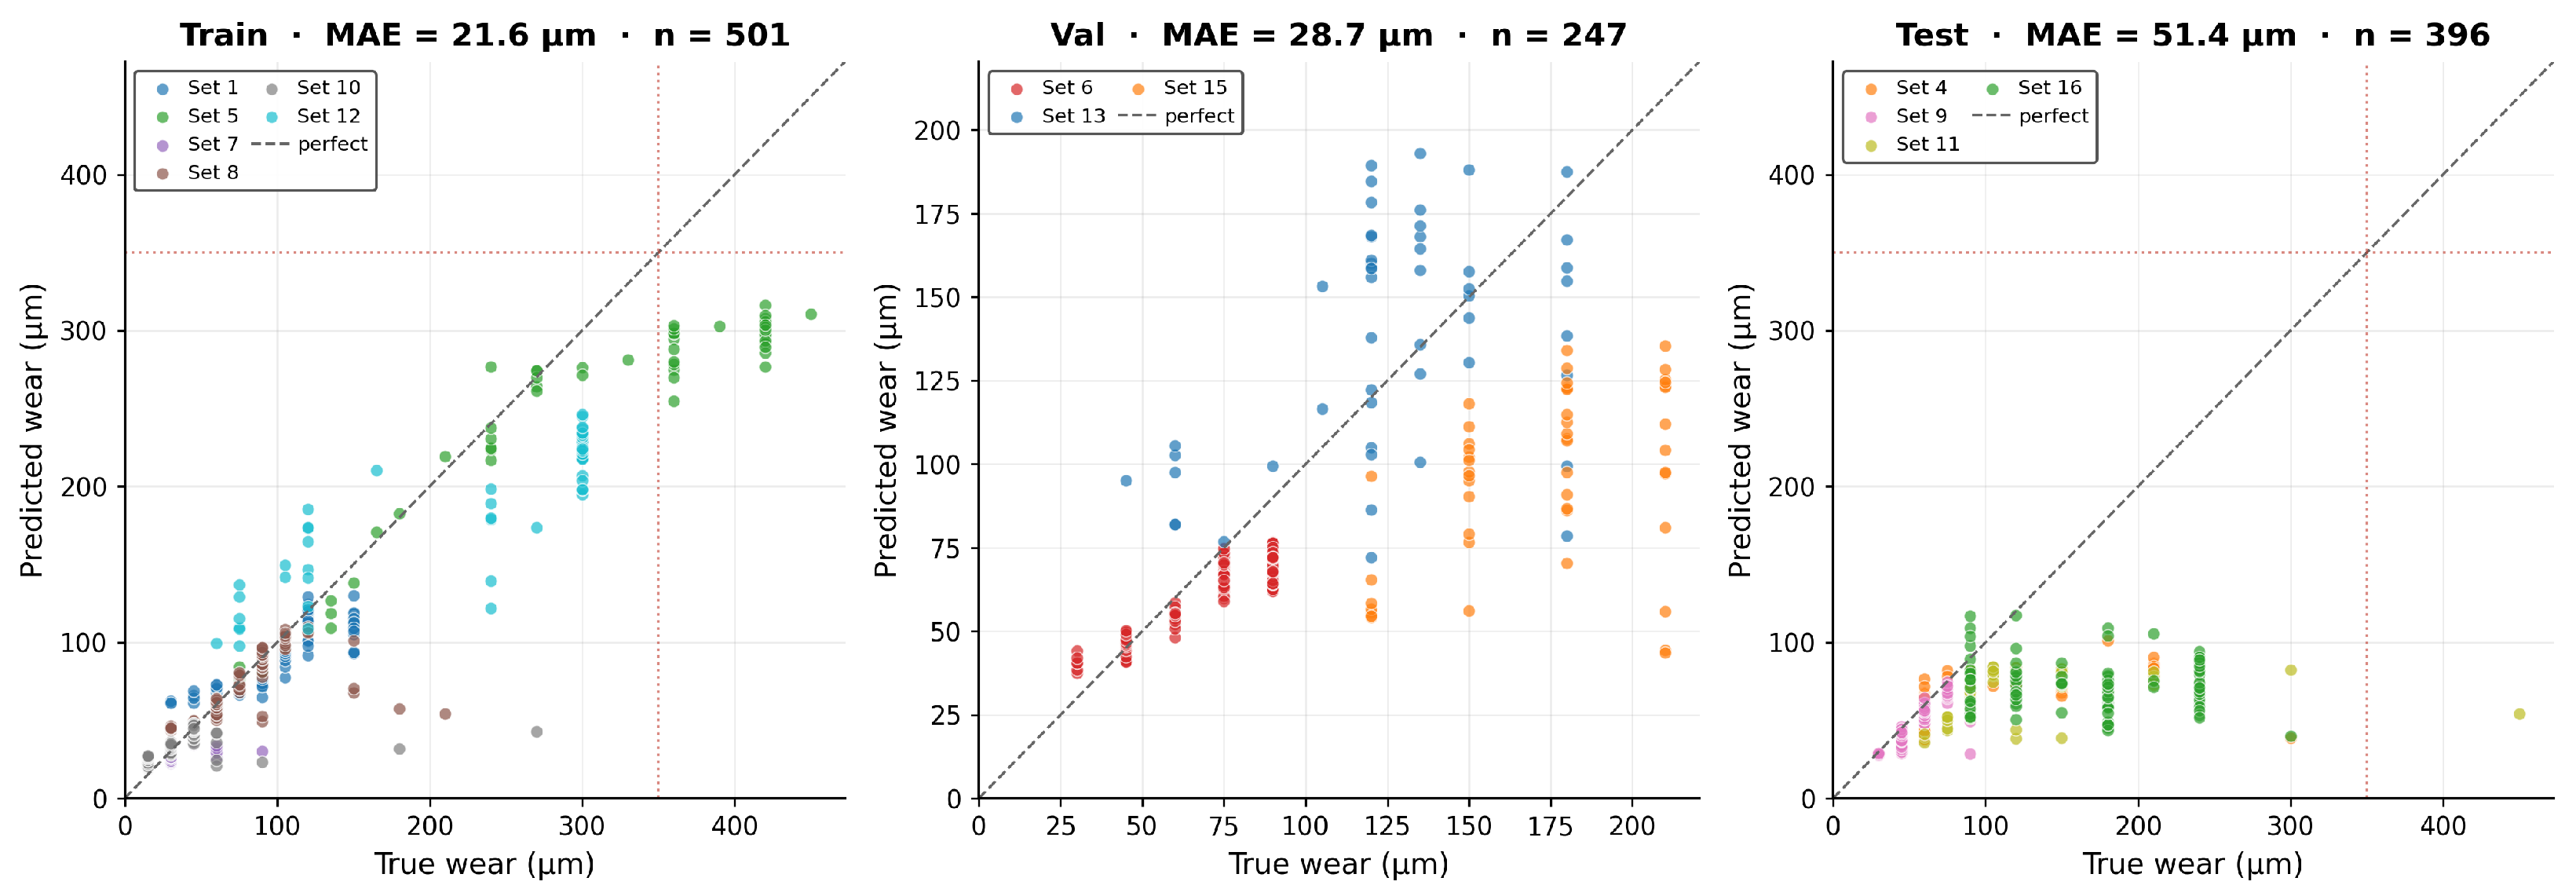
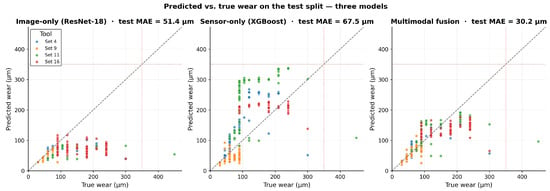
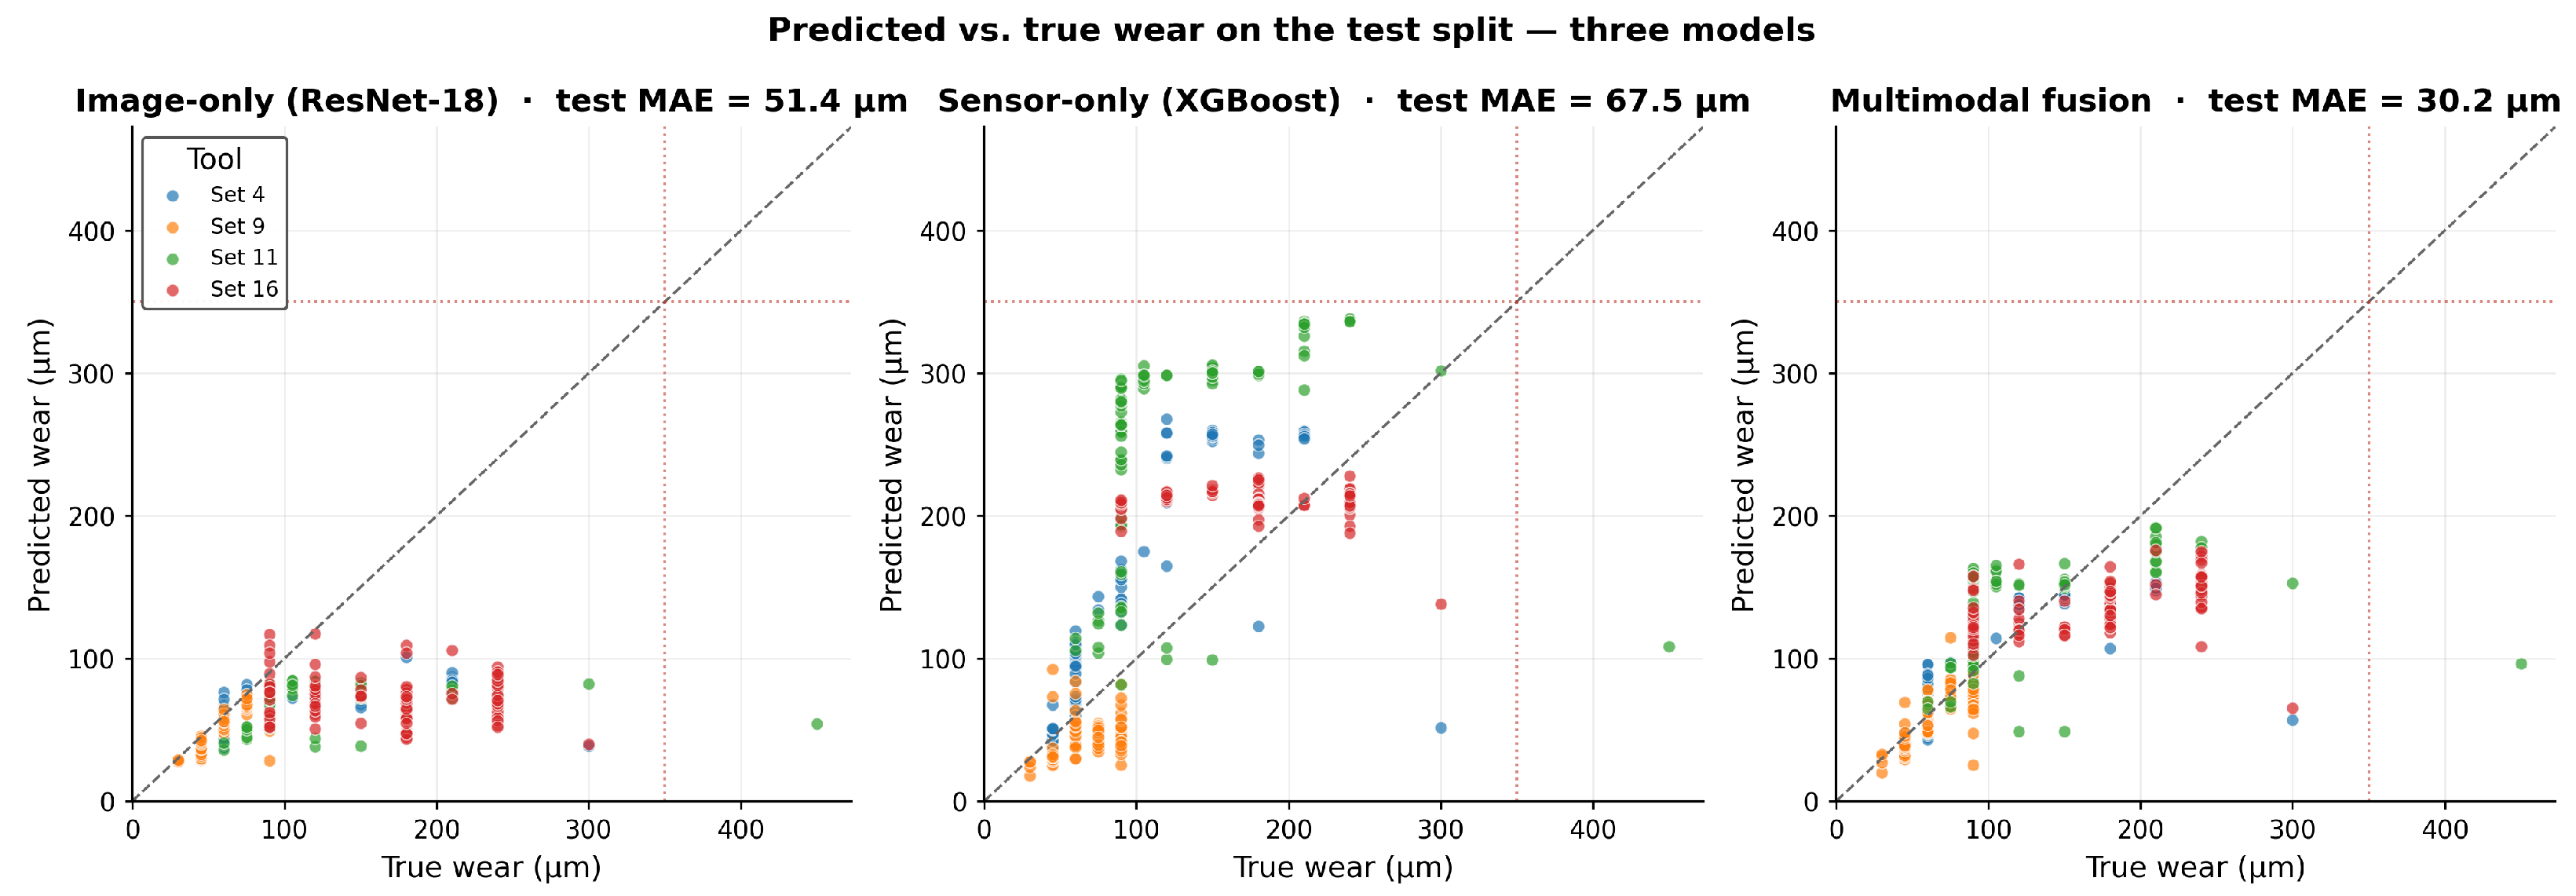
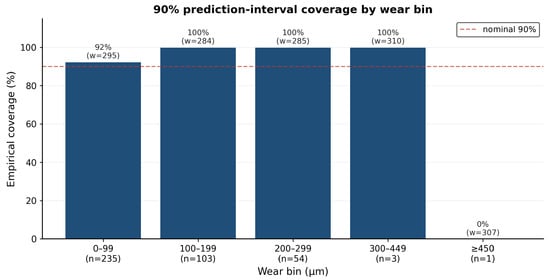
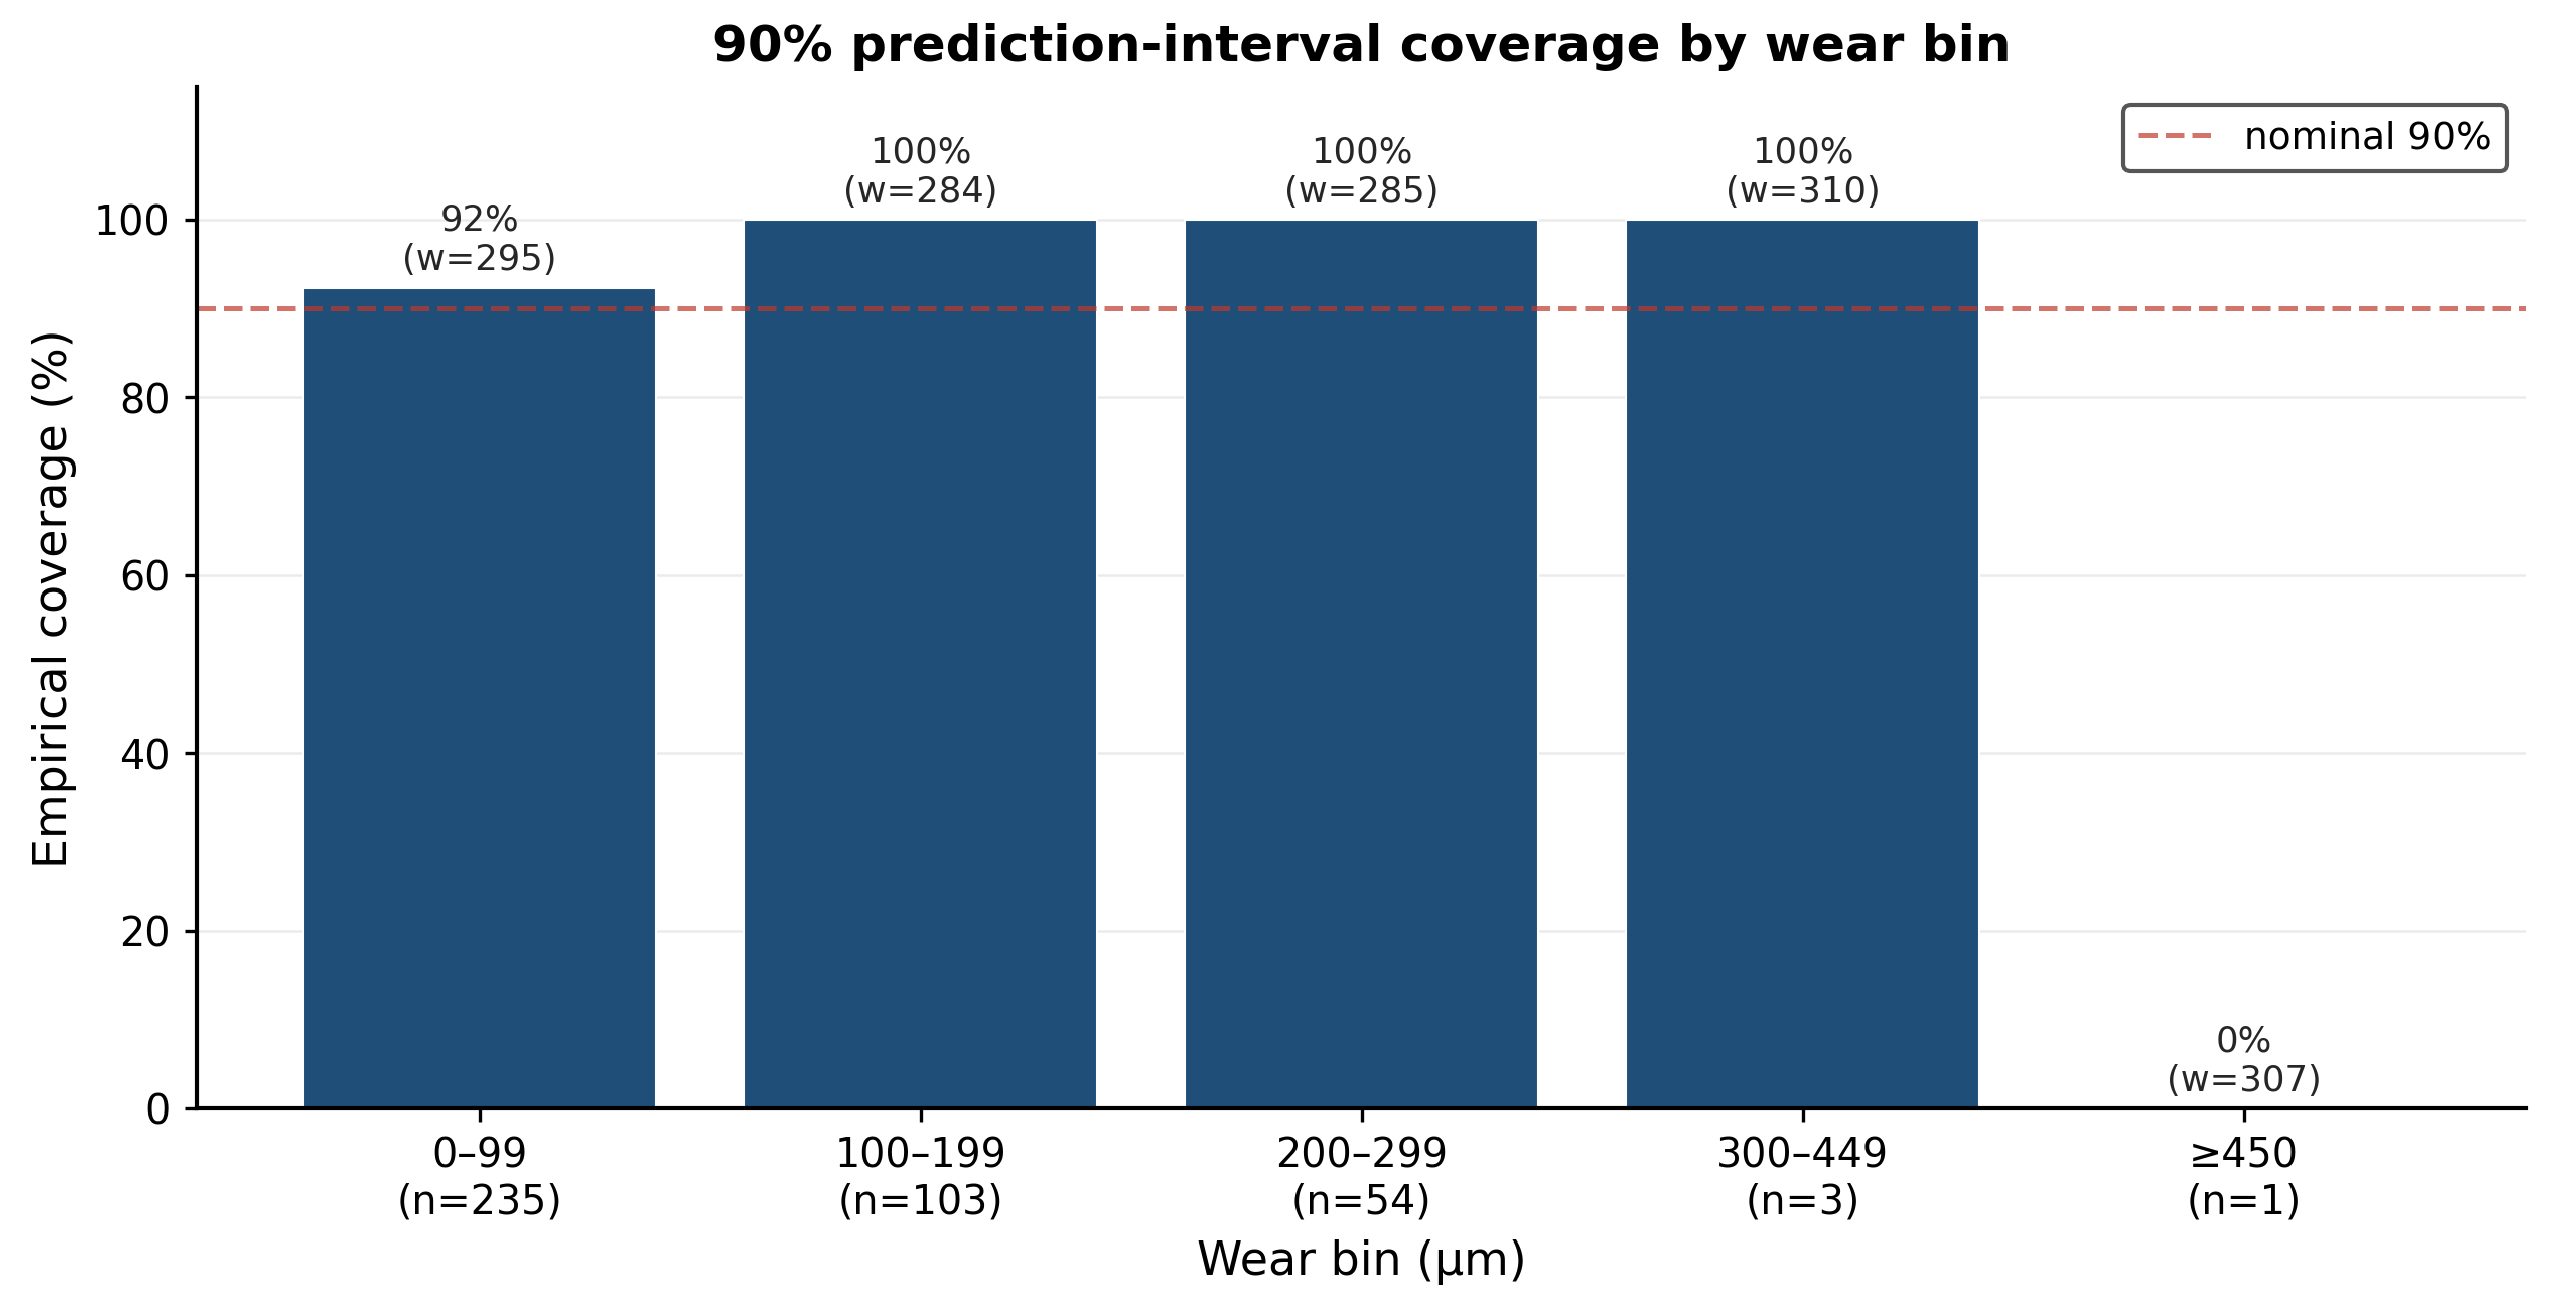
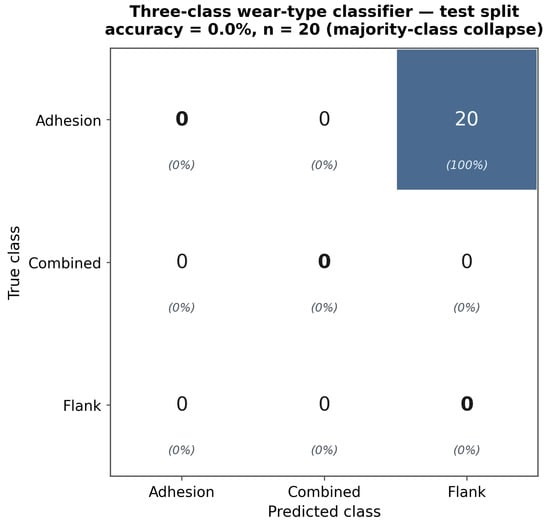
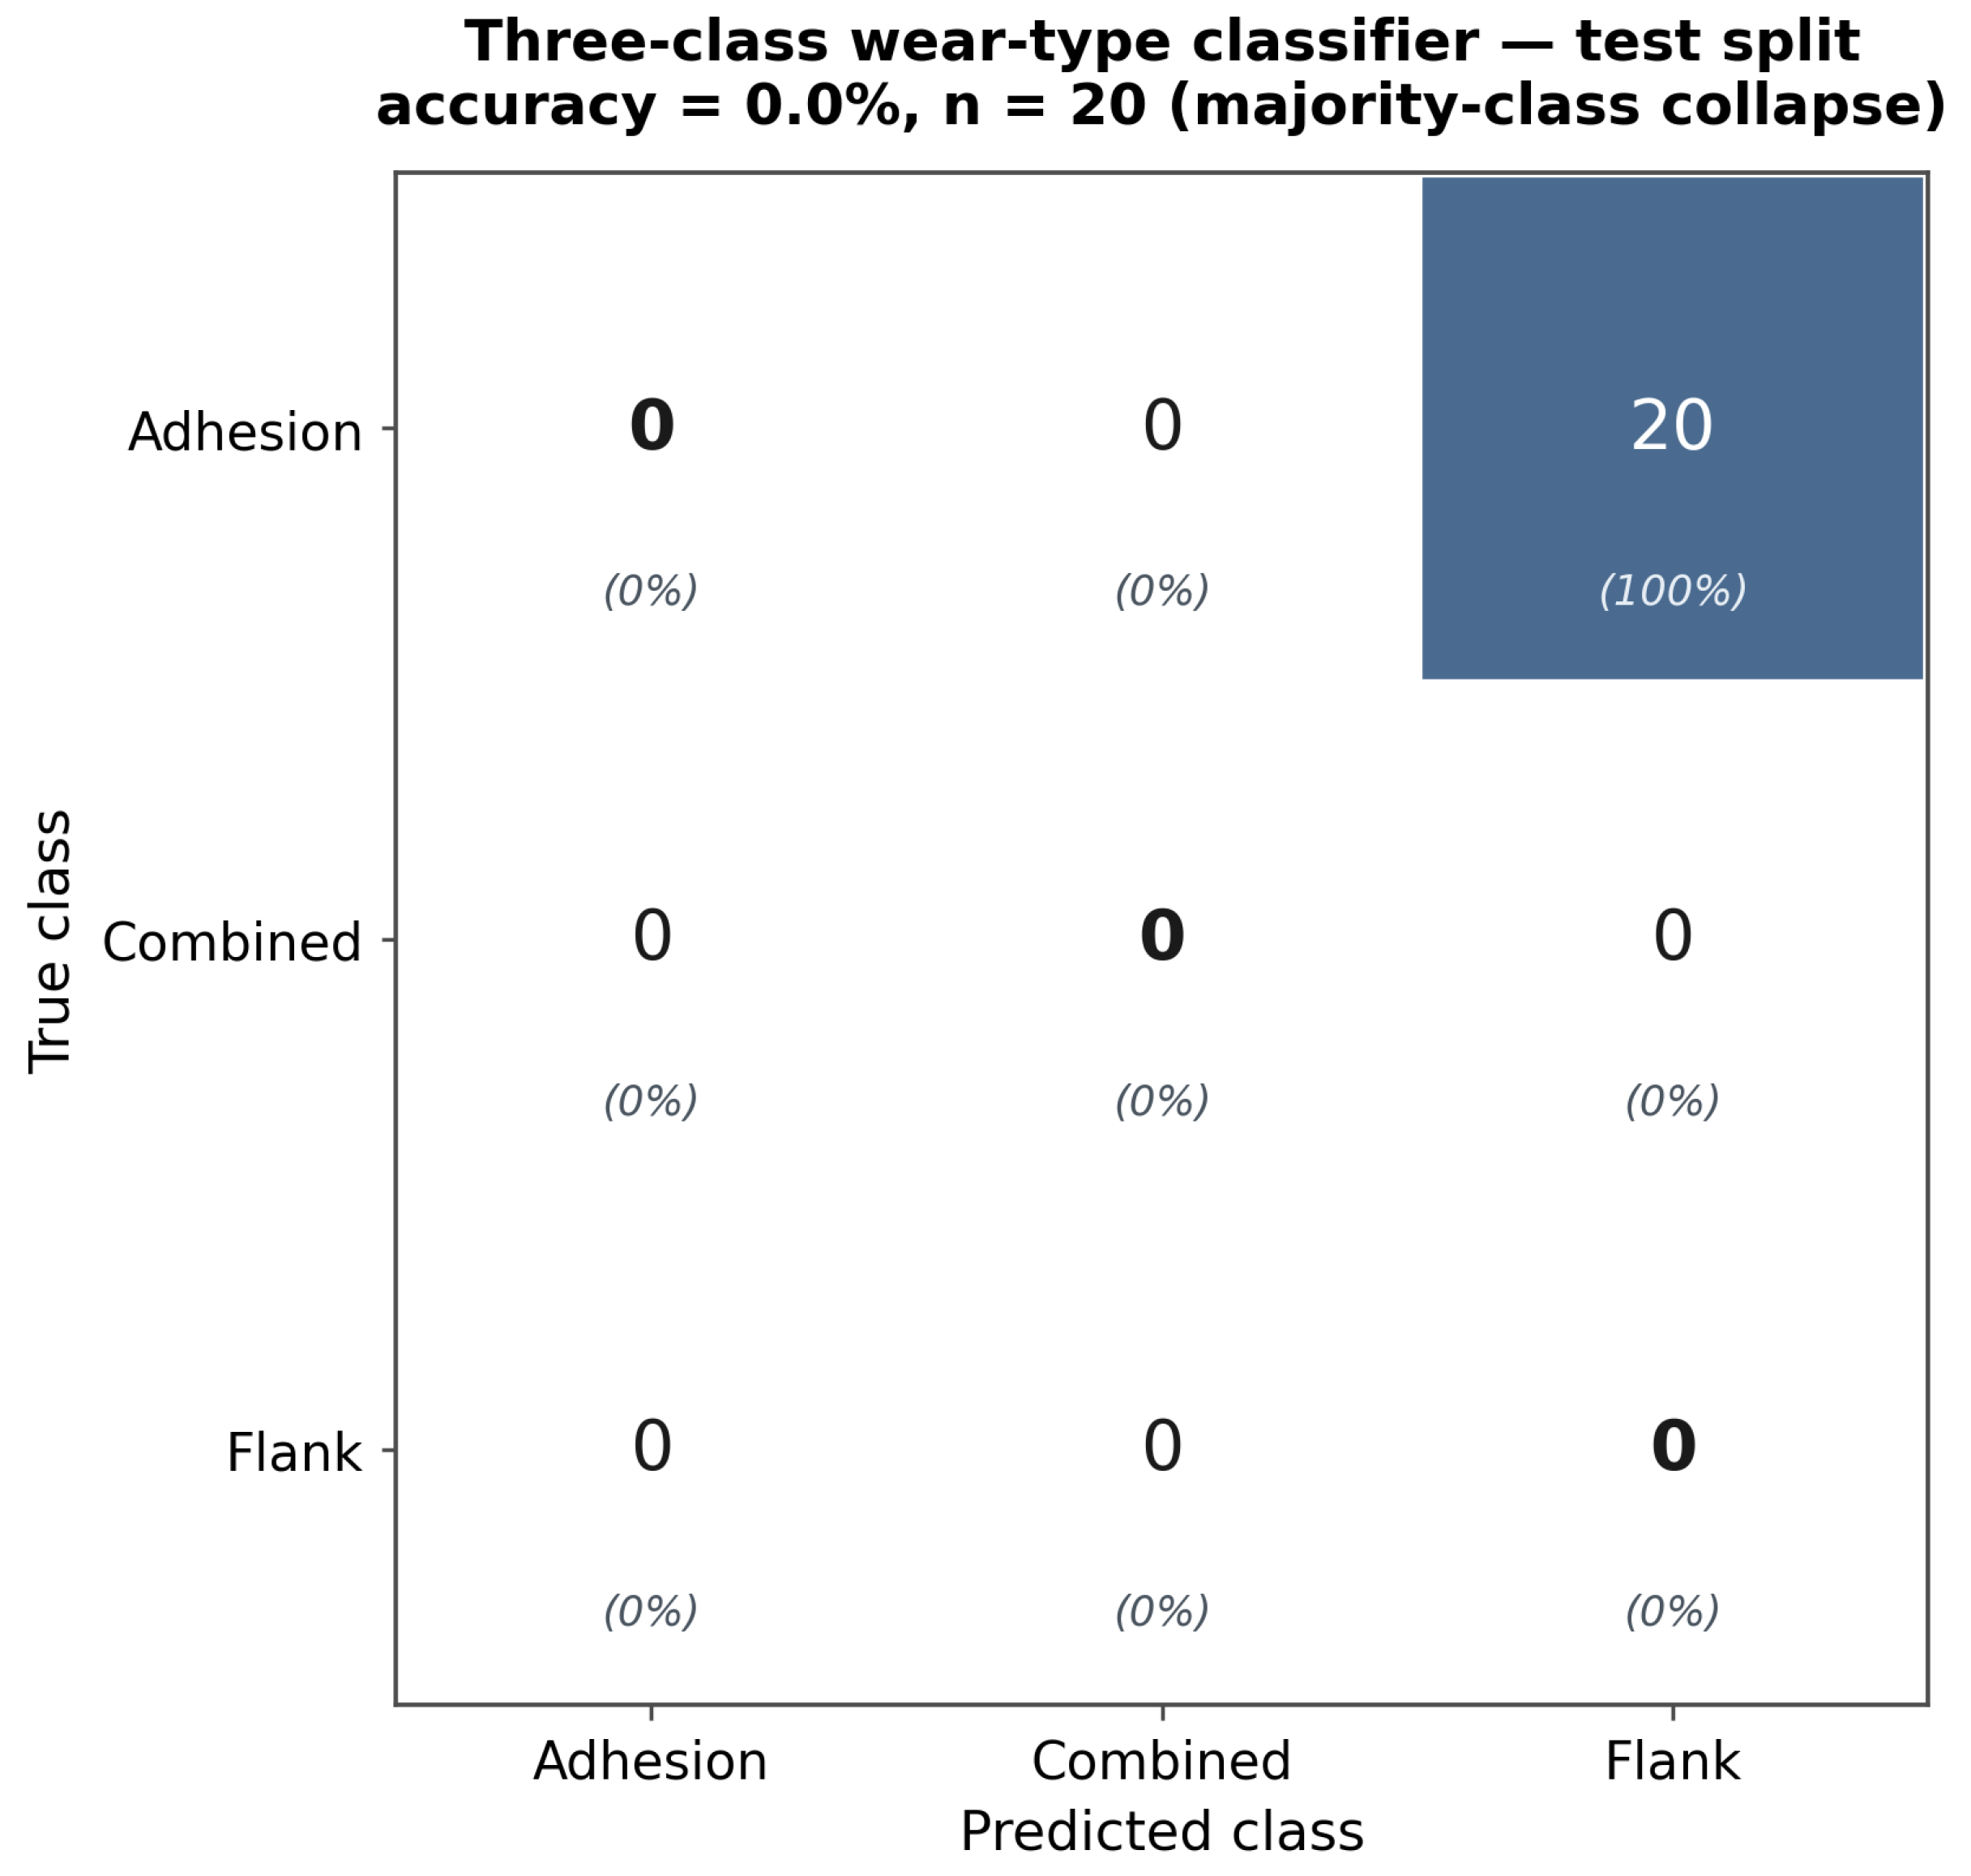
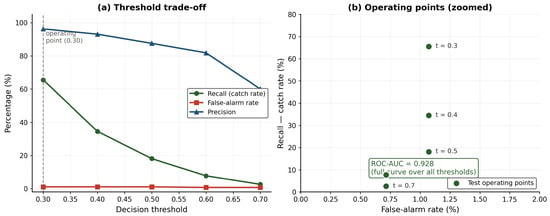
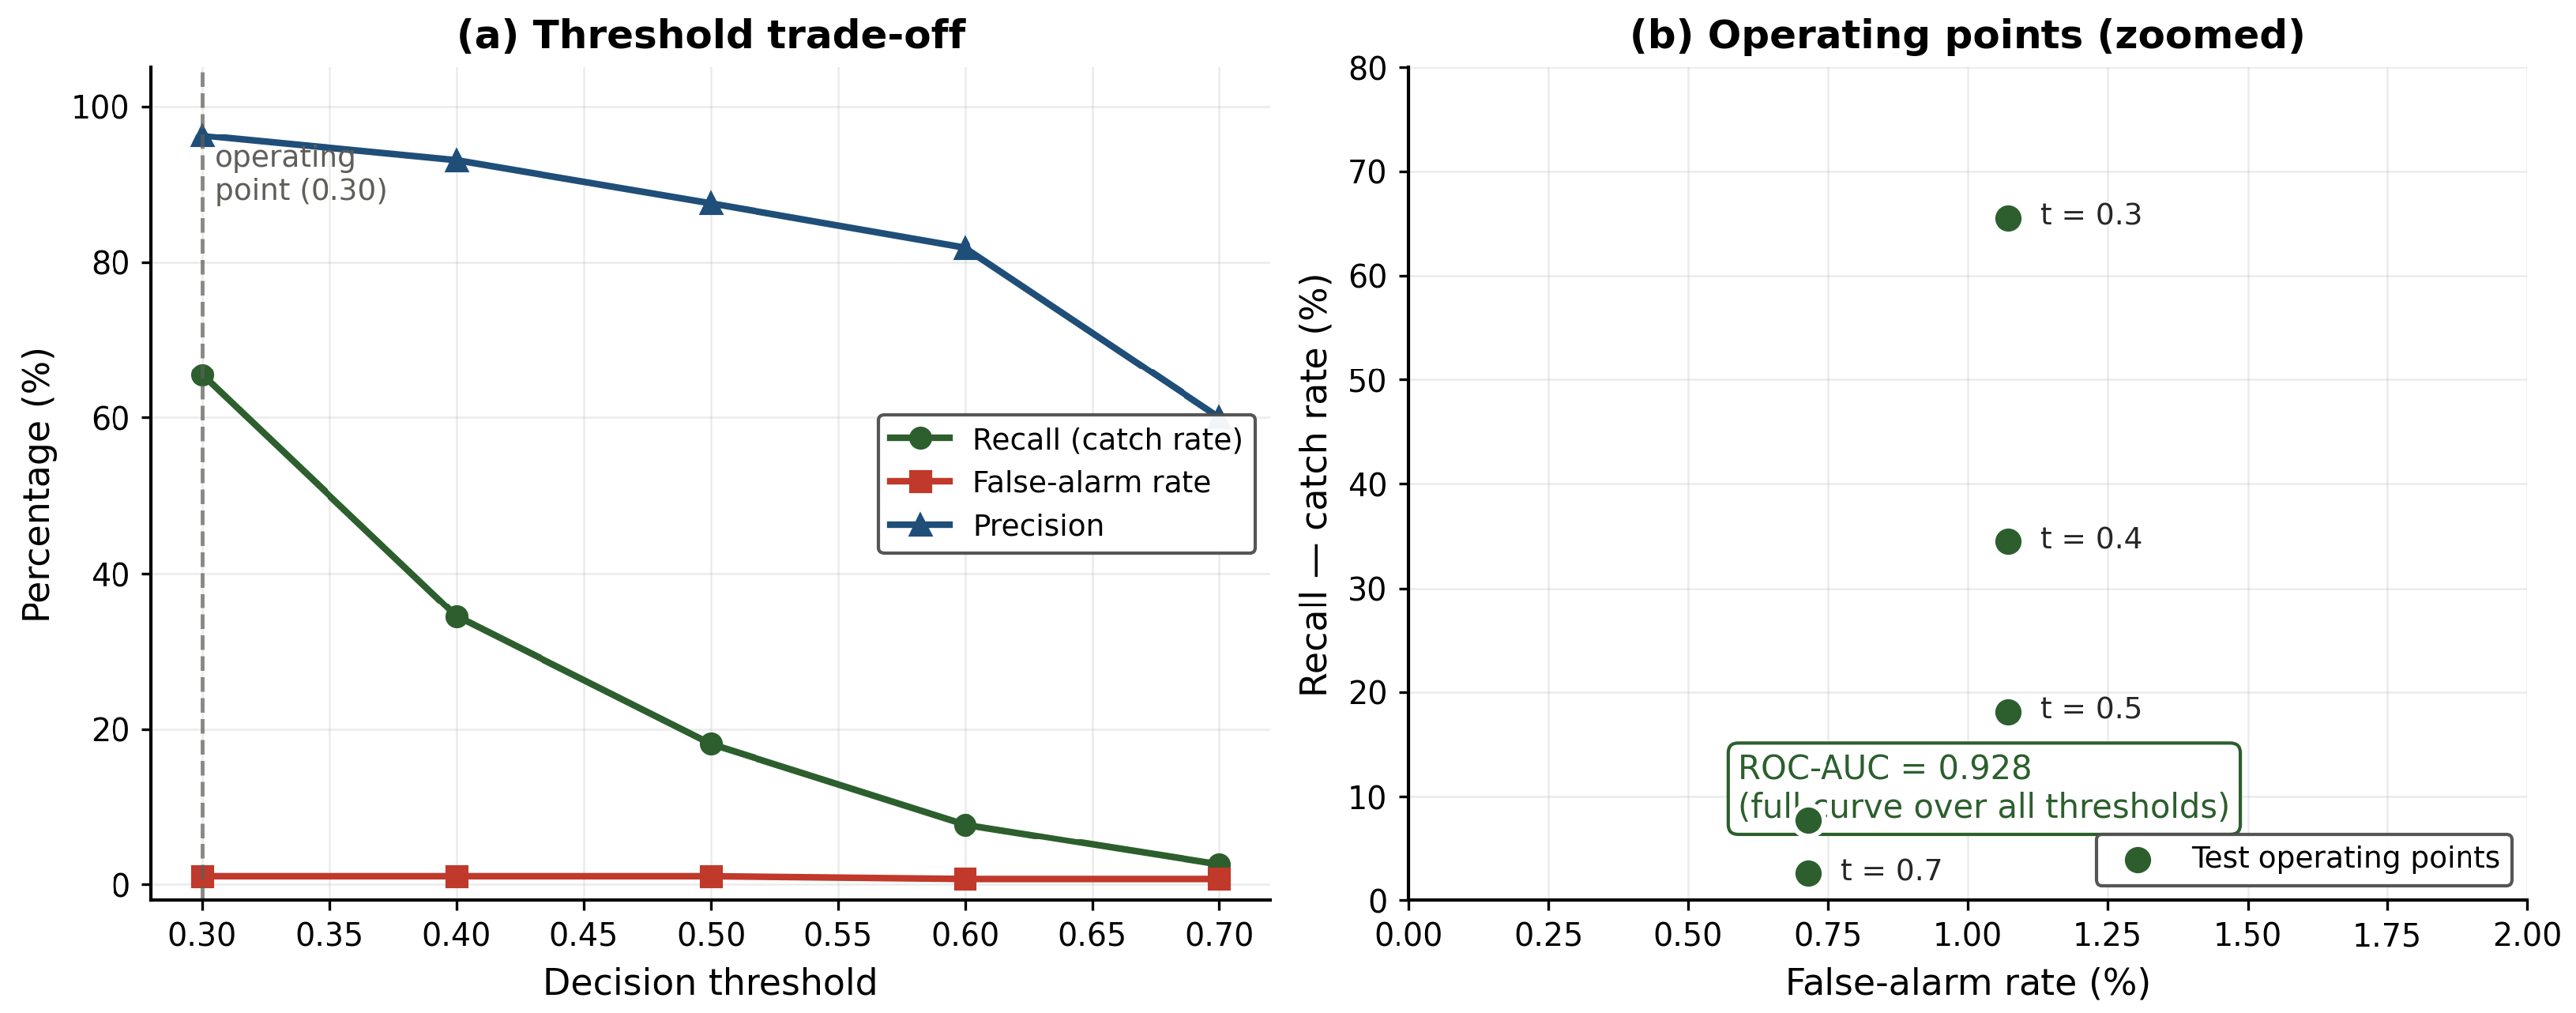
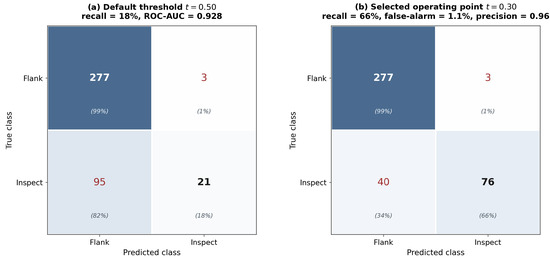
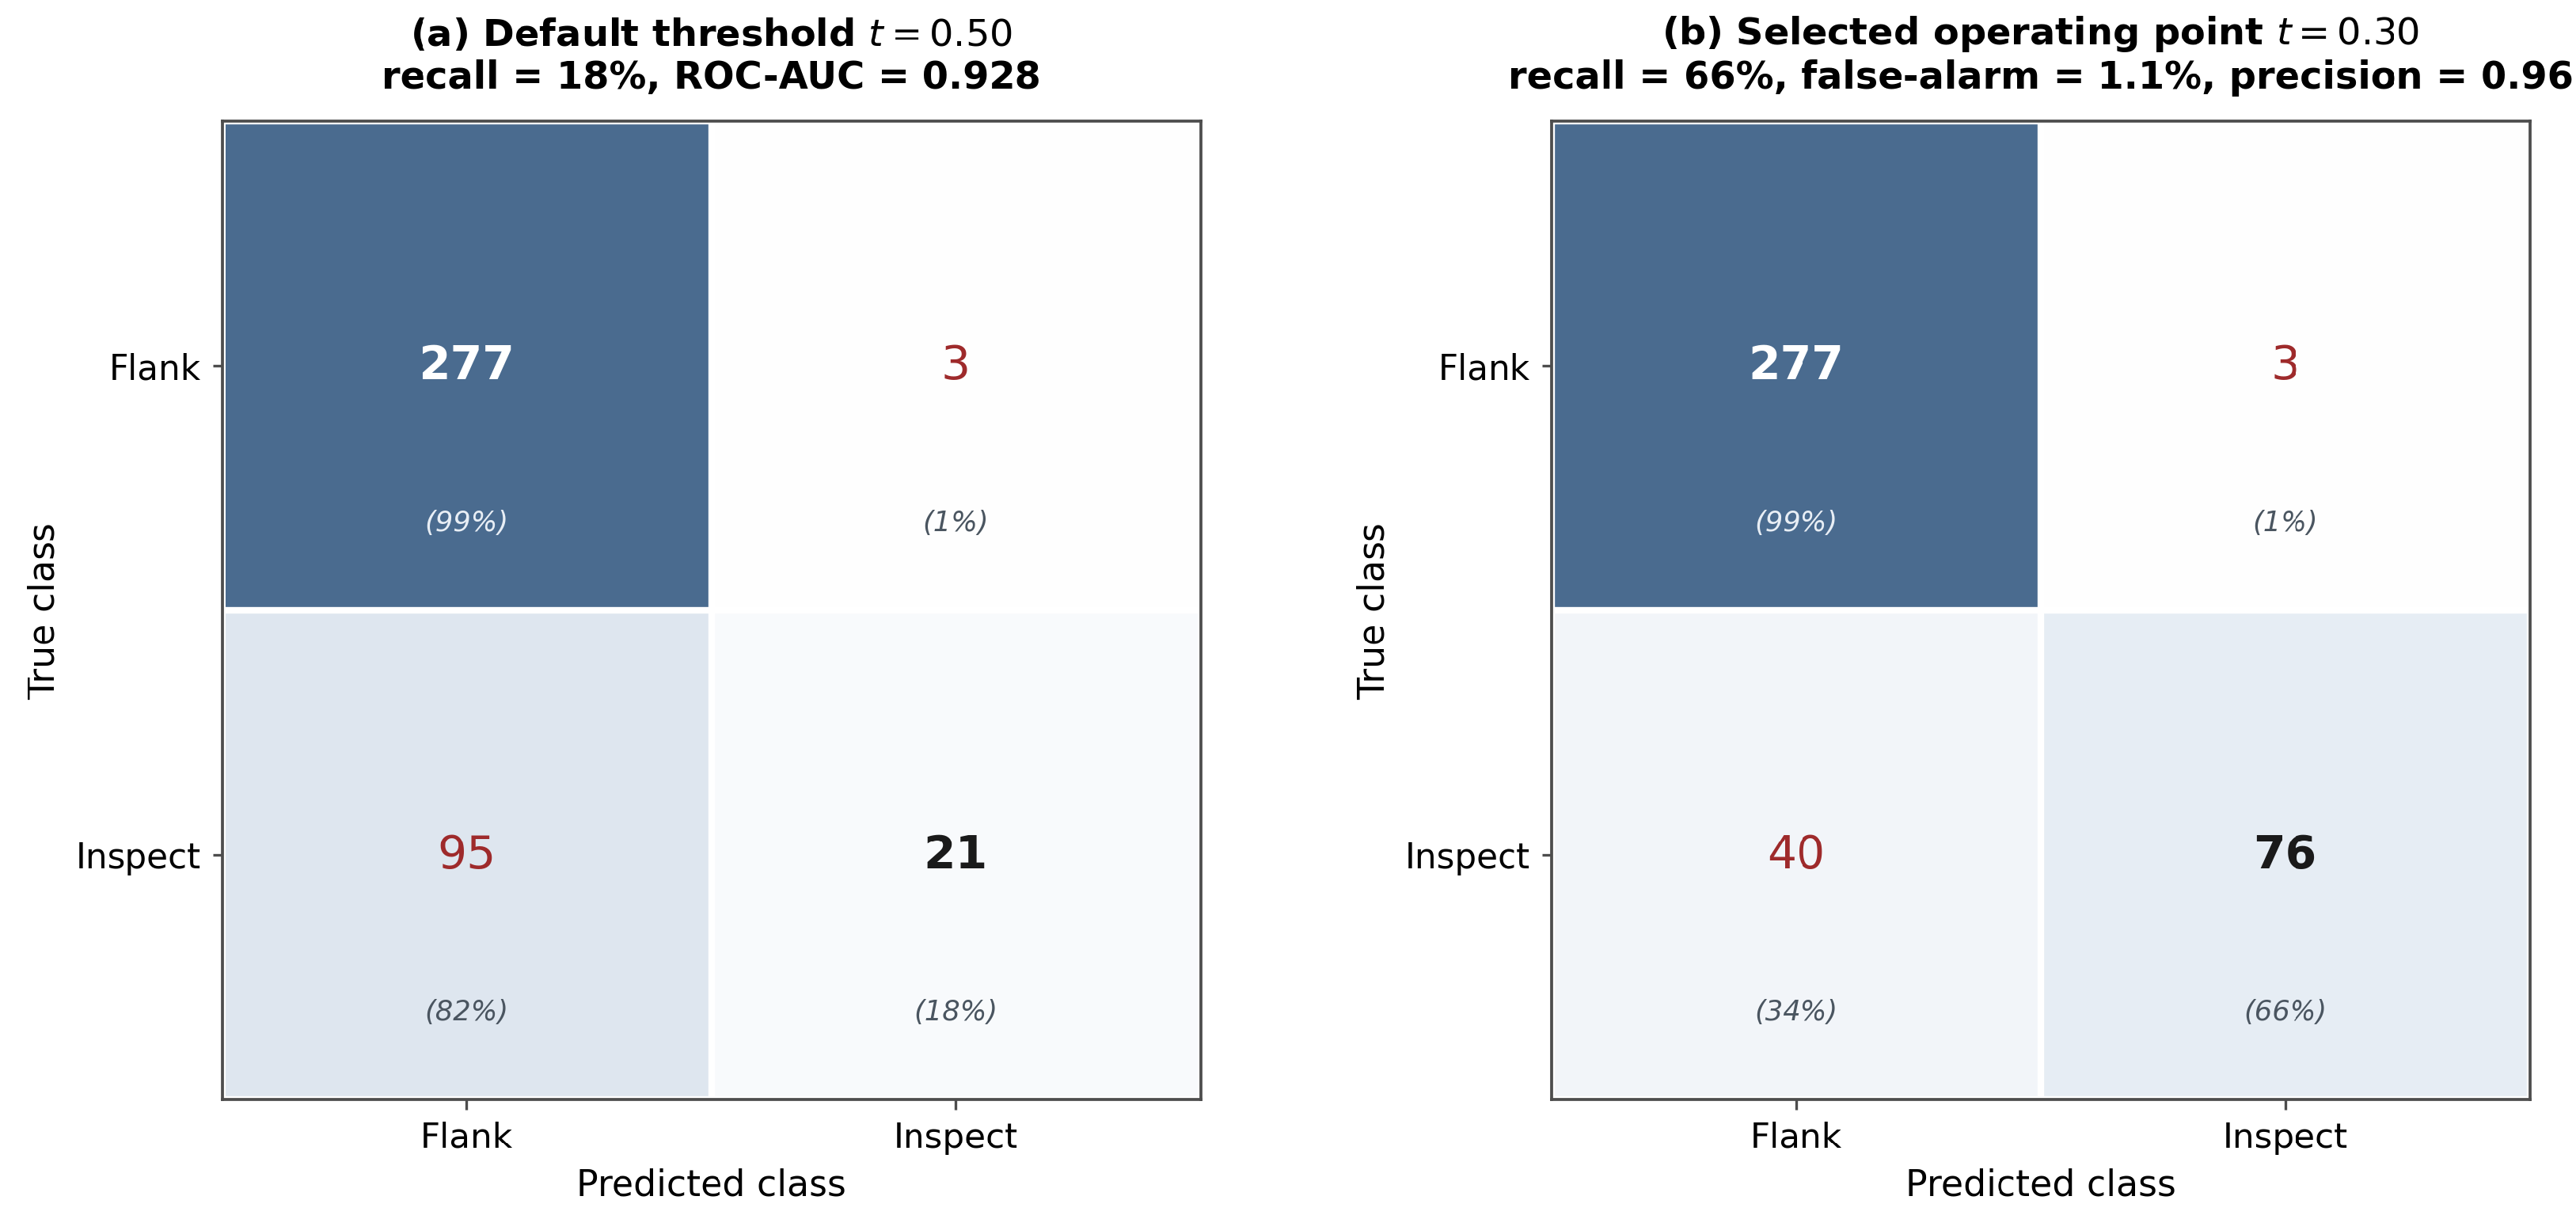
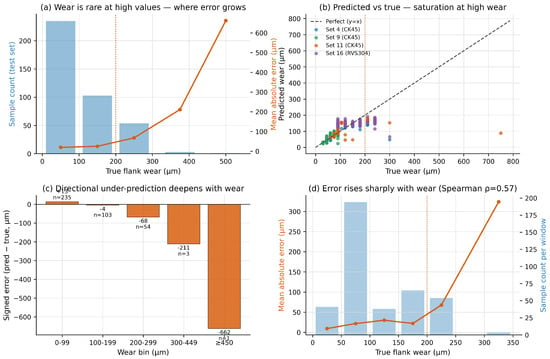
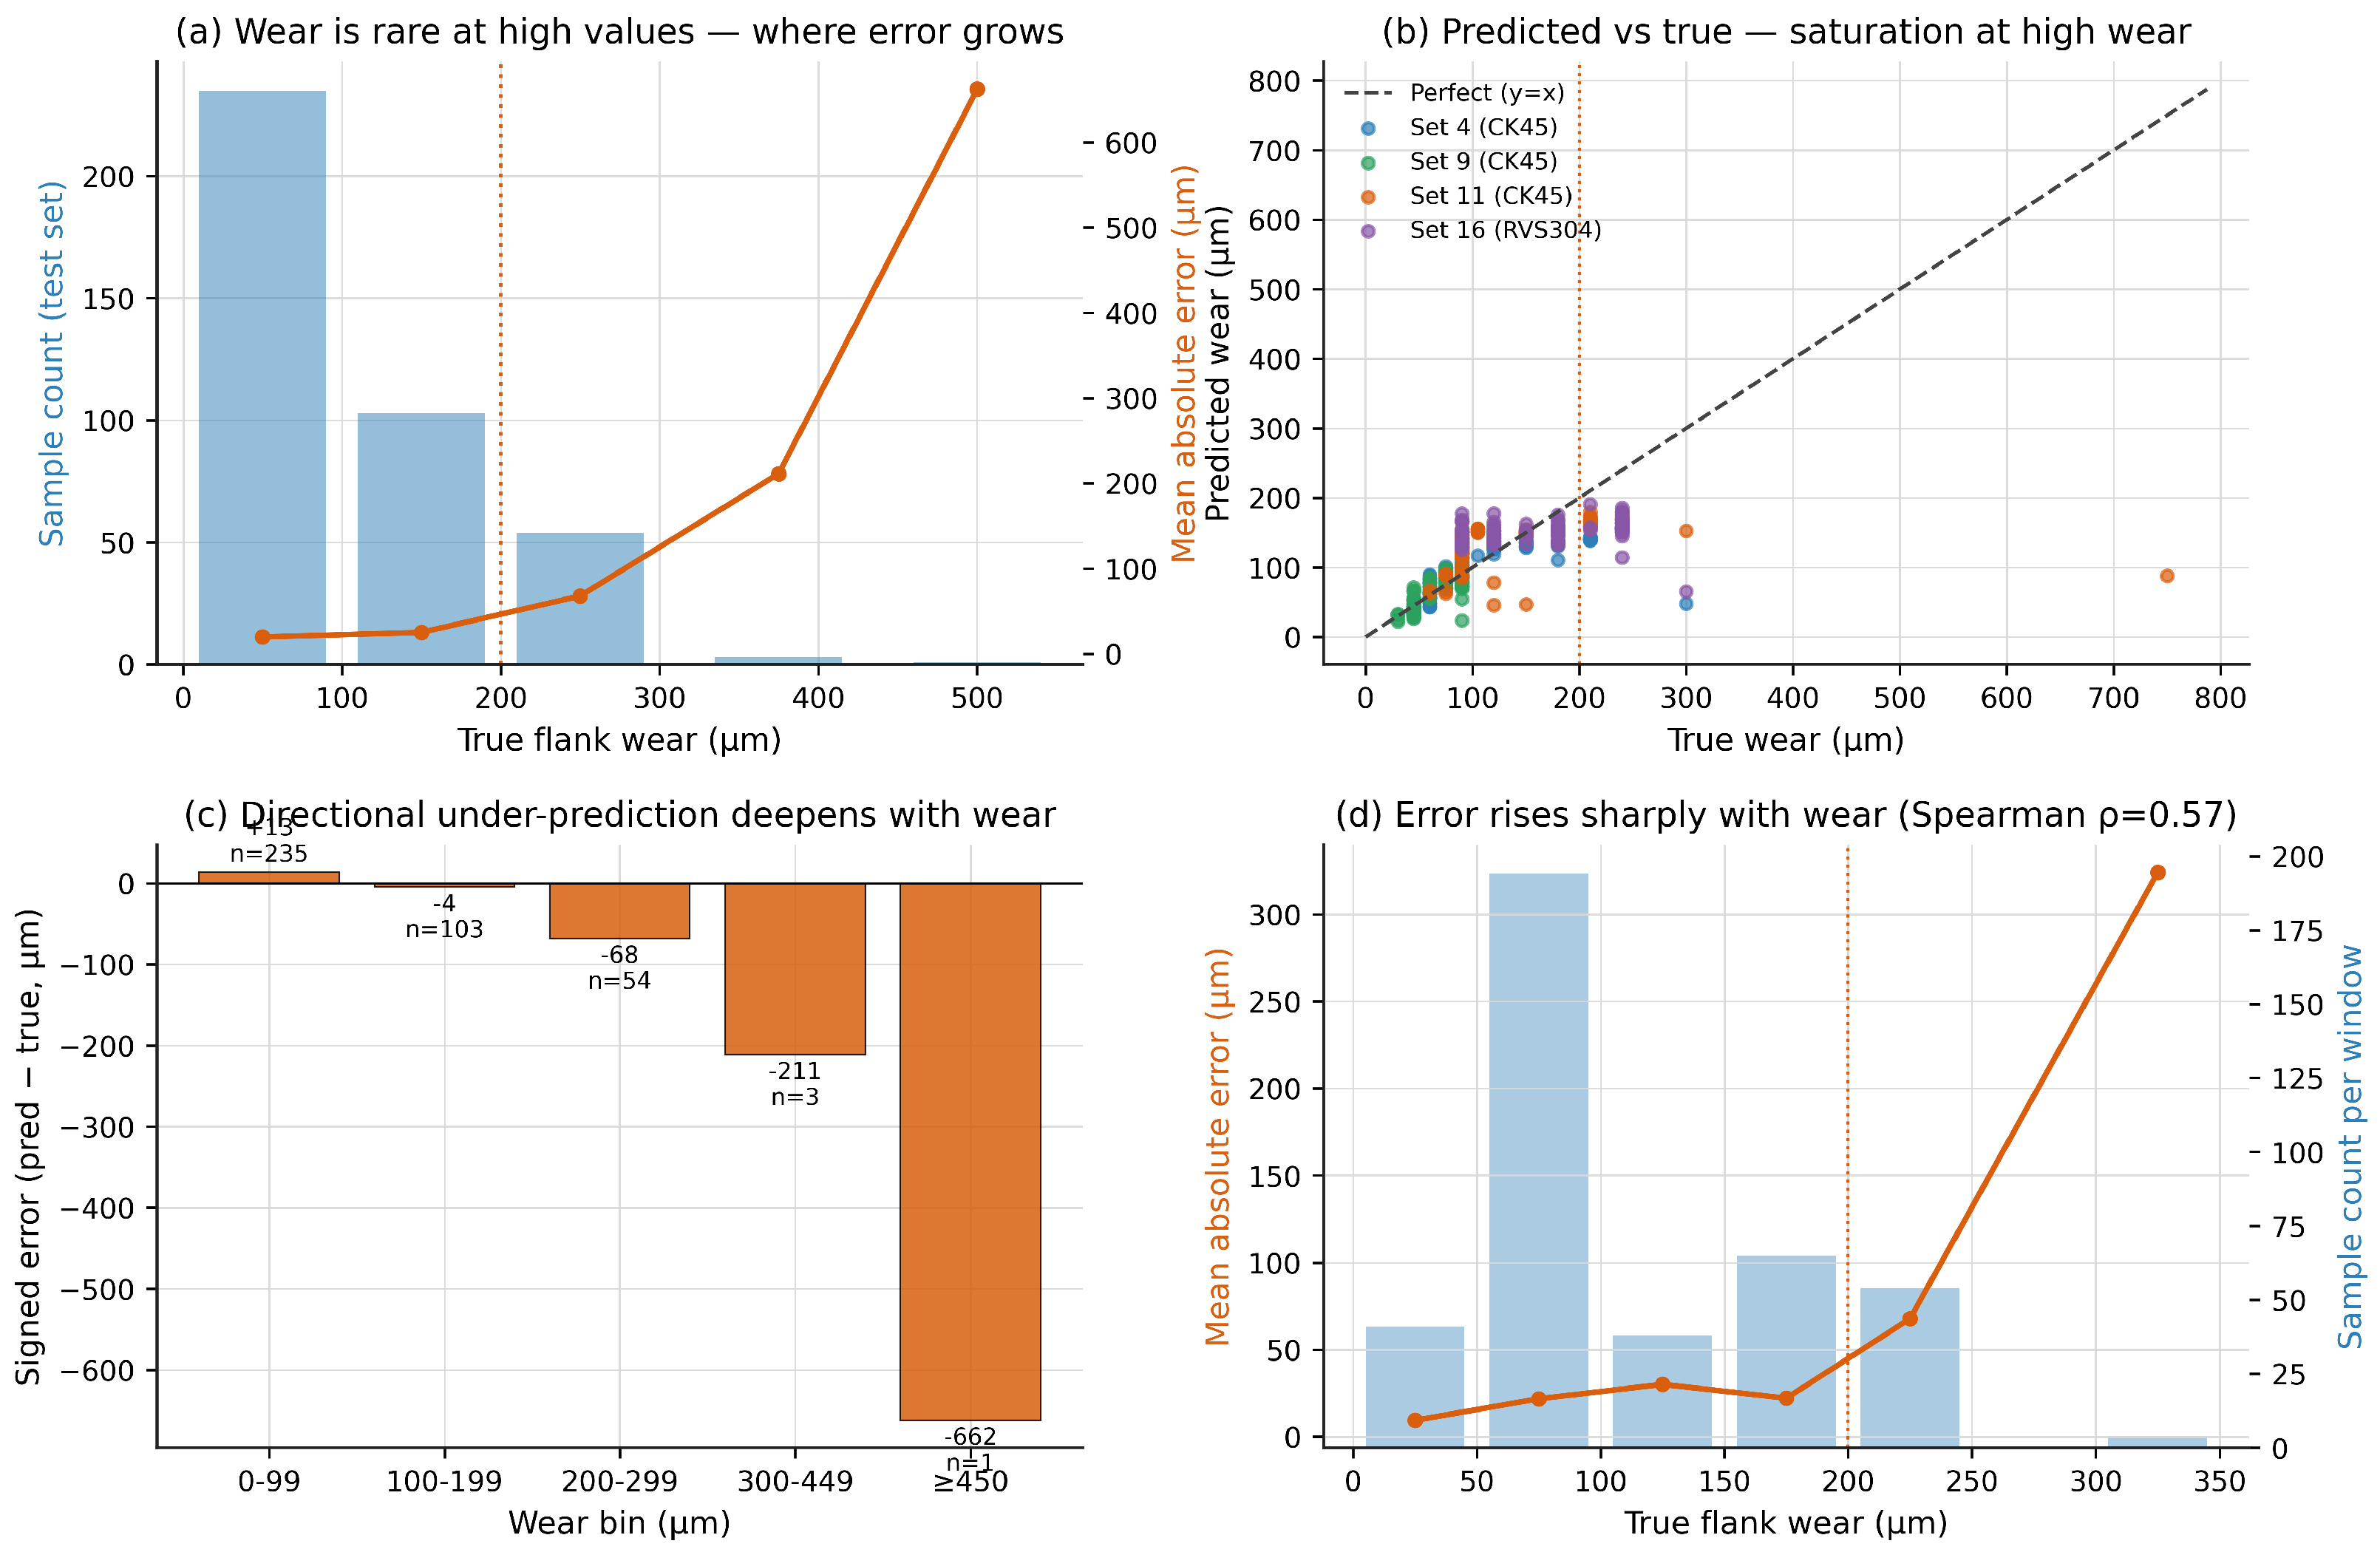
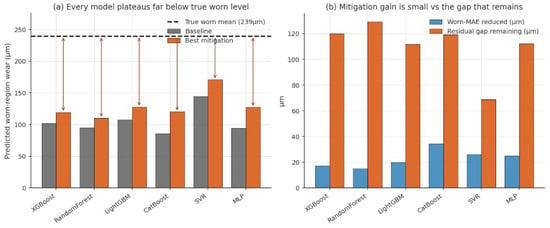
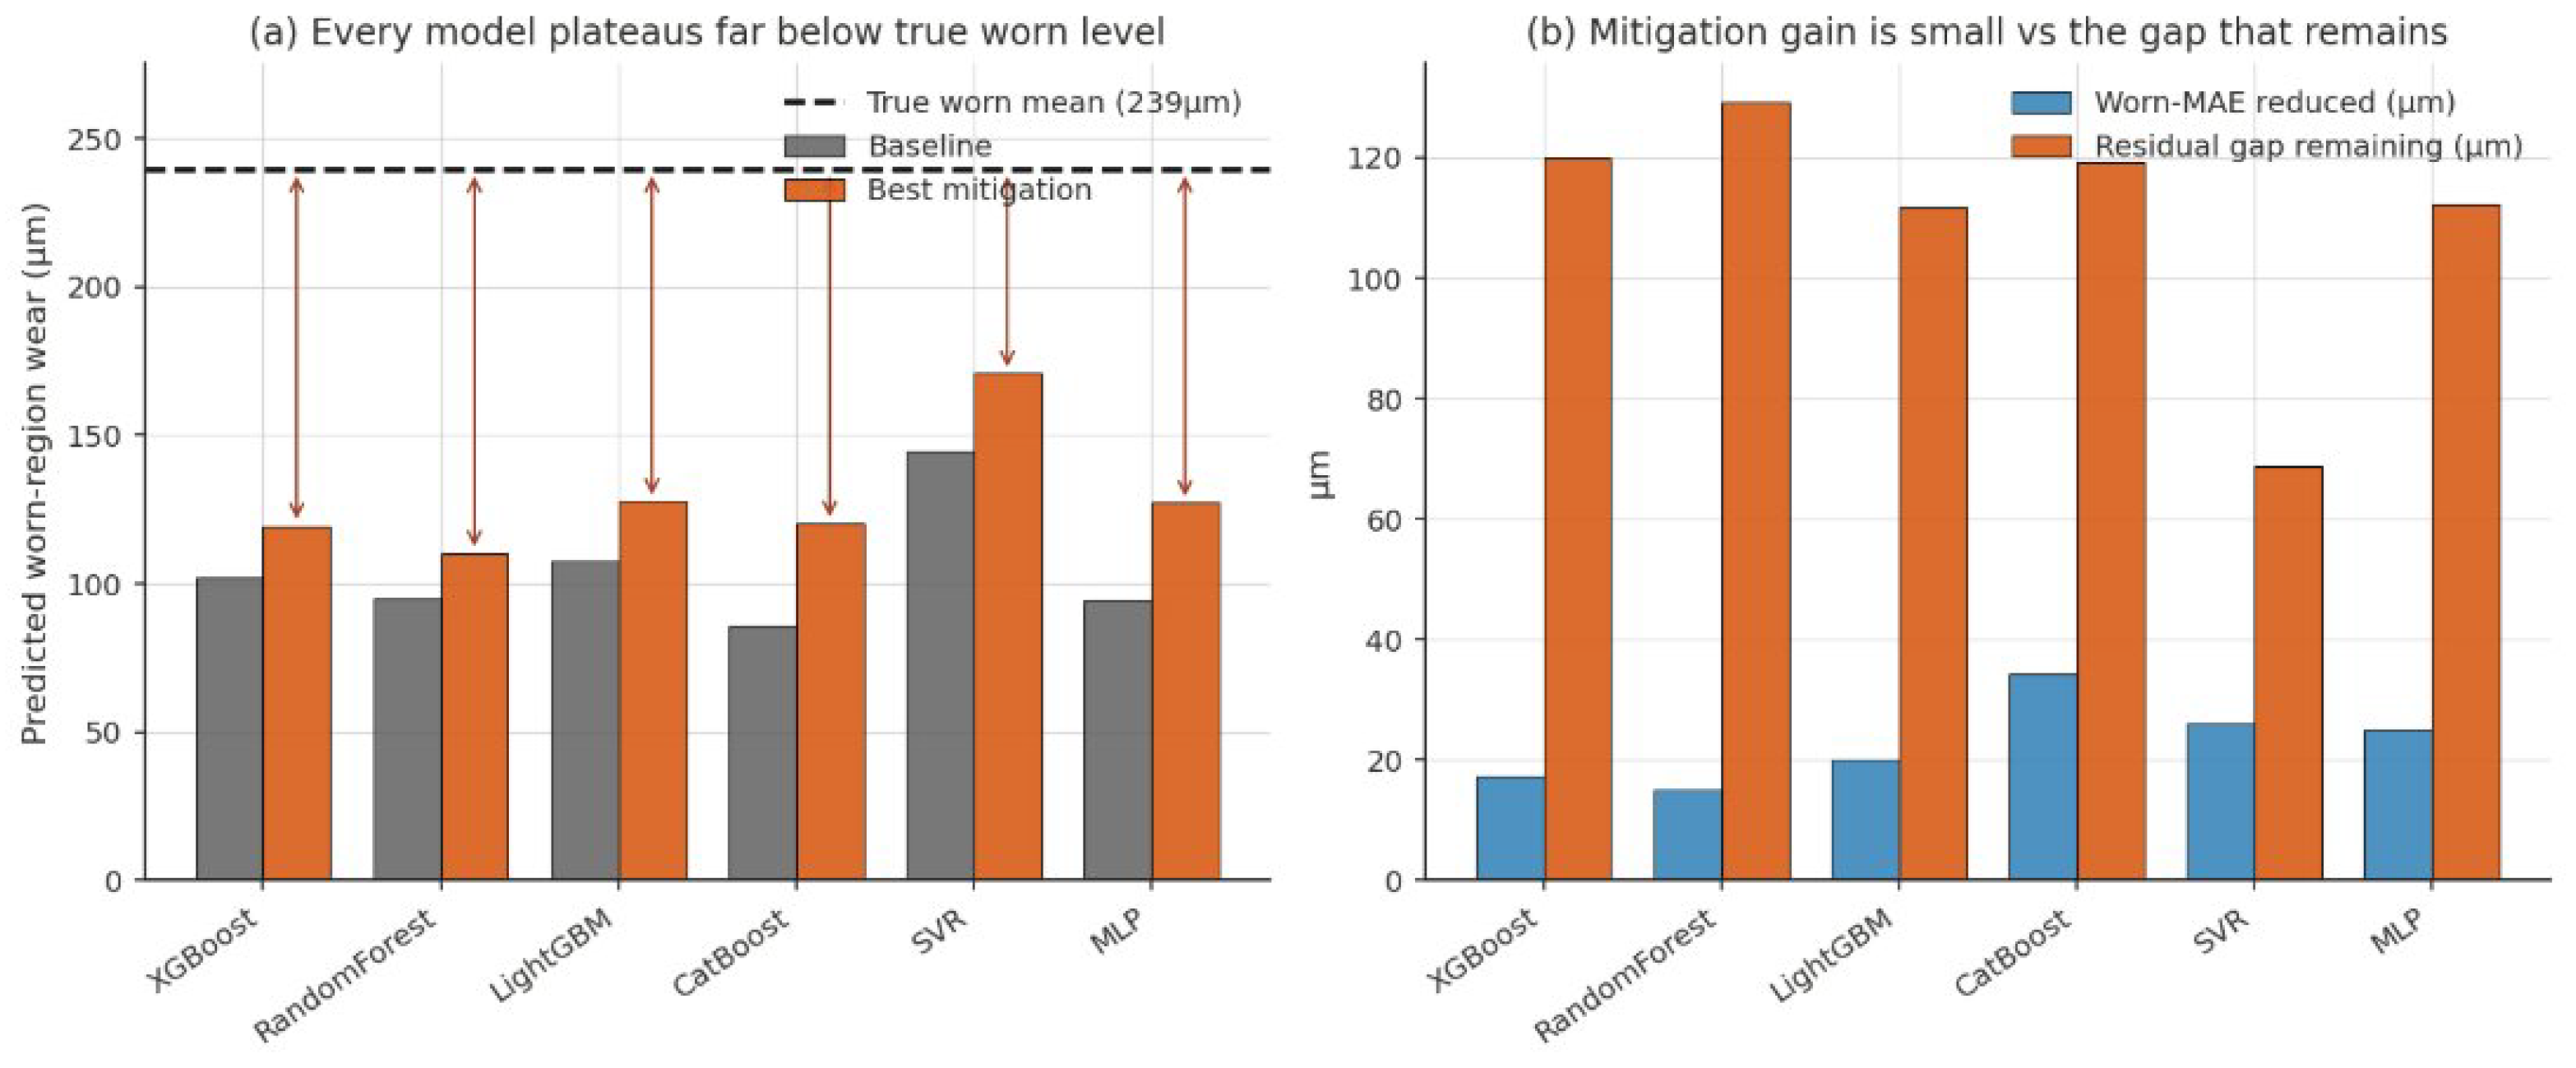
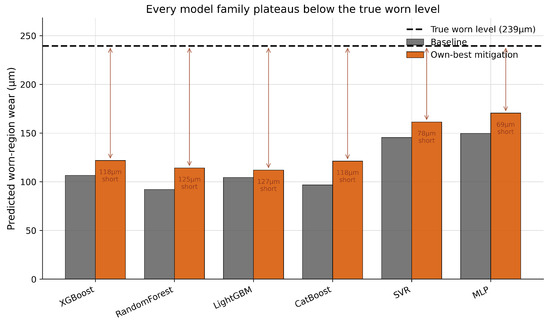
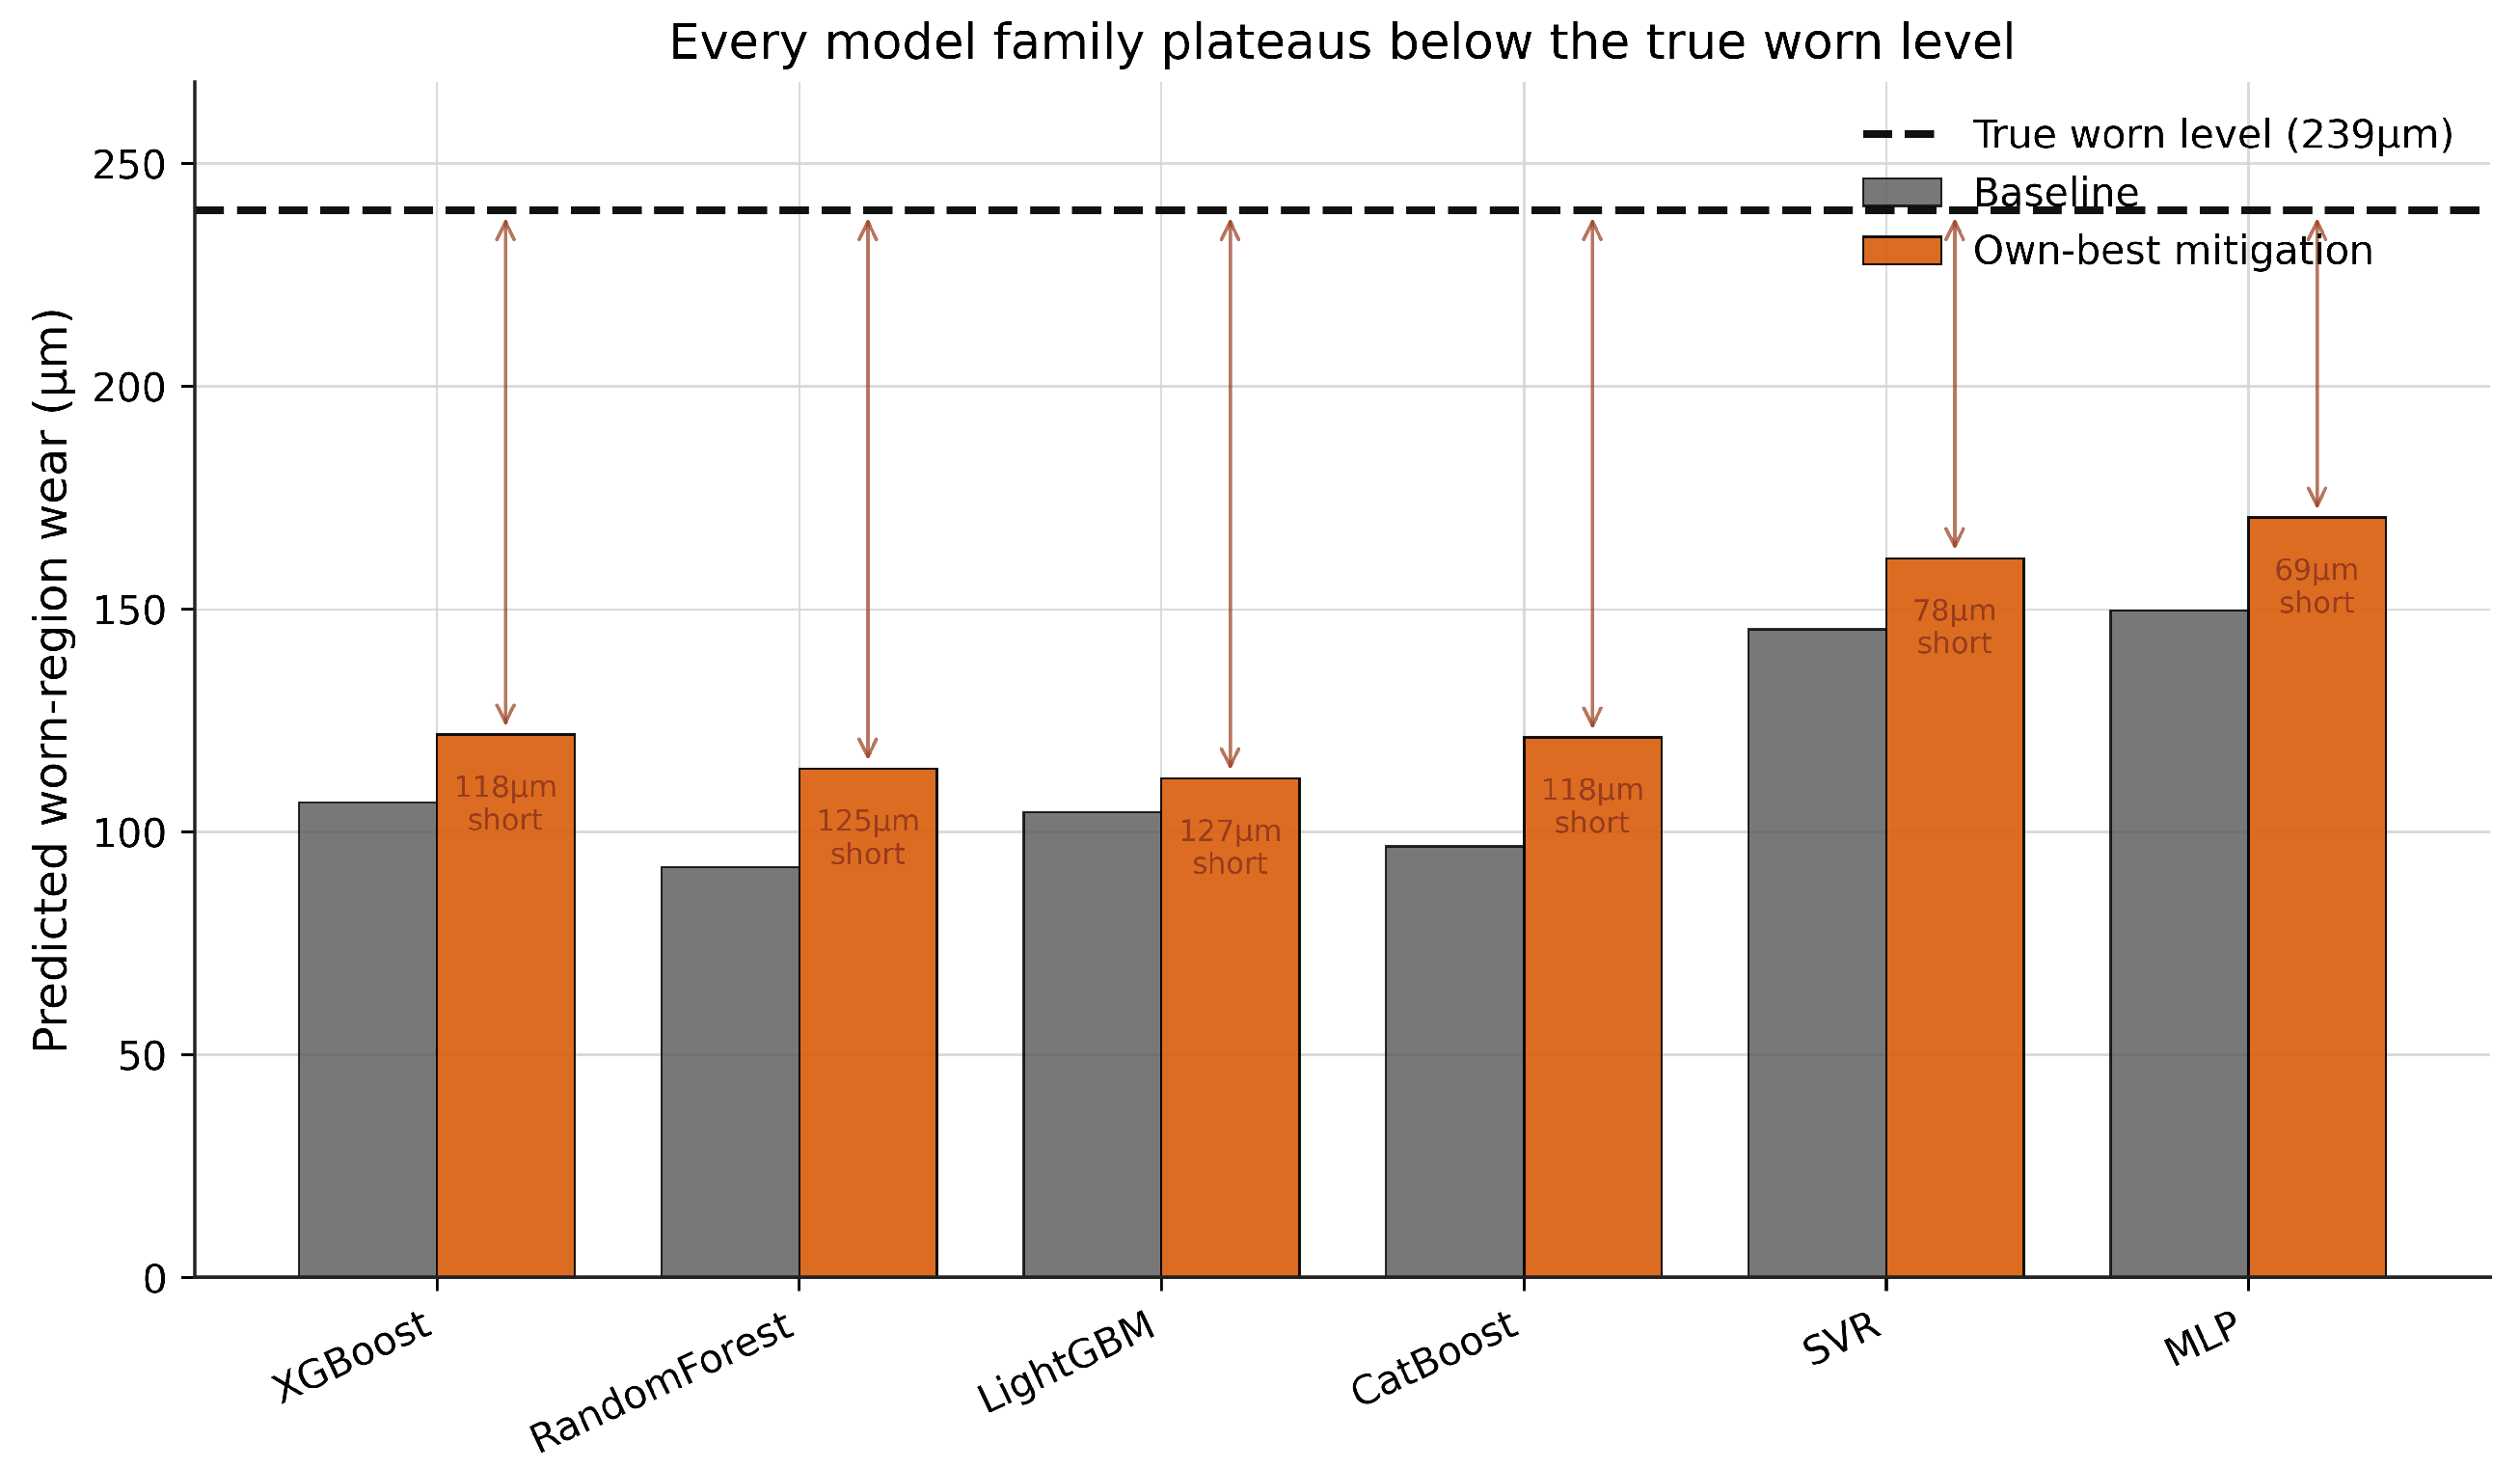

Disclaimer/Publisher’s Note: The statements, opinions and data contained in all publications are solely those of the individual author(s) and contributor(s) and not of MDPI and/or the editor(s). MDPI and/or the editor(s) disclaim responsibility for any injury to people or property resulting from any ideas, methods, instructions or products referred to in the content. |
© 2026 by the authors. Licensee MDPI, Basel, Switzerland. This article is an open access article distributed under the terms and conditions of the Creative Commons Attribution (CC BY) license.