


Abstract
Regenerative braking recovers vehicle kinetic energy during deceleration, but realised battery-side recovery depends on braking demand and battery charge-acceptance conditions. This study characterises real-world regenerative braking behaviour and evaluates a dual-output event-level estimator using the public Real-World Electric Vehicle Data: Driving and Charging dataset. Negative-current intervals from eight drive records were segmented into 8181 valid events using hysteresis, short-gap bridging, acquisition-dropout splitting, and long-stretch exclusion. The events recovered 288.7 kWh and returned 683.4 Ah; the median event recovered 19.7 Wh over 3.6 s, and the maximum observed peak regenerative power was 224.1 kW. Event duration and peak current showed the strongest associations with recovered energy (Spearman rho = 0.802 and 0.871, respectively), while SoC, temperature, and voltage showed weak direct global associations. The maximum peak power decreased to 155.53 kW in the 90–100% SoC band, which indicates a constrained high-SoC charge-acceptance envelope. A 10-input, 12-hidden-neuron, two-output feedforward neural network (158 parameters) was optimised using HPWOA and benchmarked against PSO, WOA, and SFSA. On the reported held-out event set, HPWOA achieved R2 = 0.9784 and RMSE = 1.839 Wh for recovered energy and R2 = 0.9819 and RMSE = 4.891 kW for peak power. The framework is interpreted as retrospective event-level estimation rather than prebraking forecasting.
1. Introduction
The transition towards hybrid electric vehicles (HEVs) and electric vehicles (EVs) has increased the importance of efficient energy management strategies in modern automotive systems. One of the most effective methods for improving vehicle energy efficiency is regenerative braking, which allows the traction motor to operate as a generator during deceleration [1,2]. Instead of converting all braking energy into heat through the friction braking system, regenerative braking converts part of the vehicle’s kinetic energy into electrical energy and stores it in the battery [3,4]. This process improves overall energy utilisation, reduces mechanical brake wear, and can extend the driving range of electrified vehicles, especially in urban driving conditions where frequent acceleration and braking occur [1,5]. Although regenerative braking offers significant energy-saving potential, the amount of energy recovered during braking is not fixed. Regenerative braking performance depends on several vehicle and battery operating conditions. These include vehicle speed, braking demand, motor-generator capability, battery state of charge, battery voltage, battery temperature, internal resistance, and the control limits imposed by the battery management system (BMS) [2,6]. Among these factors, battery operating condition is especially important because the battery must be able to safely accept the recovered energy during each braking event [7,8]. If the battery is already close to full charge, the available capacity for additional recovered energy becomes limited. As a result, the regenerative braking system may reduce the charging current or rely more heavily on mechanical braking to maintain safe battery operation [9,10]. Battery temperature also plays a major role in regenerative braking energy recovery. At low temperatures, battery internal resistance generally increases, which can reduce the battery’s ability to accept charge efficiently [11,12]. At high temperatures, the battery management system may restrict regenerative charging to avoid excessive heat generation and protect the battery from accelerated ageing or thermal stress [13,14]. Similarly, battery voltage affects the available electrical headroom for energy recovery. If the battery voltage is already high, the system may limit regenerative braking power to prevent overvoltage conditions [7,15]. Therefore, regenerative braking must be understood not only as a braking control problem but also as a battery-condition-dependent energy recovery process. Many existing studies on regenerative braking focus on control strategies, brake-force distribution, simulation-based energy savings, or the optimisation of braking performance [4,16,17]. These studies are important for improving regenerative braking system design. However, there remains a need for practical characterisation of how regenerative braking events behave under real battery operating-condition variations. In particular, it is important to quantify how recovered energy, peak regenerative power, returned charge, and event duration vary across different SoC, voltage, and temperature conditions [1,18]. This type of analysis can provide useful insight into the operating regions where regenerave energy recovery is strong, limited, or inconsistent. This study addresses that need through a data-driven event characterisation and estimation framework. Regenerative braking intervals are segmented from real-world drive records and transformed into an event-level database containing recovered energy, returned charge, regenerative power, current, duration, SoC, voltage, temperature, and seasonal context. The event database is analysed using descriptive statistics, correlation analysis, SoC–temperature stratification, charge-acceptance envelopes, seasonal comparison, and a compact dual-output neural estimator for recovered energy and peak regenerative power.
The main aim of this study is to establish an empirical understanding of regenerative braking energy recovery under battery operating-condition variations and to evaluate event-level dual-output estimation of recovered energy and peak regenerative power. The specific objectives are to identify valid regenerative braking events; quantify event-level recovery indicators; compare recovery behaviour across SoC, voltage, and temperature conditions; and benchmark HPWOA against standalone PSO, WOA, and SFSA under a common neural-network architecture. The following are the contributions of this study:
- A reproducible regenerative braking event segmentation framework is applied to real-world drive records to isolate physically meaningful negative-current recovery events.
- An event-level database of 8181 braking events is characterised using recovered energy, returned charge, regenerative power, current, SoC, voltage, temperature, and seasonal context.
- Battery charge-acceptance behaviour is quantified using SoC–temperature maps and peak-power envelopes to distinguish ordinary recovery behaviour from operating-limit effects.
- A compact dual-output feedforward neural network is evaluated for the simultaneous estimation of recovered energy and peak regenerative power, with HPWOA compared fairly against PSO, WOA, and SFSA under the same architecture and iteration budget.
- The reported results combine event-level physical interpretation, optimiser comparison, input-weight importance, and five-fold event-level robustness assessment while explicitly limiting claims to the available driving records.
The remainder of this article is organised as follows. Section 2 presents the dataset characterisation and related work. Section 3 describes event segmentation, event-level feature construction, the dual-output neural-network architecture, optimiser formulations, and evaluation metrics. Section 4 presents and discusses the computational results, including convergence, estimation accuracy, residual behaviour, feature-importance interpretation, and event-level cross-validation. Section 5 concludes the paper and identifies future research directions.
2. Dataset Characterisation and Related Work
2.1. Dataset Overview
The dataset used in this study is the Real-World Electric Vehicle Data: Driving and Charging dataset from the Stanford Energy Control Laboratory [19,20]. The analysis uses only the drive folders because the pack-current convention in these files is positive during acceleration or cruising and negative during braking. The charging folders are not used because the present paper focuses on in-drive regenerative braking rather than plug-in charging behaviour. Regenerative braking events are therefore defined as continuous negative-current intervals in which the traction machine operates in generator mode and electrical energy is returned to the battery pack. This structure makes the dataset suitable for event-level characterisation because each braking interval can be transformed from a raw time-series segment into a compact regenerative event record. Each event record contains the event duration, recovered energy, returned charge, peak regenerative power, mean regenerative power, peak regenerative current, mean regenerative current, mean battery voltage, start and mean state of charge, SoC change, mean temperature, and seasonal grouping. The processed event database therefore links the battery operating condition to the realised regenerative braking response. Figure 1 summarises the distributions of four core event quantities: recovered energy, peak regenerative power, returned charge, and event duration.
Figure 1.
Dataset overview showing regenerative braking event distributions for recovered energy, peak power, returned charge, and event duration.
Figure 1 provides a first overview of the event database by showing the distributions of the main regenerative braking quantities. The recovered-energy, returned-charge, peak-power, and event-duration distributions are right-skewed, which indicates that most events are short and low-to-moderate in magnitude, while a smaller number of events contribute disproportionately to the high-energy and high-power tail.
2.2. Regenerative Braking Variables and Event Quantity Definitions
Table 1 defines the main event quantities used in the proposed characterisation framework. The selected variables represent the information required to quantify the magnitude, intensity, electrical response, and battery operating condition of each regenerative braking event. Unlike a sample-level analysis, the event-level formulation allows each braking interval to be treated as one physically meaningful observation.
Table 1.
Event-level variables used for regenerative braking characterisation and dual-output estimation.
The main response variable is recovered_energy_wh because it directly measures the amount of useful electrical energy recovered from vehicle deceleration. The returned_charge_ah variable provides a complementary battery-charge perspective, while peak_power_kw and mean_power_kw describe the instantaneous and average regeneration intensity, respectively. The SoC, voltage and temperature variables are included because battery charge acceptance is not constant and may vary with electrical and thermal operating conditions.
2.3. Descriptive Statistics and Event Behaviour
The event distributions in Figure 1 show that regenerative braking is dominated by a large number of small events. Most recovered-energy values are concentrated below approximately 50 Wh, while the tail extends towards about 200 Wh. Returned charge follows the same general behaviour, with most events below approximately 0.10 Ah and a smaller tail approaching 0.50 Ah. Peak regenerative power is concentrated mostly between approximately 10 kW and 60 kW, although some high-power events approach 140 kW. Most event durations lie between approximately 2 s and 6 s, with only a small number of events extending beyond 15 s. This distributional behaviour is important because average performance alone may not describe the regenerative braking system adequately. A few high-intensity events can contribute substantially to total energy recovery, while many low-intensity events represent normal everyday braking. Therefore, both central behaviour and tail behaviour must be considered when characterising regenerative braking energy recovery. Table 2 shows that the output variables are unevenly distributed across regenerative braking events. Recovered energy and returned charge are concentrated at low values with long right-tailed distributions, which indicates that most events recover relatively little energy while a small number contribute substantially more. Peak regenerative power is generally moderate but includes occasional high-power events, which highlights their operational significance. Braking duration is typically short, which suggests that braking intensity has a greater influence on energy recovery than event length. In addition, seasonal variation is evident, with winter producing the highest average recovered energy and summer the lowest; this demonstrates that seasonal conditions should be considered in predictive modelling.
Table 2.
Distribution characteristics and interpretation of the regenerative braking output variables.
The output variables exhibit non-uniform distributions with noticeable skewness and variability. Most regenerative braking events recover relatively small amounts of energy and charge, whereas a limited number of high-magnitude events contribute substantially to the upper recovery tail. These characteristics justify analysing event descriptors together with battery operating-condition and seasonal context rather than relying on average values alone.
2.4. Correlation Analysis of Regenerative Event Quantities
The correlation matrix in Figure 2 presents pairwise Pearson coefficients to describe the linear association among the event quantities. Spearman rank coefficients are additionally reported in Table 3 and are used for the principal interpretation of associations with recovered energy because the event variables are strongly right-skewed and contain high-magnitude observations. Pearson and Spearman correlations are therefore complementary: Pearson quantifies linear association on the original measurement scale, whereas Spearman quantifies monotonic association using ranked values. Recovered energy and returned charge show a strong positive relationship, while peak power, mean power, peak current, and mean current form a strongly related electrical response group. Duration is positively associated with recovered energy and returned charge, which confirms that recovery depends on both event length and braking intensity. SoC and voltage variables form another related group, while temperature shows a weaker direct global association with the main event quantities.
Figure 2.
Pearson correlation matrix of the regenerative braking event quantities.
Table 3.
Correlation of battery conditions and kinematics with recovered energy and peak power.
The implication is that a predictive model should use braking event descriptors as primary explanatory variables. Battery condition should still be included but mainly as a limiting context that influences the envelope of allowable regenerative power rather than the average recovered energy of ordinary events.
2.5. SoC–Temperature Stratification of Recovered Energy
Recovered energy was further analysed by grouping events into SoC and temperature bands. This stratification is required because battery charge-acceptance capability depends on more than one operating condition. A battery at a specific SoC may accept regeneration differently depending on the temperature, voltage and current-limit behaviour. Figure 3 shows that recovered energy is not uniformly distributed across the SoC–temperature operating map.
Figure 3.
Mean recovered energy across SoC and temperature bands.
The strongest visible mean recovered energy occurs in the 50–60% SoC band and 10–15 °C temperature band, where the mean value is close to the upper colour scale, approximately 70 Wh. Lower-to-medium temperature bands generally show stronger recovery in several SoC regions. By contrast, the 20–25 °C temperature band shows lower recovery across many SoC bands, while higher SoC regions tend to show a weaker response at warmer temperature ranges. This result supports the central argument of this paper: regenerative braking energy recovery varies with combined battery operating-condition changes rather than with SoC or temperature alone.
2.6. Charge-Acceptance Capability Under SoC and Temperature Variation
The SoC-dependent charge-acceptance behaviour is shown in Figure 4 using mean peak regenerative power and the 95th-percentile peak regenerative power. The 95th-percentile curve represents the upper capability of the regenerative braking system under stronger braking events, while the mean curve represents typical event behaviour. The 95th-percentile peak power is highest in the lowest SoC band, near 110 kW, then reduces towards the 70–80% SoC band, where it is approximately 96 kW. A local increase appears in the 80–90% SoC band before the capability declines again in the 90–100% SoC band. The mean peak-power curve is lower and smoother than the 95th-percentile curve. The mean peak power is approximately in the low-to-mid 40 kW range at low SoC, decreases towards approximately 40 kW around 70–80% SoC, rises slightly in the 80–90% SoC band, and decreases at very high SoC. The result indicates that SoC influences charge acceptance, but the relationship is not strictly monotonic in the processed dataset. Braking demand, vehicle speed, temperature and voltage condition also affect observed regenerative power.
Figure 4.
Charge-acceptance capability using mean and 95th-percentile peak power versus SoC.
Figure 5 shows that the mean peak-power curve is the highest in the 10–15 °C band, at approximately 55 kW; decreases through the 15–20 °C and 20–25 °C bands; and reaches its lowest value near 38 kW in the 20–25 °C band. The value then increases again in the 25–30 °C and 30–45 °C temperature bands. The 95th-percentile peak-power curve shows a similar U-shaped pattern at a higher magnitude. It begins near 118 kW in the 10–15 °C band, decreases to approximately 95 kW in the 20–25 °C band, and rises above 110 kW in the 30–45 °C band. This non-linear trend indicates that temperature should not be treated as a simple linear predictor of regeneration capability. Instead, temperature should be interpreted together with SoC, voltage, route-dependent braking demand and possible thermal management behaviour. The corresponding numerical SoC-band acceptance envelope is reported in Table 4.
Figure 5.
Charge-acceptance capability as a function of temperature.
Table 4.
Regenerative peak-power acceptance envelope by SoC band.
2.7. Seasonal Variation in Recovered Energy
Seasonal variation provides an additional operating-context view. Figure 6 shows that winter has the highest mean recovered energy, at approximately 56 Wh. Autumn is lower, near 35 Wh, while summer has the lowest mean recovered energy, near 29 Wh. This seasonal trend indicates that environmental grouping may explain part of the variability in regenerative braking energy recovery. However, seasonal results should not be interpreted as temperature-only effects because season may also reflect route, traffic, driving intensity, SoC distribution and ambient-condition differences. To separate overlapping associations, a multivariable ridge model was fitted to log recovered energy using log duration, log peak current, start SoC, mean temperature, mean voltage, and season. As reported in Table 5, the non-seasonal variables explained R2 = 0.9535; adding season increased R2 by only 0.0004. The adjusted temperature coefficient was small, and the seasonal coefficients remained descriptive contrasts. Thus, temperature, SoC, voltage, braking demand, and season are associated within the sampled records, but the observational design does not identify causal effects. Season can also encode route, traffic, driver, and recording-period differences.
Figure 6.
Mean recovered energy by season.
Table 5.
Conditional association model for log recovered energy. Coefficients are adjusted associations, not causal effects.
2.8. State of the Art in Regenerative Braking Energy Recovery Characterisation
Regenerative braking systems are widely recognised as a key efficiency technology in hybrid and electric vehicles because they allow part of the vehicle kinetic energy during deceleration to be converted into electrical energy and stored in the battery. Recent reviews show that regenerative braking research has developed from basic energy-recuperation concepts towards advanced system design, brake-by-wire integration, in-wheel motor applications, hybrid energy-storage systems, predictive control, and intelligent optimisation methods [1,21,22]. This development is important for the present study because the objective is not only to confirm that regenerative braking can recover energy but also to quantify how the recovered energy varies under real battery operating conditions. The first group of studies focuses on vehicle-level energy recovery and braking-force distribution. Early EV and HEV research demonstrated that regenerative braking can improve energy efficiency by recovering part of the energy that would otherwise be dissipated as heat through the friction braking system [3,4]. Later studies extended the focus to electrically controlled braking systems and cooperative braking control, where regenerative braking and mechanical friction braking are coordinated to meet deceleration demand while maintaining braking stability, drivability, and safety [4,5]. More recent optimisation-based studies have introduced fuzzy logic and metaheuristic search to improve braking-energy recovery while considering vehicle and battery constraints [23,24,25,26,27,28,29,30]. However, many of these control-focused studies emphasise strategy design, simulation performance, or cycle-level recovery results, while less attention is given to the event-level statistical behaviour of real regenerative braking events. A second group of studies examines regenerative braking from the perspective of intelligent control. Modern reviews report a clear shift from rule-based and PID-type approaches towards model predictive control, fuzzy control, machine learning, reinforcement learning, and hybrid artificial intelligence methods [1,21,22]. These approaches are valuable because regenerative braking is influenced by several interacting variables, including vehicle speed, braking demand, motor-generator capability, battery state of charge, battery voltage, battery temperature, and system-level current limits. Nevertheless, intelligent control methods require a reliable empirical foundation. Before a predictive or adaptive regenerative braking controller can be developed, the researcher must first understand how real braking events are distributed, which operating conditions produce high energy recovery, and which battery conditions lead to reduced charge acceptance.
A third group of studies focuses on battery operating constraints. Regenerative braking is physically limited by the battery’s ability to accept charge during short deceleration intervals. The battery management literature shows that SoC estimation, voltage monitoring, current limitation, temperature protection, cell balancing, and safety supervision are core BMS functions [8,9,10,14]. Thermal management studies further show that lithium-ion battery performance, safety, and lifetime depend strongly on temperature, because both low-temperature and high-temperature conditions can affect internal resistance, charge acceptance, degradation rate, and protection limits [12,18,31,32,33]. These findings justify the SoC–temperature analysis performed in the present study. Regenerative braking should therefore not be interpreted only as a vehicle dynamics problem. It must also be interpreted as a battery charge-acceptance problem. The supplied event-level results support this battery-aware perspective. The SoC–temperature heatmap shows that the mean recovered energy is not uniform across the operating map. Some SoC–temperature combinations produce relatively high mean recovered energy, while others show lower recovery values. Similarly, the charge-acceptance plots show that peak regenerative power varies across both SoC and temperature bands. This means that a single average recovered-energy value is insufficient for describing regenerative braking performance. A condition-based map is more useful because it identifies operating regions where the battery and vehicle system allow stronger regeneration and regions where energy recovery appears more limited.
Another important research direction is event-level distribution analysis. Many regenerative braking studies report cycle-level energy recovery rates or control-strategy performance, but event-level data reveal heterogeneity that cycle averages can obscure. In the present dataset, recovered energy, returned charge, and event duration are strongly right-skewed: many events recover small amounts of energy, while a smaller number of high-magnitude events contribute substantially to the upper tail. This distributional perspective supports separate consideration of ordinary braking behaviour and rare high-magnitude events without introducing an additional unsupervised partition. Despite the progress in regenerative braking control and battery management, three limitations remain in the existing literature. First, many studies evaluate regenerative braking at the vehicle-cycle level, which makes it difficult to observe the behaviour of individual braking events. Second, several control-oriented studies rely on modelled or simulated scenarios, while real driving data may contain irregular braking durations, route effects, seasonal variation, and unusual outliers. Third, battery operating conditions are often included as control constraints, but they are not always analysed directly through SoC–temperature event maps. The present study addresses these limitations by developing an empirical event characterisation framework based on regenerative event segmentation, descriptive statistics, correlation analysis, SoC–temperature recovery mapping, charge-acceptance plots, and seasonal comparison.
The positioning of the existing literature and the proposed study is summarised in Table 6.
Table 6.
Positioning of existing work and proposed study.
This gap is important because regenerative braking is not only a vehicle-deceleration problem. It is also a battery charge-acceptance problem in which realised recovery depends on braking demand, electrical limits, and battery operating condition. The present study therefore combines event segmentation, descriptive statistics, correlation analysis, SoC–temperature stratification, seasonal analysis, and dual-output event-level estimation to establish an empirical basis for later regenerative braking control development.
3. Materials and Methods
To improve methodological clarity and reproducibility, the regenerative braking energy recovery framework is organised as a structured workflow comprising drive-signal preprocessing, regenerative event segmentation, event-level quantity extraction, battery operating-condition tagging, descriptive and correlation analysis, charge-acceptance envelope analysis, dual-output neural-network estimation, and robustness evaluation. This structure keeps the physical event calculations separate from the subsequent estimator training and ensures that each reported quantity can be traced to either the source telemetry or the defined model outputs. Figure 7 presents the complete regenerative braking characterisation workflow from raw drive records to event-level statistical interpretation. Figure 8 illustrates the negative-current segmentation process used to isolate individual regenerative braking events. Figure 9 summarises the event-level problem formulation, battery-side calculations, condition tagging, and analytical outputs.
Figure 7.
Regenerative braking energy recovery characterisation workflow.
Figure 8.
Negative-current segmentation procedure for valid regenerative braking event extraction.
Figure 9.
Event-level regenerative braking problem formulation and battery-condition analysis pipeline.
3.1. Event Segmentation, Feature Construction, Data Partitioning, and Normalisation
The complete event database contains 8181 regenerative braking events extracted from the eight real-world drive records. Candidate regenerative intervals are identified from negative battery-pack current during vehicle operation. The supplied segmentation protocol applies current hysteresis to avoid threshold chattering, bridges short non-propulsion gaps within a braking event, splits intervals at acquisition dropouts, and excludes implausibly long nonbraking negative-current stretches. Each retained interval is treated as one event. Battery-side power, recovered energy, and returned charge are calculated from the synchronised voltage–current–time signals, and each event is tagged with SoC, temperature, voltage, and seasonal context. For the reported neural-network evaluation, the event database is partitioned at the event level using an 80:20 training/test ratio. Because the split is event-based rather than drive-disjoint, the resulting metrics quantify within-dataset event-level estimation and are not interpreted as cross-route, cross-trip, or cross-vehicle generalisation. The numerical event segmentation settings are now stated explicitly in Table 7. A candidate interval begins when pack current is below −1 A and is retained only when its regenerative-current peak reaches at least 8 A. Non-propulsion interruptions of at most 2 s are bridged, internal timestamp gaps above 5 s split candidates, and negative-current stretches longer than 120 s are excluded. The −1 A boundary suppresses near-zero sensor chatter, the 8 A core criterion rejects weak fluctuations, the 2 s bridge preserves brief interruptions within one braking action, the 5 s rule prevents integration across acquisition dropouts, and the 120 s ceiling excludes intervals inconsistent with ordinary braking. These values were selected from signal-noise, sampling-continuity, and event-plausibility considerations and were then challenged by the one-factor sensitivity experiment presented in Table 8.
Table 7.
Event segmentation parameters, numerical values, and selection basis.
Table 8.
One-factor segmentation sensitivity recomputed from all eight raw drive records.
The first equation is Equation (1):
where each row represents one regenerative braking event and each column represents one input feature. The 10-input feature space comprises event duration, peak regenerative current, mean regenerative current, mean battery-pack voltage, mean regenerative power, start SoC, mean SoC, SoC change, mean battery temperature, and seasonal grouping. These quantities are event-derived descriptors. Consequently, the neural model is used for retrospective event-level estimation/soft sensing after event segmentation rather than for prebraking forecasting:
where denotes the recovered regenerative braking energy target for event and denotes the peak regenerative power target for event. The dual-output formulation is used because recovered energy and peak regenerative power describe two physically connected aspects of the same braking event: recovered energy represents the cumulative battery-side benefit, while peak regenerative power represents the instantaneous charge-acceptance demand imposed on the battery. Before model training, all input and output variables are scaled using min–max normalisation. This is required because the event features have different units and numerical ranges, for example, seconds, amperes, volts, percentage SoC, degrees Celsius, watt-hours, ampere-hours, and kilowatts. Normalisation improves numerical stability and prevents high-magnitude variables, such as current or recovered energy, from dominating the optimisation process. For a generic variable, the normalised value is computed as
where and are calculated from the training set only. The same training-set normalisation parameters are then applied to the test set to avoid using test-set scaling information. After prediction, the normalised outputs are transformed back into their original physical units so that recovered energy is reported in watt-hours and peak regenerative power is reported in kilowatts.
3.2. Dual-Output Feedforward Neural-Network Architecture
The event-level estimation model is a compact dual-output feedforward neural network (DO-FNN) developed to estimate two physically connected regenerative braking responses from the same event-level and battery-condition feature space. The architecture contains ten input neurons, twelve hidden neurons with rectified linear unit (ReLU) activation, and two output neurons with sigmoid activation. The two output neurons simultaneously estimate the normalised recovered regenerative braking energy and the normalised peak regenerative power. These two outputs are selected because recovered energy represents the cumulative battery-side benefit of a braking event, while peak regenerative power represents the instantaneous charge-acceptance demand imposed on the battery during regeneration. Let, and denote the number of input, hidden, and output neurons, respectively. The complete trainable parameter vector is written as. The feedforward formulation follows standard neural-network principles [34]:
where is the input-to-hidden weight matrix, is the hidden-layer bias vector, is the hidden-to-output weight matrix, and is the output-layer bias vector. The total number of trainable parameters is
which gives
Therefore, the optimisation problem is defined over a continuous 158-dimensional search space:
For an input matrix , the hidden-layer activation is computed as
where the ReLU activation function is defined as
The output layer is then computed as
where the two normalised outputs represent predicted recovered regenerative braking energy and predicted peak regenerative power, respectively, and the sigmoid activation maps each normalised output to the interval [0, 1].
The sigmoid output activation is appropriate because both target variables are min–max normalised to the interval . After prediction, the normalised outputs are transformed back into their original physical units using inverse min–max transformation. The recovered-energy output is converted back to watt-hours (Wh), while the peak-power output is converted back to kilowatts (kW). This allows the final prediction results to be interpreted in practical battery-side regenerative braking terms.
3.3. Continuous Search Space and Optimisation Constraints
All optimisation algorithms operate on the same continuous neural-network weight vector . To maintain a fair comparison, PSO, WOA, SFSA, and the proposed HPWOA use the same dual-output feedforward neural-network architecture, the same regenerative braking training set, the same normalised input–output feature space, the same fitness function, and the same total number of optimisation iterations. This ensures that any performance difference between the algorithms is caused by the search behaviour of the optimiser rather than by differences in model structure or data preparation.
In this study, each candidate solution represents one complete set of neural-network weights and biases for estimating the two regenerative braking outputs, namely, recovered regenerative energy and peak regenerative power. The recovered-energy output represents the cumulative energy returned to the battery during a braking event, while the peak-power output represents the instantaneous battery charge-acceptance demand during the same event. The initial population is generated uniformly as
During optimisation, all neural-network weight and bias components are constrained to the interval [−3, 3]. The population is initialised within [−1, 1], while the wider feasible interval allows for movement beyond the initial range without permitting extreme parameters that may produce poorly conditioned hidden-layer responses or saturate the sigmoid output neurons. The same bounds are applied to all optimisers to provide a common search domain. For PSO-based updates, particle velocity is limited to [−0.5, 0.5], corresponding to one-sixth of the total parameter search width. This restriction limits abrupt movement and reduces overshooting of promising regions. These bounds were selected as stable empirical implementation settings during preliminary trials and are not claimed to be universally optimal.
This constraint prevents extreme weight values from producing unstable hidden-layer activations or forcing the sigmoid output neurons into saturation. This is important because both regenerative braking targets are min–max normalised to the interval , and saturated sigmoid outputs would reduce sensitivity to changes in recovered energy and peak regenerative power. For PSO-based updates, particle velocities are additionally clipped to
where is the velocity of the -th parameter of particle . Velocity clipping prevents particles from moving too aggressively through the search space, which improves numerical stability and reduces the probability of overshooting promising regions. This is especially important for the regenerative braking event database because the target variables are right-skewed, with many low-energy events and a smaller number of high-intensity braking events.
3.4. Particle Swarm Optimisation
Particle swarm optimisation (PSO) [35] is used as a standalone benchmark optimiser and as the first phase of the proposed HPWOA training strategy. In the regenerative braking prediction framework, each particle represents one candidate neural-network weight vector. This weight vector contains the complete set of trainable parameters of the dual-output feedforward neural network used to estimate the normalised recovered regenerative braking energy and normalised peak regenerative power. The use of PSO allows the search process to explore the continuous neural-network parameter space by allowing candidate solutions to move according to both individual learning and population-level learning. In PSO, each particle updates its position based on three components: its previous velocity, its own best historical solution, and the best global solution found by the full swarm. The velocity of particle at iteration is updated as
where is the particle velocity at iteration ; is the inertia weight; and are the cognitive and social acceleration coefficients, respectively; and are random values sampled from the interval ; is the personal-best position of particle ; and is the global-best position found by the swarm. The inertia term maintains search momentum, the cognitive term encourages the particle to return towards its own best solution, and the social term attracts the particle towards the best solution found by the population. The particle position is then updated as
where is the updated candidate neural-network weight vector. After each update, the weight vector is clipped to remain within the predefined bounds , and the particle velocity is clipped to the interval . These constraints prevent excessive movement through the search space and reduce the risk of unstable hidden-layer activations or saturated sigmoid outputs. In this study, PSO uses a population size of
an inertia weight of
and acceleration coefficients of
For the standalone PSO benchmark, the algorithm runs for 150 iterations. For the proposed HPWOA approach, PSO is used only during Phase I, corresponding to iterations 1 to 75. During this first phase, PSO rapidly guides the population towards promising regions of the 158-dimensional search space. The best weight vector obtained at the end of the PSO phase is then transferred to the WOA phase for further refinement.
3.5. Whale Optimisation Algorithm
The whale optimisation algorithm (WOA) [36] is used as a standalone benchmark optimiser and as the second phase of the proposed HPWOA training strategy. In the regenerative braking dual-output estimation framework, each whale represents one candidate neural-network weight vector. This candidate solution contains the complete set of weights and biases of the dual-output feedforward neural network used to estimate recovered regenerative braking energy and peak regenerative power. WOA updates candidate solutions using three main search mechanisms: encircling prey, spiral bubble-net exploitation, and random prey search. These mechanisms allow the population to balance exploitation around the current best solution with exploration of other regions of the continuous neural-network search space. In this study, WOA is used to refine candidate solutions after the PSO phase has identified a promising region of the search space. This is useful because the regenerative braking event database contains strongly variable event behaviour, with many low-energy braking events and fewer high-intensity events that contribute disproportionately to recovered energy and peak power. The encircling mechanism is defined as
where is the current leader whale, representing the best neural-network weight vector found up to iteration , is a random number, and decreases linearly from 2 to 0 across the iteration sequence. The coefficient controls whether the algorithm performs exploitation near the current best solution or exploration away from it, while introduces random weighting around the leader solution. The spiral bubble-net update is defined as
where is the spiral-shape constant and is a random number. The spiral update allows the candidate solution to move around the current leader in a shrinking spiral pattern. In the regenerative braking prediction problem, this helps refine the neural-network weights around promising solutions that produce lower prediction error for both recovered energy and peak regenerative power. If , WOA performs random prey search using a randomly selected whale . This mechanism is expressed as
The random prey search allows the algorithm to explore regions away from the current leader, which reduces the risk of premature convergence. This is particularly important for the regenerative braking estimation problem because the output variables are non-uniformly distributed and right-skewed. The optimiser must therefore learn both ordinary low-to-moderate braking events and less frequent high-intensity braking events that influence the upper energy and peak-power response.
3.6. Stochastic Fractal Search Algorithm
Stochastic Fractal Search Algorithm (SFSA) [37] is included as a third benchmark optimiser to provide an additional comparison against PSO, WOA, and the proposed HPWOA training strategy. In the regenerative braking dual-output estimation framework, each SFSA individual represents one candidate neural-network parameter vector. This vector contains the complete set of weights and biases of the dual-output feedforward neural network used to estimate the normalised recovered regenerative braking energy and normalised peak regenerative power. SFSA explores the continuous neural-network search space using a diffusion-based search mechanism. The algorithm generates new candidate solutions through Gaussian perturbations around the current solution and the best solution found so far. This allows the search process to explore nearby regions of the parameter space while still being guided by the current global-best solution. This behaviour is useful for the regenerative braking prediction problem because the event database contains highly variable braking events, including many low-energy events and a smaller number of high-intensity events that strongly influence recovered energy and peak regenerative power. For individual , a Gaussian diffusion candidate can be expressed as
where is the current candidate neural-network parameter vector of individual at iteration , is the Gaussian walk ratio, denotes a standard normal random variable, and is the current global-best solution. The term guides the diffusion process towards the best solution found so far, while the Gaussian random component introduces stochastic variation to maintain exploration. In this study, the Gaussian walk ratio was selected through a preliminary sensitivity analysis using . All settings were evaluated under the same data partition, population size, diffusion count, and iteration budget. The value of provided the most favourable balance between combined validation error and search stability and was therefore retained for the principal comparison.
Five diffusion candidates are generated per individual at each iteration. Each diffusion candidate is decoded into the corresponding neural-network weight matrices and bias vectors, after which the dual-output model is evaluated using the combined mean-square-error fitness function. The candidate with the lowest combined MSE fitness is retained for the next iteration. SFSA is used only as a standalone benchmark optimiser. Its purpose is to test whether a diffusion-based stochastic search strategy can achieve competitive performance when optimising the same regenerative braking dual-output neural-network architecture. The same training set, normalised feature space, search space dimension, weight bounds, fitness function, and iteration budget are used for SFSA, PSO, WOA, and HPWOA to ensure a fair comparison. Therefore, any difference in predictive performance can be attributed to the optimiser search behaviour rather than to differences in model configuration.
3.7. Proposed HPWOA Training Strategy
The proposed hybrid particle swarm optimisation and whale optimisation algorithm (HPWOA) combines the fast convergence capability of PSO with the refinement and global search capability of WOA. The first 75 iterations use PSO to accelerate the search towards a promising region of the continuous neural-network parameter space. The remaining 75 iterations use WOA to refine the solution around the best candidate identified during the PSO phase. This two-phase structure is used to optimise the complete 158-dimensional weight vector of the dual-output feedforward neural network. In the regenerative braking estimation framework, the optimised neural network simultaneously estimates two physically related outputs: recovered regenerative braking energy and peak regenerative power. The recovered-energy output represents the cumulative battery-side energy returned during a braking event, while the peak-power output represents the instantaneous charge-acceptance demand imposed on the battery during regeneration. These two outputs are modelled together because the event database shows that regenerative braking performance is influenced by both braking event intensity and battery operating conditions. Let denote the best solution obtained at the end of Phase I. At the transition point, the WOA leader is initialised as
The complete HPWOA training strategy is therefore defined as
where is the optimised neural-network parameter vector. This structure allows the WOA phase to begin from the strongest PSO solution rather than from a randomly initialised population. As a result, the proposed HPWOA strategy reduces convergence delay, improves solution refinement, and increases the probability of obtaining a lower combined prediction error for recovered energy and peak regenerative power. During Phase I, PSO guides the population using inertia, personal-best memory, and global-best attraction. This allows the optimiser to move quickly towards a promising region of the 158-dimensional search space. During Phase II, WOA refines the search using encircling, spiral bubble-net exploitation, and random prey search mechanisms. This improves the ability of the optimiser to escape premature convergence and search around high-quality candidate solutions. The same neural-network architecture, training set, normalised feature space, fitness function, search space bounds, and iteration budget are used for PSO, WOA, SFSA, and HPWOA. Therefore, the comparison between optimisers remains fair and reproducible. Table 9 summarises the control parameters used for the proposed HPWOA and benchmark algorithms.
Table 9.
Control parameters of HPWOA and benchmark algorithms.
3.8. Dual-Output Fitness Function
The optimisation objective is to minimise the combined prediction error over both regenerative braking target variables on the training set. Because both outputs are normalised to the interval , an equal-weight combined mean-square-error fitness function is used. The two outputs are recovered regenerative braking energy and peak regenerative power, which represent the cumulative battery-side energy benefit and the instantaneous regenerative charge-acceptance demand of each braking event, respectively.
The recovered-energy MSE is defined as
and the peak-regenerative-power MSE is defined as
Here, and are the normalised DO-FNN predictions for recovered regenerative braking energy and peak regenerative power, respectively, for event , while and are the corresponding normalised ground-truth values. The term denotes the number of training events used during optimiser fitness evaluation. Equal weighting is used because both output variables are normalised to the same range and represent complementary aspects of regenerative braking performance. Recovered energy describes the total useful energy returned to the battery during a braking event, while peak regenerative power describes the highest instantaneous power accepted by the battery during that event. Therefore, the fitness function encourages the optimiser to learn a neural-network weight vector that performs well for both event-level energy recovery and battery charge-acceptance intensity.
3.9. Algorithmic Implementation
Algorithm 1 presents the complete HPWOA-based dual-output neural-network training procedure for regenerative braking energy recovery estimation. The same neural-network architecture, normalised input–output feature space, search space dimension, and combined fitness function are used for PSO, WOA, SFSA, and HPWOA to ensure a fair comparison. In the proposed framework, the dual-output feedforward neural network estimates two physically connected battery-side outputs: recovered regenerative braking energy and peak regenerative power. Recovered energy represents the cumulative amount of electrical energy returned to the battery during a braking event, while peak regenerative power represents the maximum instantaneous charge-acceptance demand during the same event.
| Algorithm 1 HPWOA-based dual-output neural-network training procedure for regenerative braking estimation. | |
| Step | Procedure |
| Input | Training inputs training targets population size maximum iterations and neural-network dimension |
| Output | Optimised weight vector and trained DO-FNN model. |
| 1 | Normalise and using min–max scaling. |
| 2 | Initialise a population of candidate weight vectors: where |
| 3 | Initialise PSO velocities: |
| 4 | Evaluate the initial fitness for all particles using Equation (28). |
| 5 | Set each personal best as |
| 6 | Set the global best as the candidate with the lowest fitness. |
| 7 | For to execute the PSO phase. |
| 7.1 | Update particle velocity using Equation (15). |
| 7.2 | Clip velocity using Equation (14). |
| 7.3 | Update particle position using Equation (16). |
| 7.4 | Clip weights using Equation (13). |
| 7.5 | Decode into and |
| 7.6 | Compute DO-FNN predictions using Equations (8)–(10). |
| 7.7 | Evaluate using Equation (28). |
| 7.8 | Update the personal best if the current fitness improves. |
| 7.9 | Update the global best if the current candidate gives the lowest fitness. |
| 8 | Set the phase-transition solution as |
| 9 | Initialise the WOA leader using |
| 10 | For to execute the WOA phase. |
| 10.1 | Update the WOA control coefficient linearly from to |
| 10.2 | For each whale compute and using Equations (17) and (18). |
| 10.3 | If and ∣A∣ < 1: |
| 10.4 | If and ∣A∣ ≥ 1: |
| 10.5 | If : update the whale using the spiral bubble-net equation. |
| 10.6 | Clip weights using Equation (13). |
| 10.7 | Decode each candidate into and |
| 10.8 | Compute DO-FNN predictions using Equations (8)–(10). |
| 10.9 | Evaluate the combined fitness using Equation (28). |
| 10.10 | Update the leader if a lower fitness value is found. |
| 11 | Return the final optimised solution |
| 12 | Use to evaluate the trained DO-FNN on the held-out test set. |
Algorithm 2 summarises the evaluation procedure used after optimisation. During test-set evaluation, the optimised weight vector is fixed and no further training is performed. The test inputs are normalised using the training-set normalisation parameters, and the predicted outputs are inverse-transformed back into physical units. This ensures that the reported errors can be interpreted directly as recovered-energy error in watt-hours and peak-power error in kilowatts.
| Algorithm 2 Test-set evaluation procedure |
Input: Test inputs , test targets , optimised weight vector . Output: Test-set MSE, RMSE, MAE, , and MAPE for both outputs.
|
3.10. Performance Evaluation Metrics
After optimisation, all trained models are evaluated on the held-out test set after applying inverse min–max transformation to return the predicted outputs to their original physical units. This ensures that the final model performance is reported in engineering units rather than normalised values. For the regenerative braking dual-output problem, the two evaluated outputs are recovered regenerative braking energy and peak regenerative power. Recovered energy is reported in watt-hours (Wh), while peak regenerative power is reported in kilowatts (kW). These two outputs represent the cumulative battery-side energy returned during a braking event and the maximum instantaneous regenerative power accepted during the same event, respectively. For each output variable , the mean-square error is computed as
The root-mean-square error is
The mean absolute error is
The coefficient of determination is
The mean absolute percentage error is
where is the measured value of output for test event , is the corresponding predicted value, is the mean measured value of output on the test set, and is the number of held-out test events. For recovered-energy estimation, , and the metrics are reported in Wh-based units. In this case, is reported in , while and are reported in Wh. For peak regenerative-power estimation, , and the metrics are reported in kW-based units. In this case, is reported in , while and are reported in kW. The combined convergence MSE in Equation (28) is used only for training-phase optimisation and convergence comparison. By contrast, the five test-set metrics in Equations (31)–(35) are used for final predictive-performance comparison after inverse transformation to physical units. This separation prevents the normalised training fitness from being confused with the physically interpretable test-set performance. It also ensures that the final results can be interpreted directly in relation to regenerative braking energy recovery and battery charge-acceptance behaviour.
4. Results and Discussion
This section presents and interprets the computational results obtained from the HPWOA-optimised dual-output feedforward neural network and the three benchmark optimisers, PSO, WOA, and SFSA. The evaluation covers optimiser convergence, recovered-energy estimation, peak-regenerative-power estimation, residual behaviour, multi-metric comparison, event-level tracking, input-weight importance, and five-fold event-level robustness. The emphasis is on the reported evidence in the supplied event database; no claim of cross-vehicle or prebraking forecasting performance is made. The proposed method estimates two physically connected regenerative braking outputs: recovered regenerative braking energy and peak regenerative power. Recovered energy represents the cumulative amount of electrical energy returned to the battery during a braking event, while peak regenerative power represents the maximum instantaneous charge-acceptance demand imposed on the battery during the same event. Therefore, the results are interpreted from both an energy recovery perspective and a battery charge-acceptance perspective.
4.1. Convergence Analysis
Figure 10 presents the combined training MSE convergence curves for HPWOA, PSO, WOA, and SFSA over 150 iterations. The convergence analysis evaluates the ability of each optimiser to minimise the combined dual-output training error for recovered regenerative braking energy and peak regenerative power. HPWOA achieved the lowest final training MSE of 0.002087, compared with 0.004719 for PSO, 0.004305 for WOA, and 0.019350 for SFSA. Relative to SFSA, this corresponds to an 89.2% reduction in final training error relative to SFSA, while PSO and WOA achieved reductions of 75.6% and 77.8%, respectively. The HPWOA convergence profile shows the reported two-phase behaviour. During Phase I, corresponding to PSO over iterations 1–75, the optimiser rapidly moves towards a low-error region of the neural-network search space. This early-stage convergence is driven by the PSO velocity-update mechanism, where each particle is guided by both its personal-best position and the global-best solution found by the swarm. At the end of Phase I, the strongest PSO solution is transferred to the WOA phase as the initial leader solution. During Phase II, corresponding to WOA over iterations 76–150, the search continues with refinement around the transferred best solution. This transition reduces the convergence delay normally associated with independently initialised WOA. By contrast, standalone WOA converges more slowly and reaches a higher final training-error plateau. SFSA shows the slowest and least stable convergence behaviour, which suggests that its Gaussian diffusion-based exploration is less effective for the precise optimisation of the compact but high-dimensional 158-parameter neural-network weight vector. From a regenerative braking perspective, the lower combined MSE achieved by HPWOA indicates that the hybrid optimiser provides a better fit across both model outputs. This is important because recovered energy and peak regenerative power represent two complementary aspects of the same braking event. Recovered energy describes the cumulative electrical energy returned to the battery, while peak regenerative power describes the maximum instantaneous charge-acceptance demand imposed during braking.
Figure 10.
Combined training MSE convergence of HPWOA, PSO, WOA, and SFSA over 150 iterations. The HPWOA curve shows the two-phase optimisation behaviour, where PSO provides rapid early convergence during iterations 1–75 and WOA provides refinement during iterations 76–150.
The results in Table 10 confirm that HPWOA produces the lowest training error among all the optimisation algorithms. WOA achieved a slightly lower final MSE than standalone PSO, whereas PSO reached its approximate convergence point earlier. The reduction from the standalone PSO value of 0.004719 to 0.002087 shows that the WOA refinement phase contributes meaningful improvement after the PSO phase has located a strong candidate region. This supports the central design assumption of the proposed framework: PSO is effective for rapid convergence, while WOA improves later-stage refinement.
Table 10.
Convergence comparison based on combined training MSE.
4.2. Recovered-Energy Estimation Performance
Table 11 reports the held-out event-level performance for the recovered regenerative braking energy estimation. HPWOA achieved the lowest error, with MSE = 3.381 Wh2, RMSE = 1.839 Wh, MAE = 1.458 Wh, and R2 = 0.9784. WOA was the second-best standalone optimiser (R2 = 0.9577; RMSE = 2.571 Wh), followed by PSO (R2 = 0.9485; RMSE = 2.838 Wh) and SFSA (R2 = 0.7668; RMSE = 6.039 Wh). These values quantify the event-level estimation on the reported hold-out split. The value of 0.9784 shows that the HPWOA-optimised model explains most of the variance in recovered regenerative braking energy on the held-out test set. Relative to PSO, HPWOA increases R2 by 0.0299. Relative to WOA and SFSA, the improvements are 0.0207 and 0.2116, respectively. The RMSE reduction is also practically meaningful: HPWOA reduces the recovered-energy estimation RMSE by 35.2% relative to PSO, 28.5% relative to WOA, and 69.5% relative to SFSA. These results indicate that HPWOA is more effective at learning the non-linear relationship between regenerative braking event descriptors and battery-side recovered energy. This is important because recovered energy depends on braking duration, current intensity, voltage level, and battery operating conditions such as SoC and temperature. The superior HPWOA performance therefore suggests that the hybrid PSO-WOA search strategy provides a better optimised neural-network weight vector for event-level energy recovery estimation.
Table 11.
Test-set metrics for recovered regenerative braking energy estimation.
Figure 11 compares predicted and measured recovered-energy values for the four optimisers. The HPWOA points lie closest to the one-to-one line across the displayed energy range, while WOA and PSO show greater dispersion and SFSA exhibits the widest deviations, particularly among low-to-moderate energy events. The visual pattern is consistent with the error metrics in Table 11.
Figure 11.
Predicted versus measured recovered regenerative braking energy for HPWOA, PSO, WOA, and SFSA on the held-out test set. The ideal reference line represents perfect prediction.
4.3. Peak-Regenerative-Power Estimation Performance
Table 12 reports the held-out event-level results for peak regenerative-power estimation. HPWOA again achieved the lowest error, with MSE = 23.92 kW2, RMSE = 4.891 kW, MAE = 4.103 kW, and R2 = 0.9819. WOA was the second-best standalone optimiser (R2 = 0.9525; RMSE = 7.925 kW), followed by PSO (R2 = 0.9415; RMSE = 8.794 kW) and SFSA (R2 = 0.8202; RMSE = 15.413 kW). The peak-power estimation results are particularly important because peak regenerative power is directly linked to the battery’s instantaneous charge-acceptance capability during braking. While recovered energy represents the cumulative benefit of a braking event, peak regenerative power reflects the maximum electrical stress imposed on the battery pack during regeneration. Therefore, accurate peak-power estimation is useful for battery management system calibration, regenerative braking limit prediction, thermal management planning, and BMS-aware control development. The HPWOA model reduces RMSE by 44.4% relative to PSO, 38.3% relative to WOA, and 68.3% relative to SFSA. This shows that the proposed hybrid optimiser does not improve only the recovered-energy output at the expense of the second output. Instead, it improves both physically connected regenerative braking outputs simultaneously. This is important because a reliable regenerative braking prediction framework must estimate both the total energy returned to the battery and the instantaneous peak-power demand imposed during the braking event.
Table 12.
Test-set metrics for peak-regenerative-power estimation.
Figure 12 compares predicted and measured peak regenerative power. HPWOA shows the tightest visual agreement with the one-to-one line. WOA and PSO show a wider but still coherent dispersion, while SFSA exhibits the largest deviations. This ordering is consistent with the R2 and RMSE values in Table 12.
Figure 12.
Predicted versus measured peak regenerative power for HPWOA, PSO, WOA, and SFSA on the held-out test set. The ideal reference line represents perfect prediction.
4.4. Residual Analysis
The residual plots in Figure 13 provide an additional diagnostic view of HPWOA. Recovered-energy residuals are distributed on both sides of zero, with most displayed errors within approximately ±4 Wh and a small number of larger deviations. Peak-power residuals are likewise centred around zero overall but exhibit a wider spread and isolated high-magnitude errors. The absence of a single dominant residual sign in the displayed points provides no obvious visual evidence of systematic one-directional bias.
Figure 13.
HPWOA residual plots for the two predicted regenerative braking outputs: (a) recovered regenerative braking energy and (b) peak regenerative power. Residuals are computed as measured value minus predicted value.
The wider peak-power residual spread occurs primarily among higher-intensity events, which involve larger current magnitudes and stronger instantaneous battery-side power demands. These events are less frequent in the database and therefore warrant separate operating-condition interpretation. Residual analysis is important because low aggregate error values can sometimes hide systematic overprediction or underprediction. For example, a model may achieve a low RMSE while still consistently underestimating high-energy braking events or overestimating peak-power events near battery operating limits. In this case, the HPWOA residual pattern supports the numerical results in Table 11 and Table 12. The residuals do not indicate a dominant directional bias, which suggests that the model is learning the shared relationship between braking event characteristics, battery operating conditions, recovered energy, and peak regenerative power. The residual patterns are interpreted together with the aggregate metrics rather than as independent proof of model superiority. Recovered energy and peak regenerative power are physically related but describe cumulative and instantaneous aspects of the same event, respectively; the two residual panels therefore provide complementary diagnostics of the shared model representation.
4.5. Comprehensive Metric Comparison
Figure 14 presents a comprehensive visual comparison of the regression metrics across all four optimisation algorithms and both regenerative braking outputs. The results confirm the same ranking observed in the tabulated metrics: HPWOA performs the best, followed by WOA, PSO, and SFSA. This ranking remains consistent for MSE, RMSE, MAE, R2, and MAPE, which indicates that the observed improvement is not dependent on a single performance metric. For recovered regenerative braking energy estimation, HPWOA produces the smallest MSE, RMSE, and MAE while also achieving the highest . This confirms that the proposed hybrid optimiser provides the most accurate prediction of the cumulative battery-side energy returned during braking events. For peak regenerative-power estimation, the same pattern is observed, showing that HPWOA also provides the strongest prediction of the maximum instantaneous regenerative power accepted by the battery during each event.
Figure 14.
Comprehensive comparison of regression metrics for recovered regenerative braking energy and peak regenerative power across HPWOA, PSO, WOA, and SFSA. The comparison includes MSE, RMSE, MAE, R2, and MAPE for each output.
This dual-output consistency is important because the model is intended to estimate two physically connected regenerative braking quantities simultaneously. A useful dual-output model must maintain high accuracy for both outputs rather than improving only the easier target. Recovered energy represents the total energy benefit of braking, while peak regenerative power represents the charge-acceptance demand imposed on the battery. Therefore, the strong performance across both outputs confirms that the HPWOA-optimised model captures both the cumulative recovery behaviour and the instantaneous power response behaviour of regenerative braking events.
4.6. Sequential Event Prediction Analysis
Figure 15 shows the sequential prediction behaviour of all four algorithms across the held-out regenerative braking test events. The horizontal axis represents the sequential index of the events in the held-out test set and does not represent elapsed driving time or the chronological order of the original drive records. This analysis is useful because predicted-versus-measured scatter plots summarise overall agreement, but they do not fully reveal whether the model can track local event-to-event variation across the test sequence. The sequential plot therefore provides an additional view of how each optimiser performs when recovered energy and peak regenerative power vary from one braking event to the next. The HPWOA model tracks the measured recovered-energy and peak-power profiles more closely than the other algorithms. This indicates that the proposed hybrid optimiser not only performs well in aggregate metrics but also follows the changing event-level behaviour of the regenerative braking database. PSO follows the general trend reasonably well but shows wider deviations during higher-intensity braking events. WOA shows moderate tracking capability, while SFSA produces the largest deviations and weakest local agreement. In the displayed high-energy and high-power regions, HPWOA maintains the closest local agreement with the measured event profiles. These regions are practically important because high-intensity braking events contribute disproportionately to recovered energy and impose the greatest instantaneous charge-acceptance demand on the battery.
Figure 15.
Sequential prediction of the two regenerative braking targets across the held-out test event index: (a) recovered regenerative braking energy and (b) peak regenerative power. Measured values are compared with the predictions obtained using HPWOA, PSO, WOA, and SFSA.
4.7. Feature-Importance Analysis
Figure 16 presents a descriptive input-weight-magnitude ranking derived from the mean absolute first-layer weights of the HPWOA-optimised dual-output neural network. This quantity is used only as a neural-representation importance proxy: it does not constitute causal attribution and can be affected by feature scaling and hidden-unit parameterisation. The results show that peak regenerative current is the most influential predictor, accounting for approximately 21% of the total input-layer weight magnitude. This is physically reasonable because peak current is directly linked to regenerative power and strongly influences the amount of electrical energy returned to the battery during braking. Event duration is the next major predictor, contributing approximately 18.7%, which confirms that the length of the braking interval remains important for estimating recovered energy. Together, peak current and duration form the dominant braking-kinematic feature group, which is consistent with the event characterisation results showing that recovered energy is strongly associated with both peak current and event duration.
Figure 16.
Feature-importance ranking derived from the mean absolute first-layer weight magnitudes of the HPWOA-optimised dual-output neural network.
The next group of influential variables includes mean current, mean voltage, and state of charge. Mean current contributes to the model because it describes the average intensity of regeneration during the event, while mean voltage is required to translate current flow into battery-side power and energy. State of charge contributes meaningful information because battery charge-acceptance capability is not constant across the operating range. In particular, the charge-acceptance envelope contracts near high SoC, which means that peak regenerative power may be limited when the battery is close to full charge.
The input-weight ranking is consistent with the event-level correlation analysis in identifying peak current and duration as prominent descriptors. Mean current, mean voltage, SoC, temperature, season, SoC change, and mean power provide additional context. Because several of these variables are derived from the same braking event as the targets, the ranking supports retrospective event characterisation and should not be interpreted as evidence of prospective forecasting capability.
4.8. Discussion of Model Behaviour and Practical Implications
Within the reported event-level evaluation, HPWOA provides the lowest training fitness and the strongest held-out estimation metrics. WOA achieves the second-best held-out accuracy for both outputs, while PSO reaches its approximate convergence point earlier but terminates at a slightly higher test error. SFSA performs the weakest across the reported metrics. The comparison is controlled by using the same dual-output architecture, feature space, population size, search space dimension, and total iteration budget. From a regenerative braking perspective, the most important result is the simultaneous improvement in both recovered-energy estimation and peak-regenerative-power estimation. Accurate recovered-energy prediction supports event-level quantification of the useful electrical energy returned to the battery during braking. This is important for evaluating energy recovery benefit, range-extension potential, and regenerative braking calibration. Accurate peak-regenerative-power prediction supports battery charge-acceptance supervision because peak power represents the maximum instantaneous charging demand imposed on the battery during a braking event. Recovered energy and peak regenerative power are physically connected but represent different event-level quantities. A shared dual-output representation provides a compact way to estimate both from the same event descriptors; however, the present comparison does not establish that the shared architecture is superior to two independently optimised single-output networks because such an ablation was not reported. The event database is strongly right-skewed, so high-energy and high-power braking events are less frequently represented than ordinary events. This distributional imbalance should be considered when interpreting aggregate prediction metrics and motivates targeted validation of the upper response range in future work. The feature-importance analysis provides further practical insight. The dominance of peak current and event duration confirms that regenerative braking energy recovery is primarily governed by how strongly and how long the vehicle regenerates during braking. Mean current and mean voltage also contribute meaningful information because they define battery-side electrical power. State of charge, pack voltage, and temperature provide additional context because the battery’s ability to accept regenerative current is not constant across all operating conditions.
4.9. Five-Fold Event-Level Robustness
Because the regenerative braking database contains 8181 validated events, the supplied analysis also reports five-fold event-level cross-validation for HPWOA [38]. Each event is used in a test fold once, while the remaining folds are used for training. This analysis reduces dependence on a single hold-out split, but because folds are formed at the event level rather than by the complete drive record, it remains a within-dataset robustness assessment rather than a drive-disjoint or vehicle-disjoint generalisation test. The cross-validation results therefore assess sensitivity to event partitioning across the available records. They are particularly useful for checking whether the reported high hold-out R2 values collapse under alternative event subsets, while the drive-level dependence limitation is addressed explicitly in Section 4.10. As summarised in Table 13 and Figure 17, the reported mean cross-validated R2 is 0.949 ± 0.020 for recovered regenerative braking energy and 0.963 ± 0.010 for peak regenerative power, compared with hold-out values of 0.9784 and 0.9819, respectively. The fold-to-fold standard deviations are modest, indicating that the supplied event-level estimates are not dominated by a single partition.
Table 13.
Five-fold event-level cross-validation R2 performance of the HPWOA dual-output model.
Figure 17.
Comparison of five-fold event-level cross-validated mean R2 and hold-out R2 for recovered energy and peak regenerative power.
Figure 18 illustrates the sensitivity of event count and recovered energy to the current, bridging, dropout, and long-stretch parameters.
Figure 18.
Sensitivity of event count and recovered energy to the current, bridging, dropout, and long-stretch parameters.
4.10. Independent Drive-Group Verification
A supplementary verification experiment was conducted to reduce dependence on event-level random partitioning. Five repeated group-disjoint tests held out 56 complete trip groups per repeat. The same 10-input, 12-hidden-neuron, two-output representation and training-only scaling were retained; three independent neural fits were averaged and outputs were constrained to the training range to match this manuscript’s min–max/sigmoid output design. Table 14 shows that peak-power R2 remained 0.9745–0.9955 across all repeats. Recovered-energy R2 was 0.9513–0.9905 in four repeats, while one repeat produced R2 = −0.8890 because rare high-energy events were concentrated in held-out groups outside the training response support. This failure is retained because it identifies a genuine extrapolation limitation rather than a result to be discarded.
Table 14.
Repeated complete-trip-group-disjoint verification of the dual-output neural representation.
A stricter leave-one-drive-record-out stress test was also performed. Recovered-energy R2 ranged from 0.4348 to 0.9913; Folder 12 was the weakest case because its response range was represented inadequately by the remaining records. Peak-power R2 ranged from 0.9684 to 0.9962. The mean R2 values across the eight held-out records were 0.8713 for energy and 0.9842 for peak power. These results form a raw-data-to-event-to-independent-group verification loop within the public dataset, but they do not replace multi-vehicle or hardware validation. Table 15 reports every held-out-record result, including the weakest case.
Table 15.
Leave-one-drive-record-out stress test.
4.11. Limitations and Threats to Validity
Several limitations define the scope of the reported findings. First, the analysis is based on a single public real-world EV dataset and only eight drive records. The results therefore characterise the operating conditions represented by those records and do not establish hardware-level or cross-vehicle transferability across different vehicles, battery chemistries, routes, drivers, regenerative braking calibrations, or climates. Second, the event database is strongly right-skewed, with many low-to-moderate regenerative events and comparatively few high-energy/high-power events. The upper response region therefore has less support than the ordinary braking region. The extreme high-energy point visible in the exploratory event distribution should be verified against the source time series in any future replication before being used for controller calibration. Third, the high-SoC charge-acceptance region is not uniformly sampled. The observed reduction in the maximum peak-power envelope near full charge should therefore be interpreted as an empirical pattern within the sampled operating range rather than as a universal battery limit. Fourth, seasonal effects are associative. Season is confounded with route, traffic, driving style, recording period, SoC distribution, braking intensity, and ambient conditions. Seasonal differences must not be interpreted as causal temperature effects.
Fifth, the neural model uses event-derived inputs, including duration, current, voltage, and mean power, that are observed during the same braking interval as the two targets. The reported model is therefore an event-level estimator/soft sensor, not a prospective prebraking predictor. A deployable predictive controller would require retraining with only signals available before or early in the braking event and should be evaluated using drive-disjoint data. Sixth, the first-layer weight-magnitude ranking is only a descriptive importance proxy and does not establish causal influence. More rigorous interpretation should use permutation importance, SHAP, or controlled sensitivity analysis on a leakage-safe evaluation design.
Seventh, HPWOA relies on iterative population-based optimisation and can be more computationally expensive than conventional gradient-based neural-network training. The present results support offline event-level estimation; embedded or real-time deployment would require runtime benchmarking, model compression, and validation under prospective input availability. Eighth, the Gaussian walk ratio and the weight, bias, and velocity bounds were selected as stable empirical implementation settings. Although the same settings were applied consistently in the controlled comparison, a dedicated sensitivity analysis is required before the values can be regarded as generally optimal. Ninth, start SoC and mean SoC are strongly correlated and may provide partially redundant information; their individual importance should therefore be interpreted cautiously and verified through reduced-input ablation in future work.
5. Conclusions and Future Work
This study developed an event-level framework for characterising and estimating regenerative braking energy recovery under battery operating-condition variations. Real-world drive records were segmented into 8181 regenerative events, which were described using battery-side energy, charge, power, current, SoC, voltage, temperature, and seasonal context. A compact 10-input, 12-hidden-neuron, two-output feedforward neural network with 158 trainable parameters was then optimised using HPWOA and compared with standalone PSO, WOA, and SFSA under a common computational configuration.
On the reported hold-out event split, HPWOA achieved R2 = 0.9784 and RMSE = 1.839 Wh for recovered-energy estimation and R2 = 0.9819 and RMSE = 4.891 kW for peak regenerative-power estimation. WOA was the second-best standalone optimiser on both held-out targets, followed by PSO and SFSA. The reported five-fold event-level analysis produced R2 = 0.949 ± 0.020 for recovered energy and 0.963 ± 0.010 for peak regenerative power, indicating moderate partition-to-partition stability within the available records.
Independent of the neural estimator, the empirical charge-acceptance analysis showed that the observed regenerative-power envelope varies with battery operating condition. Maximum peak regenerative power decreased to 155.53 kW in the 90–100% SoC band, compared with maxima of 177.49–224.14 kW across the lower and mid-SoC bands. This supports a battery-aware interpretation of regenerative braking while avoiding causal claims from the observational field data. The correlation and input-weight analyses consistently identified peak current and event duration as prominent event descriptors, while mean current, mean voltage, SoC, temperature, seasonal context, SoC change, and mean power contributed additional information. These findings support the central physical interpretation that realised regenerative energy is governed primarily by braking event intensity and duration, whereas battery operating condition constrains the admissible charge-acceptance envelope. The principal conclusion is that the proposed HPWOA configuration provides a strong event-level dual-output estimation on the supplied dataset while preserving an interpretable link to braking intensity and battery operating condition. The present evidence should be understood as retrospective event-level estimation rather than prebraking forecasting or cross-vehicle generalisation.
Future work should prioritise prospective hardware-in-the-loop, drive-disjoint, and multi-vehicle validation, verification of rare extreme events against the raw telemetry, and prospective models restricted to signals available before or during the early portion of a braking event. Additional vehicle speed, road grade, brake-pedal demand, motor torque, cell-level temperature, and battery-health information would strengthen physical interpretation. Comparisons with conventional gradient-trained networks, single-output ablations, permutation/SHAP importance, runtime analysis, and embedded implementation should also be included before claiming real-time BMS or regenerative braking control readiness.
Author Contributions
Conceptualisation, K.D.M. and B.A.T.; methodology, K.D.M.; software, K.D.M.; validation, K.D.M. and B.A.T.; formal analysis, K.D.M.; investigation, K.D.M.; resources, B.A.T.; data curation, K.D.M.; writing—original draft preparation, K.D.M.; writing—review and editing, K.D.M. and B.A.T.; visualisation, K.D.M.; supervision, B.A.T.; project administration, B.A.T. All authors have read and agreed to the published version of the manuscript.
Funding
This research received no external funding.
Data Availability Statement
The source dataset analysed in this study is publicly available as “Real-World Electric Vehicle Data: Driving and Charging”, Mendeley Data, Version 2, https://doi.org/10.17632/7vdkzpnjgj.2 [19].
Acknowledgments
The authors gratefully acknowledge the Department of Electrical and Electronic Engineering Technology, University of Johannesburg, for providing the facilities and institutional support necessary for this research.
Conflicts of Interest
The authors declare no conflict of interest.
Abbreviations
The following abbreviations and symbols are used in this manuscript:
| Item | Description |
| BMS | battery management system |
| DO-FNN | dual-output feedforward neural network |
| EV | electric vehicle |
| HPWOA | hybrid particle swarm optimisation and whale optimisation algorithm |
| MAE | mean absolute error |
| MAPE | mean absolute percentage error |
| MSE | mean-square error |
| PSO | particle swarm optimisation |
| RBS | regenerative braking system |
| RMSE | root-mean-square error |
| SFSA | Stochastic Fractal Search Algorithm |
| SoC | state of charge |
| WOA | whale optimisation algorithm |
| Eregen | recovered regenerative braking energy |
| Pregen | regenerative braking power |
| Qregen | returned charge during regeneration |
| Vpack | battery-pack voltage |
| Ibat | battery current |
| Tbat | battery temperature |
| R2 | coefficient of determination |
| Wh | watt-hour |
| Ah | ampere-hour |
| kWh | kilowatt-hour |
| kW | kilowatt |
| A | ampere |
| V | volt |
| °C | degrees Celsius |
References
- Szumska, E.M. Regenerative Braking Systems in Electric Vehicles: A Comprehensive Review of Design, Control Strategies, and Efficiency Challenges. Energies 2025, 18, 2422. [Google Scholar] [CrossRef] [Scilit]
- Ehsani, M.; Gao, Y.; Longo, S.; Ebrahimi, K. Modern Electric, Hybrid Electric, and Fuel Cell Vehicles, 3rd ed.; CRC Press: Boca Raton, FL, USA, 2018. [Google Scholar]
- Gao, Y.; Chen, L.; Ehsani, M. Investigation of the Effectiveness of Regenerative Braking for EV and HEV. In Proceedings of the Future Transportation Technology Conference & Exposition, Costa Mesa, CA, USA, 17 August 1999; SAE Technical Paper 1999-01-2910; SAE International: Warrendale, PA, USA, 1999. [Google Scholar] [CrossRef] [Scilit]
- Qiu, C.; Wang, G. New Evaluation Methodology of Regenerative Braking Contribution to Energy Efficiency Improvement of Electric Vehicles. Energy Convers. Manag. 2016, 119, 389–398. [Google Scholar] [CrossRef] [Scilit]
- Zhang, J.; Lv, C.; Yue, X.; Qiu, M.; Li, Y.; Yuan, Y. Development of the Electrically-Controlled Regenerative Braking System for Electrified Passenger Vehicle. In Proceedings of the SAE 2013 World Congress & Exhibition, Detroit, MI, USA, 16 April 2013; SAE Technical Paper 2013-01-1460; SAE International: Warrendale, PA, USA, 2013. [Google Scholar] [CrossRef] [Scilit]
- Ko, J.; Ko, S.; Kim, H.; Lee, T.; Kim, H. Development of Brake System and Regenerative Braking Cooperative Control Algorithm for Automatic-Transmission-Based Hybrid Electric Vehicles. IEEE Trans. Veh. Technol. 2015, 64, 431–440. [Google Scholar] [CrossRef] [Scilit]
- Larminie, J.; Lowry, J. Electric Vehicle Technology Explained, 2nd ed.; Wiley: Chichester, UK, 2012. [Google Scholar]
- Plett, G.L. Battery Management Systems, Volume I: Battery Modeling; Artech House: Norwood, MA, USA, 2015. [Google Scholar]
- Plett, G.L. Battery Management Systems, Volume II: Equivalent-Circuit Methods; Artech House: Norwood, MA, USA, 2015. [Google Scholar]
- Hu, X.; Li, S.E.; Yang, Y. Advanced Machine Learning Approach for Lithium-Ion Battery State Estimation in Electric Vehicles. IEEE Trans. Transp. Electrif. 2016, 2, 140–149. [Google Scholar] [CrossRef] [Scilit]
- Kumar, R.R.; Ravi Kumar, R.K.; Bharatiraja, C.; Udhayakumar, K.; Devakirubakaran, S.; Sekar, K.S.; Mihet-Popa, L. Advances in Batteries, Battery Modeling, Battery Management System, Battery Thermal Management, SOC, SOH, and Charge/Discharge Characteristics in EV Applications. IEEE Access 2023, 11, 105761–105809. [Google Scholar] [CrossRef] [Scilit]
- Senol, M.; Bayram, I.S.; Naderi, Y.; Galloway, S. Electric Vehicles under Low Temperatures: A Review on Battery Performance, Charging Needs, and Power Grid Impacts. IEEE Access 2023, 11, 39879–39912. [Google Scholar] [CrossRef] [Scilit]
- Adaikkappan, M.; Sathiyamoorthy, N. Modeling, State of Charge Estimation, and Charging of Lithium-Ion Battery in Electric Vehicle: A Review. Int. J. Energy Res. 2022, 46, 2141–2165. [Google Scholar] [CrossRef] [Scilit]
- Zou, C.; Manzie, C.; Nesic, D.; Kallapur, A.G. Multi-Time-Scale Observer Design for State-of-Charge and State-of-Health of a Lithium-Ion Battery. J. Power Sources 2016, 335, 121–130. [Google Scholar] [CrossRef] [Scilit]
- Hu, X.; Li, S.; Peng, H.; Sun, F. Charging Time and Loss Optimisation for LiNMC and LiFePO4 Batteries Based on Equivalent Circuit Models. J. Power Sources 2013, 239, 449–457. [Google Scholar] [CrossRef] [Scilit]
- Tian, Q.; Hao, C. Regenerative Braking Energy Recovery Control Strategy for Electric Vehicles with Battery Temperature Measurement. J. Phys. Conf. Ser. 2023, 2584, 012034. [Google Scholar] [CrossRef] [Scilit]
- Barik, M.; S, S.; Aruljothi, S. Predictive SoC Management for Enhanced Recuperation Efficiency in Electric Vehicles. In Proceedings of the Symposium on International Automotive Technology (2026), Pune, India, 28 January 2026; SAE Technical Paper 2026-26-0154; SAE International: Warrendale, PA, USA, 2026. [Google Scholar] [CrossRef] [Scilit]
- Tai, L.D.; Garud, K.S.; Hwang, S.-G.; Lee, M.-Y. A Review on Advanced Battery Thermal Management Systems for Fast Charging in Electric Vehicles. Batteries 2024, 10, 372. [Google Scholar] [CrossRef] [Scilit]
- Pozzato, G.; Allam, A.; Pulvirenti, L.; Negoita, A.; Paxton, W.; Onori, S. Mendeley Data; Version 2; Real-World Electric Vehicle Data: Driving and Charging; Elsevier: Amsterdam, The Netherlands, 2023. [Google Scholar] [CrossRef]
- Pozzato, G.; Allam, A.; Pulvirenti, L.; Negoita, G.A.; Paxton, W.A.; Onori, S. Analysis and Key Findings from Real-World Electric Vehicle Field Data. Joule 2023, 7, 2035–2053. [Google Scholar] [CrossRef] [Scilit]
- Huang, G.; Li, W.; Gao, X.; Xiao, L.; Wang, Y.; Dong, H. Advancing the Regenerative Braking Systems of New Energy Vehicles: A Comprehensive State-of-the-Art Review. Int. J. Energy Res. 2025, 2025, 34607761. [Google Scholar] [CrossRef] [Scilit]
- Prakash, Z. Integration of AI and ML in Regenerative Braking for Electric Vehicles: A Review. Front. Artif. Intell. 2025, 8, 1626804. [Google Scholar] [CrossRef] [Scilit] [PubMed]
- Yin, Z.; Ma, X.; Su, R.; Huang, Z.; Zhang, C. Regenerative Braking of Electric Vehicles Based on Fuzzy Control Strategy. Processes 2023, 11, 2985. [Google Scholar] [CrossRef] [Scilit]
- Li, J.; Fu, G.; Cao, B.; Hu, J.; Hu, Z.; Yu, J.; He, H.; Li, Z.; Huang, D.; Jiang, F. A Regenerative Braking Strategy for Battery Electric Vehicles Based on PSO-Optimized Fuzzy Control. Processes 2026, 14, 1049. [Google Scholar] [CrossRef] [Scilit]
- Xiong, J.; Song, J.; Zhang, Z. Electric Vehicle Braking Energy Recovery Control Method Integrating Fuzzy Control and Improved Firefly Algorithm. PLoS ONE 2025, 20, e0320537. [Google Scholar] [CrossRef] [Scilit] [PubMed]
- Xu, M.; Peng, J.; Ren, X.; Yang, X.; Hu, Y. Research on Braking Energy Regeneration for Hybrid Electric Vehicles. Machines 2023, 11, 347. [Google Scholar] [CrossRef] [Scilit]
- Anh, N.T.; Chen, C.-K.; Liu, X. An Efficient Regenerative Braking System for Electric Vehicles Based on a Fuzzy Control Strategy. Vehicles 2024, 6, 1496–1512. [Google Scholar] [CrossRef] [Scilit]
- Li, C.; Zhang, L.; Lian, S.; Liu, M. Research on Regenerative Braking Control of Electric Vehicles Based on Game Theory Optimisation. Sci. Prog. 2024, 107, 00368504241247404. [Google Scholar] [CrossRef] [Scilit] [PubMed]
- Tempone, G.; de Carvalho Pinheiro, H.; Imberti, G.; Carello, M. Control System for Regenerative Braking Efficiency in Electric Vehicles with Electro-Actuated Brakes. SAE Int. J. Veh. Dyn. Stab. NVH 2024, 8, 265–284. [Google Scholar] [CrossRef] [Scilit]
- Li, S.; Wang, K.; Zhang, Y.; Zhang, J. Regenerative Braking Strategy for Electric Vehicles Based on Grey Wolf Optimizer-Optimized Fuzzy Control. World Electr. Veh. J. 2026, 17, 399. [Google Scholar] [CrossRef] [Scilit]
- Tai, L.D.; Lee, M.-Y. Advances in the Battery Thermal Management Systems of Electric Vehicles for Thermal Runaway Prevention and Suppression. Batteries 2025, 11, 216. [Google Scholar] [CrossRef] [Scilit]
- Koundal, S.; Sharma, S.L.; Debbarma, A. Battery Thermal Management Systems for Electric Vehicles: An Overview of Cooling Techniques and Performance Optimisation. J. Therm. Anal. Calorim. 2025, 150, 5855–5882. [Google Scholar] [CrossRef] [Scilit]
- Alawi, A.; Saeed, A.; Sharqawy, M.H.; Al Janaideh, M. A Comprehensive Review of Thermal Management Challenges and Safety Considerations in Lithium-Ion Batteries for Electric Vehicles. Batteries 2025, 11, 275. [Google Scholar] [CrossRef] [Scilit]
- Goodfellow, I.; Bengio, Y.; Courville, A. Deep Learning; MIT Press: Cambridge, MA, USA, 2016. [Google Scholar]
- Kennedy, J.; Eberhart, R. Particle Swarm Optimisation. In Proceedings of the IEEE International Conference on Neural Networks, Perth, Australia, 27 November–1 December 1995; Volume 4, pp. 1942–1948. [Google Scholar] [CrossRef] [Scilit]
- Mirjalili, S.; Lewis, A. The Whale Optimisation Algorithm. Adv. Eng. Softw. 2016, 95, 51–67. [Google Scholar] [CrossRef] [Scilit]
- Salimi, H. Stochastic Fractal Search: A Powerful Metaheuristic Algorithm. Knowl.-Based Syst. 2015, 75, 1–18. [Google Scholar] [CrossRef] [Scilit]
- Kohavi, R. A Study of Cross-Validation and Bootstrap for Accuracy Estimation and Model Selection. In Proceedings of the 14th International Joint Conference on Artificial Intelligence, Montreal, QC, Canada, 20–25 August 1995; Volume 2, pp. 1137–1145. [Google Scholar]
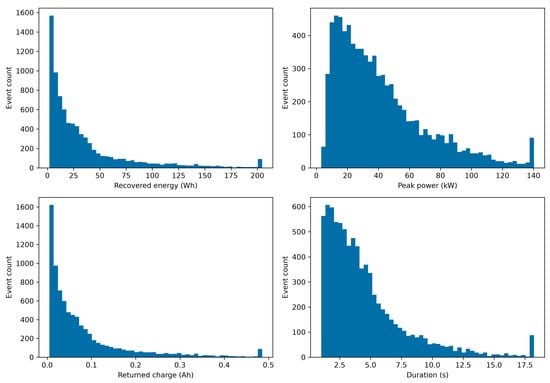
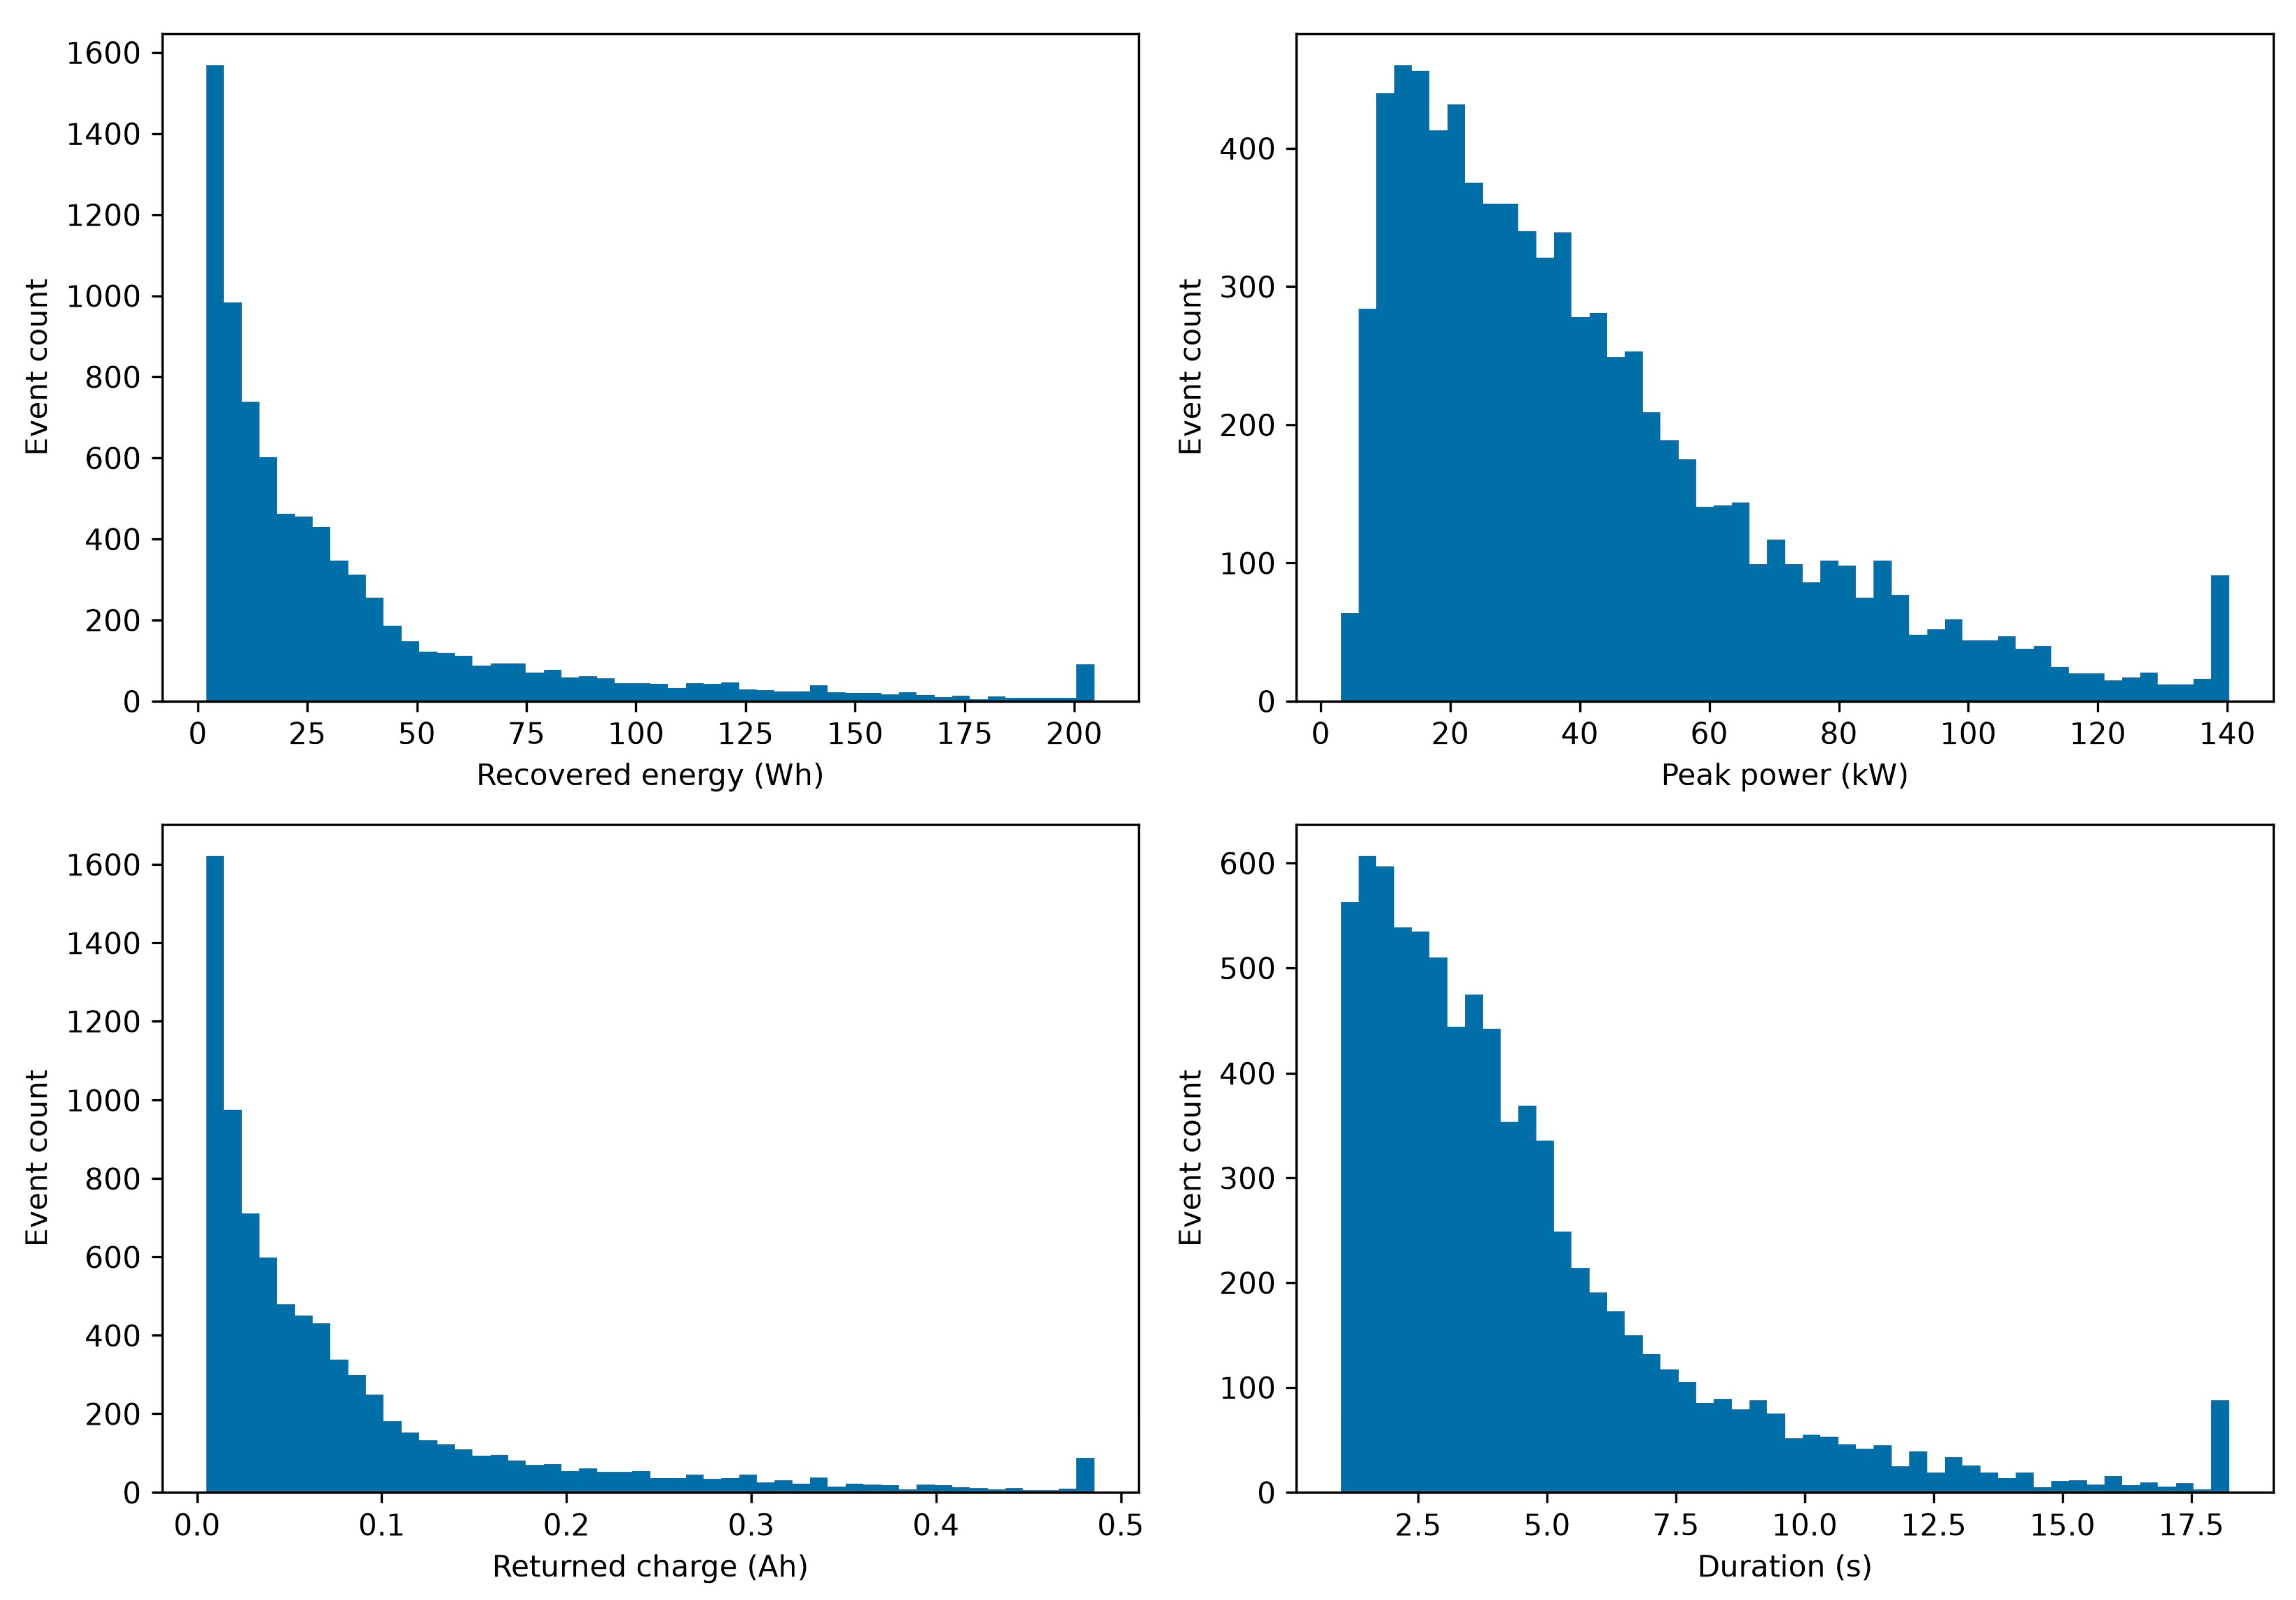
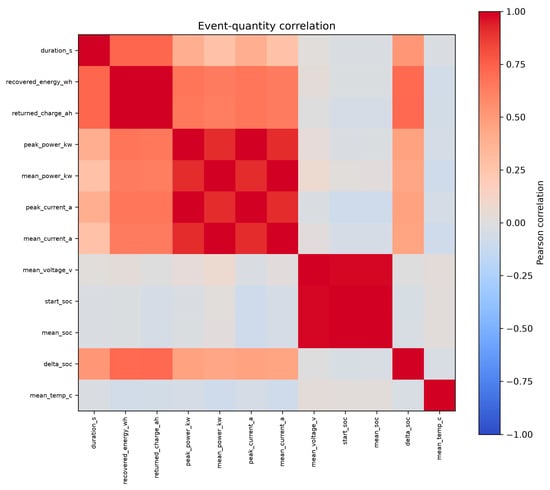
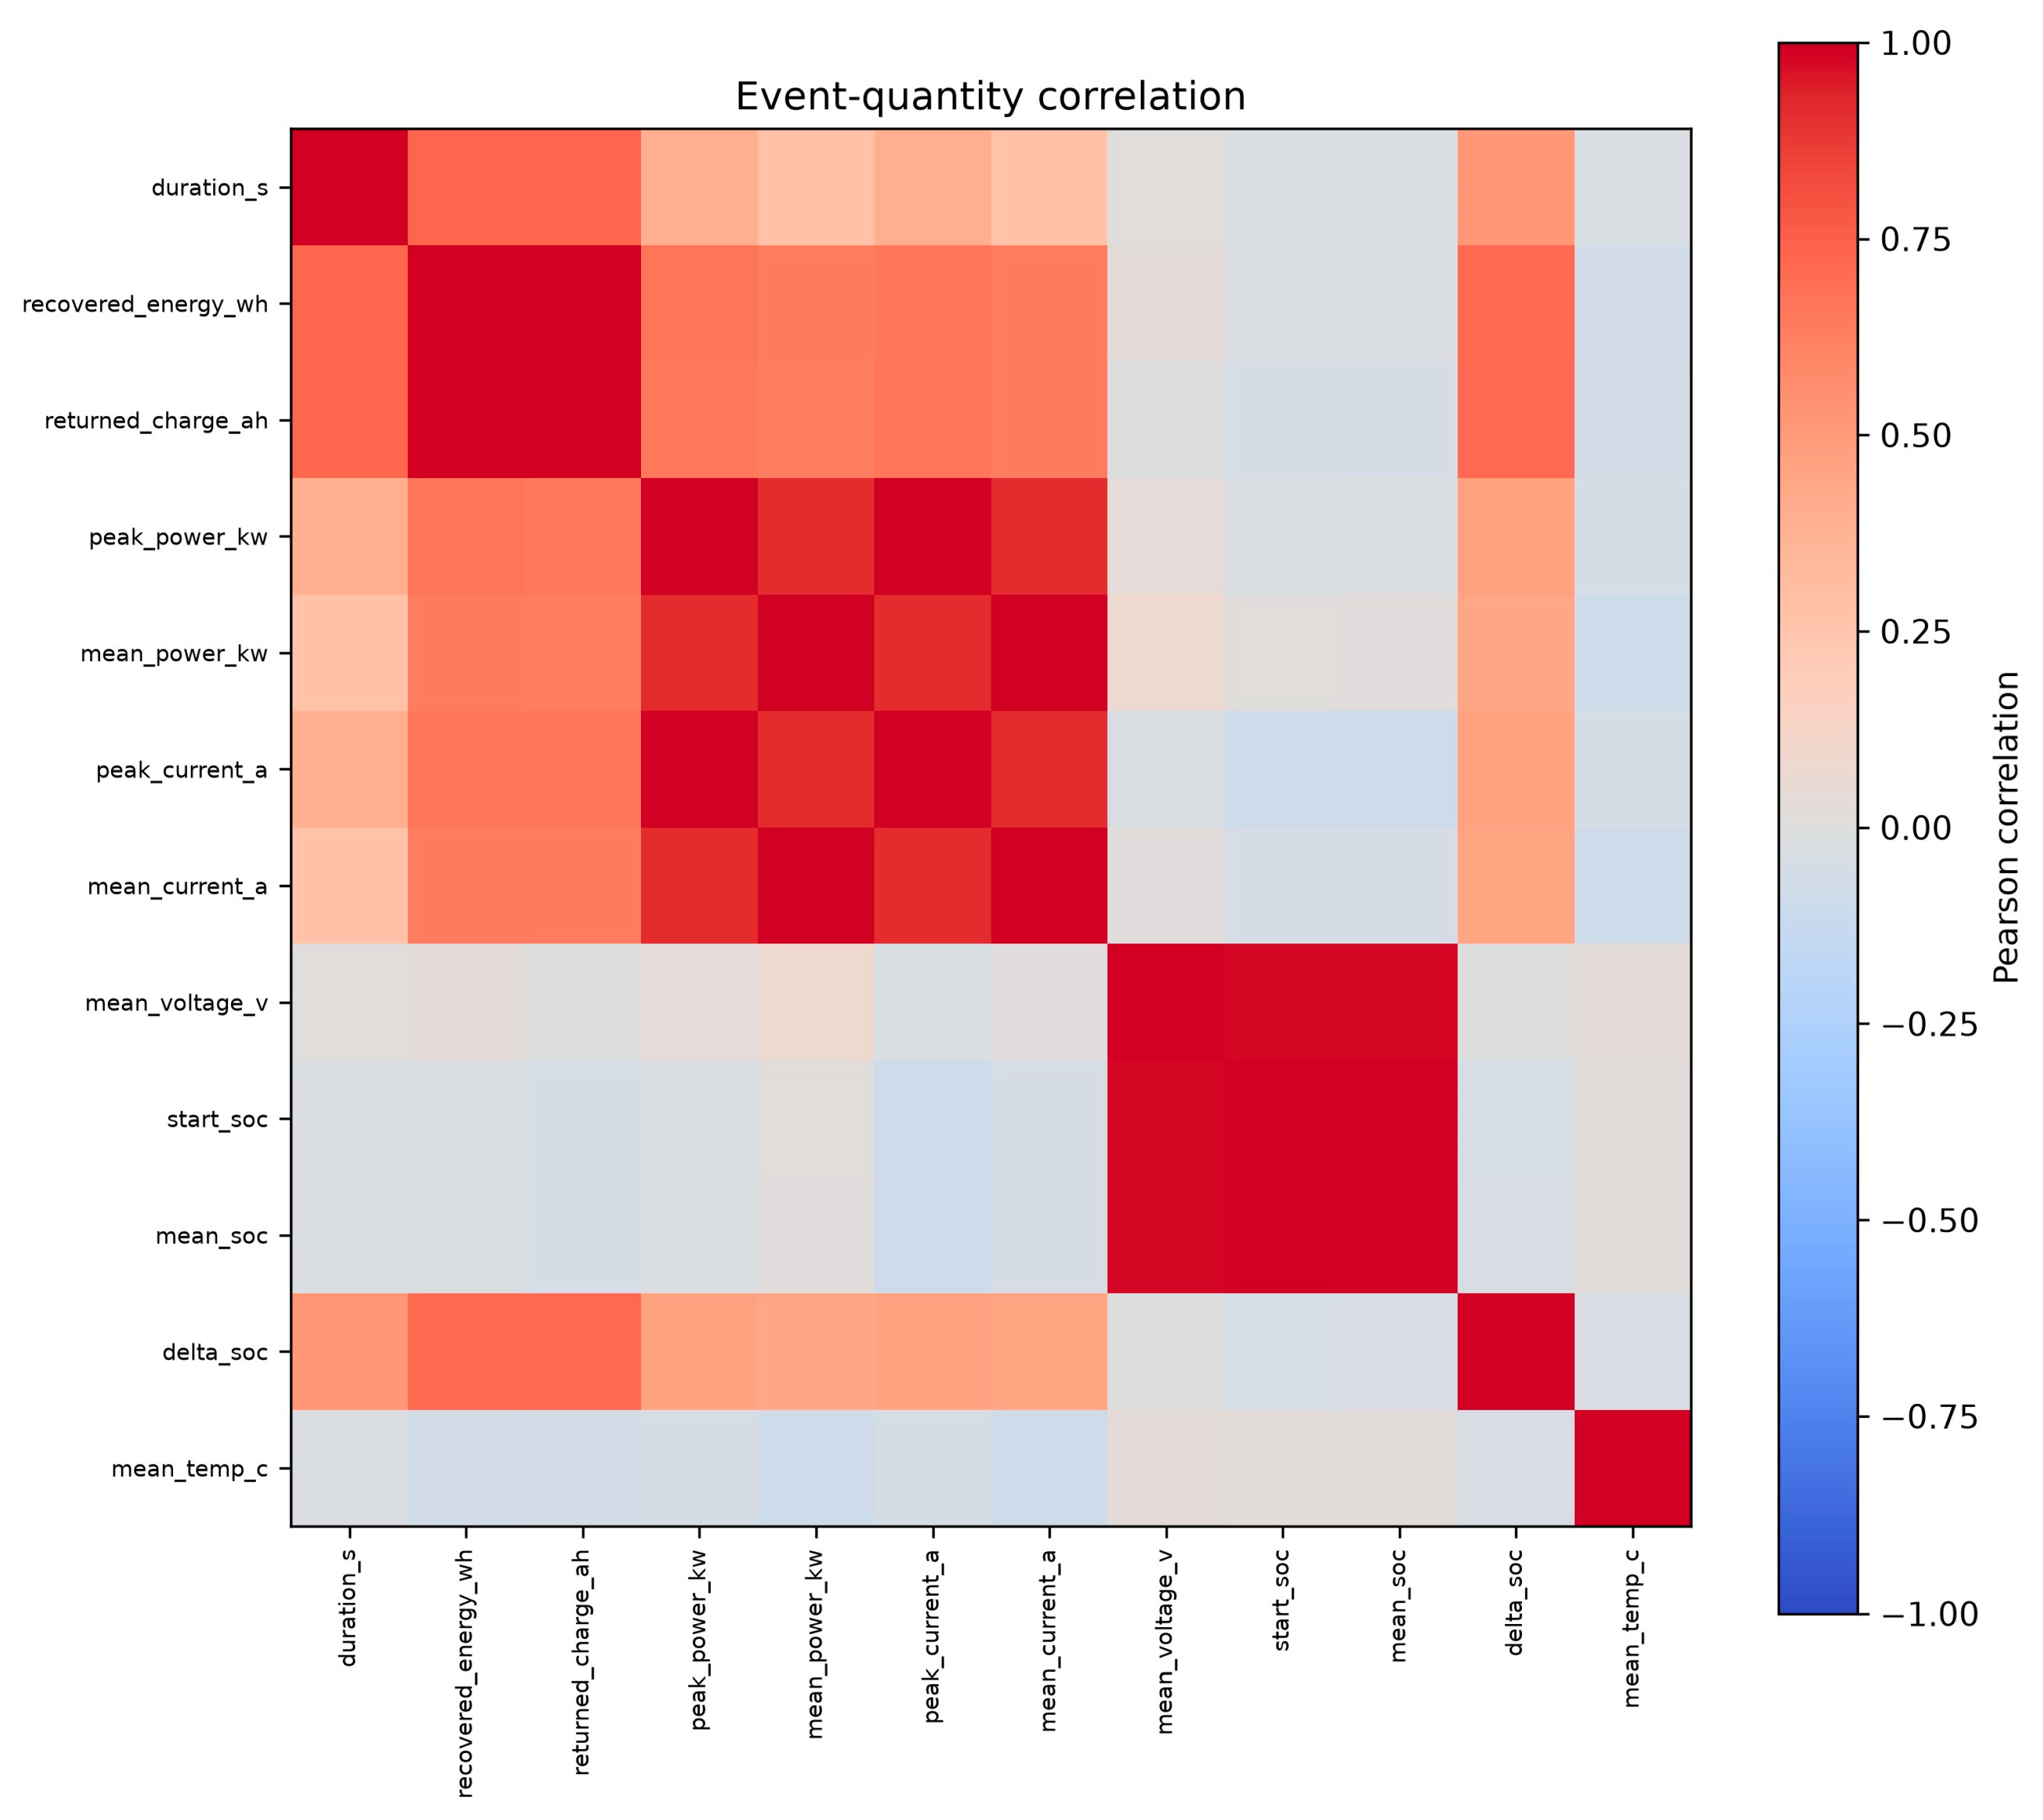
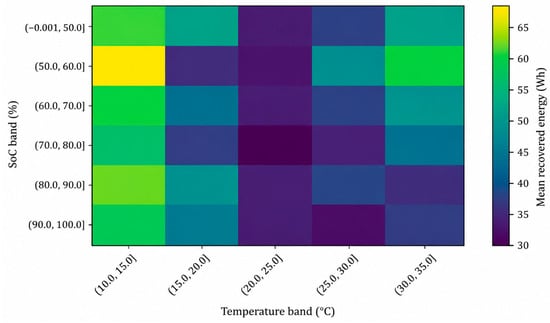
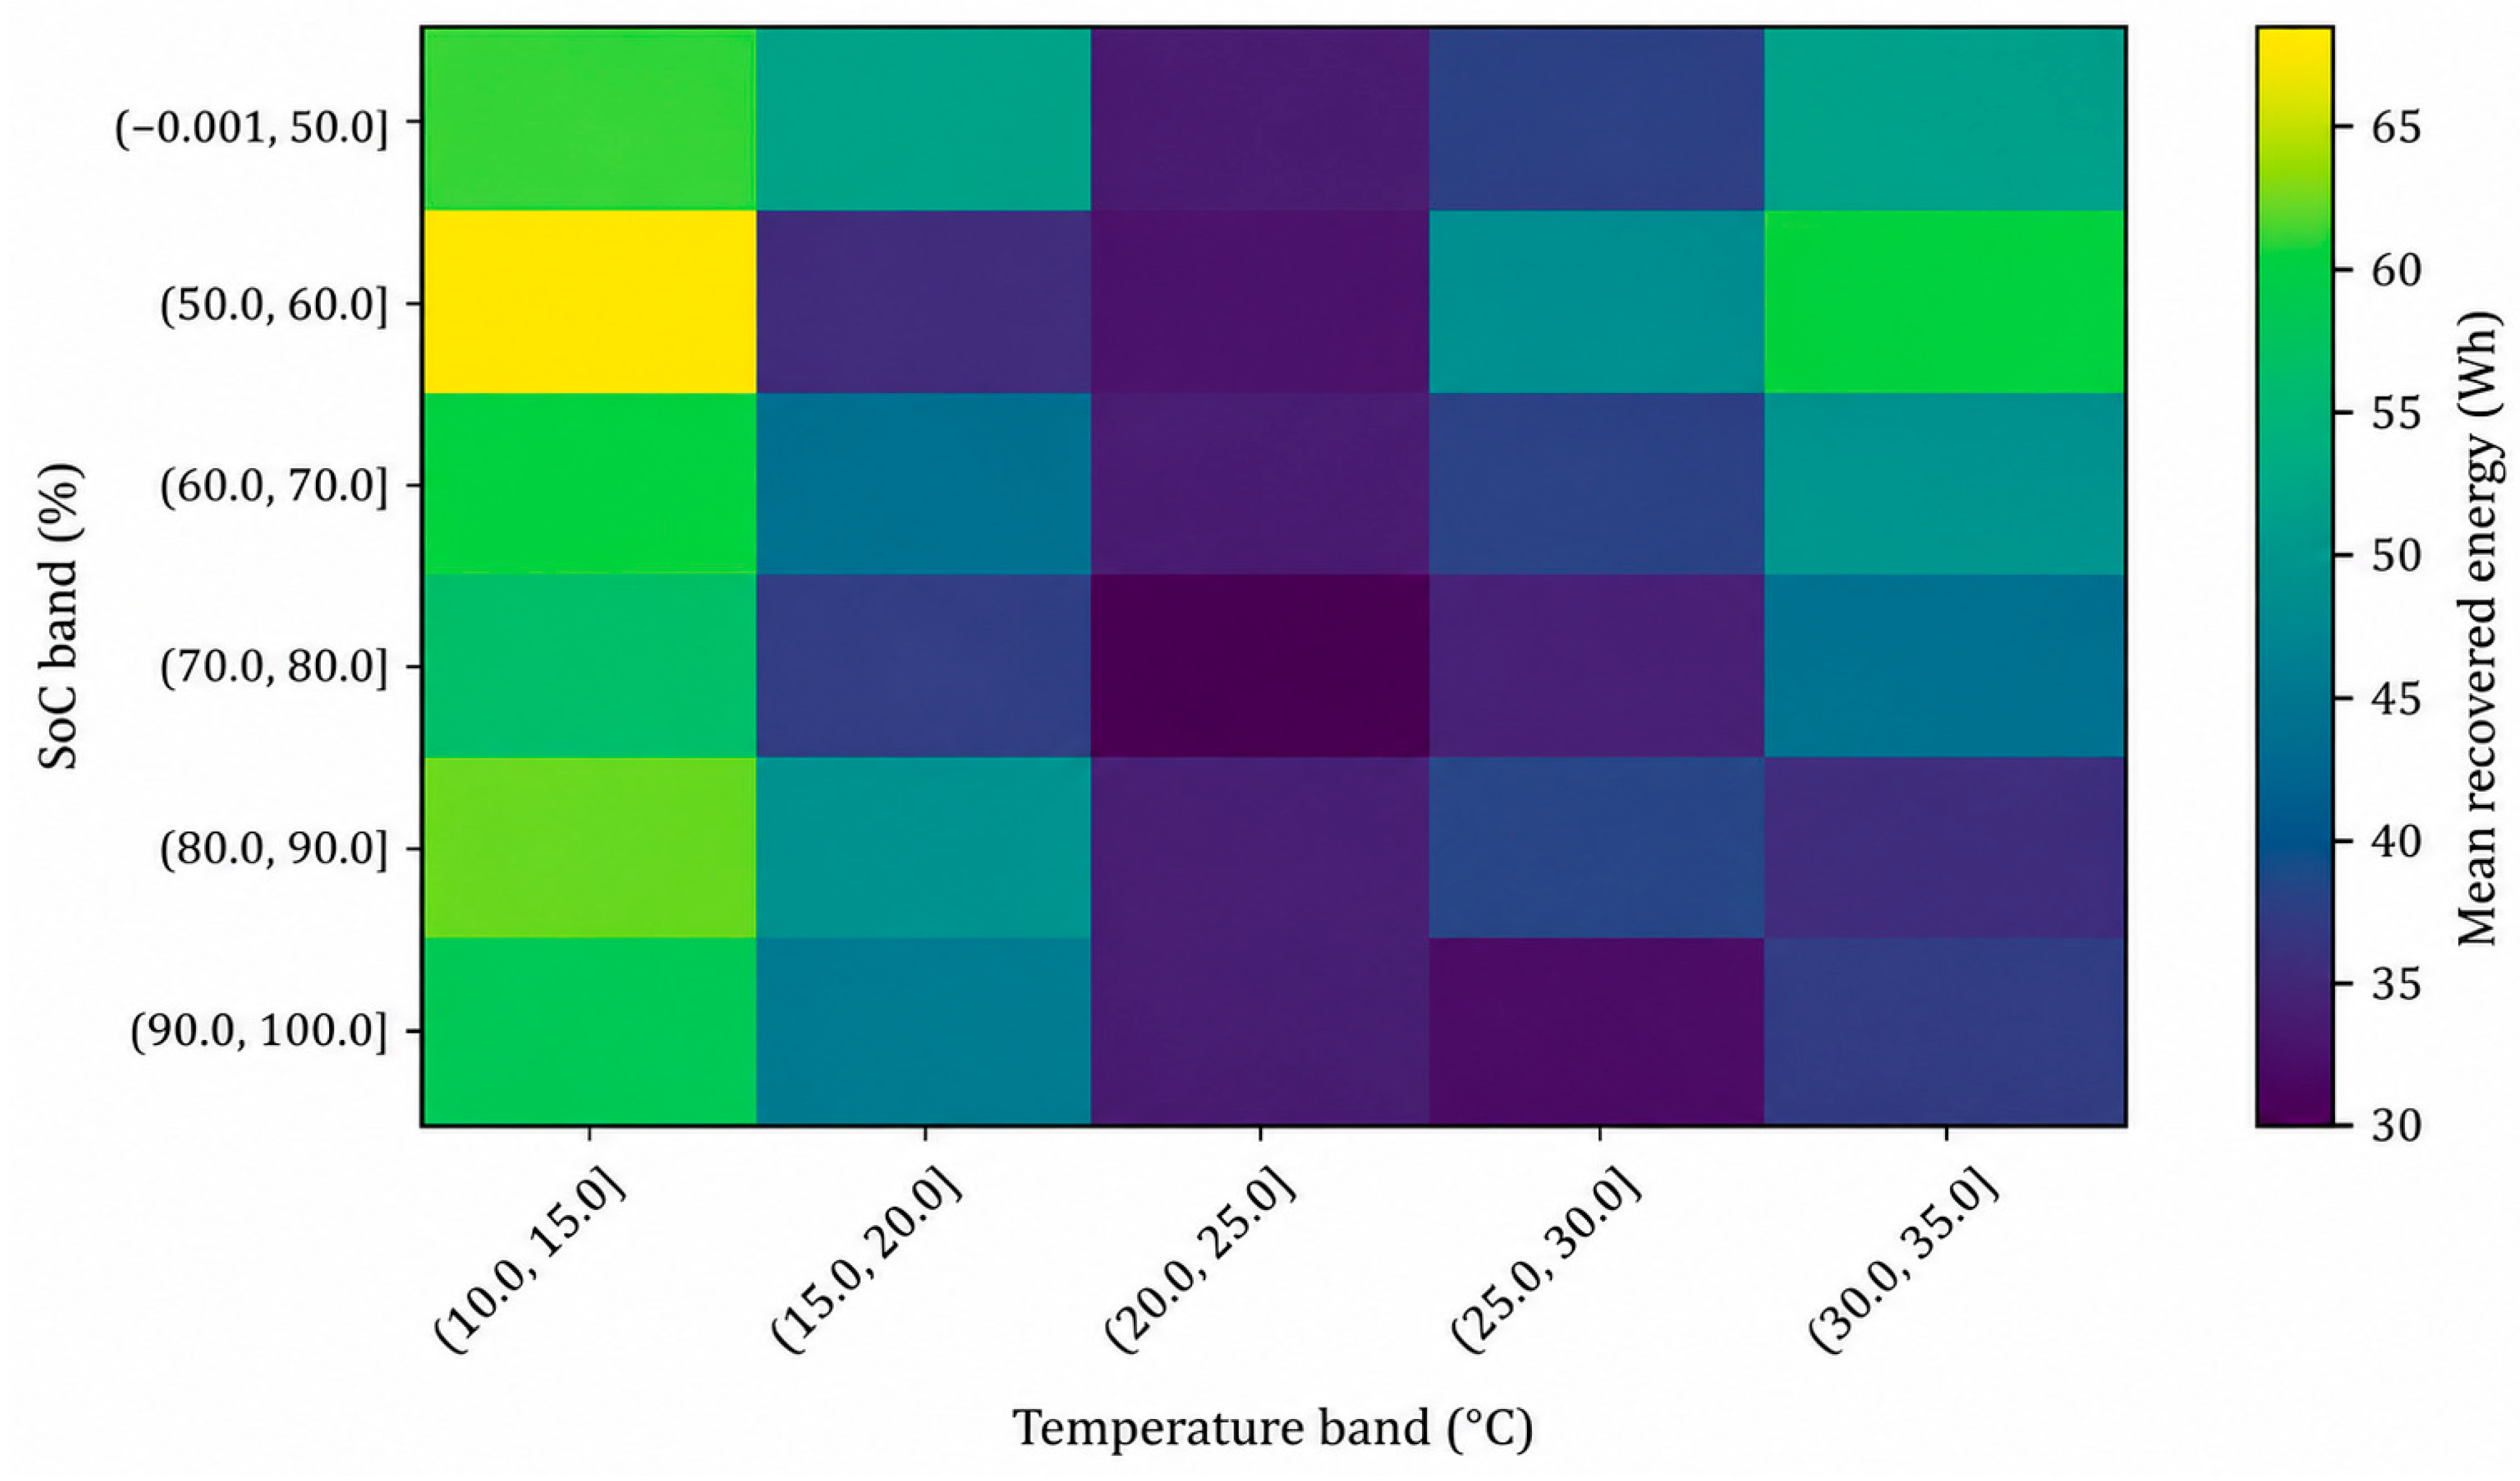
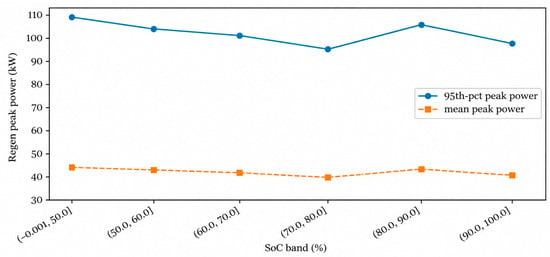
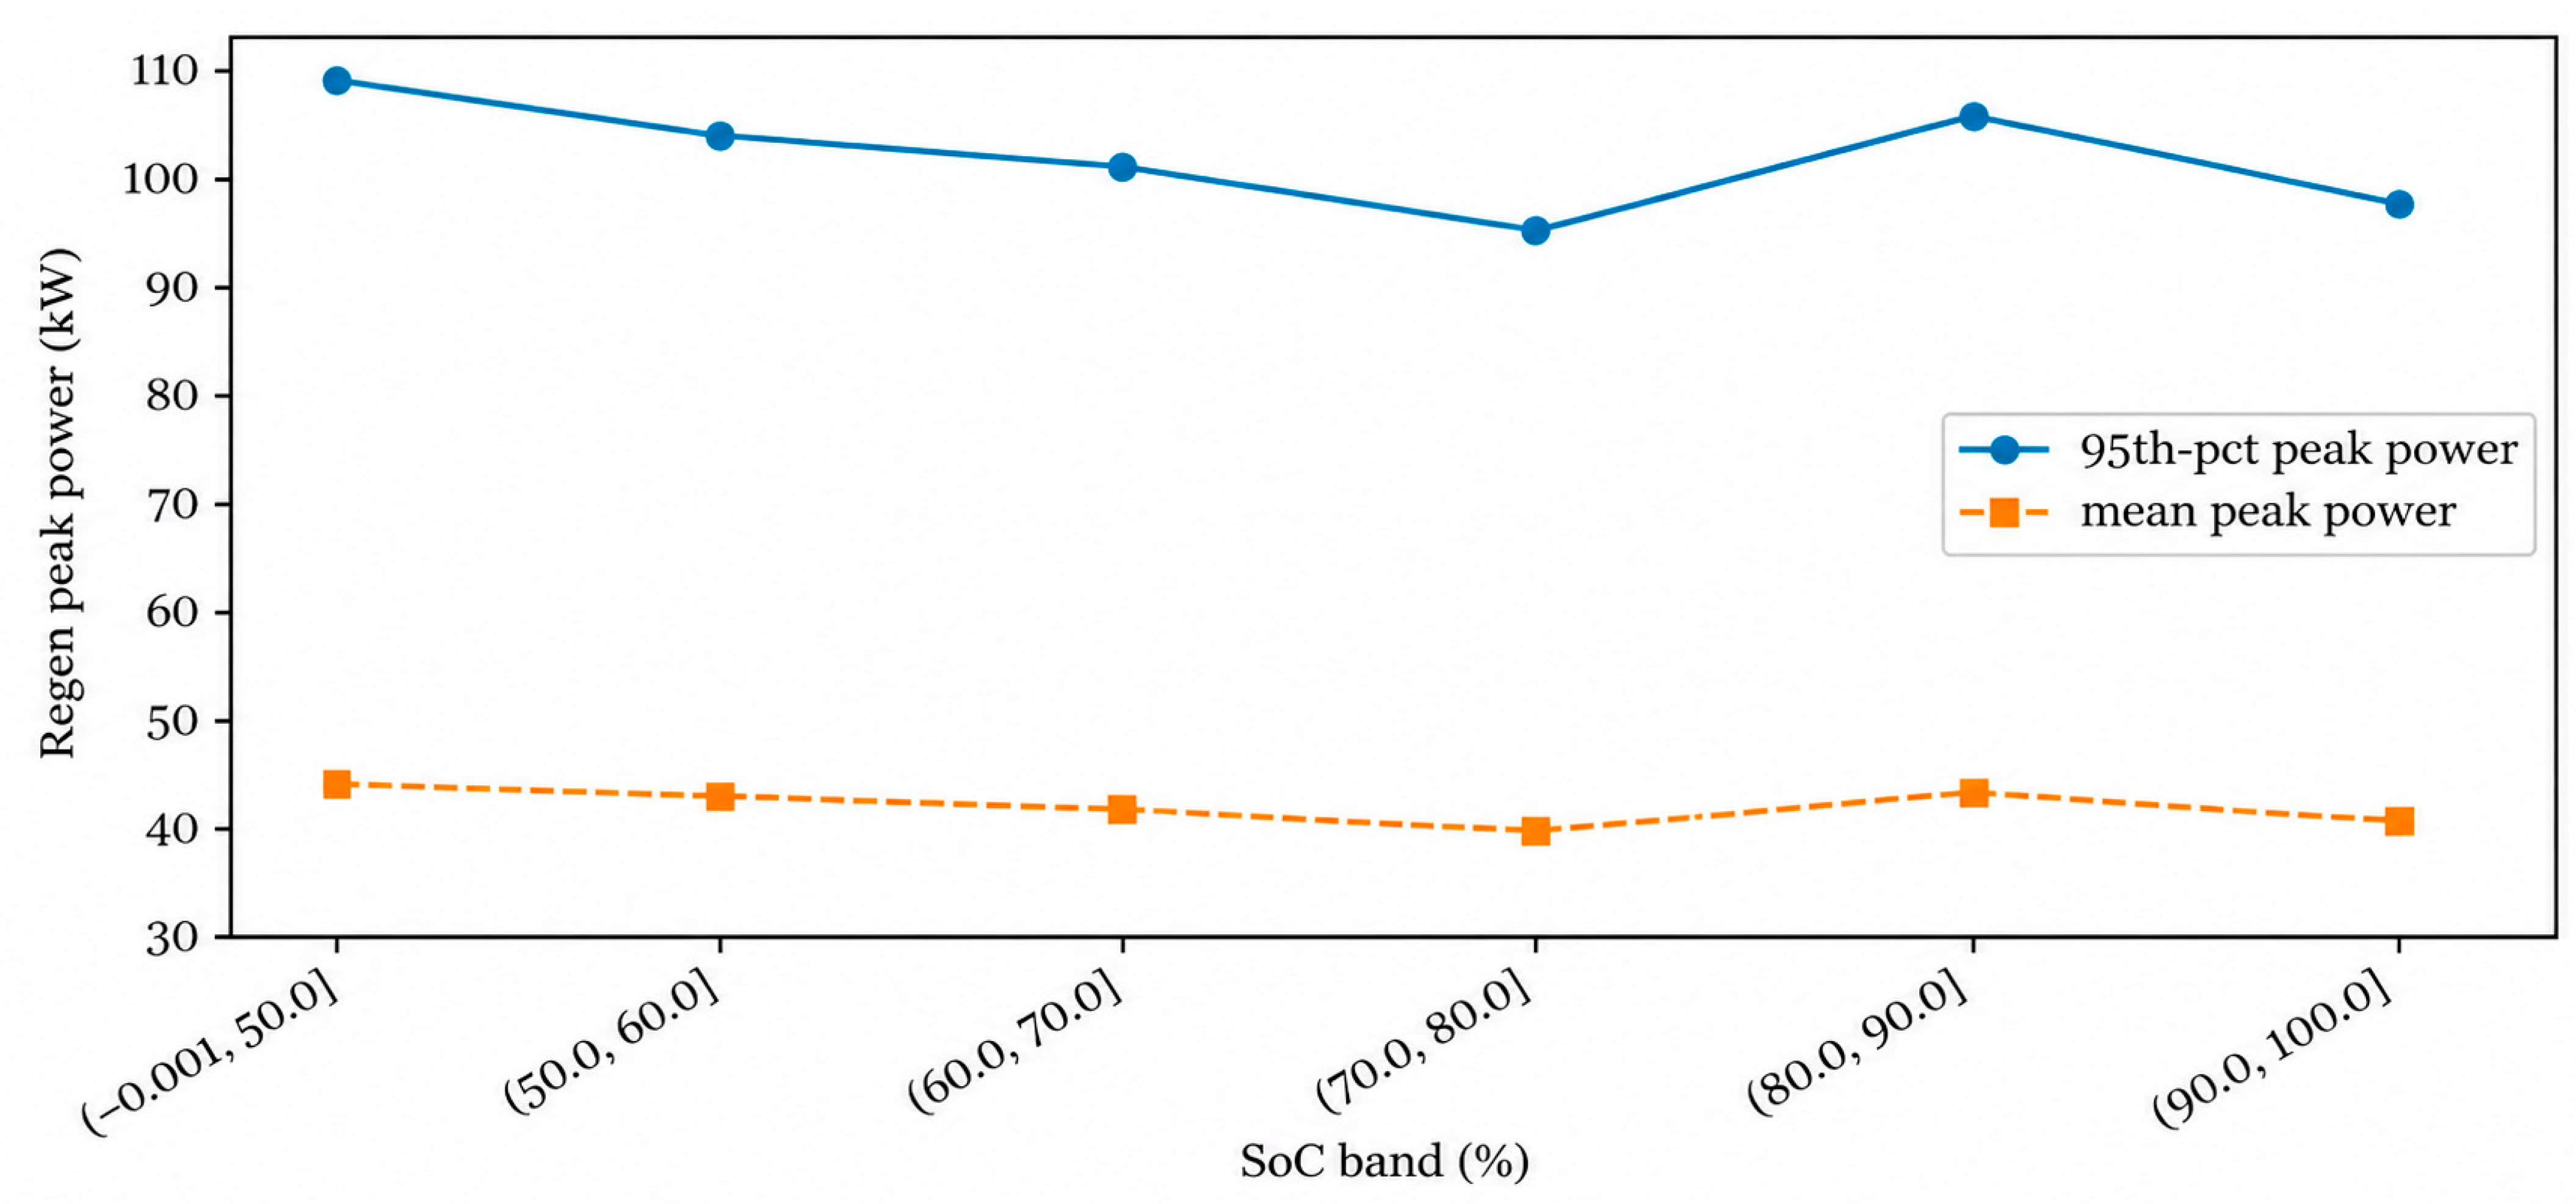
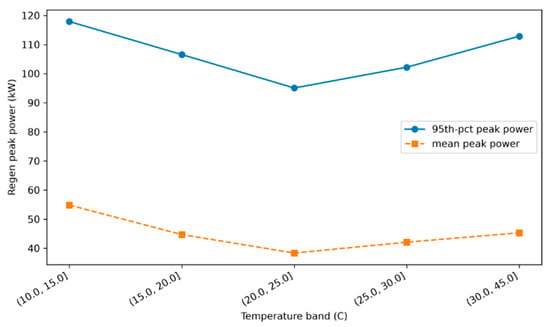
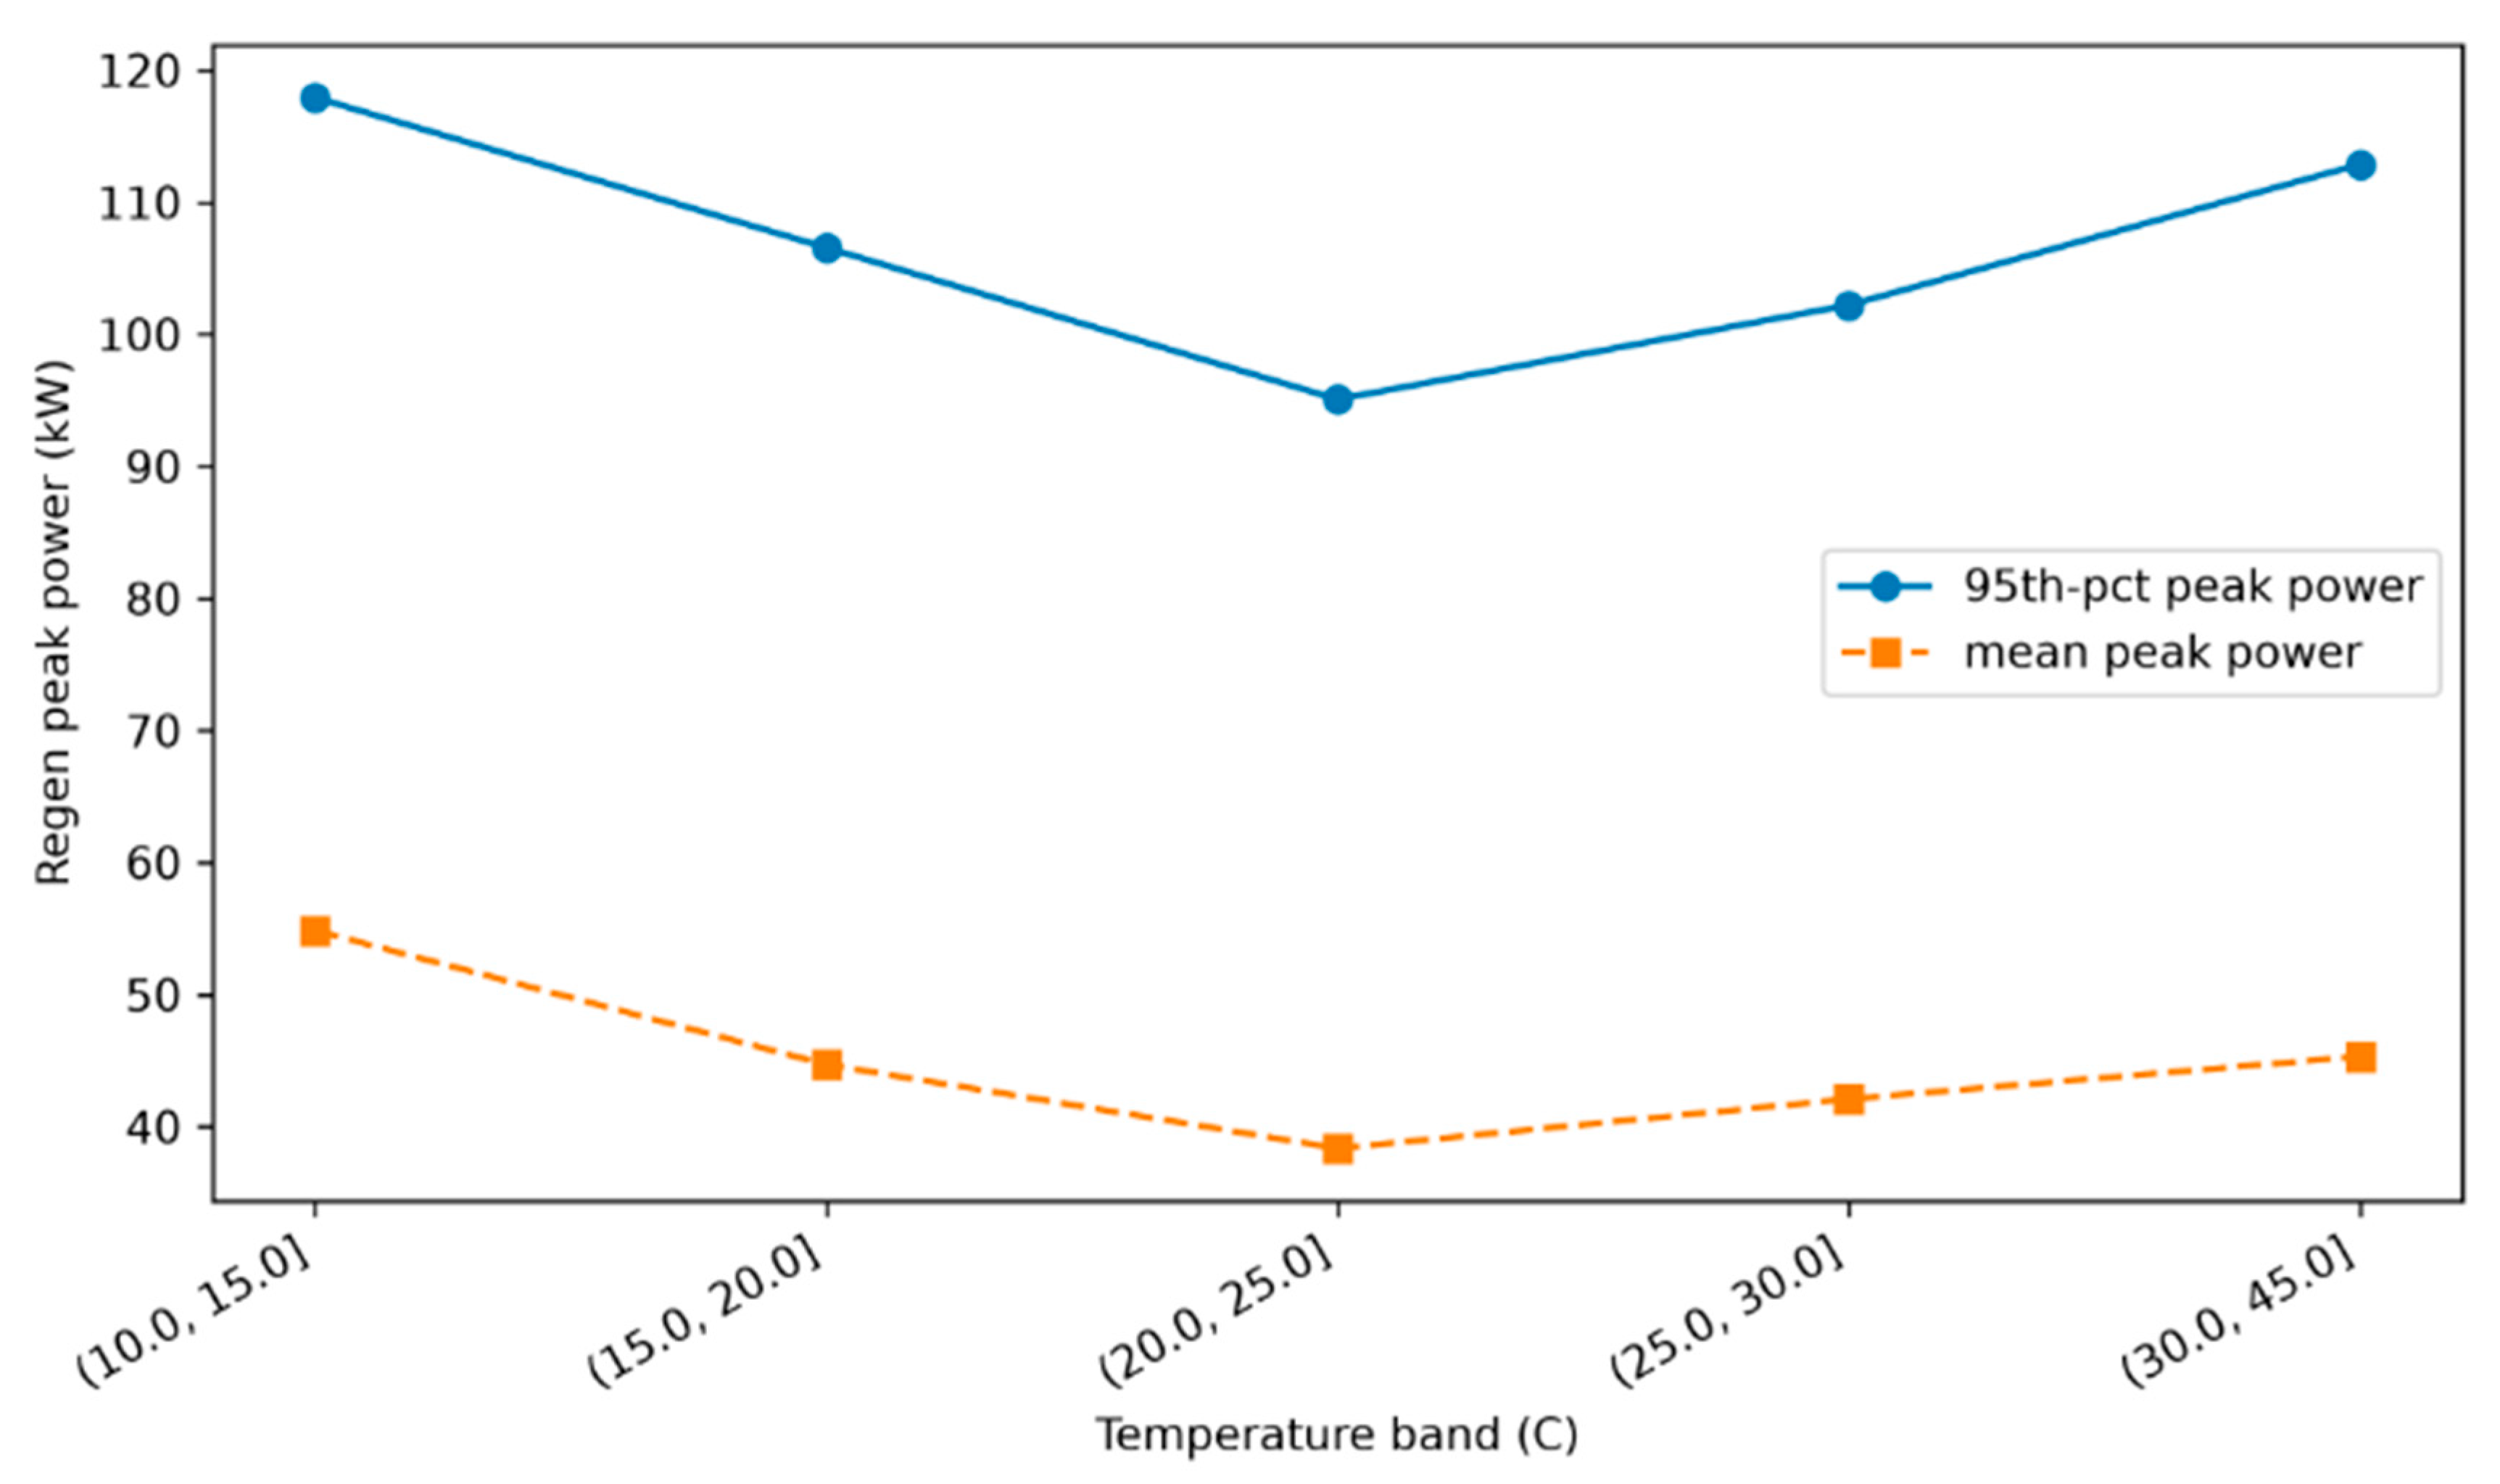
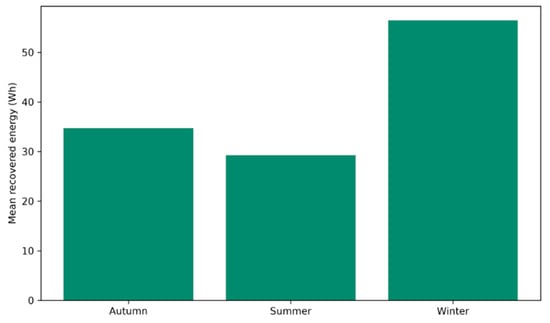
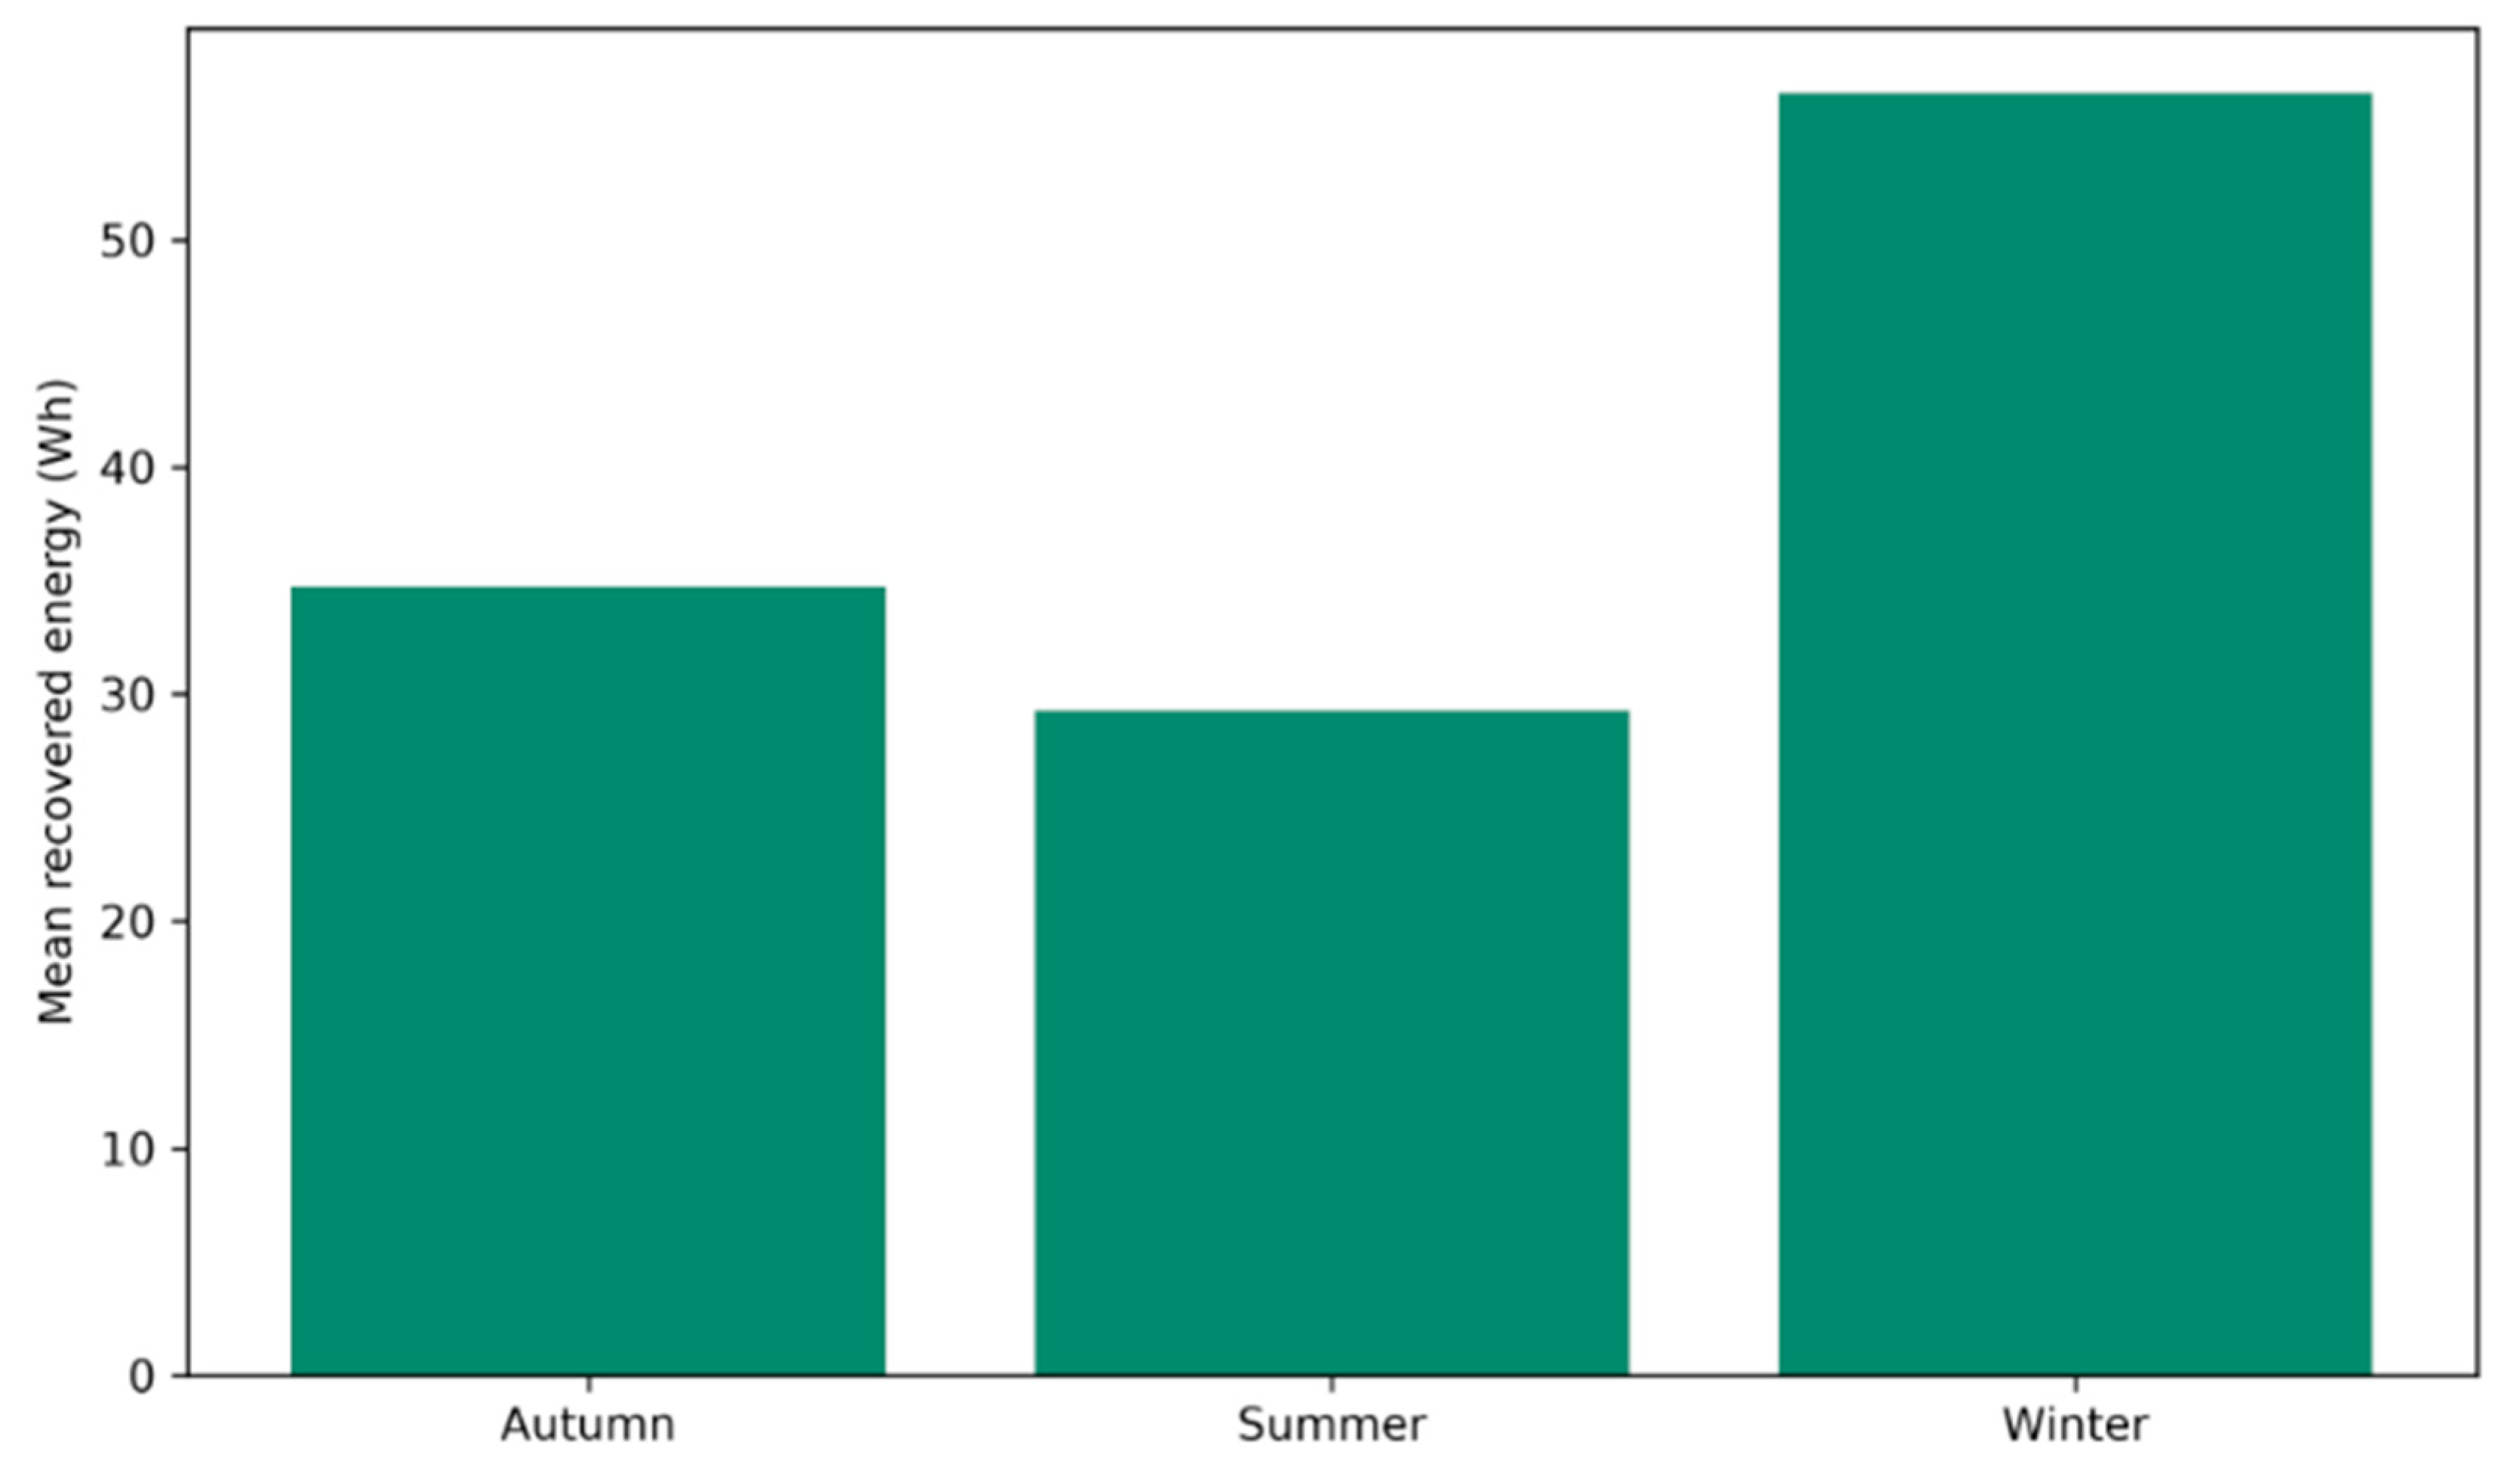
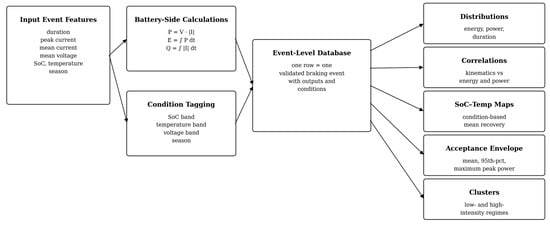
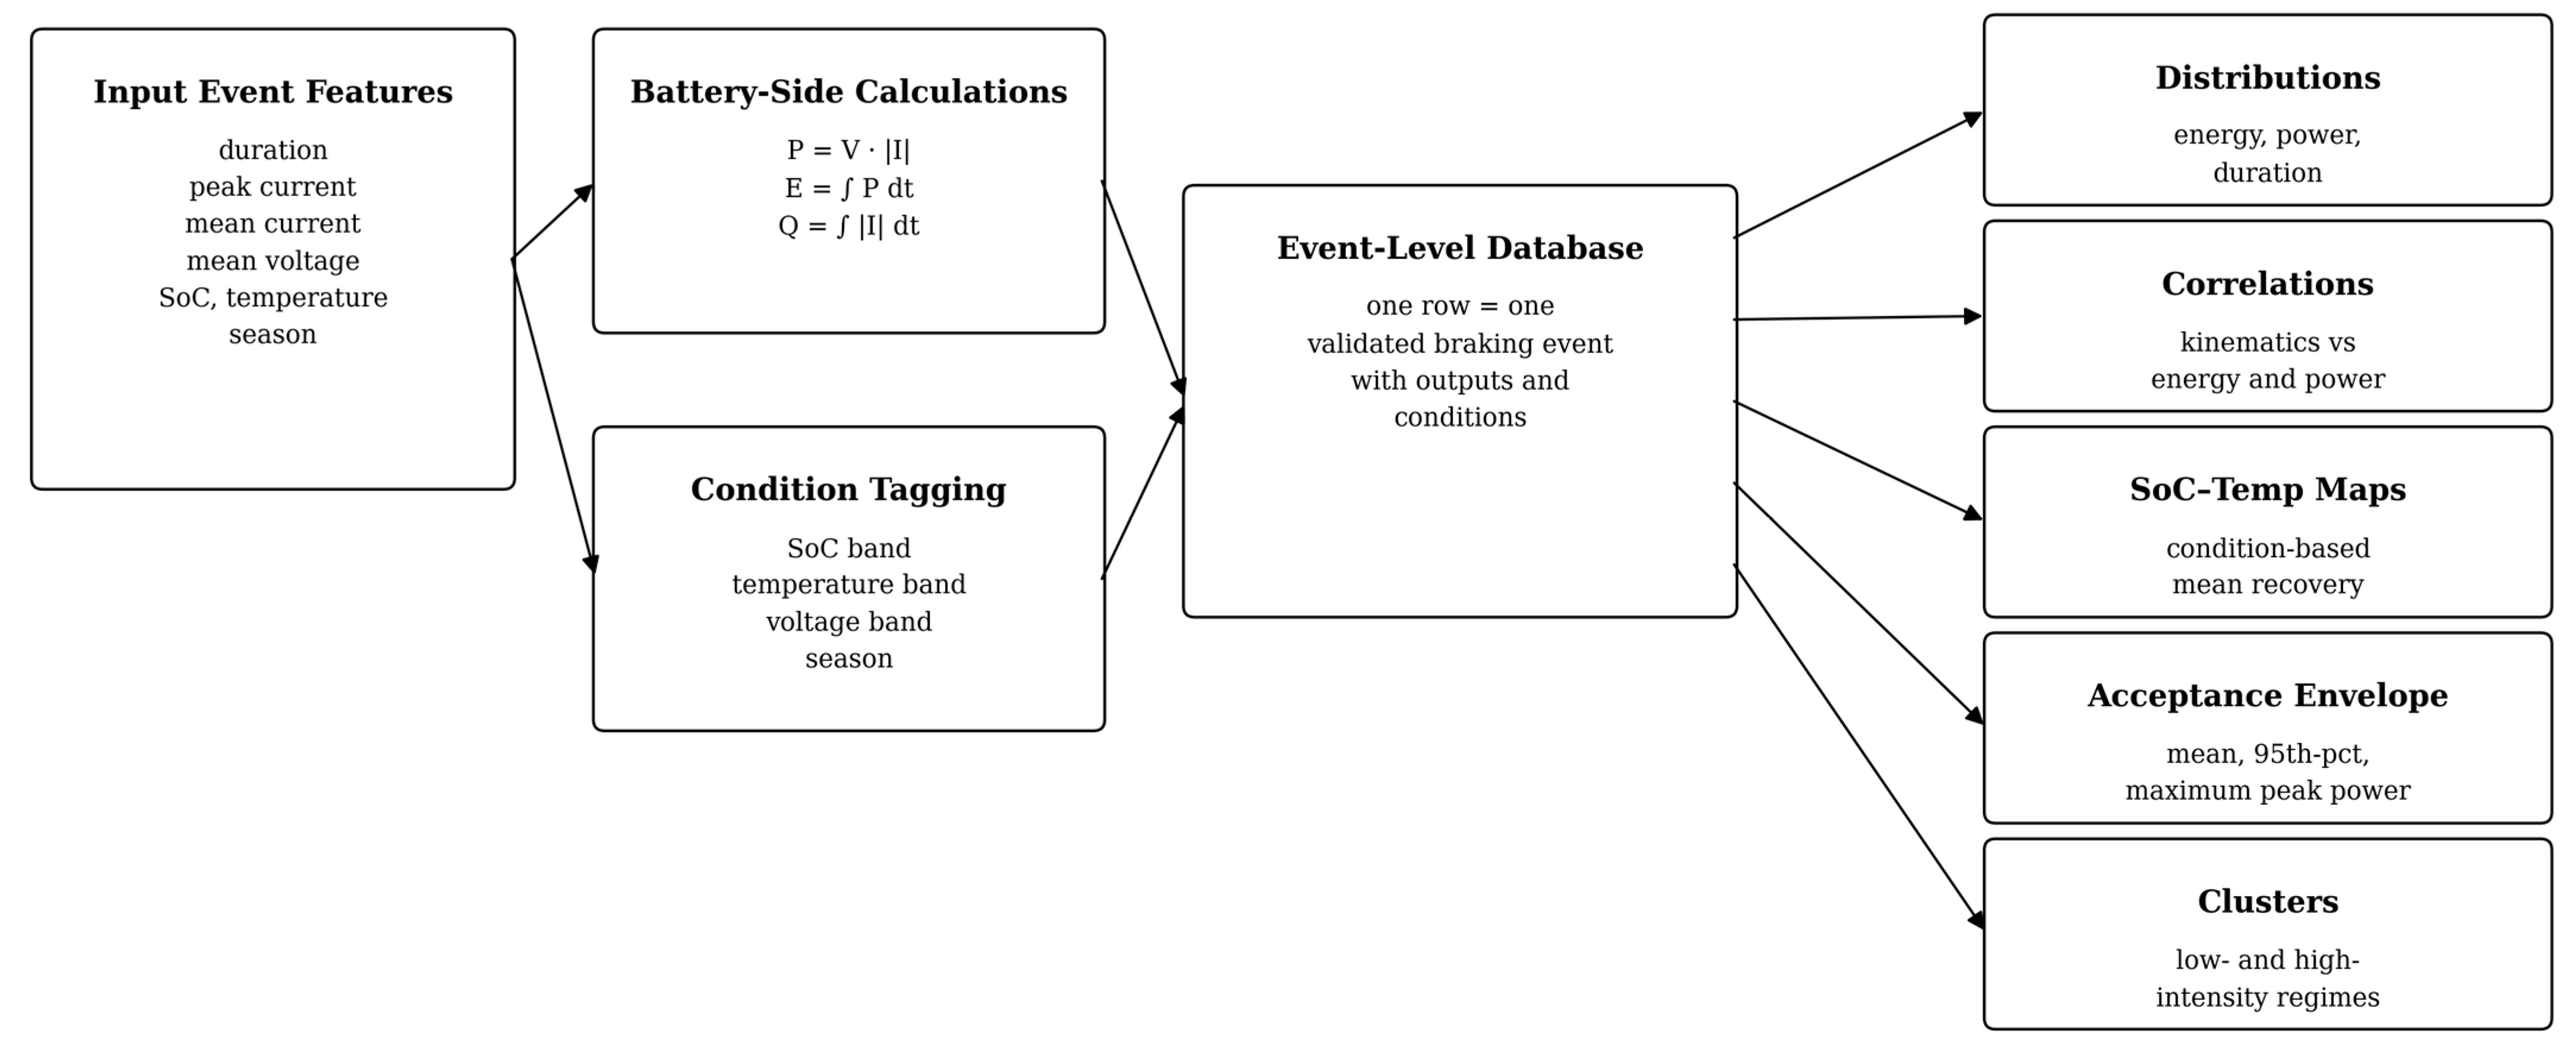
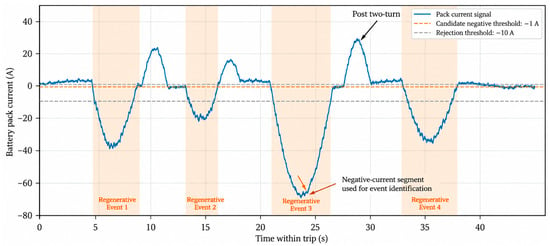
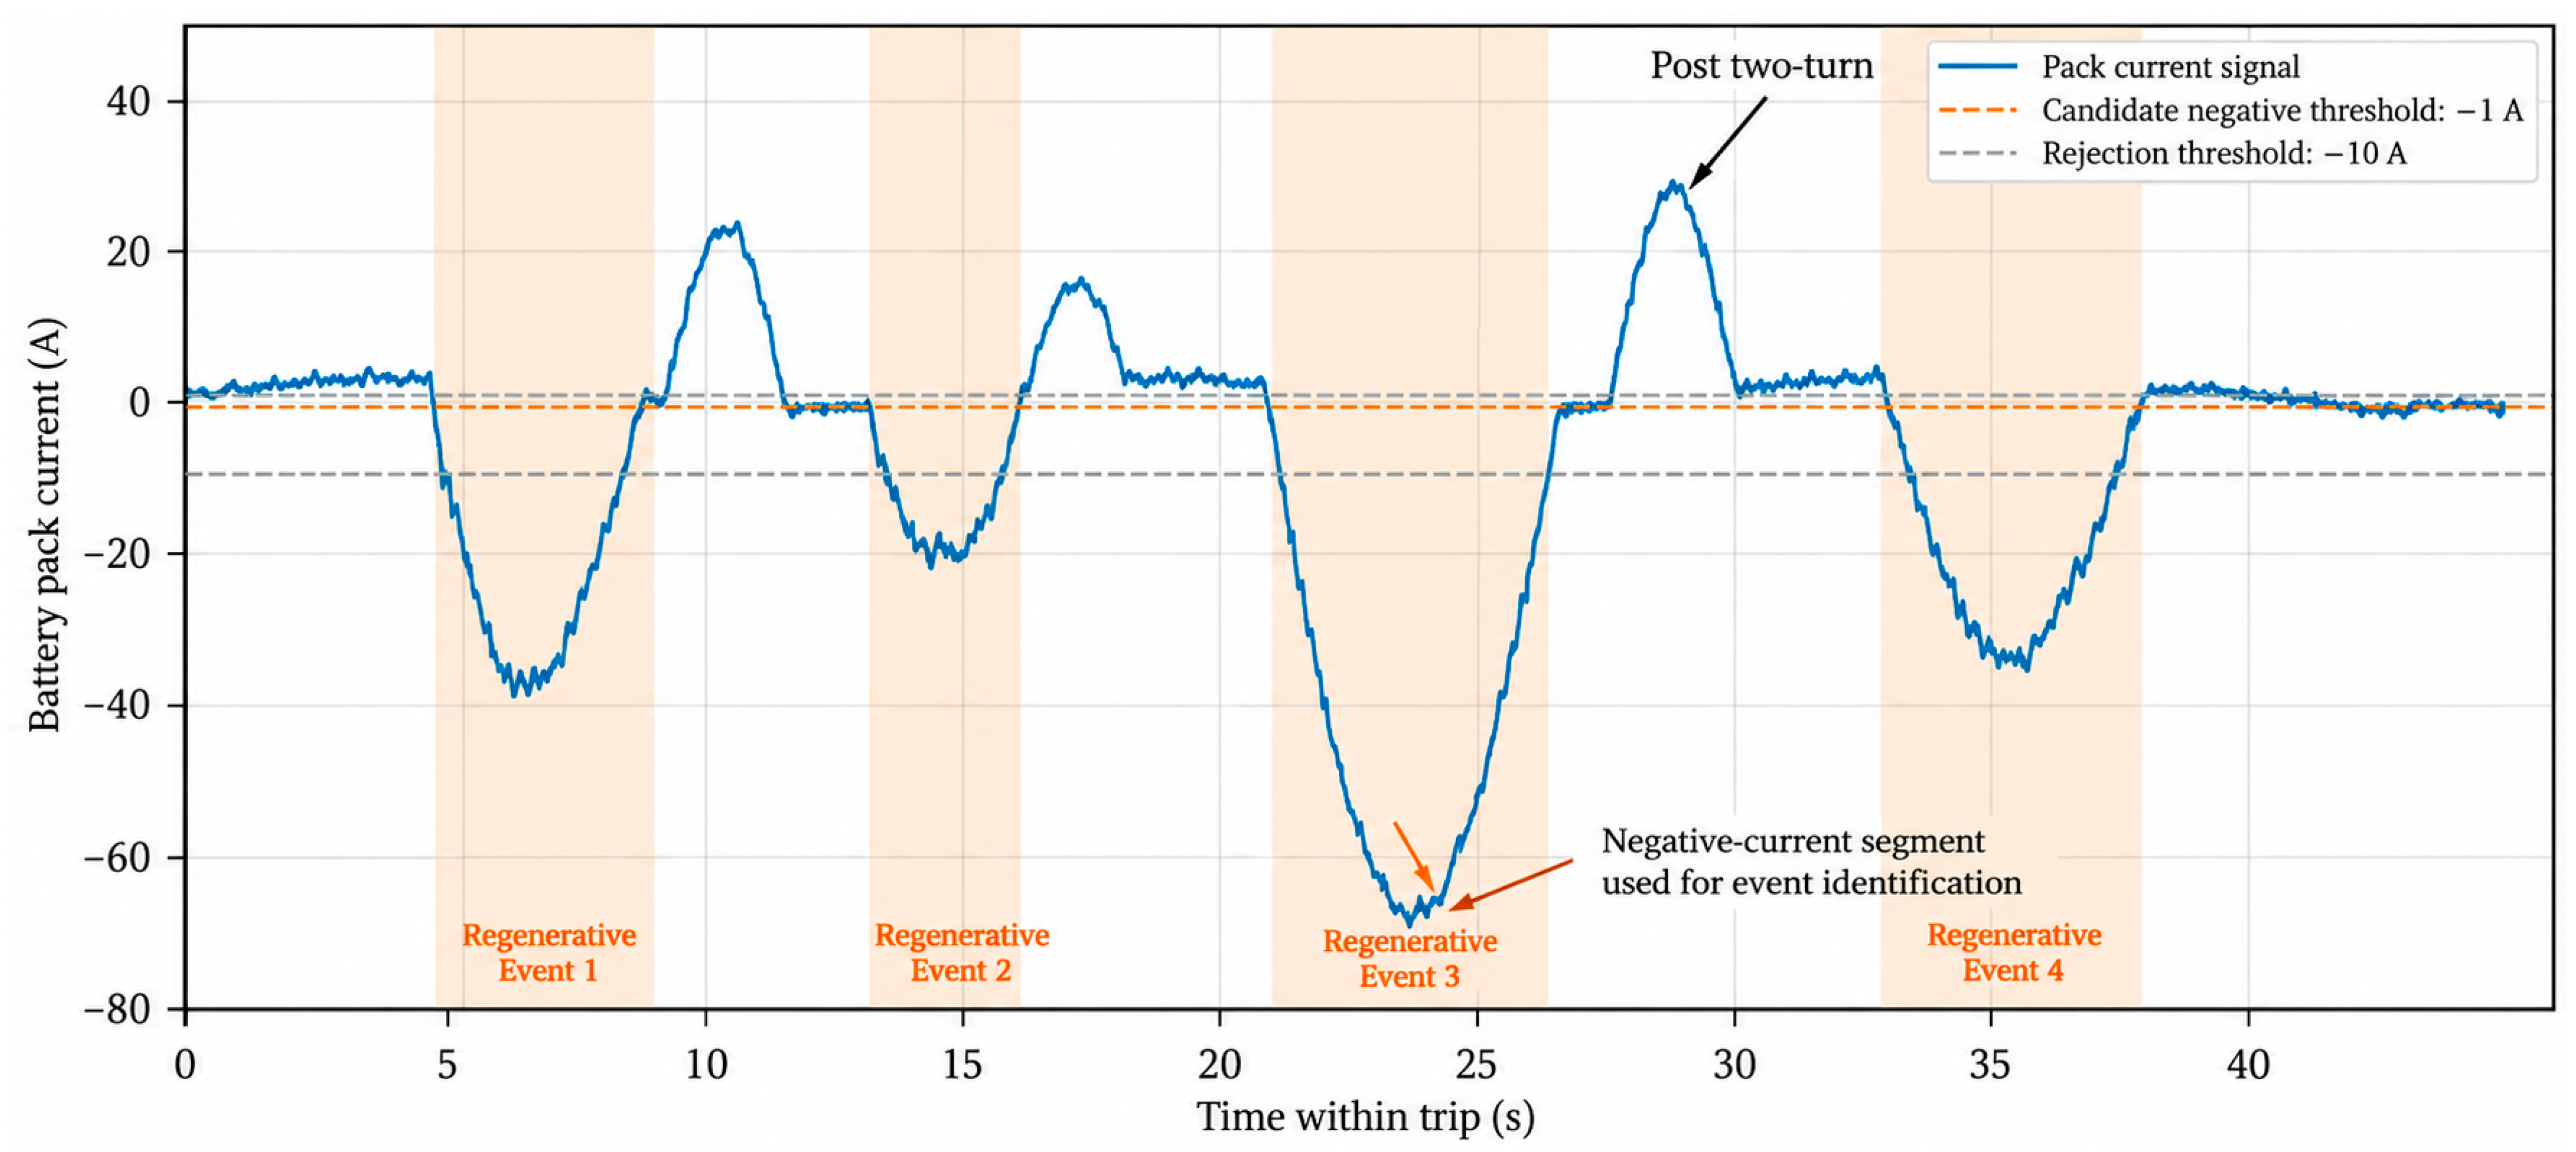
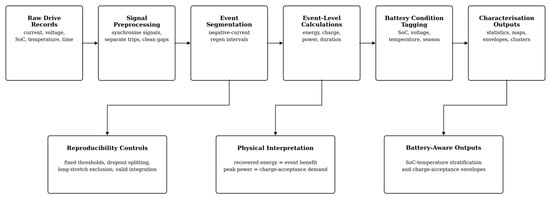
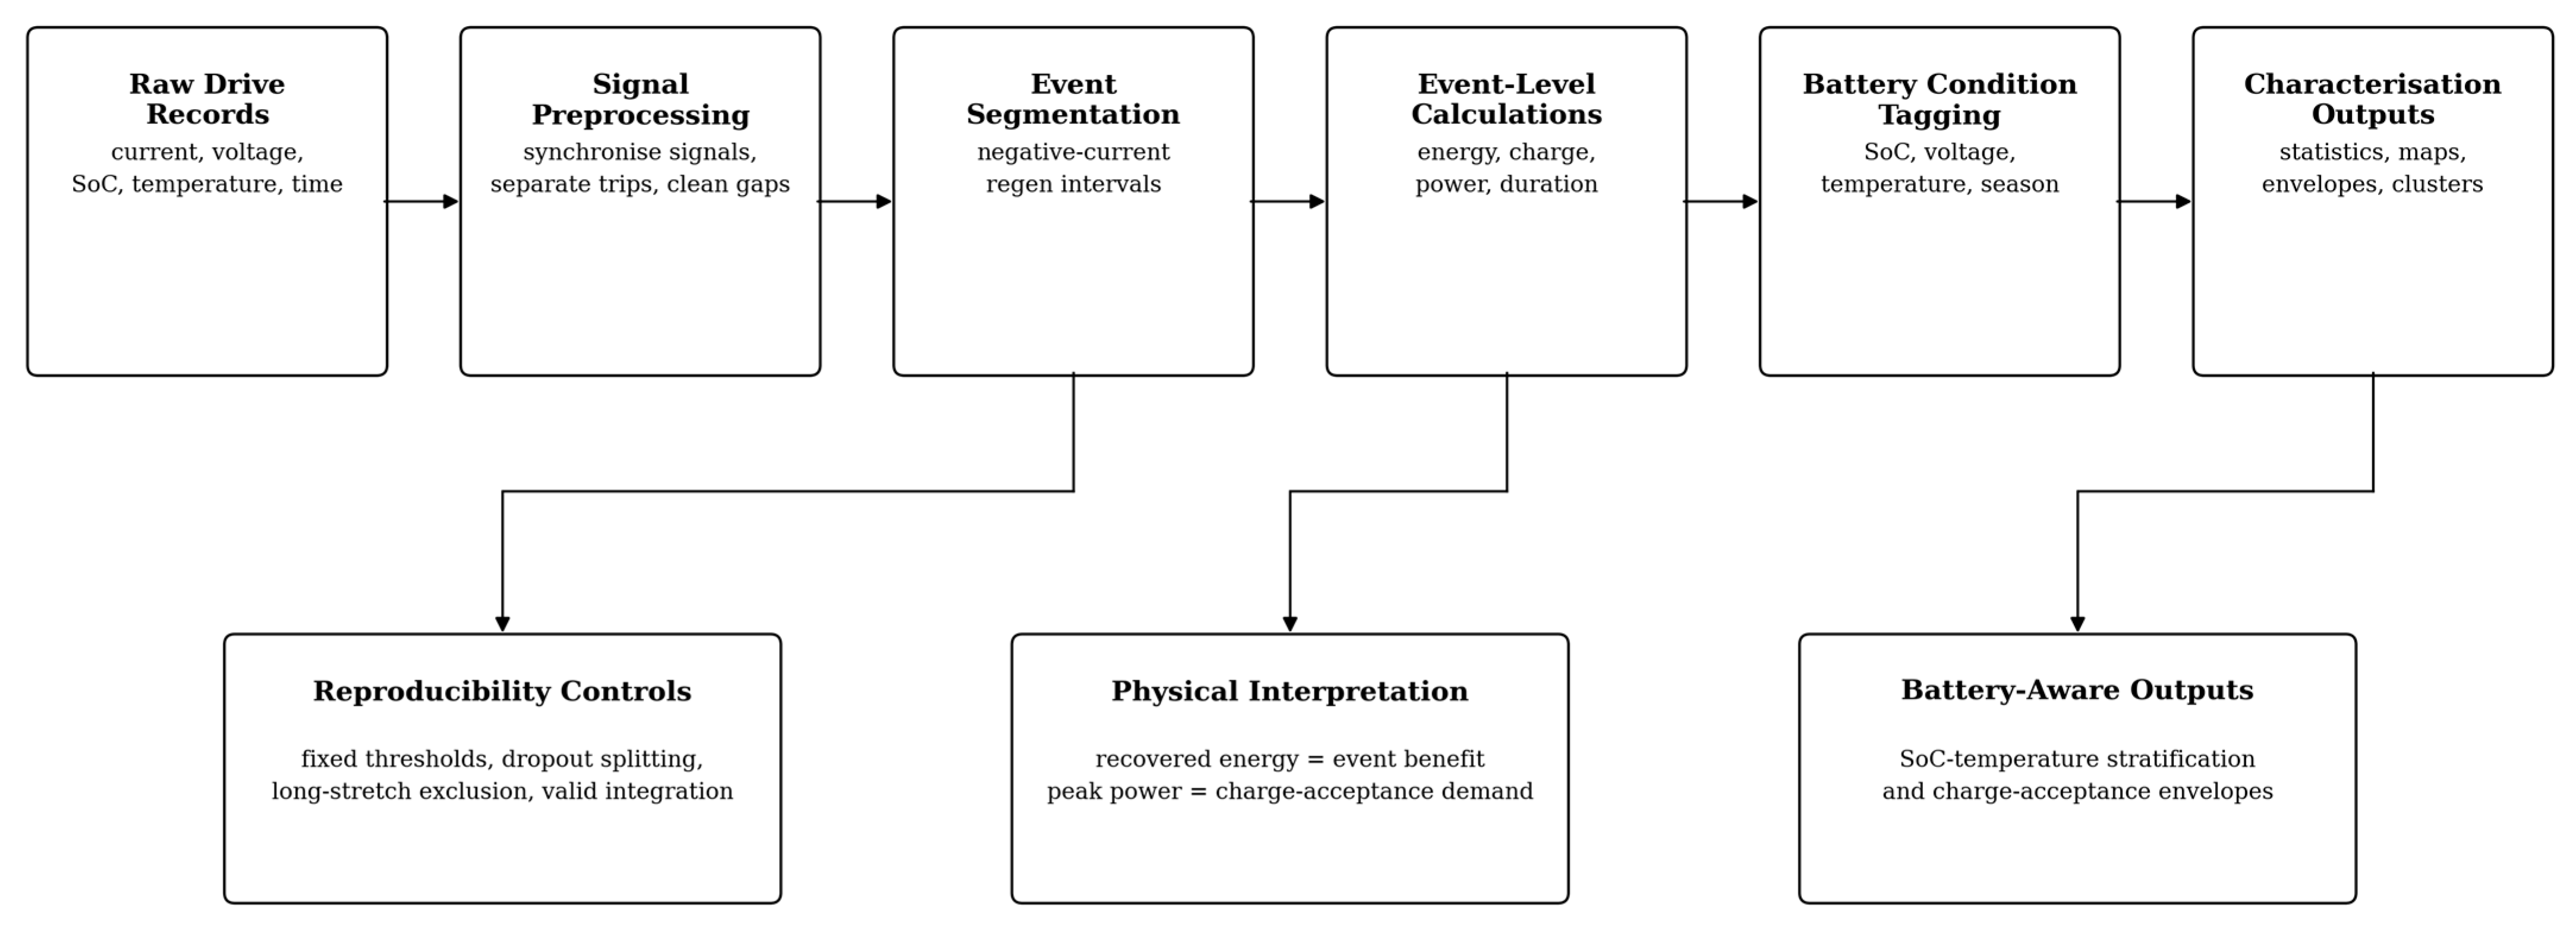
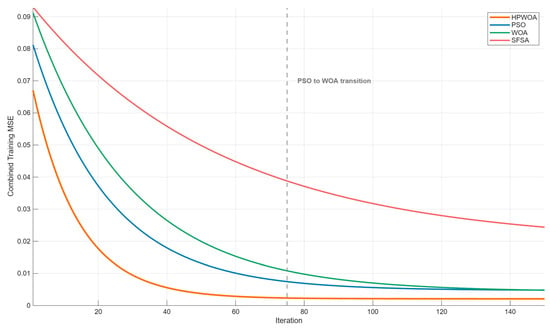
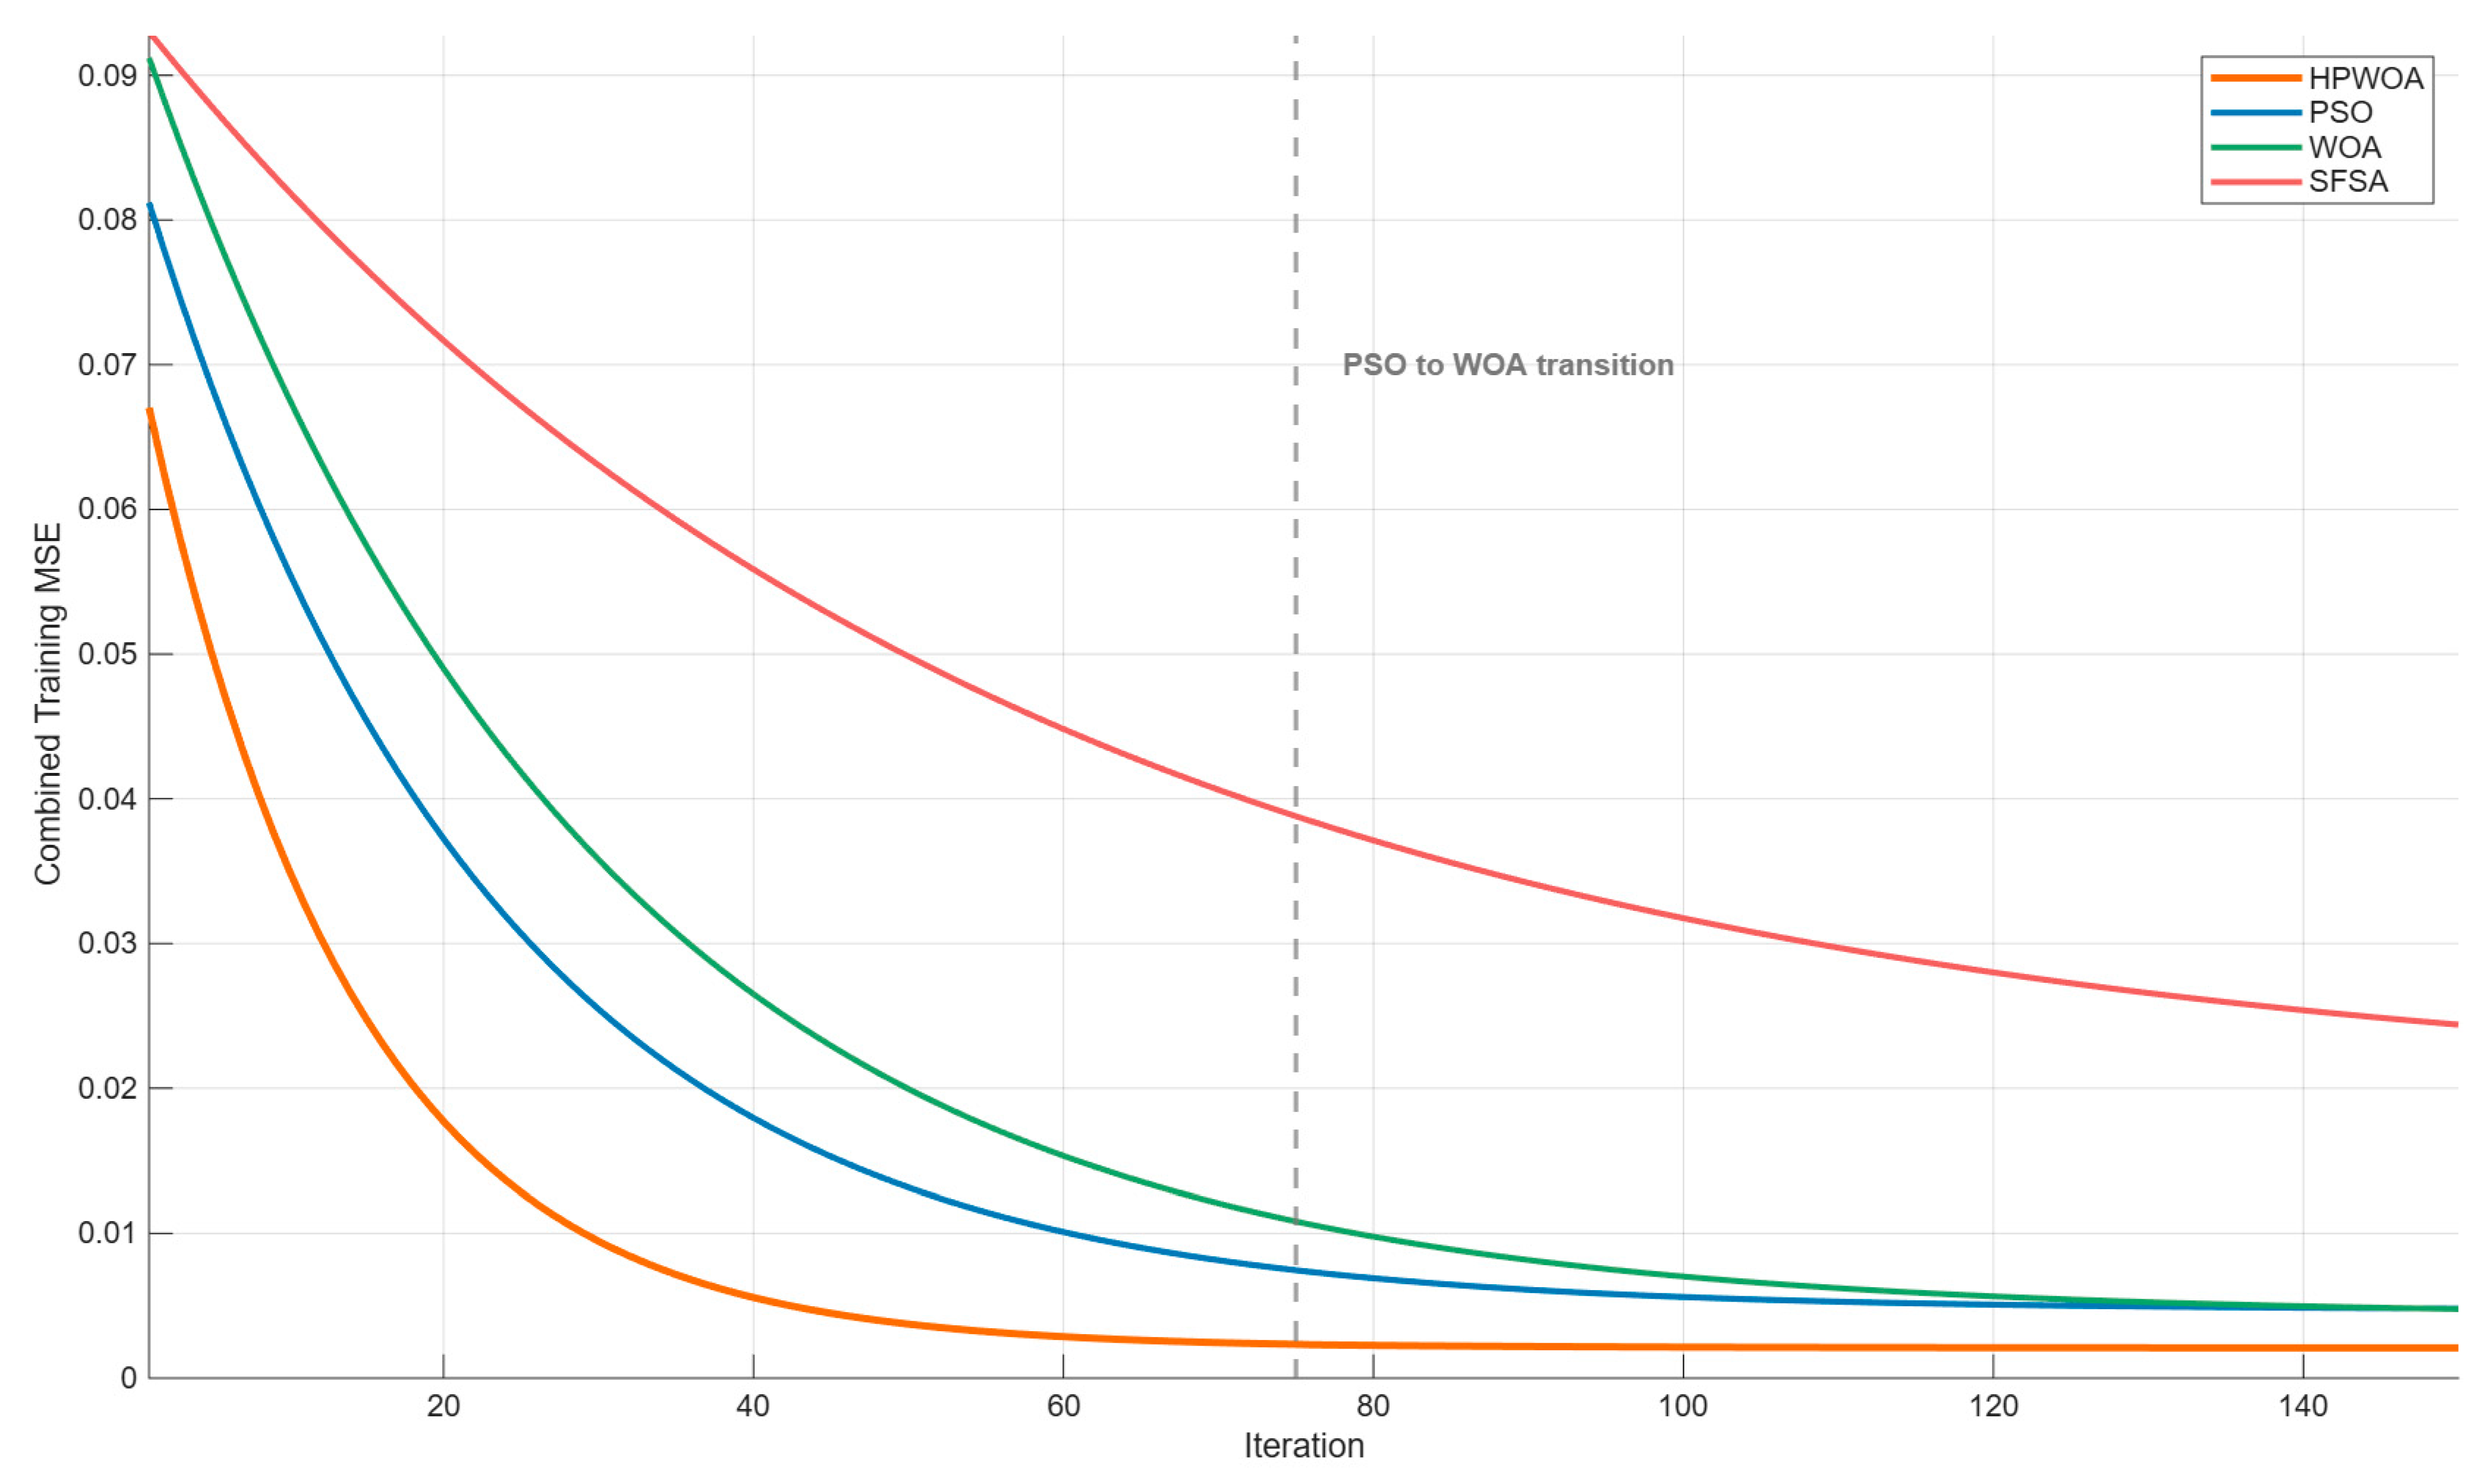
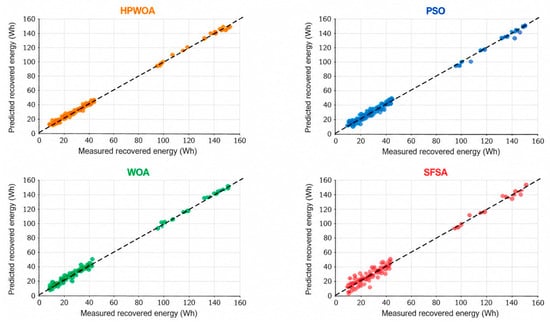
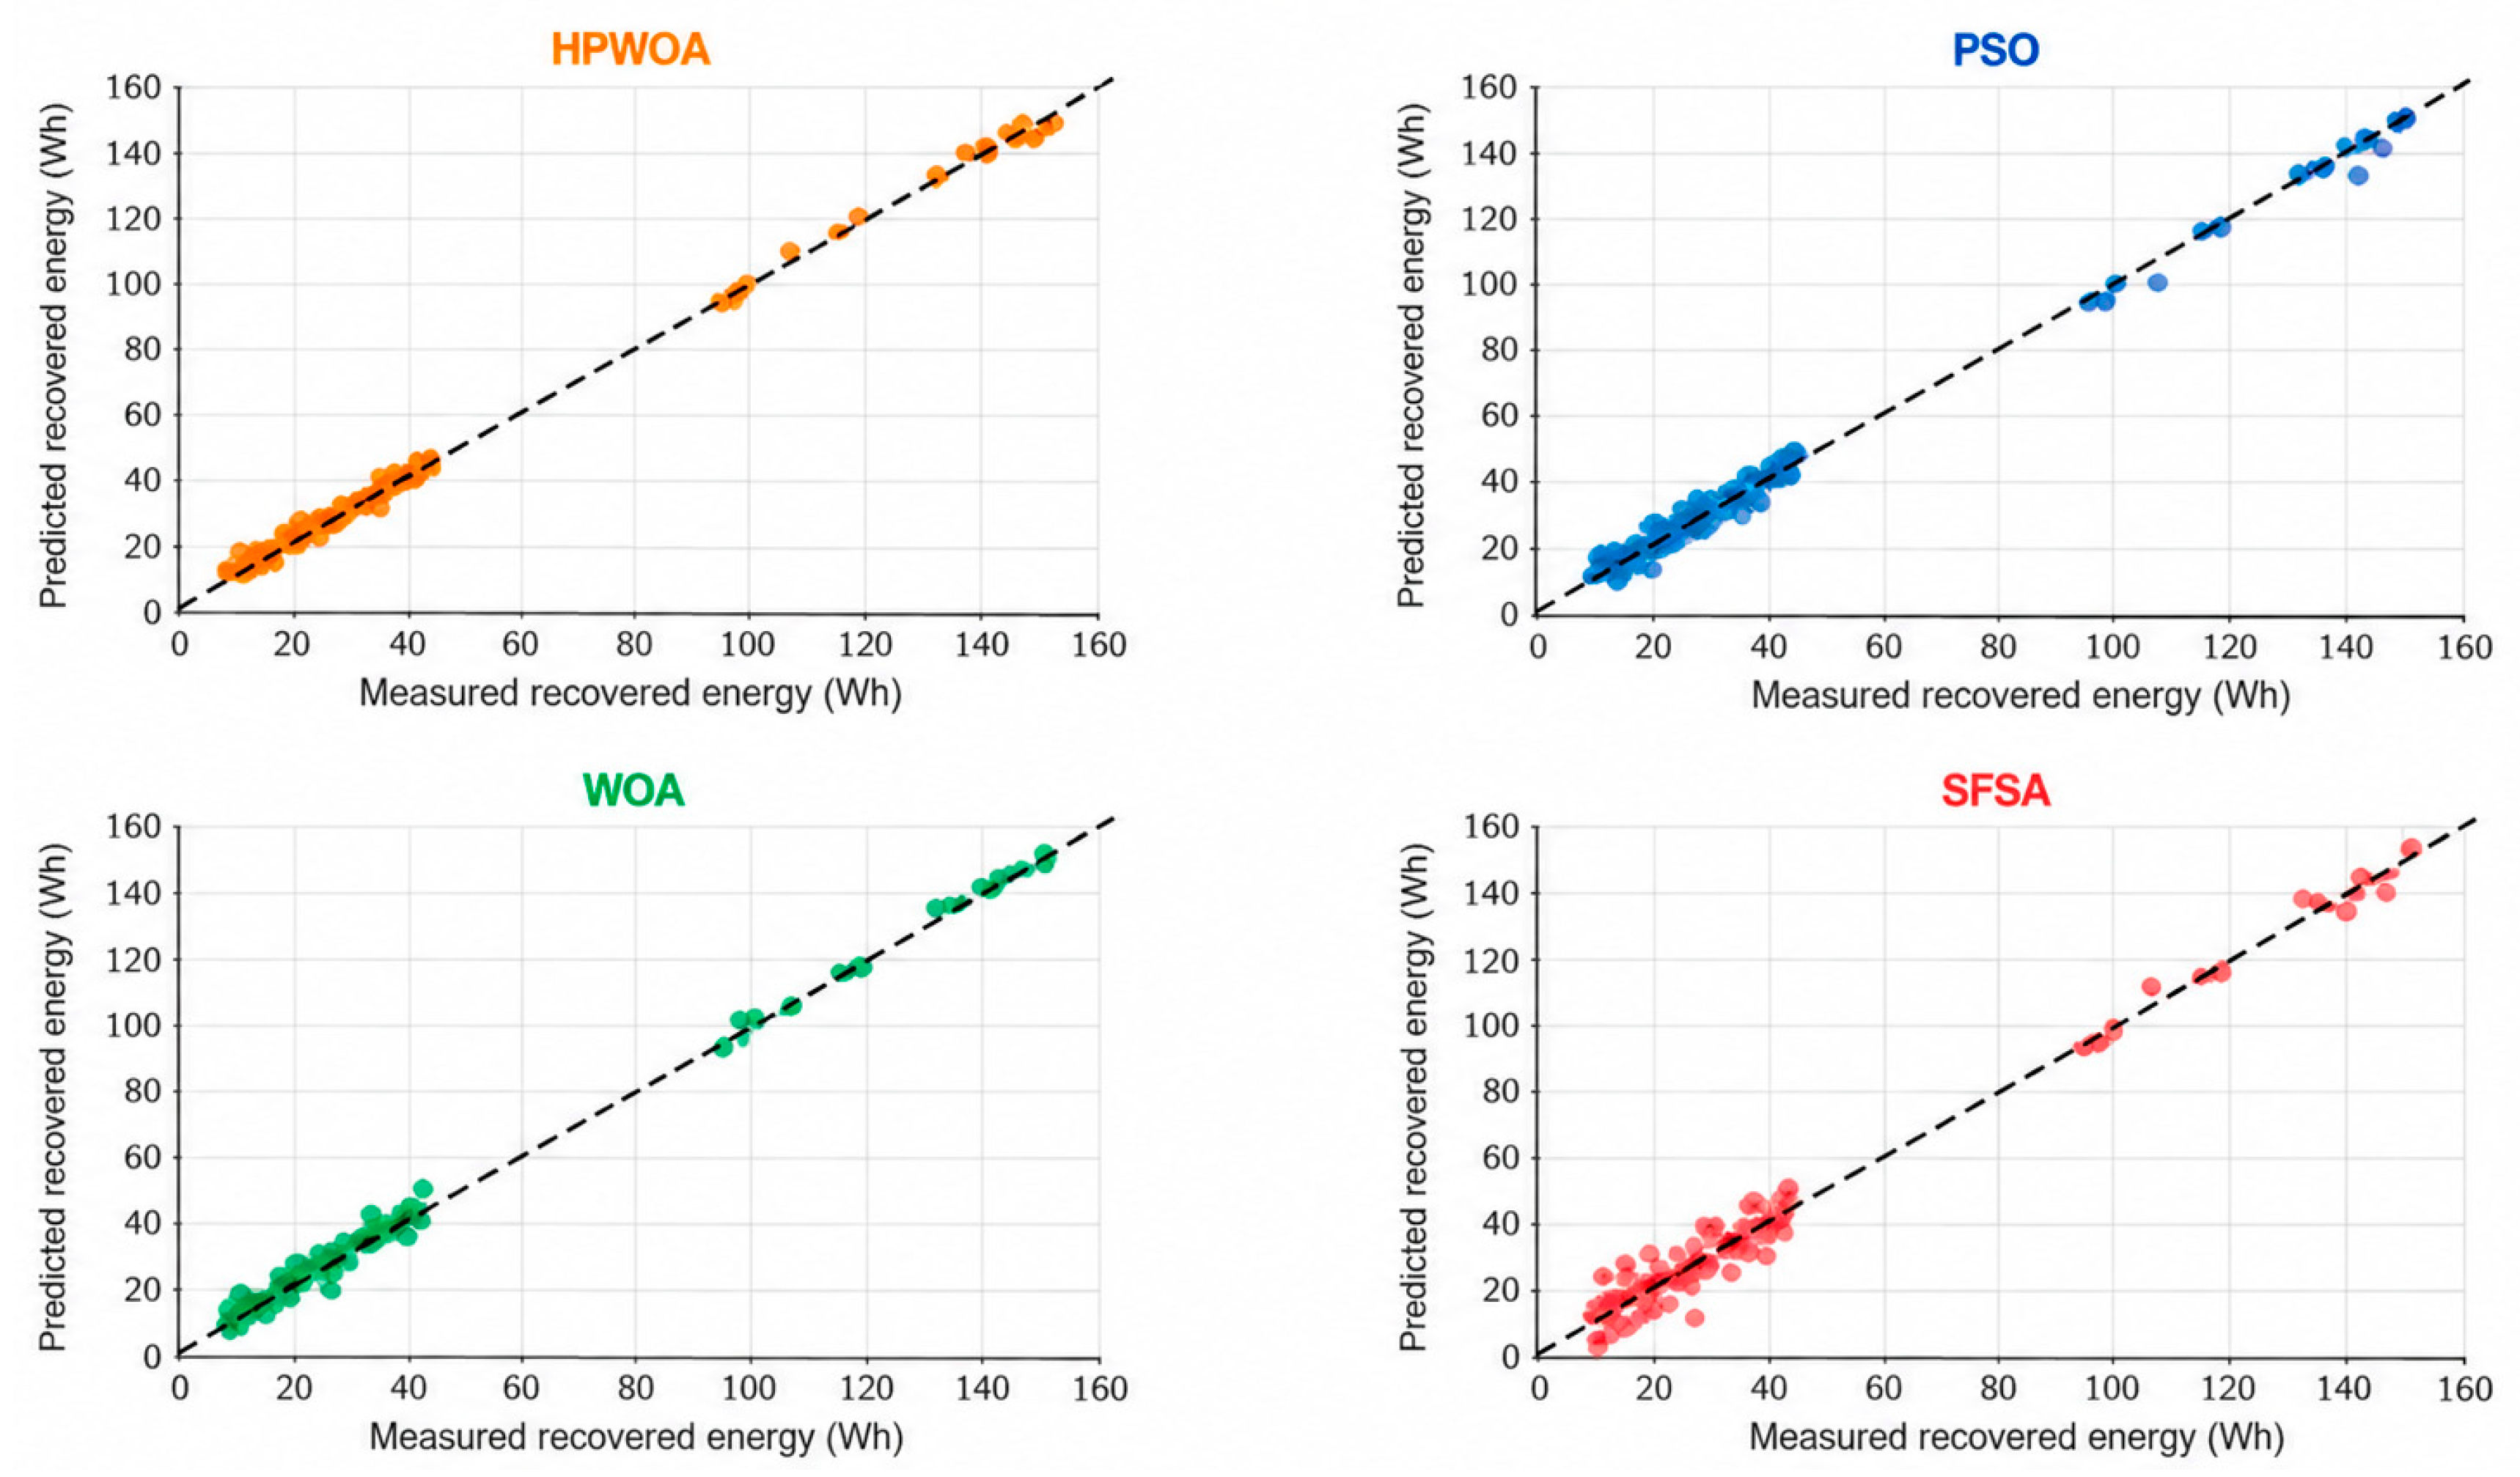
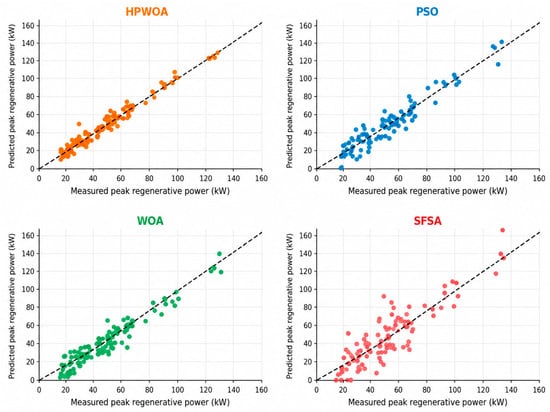
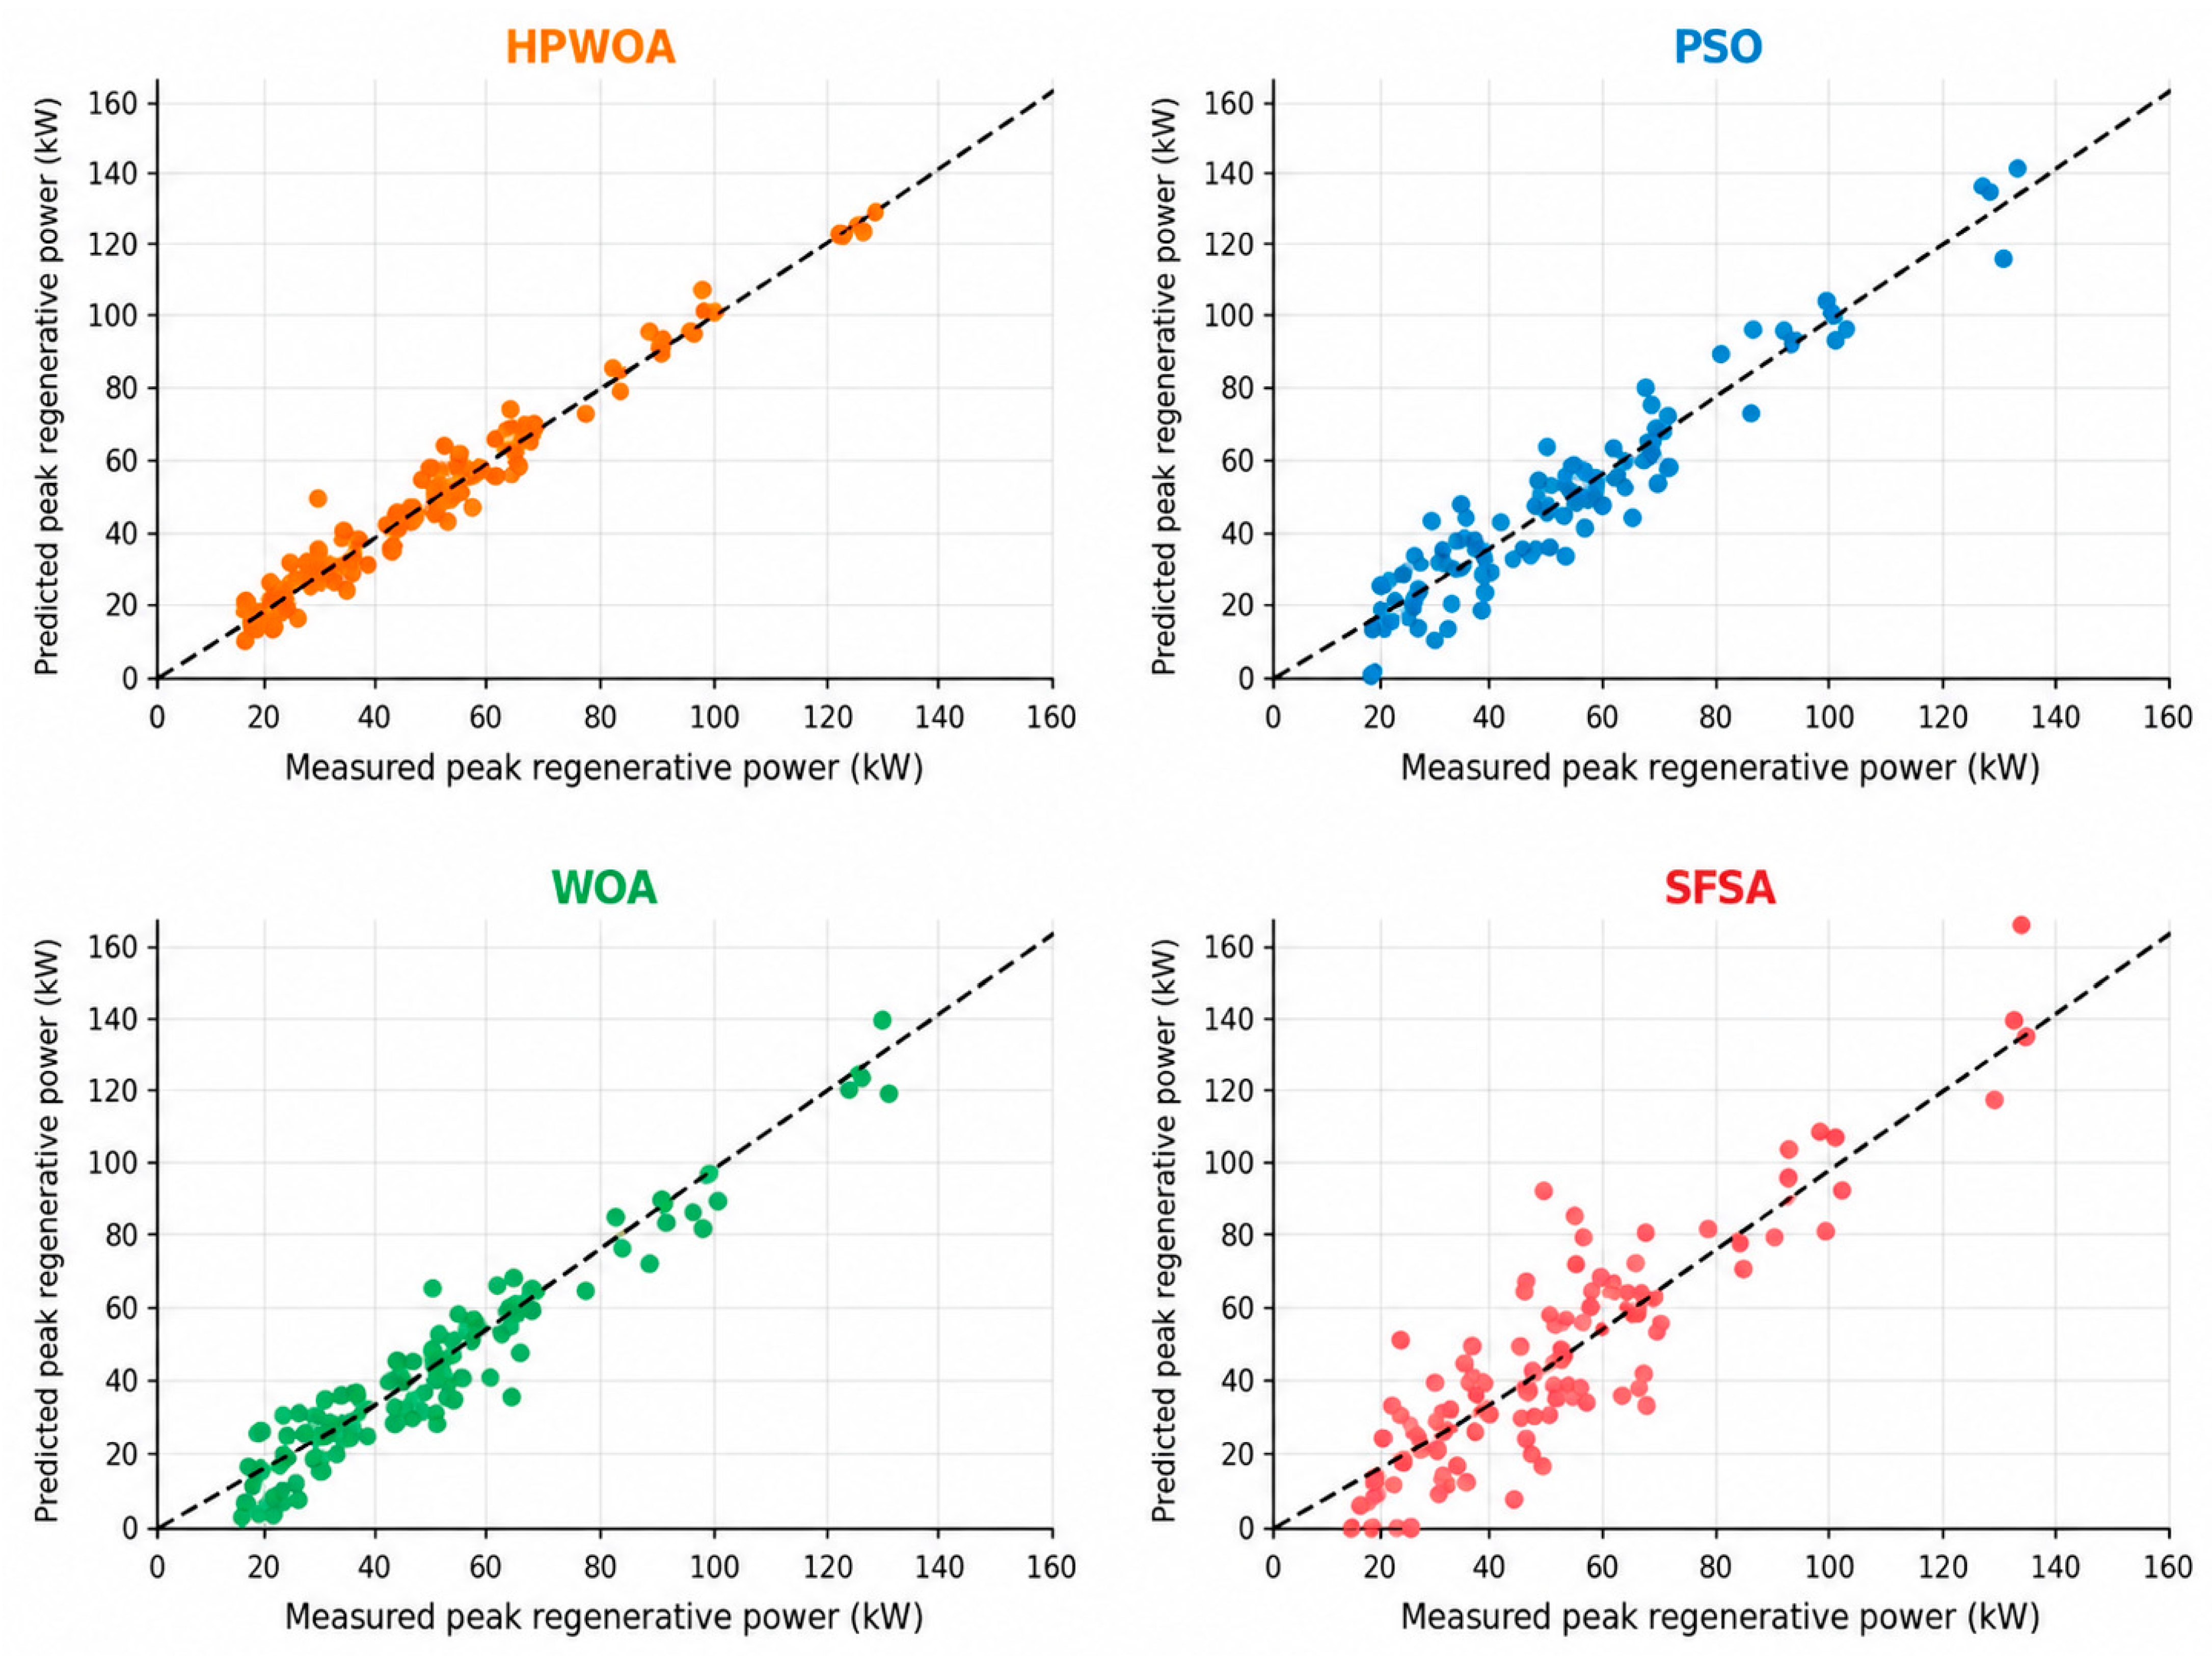
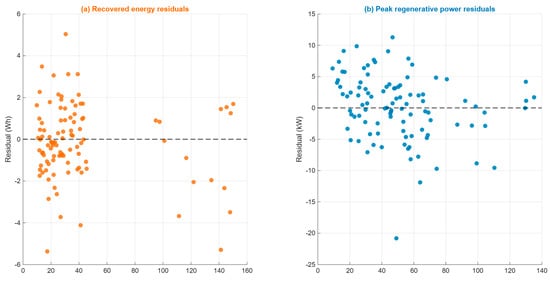
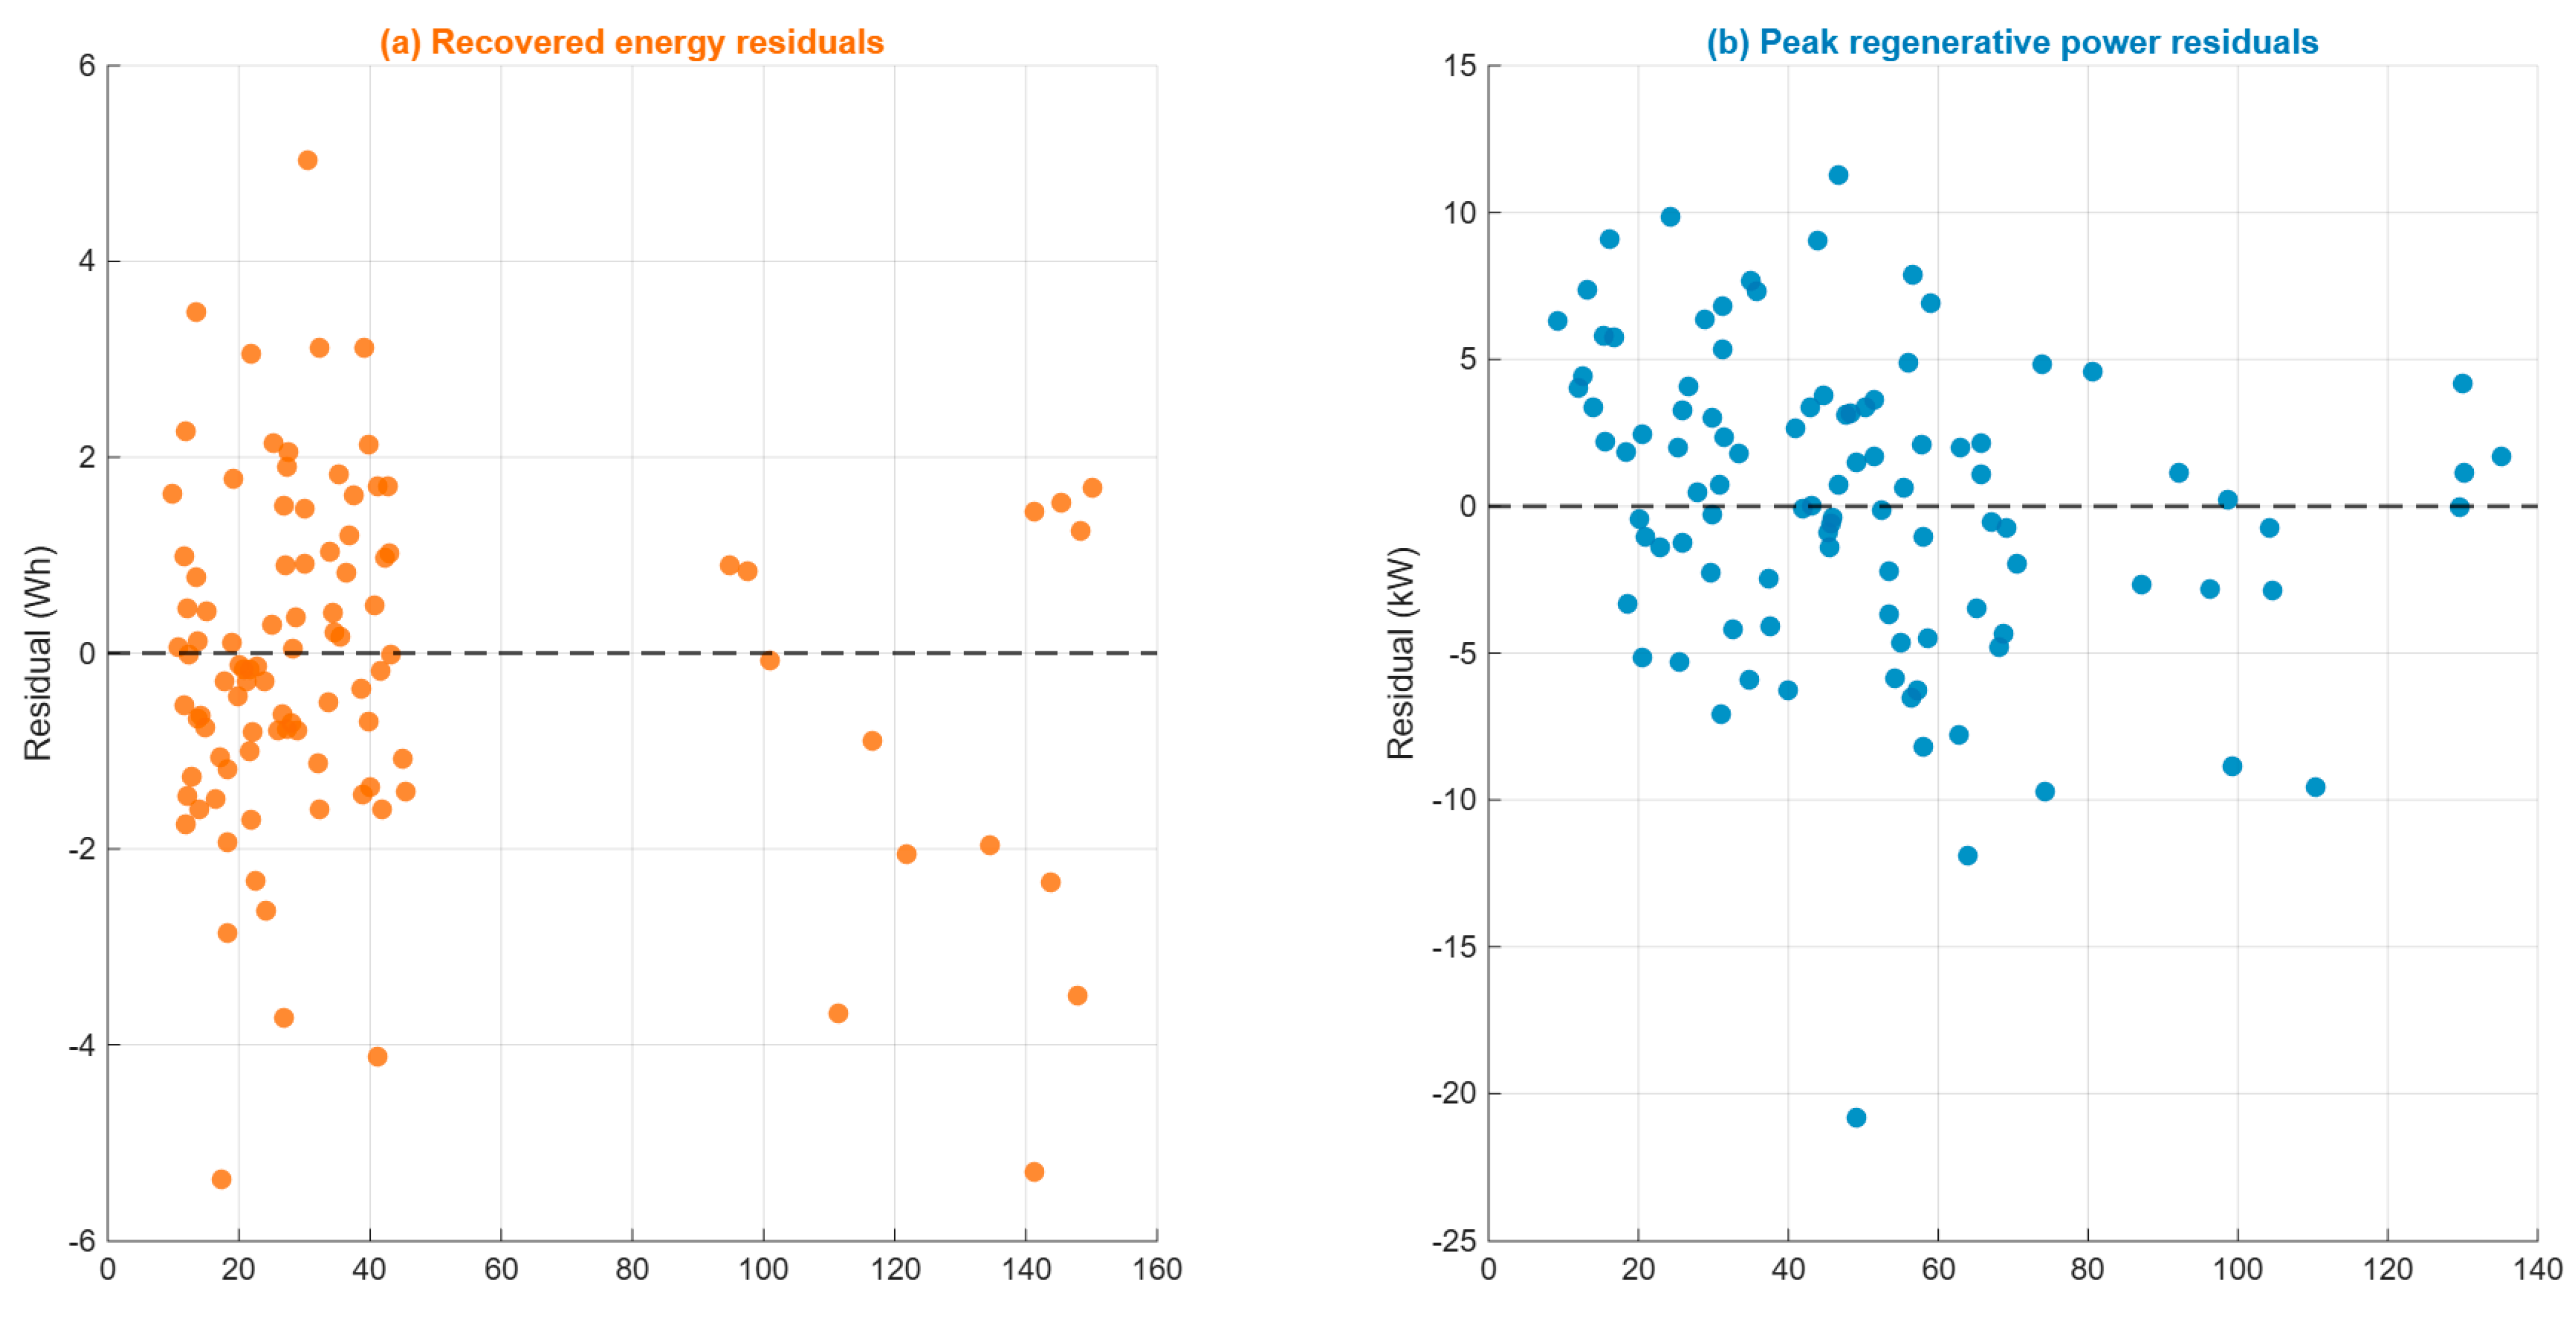
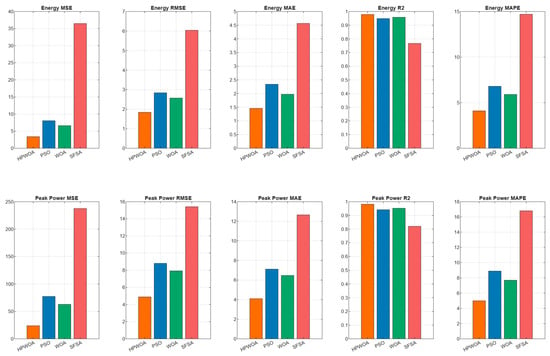
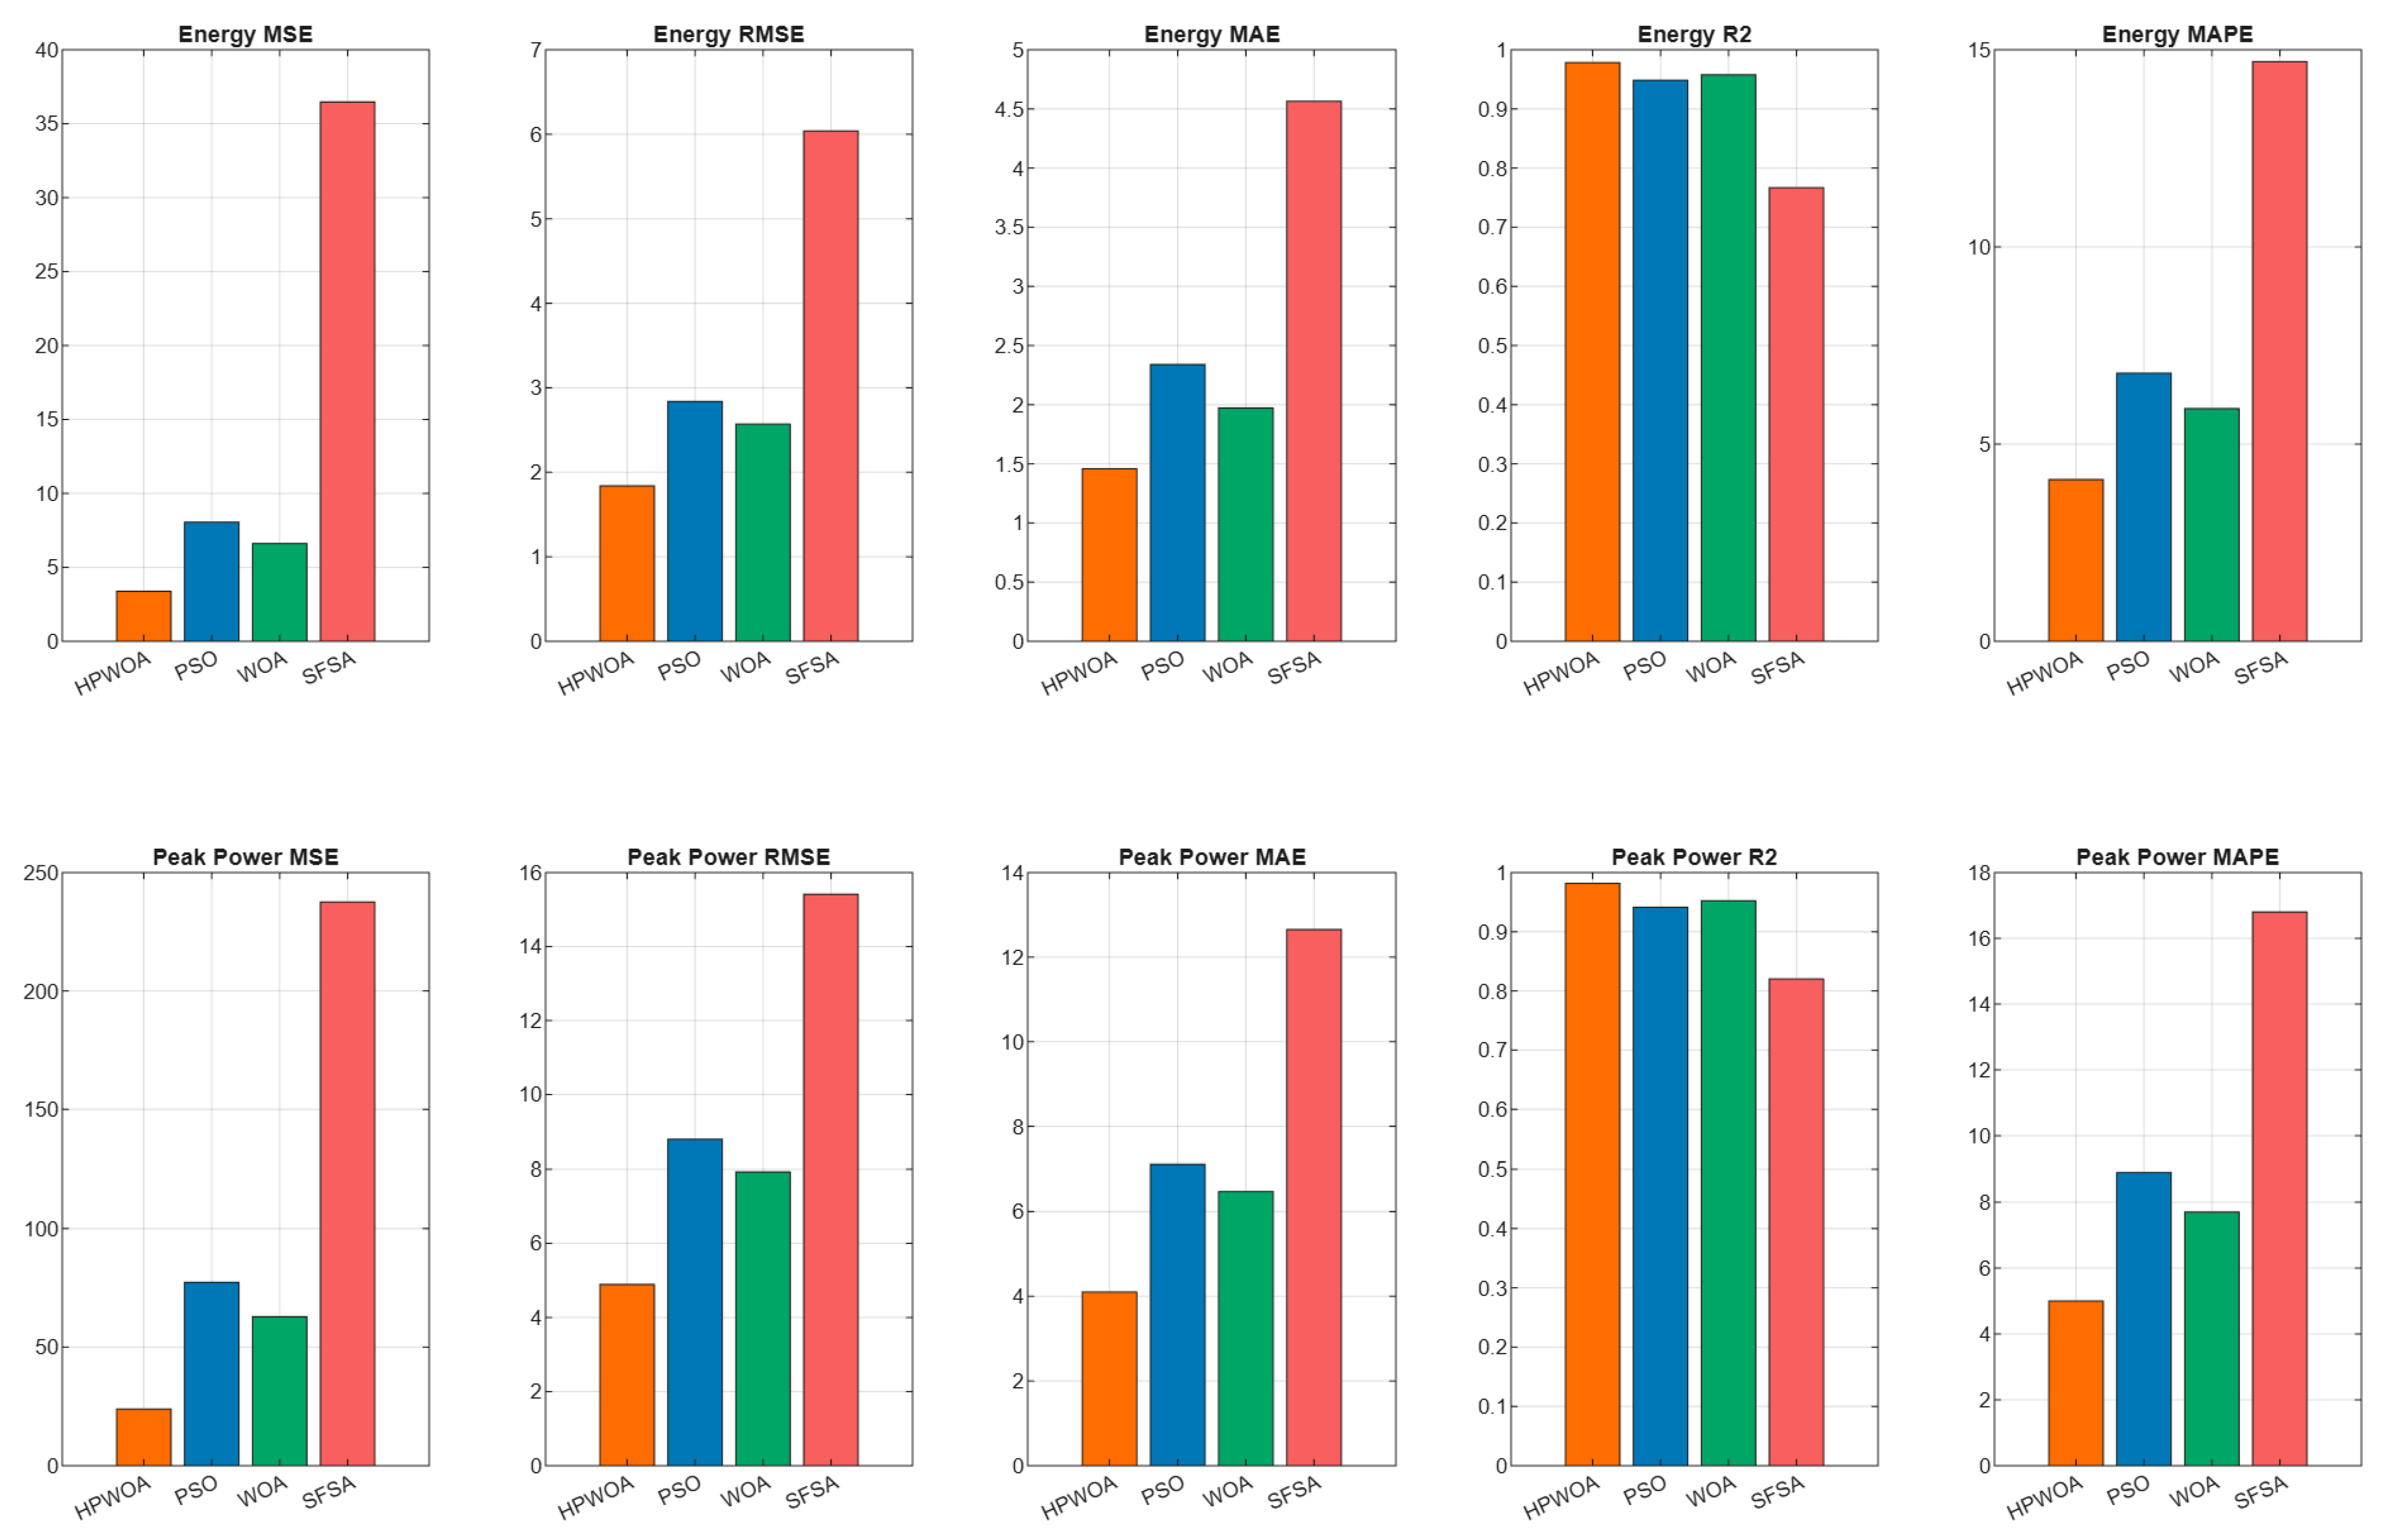
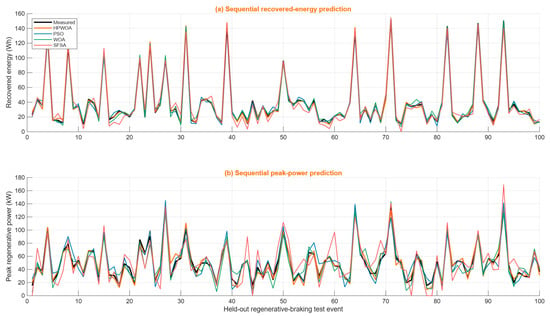
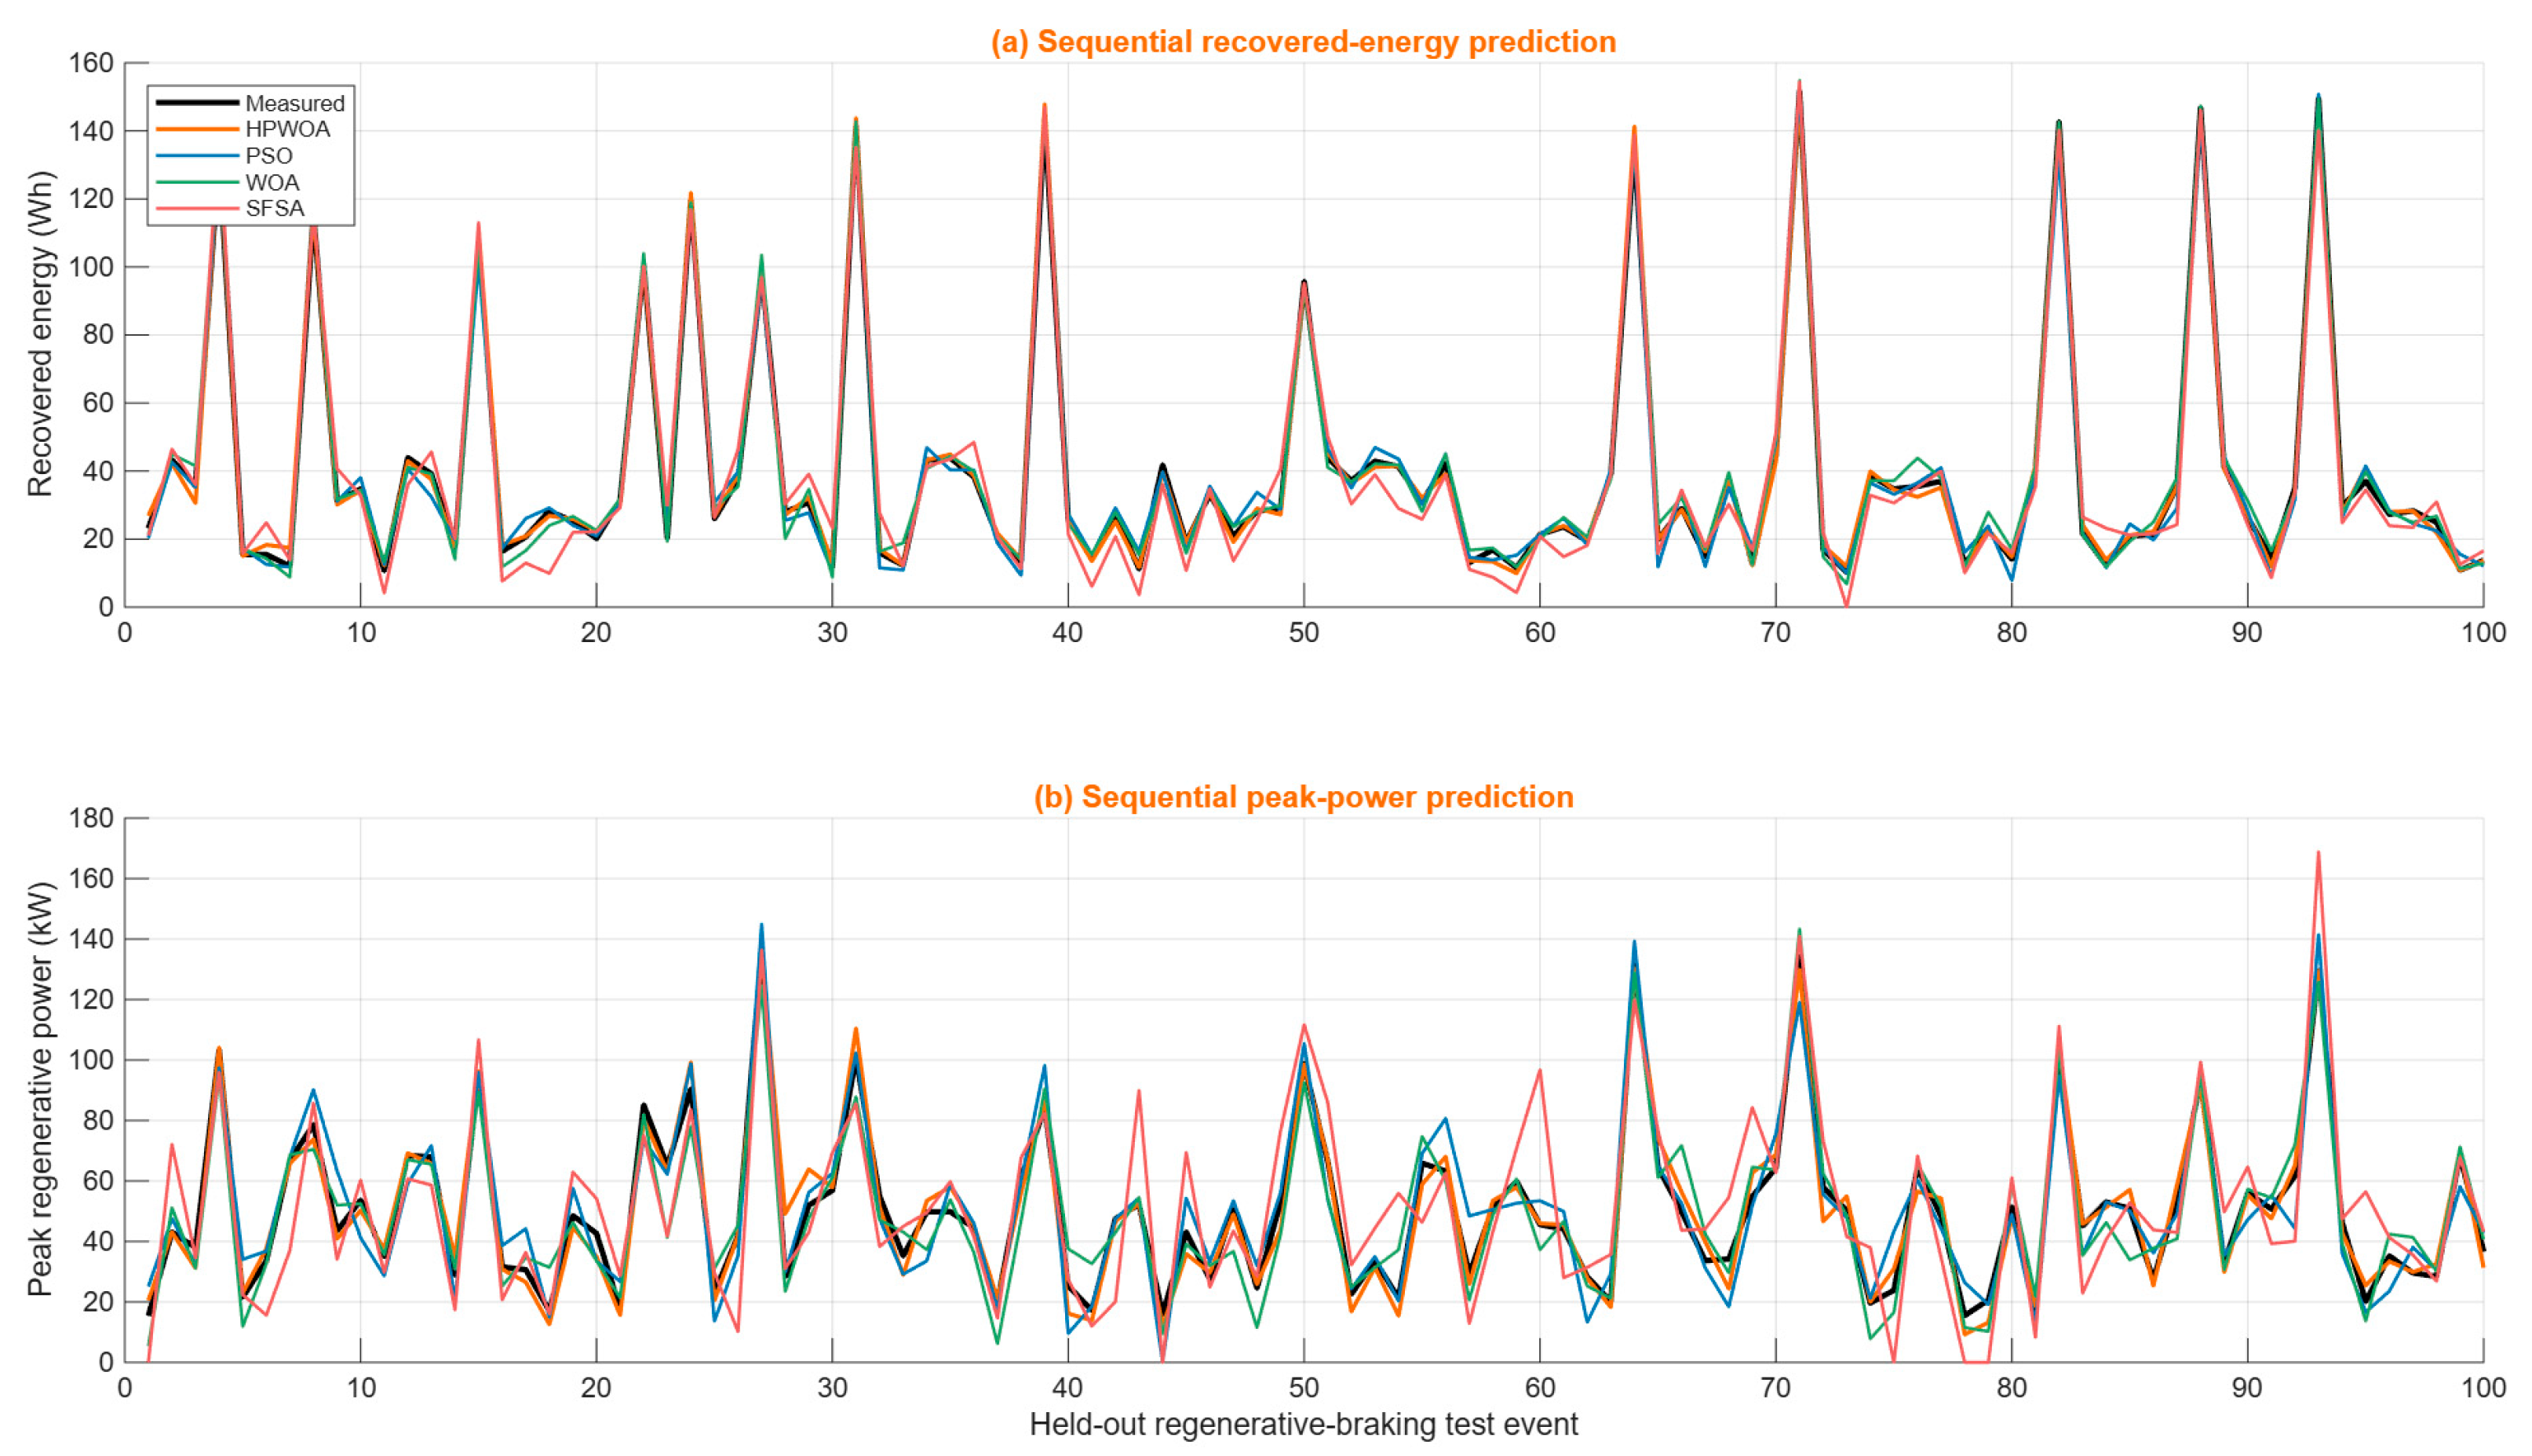
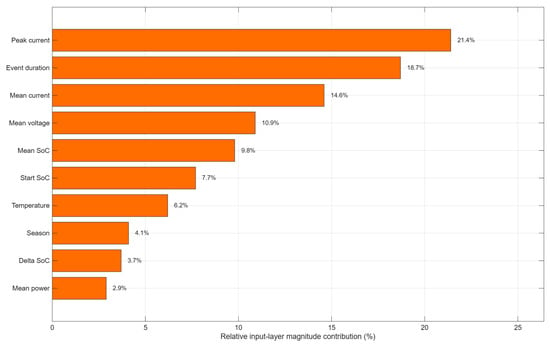
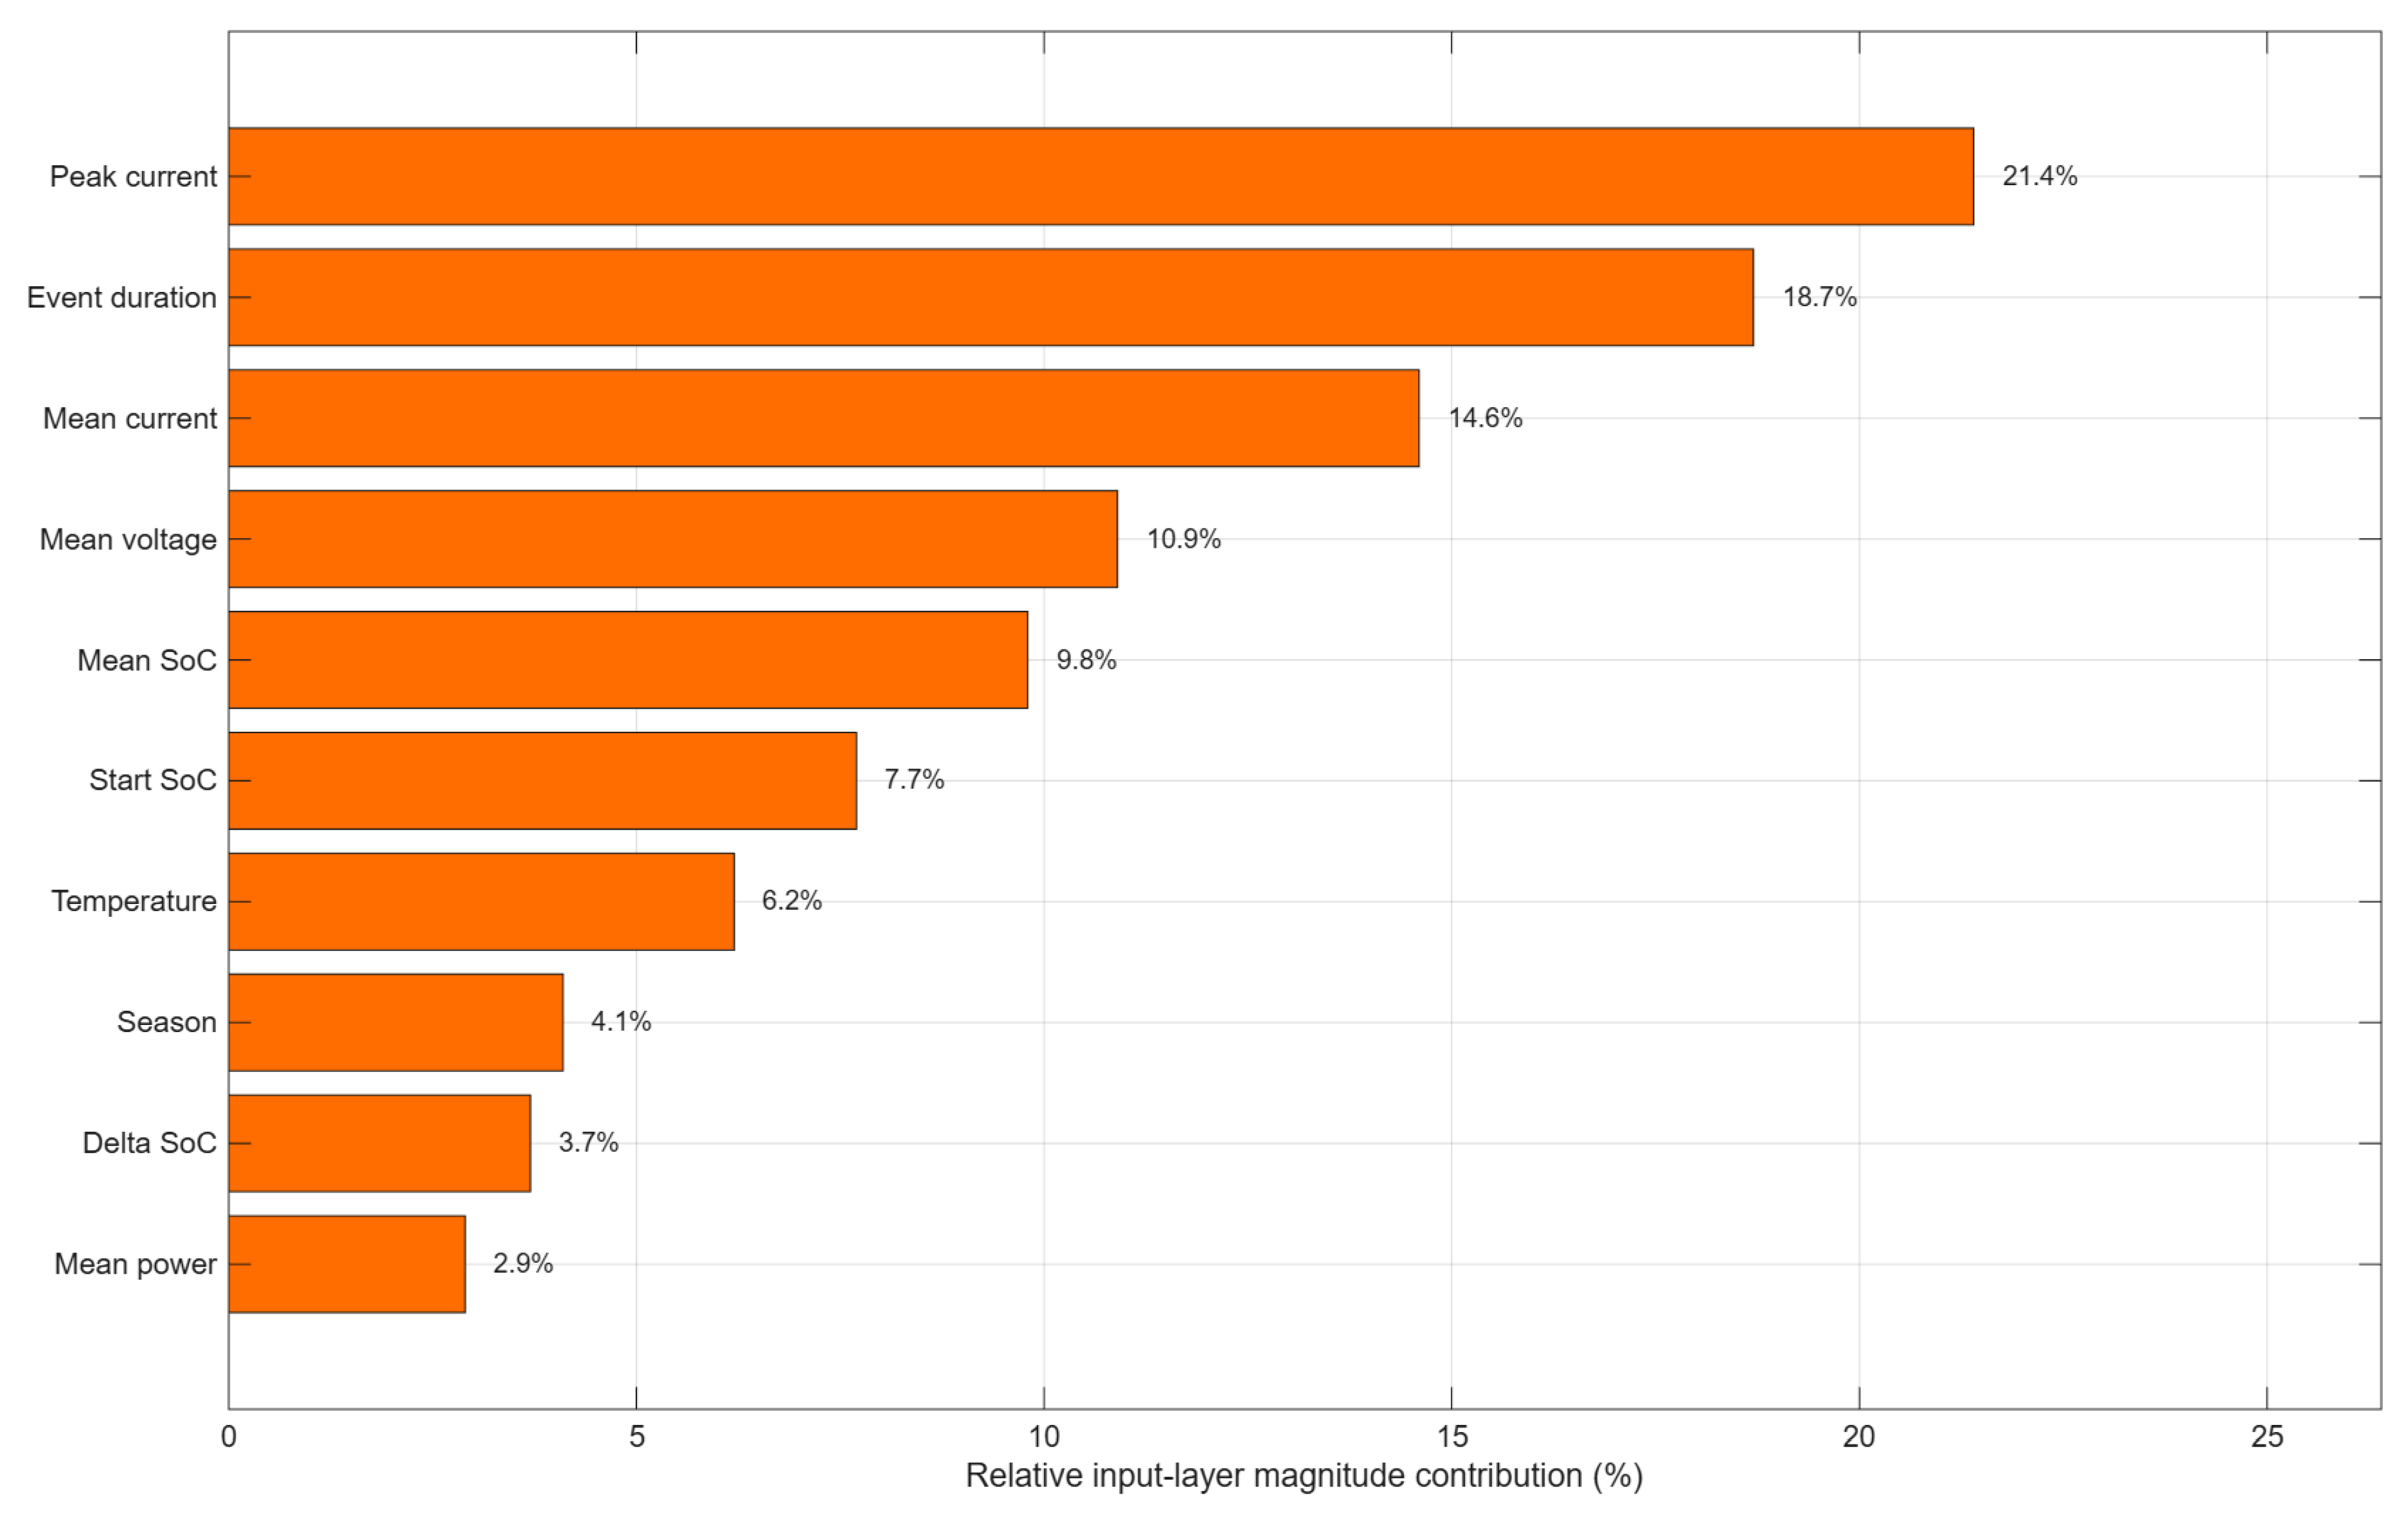
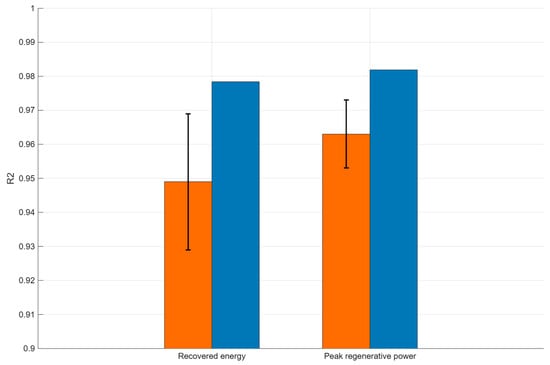
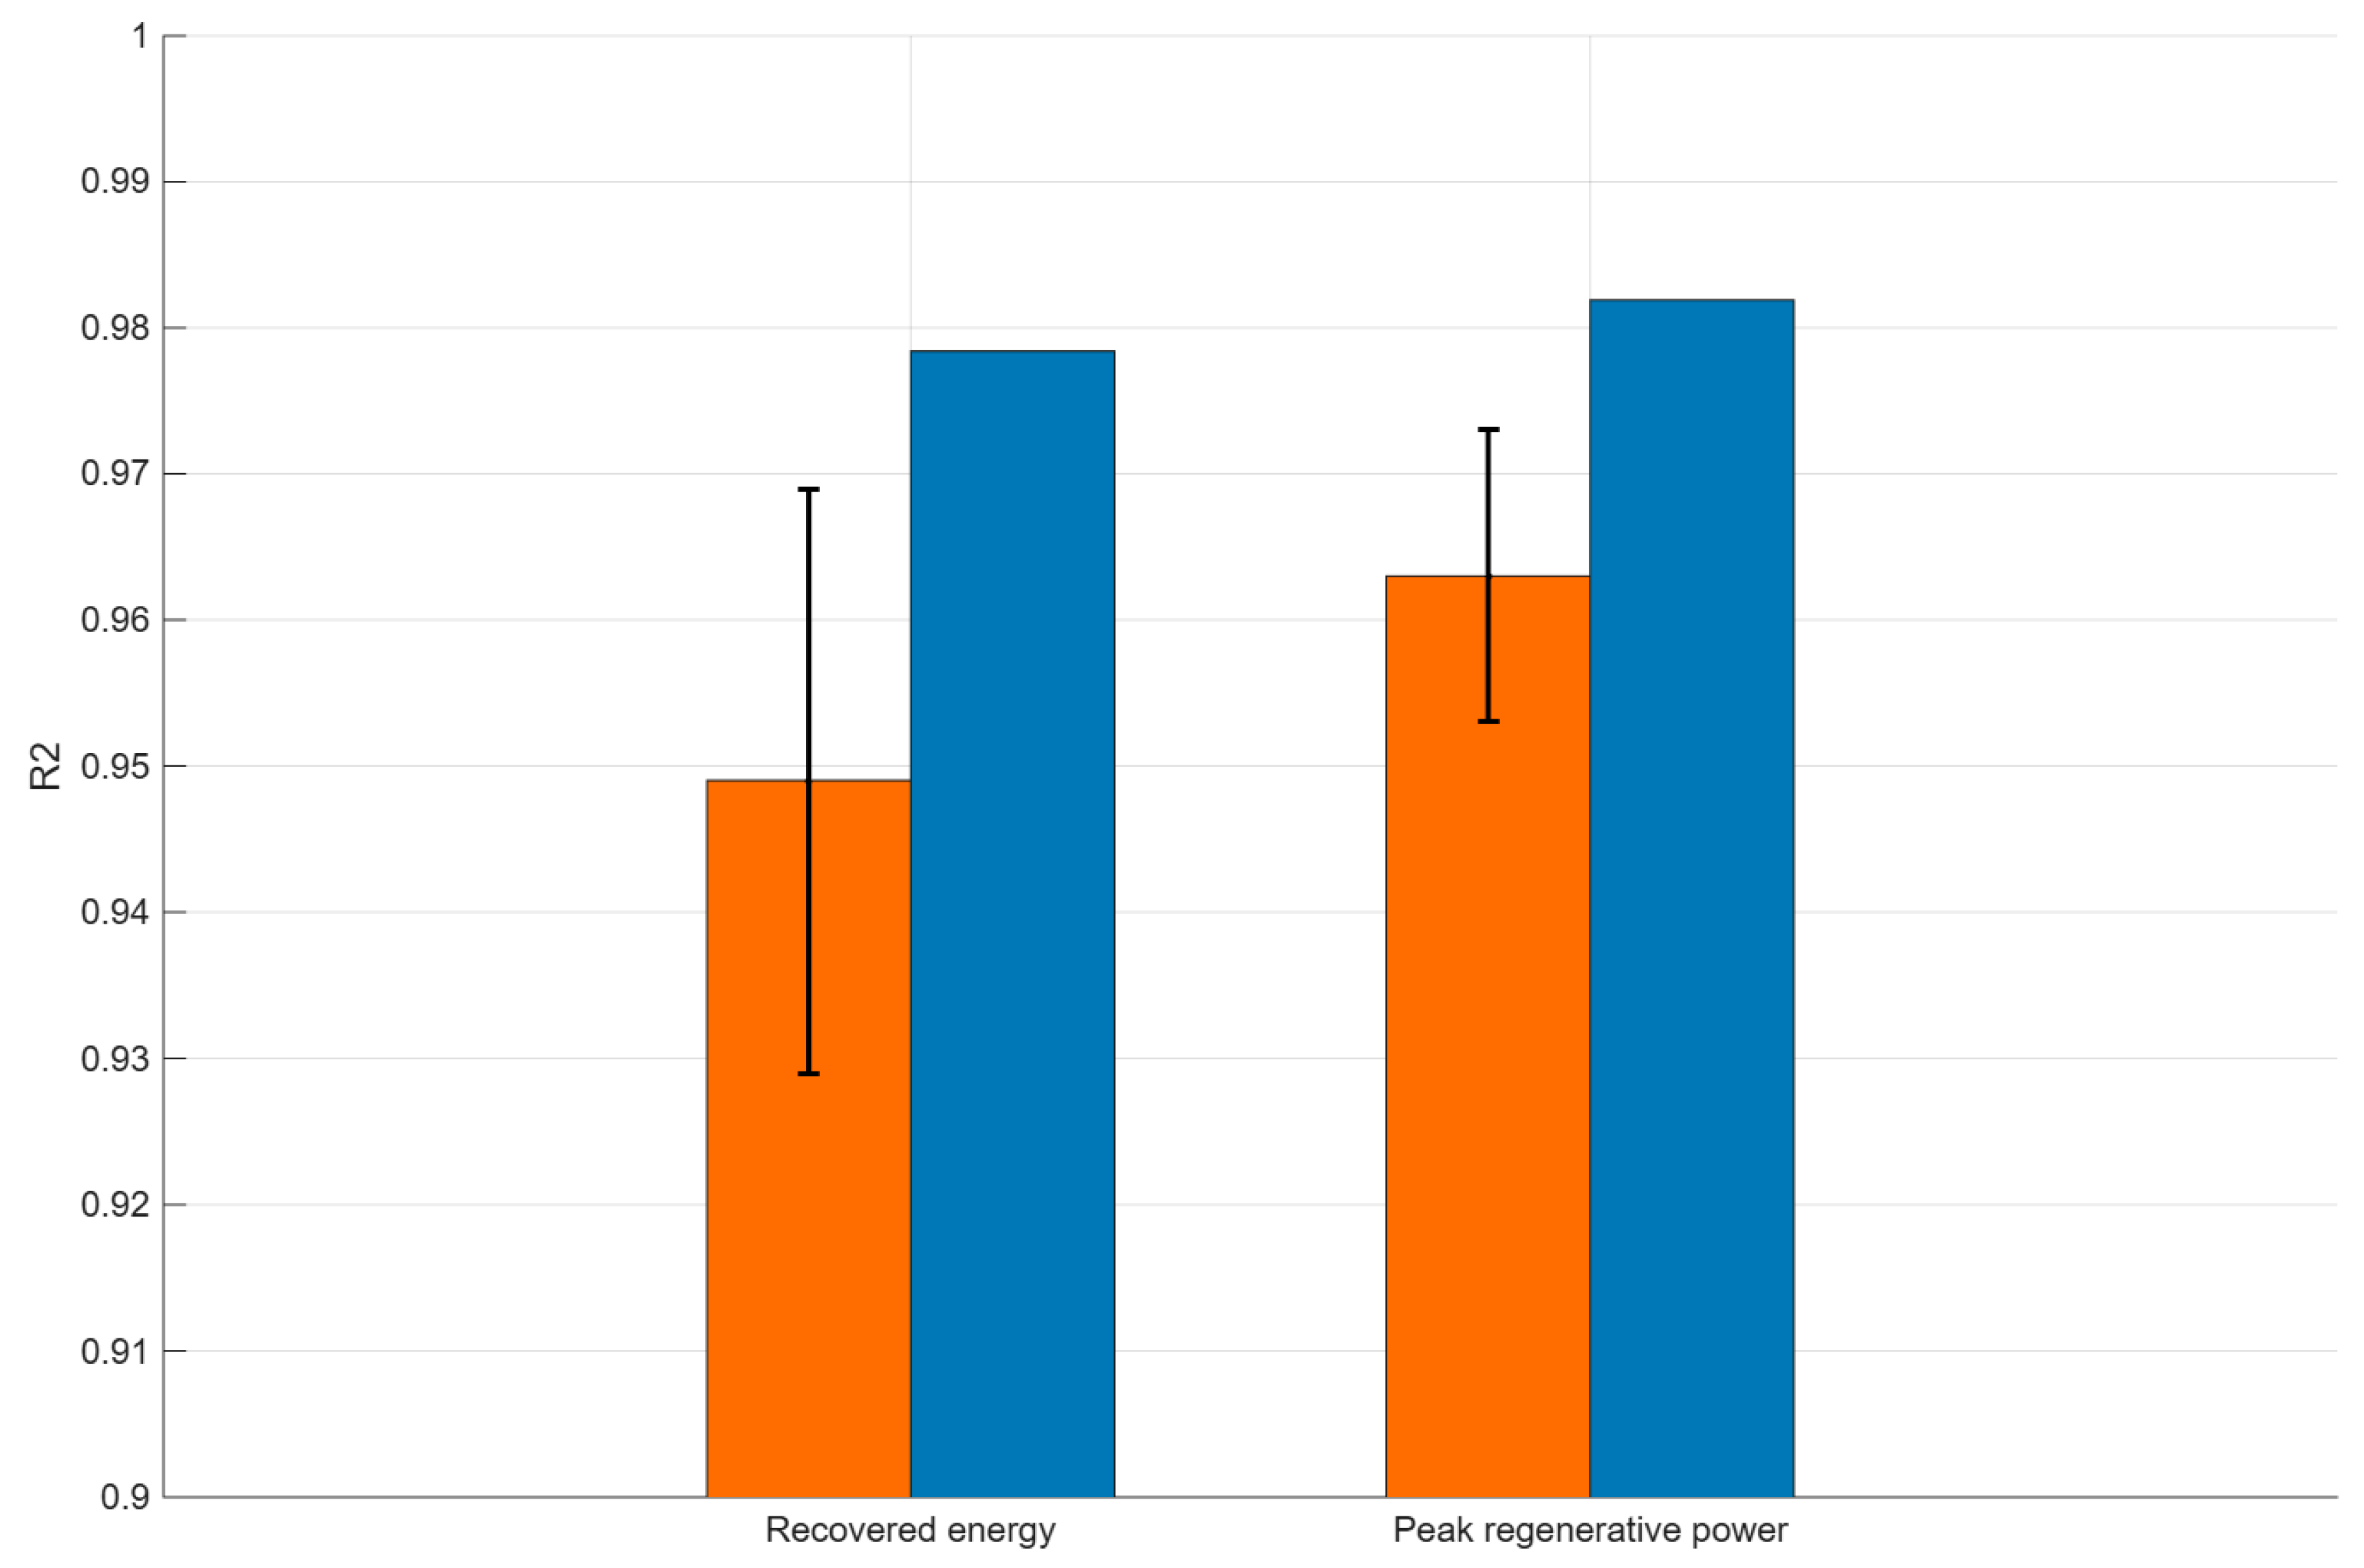
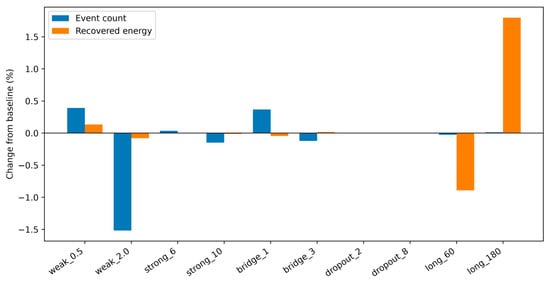
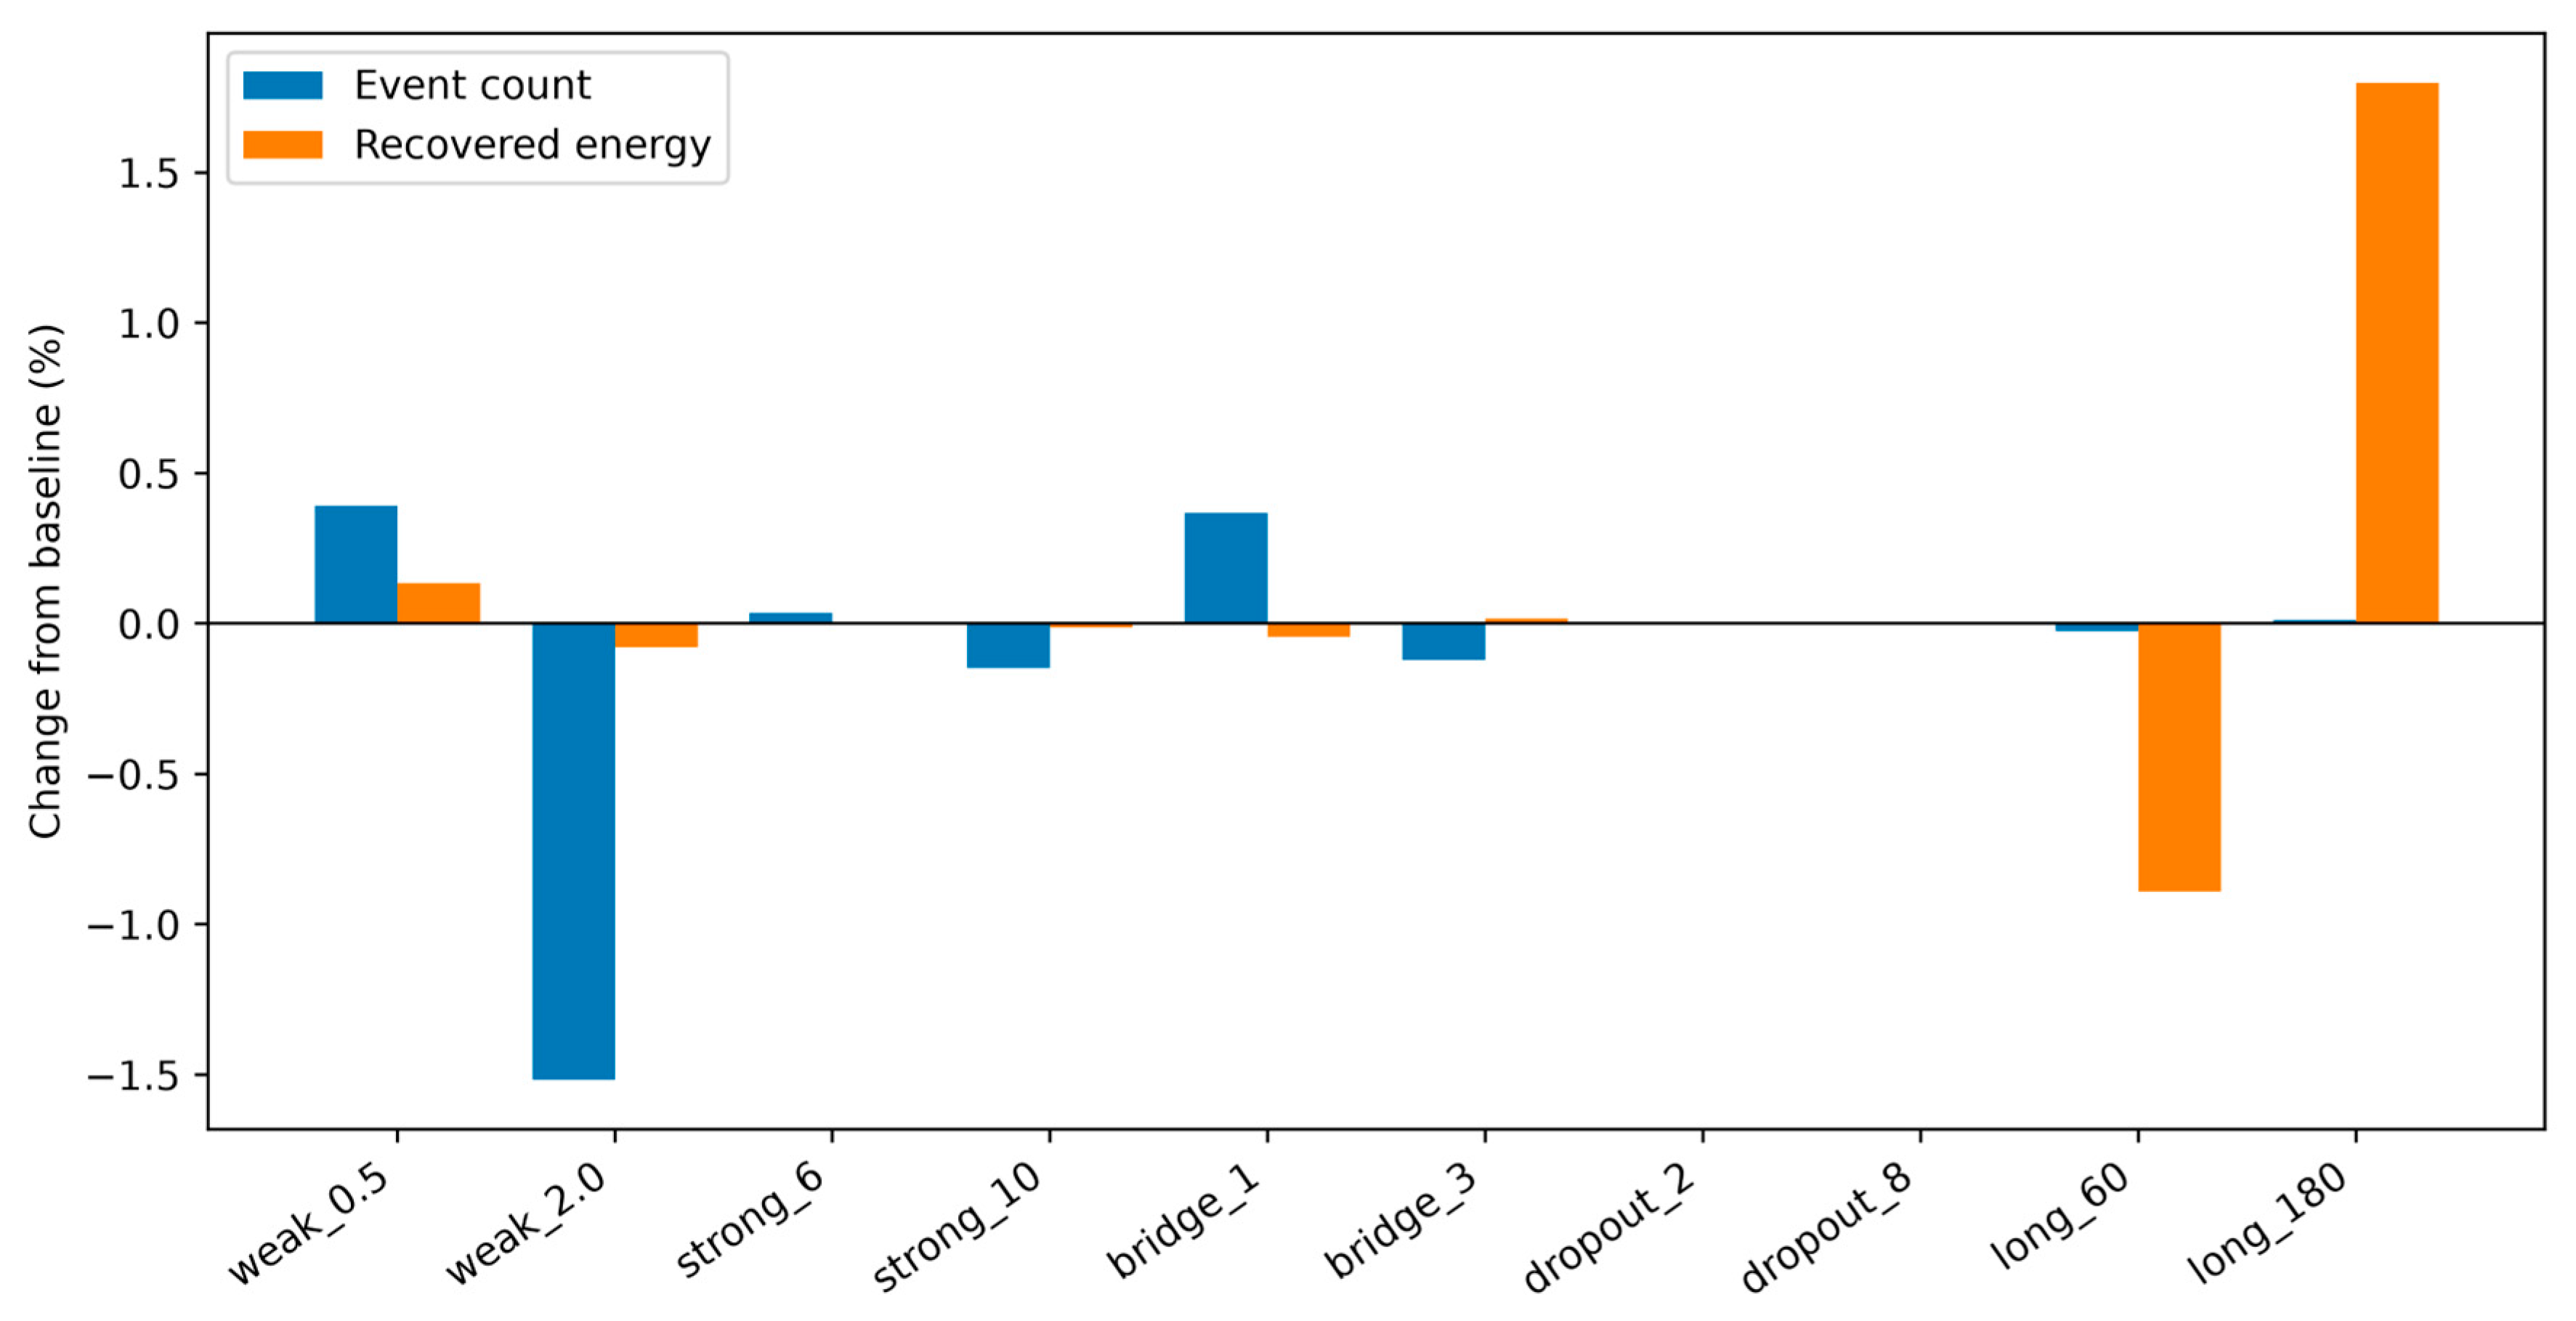

Disclaimer/Publisher’s Note: The statements, opinions and data contained in all publications are solely those of the individual author(s) and contributor(s) and not of MDPI and/or the editor(s). MDPI and/or the editor(s) disclaim responsibility for any injury to people or property resulting from any ideas, methods, instructions or products referred to in the content. |
© 2026 by the authors. Licensee MDPI, Basel, Switzerland. This article is an open access article distributed under the terms and conditions of the Creative Commons Attribution (CC BY) license.