


Abstract
This paper proposes a multi-point optimization method for a high-speed interior permanent magnet synchronous motor (HIPMSM) used in electric vehicle (EV) traction under the WLTP driving cycle. Representative operating points are first extracted from the WLTP speed–torque distribution, and their energy weights are determined according to the energy contribution of each operating region. The resulting operating points cover heavy-load climbing, frequent start–stop, normal cruising, and high-speed cruising conditions, providing a basis for multi-condition motor design. The characteristics of different stator core materials are then evaluated, and the amorphous magnetic alloy (AMA) motor is selected for further optimization. To link material characteristics and operating conditions with motor performance, four electromagnetic indicators are derived from the loss and torque formulations. Their sensitivities to structural parameters are evaluated under the representative conditions and mapped to efficiency, average torque, and torque ripple to identify key design variables for multi-point optimization. Response surface models and NSGA-II are then employed for multi-objective optimization. Compared with rated-point optimization, the proposed multi-point method increases the high-efficiency area from 64.5% to 69.2%. The average torque under the heavy-load condition is increased by approximately 6.5%, while the torque ripple under the high-speed condition is reduced from 17.9% to 12.6%. Finally, thermal validation further confirms that the optimized motor maintains acceptable temperatures under severe high-speed operation. The results demonstrate that the proposed method achieves a more balanced improvement in efficiency and torque performance over the WLTP operating range than conventional rated-point optimization.
1. Introduction
As the global energy challenge continues to grow, electric vehicles (EVs) have attracted extensive attention because of their potential to reduce or eliminate tailpipe emissions and alleviate environmental and energy-related pressures [1,2]. Among various traction-machine technologies, interior permanent magnet synchronous motors (IPMSMs) are widely employed in EV applications owing to their high power density, favorable speed-regulation capability, and reliable operation [3,4,5,6]. In recent years, EV traction motors have increasingly developed toward higher rotational speeds and electrical frequencies [7], making the design and performance improvement of high-speed interior permanent magnet synchronous motors (HIPMSMs) increasingly important.
With increasing operating frequency, motor losses become more pronounced and may lead to excessive temperature rise, reduced driving range, and deteriorated operational reliability. These problems are closely associated with the electromagnetic characteristics of conventional silicon-steel laminations. Consequently, the use of alternative magnetic materials provides an effective route for improving high-speed motor performance [8]. With the development of advanced soft magnetic materials, amorphous magnetic alloy (AMA), ultra-thin silicon steel (UTSS), grain-oriented silicon steel, and soft magnetic composites have been increasingly investigated for high-performance electrical-machine cores [9]. AMA features extremely low core loss, although its brittleness and hardness increase the difficulty of core manufacturing [10,11]. UTSS, generally referring to silicon-steel laminations with a thickness below 0.05 mm, is also attractive for high-speed motors because of its relatively high saturation flux density, favorable manufacturability, and structural reliability. Nevertheless, the electromagnetic properties of these emerging materials differ considerably from those of conventional silicon steel. Therefore, direct material substitution without corresponding structural redesign may not fully exploit their advantages. The machine geometry should instead be adapted according to both design requirements and material characteristics. Moreover, whether these advanced materials can maintain their performance advantages throughout the entire operating range, rather than only under high-speed conditions, still requires systematic comparison.
Efficient optimization is also essential for accommodating the different design requirements and electromagnetic characteristics introduced by new core materials. Electrical-machine optimization usually involves several competing performance indices, including loss, efficiency, and torque ripple, making multi-objective optimization necessary to obtain a balanced design. Kriging models are frequently employed as surrogate models in such optimization problems; however, their parameter estimation can become complicated as the number of design variables increases, and some model settings may require additional adjustment [12]. Genetic algorithms and particle swarm optimization have also been applied to multi-objective motor design, but their convergence behavior may deteriorate in complex optimization spaces, increasing the possibility of premature convergence [13,14]. Therefore, the Non-dominated Sorting Genetic Algorithm II (NSGA-II) is employed in this study. To further reduce the computational burden, a response surface (RS) surrogate model is adopted. Simpson et al. [15] demonstrated that polynomial response surfaces provide efficient and stable approximations for smooth engineering design problems. Simpson et al. [16] further compared response-surface and Kriging models for engineering design optimization. Forrester and Keane [17] reviewed the development and application of surrogate-based optimization for computationally expensive engineering problems. Accordingly, the RS method provides an efficient and robust surrogate framework for the multi-operating-point optimization considered in this study.
However, optimizing a motor at only one operating point may improve local performance while degrading its behavior at other operating conditions [18]. For EV traction applications, the optimization process should therefore account for the varying operating states encountered throughout a driving cycle. Directly incorporating a large number of driving-cycle operating points would, however, require extensive finite-element evaluations and substantially increase the computational cost [19]. Achieving representative coverage of the driving cycle with an acceptable computational burden is therefore an important issue in EV traction-motor optimization. In addition, conventional driving cycles such as the New European Driving Cycle (NEDC) provide limited representation of high-speed driving conditions and are consequently less suitable for evaluating modern high-speed traction motors [20]. It is therefore necessary to employ a driving cycle that better reflects realistic vehicle operation and provides sufficient coverage of high-speed operating regions.
This paper aims to develop an efficient design framework for HIPMSMs that balances efficiency, torque capability, and torque stability over the EV operating range. The main contributions are as follows. Silicon steel, ultra-thin silicon steel (UTSS), and amorphous magnetic alloy (AMA) are first evaluated in terms of magnetic characteristics and motor performance, and AMA is selected for further optimization. Representative operating points (RPs) are then extracted from the WLTP driving cycle using K-means clustering, with energy-based weights introduced to retain the contribution of different operating regions while reducing computational cost. To link material characteristics and operating conditions with motor performance, four electromagnetic indicators are derived from the loss and torque formulations. Their sensitivities to structural parameters are evaluated under the representative conditions and mapped to efficiency, average torque, and torque ripple to identify key design variables. Based on these results, response surface models and NSGA-II are employed for multi-objective multi-point optimization, and the effectiveness of the proposed method is evaluated against rated-point optimization. Finally, the thermal performance of the optimized motor is verified under high-speed operation.
The remainder of this paper is organized as follows. Section 2 determines the HIPMSM topology and analyzes the loss and efficiency characteristics of conventional-speed and high-speed motors. Section 3 extracts representative operating points and their energy weights from the WLTP driving cycle. Section 4 evaluates different core materials and establishes the electromagnetic indicators associated with core loss, average torque, and torque ripple. Section 5 presents the sensitivity-guided multi-point optimization and compares its performance with rated-point optimization. Section 6 verifies the temperature-rise performance of the optimized motor under high-speed operation. Finally, Section 7 summarizes the main conclusions.
2. Structure of HIPMSM and Analysis of Loss and Efficiency
For HIPMSM, overcoming high-frequency losses is a common consensus. However, focusing only on losses under high-speed conditions does not reflect the actual operating conditions of EVs. Therefore, this section will analyze the loss and efficiency performance of HIPMSM in different situations.
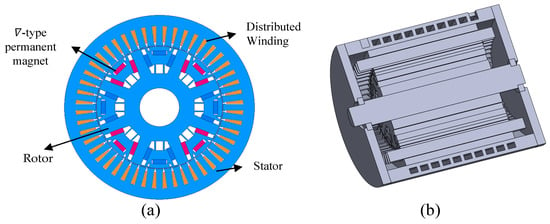
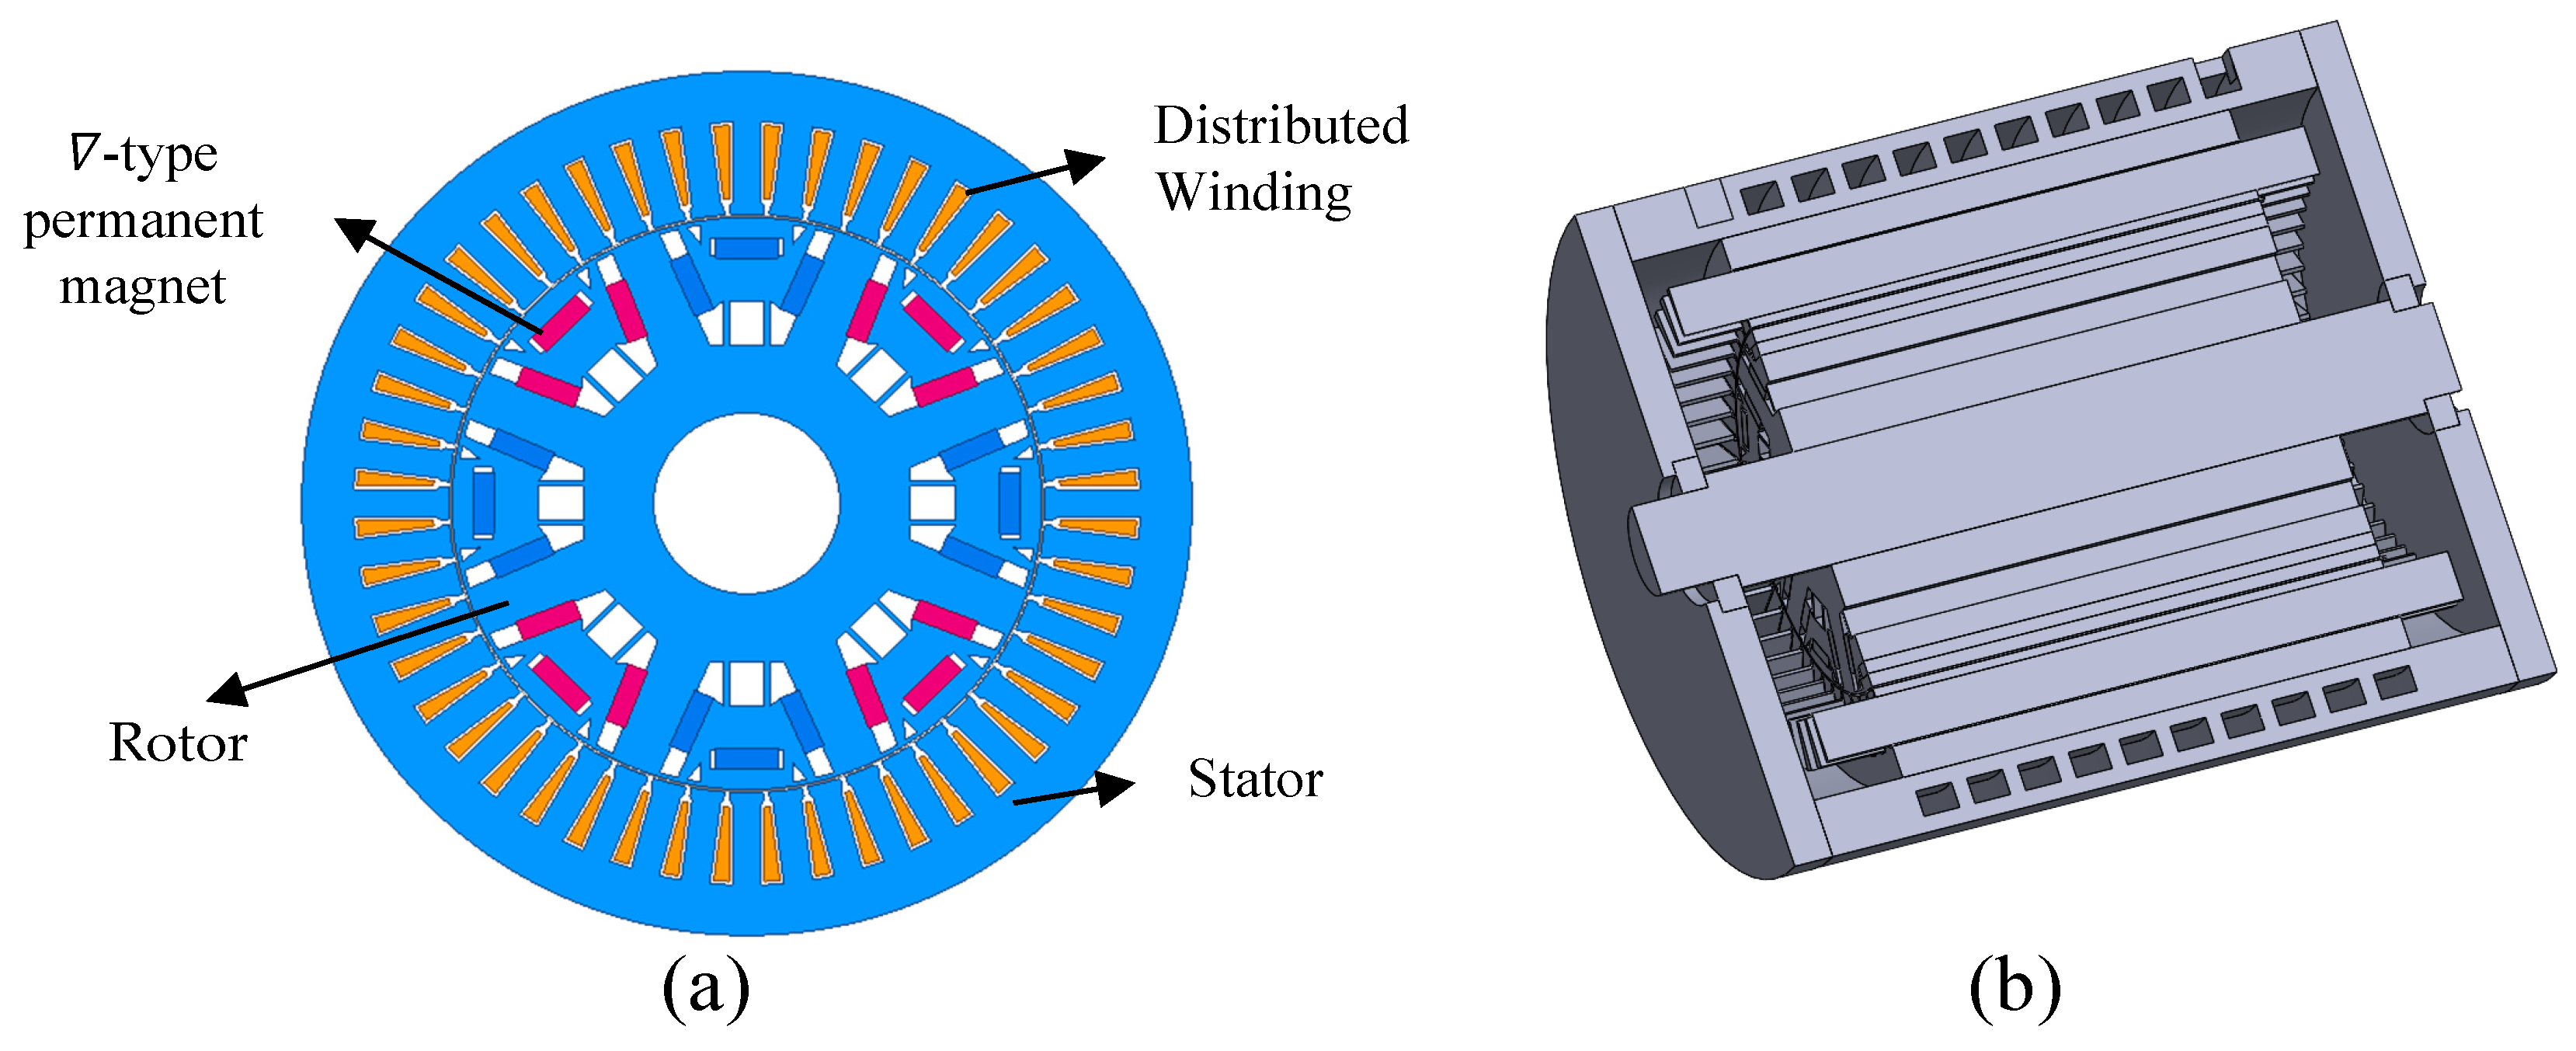
Selecting an appropriate electrical machine topology is crucial for ensuring the feasibility and efficiency of the machine. In this paper, an IPMSM with an 8-pole 48-slot (48S8P) configuration, featuring ∇-shape permanent magnets (PMs) and distributed windings, is determined as the research subject. It is a commonly used topology, with numerous studies attesting to the superior output performance of this topology [21,22]. Figure 1 illustrates the main topology of the IPMSM.
Figure 1.
Structure of HIPMSM. (a) Two-dimensional topology; (b) three-dimensional structural model.
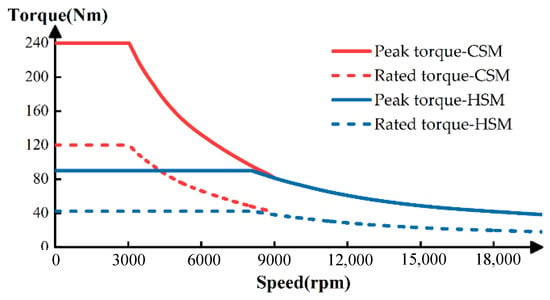
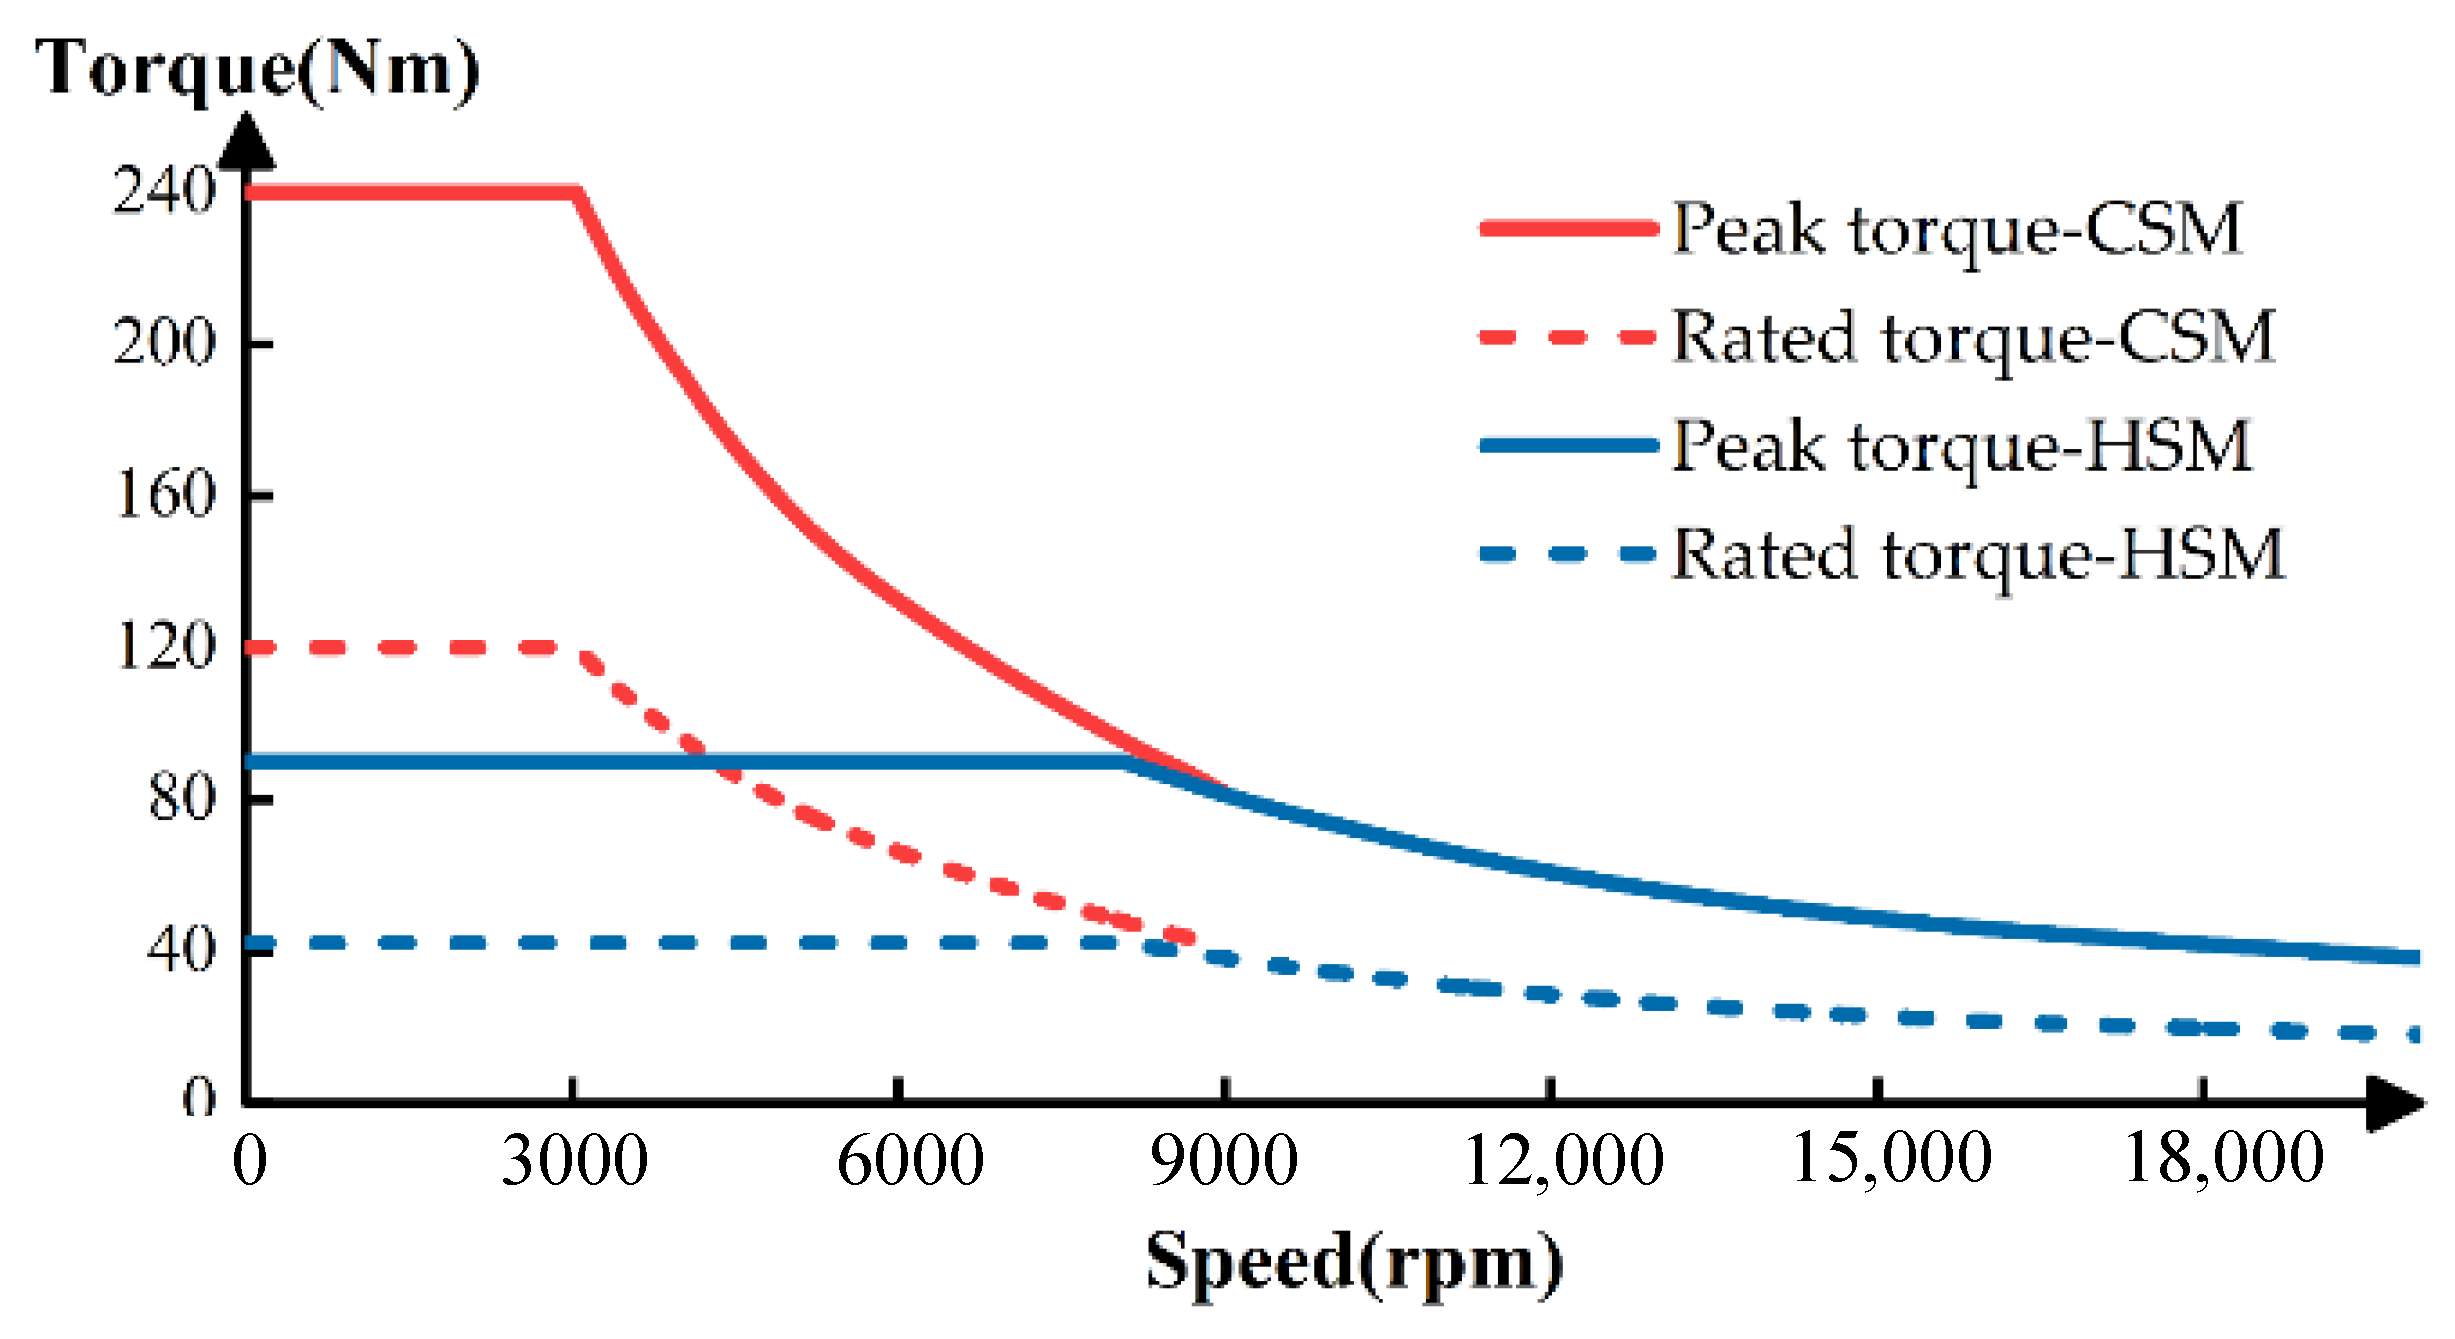
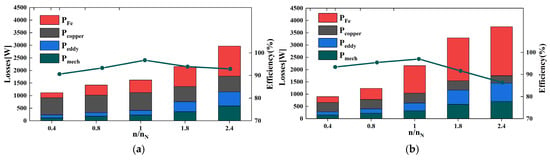
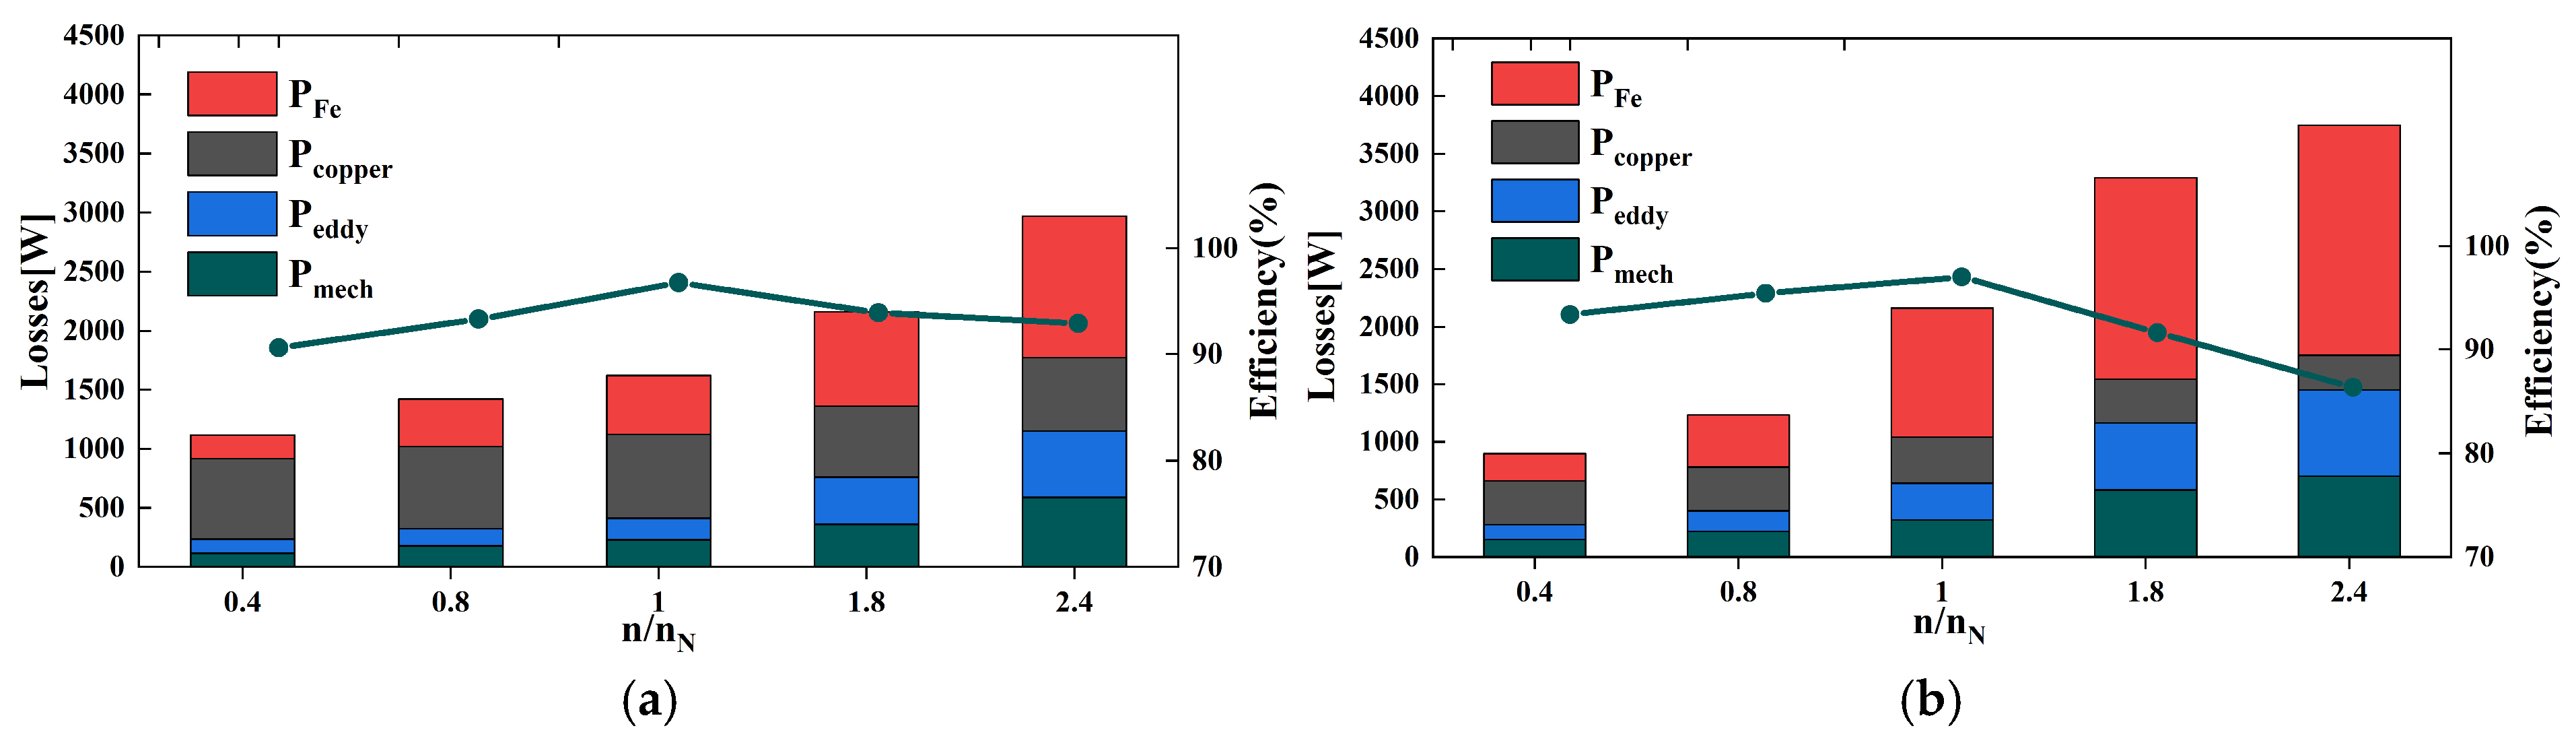
To evaluate the loss and efficiency characteristics of HSM, a conventional-speed motor (CSM) with the same peak power of 75 kW and rated power of 38 kW is designed for comparison. Their main specifications are listed in Table 1, while the peak and rated torque–speed characteristics are shown in Figure 2. The corresponding loss and efficiency results are presented in Figure 3.
Table 1.
Technical specifications of CSM and HSM.
Figure 2.
Torque–speed characteristic of CSM and HSM.
Figure 3.
Losses and efficiency. (a) CSM, (b)HSM.
Compared with CSM, HSM exhibits higher overall losses because of its higher power density. The dominant loss region shifts from the constant-torque region in CSM to the constant-power region in HSM, where core loss becomes particularly significant. At higher speeds, however, the increase in core loss is moderated by the increasing negative (id), which weakens the stator magnetic field. These results indicate that core loss remains a key limitation of HSM over a wide operating range, motivating the introduction of advanced core materials in Section 4.
3. Representative Operating Points Extraction
The operating range of the drive motor is extensive, and design based only on the rated operating point no longer meets actual requirements. However, the actual driving cycles of EVs are often characterized by thousands of operating points, leading to an extremely large computational load. Extracting RPs to reduce the number of operating points, it is an effective method that has been explored in recent years to balance accuracy and time cost [23]. The use of the K-clustering method can simplify data by modeling and statically classifying data into different groups.
The WLTP speed sequence is sampled at . A longitudinal vehicle dynamics model is employed to calculate the traction force demand:
The vehicle mass is set to 1800 kg, and the effective wheel radius is 0.31 m. The rolling resistance coefficient and aerodynamic drag coefficient are assumed to be 0.010 and 0.28, respectively. The frontal area is 2.2 m2 and the air density is taken as 1.225 kg/m3. A flat road condition is considered, i.e., the road slope angle . The total transmission ratio is set to 12, and the drivetrain efficiency is assumed to be 0.95. The wheel torque is
which is mapped to the motor side through the drivetrain:
To prevent near-zero torque samples from biasing the clustering and weight calculation, operating points with ·m are excluded from the analysis.
To eliminate the influence of the different numerical scales of speed and torque, both variables are normalized before K-means clustering as
and the Euclidean distance is then calculated in the normalized speed–torque space. Set the input sample dataset as X and the output clustering set as C. Select any k data points from X to form the first generation of clustering center set A. Then, calculate the Euclidean distance between all samples and each clustering center, and assign the samples to the corresponding clustering set based on the nearest distance criterion. The specific calculation formula is as follows.
where xi is the ith sample, aj is the jth cluster center, Ci is the cluster set closest to aj, and t is the number of iterations. Furthermore, calculate the mean of the sample data in each clustering set to serve as the new generation of clustering centers, which can be given by
Repeat the iteration until the change rate of the clustering centers is zero, and then stop the iteration and output the clustering set and clustering centers.
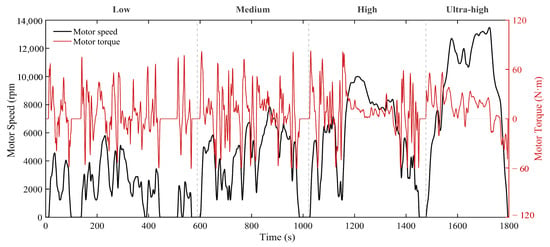
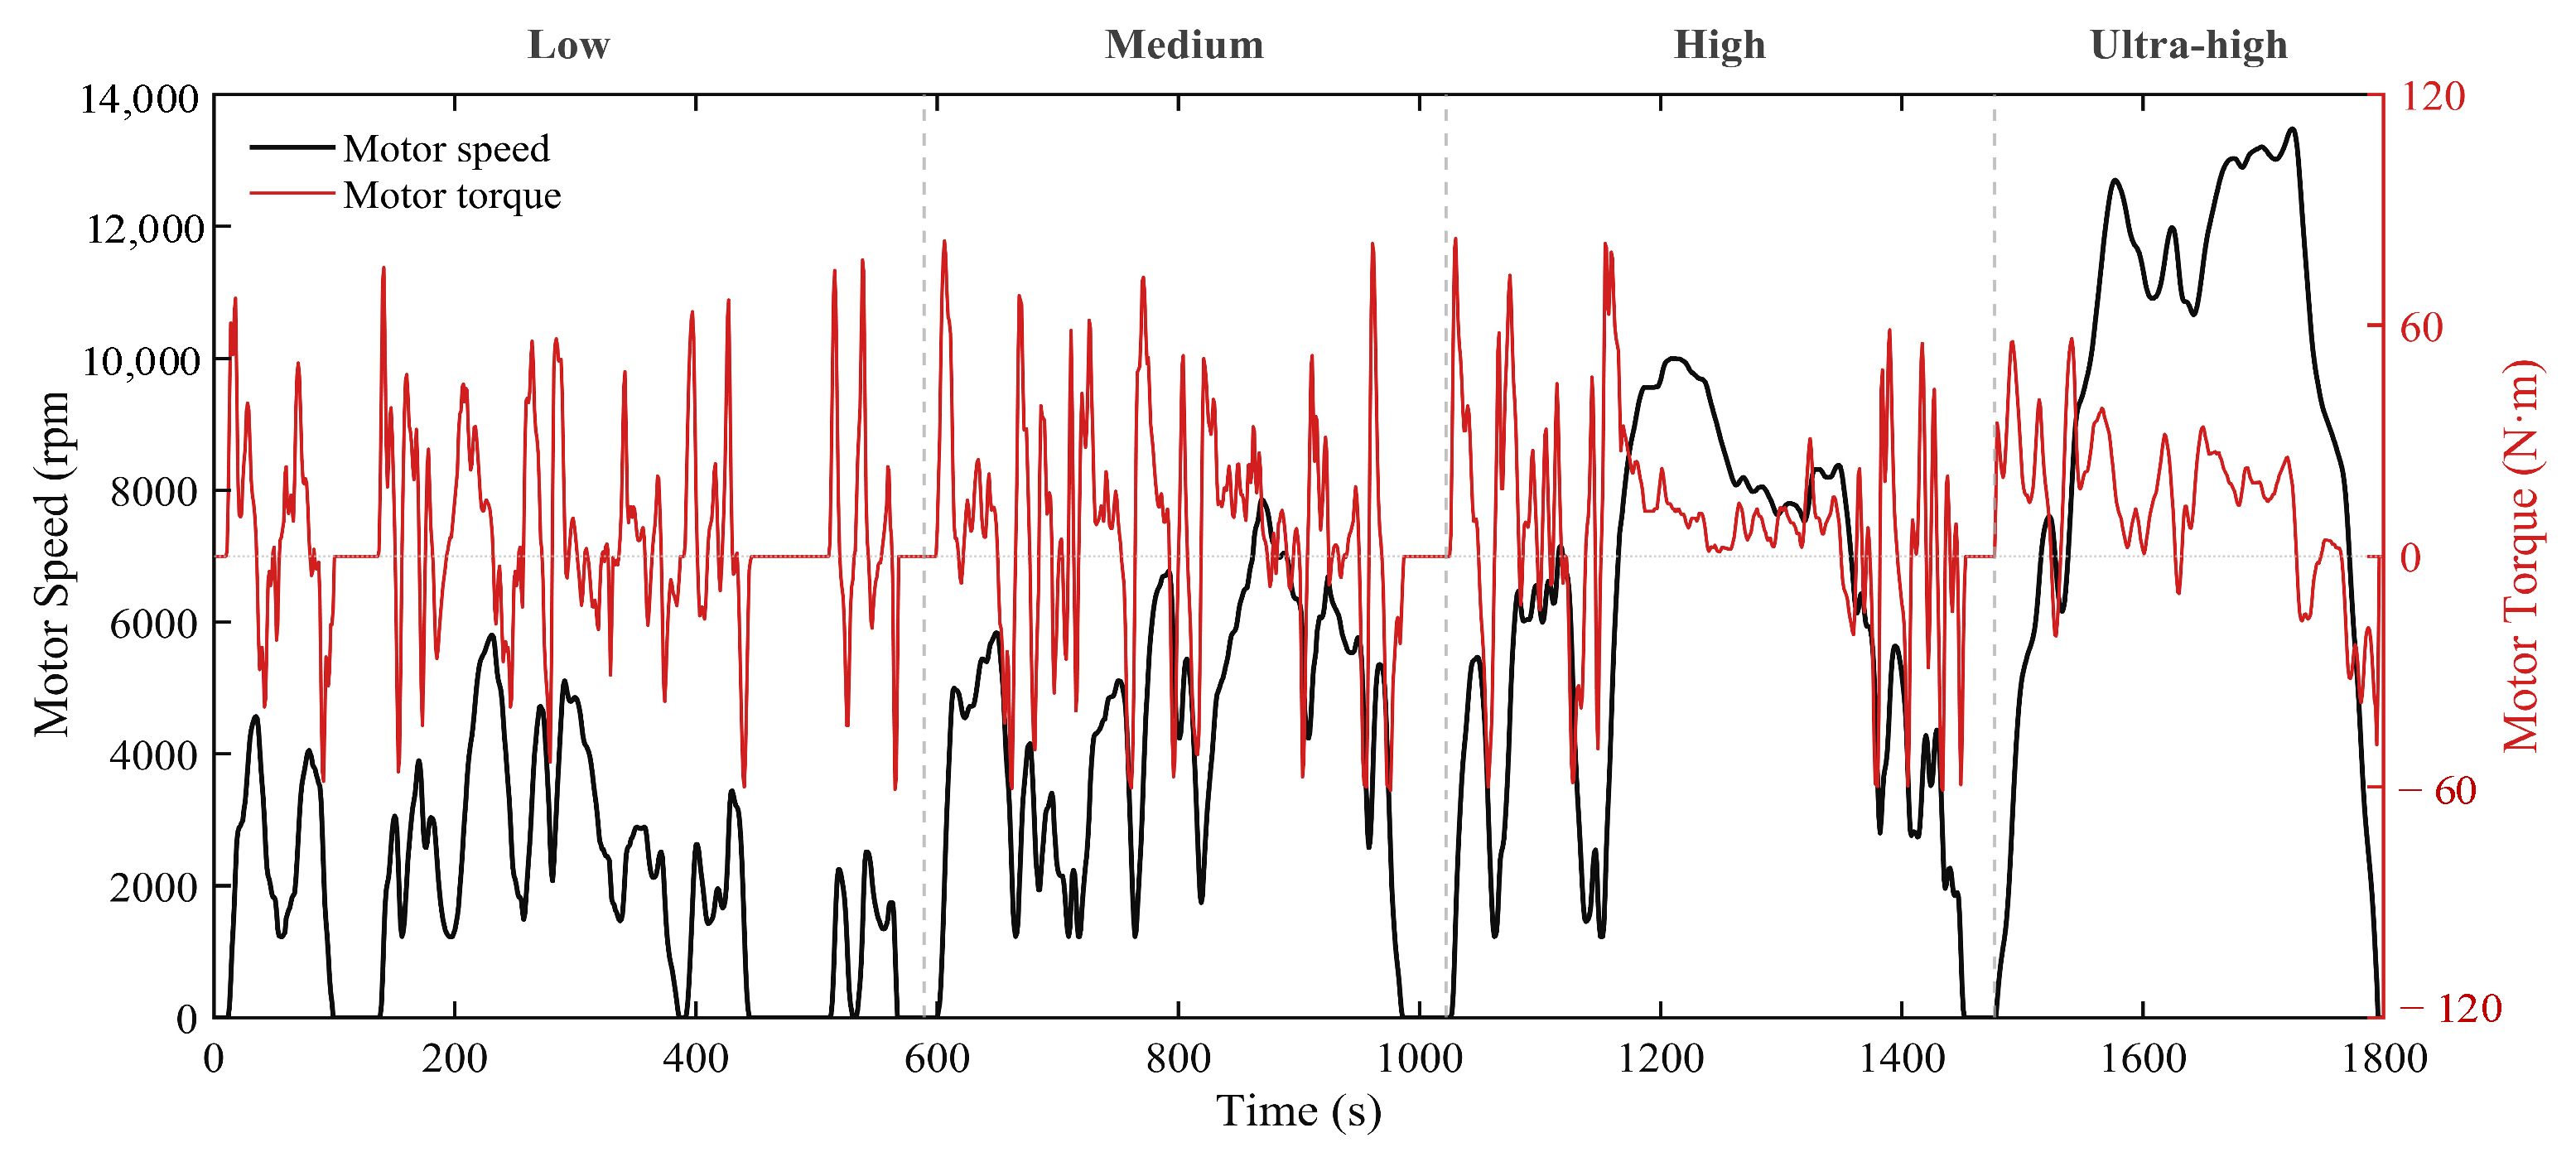
To effectively reflect the diverse operating conditions of EV traction motors, the Worldwide Harmonized Light Vehicles Test Procedure (WLTP) is adopted as the standard driving cycle, as shown in Figure 4. The corresponding motor operating profile includes both positive- and negative-torque intervals, where positive torque represents motoring operation and negative torque corresponds to regenerative braking. Since the present study focuses on traction-mode motor performance, only operating points with Tm(t) > 0 are considered in the subsequent K-means clustering and energy-weighting process.
Figure 4.
Motor speed and torque profiles under the WLTP driving cycle.
To reflect the contribution of each RP to the WLTP cycle, an energy-based weighting scheme is introduced. The instantaneous mechanical power is
For cluster i, the positive mechanical-energy contribution is calculated as
The normalized weight is
Thus, wi represents the positive mechanical-energy contribution of each motoring operating region to the traction-energy demand considered in the subsequent multi-operating-point evaluation and optimization.
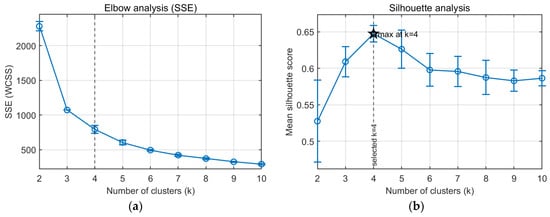
To determine the appropriate number of clusters, a sensitivity analysis is performed for –10. For each , K-means with k-means++ initialization is repeated 20 times, and the solution with the minimum within-cluster sum of squares (SSE) is retained, where
The clustering quality is further evaluated using the mean silhouette coefficient
where and denote the intra-cluster and nearest-cluster distances, respectively.
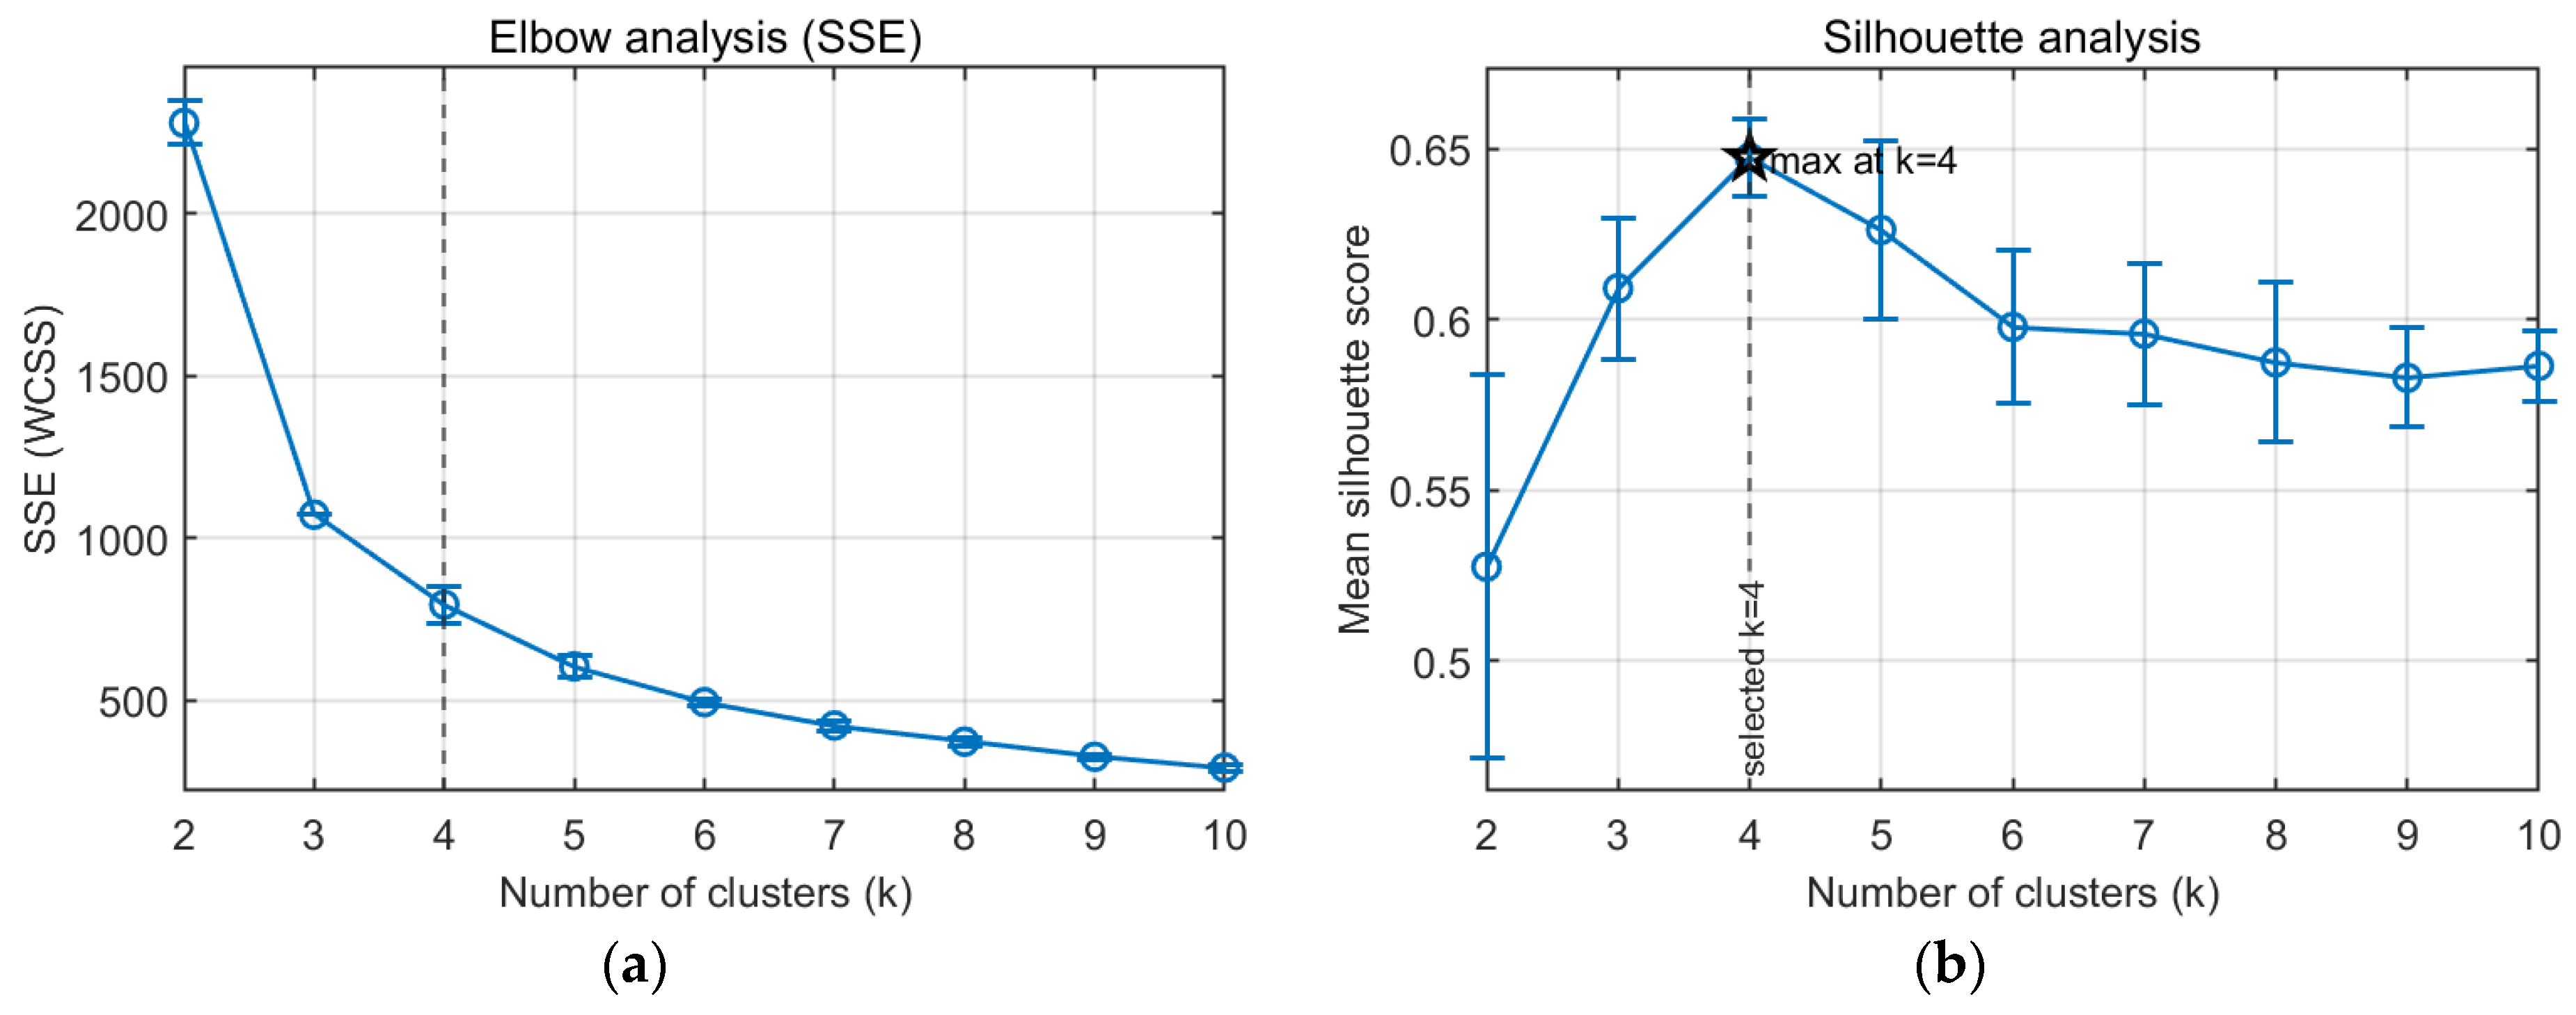
As shown in Figure 5, SSE exhibits an elbow around , while the silhouette coefficient reaches its maximum at . Therefore, is selected considering both compactness and separation criteria.
Figure 5.
Determination of the optimal number of clusters for K-means clustering: (a) elbow analysis based on the within-cluster sum of squares (SSE); (b) silhouette coefficient analysis. SSE (also referred to as WCSS) denotes the within-cluster sum of squares, and k denotes the number of clusters.
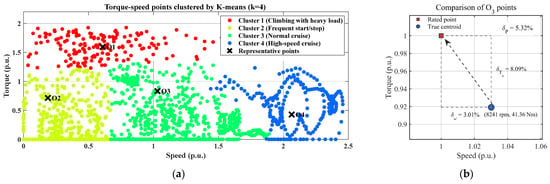
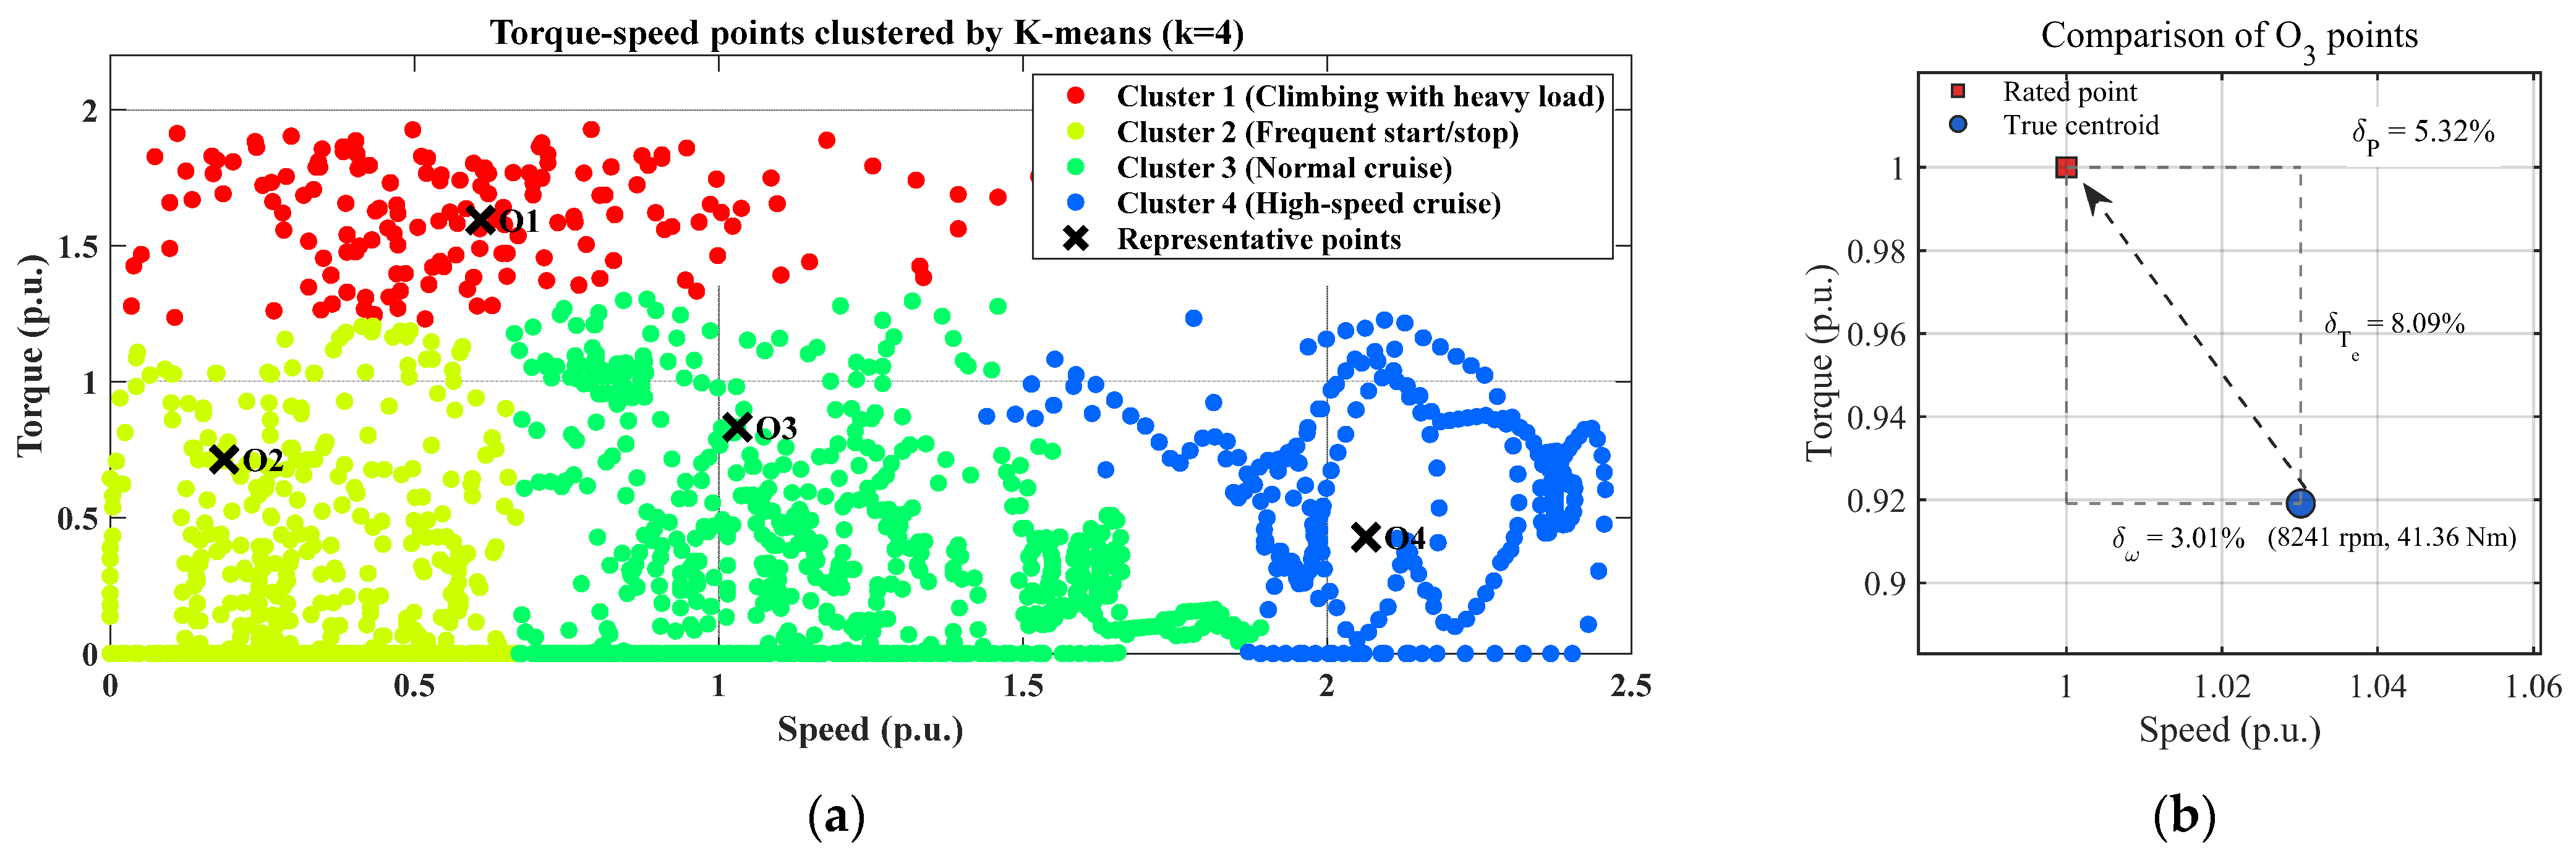
Based on the speed–torque characteristics of the data points in each cluster, the four clusters are associated with climbing with heavy load, frequent start–stop, normal cruise, and high-speed cruise conditions, respectively, as shown in Figure 6a. The centroid of each cluster is initially taken as its representative operating point (RP). For the normal-cruise cluster O3, the true centroid is located at 8241 rpm and 41.36 Nm, which is close to the rated operating point of 8000 rpm and 45 Nm. As quantitatively compared in Figure 6b, the relative deviations in speed, torque, and mechanical power are 3.01%, 8.09%, and 5.32%, respectively. To retain the rated operating point as a common reference for the multi-point and single-rated-point optimization strategies, the rated operating point is adopted to represent O3 in the subsequent optimization. The torque, speed, and energy weight of each RP are summarized in Table 2.
Figure 6.
(a) K-means clustering results; (b) comparison of the O3 representative point.
Table 2.
Torque–speed distributions of RPs.
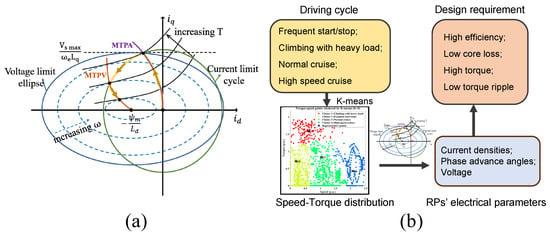
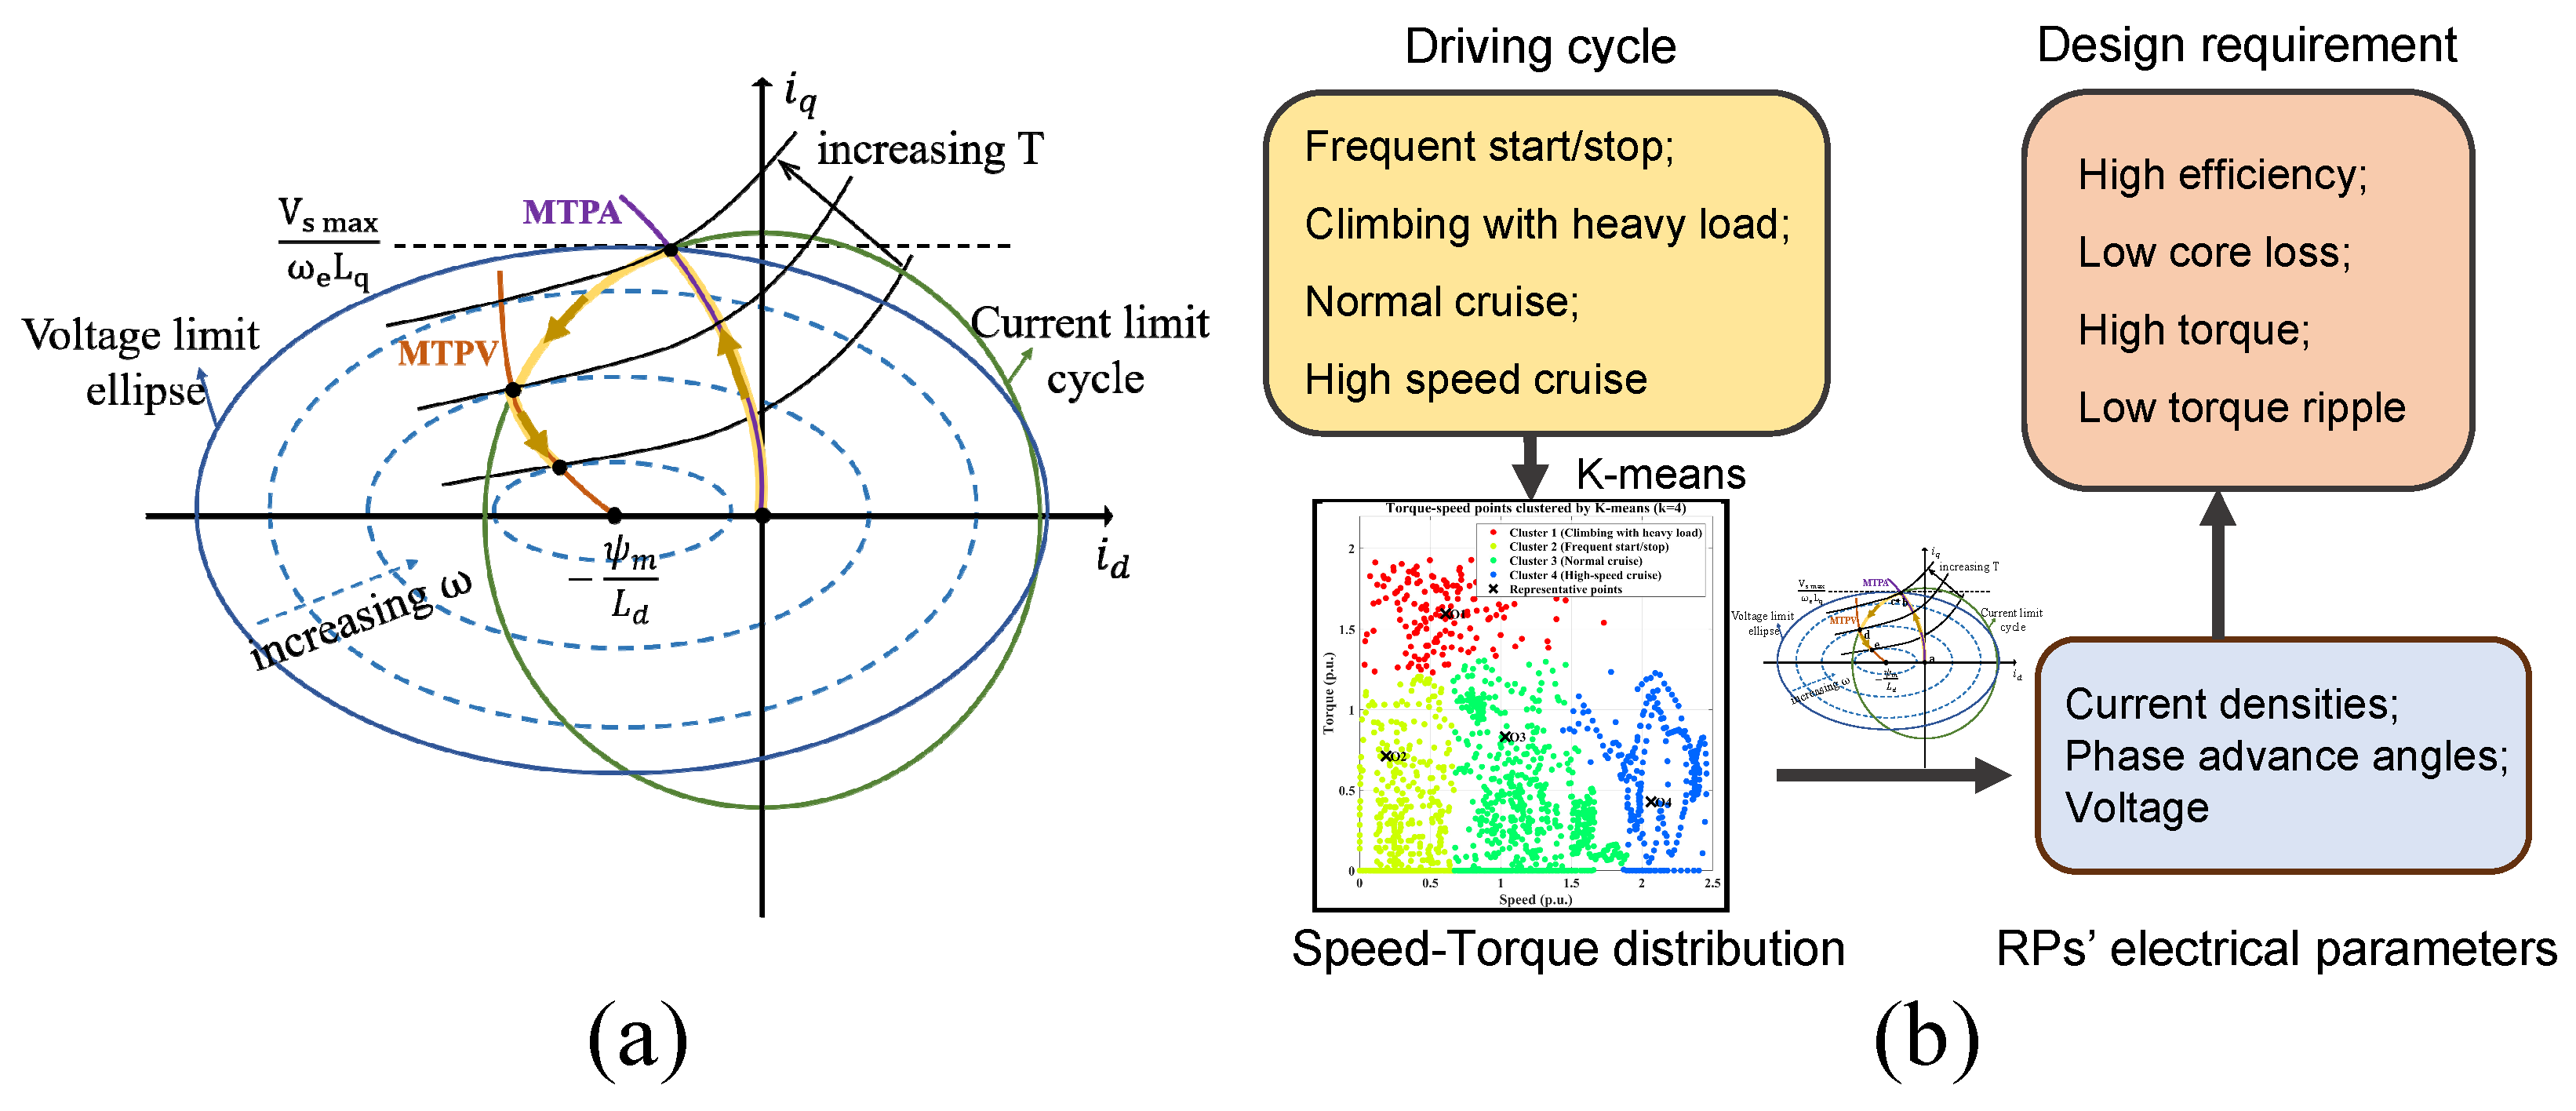
Based on the motor control strategy, electrical parameters such as current density, current advance angle, and voltage are extracted at each representative point (RP) for subsequent machine analysis and design. As shown in Figure 7, the four driving conditions identified from the WLTP cycle correspond to different control regions. The frequent start/stop and heavy-load climbing conditions operate mainly in the maximum torque per ampere (MTPA) region. As the speed increases, the control strategy shifts to field weakening, with normal cruise located mainly in the first field-weakening region, while high-speed cruise operates in the second field-weakening region under the maximum torque per voltage (MTPV) strategy. Accordingly, the representative driving conditions are mapped to their corresponding electrical inputs and design requirements, providing the basis for subsequent multi-operating-point analysis and optimization.
Figure 7.
Motor control and operating-condition-oriented design framework. (a) Control principle of HIPMSM; (b) relationship among driving cycles, RPs, and design requirements.
4. Application of Novel Materials
4.1. Introduction of Novel Core Materials
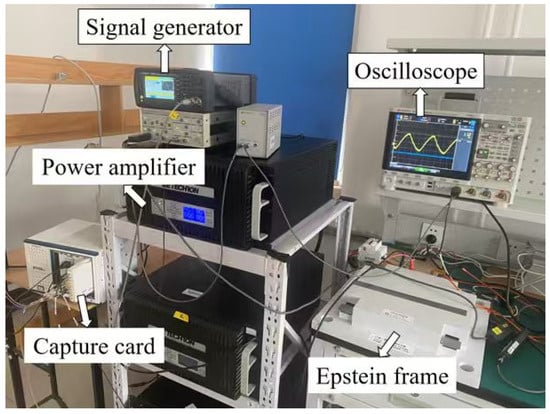
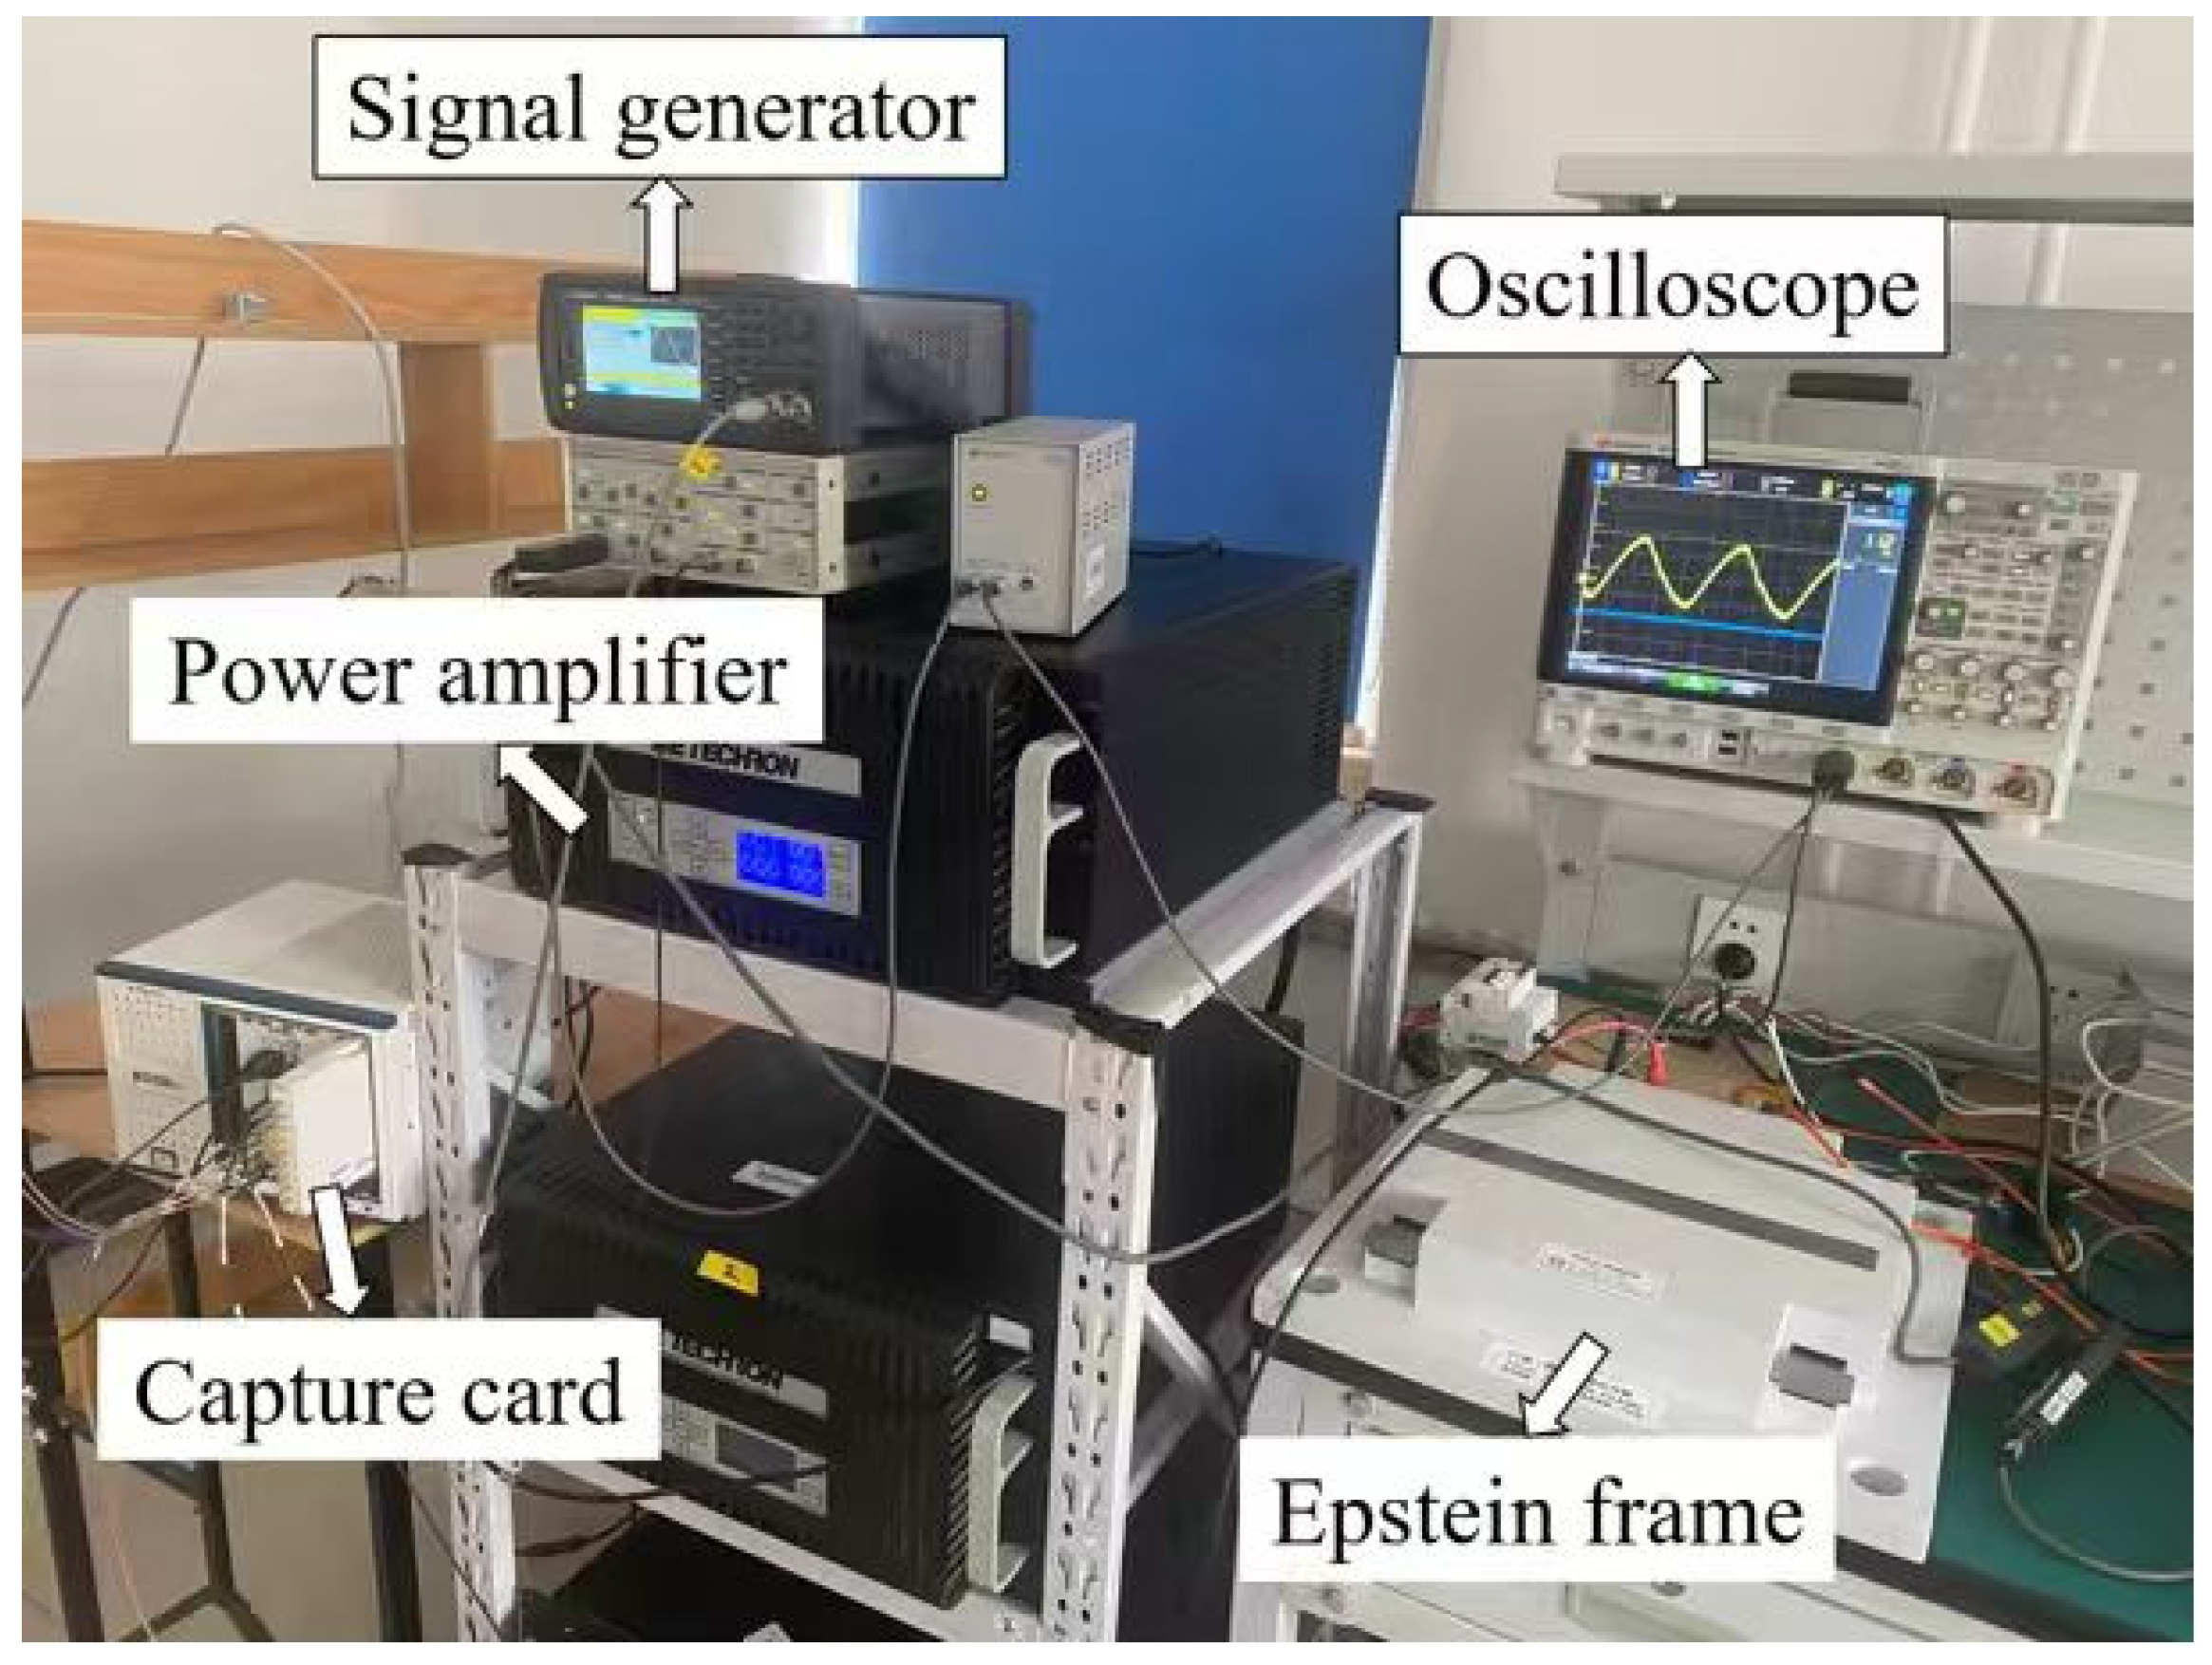
To experimentally characterize the magnetic properties of the three core materials, the Epstein frame test system shown in Figure 8 is employed. The signal generator and power amplifier provide the required sinusoidal excitation, while the excitation and induced signals are recorded by the oscilloscope and capture card. The Epstein-frame strip specimens have dimensions of 30 mm × 300 mm. The specimens correspond to the same material grades and specifications adopted in the motor design, with lamination thicknesses of 0.35, 0.20, and 0.025 mm for silicon steel, UTSS, and AMA, respectively. The Epstein-frame test is used for material characterization rather than to directly reproduce the magnetic-field distribution of the actual stator. In the FEM model, the local magnetic field and core-loss distribution are recalculated according to the actual stator geometry and operating conditions.
Figure 8.
Epstein frame test system.
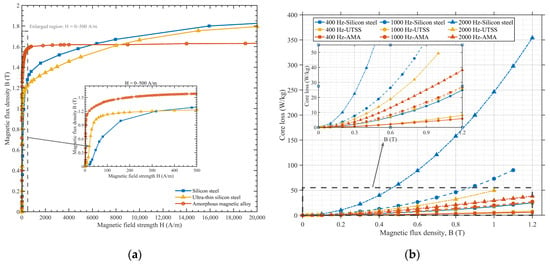
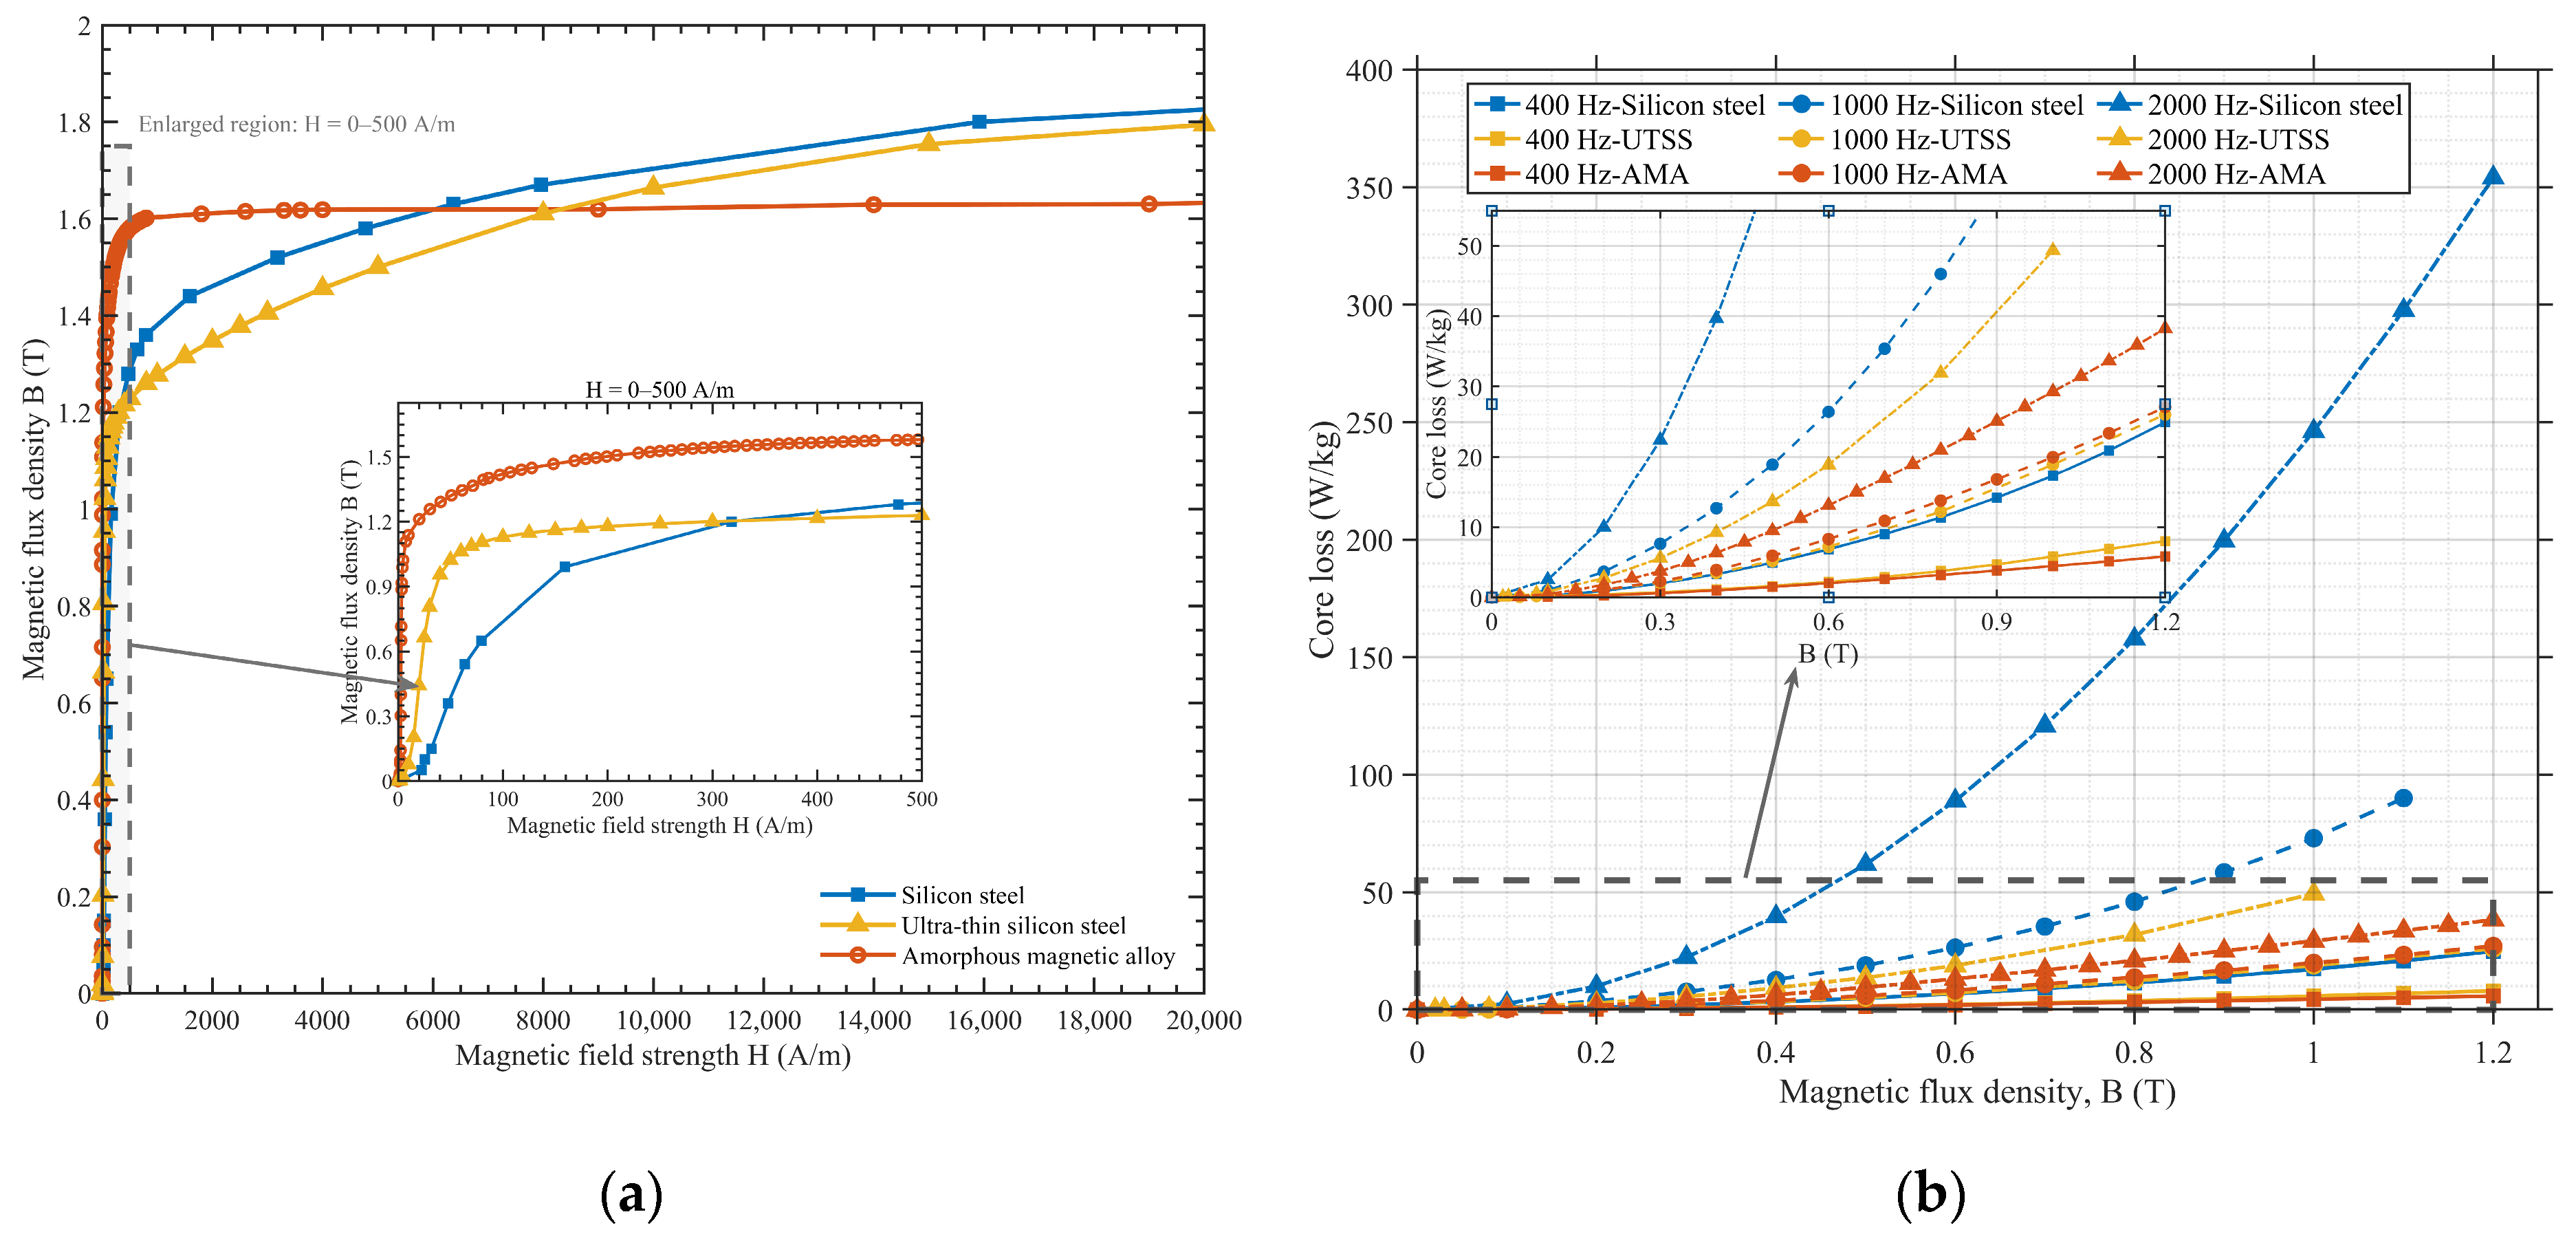
Figure 9a compares the measured B–H curves of the three materials. AMA exhibits a steeper magnetization curve in the low-field region, indicating higher magnetic permeability, but reaches the nonlinear saturation region earlier and exhibits a lower saturation flux density. In contrast, silicon steel provides the highest saturation capability, while UTSS shows intermediate magnetic characteristics. Figure 9b shows the measured core-loss characteristics at different frequencies and flux densities. Conventional silicon steel exhibits a substantially steeper loss increase, whereas UTSS and AMA maintain significantly lower losses. The difference among the materials becomes increasingly evident at high frequency, demonstrating the advantage of low-loss magnetic materials for high-speed motor operation. The material comparison in this study focuses on the stator core because the high-frequency core loss of the investigated HIPMSM is dominated by the stator, particularly the tooth and yoke regions. Therefore, silicon steel, UTSS, and AMA are applied only to the stator core, while the rotor-core material is kept unchanged. This setting isolates the influence of the stator-core material on the electromagnetic performance and maintains consistent rotor magnetic and high-speed mechanical conditions among the three motors [24,25].
Figure 9.
Characteristics of silicon sheet, UTSS, and AMA: (a) B-H curve; (b) measured core loss curves under different frequencies.
Practical manufacturability and high-speed mechanical reliability are also considered. Lamination thicknesses of 0.35, 0.20, and 0.025 mm and stacking factors of 0.97, 0.96, and 0.93 are adopted for silicon steel, UTSS, and AMA, respectively. Owing to the extremely small ribbon thickness of AMA, the relative contribution of interlaminar insulation, bonding layers, and small assembly gaps to the total core thickness becomes more significant, leading to a lower effective stacking factor than that of conventional silicon-steel laminations. The stacking factor adopted for the AMA material used in our laboratory is within the typical range reported for AMA cores [26]. A minimum rotor bridge width of 1.6 mm is maintained, and the centrifugal stress at 25,000 rpm remains below 50% of the material yield strength, ensuring sufficient mechanical safety margin.
4.2. Initial Parameter Design
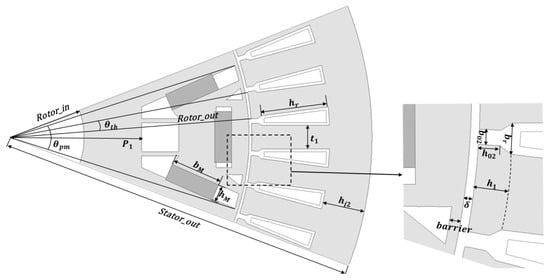
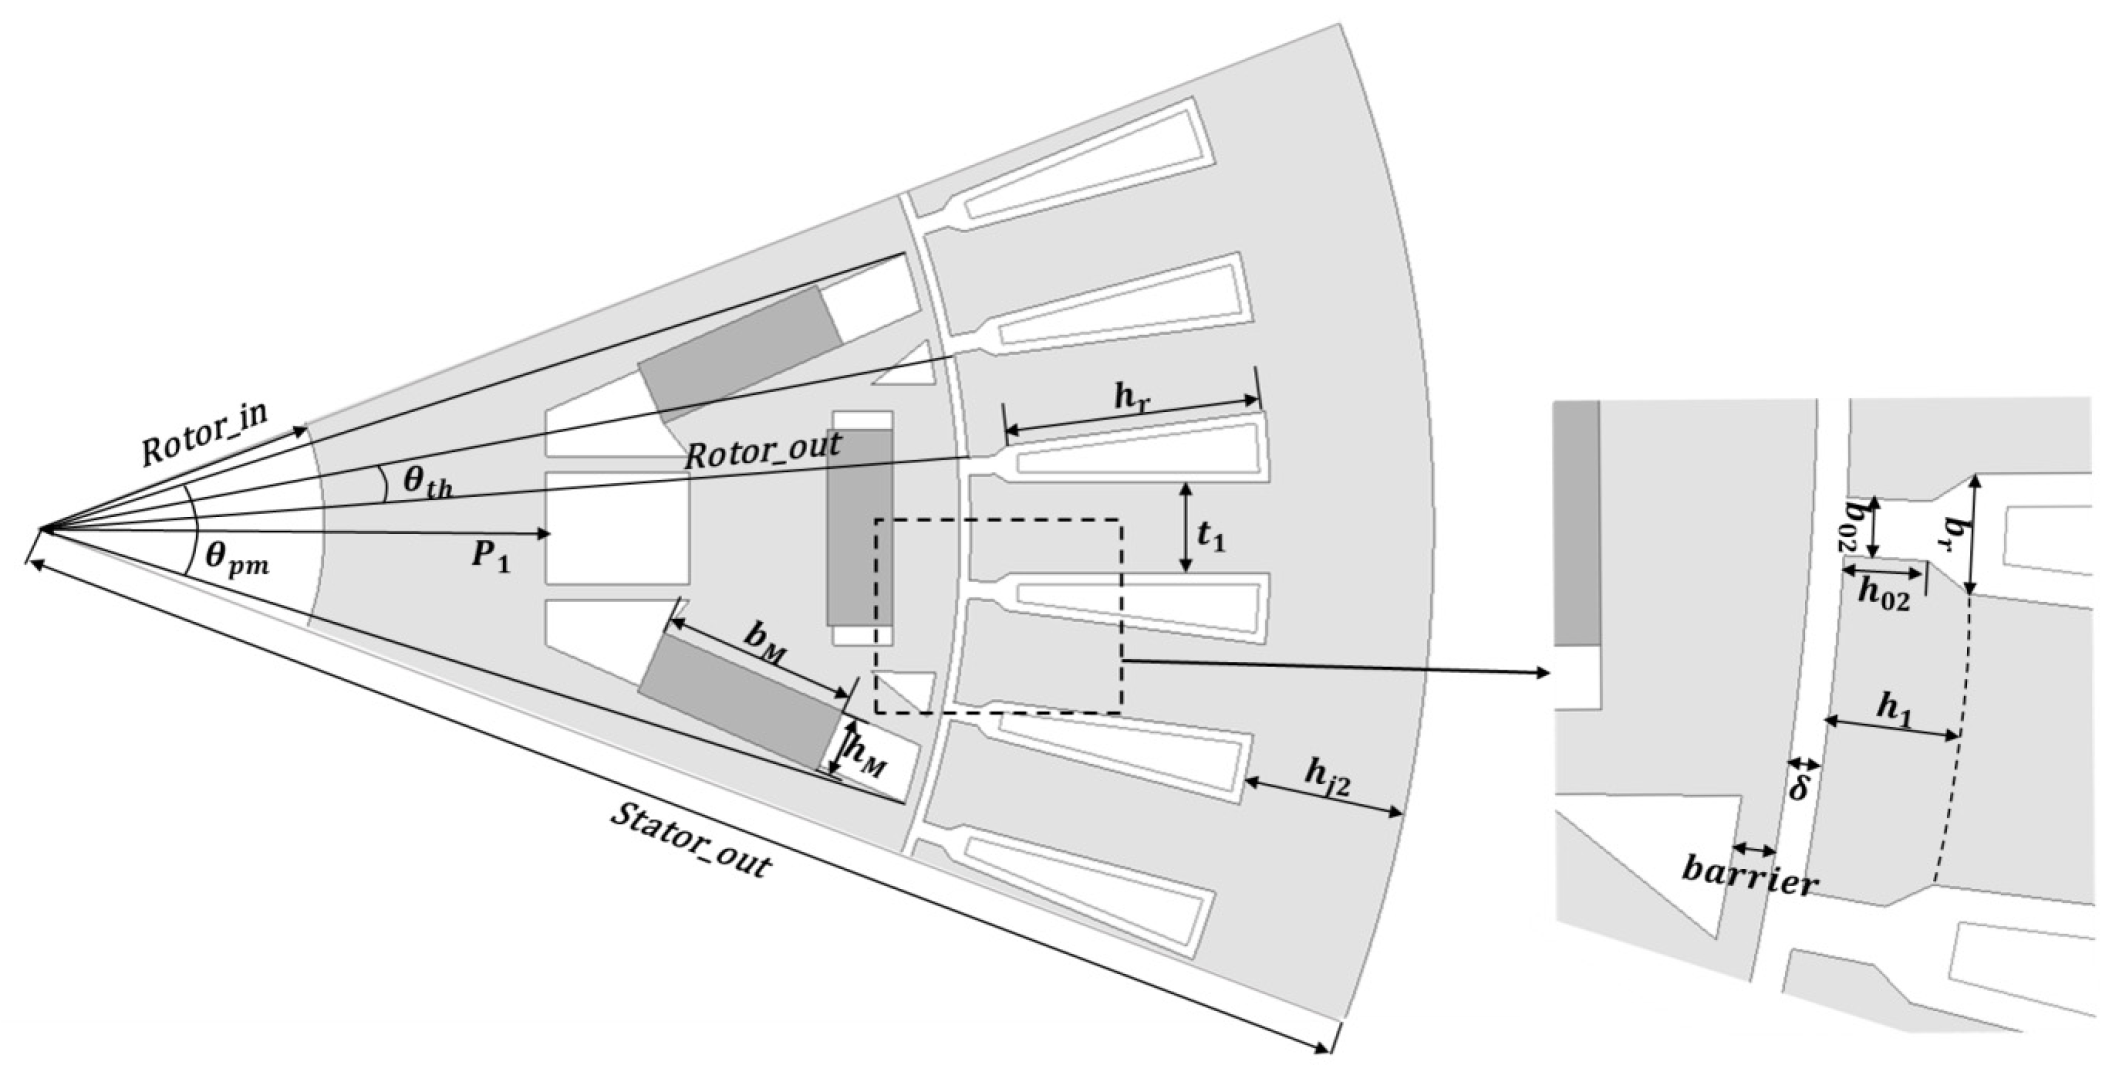
IPMSMs using silicon sheet, UTSS, and AMA for the stator are denoted as Si-HIPMSM, UTSS-HIPMSM, and AMA-HIPMSM, respectively. When novel materials are used to replace the silicon sheet as the stator material for the motor, it is necessary to adjust the motor’s structural parameters to meet the technical requirements in Table 1. Figure 10 provides the main parameters of the IPMSM. Table 3 lists the initial dimensional parameters of the three motors after adjustment. Compared with silicon steel, AMA has a lower saturation flux density, which limits the allowable magnetic loading and causes the core to enter the nonlinear saturation region earlier. A moderate increase in the motor diameter is introduced for the AMA-HIPMSM to maintain the required torque and power capability while avoiding excessive magnetic saturation. Although the AMA-HIPMSM has increased in size, it does not have a disadvantage in terms of mass due to the relatively lower density of the AMA. A 2D transient FEM model is employed. Local length-based mesh controls are applied in the air-gap and tooth-tip regions. For the air-gap, the maximum element size is set to 0.12 mm. Adaptive meshing is enabled, and mesh independence is verified by torque convergence, where further refinement changes the average torque by less than 1%.
Figure 10.
Main design parameters of HIPMSM.
Table 3.
Parameters of IPMSMs.
4.3. Performance Comparison
Based on the analysis in Section 2, the impact of core losses on motor efficiency is particularly significant, especially in the high-speed range. Therefore, an analysis of core losses for the three types of motors at O4 RP is conducted. Core losses are composed of hysteresis losses, eddy current losses, and additional losses. The calculation of motor core losses using the classical three-term model is as follows:
where m denotes the core material. Based on the measured core-loss data shown in Figure 9b, kh, ke, and kα are identified by minimizing the discrepancy between the measured and regression loss data:
The resulting coefficients for the three core materials are summarized in Table 4. The saturation-corrected equivalent flux density and saturation factor are defined as
where Bm(i) is the operating flux density of material m at the ith operating point, and Bk,m and Bsat,m are the knee-point and saturation flux densities obtained from the corresponding B-H curve, respectively. The saturation factor Ssat,m(i) is bounded within [0, 1].
Table 4.
Core-loss coefficients of the three core materials.
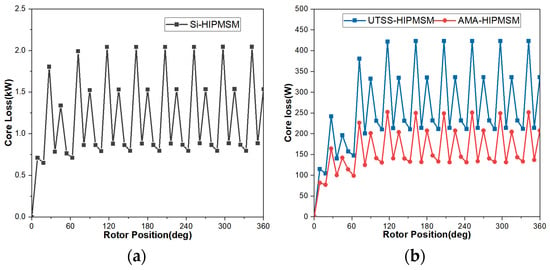
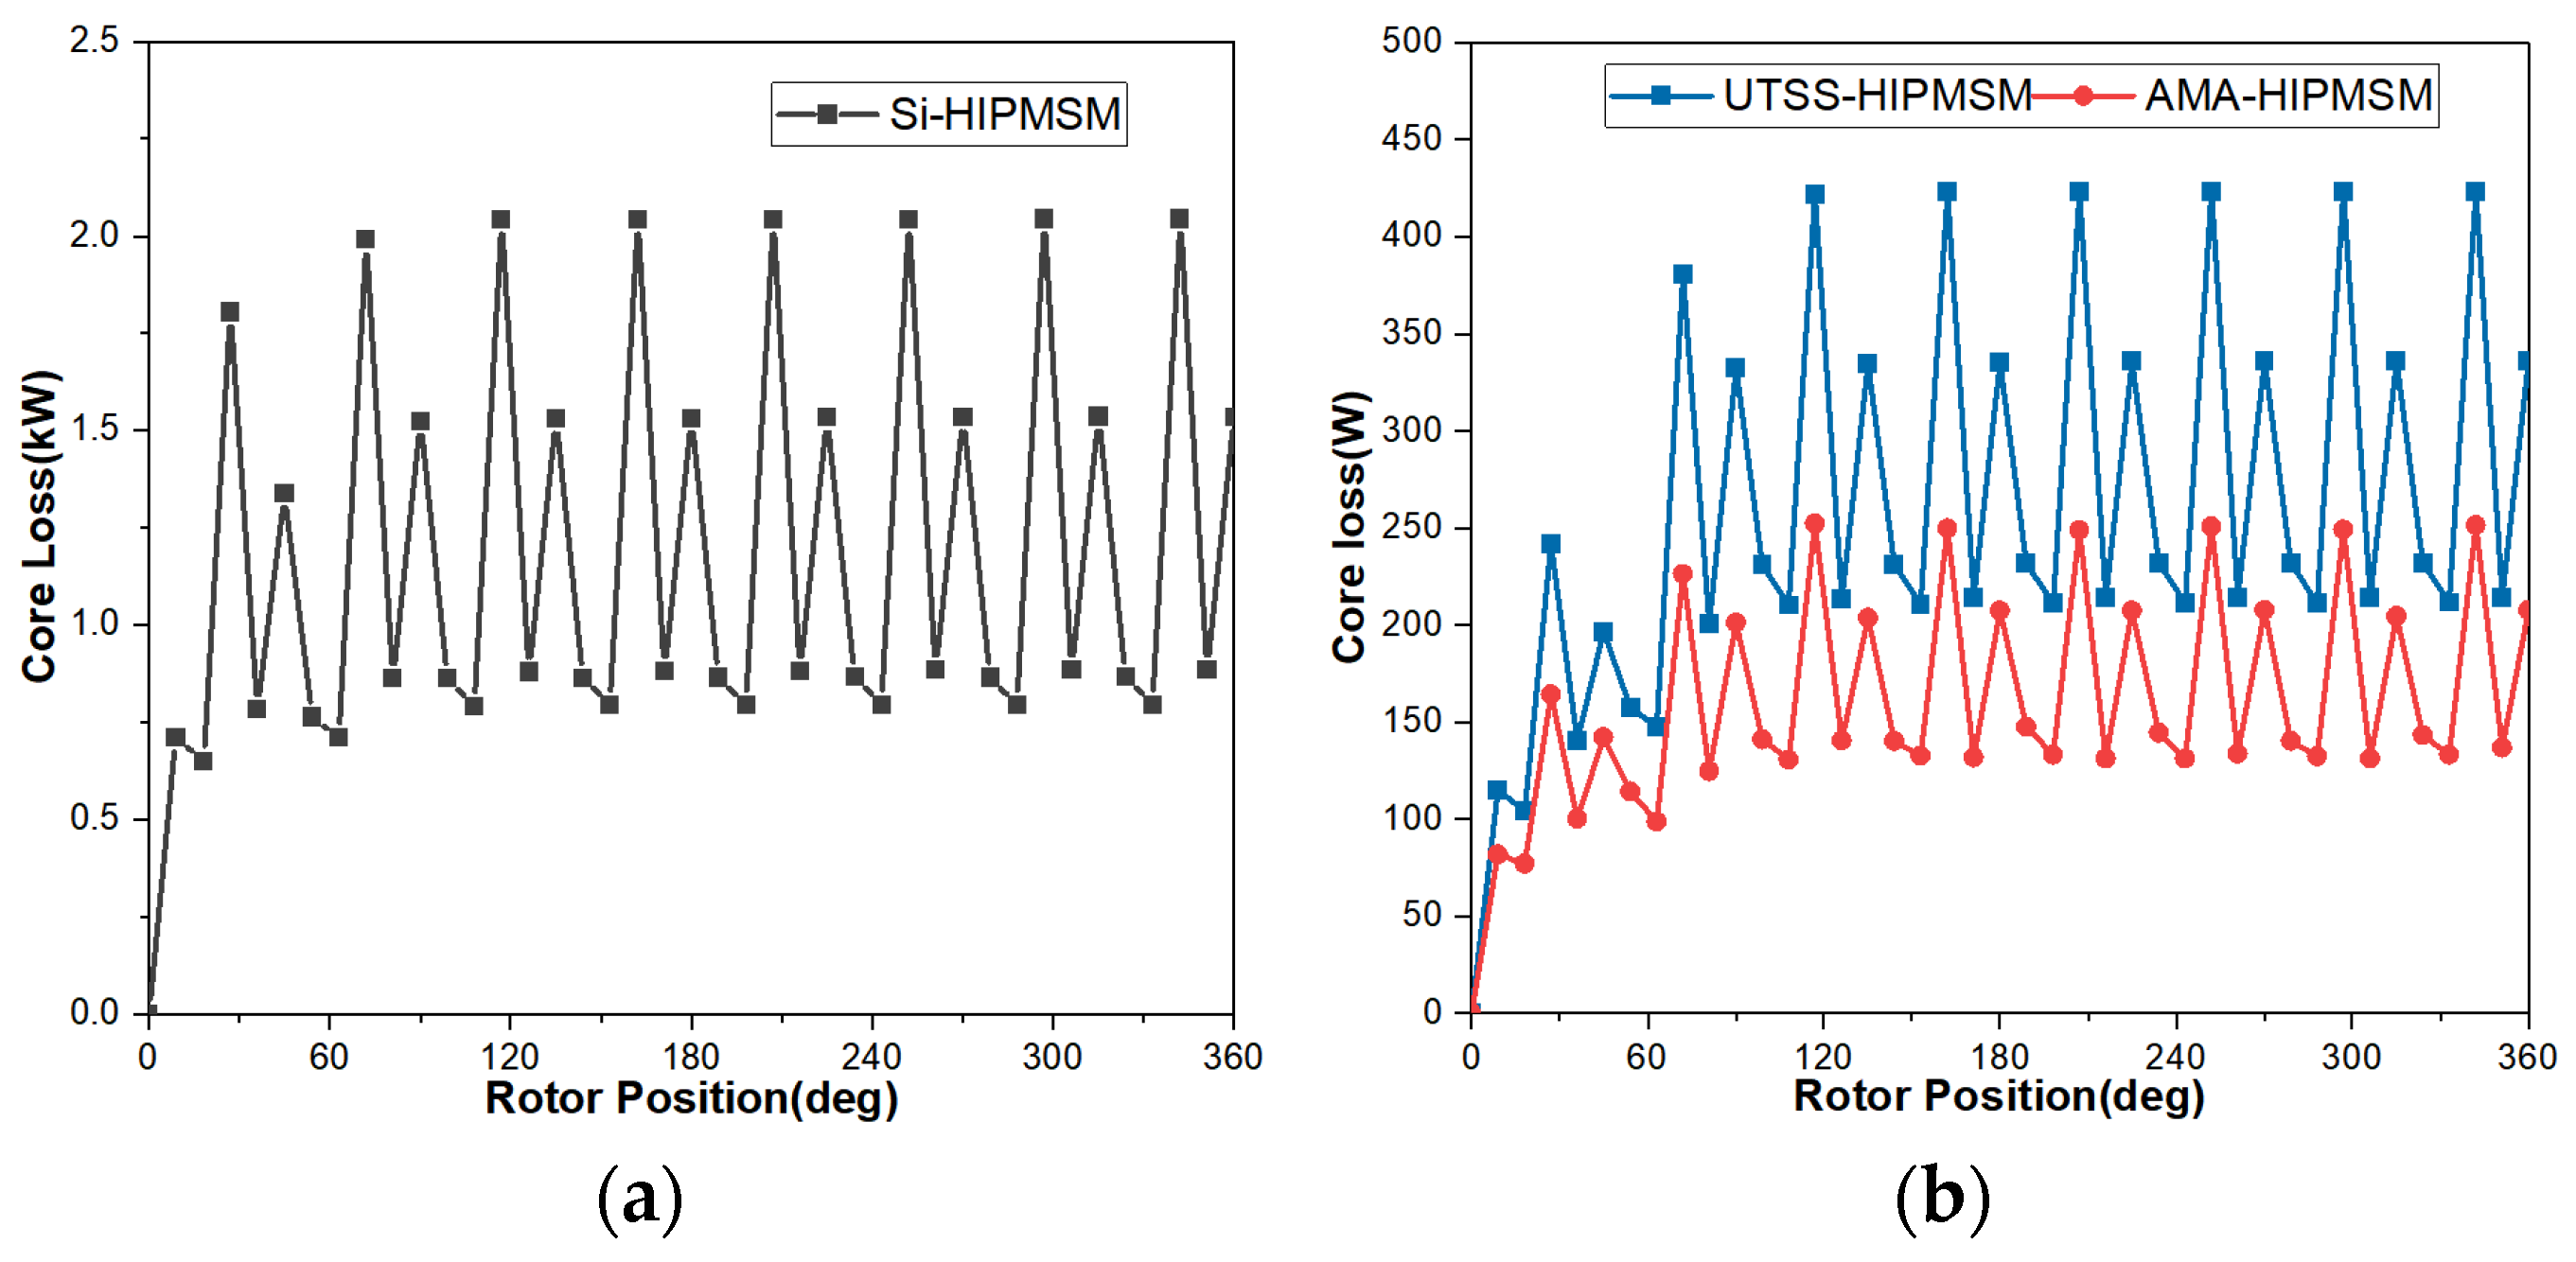
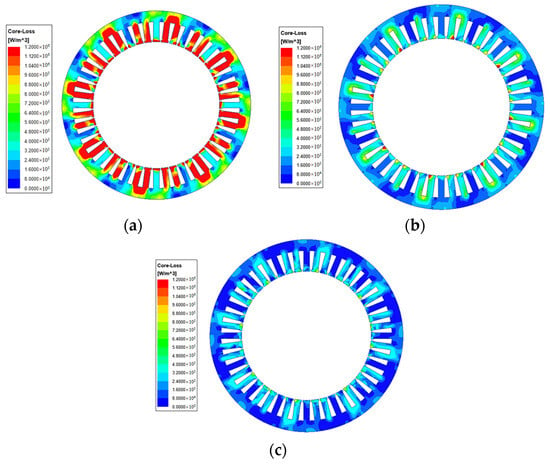
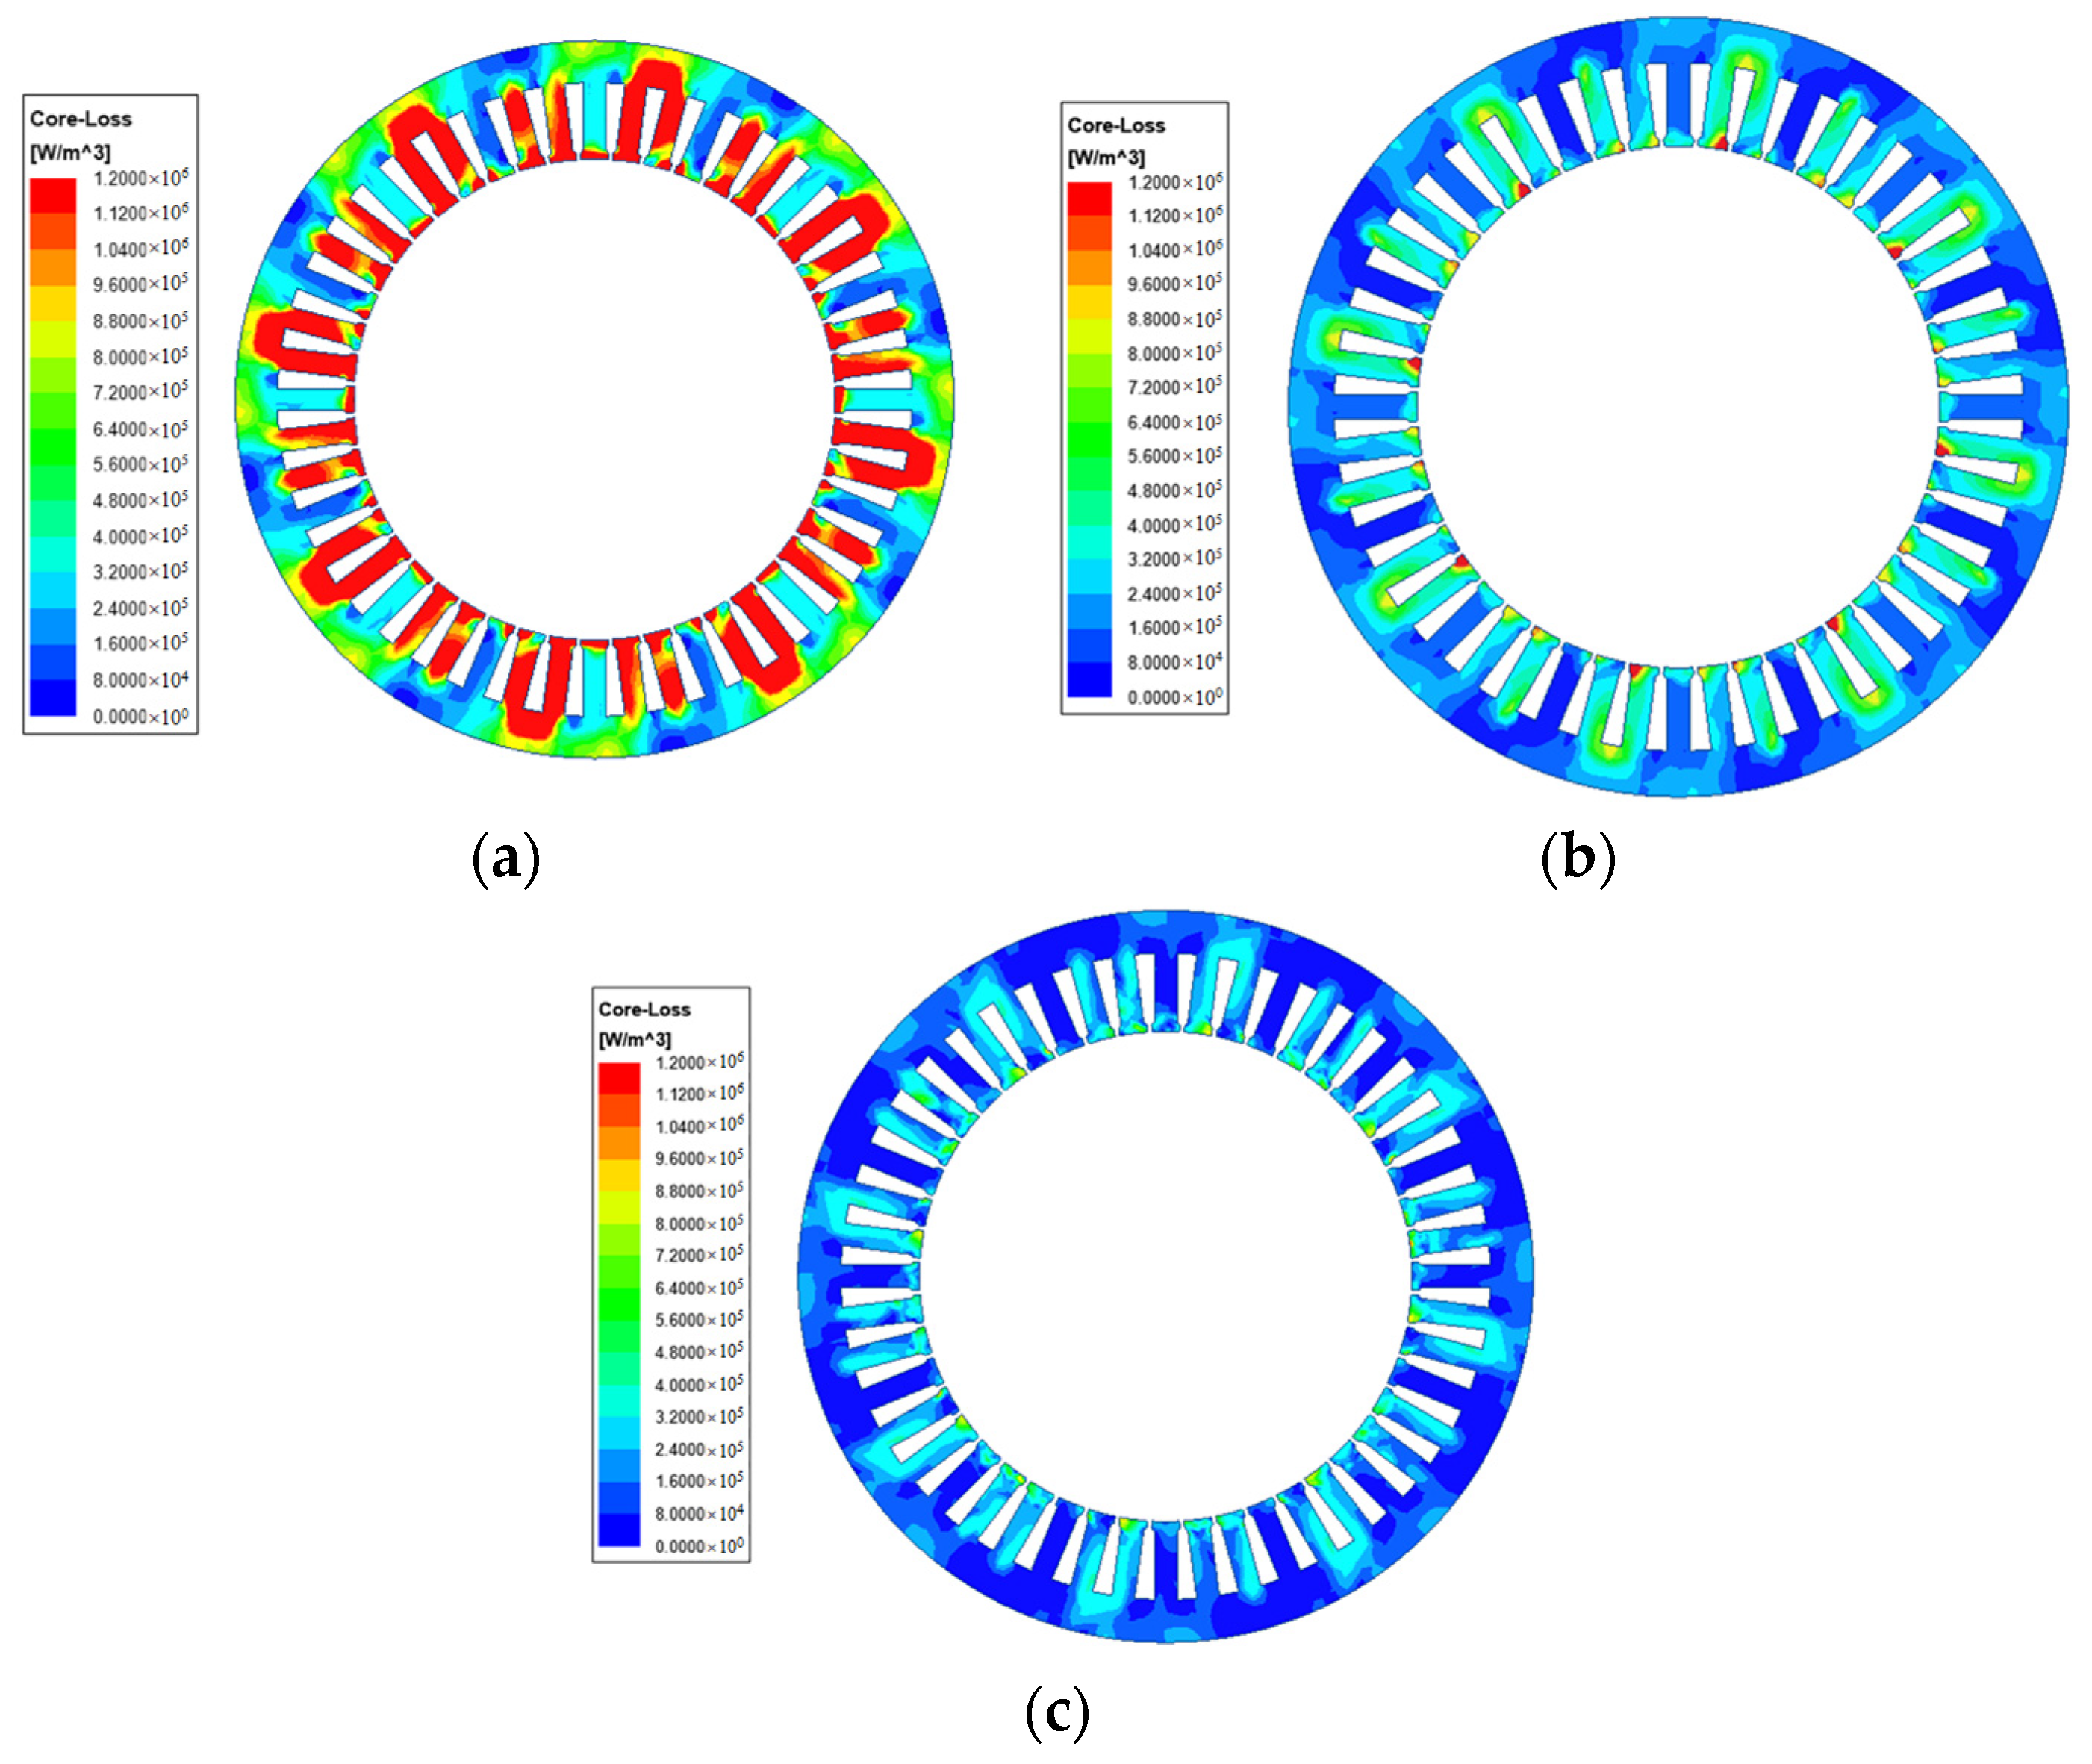
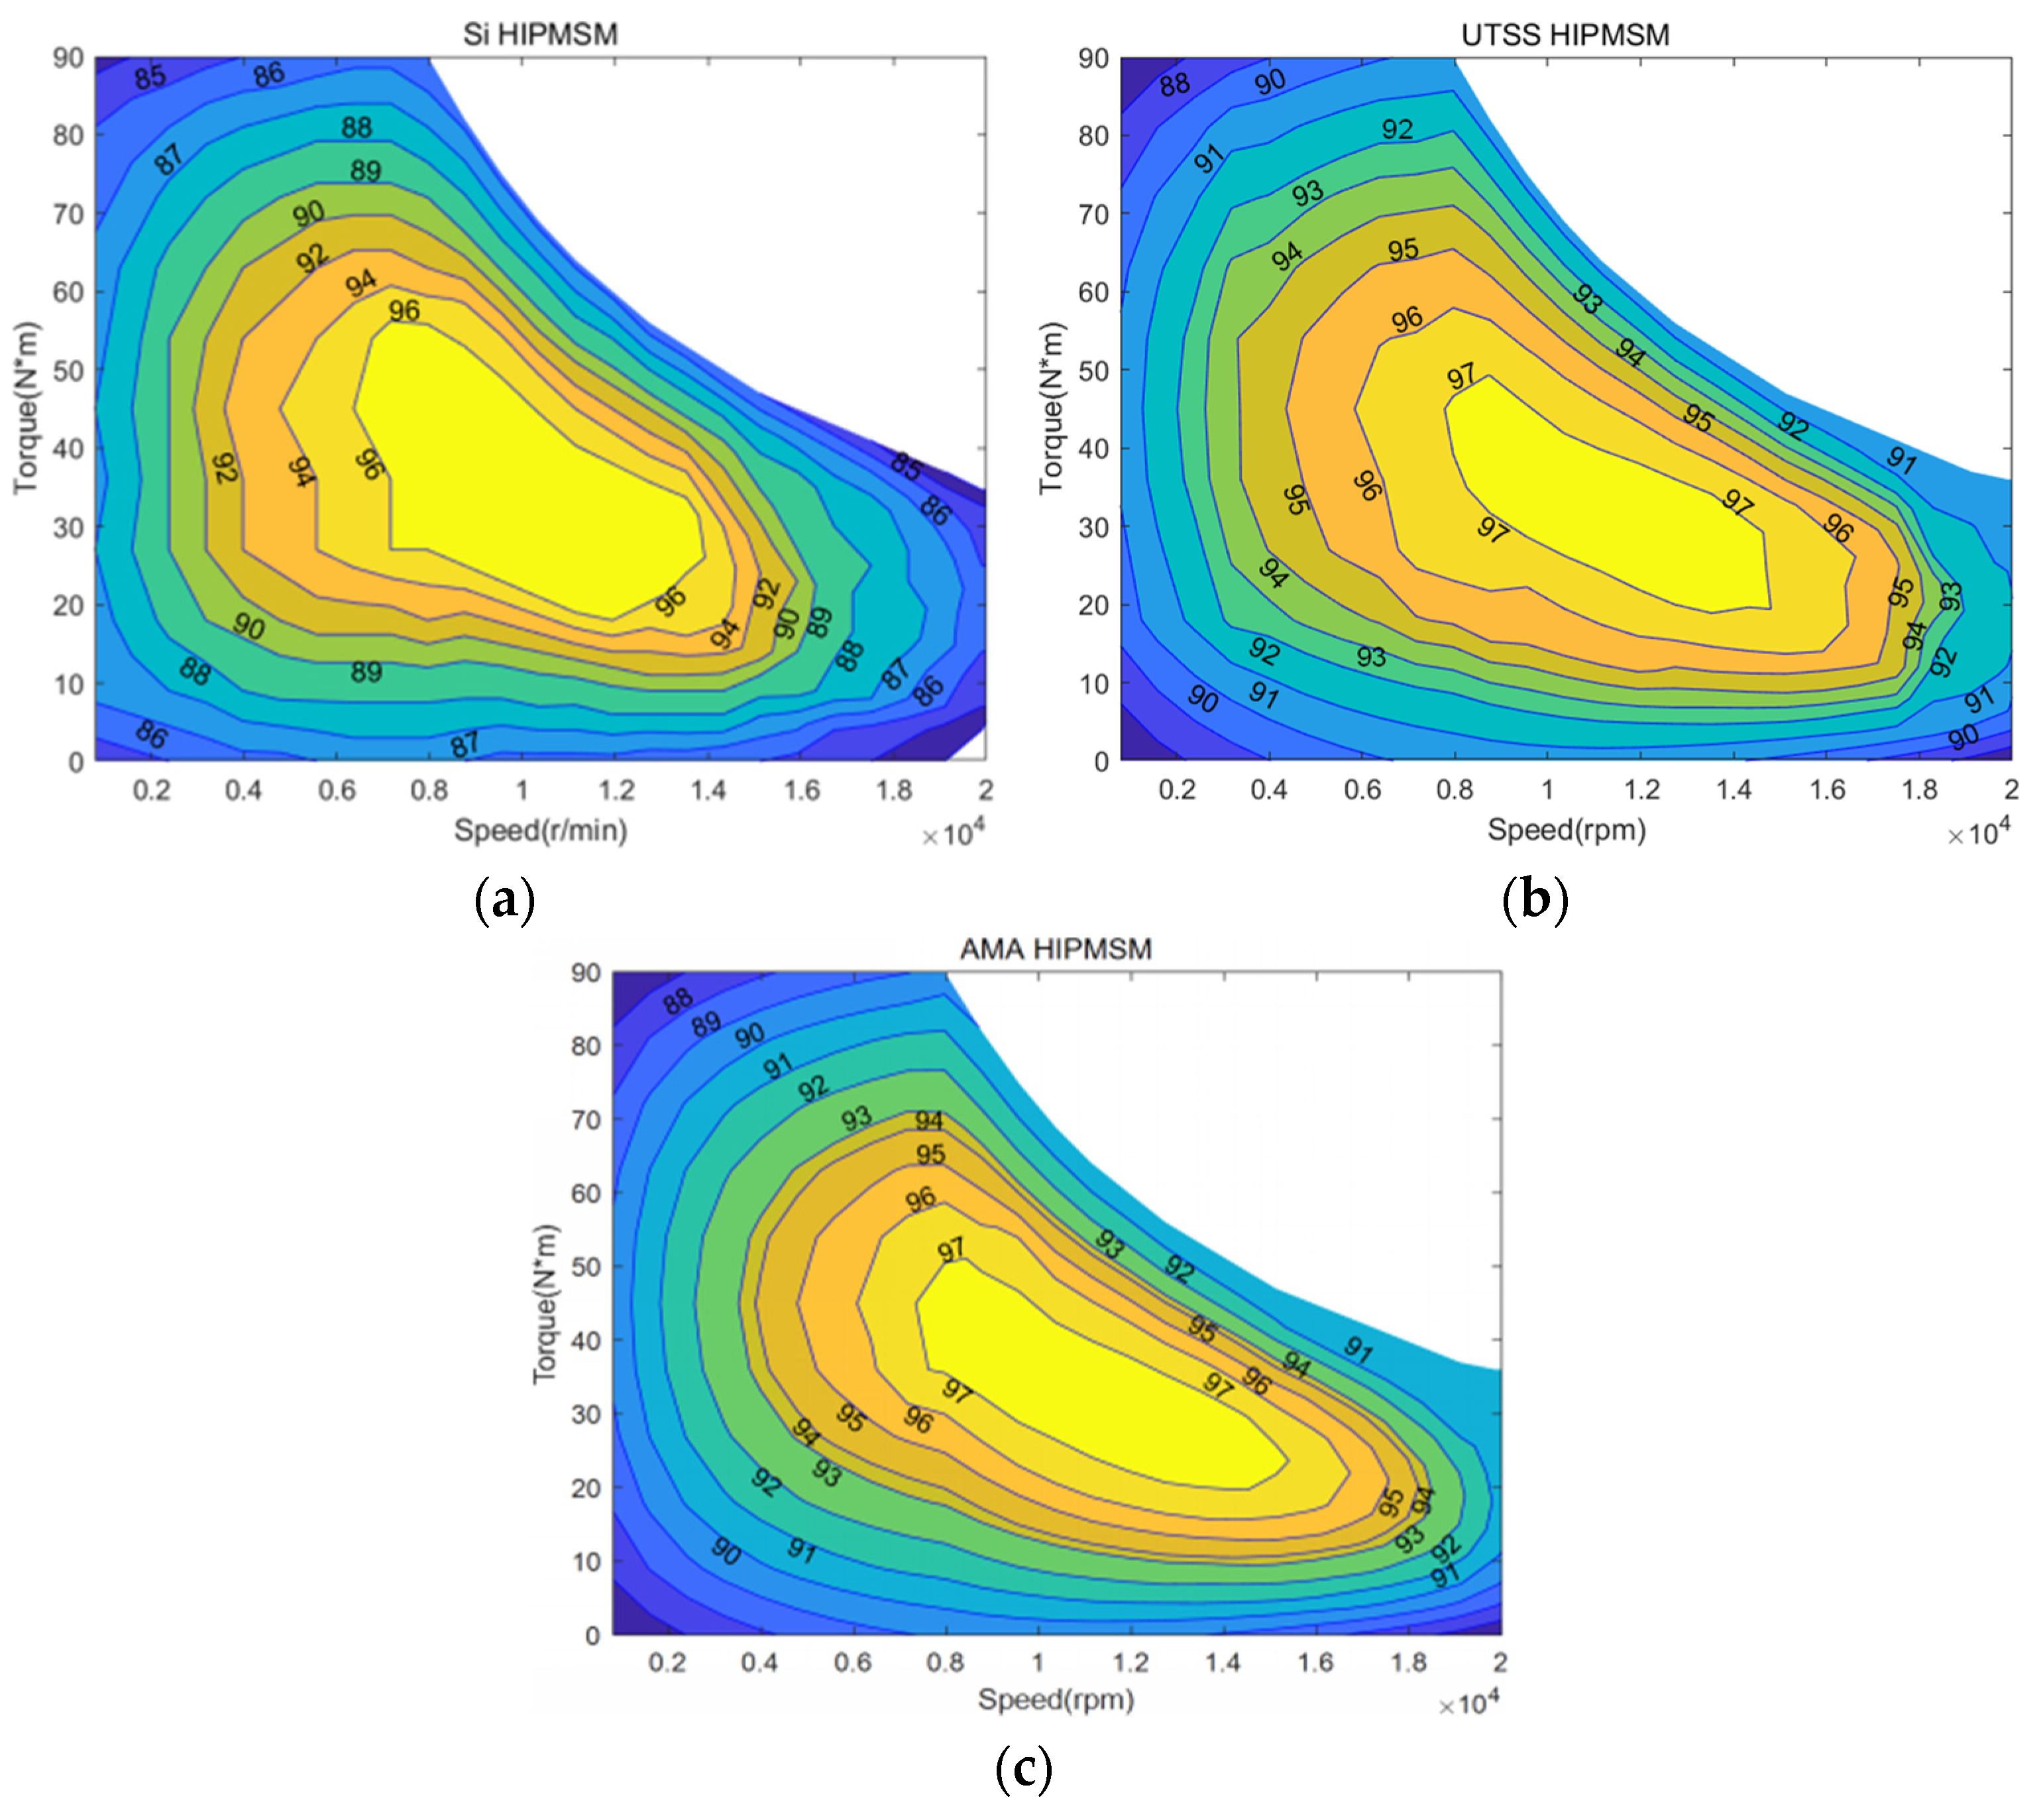
Figure 11 illustrates the core losses of the three electrical machines at O4. The average core losses for Si-HIPMSM, UTSS-HIPMSM, and AMA-HIPMSM are 2241 W, 474 W, and 302 W, respectively. Figure 12 shows the distribution of loss density for the stator cores made of silicon sheet, UTSS and AMA. The stator core losses are predominantly concentrated in the stator teeth, which aligns closely with the distribution of magnetic flux density.
Figure 11.
Core losses at O4: (a) Si-HIPMSM, (b) UTSS-HIPMSM, and AMA-HIPMSM.
Figure 12.
Core loss density distributions at O4: (a) Si-HIPMSM, (b) UTSS-HIPMSM, (c) AMA-HIPMSM.
Efficiency is an important indicator for evaluating the performance of the motor, and the motor efficiency can be expressed as
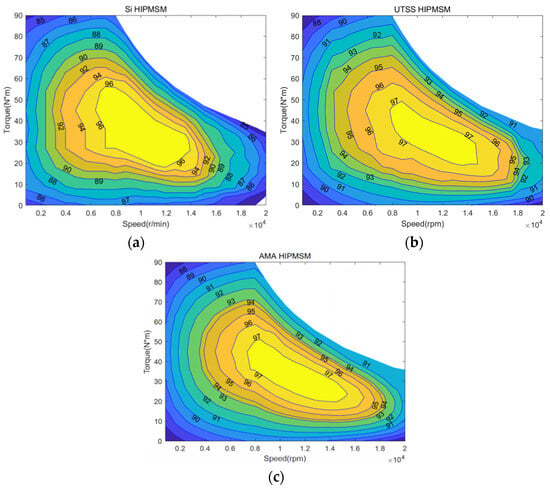
Figure 13 displays efficiency maps for the Si-IPMSM, UTSS-HIPMSM, and AMA-HIPMSM. The efficiency map can be divided into three speed ranges: low (0–3000 rpm), medium (3000–10,000 rpm), and high (10,000–20,000 rpm). The corresponding efficiency-map distribution characteristics of the three HIPMSMs are summarized in Table 5.
Figure 13.
Efficiency maps: (a) Si-HIPMSM, (b) UTSS-HIPMSM, (c) AMA-HIPMSM.
Table 5.
Efficiency map distribution characteristics of three HIPMSMs.
The torque characteristics of the electrical machine under different operating conditions directly reflect its ability to start, accelerate, and climb slopes. According to the Maxwell stress tensor, the tangential electromagnetic stress and instantaneous electromagnetic torque can be expressed as
Br and Bt are the radial and tangential air-gap flux densities, respectively; Lef is the effective core length; rg is the air-gap radius; MT is the average component of the torque-producing magnetic field; and Mh denotes its hth harmonic component. Accordingly, the average torque-producing magnetic-field factor and harmonic field index are defined as
Therefore, the average electromagnetic torque can be directly expressed as
while Hg characterizes the harmonic fluctuation of the torque-producing magnetic field. The torque ripple is calculated by
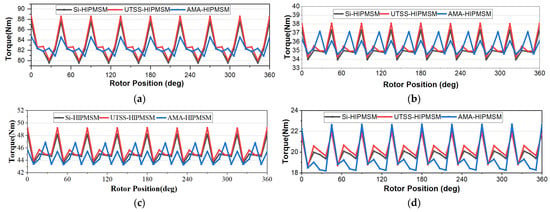
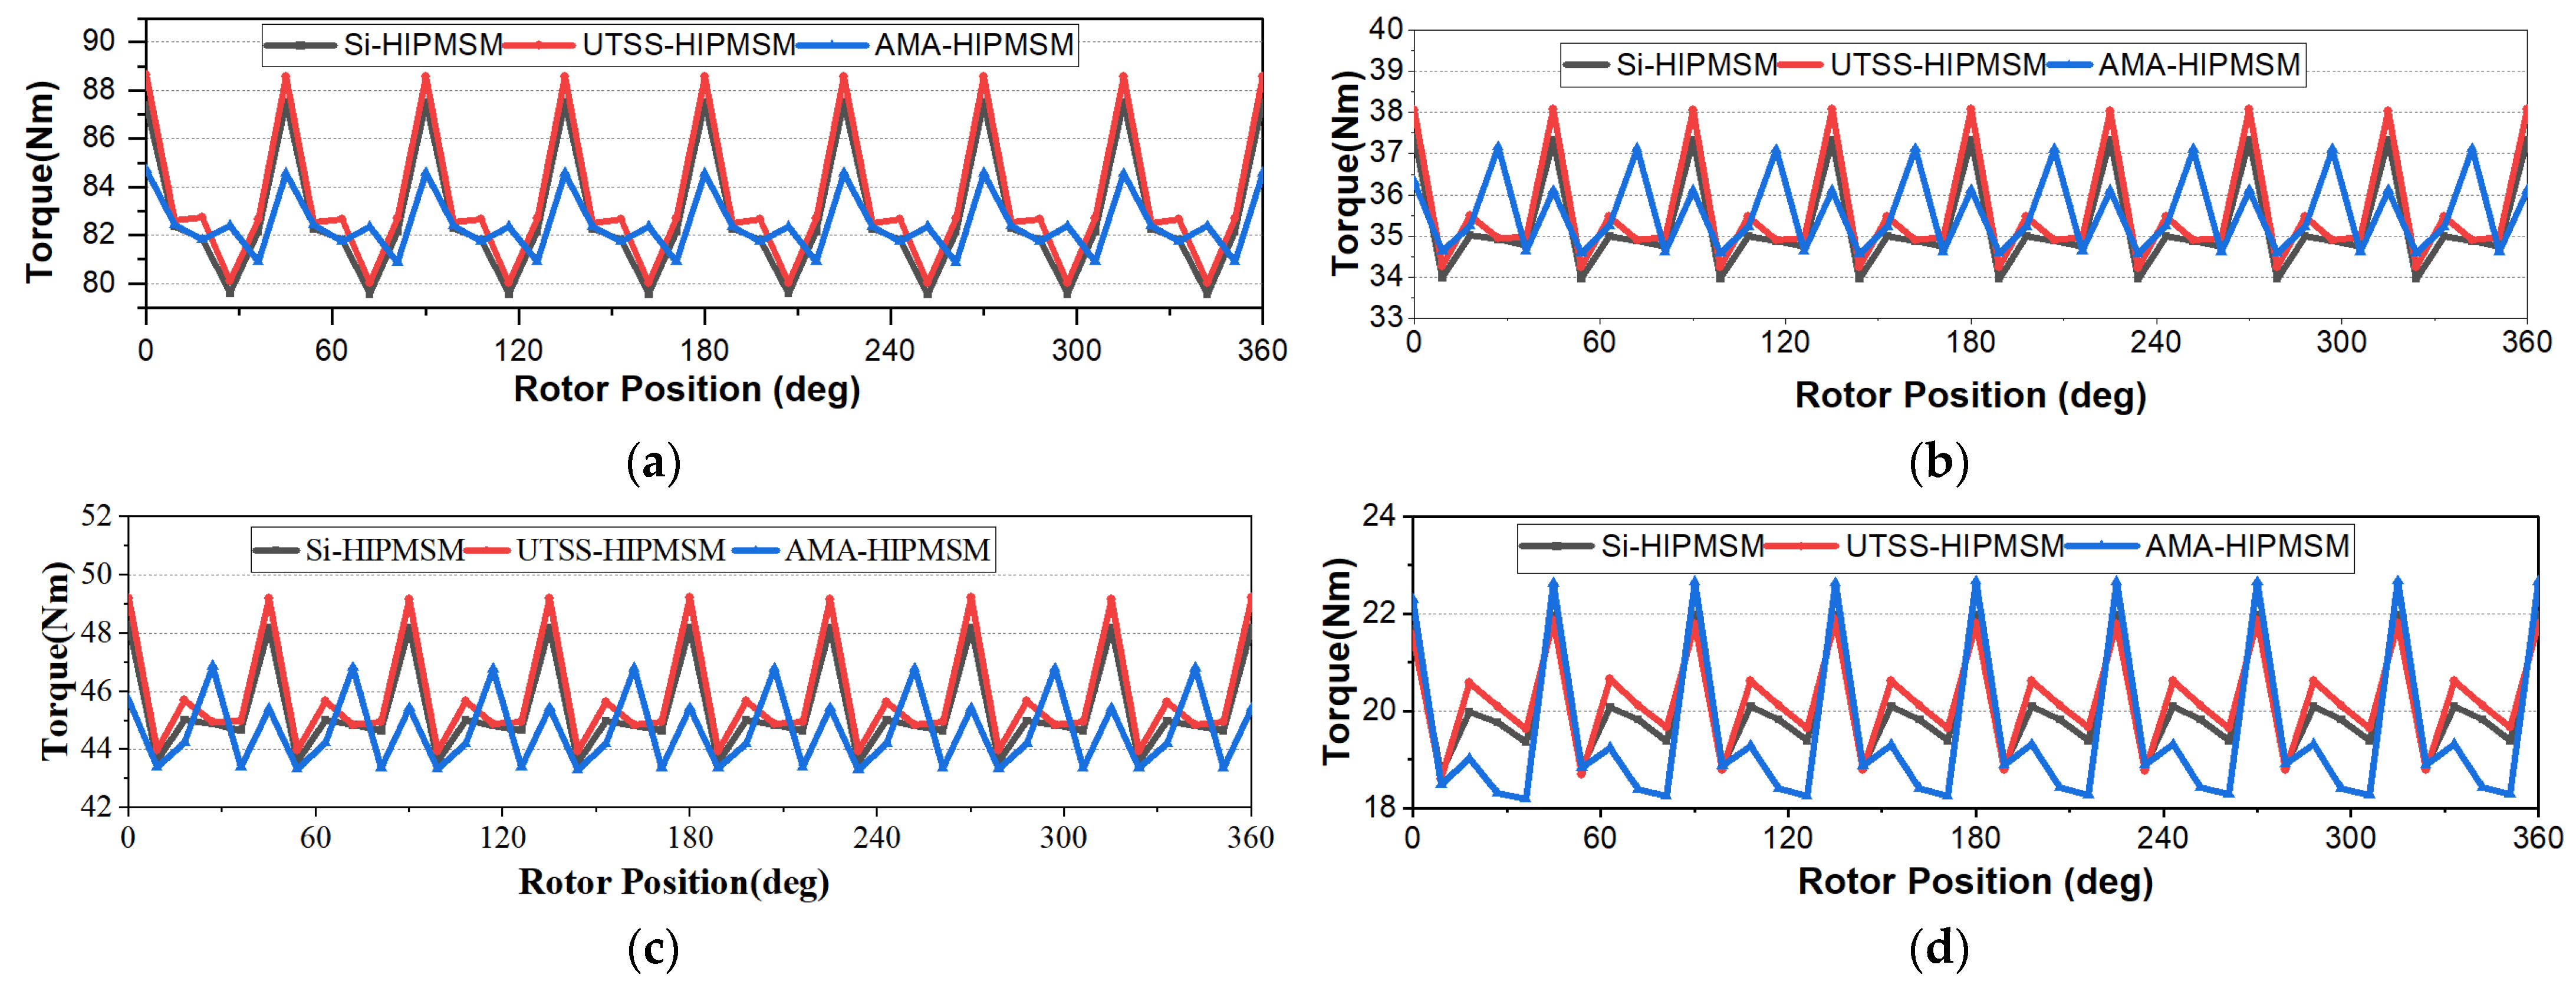
Figure 14 shows the torque characteristics of the three motors at RPs. To compare the torque ripple of the motors, it can be represented as follows: Table 6 presents the average torque and torque ripple for the Si-HIPMSM, UTSS-HIPMSM, and AMA-HIPMSM under RPs.
Figure 14.
Torque characteristics of four RPs: (a) O1, (b) O2, (c) O3, (d) O4.
Table 6.
Values of average torque and torque ripple at each RP.
To quantitatively evaluate the overall performance of the three motors over the WLTP operating range, the efficiency, average torque, and torque ripple are normalized to the range of 0–1. The normalized score of the qth performance index for the mth motor at the ith RP is defined as
The normalized scores are further weighted according to the energy contribution of each RP, and the comprehensive score is calculated as
where wi denotes the energy weight of the ith RP. A higher score indicates better overall performance, and the three performance indices are equally weighted in the comprehensive evaluation. The calculated comprehensive evaluation results are summarized in Table 7. As shown in the table, the WLTP-oriented comprehensive evaluation gives the AMA-HIPMSM the highest score of 0.883, which is selected as the baseline motor for subsequent multi-point optimization.
Table 7.
Comprehensive performance scores of the three motors.
5. Multi-Point Optimization
5.1. Optimization Process
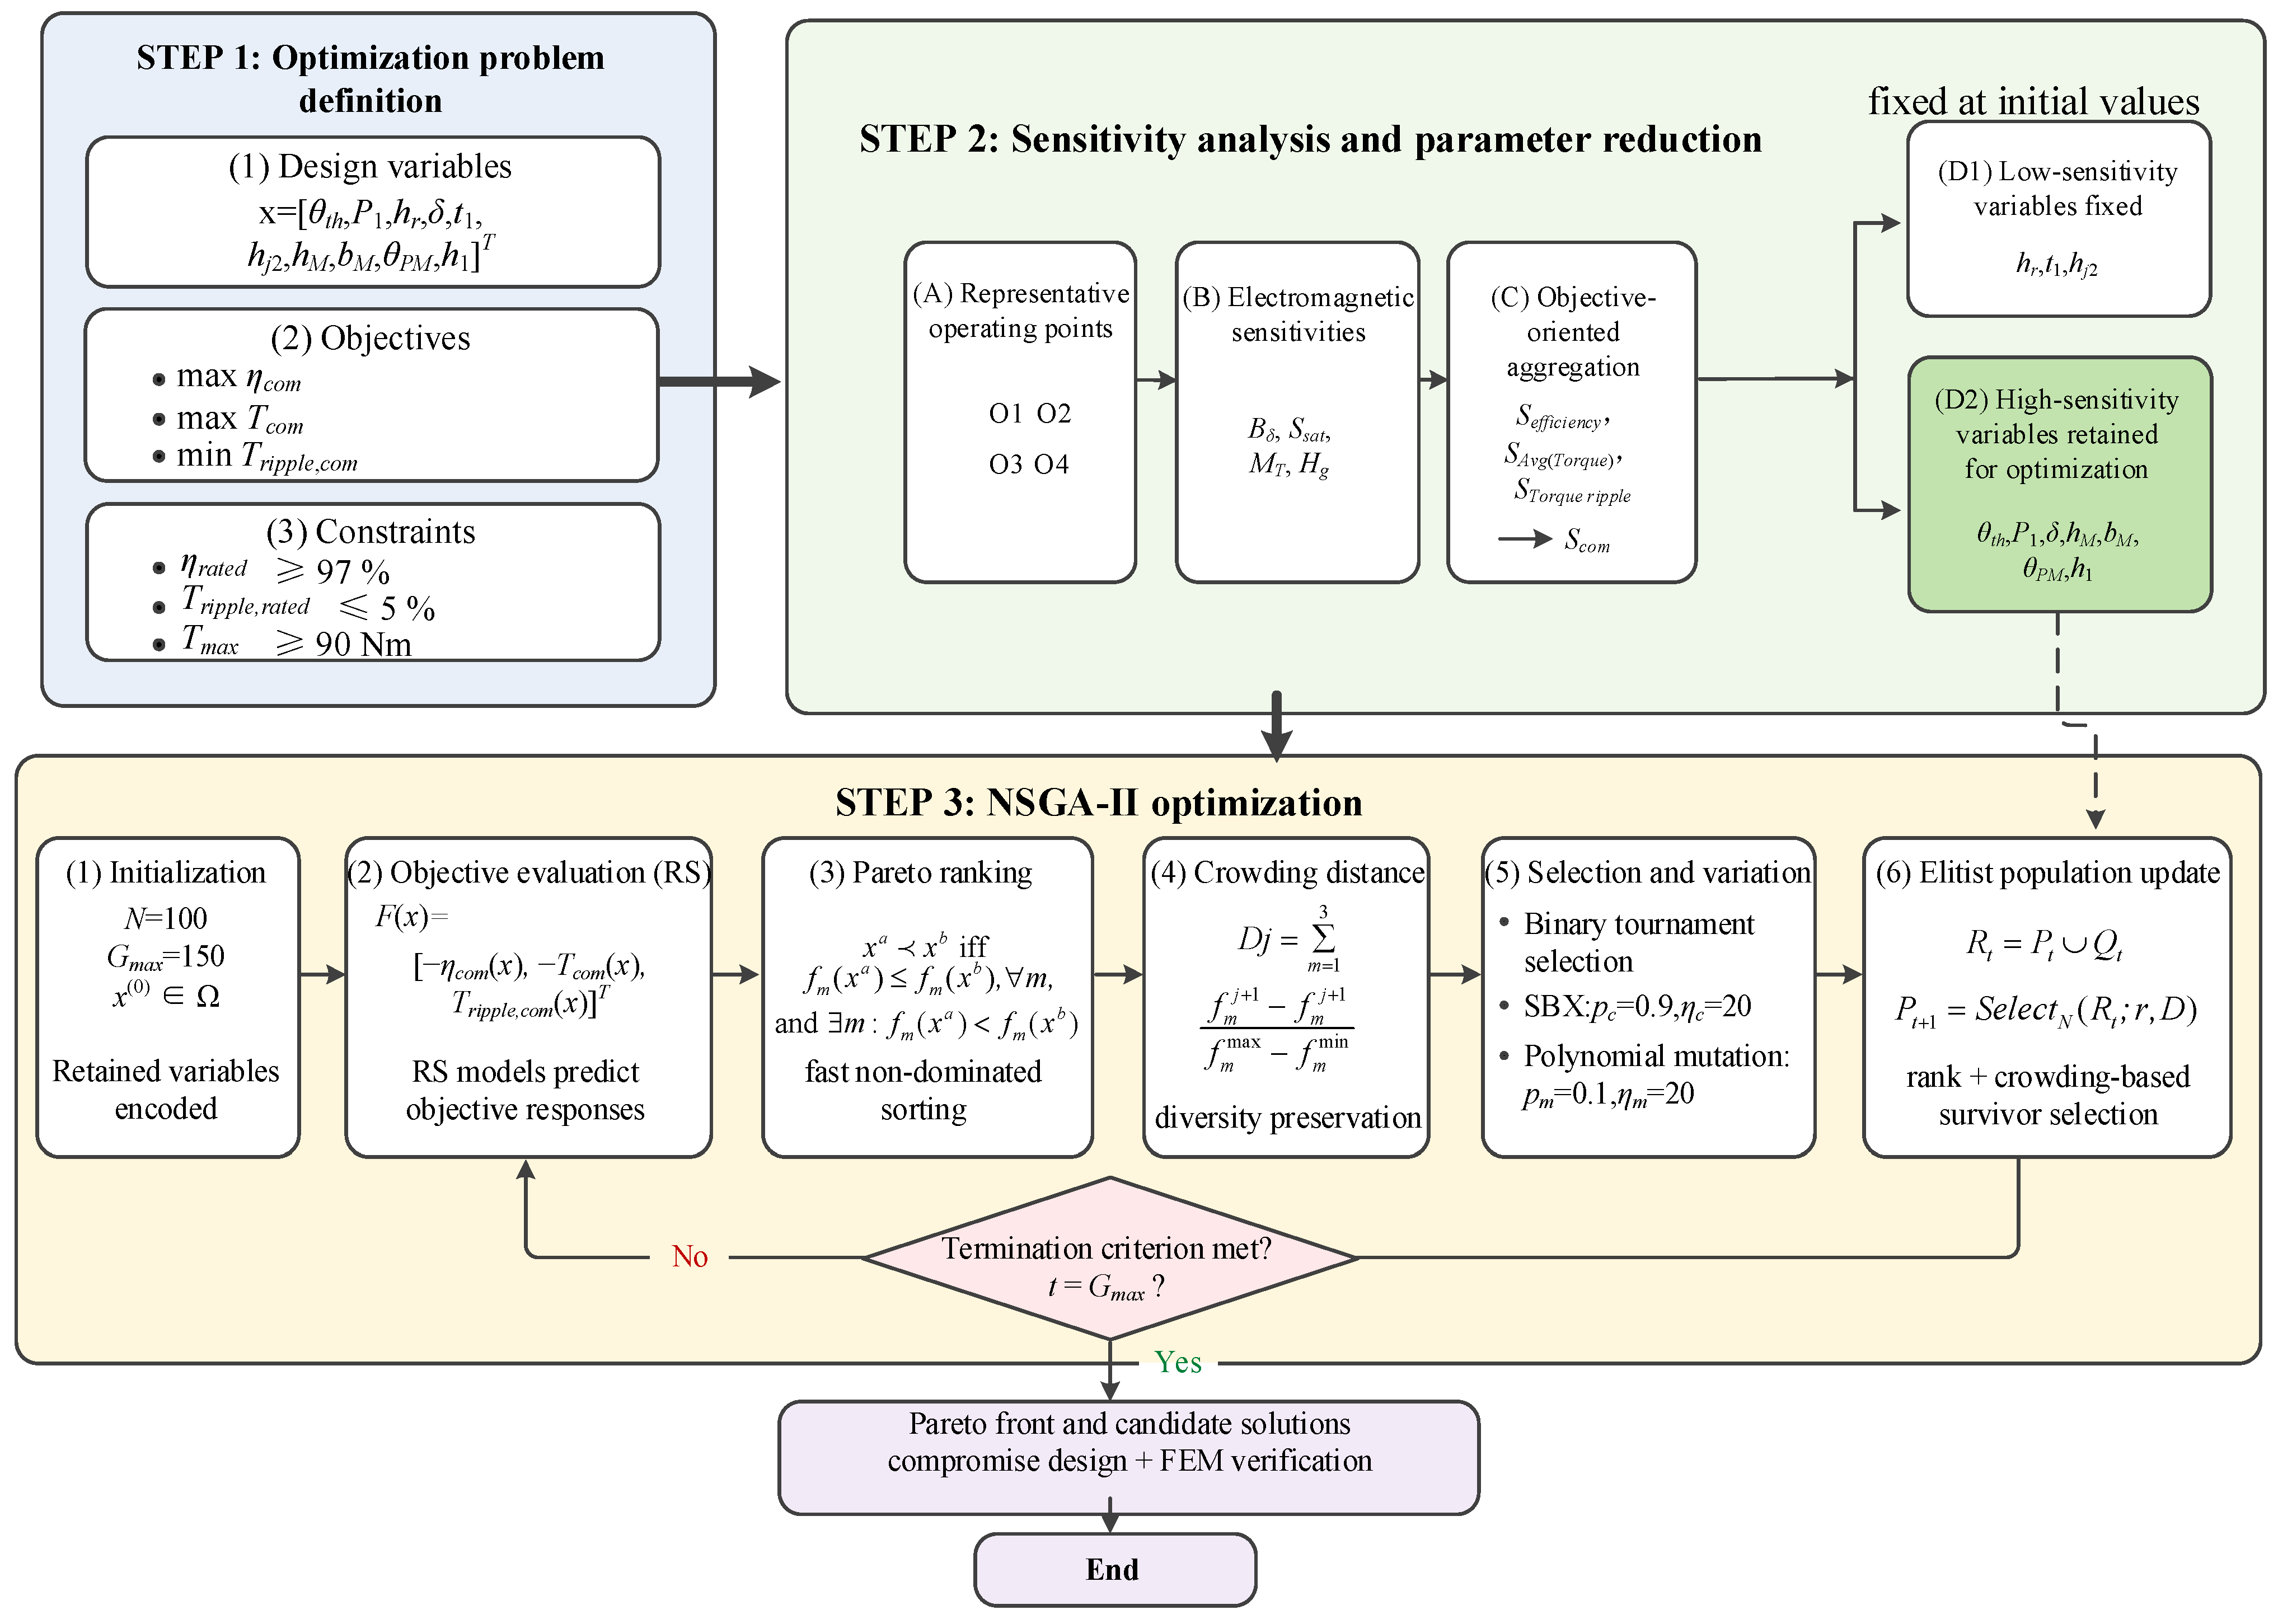
To reduce the computational load of design while enhancing the global performance of the electrical machine, a multi-point design approach integrating new material introduction and topological parameter optimization is proposed. The overall optimization procedure is summarized as follows.
Firstly, based on the torque–speed distribution of driving cycles, four RPs are selected by the k-means clustering method. Then, based on the performance comparison of electrical machines with different core materials, the optimization target is determined as AMA-HIPMSM. Next, the motor parameters to be optimized are selected, and based on the driving requirements for RPs and the analysis results in Section 4, the optimization objectives and weight factors are determined. Furthermore, to account for the variation in electromagnetic behavior among different operating conditions, an operating-condition-dependent sensitivity analysis is performed based on the electromagnetic characteristic quantities derived from the loss and torque mechanisms to identify key design variables and reduce the optimization dimension. Finally, NSGA-II is employed to generate a 3D Pareto front, establishing the optimized parameters. To validate the superiority of the proposed approach, a performance comparison is made between the motor based on multi-point optimization and the motor based on the rated operating point optimization.
5.1.1. Design Parameters and Optimization Objectives
According to the existing design experience of the conventional IPMSM machine, four permanent magnet parameters, four stator tooth parameters, one stator yoke parameter, and the length of the air gap are chosen for the multi-point optimization. Table 8 provides the initial values and the range of optimization for the selected ten parameters.
Table 8.
Ranges and initial values of design variables.
The determination of optimization objectives requires considering both the actual driving condition and the result of the initial motor performance analysis. From the perspective of motor requirements, under different driving conditions, the drive motor has multiple objectives such as high efficiency, high torque, and low torque ripple. Due to the strong coupling of the motor, different optimization objectives are correlated under the same RP, but each optimization objective is independent under different RPs due to the different working states of the motor. To incorporate the contributions of different WLTP operating regions without introducing additional objective-specific weighting factors, the positive-energy weights determined in Section 3 are directly used to aggregate each performance index over the four representative operating points:
where ηi, Torquei, and Tripple_i are the efficiency, torque, and torque ripple at the ith RP, respectively. The weights wi characterize the positive-energy contributions of O1–O4 to the WLTP driving cycle. Accordingly, the proposed multi-point optimization and the conventional rated-point reference optimization are formulated consistently as
The negative signs applied to efficiency and average torque convert their maximization into the minimization form used in the NSGA-II implementation, whereas torque ripple is minimized directly. Importantly, the three components of F remain independent objectives throughout the Pareto search and are not combined into a single scalar fitness function.
To ensure a consistent and physically feasible comparison, the same geometric and performance constraints are imposed on both optimization strategies:
where CPM and Cw are constants determined from the initial design to preserve the prescribed permanent-magnet and winding-related geometric quantities. The third equality constraint maintains the specified radial dimensional relationship of the motor. The inequality constraints require the rated-point efficiency to remain no lower than 97%, the rated-point torque ripple not to exceed 5%, and the maximum torque capability to remain no lower than 90 Nm.
5.1.2. Sensitivity Analysis
The influence of structural parameters varies with the electromagnetic operating state. Therefore, the sensitivities are evaluated separately at the four representative operating points. For the ith operating point, the electromagnetic characteristic quantity is expressed as
and m denotes the AMA magnetic properties. During sensitivity analysis, the operating-state variables of each representative point are fixed, while the structural parameters vary within the ranges listed in Table 8. Response-surface models are established for the four electromagnetic characteristic quantities. At the sth design sample, the normalized sensitivity of zk to structural parameter xj is defined as
where Δxj and Δzk(i) are their variation ranges. The overall electromagnetic sensitivity within the design space is calculated by
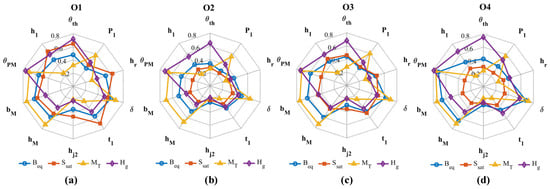
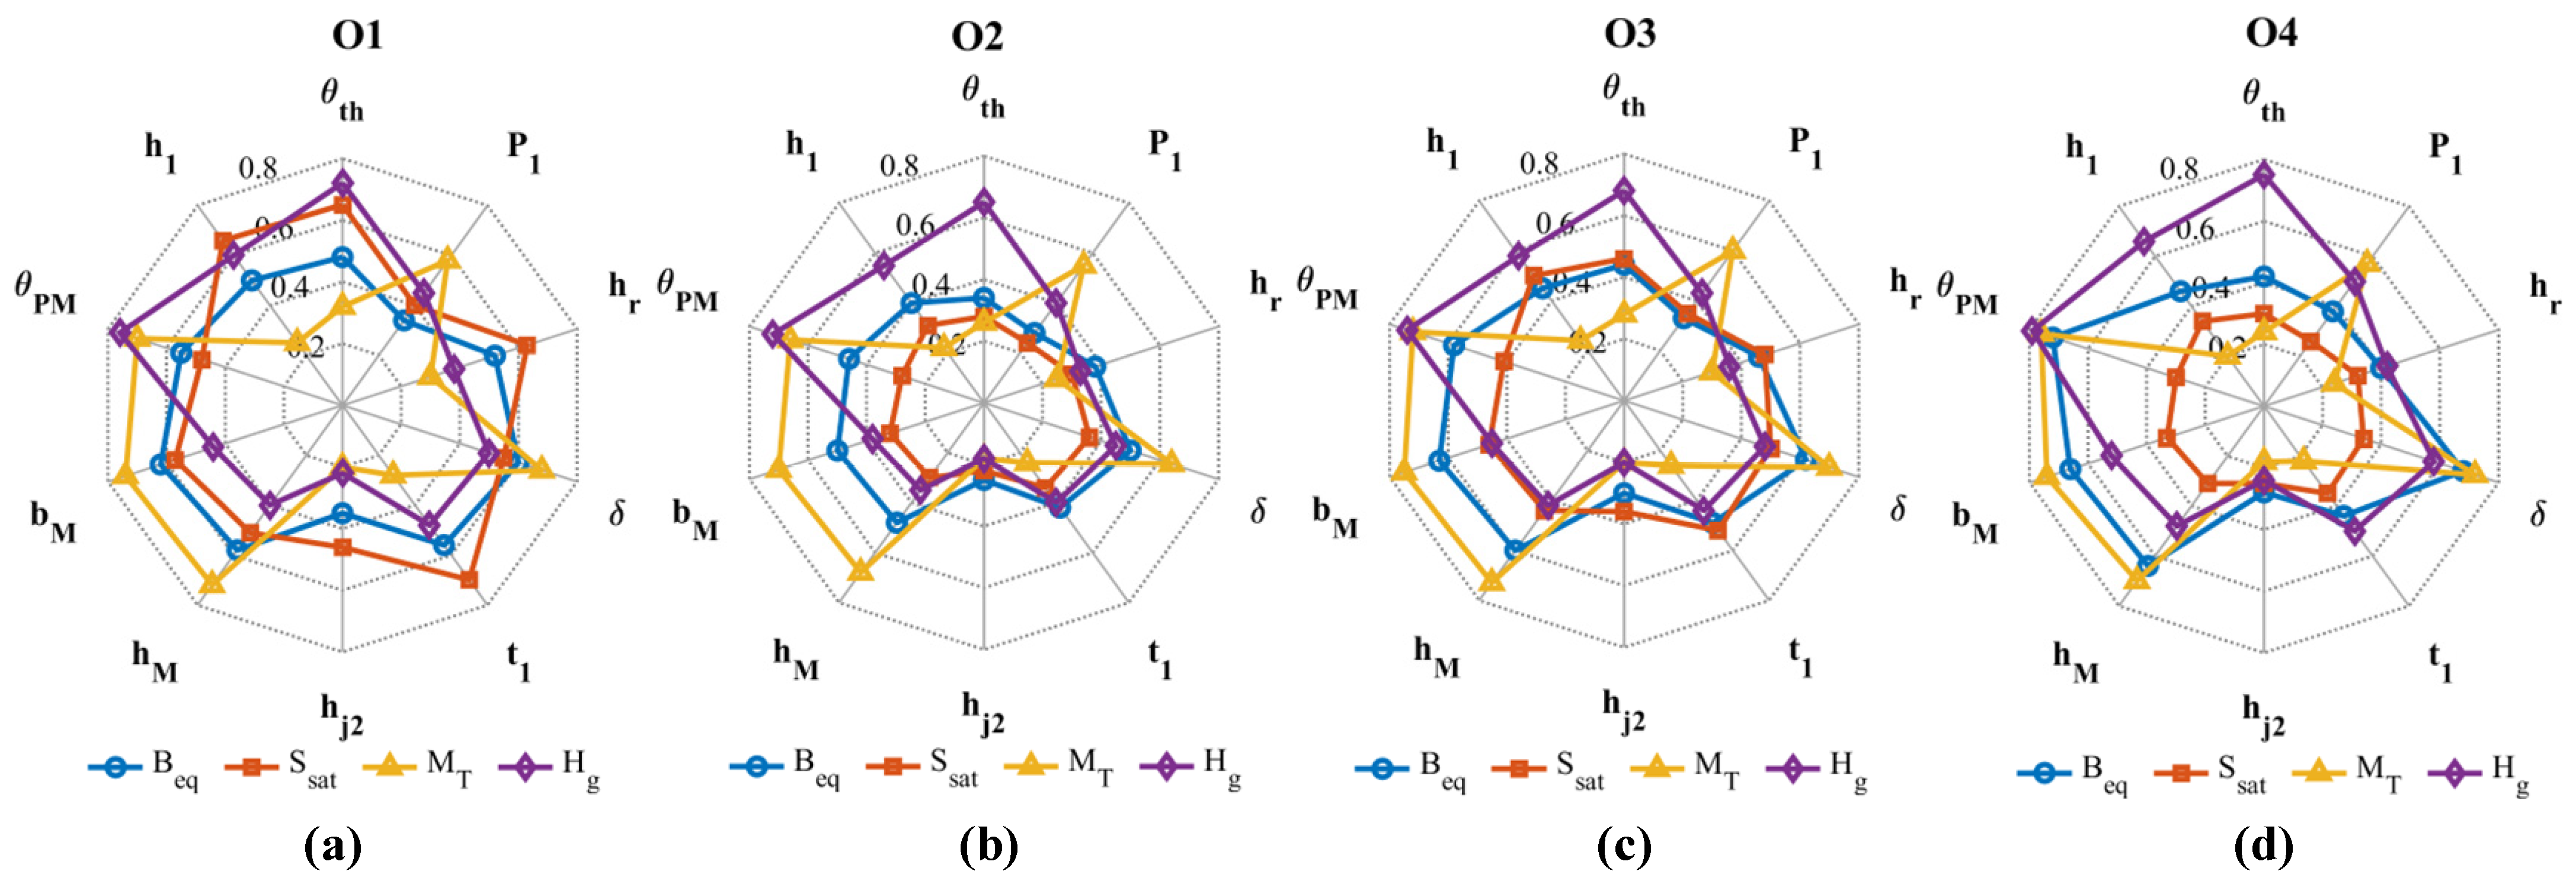
The resulting sensitivities of Beq, Ssat, MT, and Hg under O1–O4 are compared in Figure 15. As shown, different structural parameters act on different electromagnetic characteristics. For example, at O4, θth shows a stronger influence on Hg, whereas δ mainly affects Beq and MT. Meanwhile, the effect of the same parameter varies considerably with the operating condition. The sensitivity of θth to Ssat is relatively high at O1 but decreases markedly at O4, mainly due to the change from heavy magnetic loading to high-speed field-weakening operation. These results demonstrate that the influence of structural parameters is strongly operating-condition-dependent and is transmitted to the final performance objectives through different electromagnetic mechanisms.
Figure 15.
Operating-condition-dependent sensitivities of electromagnetic characteristic quantities to design parameters: (a) O1; (b) O2; (c) O3; (d) O4.
The sensitivity of structural parameter xj to objective yq is obtained through the chain rule:
where the summation includes Beq and Ssat for efficiency, MT for average torque, and Hg for torque ripple.
The objective sensitivity at the ith operating point is calculated as
Considering the energy contribution and objective importance of each representative operating point, the driving-cycle sensitivity is
where wi is the energy weight and αi,q is the objective weight at the corresponding operating point. The comprehensive sensitivity of the jth structural parameter is defined as
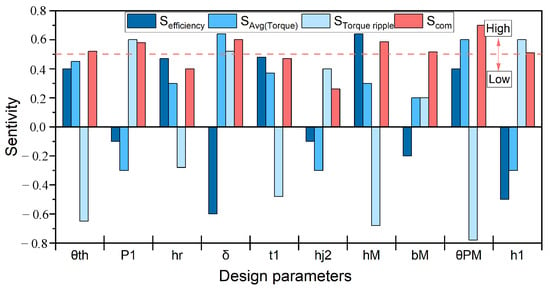
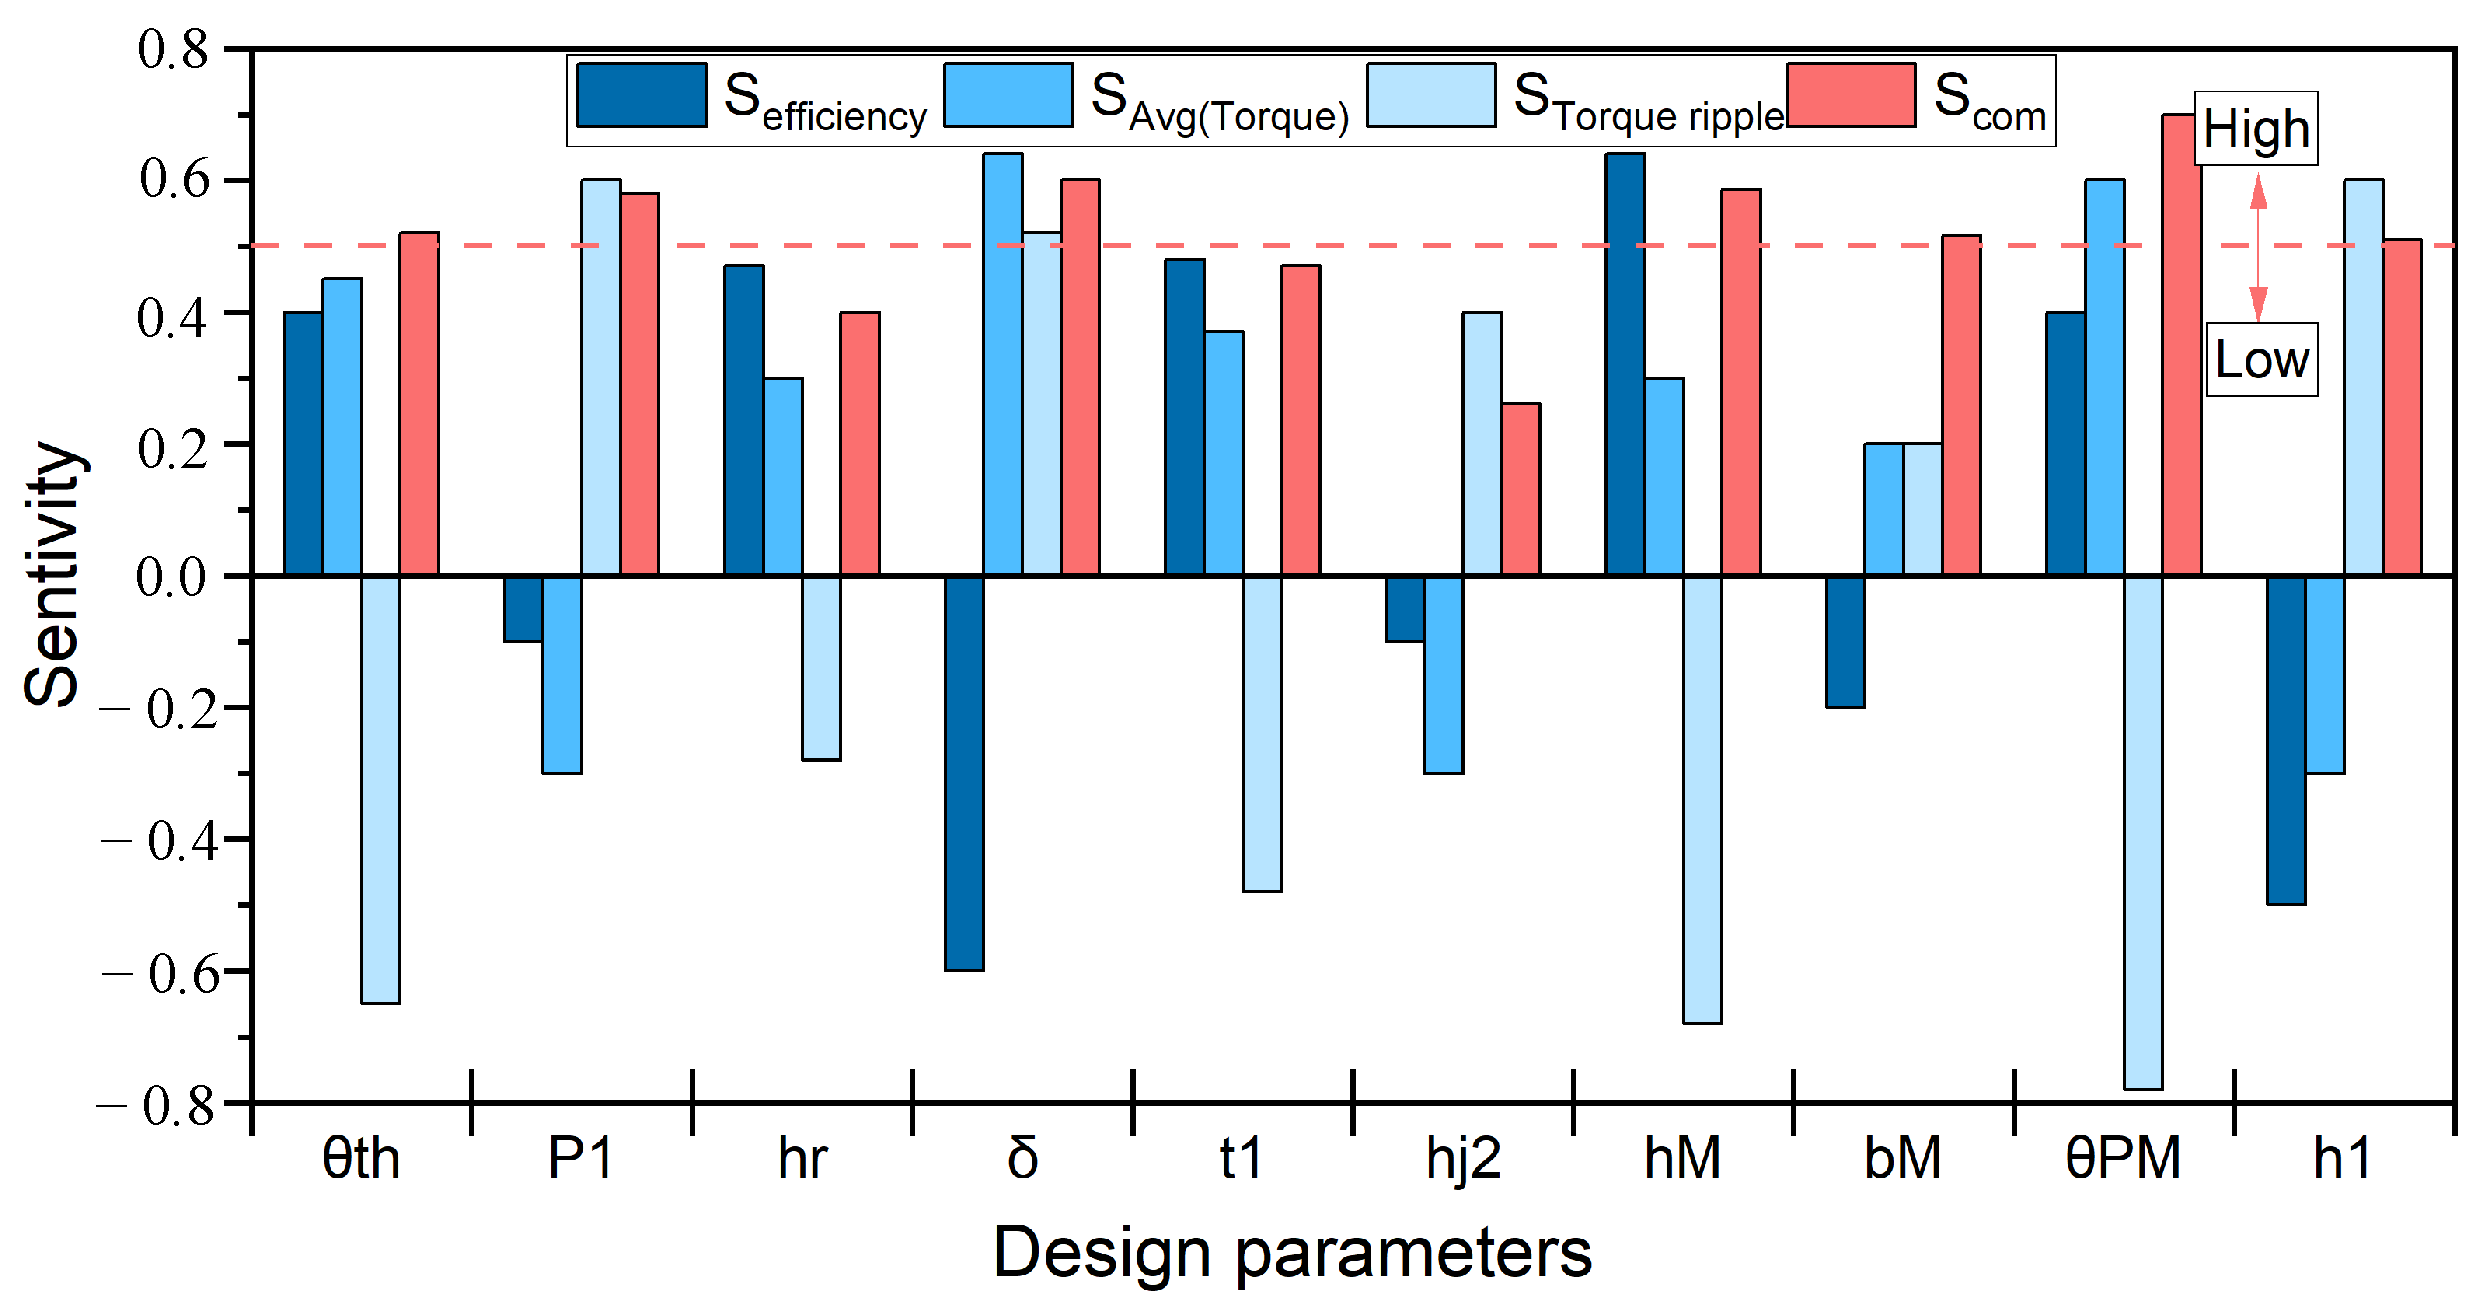
The objective-oriented and comprehensive sensitivities are shown in Figure 16. High-sensitivity parameters are retained for subsequent multi-objective optimization, while low-sensitivity parameters are fixed at their initial values.
Figure 16.
Sensitivity of design parameters. The red dashed line indicates the threshold for distinguishing high- and low-sensitivity parameters.
5.1.3. Multi-Objective Optimization
To reduce the computational cost of repeated FEM evaluations, the RS models are used to predict the objective responses of candidate designs during the optimization. NSGA-II is then applied to the constrained three-objective problems defined in Section 5.1.1. The three objective components are treated independently throughout the Pareto search and are not combined into a scalar fitness function.
For two feasible candidate designs xa and xb, xa is considered to dominate xb if
Based on this dominance relation, the population is divided successively into non-dominated fronts F1,F2,…, and each candidate is assigned a non-dominated rank. To maintain the diversity of solutions within the same front, the normalized crowding distance of the jth solution is calculated as
where the solutions are sorted according to the mth objective. Boundary solutions are assigned an infinite crowding distance. During binary-tournament selection, a solution with a lower non-dominated rank is preferred; for solutions with the same rank, the one with the larger crowding distance is retained.
The selected parent solutions generate offspring through simulated binary crossover (SBX) and polynomial mutation. In this study, the population size is N = 100, the maximum number of generations is Gmax = 150, the crossover probability is pc = 0.90, and the mutation probability is pm = 0.10. The distribution indices for crossover and mutation are both set to 20.
An elitist strategy is employed to preserve high-quality solutions between successive generations. At generation t, the parent population Pt and offspring population Qt are combined as
where the combined population is first sorted according to the non-dominated rank r. If the final accepted front cannot be retained completely, solutions with larger crowding distances D are selected preferentially until the population size reaches N. This procedure is repeated until G = Gmax, yielding the final Pareto solution set. The numerical parameters used in the NSGA-II implementation are summarized in Table 9.
Table 9.
NSGA-II parameter settings.
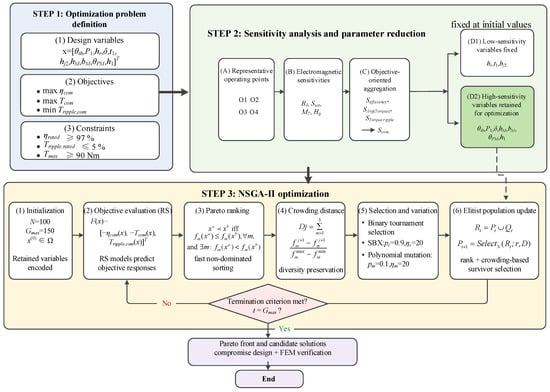
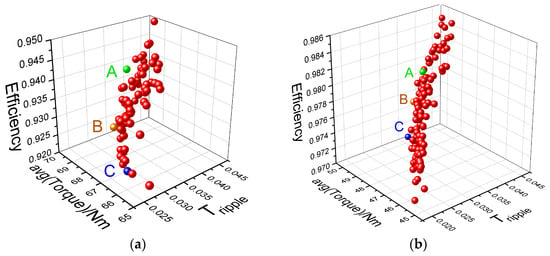
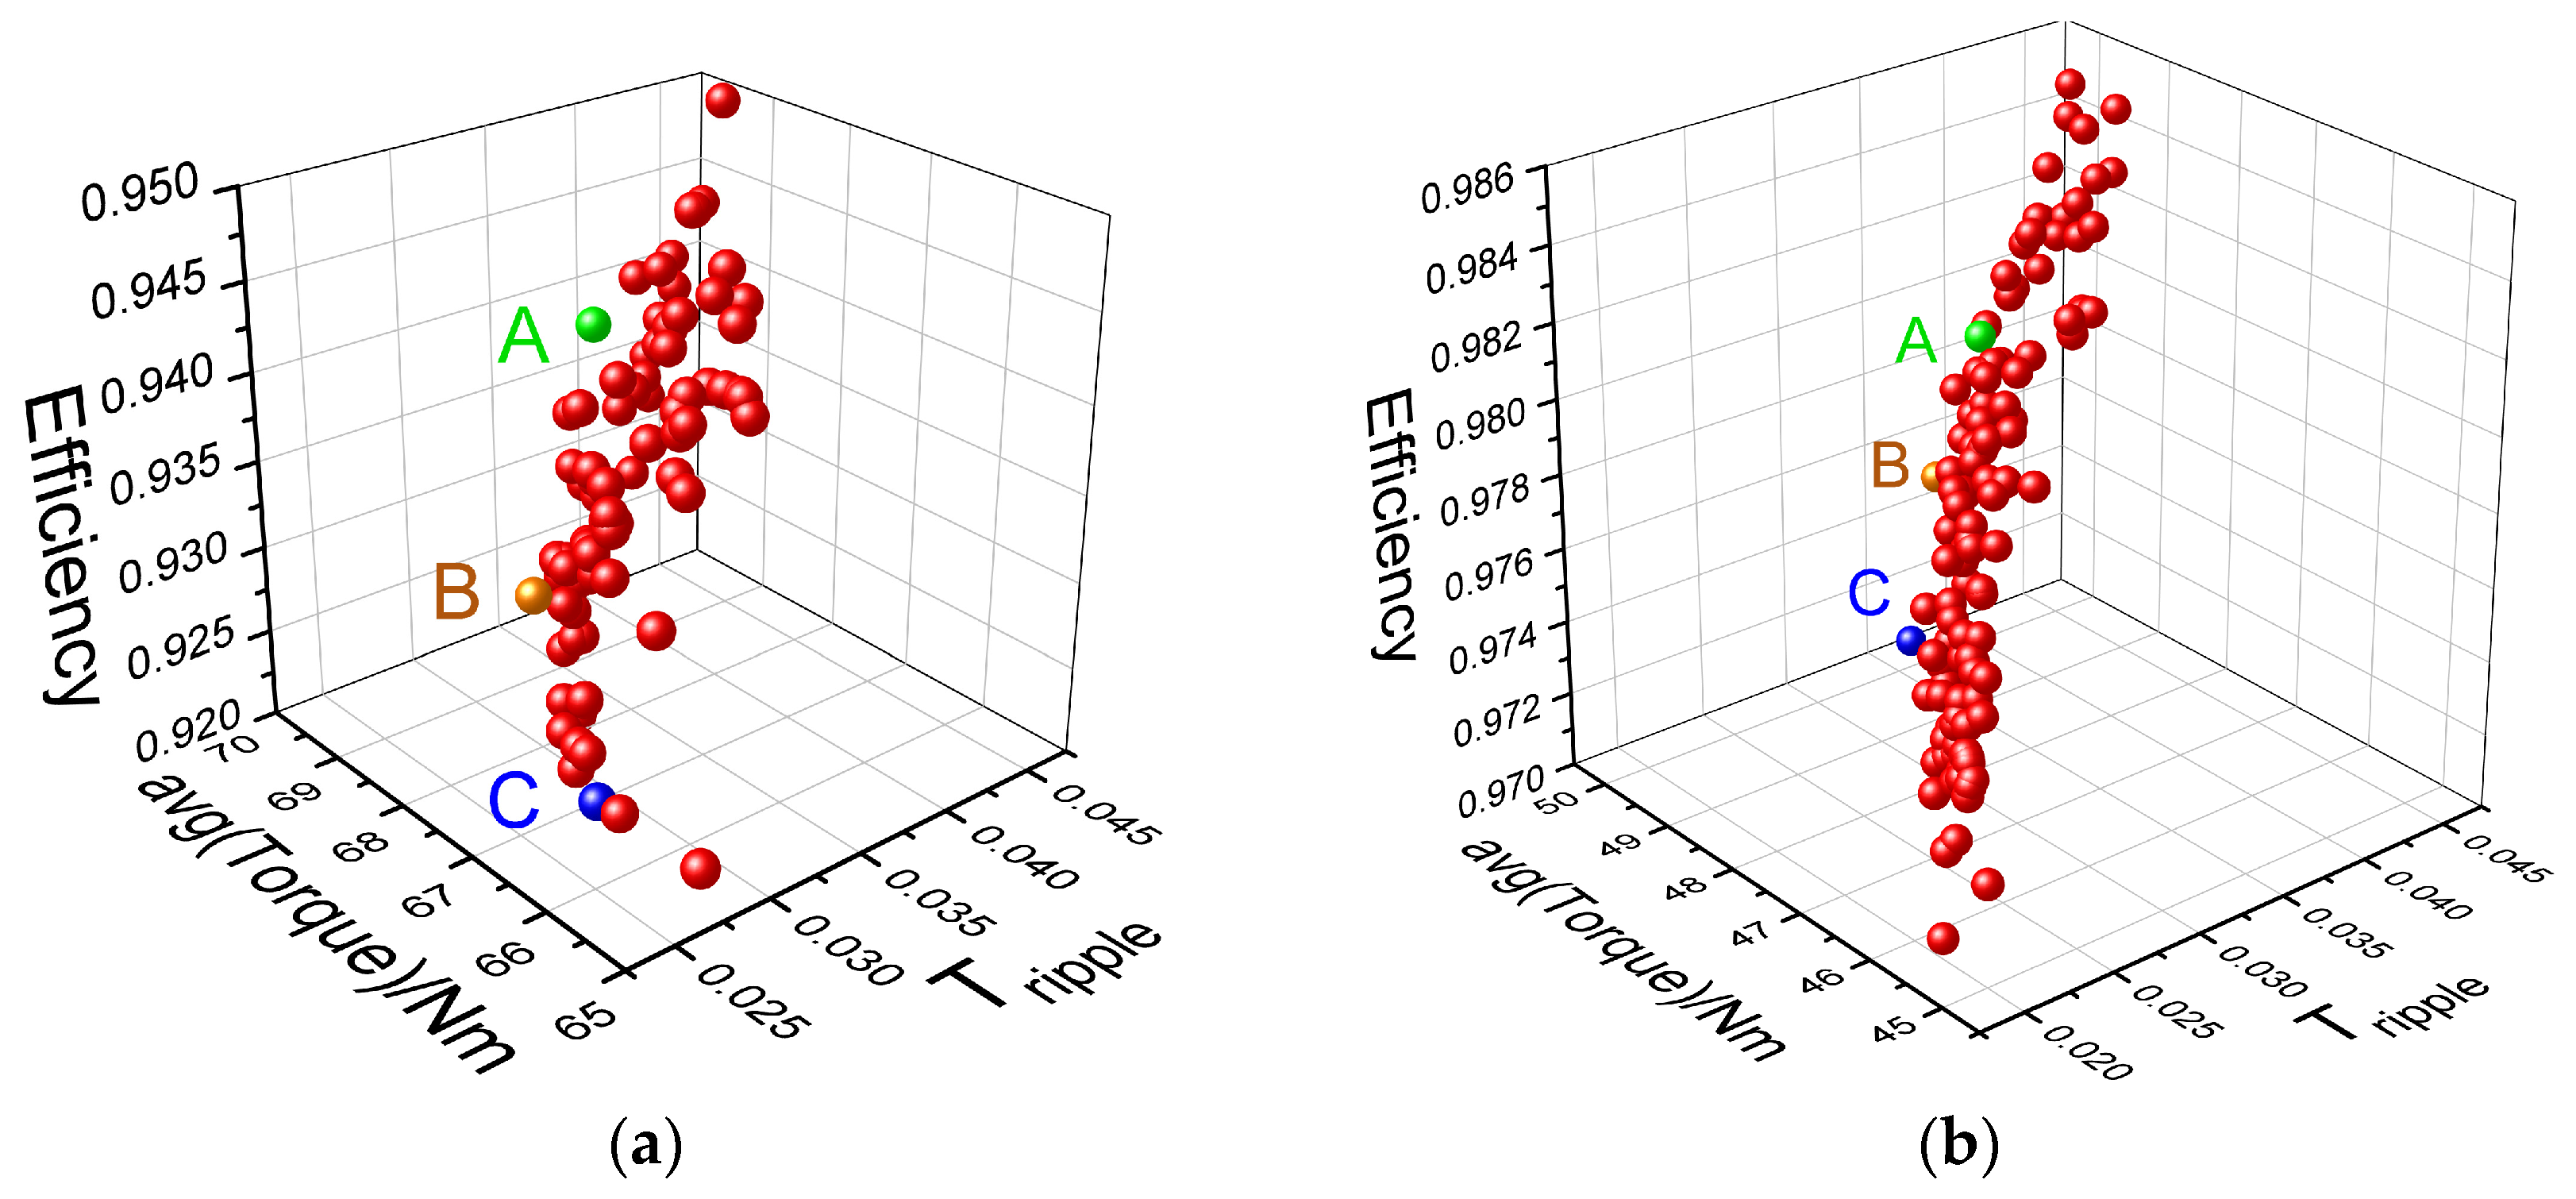
The overall optimization procedure is summarized in Figure 17. As the Pareto set comprises non-dominated solutions, three candidates are identified, namely A, B, and C. Candidate B is the solution obtained by assigning equal weights to efficiency, average torque, and torque ripple. Candidate B in Figure 18a corresponds to the multi-point optimized motor M2, while candidate B in Figure 18b corresponds to the rated-point optimized motor M1. Given the necessity for EVs to balance economic efficiency, driving comfort and high-power output, all objectives are deemed equally significant. Consequently, both methodologies select candidate B as the optimal solution.
Figure 17.
Overall workflow of the proposed optimization method.
Figure 18.
Pareto fronts: (a) multi-point optimization, (b) rated operating point optimization. (Red dots represent Pareto-optimal solutions; A, B, and C denote three representative candidate solutions, highlighted in green, orange, and blue, respectively).
5.2. Optimization Result
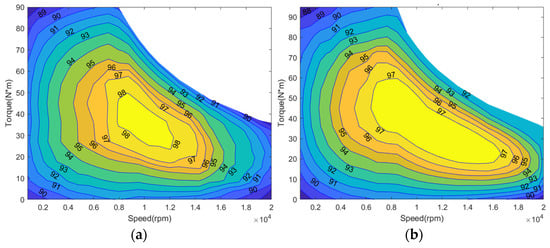
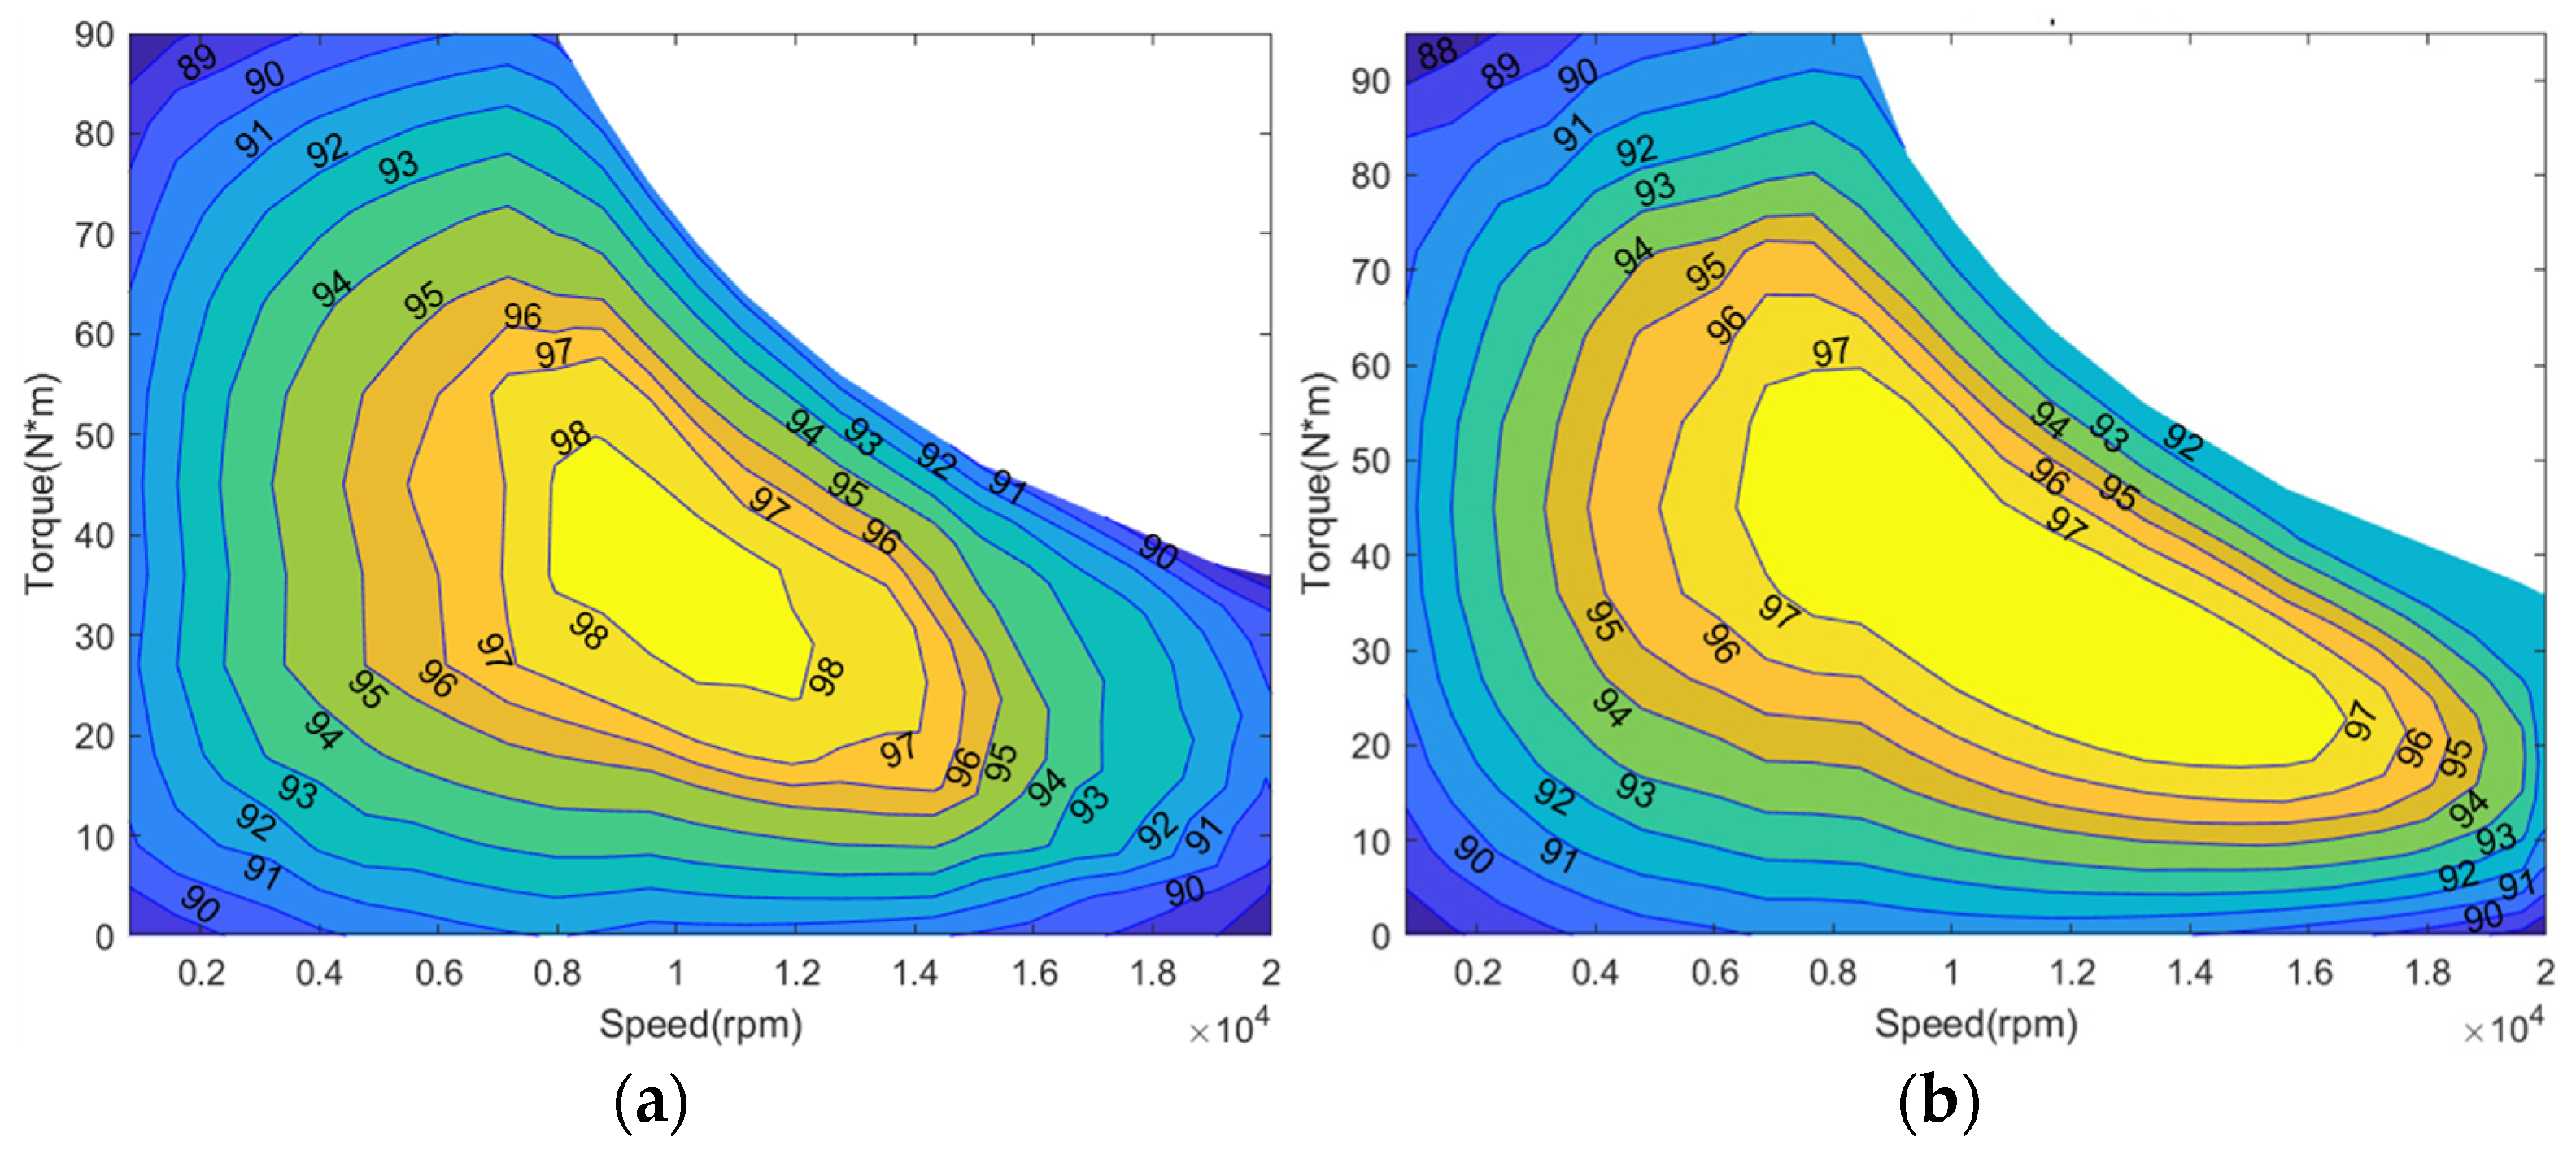
The motor optimized based on a single rated point is M1 and the motor optimized by multi-point optimization is M2. Following optimization, the final M1 and M2 designs are reconstructed and re-evaluated using FEM to obtain their final performance results. Table 10 displays the parameters of the best candidate solutions for the two motors. The efficiency maps of M1 and M2 are analyzed and compared, as shown in Figure 19. The distribution of efficiency maps for the initial motor (M0), M1, and M2 can be seen in Table 11.
Table 10.
Optimized design parameters of M1 and M2.
Figure 19.
Efficiency maps: (a) M1, (b) M2.
Table 11.
Efficiency comparison of M0, M1, and M2.
It can be observed that the rated-point optimization (M1) slightly increases the efficiency at the rated operating point by 0.33% compared with the initial motor. However, this localized improvement is accompanied by a reduction in the high-efficiency operating region. In contrast, the motor optimized using the proposed multi-point method (M2) achieves a significantly broader high-efficiency distribution across the speed–torque plane. Specifically, the area with efficiency above 96% increases from 19.74% in M1 to 24.6% in M2, corresponding to an improvement of approximately 4.86 percentage points. Similarly, the area with efficiency above 92% increases from 64.5% to 69.2%, indicating a noticeable enhancement of global efficiency performance. These results demonstrate that multi-point optimization improves the overall efficiency distribution rather than only maximizing efficiency at a single operating point.
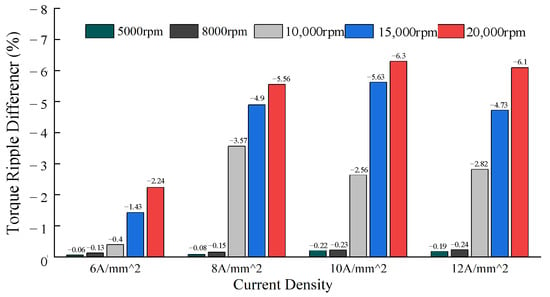
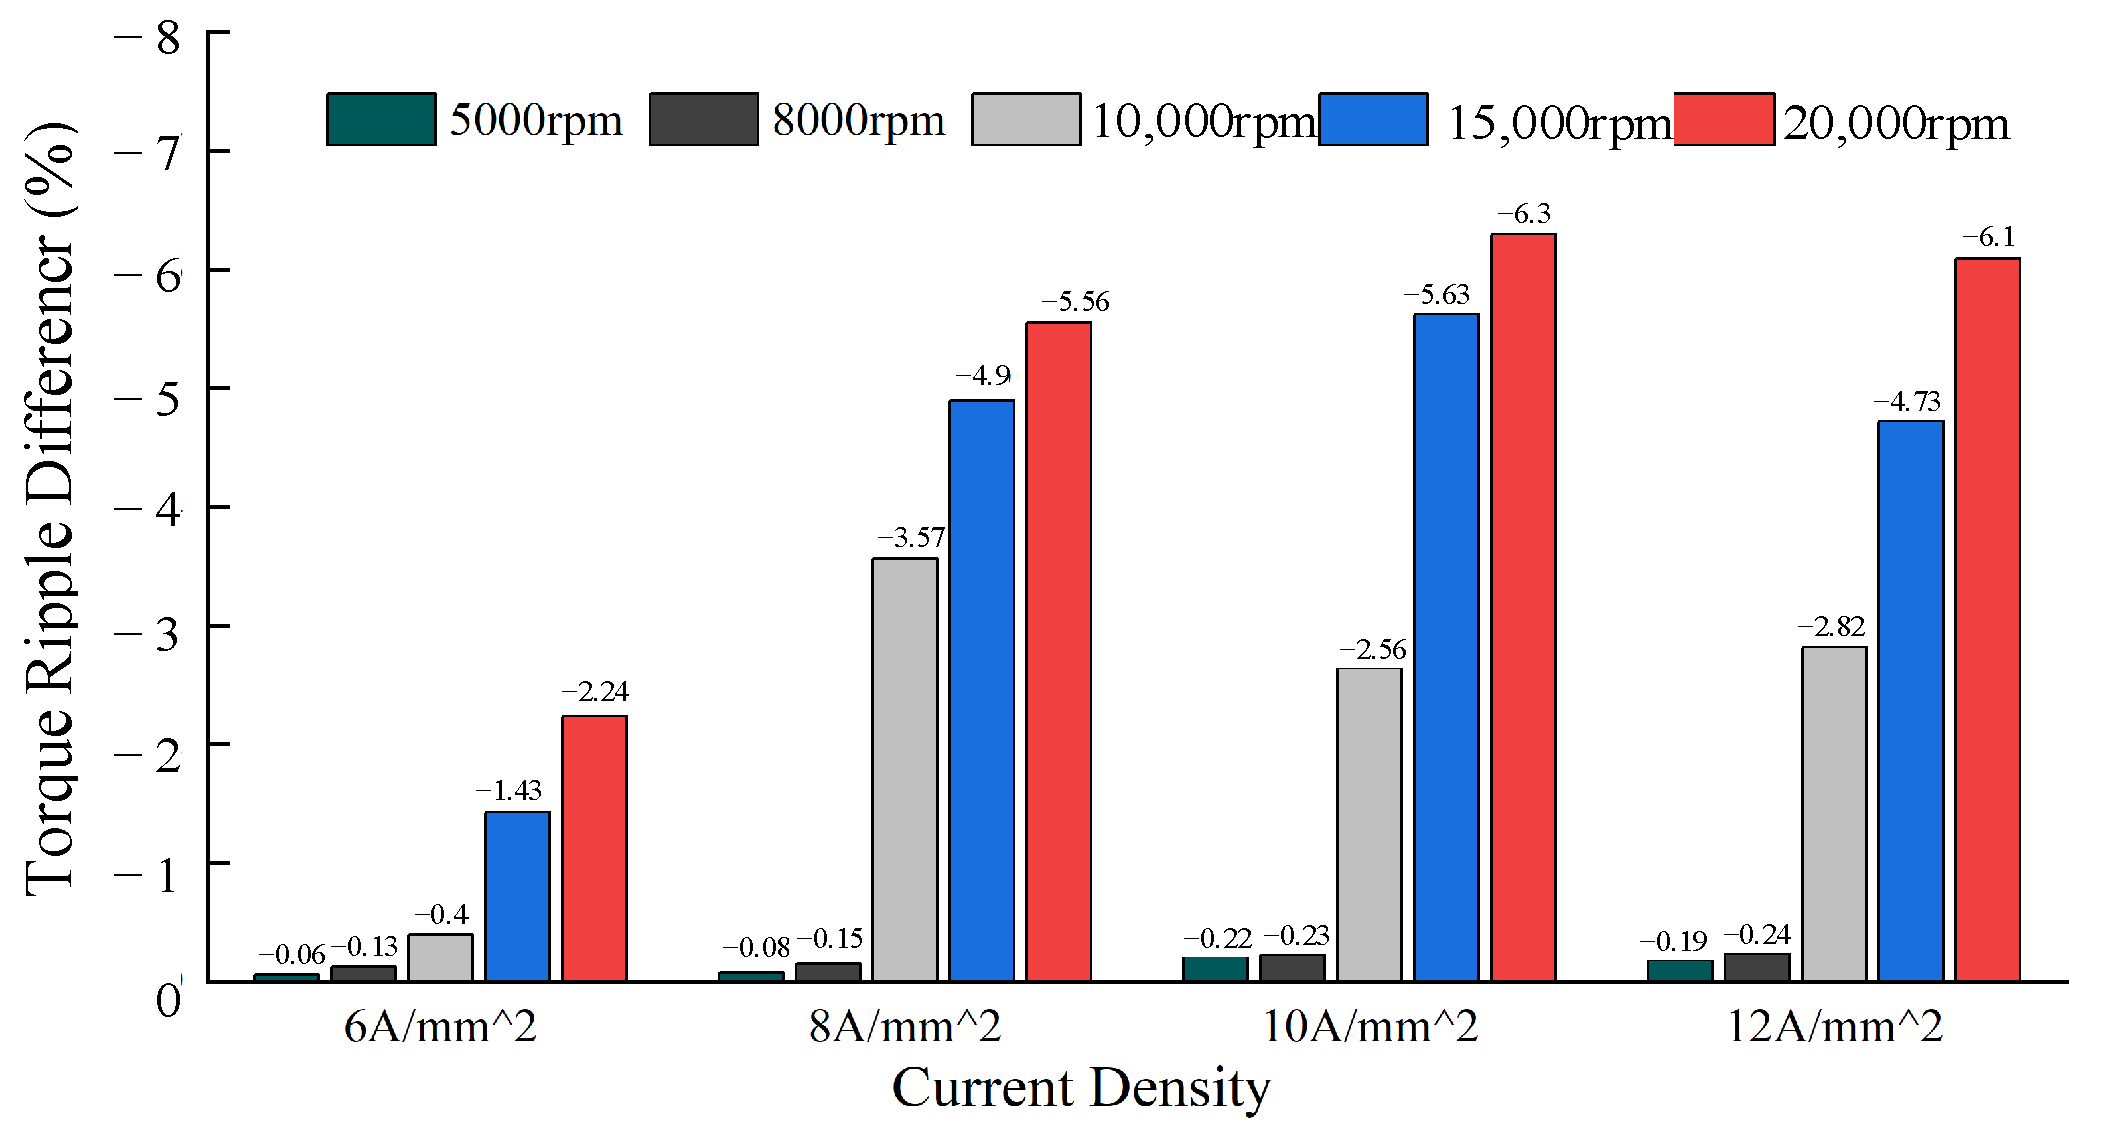
The torque performance after optimization is presented in Table 12. Compared with M1, the multi-point optimized motor (M2) exhibits improved torque characteristics at several representative operating points. For example, at O1, the average torque increases from 87.4 Nm to 93.1 Nm, representing an improvement of approximately 6.5%. In addition, Figure 20 presents the torque-ripple difference between M2 and M0 under different speeds and current densities. A negative value indicates that the torque ripple is reduced after multi-point optimization, and a more negative value represents a greater reduction. The results show that the reduction becomes more pronounced as the speed increases, particularly in the high-speed region, demonstrating the effectiveness of the proposed multi-point optimization in suppressing high-speed torque ripple.
Table 12.
Torque performance of M1 and M2 at the four RPs.
Figure 20.
The difference in torque ripple before and after optimization.
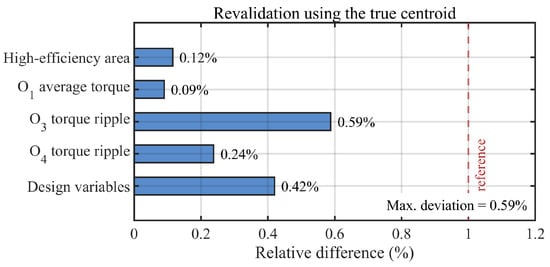
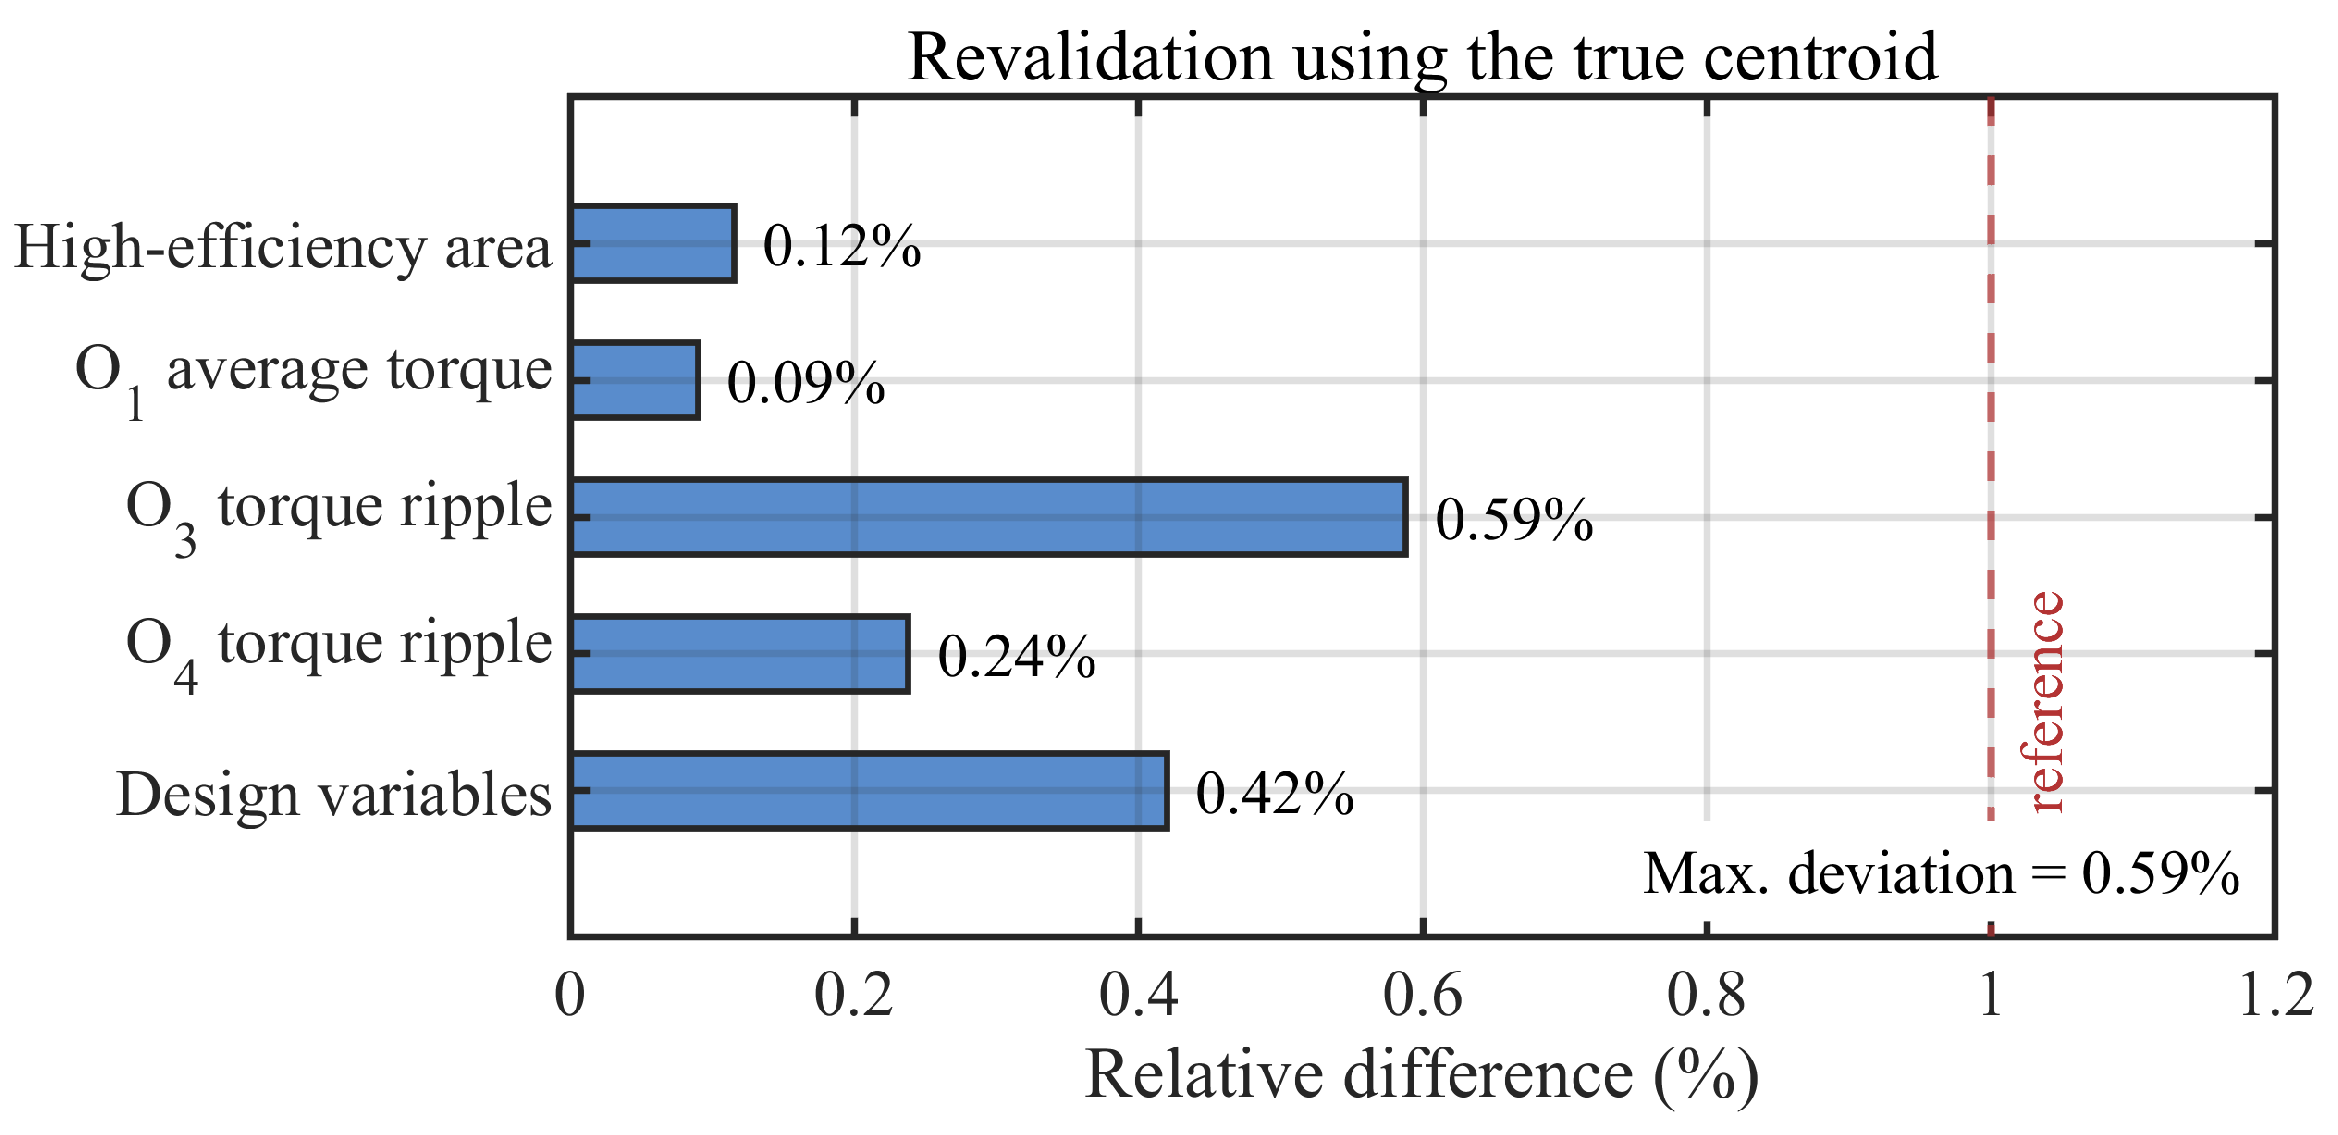
In addition, to further evaluate the influence of replacing the true O3 centroid with the rated operating point, the multi-point optimization is repeated using the true centroid (8241 rpm, 41.36 Nm), as shown in Figure 21. Compared with the optimization using the rated point, the relative differences in the high-efficiency area, O1 average torque, O3 torque ripple, O4 torque ripple, and optimized design variables are 0.12%, 0.09%, 0.59%, 0.24%, and 0.42%, respectively. The maximum deviation is 0.59%, demonstrating that the replacement has negligible influence on the optimization results.
Figure 21.
Revalidation results using the true O3 centroid.
To evaluate the prediction accuracy of the RS models in the optimized design region, the RS predictions are directly compared with the corresponding FEM results. The WLTP-weighted efficiency, comprehensive average torque, and comprehensive torque ripple correspond to the three performance quantities used in the multi-point optimization, while the maximum efficiency and the area with efficiency above 92% are additionally included to assess the consistency of the predicted efficiency-map characteristics. The absolute deviations and relative errors between the RS and FEM results are summarized in Table 13. As shown in Table 13, the relative errors of the WLTP-weighted efficiency, maximum efficiency, high-efficiency-area ratio, comprehensive average torque, and comprehensive torque ripple are 1.16%, 0.07%, 1.73%, 0.53%, and 2.85%, respectively. All deviations remain below 3%, which demonstrates that the RS models maintain sufficient prediction accuracy around the selected optimized design.
Table 13.
RS–FEM validation results.
Furthermore, following the RS–FEM accuracy validation, the optimized motor is benchmarked against representative EV traction motor designs reported in the literature, as summarized in Table 14. As shown in Table 14, the proposed motor exhibits distinct advantages when compared individually with the reported designs. Relative to the driving-cycle multi-point designs in [27,28], the maximum operating speed is extended from 5000–6000 rpm to 20,000 rpm, while the maximum efficiency increases to 97.98%. At the reported 20 Nm condition, the torque ripple is reduced from approximately 20% at 5500 rpm in [27] to 12.6% at 17,000 rpm in the proposed motor. Compared with the low-speed single-point optimized motor in [29], the proposed design maintains similarly low torque ripple at O1–O3 while extending the operating speed range substantially. Compared with the 4.5 kW AMA-core motor in [30], the proposed motor retains a comparable maximum efficiency while increasing the power and torque capability to 75 kW and 90 Nm. Overall, the proposed design combines a substantially wider operating range with a broad high-efficiency region and favorable torque-ripple performance over the representative operating points, demonstrating its suitability for high-speed EV traction operation.
Table 14.
Performance comparison with representative EV traction motor designs.
For multi-operating-point optimization, K-means clustering first reduces the WLTP operating space to four representative points, sensitivity analysis reduces the number of active design variables from 10 to 5, and the subsequent sensitivity evaluation and NSGA-II search are performed using the RS models rather than repeated FEM calculations. The computational cost of each stage is summarized in Table 15. As shown in Table 15, the DOE stage requires 120 designs evaluated at four RPs, corresponding to 480 FEM evaluations, while 10 additional validation designs require 40 FEM evaluations. The subsequent sensitivity analysis and NSGA-II optimization are conducted using the surrogate models and therefore introduce only a small additional computational cost. The total computational time of the proposed method is approximately 1.7 h. By comparison, direct FEM-based NSGA-II optimization would require approximately 15,000 FEM evaluations for a single operating point and 60,000 FEM evaluations for four operating points, corresponding to approximately 46.9 h and 187.5 h, respectively. Therefore, although the proposed framework contains several processing stages, it substantially reduces the overall FEM burden and makes driving-cycle-oriented multi-point optimization computationally feasible.
Table 15.
Computational cost comparison of different optimization methods.
6. Thermal Constraint Verification
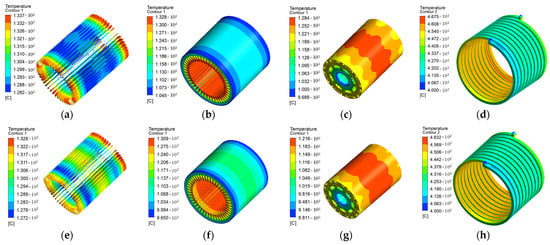
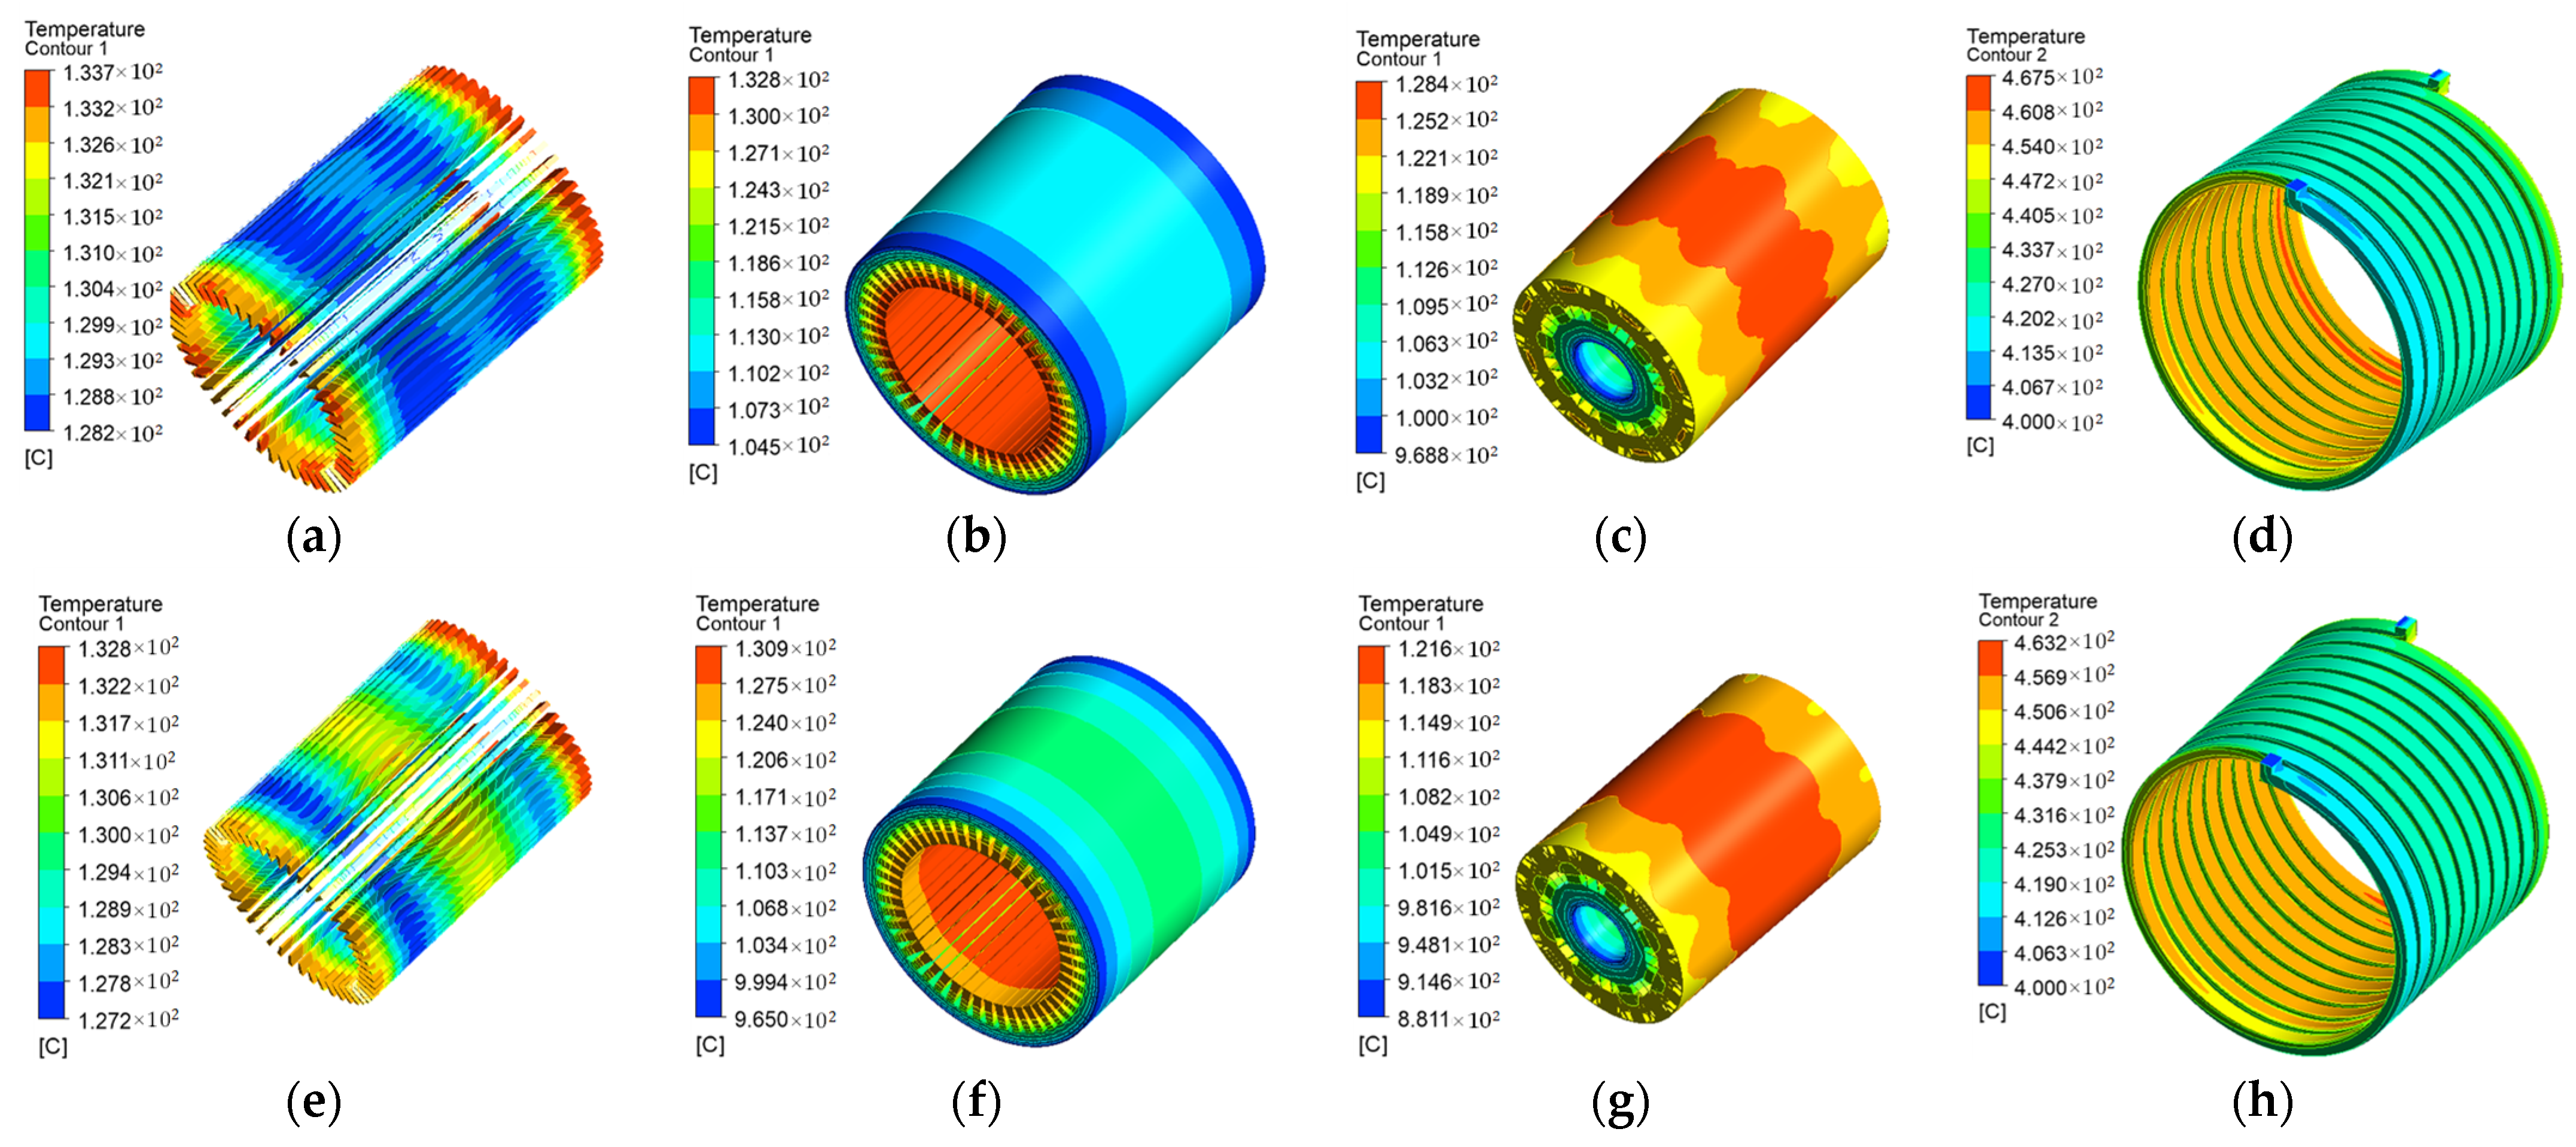
To verify the thermal feasibility of the optimized motor, thermal analysis is performed under a high-speed limiting operating condition. The coolant inlet temperature is set to 40 C, with an inlet velocity of 1.43 m/s, corresponding to a volumetric flow rate of 12 L/min through a 10 × 14 mm inlet. The ambient-air temperature is also set to 40 C, and an external airflow velocity of 0.5 m/s is applied to account for external convective cooling. The computational domain is discretized into approximately 15.8 million cells, with a minimum orthogonal quality of 0.154, exceeding the minimum requirement of 0.1 and indicating acceptable mesh quality. Anisotropic thermal conductivity is assigned to the laminated stator core to account for the directional heat-transfer characteristics of the stacked laminations. The allowable temperatures used to assess thermal feasibility are set to 155 C for the winding insulation and 150 C for the permanent magnets, according to the adopted Class-F insulation system and SH-grade NdFeB permanent magnets. The permanent magnets are modeled as separate solid regions (ρ = 7872 kg/m3, cp = 420 J/(kg * K), k = 8.9 W/(m * K)); thus, the rotor-temperature contour reflects the thermal state of the entire rotating assembly, including the magnets. The temperature distributions before and after multi-point optimization are shown in Figure 22, and the corresponding temperature ranges of the winding, stator core, and rotor are summarized in Table 16.
Figure 22.
Temperature distributions before and after multi-point optimization at O4 (17,000 rpm, 20 Nm): (a) winding of M0; (b) stator core of M0; (c) rotor of M0; (d) cooling-water channel of M0; (e) winding of M2; (f) stator core of M2; (g) rotor of M2; (h) cooling-water channel of M2.
Table 16.
Temperature ranges of key components before and after multi-point optimization.
As shown in Figure 22 and Table 16, the maximum winding temperature decreases slightly from 133.7 °C to 132.8 °C after optimization, while the maximum stator-core temperature decreases from 132.8 °C to 130.9 °C. A more pronounced reduction is observed in the rotor, where the maximum temperature decreases from 128.4 °C to 121.6 °C. The maximum cooling-water temperature decreases slightly from 45.75 °C to 45.32 °C. The temperature levels of all key components remain within the prescribed thermal limits, indicating that the optimized design satisfies the thermal constraints under severe high-speed operation. The thermal improvement is mainly attributed to the reduction in electromagnetic losses after optimization. In particular, under high-frequency operation, the reduced core loss lowers the heat generation in the stator and consequently alleviates the overall thermal load of the motor. Meanwhile, the redistribution and reduction in high-frequency electromagnetic losses also contribute to the lower rotor temperature. Therefore, the proposed multi-point optimization improves the electromagnetic performance without introducing additional thermal risk and maintains sufficient thermal margin under high-speed operation.
7. Conclusions
This study proposes a WLTP-oriented multi-point optimization framework for high-speed IPMSMs by integrating advanced core materials, driving-cycle-based representative operating points, and NSGA-II multi-objective optimization. A coupled material–operation–optimization design paradigm is established to evaluate machine performance from a global driving-cycle perspective rather than conventional rated-point conditions. The main conclusions are summarized as follows:
- The performance advantages of advanced core materials are operating-condition dependent. Their effectiveness is jointly determined by the material magnetic characteristics, magnetic loading, and electrical frequency, rather than by the core-loss property alone.
- Rated-point efficiency is not representative of driving-cycle efficiency, and optimization based solely on rated conditions may lead to misleading performance evaluation for EV traction applications.
- Torque ripple behavior is strongly dependent on magnetic saturation state, which varies with operating conditions, leading to different performance characteristics across the driving cycle.
- The influence of structural parameters is strongly dependent on the operating condition and is transferred to the final performance objectives through different electromagnetic mechanisms. Therefore, parameter importance cannot be regarded as invariant over the entire operating range.
- Rated-point optimization leads to localized performance improvement but sacrifices global performance distribution, whereas multi-point optimization achieves a more balanced efficiency map and improved torque characteristics across the operating range.
Overall, the results reveal that the performance of high-speed EV traction motors is governed by the coupling between material properties, operating-condition distribution, and optimization strategy. Achieving globally optimal performance requires coordinated design across these dimensions, rather than isolated enhancement of a single objective.
Although the present study focuses primarily on electromagnetic performance and multi-operating-point optimization, the practical manufacturability of AMA stator cores remains an important engineering issue. Future work will investigate AMA core fabrication in cooperation with motor manufacturers, with particular attention to cutting, stacking/bonding, segmentation, and manufacturing-induced stress, as well as their influence on the magnetic properties and final motor performance.
Author Contributions
Conceptualization, J.Z.; methodology, J.Z. and S.X.; validation, J.Z., S.Z. and J.W.; investigation, J.W.; writing—original draft preparation, J.Z.; visualization, J.Z., S.X. and S.Z.; supervision, J.D.; project administration, J.D.; funding acquisition, J.D. All authors have read and agreed to the published version of the manuscript.
Funding
This work was supported by the National Major Science and Technology Projects of China under Grant 2026ZD0810504, the National Natural Science Foundation of China under Grant 52277065, the State Key Laboratory of Electrical Insulation and Power Equipment under Grant EIPE26112, and the Shaanxi Provincial Natural Science Basic Research Program under Grant 2026SYS-SYSZD-71.
Institutional Review Board Statement
Not applicable.
Informed Consent Statement
Not applicable.
Data Availability Statement
The data presented in this study are available on request from the corresponding author.
Conflicts of Interest
The authors declare no conflicts of interest.
References
- Smokers, R.T.M.; Verbeek, M.; Van Zyl, S. EVs and post 2020 CO2 targets for passenger cars. In Proceedings of the 2013 World Electric Vehicle Symposium and Exhibition (EVS27), Barcelona, Spain, 17–20 November 2013; pp. 1–11. [Google Scholar] [CrossRef] [Scilit]
- Sardar, M.U.; Manfeng, D.; Saleem, U.; Hassan, M.; Nawaz, M.K. State-of-the-art design optimization of an IPM synchronous motor for electric vehicle applications. In Proceedings of the 2022 International Conference on Emerging Trends in Electrical, Control, and Telecommunication Engineering (ETECTE), Lahore, Pakistan, 2–4 December 2022; pp. 1–6. [Google Scholar] [CrossRef] [Scilit]
- Mohana Devi, S.; Bagyaveereswaran, V. Electric motor systems: Relative study on diverse motors in the electric vehicles. In Proceedings of the 2023 Innovations in Power and Advanced Computing Technologies (i-PACT), Kuala Lumpur, Malaysia, 8–10 December 2023; pp. 1–6. [Google Scholar] [CrossRef] [Scilit]
- Guiyong, W. The development status and trend of permanent magnet synchronous motor in the electric vehicle industry. In Proceedings of the 2022 IEEE 6th Conference on Energy Internet and Energy System Integration (EI2), Chengdu, China, 11–13 November 2022; pp. 2397–2401. [Google Scholar] [CrossRef] [Scilit]
- Goss, J.; Popescu, M.; Staton, D. A comparison of an interior permanent magnet and copper rotor induction motor in a hybrid electric vehicle application. In Proceedings of the 2013 International Electric Machines & Drives Conference (IEMDC), Chicago, IL, USA, 12–15 May 2013; pp. 220–225. [Google Scholar] [CrossRef] [Scilit]
- Zhou, C.; Huang, X.; Fang, Y.; Wu, L. Comparison of PMSMs with different rotor structures for EV application. In Proceedings of the 2018 XIII International Conference on Electrical Machines (ICEM), Alexandroupoli, Greece, 3–6 September 2018; pp. 609–614. [Google Scholar] [CrossRef] [Scilit]
- Ishizuka, M.; Higure, H.; Kato, D.; Hoshi, N.; Haruna, J.; Matsuoka, H.; Suemasu, H.; Uchiyama, Y. Driving characteristics consideration of interior permanent magnet synchronous motor in high speed range. In Proceedings of the 7th International Power Electronics and Motion Control Conference, Harbin, China, 2–5 June 2012; pp. 2593–2598. [Google Scholar] [CrossRef] [Scilit]
- Romero, M.E. Analysis and comparison of the interior permanent magnet motor design with different magnetic materials. In Proceedings of the 2020 IEEE International Conference on Electro Information Technology (EIT), Chicago, IL, USA, 31 July–1 August 2020; pp. 249–254. [Google Scholar] [CrossRef] [Scilit]
- Liu, C.; Chao, Z.; Wang, S.; Wang, Y. Design and performance analysis of permanent magnet claw pole machine with hybrid cores. CES Trans. Electr. Mach. Syst. 2023, 7, 275–283. [Google Scholar] [CrossRef] [Scilit]
- Zhang, C.; Tong, W.; Ma, X.; Tang, R.; Zhu, J. Development of a high-speed permanent magnet machine using amorphous alloy cores. In Proceedings of the 2016 IEEE Vehicle Power and Propulsion Conference (VPPC), Hangzhou, China, 17–20 October 2016; pp. 1–5. [Google Scholar] [CrossRef] [Scilit]
- Song, S.; Hu, M.; Du, Y.; Li, N. Effects of amorphous alloy rotor core on performance of remanufacturing motor. Electr. Mach. Control Appl. 2018, 41, 66–71. [Google Scholar] [CrossRef]
- Zhang, B.; Cheng, M.; Wang, S.; Wang, W. Optimal design of flux-switching permanent magnet linear machine based on improved surrogate-based optimization algorithm. Trans. China Electrotech. Soc. 2020, 35, 1013–1021. [Google Scholar] [CrossRef]
- Xiang, Z.; Zhu, X.; Quan, L.; Du, Y.; Zhang, C.; Fan, D. Multilevel design optimization and operation of a brushless double mechanical port flux-switching permanent-magnet motor. IEEE Trans. Ind. Electron. 2016, 63, 6042–6054. [Google Scholar] [CrossRef] [Scilit]
- Zhang, J.; Wang, H.; Chen, L.; Tan, C.; Wang, Y. Multi-objective optimal design of bearingless switched reluctance motor based on multi-objective genetic particle swarm optimizer. IEEE Trans. Magn. 2018, 54, 8100113. [Google Scholar] [CrossRef] [Scilit]
- Simpson, T.W.; Peplinski, J.D.; Koch, P.N.; Allen, J.K. Metamodels for computer-based engineering design: Survey and recommendations. Eng. Comput. 2001, 17, 129–150. [Google Scholar] [CrossRef] [Scilit]
- Simpson, T.W.; Mauery, T.M.; Korte, J.J.; Mistree, F. Comparison of response surface and Kriging models for multidisciplinary design optimization. In Proceedings of the 7th AIAA/USAF/NASA/ISSMO Symposium on Multidisciplinary Analysis and Optimization, St. Louis, MO, USA, 2–4 September 1998; American Institute of Aeronautics and Astronautics (AIAA): Reston, VA, USA, 1998; pp. 381–391. [Google Scholar] [CrossRef] [Scilit]
- Forrester, A.I.J.; Keane, A.J. Recent advances in surrogate-based optimization. Prog. Aerosp. Sci. 2009, 45, 50–79. [Google Scholar] [CrossRef] [Scilit]
- Wu, Z.; Li, W.; Liu, X. Optimal design of the drive motor based on the road condition of the electric vehicle. IET Electr. Power Appl. 2021, 15, 379–389. [Google Scholar] [CrossRef] [Scilit]
- Yuan, S.; Du, J.; Wei, Y. Optimization of permanent magnet machine for electric vehicles considering the control strategy and inverter. In Proceedings of the 2020 23rd International Conference on Electrical Machines and Systems (ICEMS), Virtual, 24–27 November 2020; pp. 195–200. [Google Scholar] [CrossRef] [Scilit]
- Fan, D.; Zhu, X.; Quan, L.; Han, P.; Xiang, Z.; Wu, J. Driving cycle design optimization of less-rare-earth PM motor using dimension reduction method. IEEE Trans. Energy Convers. 2023, 38, 1614–1625. [Google Scholar] [CrossRef] [Scilit]
- Wang, M.; Chen, Z. Research on permanent magnet structure of permanent magnet synchronous motor for electric vehicle. In Proceedings of the IC2ECS 2022, Nanjing, China, 16–18 December 2022; pp. 990–993. [Google Scholar] [CrossRef] [Scilit]
- Abdelrahman, A.; Wang, Y.; Al-Ani, D.; Bilgin, B. Comparative analysis of two rotor topologies for a high-power density dual three-phase IPM propulsion motor. In Proceedings of the ITEC 2021, Virtual, 21–25 June 2021; pp. 1–5. [Google Scholar] [CrossRef] [Scilit]
- Salameh, M.; Brown, I.P.; Krishnamurthy, M. Fundamental evaluation of data clustering approaches for driving cycle-based machine design optimization. IEEE Trans. Transp. Electrif. 2019, 5, 1395–1405. [Google Scholar] [CrossRef] [Scilit]
- Ishida, M.; Shiga, N.; Sadahiro, K. Improvement of motor performance by use of high-efficiency electrical steels. Kawasaki Steel Tech. Rep. 2003, 48, 39–46. [Google Scholar]
- Çirozlar, İ.; Nakamura, K. Performance comparison of interior permanent magnet synchronous motors with amorphous alloy and silicon steel stator core. J. Magn. Soc. Jpn. 2026, 50, 47–51. [Google Scholar] [CrossRef] [Scilit]
- Ou, J. Improving High-Speed Electrical Machines by Amorphous Metals. Ph.D. Thesis, Karlsruhe Institute of Technology (KIT), Karlsruhe, Germany, 2019. [Google Scholar] [CrossRef]
- Bu, J.; Yuan, S.; Du, J. Clustering optimization of IPMSM for electric vehicles: Considering inverter control strategy. Appl. Sci. 2023, 13, 10792. [Google Scholar] [CrossRef] [Scilit]
- Lee, G.-H.; You, Y.-M. Efficiency optimization of the main operating points of an EV traction motor. Appl. Sci. 2025, 15, 368. [Google Scholar] [CrossRef] [Scilit]
- Zhang, G.; Yu, W.; Hua, W.; Cao, R.; Qiu, H.; Guo, A. The design and optimization of an interior permanent magnet synchronous machine applied in an electric traction vehicle requiring a low torque ripple. Appl. Sci. 2019, 9, 3634. [Google Scholar] [CrossRef] [Scilit]
- Kano, Y.; Kanekiyo, H.; Suzuki, Y. Traction drive motor for small EVs using mass producible amorphous laminated cores. Electr. Eng. Jpn. 2024, 217, e23484. [Google Scholar] [CrossRef] [Scilit]

Disclaimer/Publisher’s Note: The statements, opinions and data contained in all publications are solely those of the individual author(s) and contributor(s) and not of MDPI and/or the editor(s). MDPI and/or the editor(s) disclaim responsibility for any injury to people or property resulting from any ideas, methods, instructions or products referred to in the content. |
© 2026 by the authors. Licensee MDPI, Basel, Switzerland. This article is an open access article distributed under the terms and conditions of the Creative Commons Attribution (CC BY) license.