


Abstract
Automotive thermal-comfort studies commonly focus on interactions between occupants and cabin air, although the seat forms the principal sustained contact interface between an occupant and a vehicle. This study presents a coupled computational fluid dynamics (CFD) framework that simultaneously resolves heat conduction through perforated leather, breathable sponge, heating pads, and foam; porous airflow through the seat; seat heating and ventilation; and convective heat transfer between the occupant and cabin air. Four total seat-heating powers (0, 60, 90, and 120 W) and four ventilation-fan speeds (0, 1500, 3000, and 4500 rpm) were simulated for 900 s. The results show that seat heating primarily alters temperatures in the contact region through conduction, whereas seat ventilation increases local airflow and cooling near the edges of ventilated contact regions. The principal contribution is a reproducible interface between cabin CFD and thermophysiological modeling. The framework generates spatially resolved fields of air temperature, air velocity, skin and contact-surface temperatures, and heat flux that can serve as boundary conditions for physiological models such as the Fiala and Berkeley models and for subsequent experimental validation. Because the present calculations constitute a comparative single-driver study, direct experimental validation, active thermoregulation, subjective thermal sensation, and interactions under full occupancy must be addressed before the framework can provide absolute comfort predictions.
1. Introduction
Vehicle thermal-management systems must increasingly balance cabin energy consumption against the highly nonuniform and transient conditions experienced by occupants, particularly in electrified vehicles [1]. Recent studies have combined experiments, high-fidelity CFD, data-driven prediction, and energy-oriented comfort assessment to characterize cabin heating and cooling transients [2,3,4]. A recent review further indicates that automotive comfort prediction is shifting from uniform, steady-state indices toward local, transient, and personalized models [5]. In this context, seat heating and ventilation provide rapid local conditioning at the occupant seat interface and can complement the slower response of the main HVAC system.
Thermal comfort was initially evaluated primarily through subjective responses. Quantitative indices were subsequently introduced, including effective-temperature indices and Fanger’s predicted mean vote (PMV) [6,7]. The Fiala model represents passive heat transfer and active thermoregulation to predict core and skin temperatures over a wide range of conditions [8,9,10]. The Berkeley model extends the prediction of local and whole-body thermal sensation and comfort to transient and nonuniform environments [11,12,13]. These physiological and empirical models are essential for translating local environmental conditions into thermal sensation; however, their predictions depend on reliable local boundary conditions, particularly at the occupantseat contact interface [5].
Previous studies have demonstrated the potential of seat-based local conditioning. Zhang et al. used circulating-water pads to heat and cool a seat and reported a wider acceptable ambient-temperature range [14]. Feng et al. experimentally evaluated a personalized heated seat under severe thermal conditions [15], and Ziolek et al. discussed model development for heated-seat comfort simulation [16]. Dong optimized a ventilated-seat duct and semiconductor cooling system and assessed it in road tests [17]. These studies establish the practical relevance of seat conditioning, but many cabin-level CFD models still simplify the seat as a single solid or boundary surface, limiting their ability to resolve conduction through individual seat layers, flow through porous media, and heat exchange in the contact region.
Recent automotive CFD studies demonstrate the value of resolving transient cabin airflow and temperature fields [2,3,18]. Studies of impinging jets, displacement ventilation, and permeable surfaces also show that the resulting predictions can be sensitive to geometry, turbulence treatment, mesh resolution, and boundary-condition representation [19,20,21,22]. A methodological need therefore remains for a cabin model that explicitly couples the occupant, the functional seat layers, the internal ventilation paths, and the surrounding airflow. Such a model can provide the local boundary conditions required by a separate physiological or thermal-sensation model, but it cannot be regarded as a validated comfort predictor without experimental evidence.
Accordingly, this study presents a comparative CFD method for a short-duration, single-driver scenario. A STAR-CCM+ model was constructed with one 50th-percentile male occupant, a detailed multilayer driver’s seat, and a simplified passenger cabin. The effects of seat-heating power and ventilation-fan speed on seat-surface temperature, local skin temperature, and cabin airflow were evaluated. The present scope excludes full cabin occupancy, interactions among multiple occupant thermal plumes, active human thermoregulation, and subjective thermal-sensation calculations; these limitations are considered explicitly when the results are interpreted.
2. Numerical Modeling Framework
2.1. Governing Equations for Cabin Airflow and Heat Transfer
Mass conservation requires that the rate of mass accumulation within a control volume the net mass flux into it. The differential continuity equation is [23]
where ρ is the fluid density; u, v, and w are the velocity components in the x, y, and z directions, respectively; and t is time. For incompressible flow, density is constant, and Equation (1) reduces to
The momentum equations follow Newton’s second law: the rate of change momentum within a fluid element equals the sum of the surface and body forces. In Cartesian coordinates, the x-, y-, and z-momentum equations are
where p denotes pressure; U is the velocity vector; τxx, τyy, τzz, τxy, τyz, and τxz are components of the viscous stress tensor; and Fx, Fy, and Fz denote the body-force components.
Energy conservation requires that the rate of change of a fluid element’s total energy the net heat input plus the work done by external forces. The energy equation is
where T is temperature, Cp is specific heat capacity, k is fluid thermal conductivity, and ST represents viscous dissipation and any prescribed volumetric energy source.
2.2. Heat-Transfer Modes in the Passenger Cabin
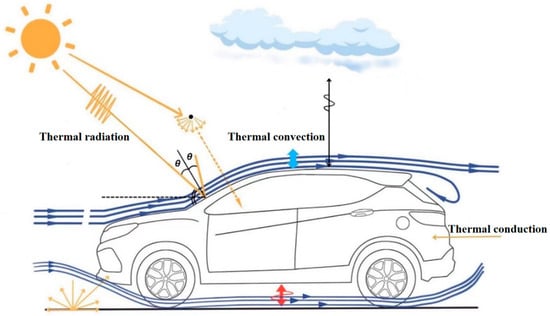
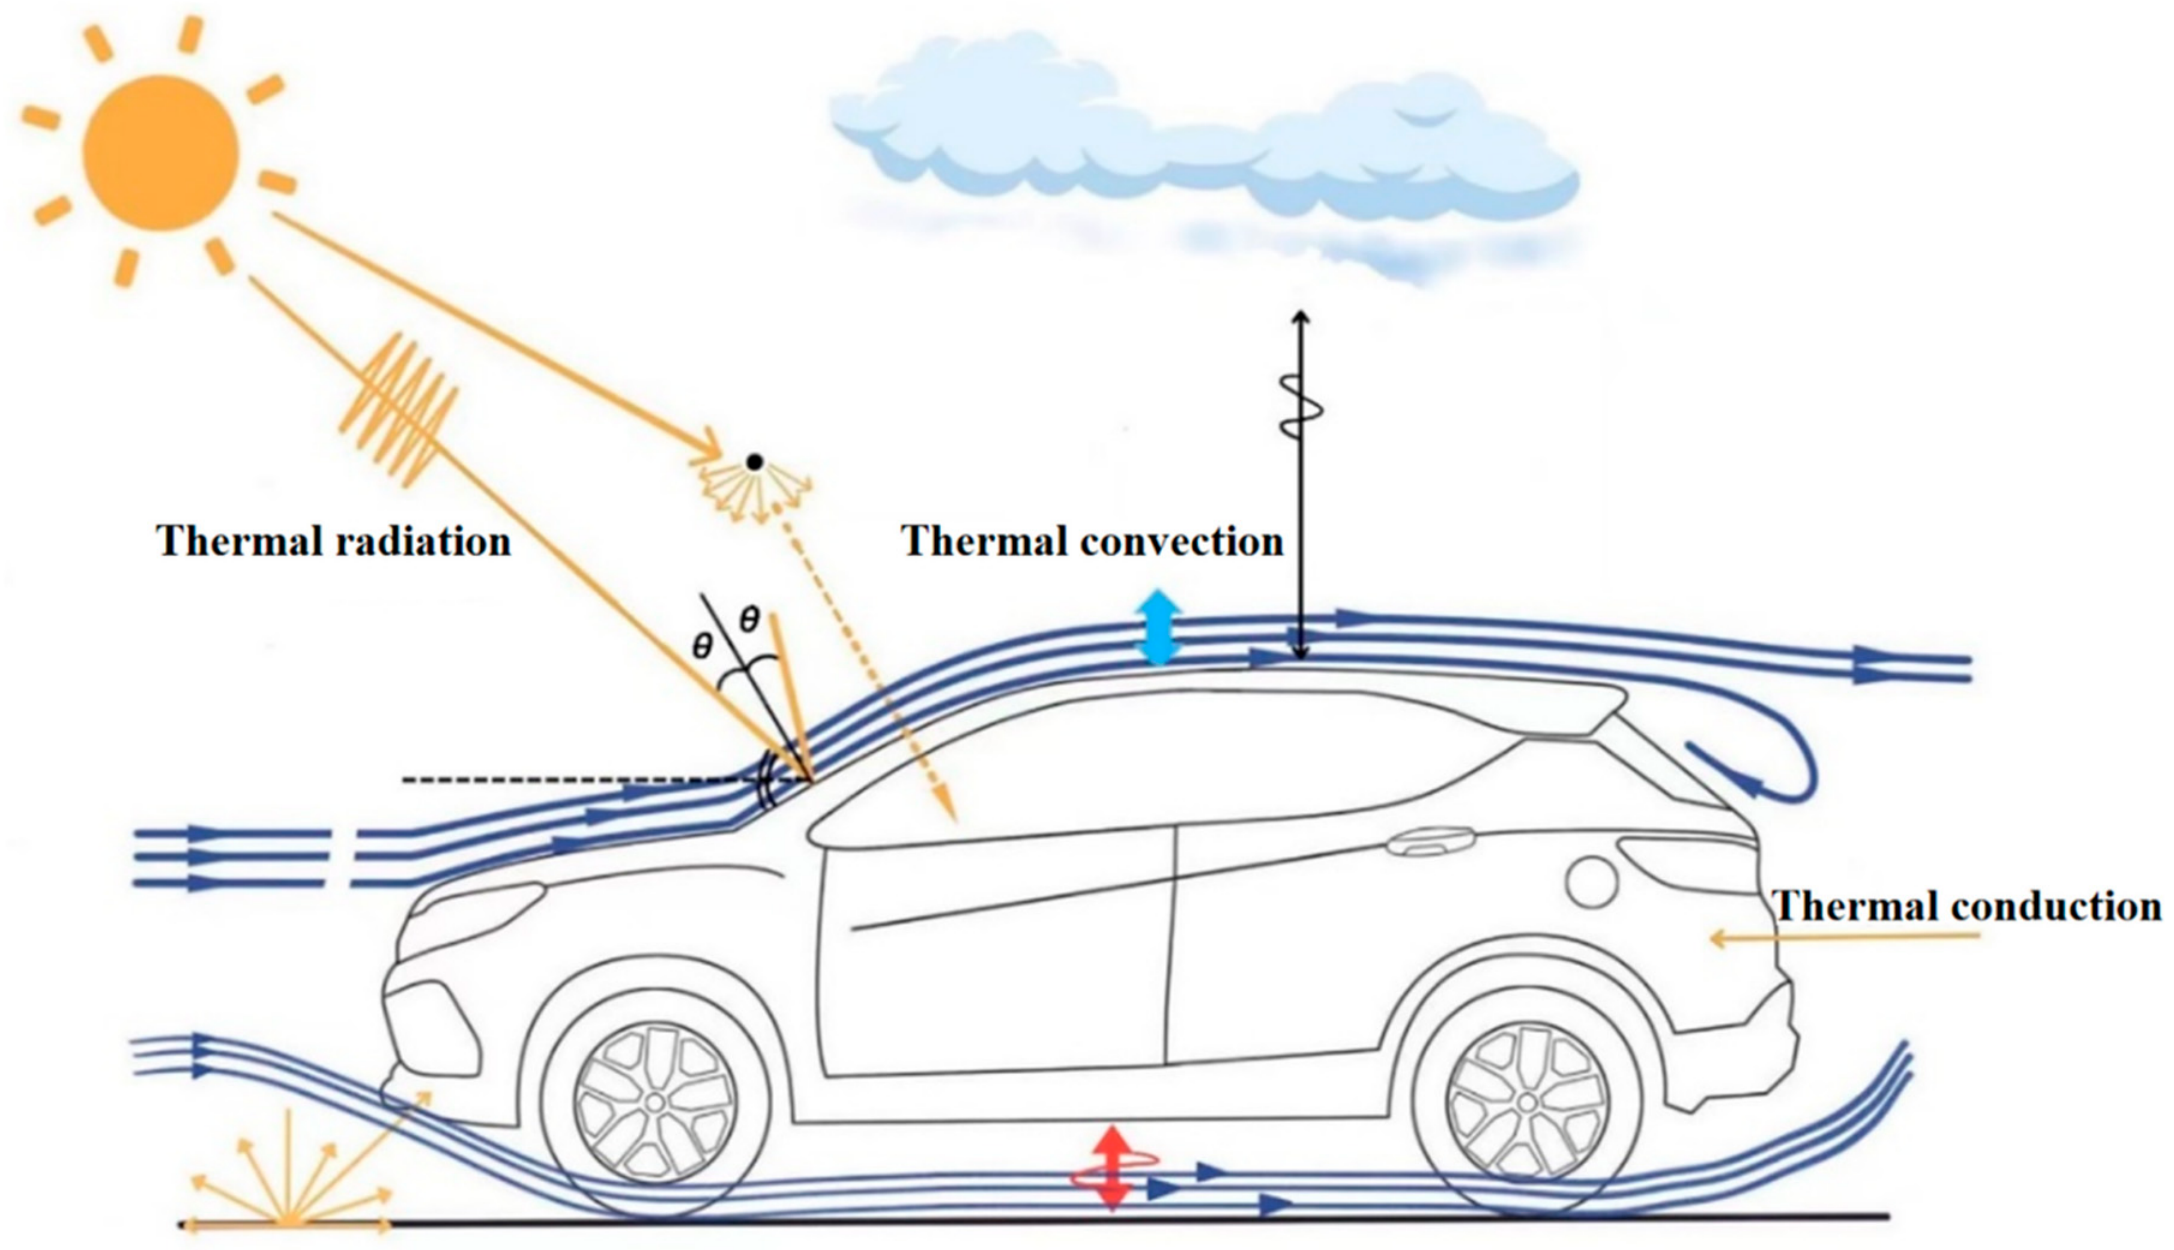
Three heat-transfer mechanisms govern the thermal environment of the passenger cabin: convection between moving air and solid surfaces, conduction through the seat layers and the occupant+seat contact interface, and radiation among the occupant, the cabin surfaces, and the surroundings. Figure 1 summarizes these mechanisms.
Figure 1.
Modes of heat transfer in the vehicle thermal environment.
2.2.1. Thermal Convection
In the passenger cabin, convection occurs between moving air and solid surfaces. The HVAC outlets provide the dominant forced flow, while seat ventilation adds local suction through the perforated cover and internal ducts. As air passes over the occupant, seat, and trim surfaces, the local heat flux depends on air velocity and the airsurface temperature difference. Buoyancy may contribute locally where temperature gradients are strong, but forced convection dominates under the modeled HVAC conditions. The resulting velocity and temperature fields therefore define the convective boundary conditions for the occupant and seat.
Convective heat transfer is calculated using Newton’s law of cooling:
where φ is the convective heat-transfer rate (W), Ah is the convective area (m2), h is the convective heat-transfer coefficient (W m−2 K−1), Ts is surface temperature, and Tf is the adjacent air temperature.
2.2.2. Thermal Conduction
In the present model, heat conduction occurs primarily within the layered seat structure and across the occupantseat contact interface. Heat flows across the contact interface from the warmer side to the cooler side and sequentially through the perforated leather, breathable sponge, heating pad, and foam layers. The resulting seat-surface and local skin temperatures depend on the thermal conductivity, thickness, density, and specific heat capacity of each layer, as well as on the temperature difference across the contact interface.
At the continuum scale, conduction transfers energy down a temperature gradient through molecular interactions. In the present model, the relevant solid pathways are the individual seat layers and the contact interface.
Fourier’s law of heat conduction is
where Ac is the conduction area (m2), λ is thermal conductivity (W m−1 K−1), and ∂T/∂x is the temperature gradient. The negative sign indicates that heat flows in the direction of decreasing temperature.
2.2.3. Thermal Radiation
Thermal radiation transfers energy by electromagnetic waves and therefore does not require a material medium. When radiation reaches a surface, it may be absorbed, reflected, or transmitted. The corresponding fractions are absorptivity α, reflectivity ρ, and transmissivity τ, which satisfy
The StefanBoltzmann law relates the radiative heat-transfer rate of a surface to its absolute temperature:
where ε is surface emissivity, Ar is radiating area (m2), σ = 5.67 × 10⁻⁸ W m−2 K−4 is the StefanBoltzmann constant, and T is absolute temperature (K). Radiative emission therefore increases with the fourth power of absolute temperature.
2.3. Porous-Medium Modeling
A porous medium consists of a solid skeleton and voids occupied by fluid. The voids may be interconnected or closed. Examples include packed beds, filters, heat sinks, honeycomb cores, and fibrous materials.
Flow resistance in a porous material is commonly represented by the Forchheimer relation:
In Equation (11), Δp/L is the pressure gradient, v is the superficial (Darcy) velocity, a is the viscous-resistance coefficient, and b is the inertial-resistance coefficient.
Based on packed-bed measurements, Ergun formulated the resistance terms as functions of particle diameter, porosity, and fluid properties, yielding the Ergun equation:
where A and B are dimensionless coefficients for the viscous and inertial terms, respectively; ε is porosity; and dp is particle diameter.
A multiphase porous-medium formulation was used for the breathable sponge and heating pad. Interstitial velocity was solved within the connected pore space, and local thermal nonequilibrium was enabled because the solid matrix and air may exhibit different transient temperatures. Separate energy equations were therefore solved for the fluid and solid phases, with interphase heat exchange represented by a volumetric heat-transfer coefficient.
For solid phase i, the volume fraction is the ratio of its volume to the total cell volume and is related to porosity by
where Vsolid,i is the volume of solid phase i, V is the cell volume, and ε is total porosity.
The porous-flow continuity equation is
where v denotes the interstitial (physical) velocity.
The porous-flow momentum equation is
where the tensors in the momentum-source term represent inertial and viscous resistance, respectively.
Under local thermal nonequilibrium, separate energy equations are solved for the fluid and solid phases:
In the phase-energy equations, E and H denote total energy and total enthalpy, respectively; q is heat flux; a is the interfacial area density; h is the interphase convective heat-transfer coefficient; ρ is density; and τ is the stress tensor. Subscripts f and si denote the fluid and the ith solid phase, respectively.
Under local thermal equilibrium, the combined energy equation is
where cp,f and cp,si are the specific heat capacities of the fluid and the ith solid phase, respectively; keff is the effective thermal conductivity; and the phase volume fractions provide the corresponding weighting.
3. Three-Dimensional Geometry and Boundary Conditions
3.1. Geometry Processing and Mesh Generation
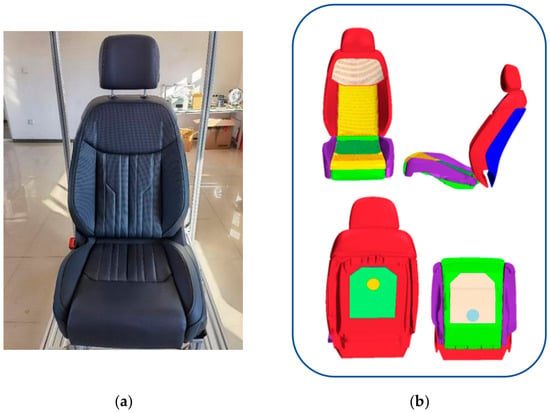
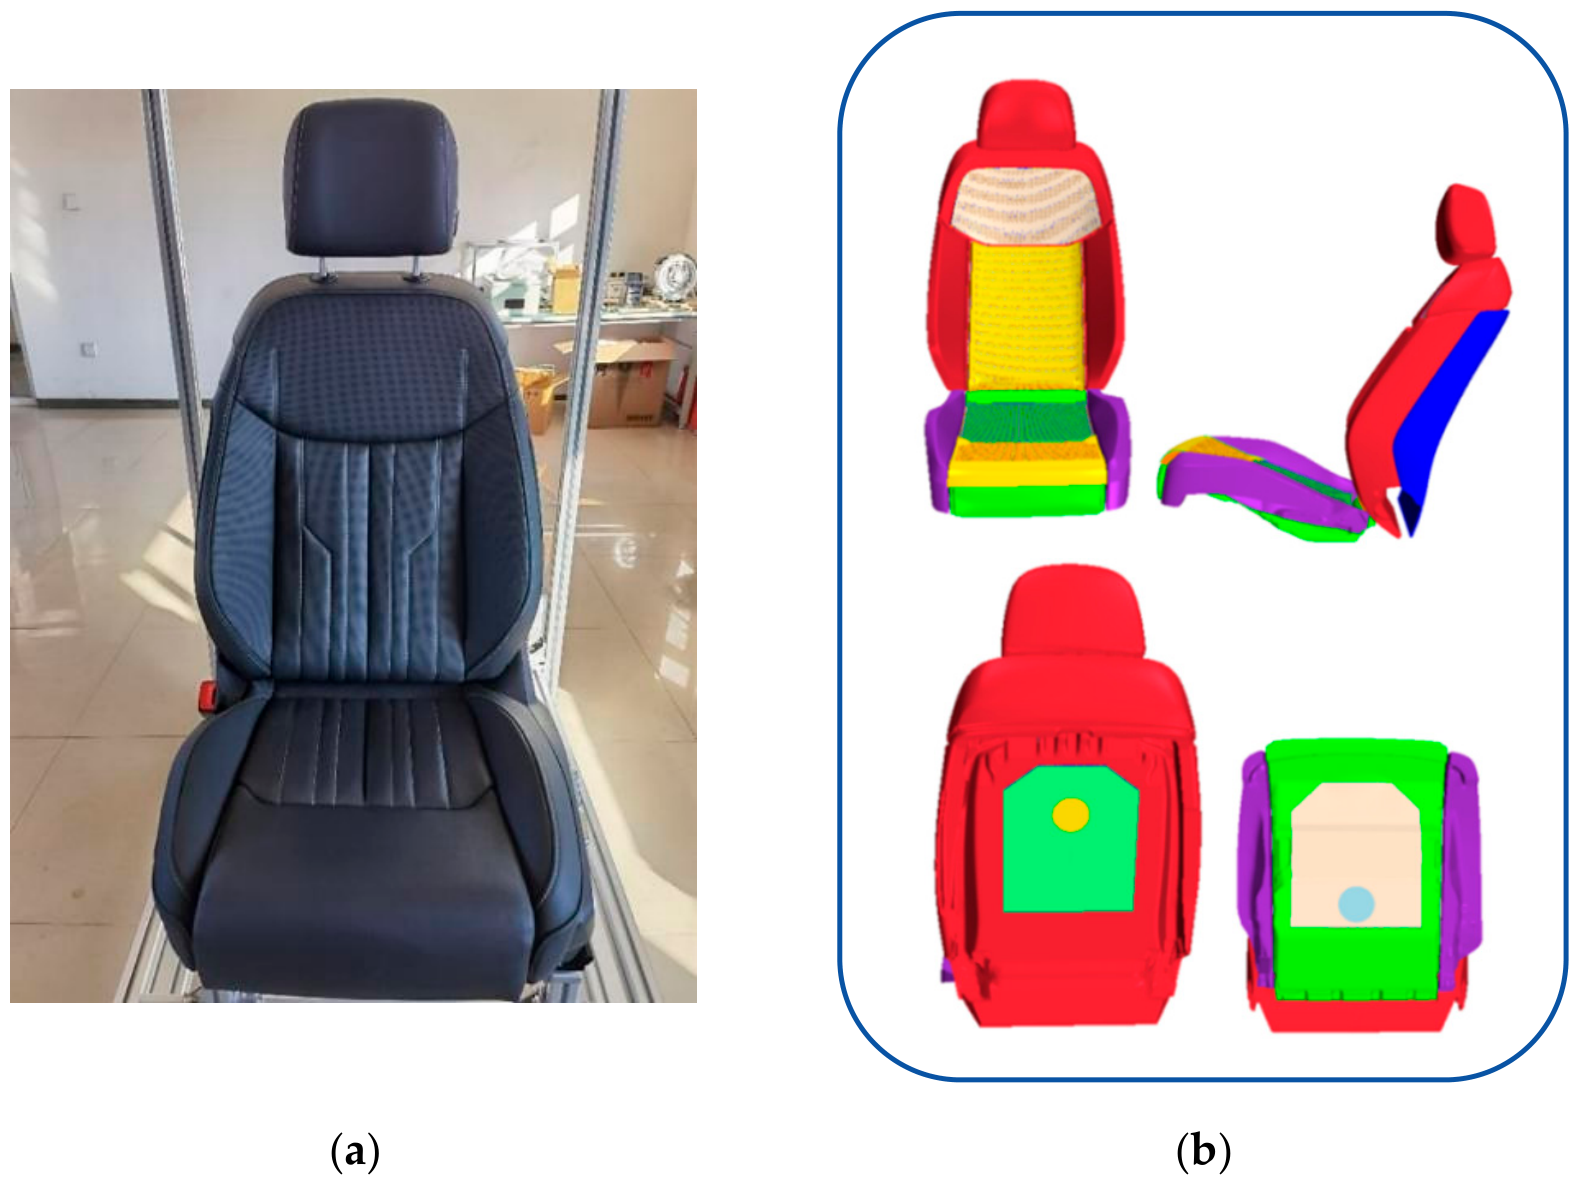
A driver’s seat from a midsize vehicle was selected for the study (Figure 2). The source geometry included the frame, adjustment mechanism, wiring harness, and electrical hardware. Because these features have negligible effects on seat-surface heat transfer, airflow distribution, and contact but substantially increase the cell count, they were removed. The exterior geometry and principal thermally functional regions were retained.
Figure 2.
Original and simplified driver’s-seat geometry: (a) physical seat; (b) geometrically cleaned model. In (b), colors distinguish geometric components only; they do not represent temperature or another calculated field.
The source CAD geometry did not include the perforated cover, ventilation ducts, or heating pads required for the thermal model. These functional features were added while preserving the external seat geometry and eliminating details not expected to affect heat transfer or airflow.
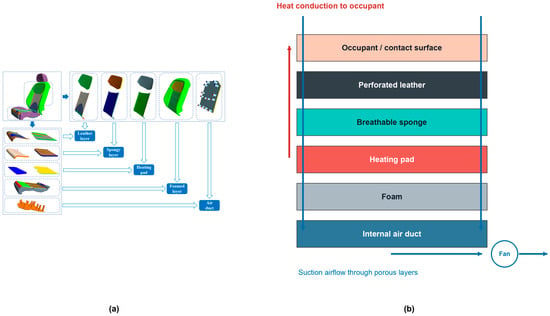
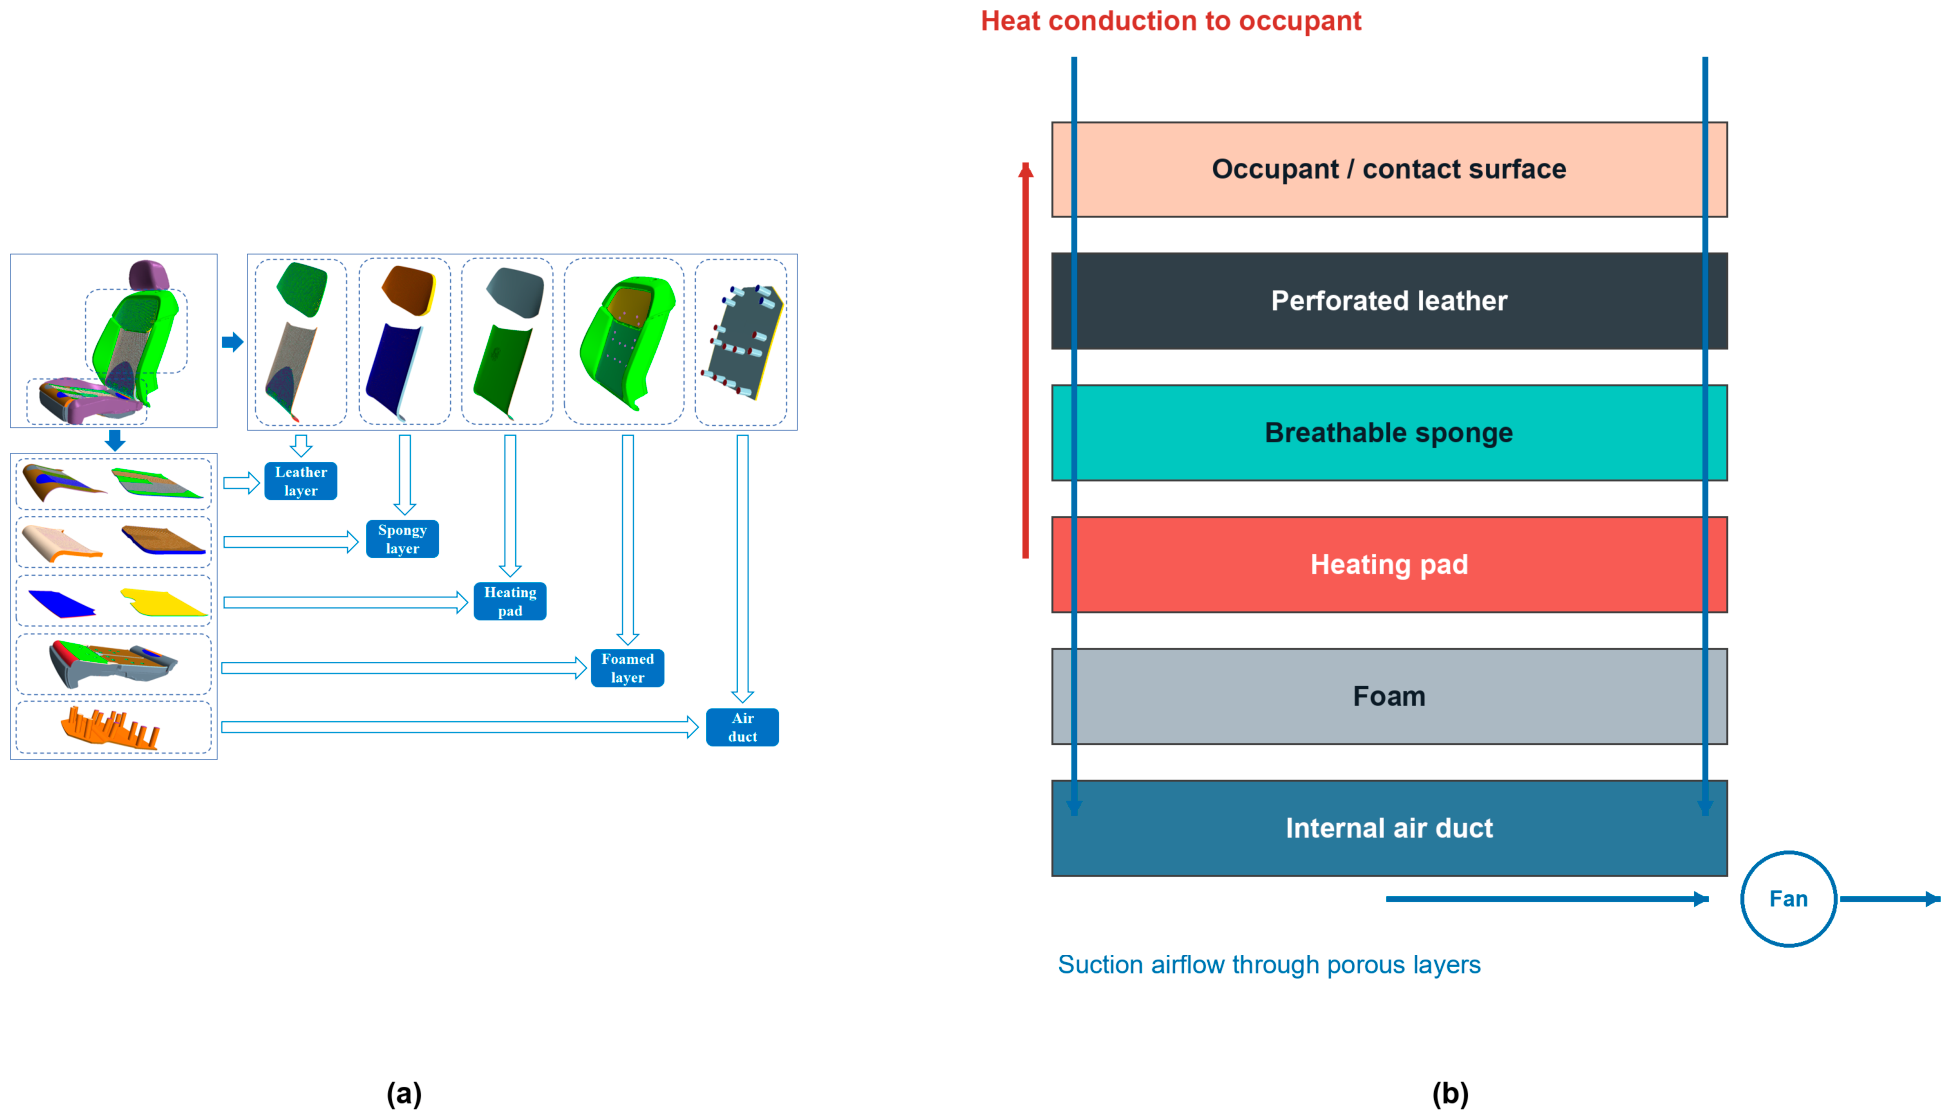
ANSA was used to prepare the seat geometry by removing the frame, adjustment mechanism, wiring harness, and electrical components; smoothing joint transitions; closing holes; and trimming overlapping regions. The resulting model is shown in Figure 2b. To represent convection, conduction through the functional layers, and airflow through the ventilation paths, the seat was divided from the surface inward into perforated leather, breathable sponge, heating pads, foam, and internal air ducts, as illustrated schematically in Figure 3.
Figure 3.
Multilayer seat structure and coupled heat-transfer paths: (a) geometric decomposition of the detailed seat model; (b) schematic of the interface, porous layers, heating pad, internal air ducts, and suction airflow. In (a), colors distinguish geometric components. In (b), the labeled fills identify the seat layers; red arrows indicate conductive heat transfer and blue arrows indicate suction airflow. The schematic is not to scale.
According to the structural layout and thermal functional characteristics of the seat, the seat model was further divided into 18 regions: backrest foam layer, cushion foam layer, cushion side foam layer, headrest, upper-back leather layer, upper-back sponge layer, upper-back heating pad, lower-back leather layer, lower-back sponge layer, lower-back heating pad, upper-cushion leather layer, upper-cushion sponge layer, upper-cushion heating pad, lower-cushion leather layer, lower-cushion sponge layer, heating pad beneath the cushion, fan and sealing pad near the backrest, and fan and sealing pad inside the cushion. This regional division provides the basis for assigning material properties, defining heat sources, and setting ventilation-related boundary conditions in the subsequent CFD model.
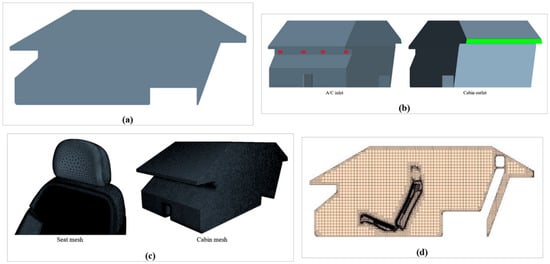
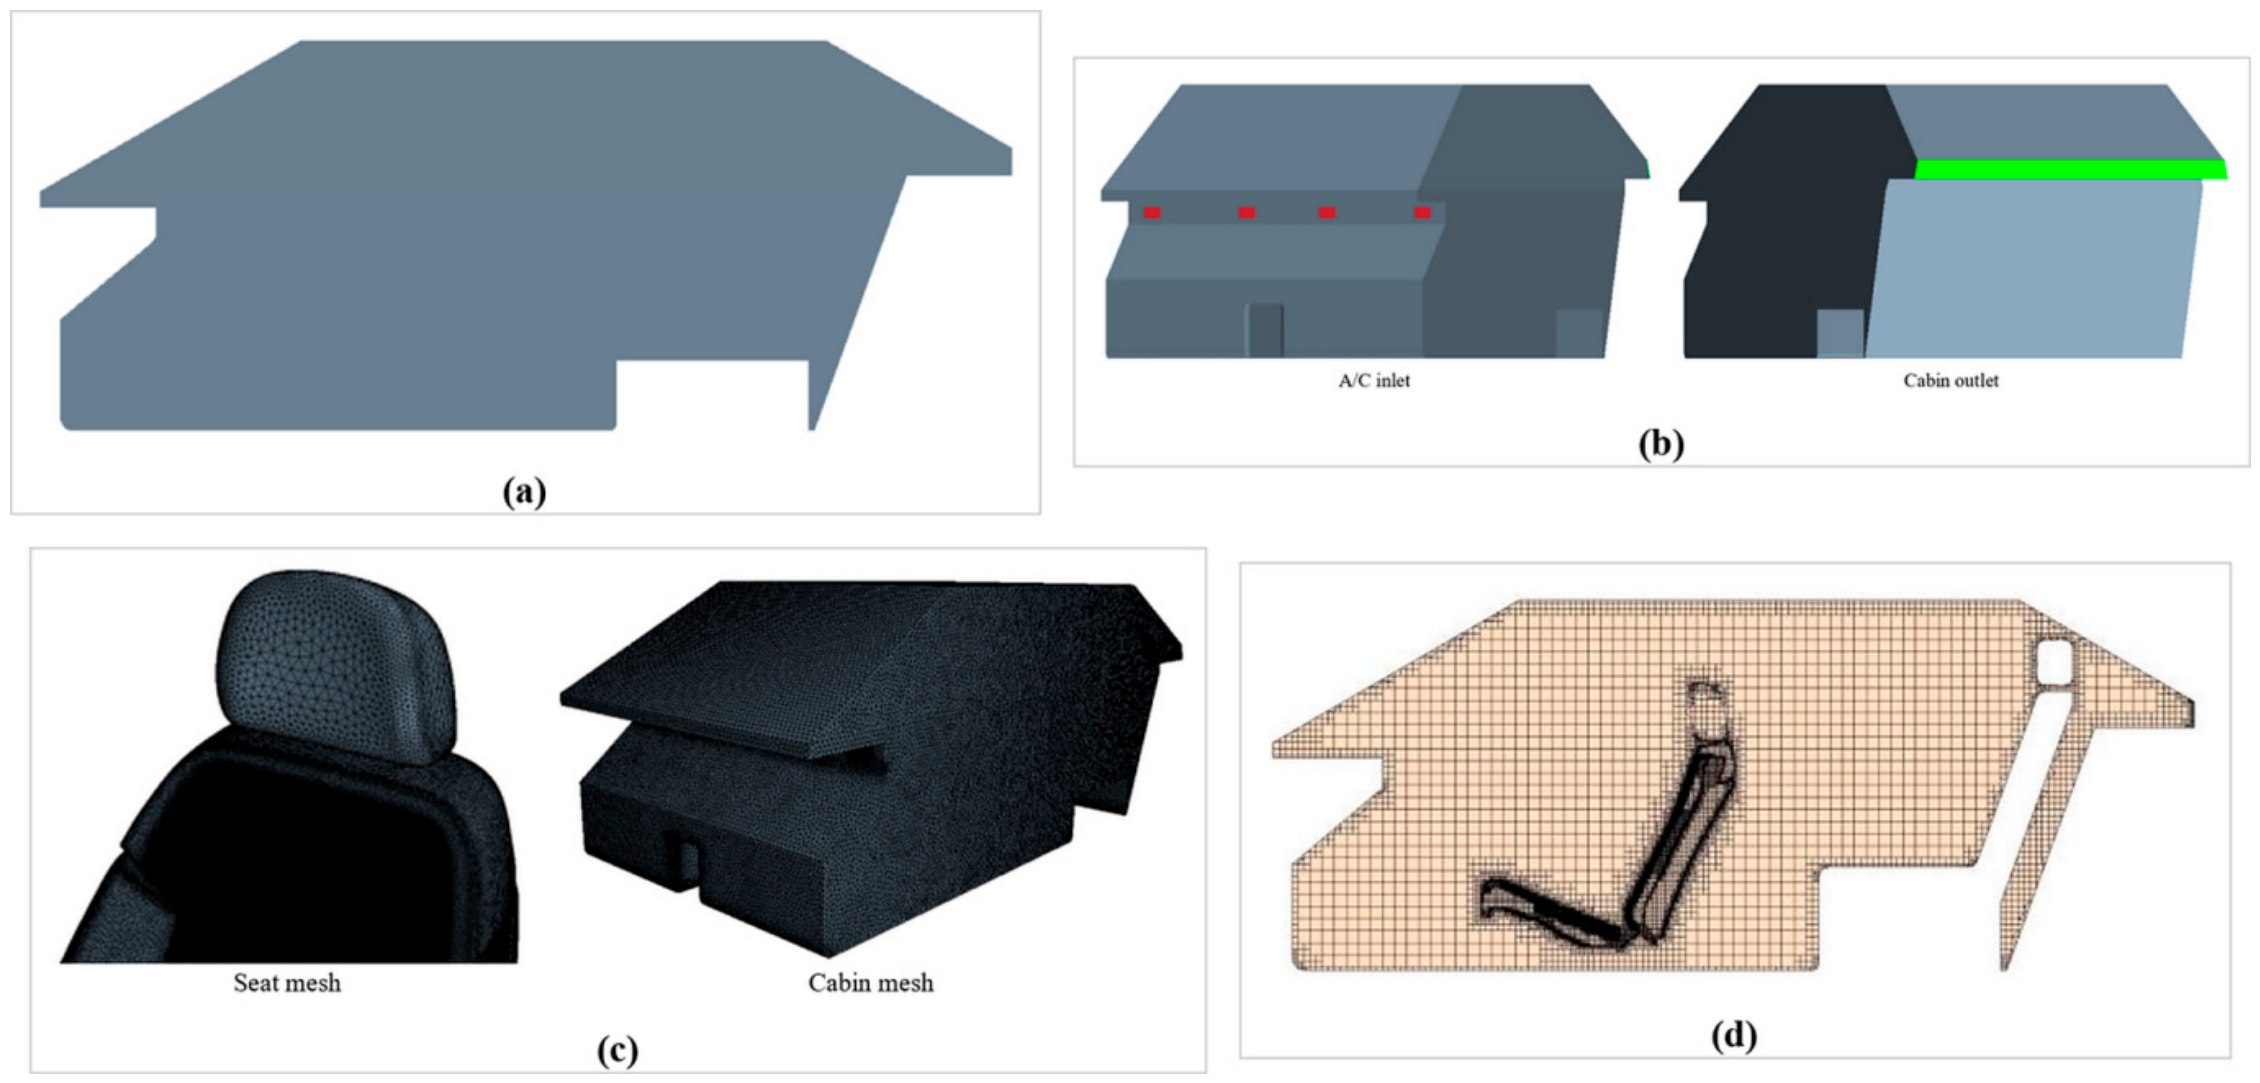
To limit the cell count, the detailed seat was retained while cabin components with little influence on airflow or heat transfer were simplified, as shown in Figure 4a. Because the complete HVAC duct network was unavailable, the computational inlets were placed at the cabin supply outlets, and the computational outlet was located near the rear seat (Figure 4b).
Figure 4.
Computational geometry and mesh: (a) simplified passenger cabin; (b) inlet and outlet locations; (c) seat and cabin surface mesh; (d) cut-cell volume mesh on the cabin center plane. In (b), red marks the HVAC supply inlets and green marks the cabin outlet; the other colors distinguish geometric or mesh regions and are not scalar-field contours.
The computational domain represented the entire simplified passenger cabin and had internal bounding dimensions of approximately 2.40 m longitudinally, 1.50 m laterally, and 1.20 m vertically. The enclosed fluid volume was 2.65 m3. The total supply-inlet and pressure-outlet areas were 0.0192 and 0.0300 m2, respectively. The x-, y-, and z-axes pointed rearward, rightward, and upward, respectively. The occupant accounted for 2.9% of the enclosed cabin-air volume. Because only one driver was included, interactions among multiple occupant plumes and the airflow obstruction associated with full occupancy were outside the present scope.
The seat geometry was surface-cleaned in ANSA before volume meshing. The initial surface mesh was imported into STAR-CCM+ and checked for penetrations, free edges, overlapping faces, and other defects that could impair solver stability. These regions were repaired before volume-mesh generation.
Surface target sizes were assigned according to geometric scale and thermal sensitivity. The thin leather layer used a 0.5 mm surface size, whereas the thicker sponge layer used 2 mm to control the total cell count while retaining local resolution. Figure 4c shows the resulting surface mesh.
A cut-cell volume mesh was generated for the computational domain, as shown in Figure 4d. The final model contained 16.89 million volume cells, and the monitored iterative residuals fell below 10−3. This residual criterion indicates iterative convergence for a given mesh but does not, by itself, demonstrate mesh or time-step independence. The quantitative mesh, time-step, and global conservation assessments are reported in Section 3.3.
3.2. Material Models and Boundary Conditions
The passenger cabin contains numerous components, including the roof lining, front and rear windshields, side windows, instrument panel, center console, seats, carpet, and doors [24]. Each component has distinct thermophysical and radiative properties. Because many of these components have complex multilayer structures, modeling every material layer would substantially increase the preprocessing effort and computational cost. The cabin components were therefore represented by equivalent homogeneous materials, and interlayer thermal contact resistance was neglected [25]. The material parameters are listed in Table 1 (passenger-cabin surfaces).
Table 1.
Thermophysical and porous-medium parameters of the passenger-cabin surfaces, seat layers, porous seat layers, and occupant used in the CFD model.
Thermophysical properties were assigned separately to each modeled seat layer, as listed in Table 1 (seat layers).
A breathable sponge layer was placed beneath the perforated leather to permit airflow through the seat, and heating pads were positioned beneath the sponge. Because both components contain internal voids, they were represented as porous media. In the heating cases, the prescribed total power, Q, was applied as a spatially distributed volumetric heat source within each porous heating-pad region, q‴ = Q/Vpad; neither a fixed-temperature boundary nor a point heat source was used. The porous-medium parameters were adopted from previous studies [26,27] and are listed in Table 1 (porous seat layers).
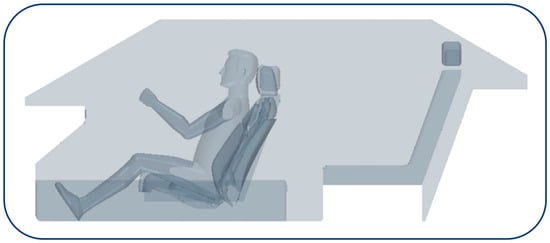
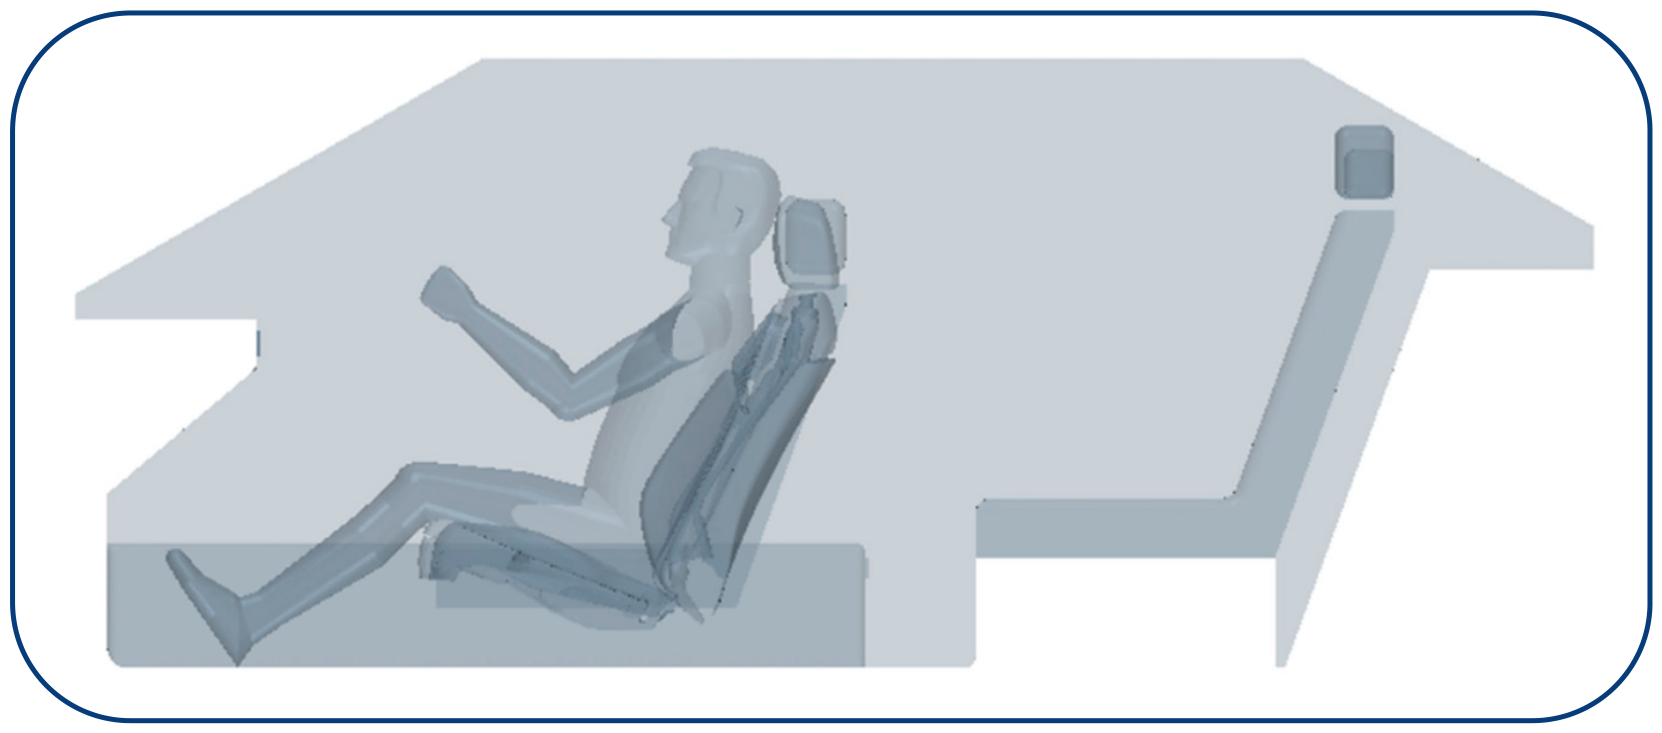
This study considers a single-driver scenario rather than a multi-occupant or fully occupied cabin. The occupant geometry was based on the dimensions of a 50th-percentile adult male specified in GB/T 10000-2023 [28], and the posture was adjusted using the driver’s H-point, as shown in Figure 5. Interactions among multiple occupant plumes and the additional airflow blockage associated with full occupancy are therefore outside the scope of the model.
Figure 5.
Positioning of the occupant model in the passenger cabin.
The three-dimensional occupant model was divided into 17 segments in ANSA. A skin temperature of 36 °C was specified as the initial condition. The segmented model represents passive heat transfer only and excludes active thermoregulatory responses such as sweating, vasomotor regulation, and metabolic adaptation. The thermophysical properties are listed in Table 1 (occupant properties).
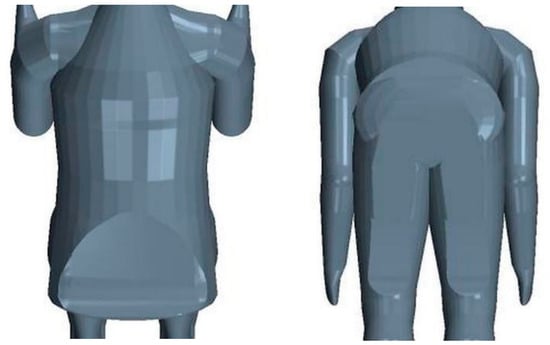
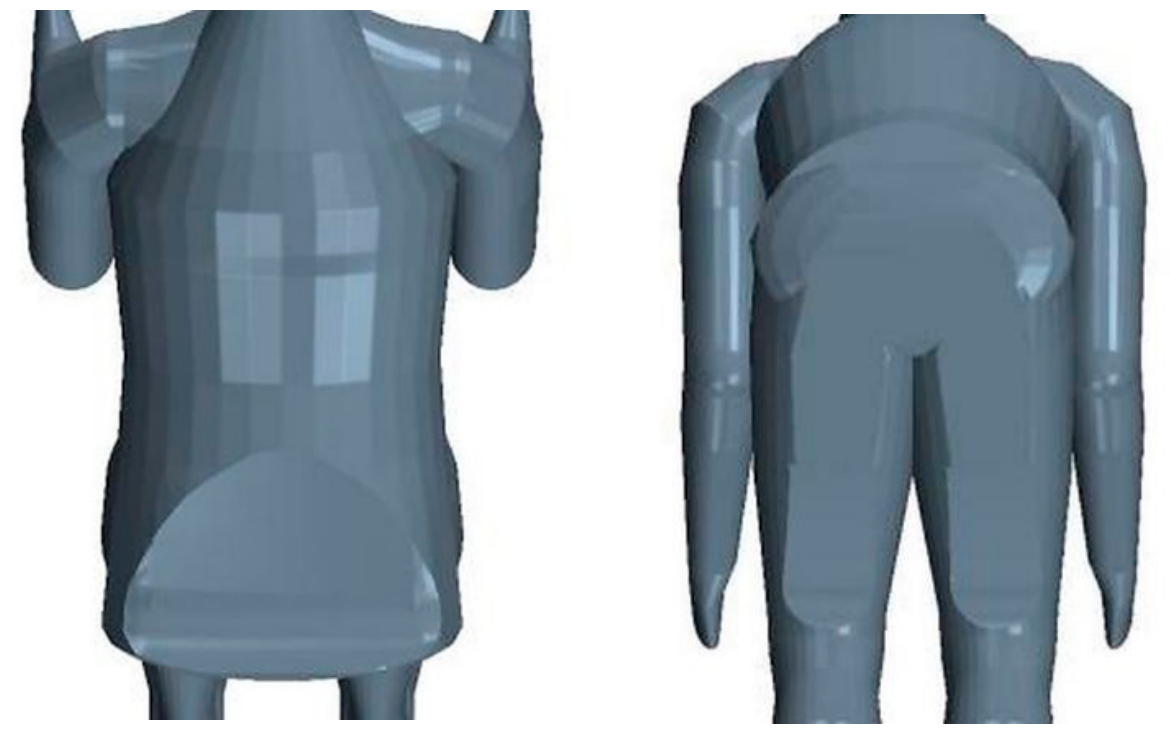
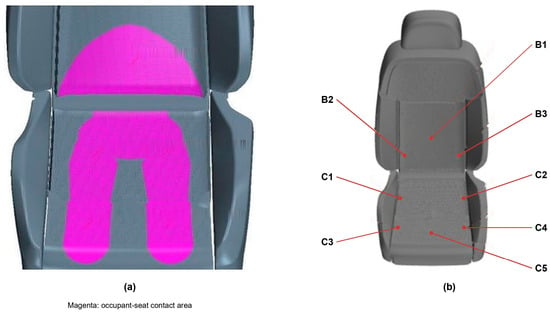
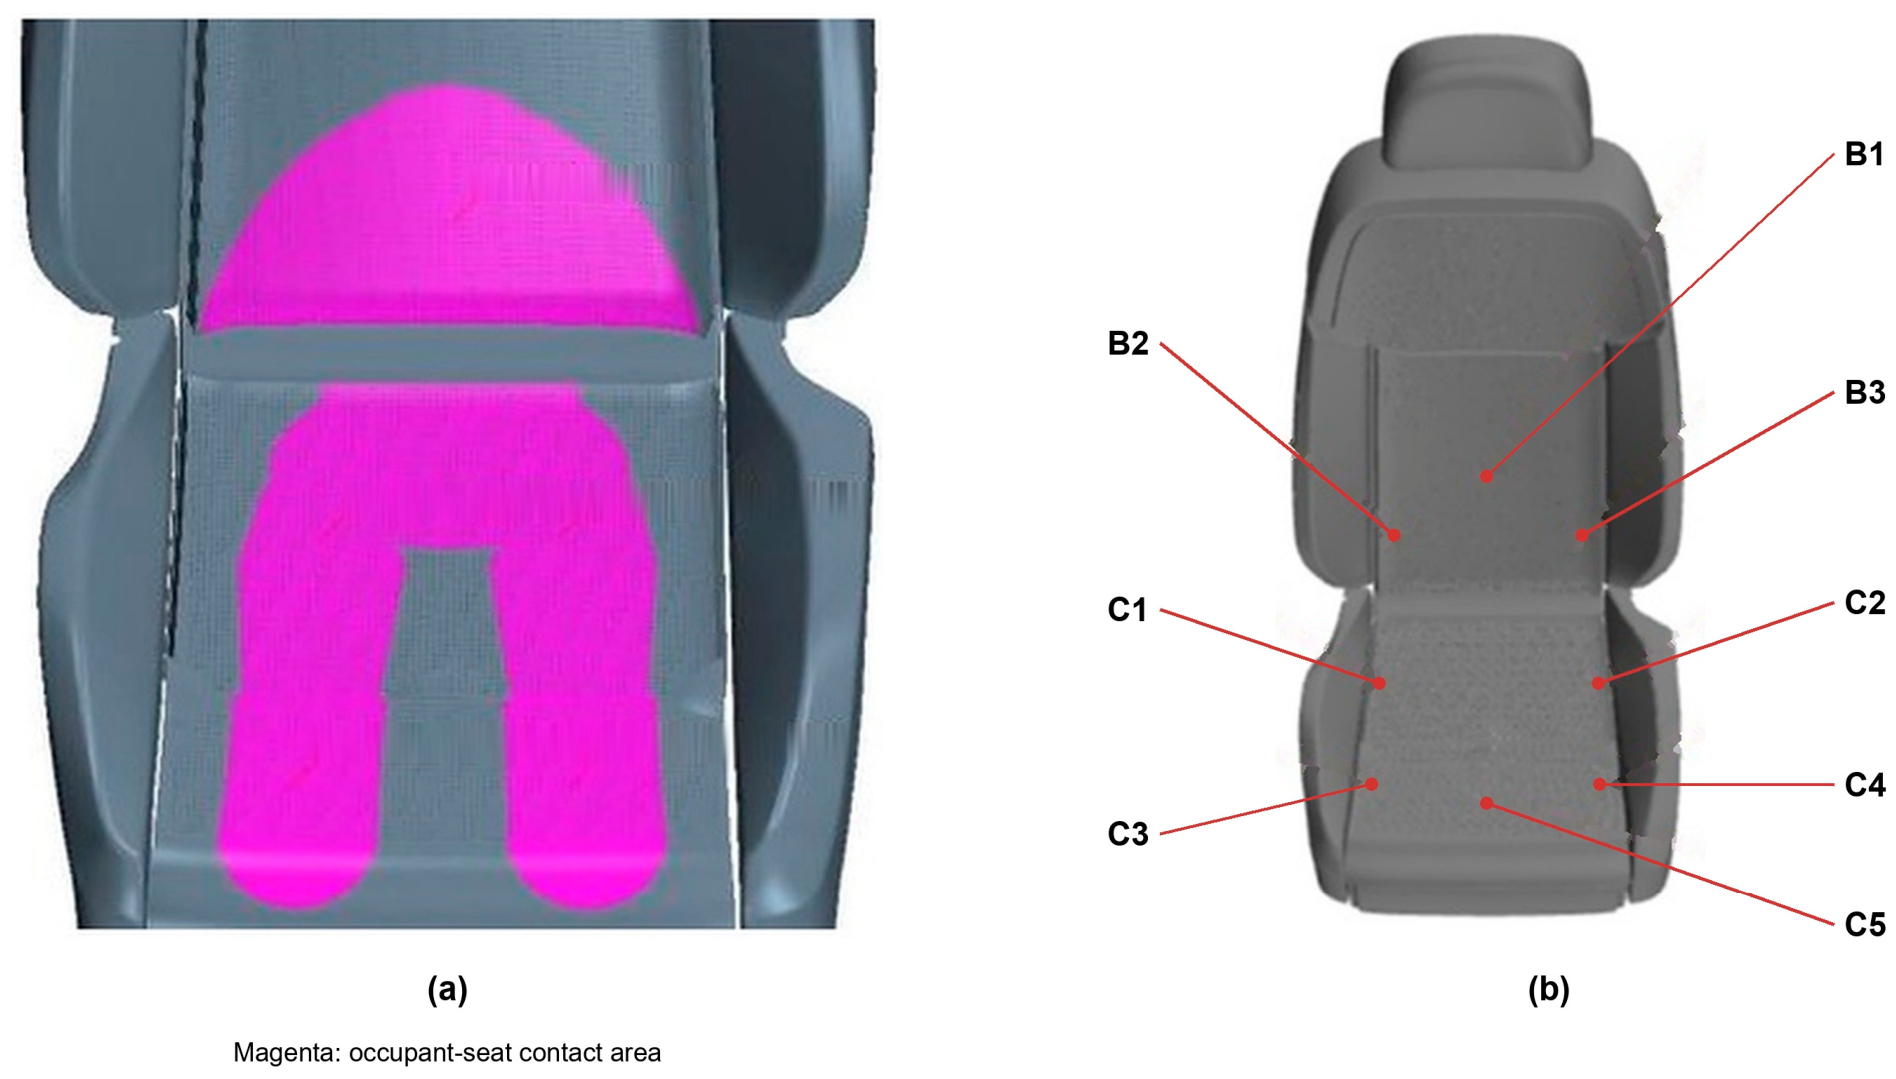
The occupant and seat surfaces were locally deformed to represent the loaded contact region (Figure 6). The corresponding seat contact surface was partitioned, and a coupled interface was defined between the occupant and the seat, as shown in Figure 7a.
Figure 6.
Occupant surface mesh after deformation to represent the contact region.
Figure 7.
Occupanteat interface and monitoring locations: (a) contact area; (b) backrest and cushion monitoring points. Magenta identifies the contact area. B1–B3 denote backrest points, and C1–C5 denote cushion points.
3.3. Numerical Models, Solution Procedure, and Assumptions
Table 2 provides a reproducibility and model-handoff summary rather than a simple list of solver settings. It clarifies the role of the detailed seat model in the overall workflow: multilayer conduction, porous airflow, and contact determine local boundary conditions that a cabin-only model cannot resolve. The listed outputs can be sampled at the monitoring locations, exported to thermophysiological models, and compared with measurements in future validation. Thus, the present work addresses boundary-condition generation and does not replace physiological modeling or subjective comfort validation.
Table 2.
CFD configuration, solution procedure, assumptions, verification evidence, and role in the overall thermal-comfort workflow.
The surface-to-surface radiation model was selected because cabin air was treated as a nonparticipating medium and the principal radiative exchange occurred among opaque, diffuse-gray cabin and occupant surfaces. The model accounts directly for geometric view factors and surface emissivity at substantially lower computational cost than a participating-media method such as discrete ordinates. Thermophysiological models such as the Fiala model serve a different purpose: they predict passive and active physiological responses and translate environmental loads into core and local skin temperatures. By contrast, the present CFD approach resolves the multilayer seat, porous airflow, internal ducts, and contactinterface heat transfer. It therefore provides spatial detail at the seat-cabin interface but does not include active physiology or validated thermal-sensation predictions.
3.4. Validation Status, Applicability, and Limitations
The present calculations have not yet been validated against measurements of cabin airflow, seat-surface temperature, or occupant-contact temperature. Consequently, the reported fields and trends should be interpreted as comparative numerical results for the modeled cases rather than as verified absolute predictions for a production vehicle. The single-driver configuration also cannot establish reliability under multi-occupant or fully occupied conditions, in which interacting thermal plumes and additional blockage may alter the cabin airflow.
Future validation should compare the numerical predictions with repeated measurements for representative winter-heating (90 W) and summer-ventilation (3000 rpm) cases over the 900 s simulation period. Seat-surface and occupant-contact temperatures could be measured using Type-T thermocouples with an accuracy of ±0.3 K, while local velocities at the monitoring locations in Figure 7 could be measured using a hot-wire anemometer with an accuracy of ±0.03 m s−1 or ±3%. At least three repetitions per condition would enable the reporting of the mean absolute error, root mean square error, maximum absolute error, and combined measurement uncertainty. These measurements have not yet been performed and remain a priority for future work.
4. Effects of Seat Heating and Ventilation on the Cabin and Occupant
Representative seat-surface monitoring locations were defined for the subsequent analysis, as shown in Figure 7b. The backrest points lie within the occupant-backrest contact region, whereas the cushion points cover the thigh-cushion contact region and the exposed area between the thighs.
4.1. Seat-Heating Results
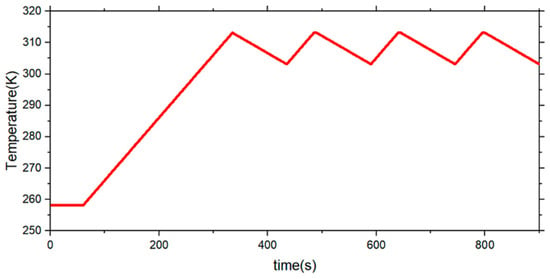
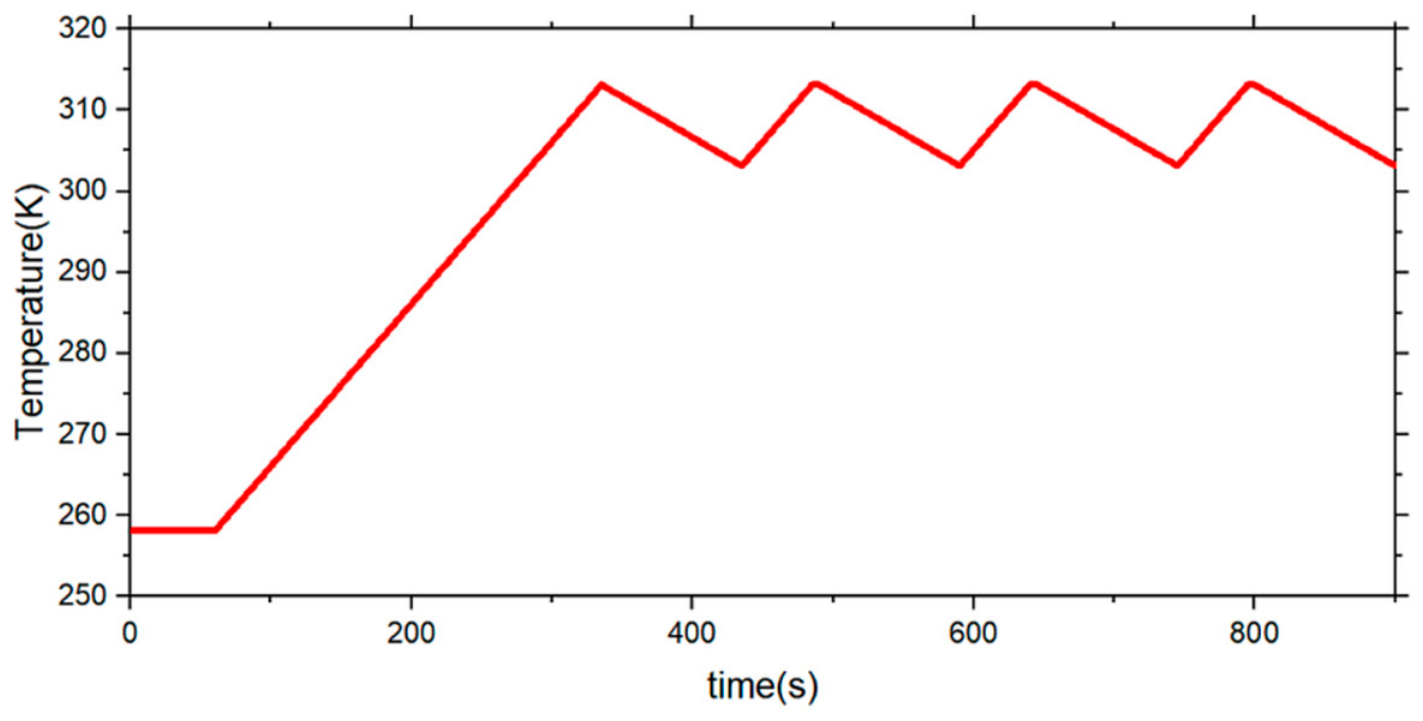
This section examines the effect of seat-heating power under a common winter HVAC condition. Heating pads were installed in the cushion and backrest. Bench measurements yielded single-pad powers of 30, 45, and 60 W, corresponding to total seat-heating powers of 60, 90, and 120 W. The cabin supply-air velocity was 3 m/s, and the prescribed PTC-heater supply-temperature profile was adapted from Ref. [29] and simplified as shown in Figure 8. The four simulated total power levels were 0, 60, 90, and 120 W.
Figure 8.
Prescribed cabin supply-air temperature profile for the winter cases.
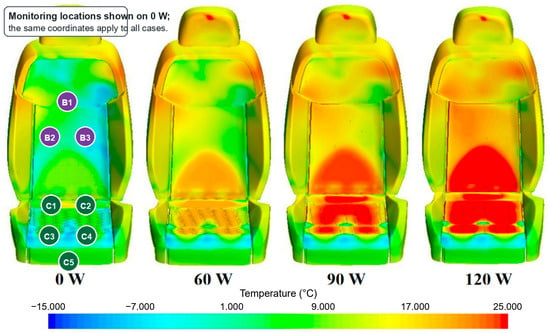
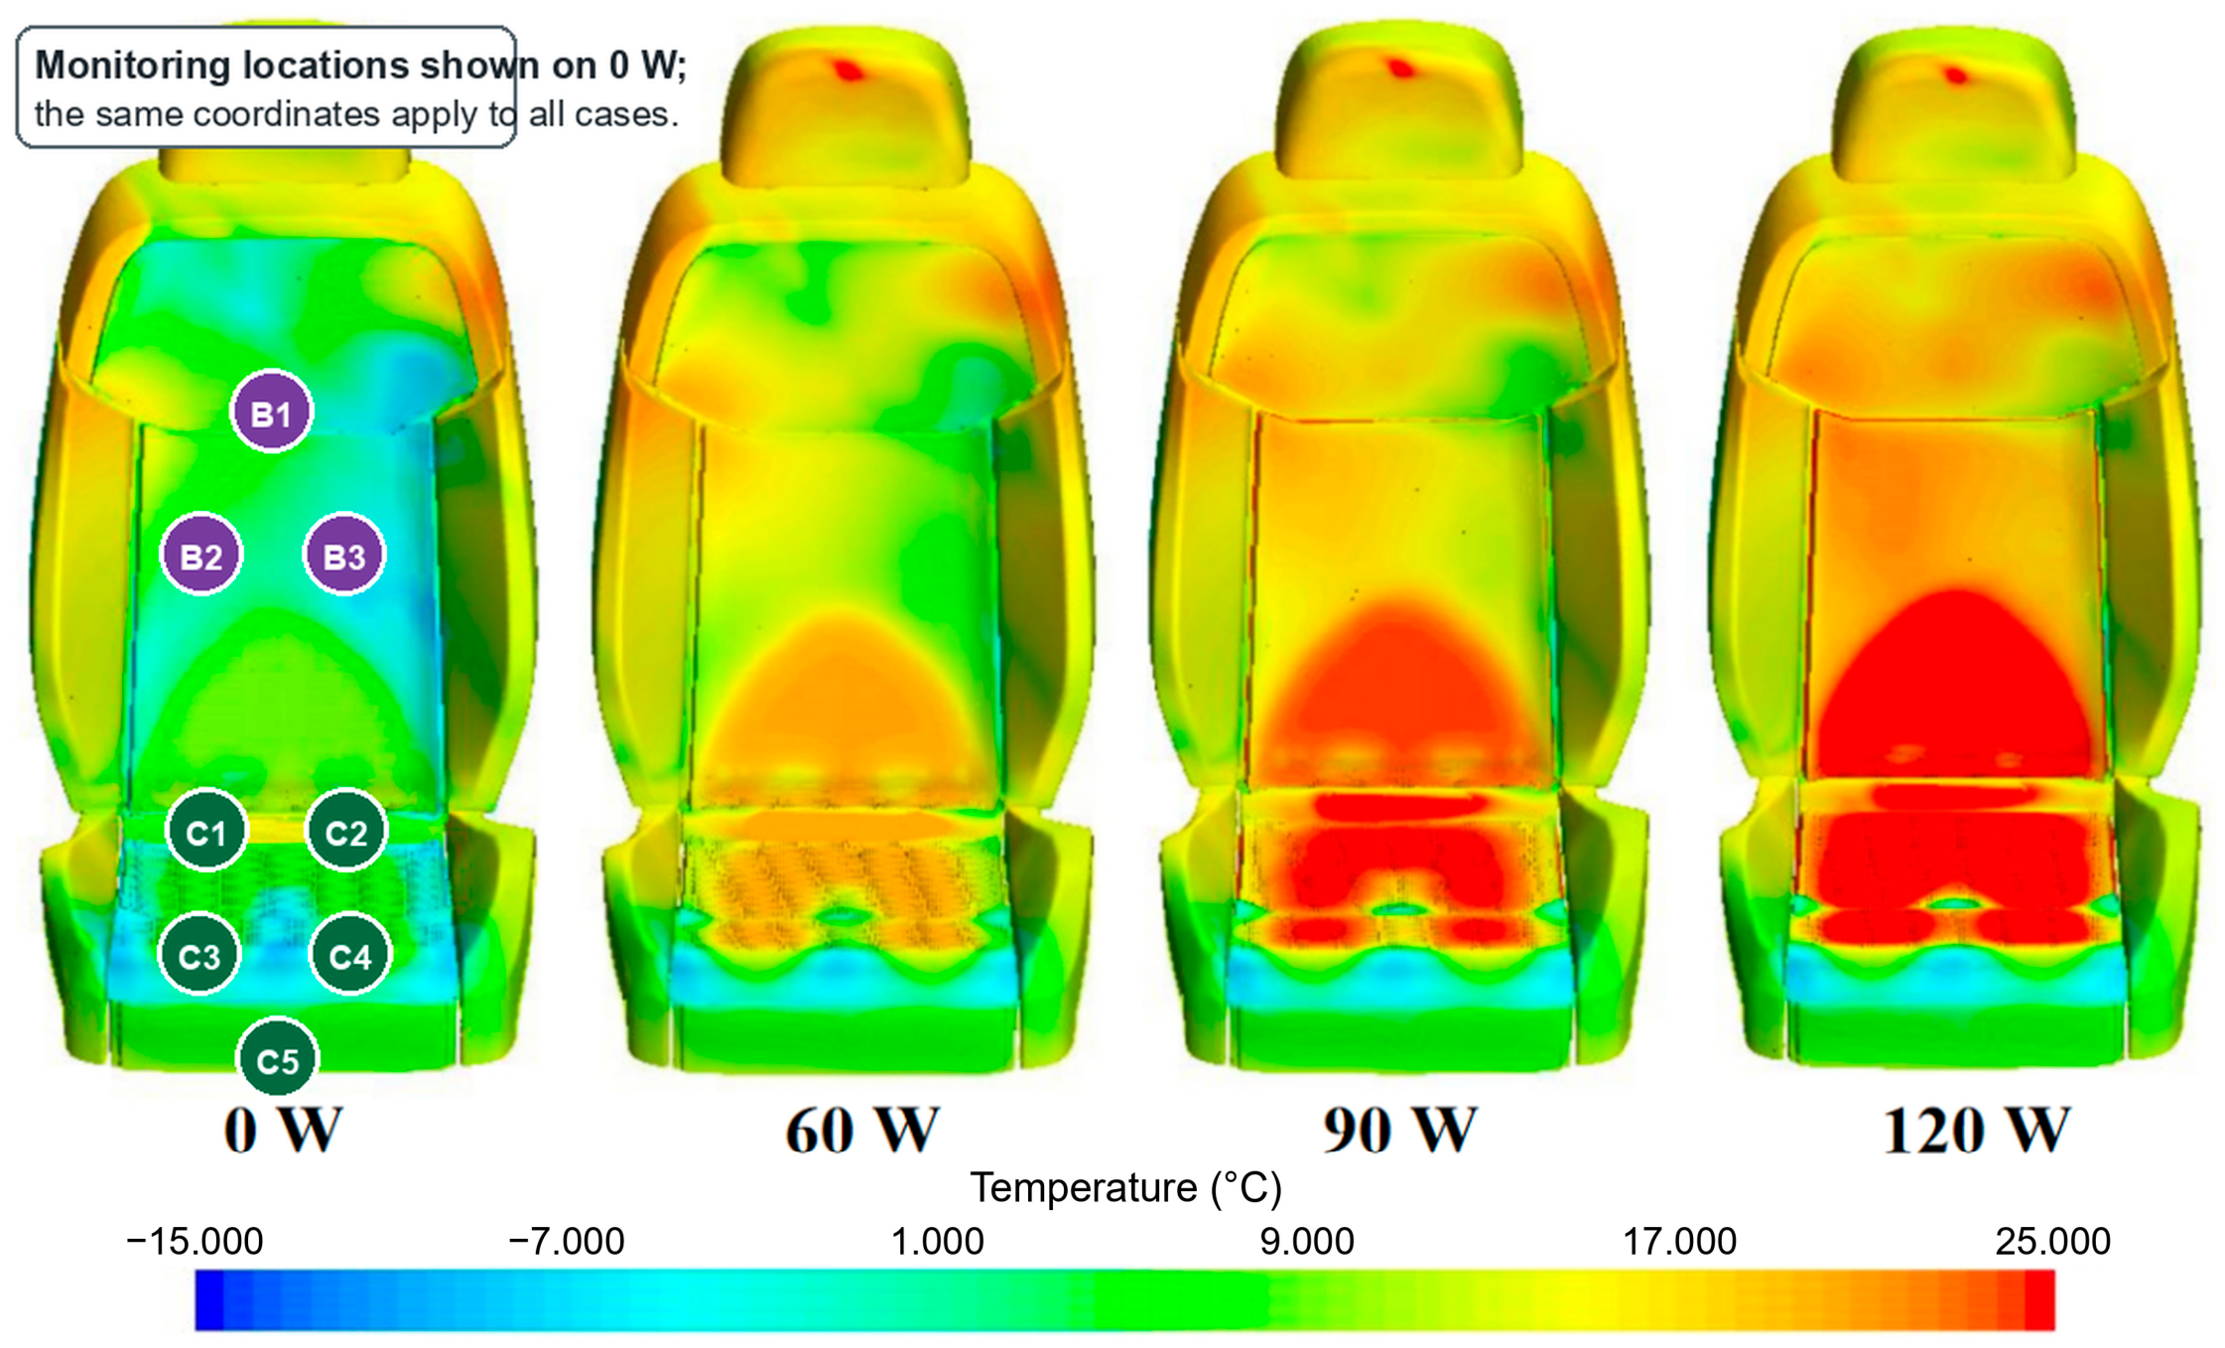
Figure 9 and Figure 10 compare the seat-surface temperature field and the temperatures at the labeled backrest (B1–B3) and cushion (C1–C5) monitoring points at t = 900 s. The coordinates shown in Figure 9 correspond to those defined in Figure 7. Increasing the heating power raises the temperature within and around the contact region, consistent with heat conduction from the porous heating-pad regions through the overlying seat layers.
Figure 9.
Driver-seat surface temperature fields at t = 900 s in winter. Monitoring locations B1–B3 and C1–C5 are identified on the 0 W case in a boxed callout; the same coordinates apply to all heating-power cases.
Figure 10.
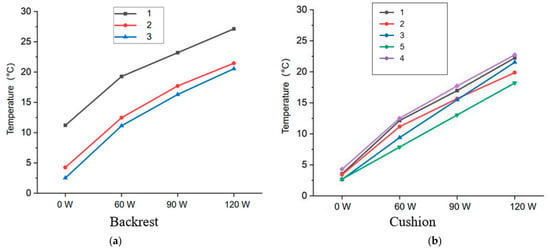
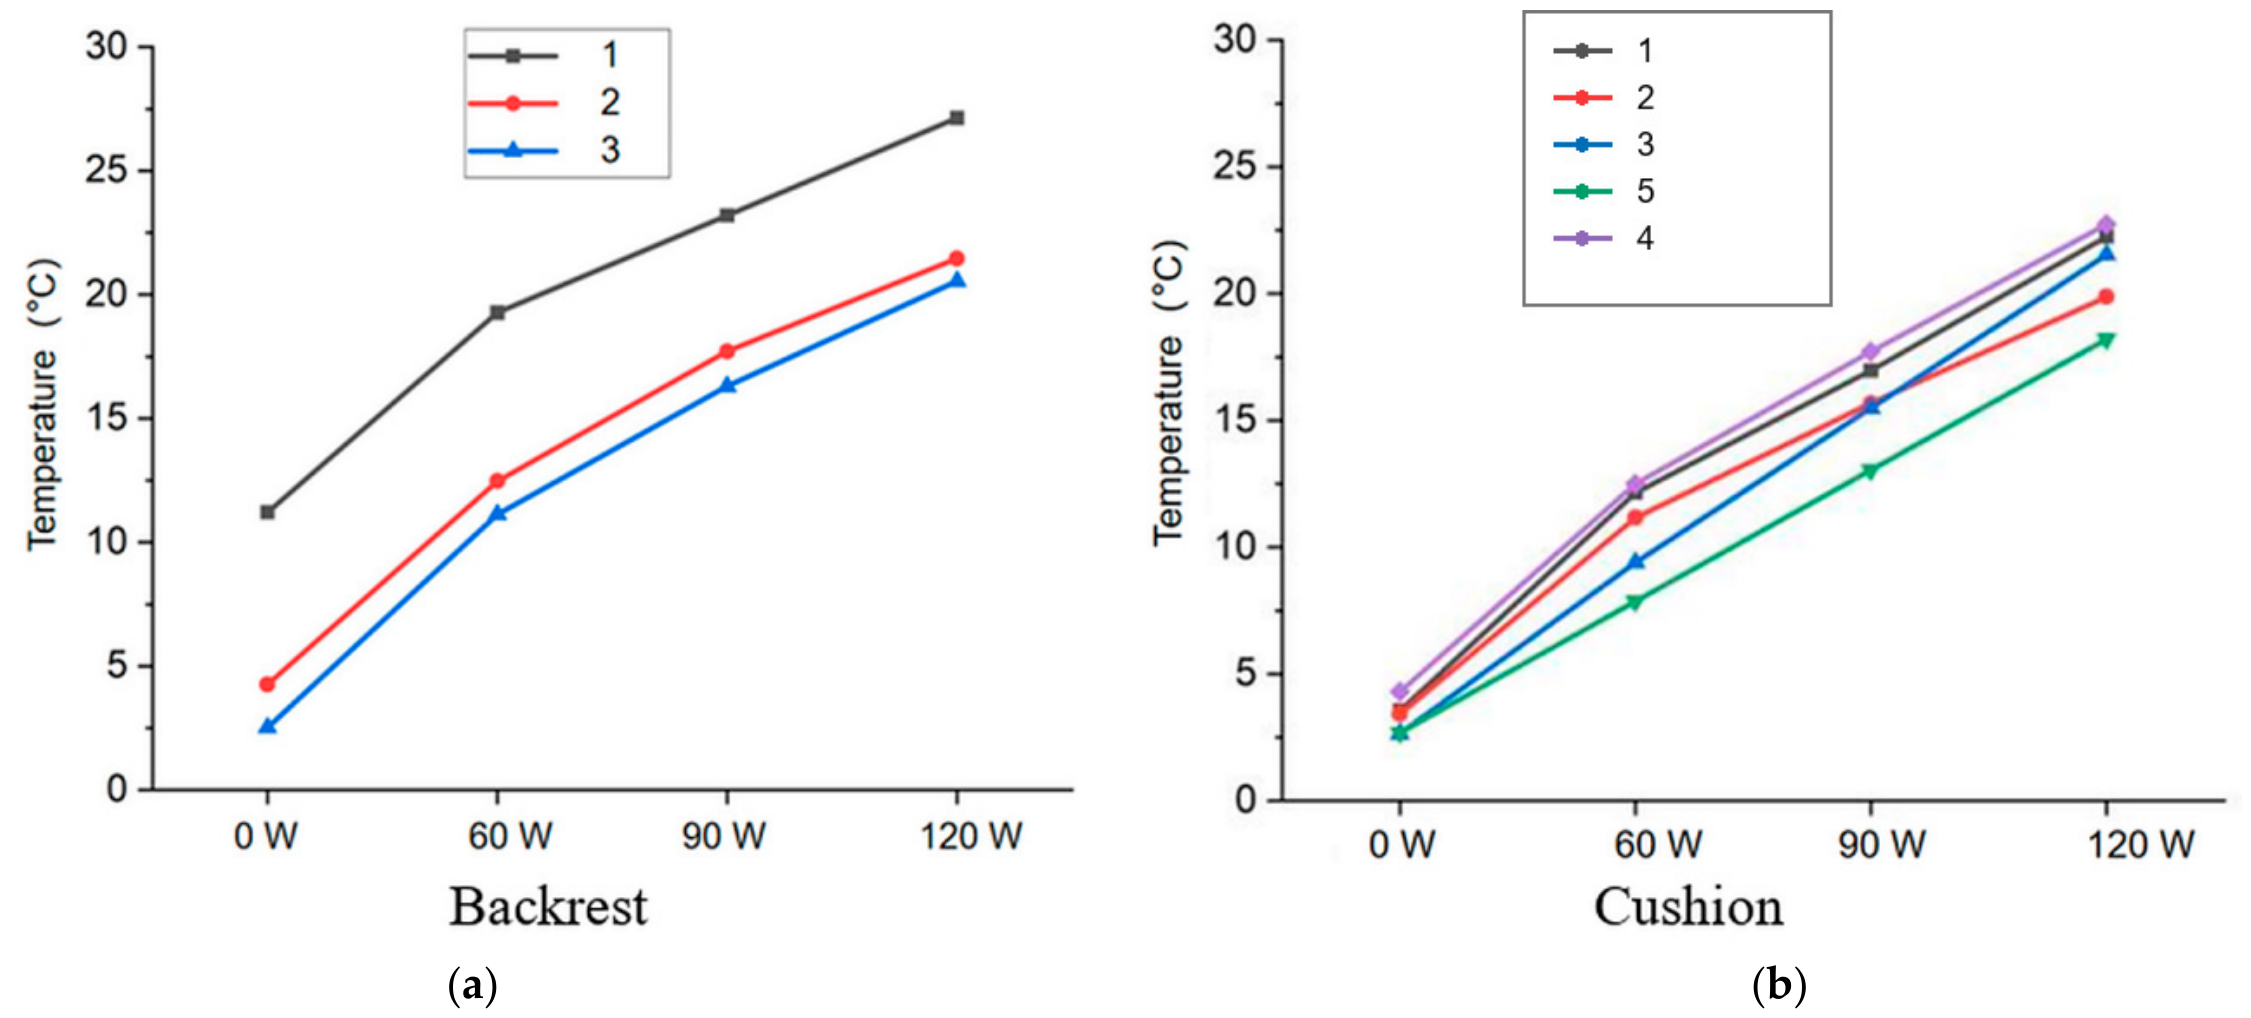
Temperatures at the seat monitoring points at t = 900 s in winter: (a) backrest monitoring points; (b) cushion monitoring points.
C5 denotes the exposed point between the thighs and has a lower cushion temperature than the covered C1–C4 locations because it is more directly exposed to cabin airflow. Differences among B1–B3 reflect variations in heating-pad coverage, occupant contact, and cabin supply airflow.
Figure 10 quantifies the temperatures at the backrest (B1–B3) and cushion (C1–C5) monitoring points at t = 900 s. The backrest temperatures [Figure 10a] are relatively uniform, although B2 is slightly warmer than B1 and B3 because its central position provides more direct occupant contact and greater coverage by the main heating pad.
For the cushion points [Figure 10b], C1–C4 lie within or near the thigh-cushion contact region and exhibit higher temperatures that increase with heating power, whereas C5 lies in the exposed region between the thighs and remains cooler. This contrast indicates that seat heating is most effective where the occupant maintains sustained contact with the multilayer seat.
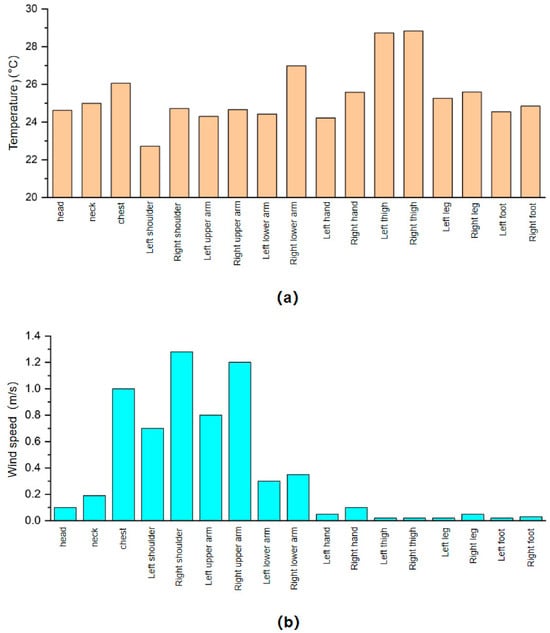
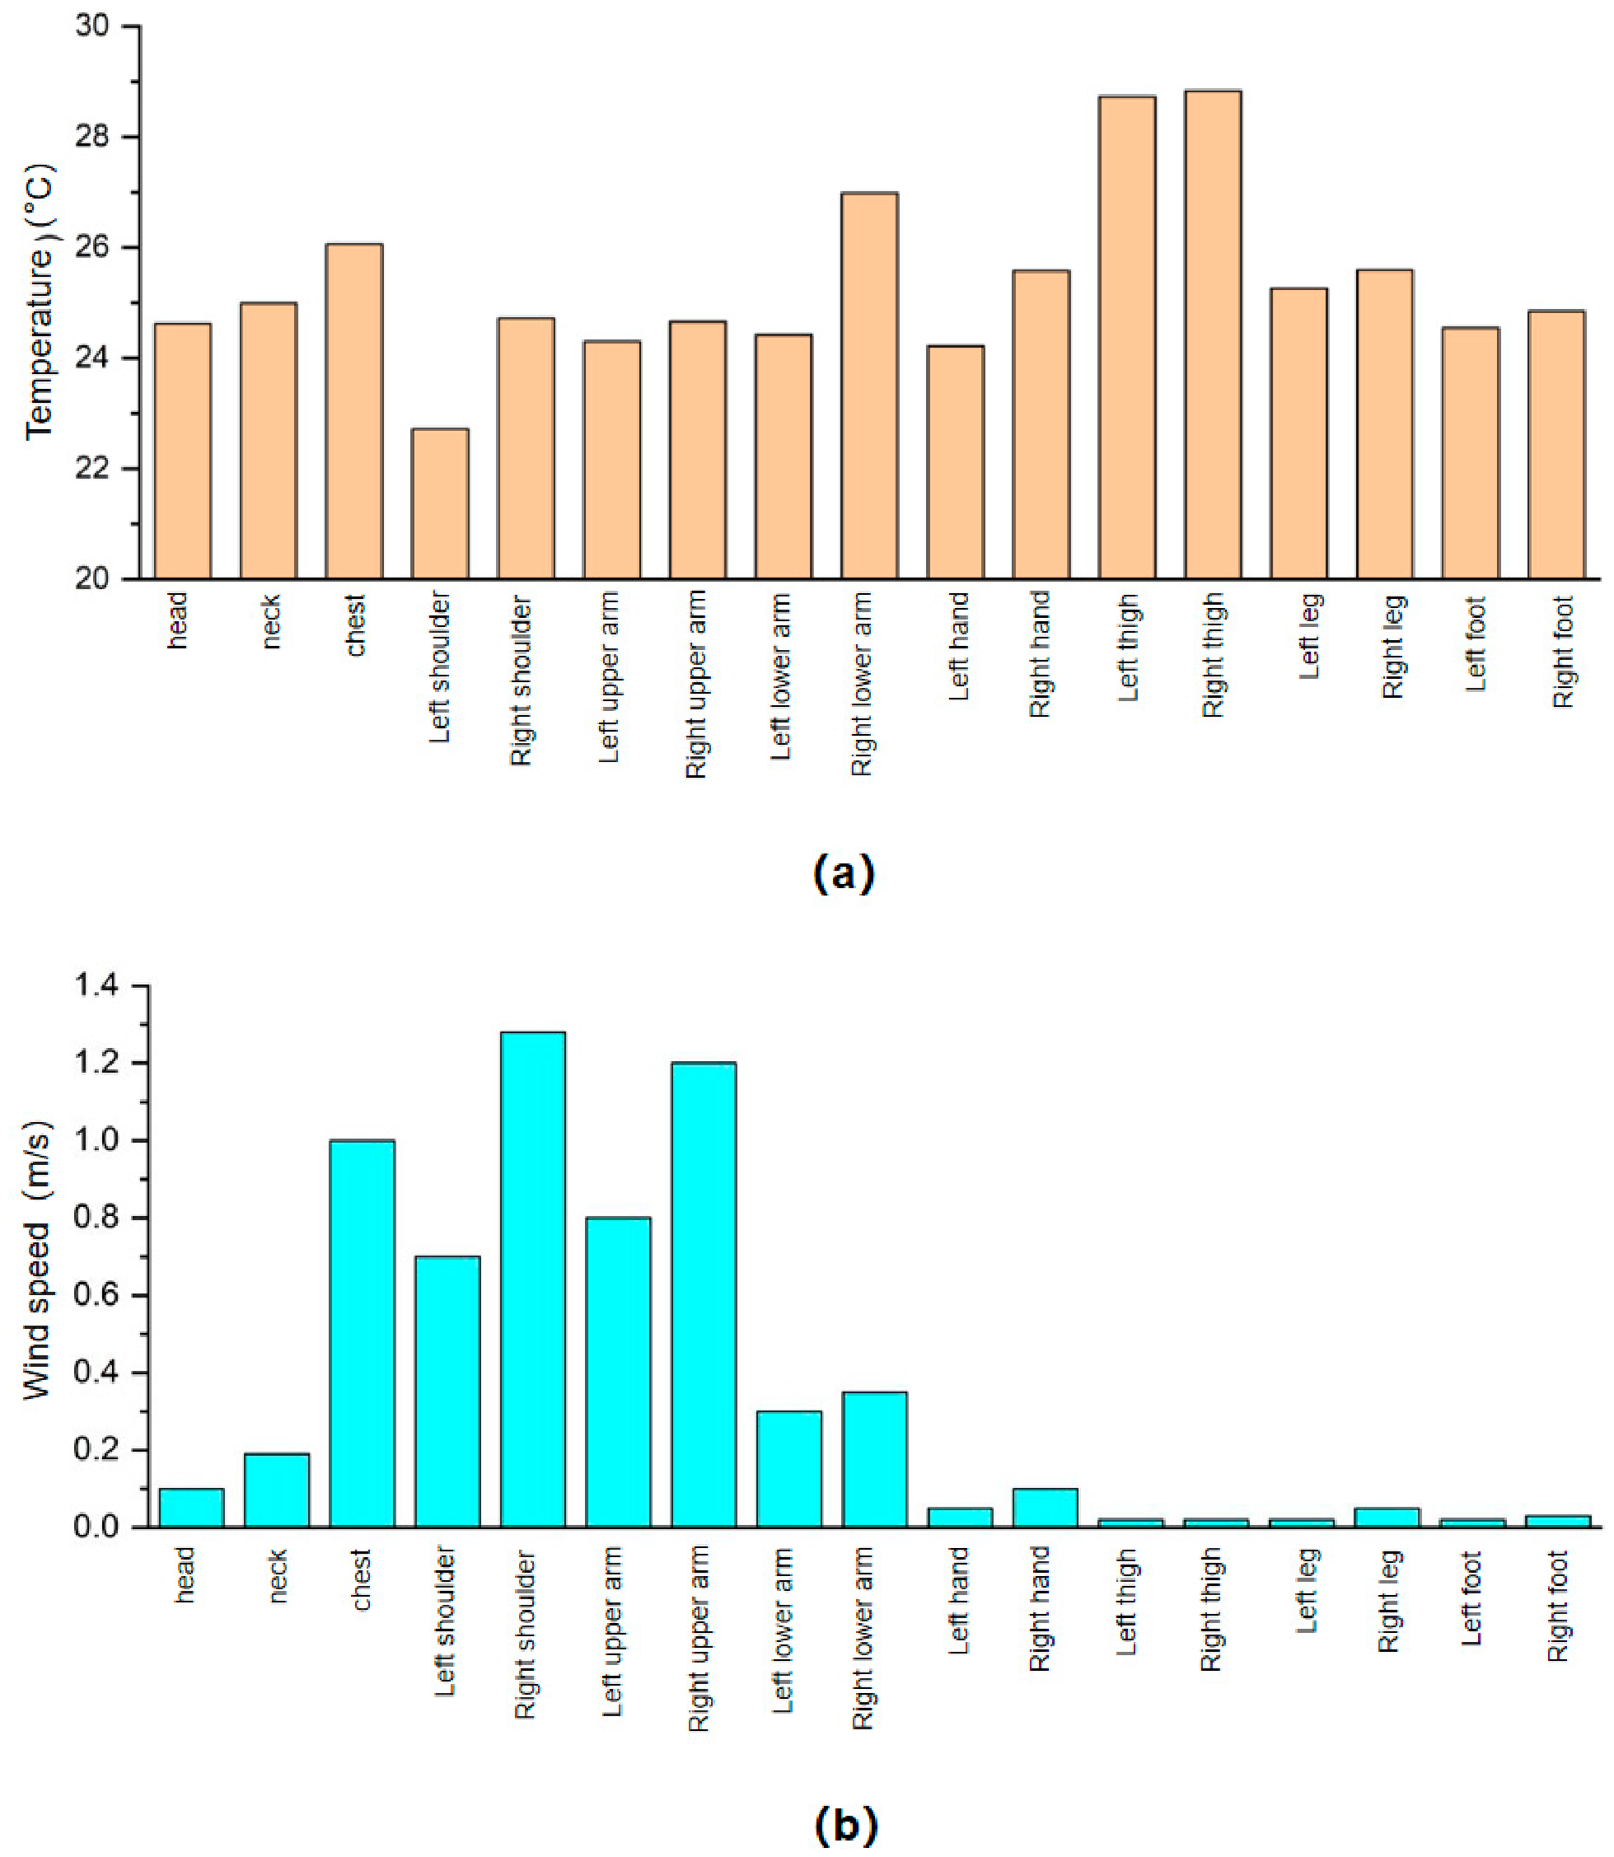
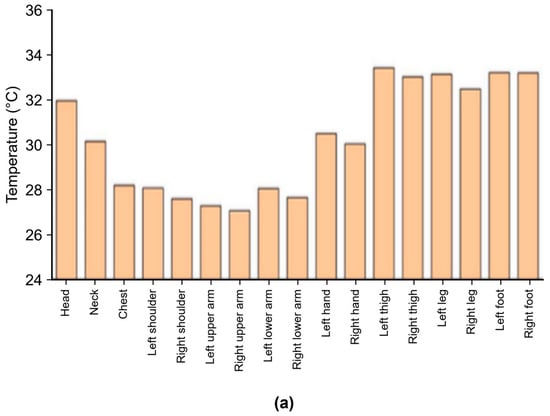
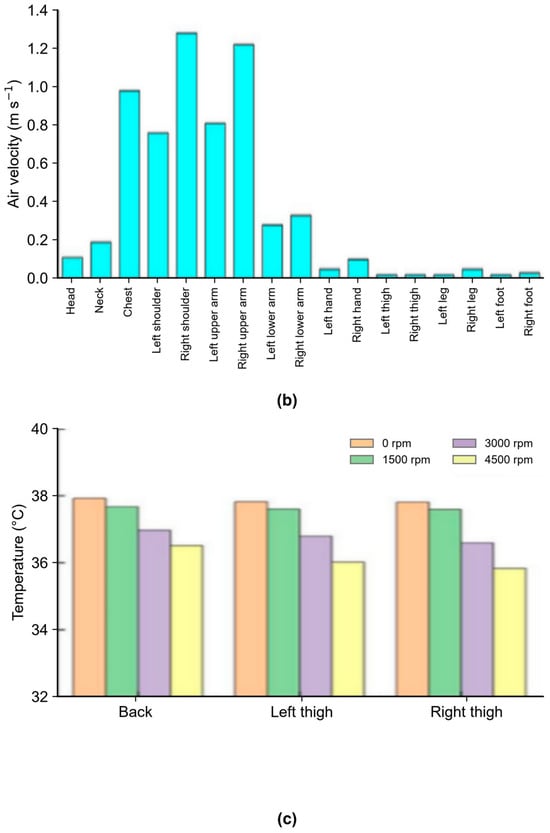
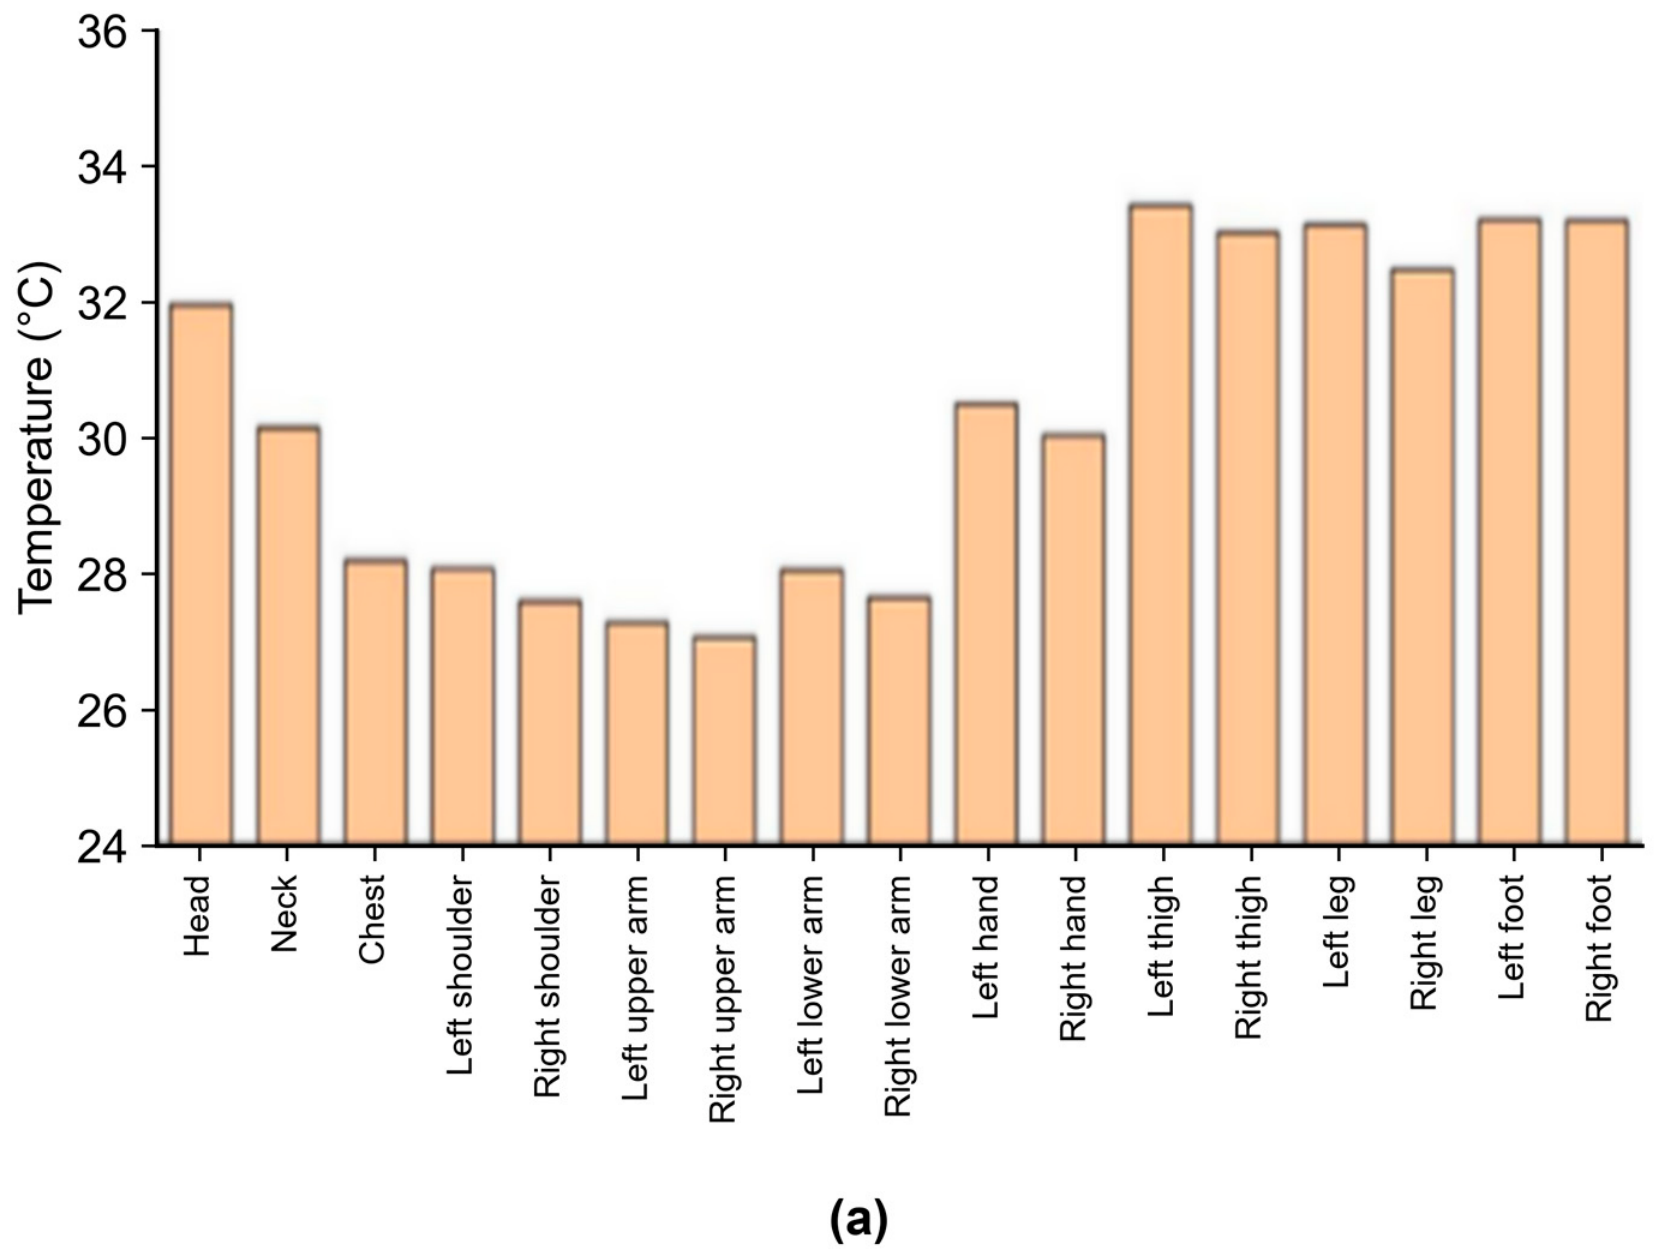
Figure 11a,b show the local air temperature and velocity adjacent to the front of each body segment at t = 900 s. Exposed skin regions are generally cooler than clothed regions. The upper body lies within the direct HVAC supply path and therefore experiences higher local velocities than the lower body; right-side segments are also closer to the outlets than their left-side counterparts. Temperature and velocity must be interpreted together because local convective heat transfer depends on both the air surface temperature difference and the velocity-dependent heat-transfer coefficient. In winter, higher velocity can increase heat transfer from warm supply air, but it can also produce local cooling or draft when the air is cooler than the body surface.
Figure 11.
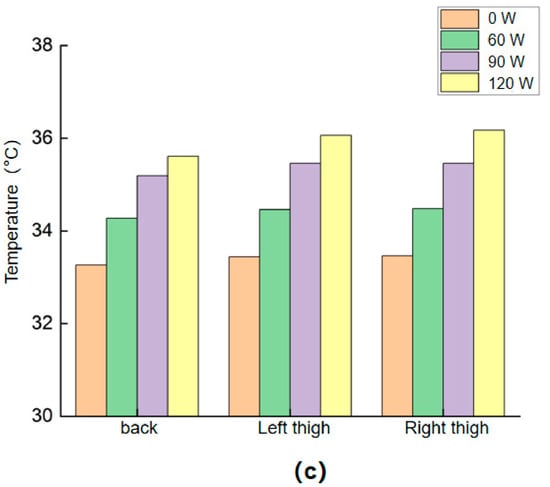
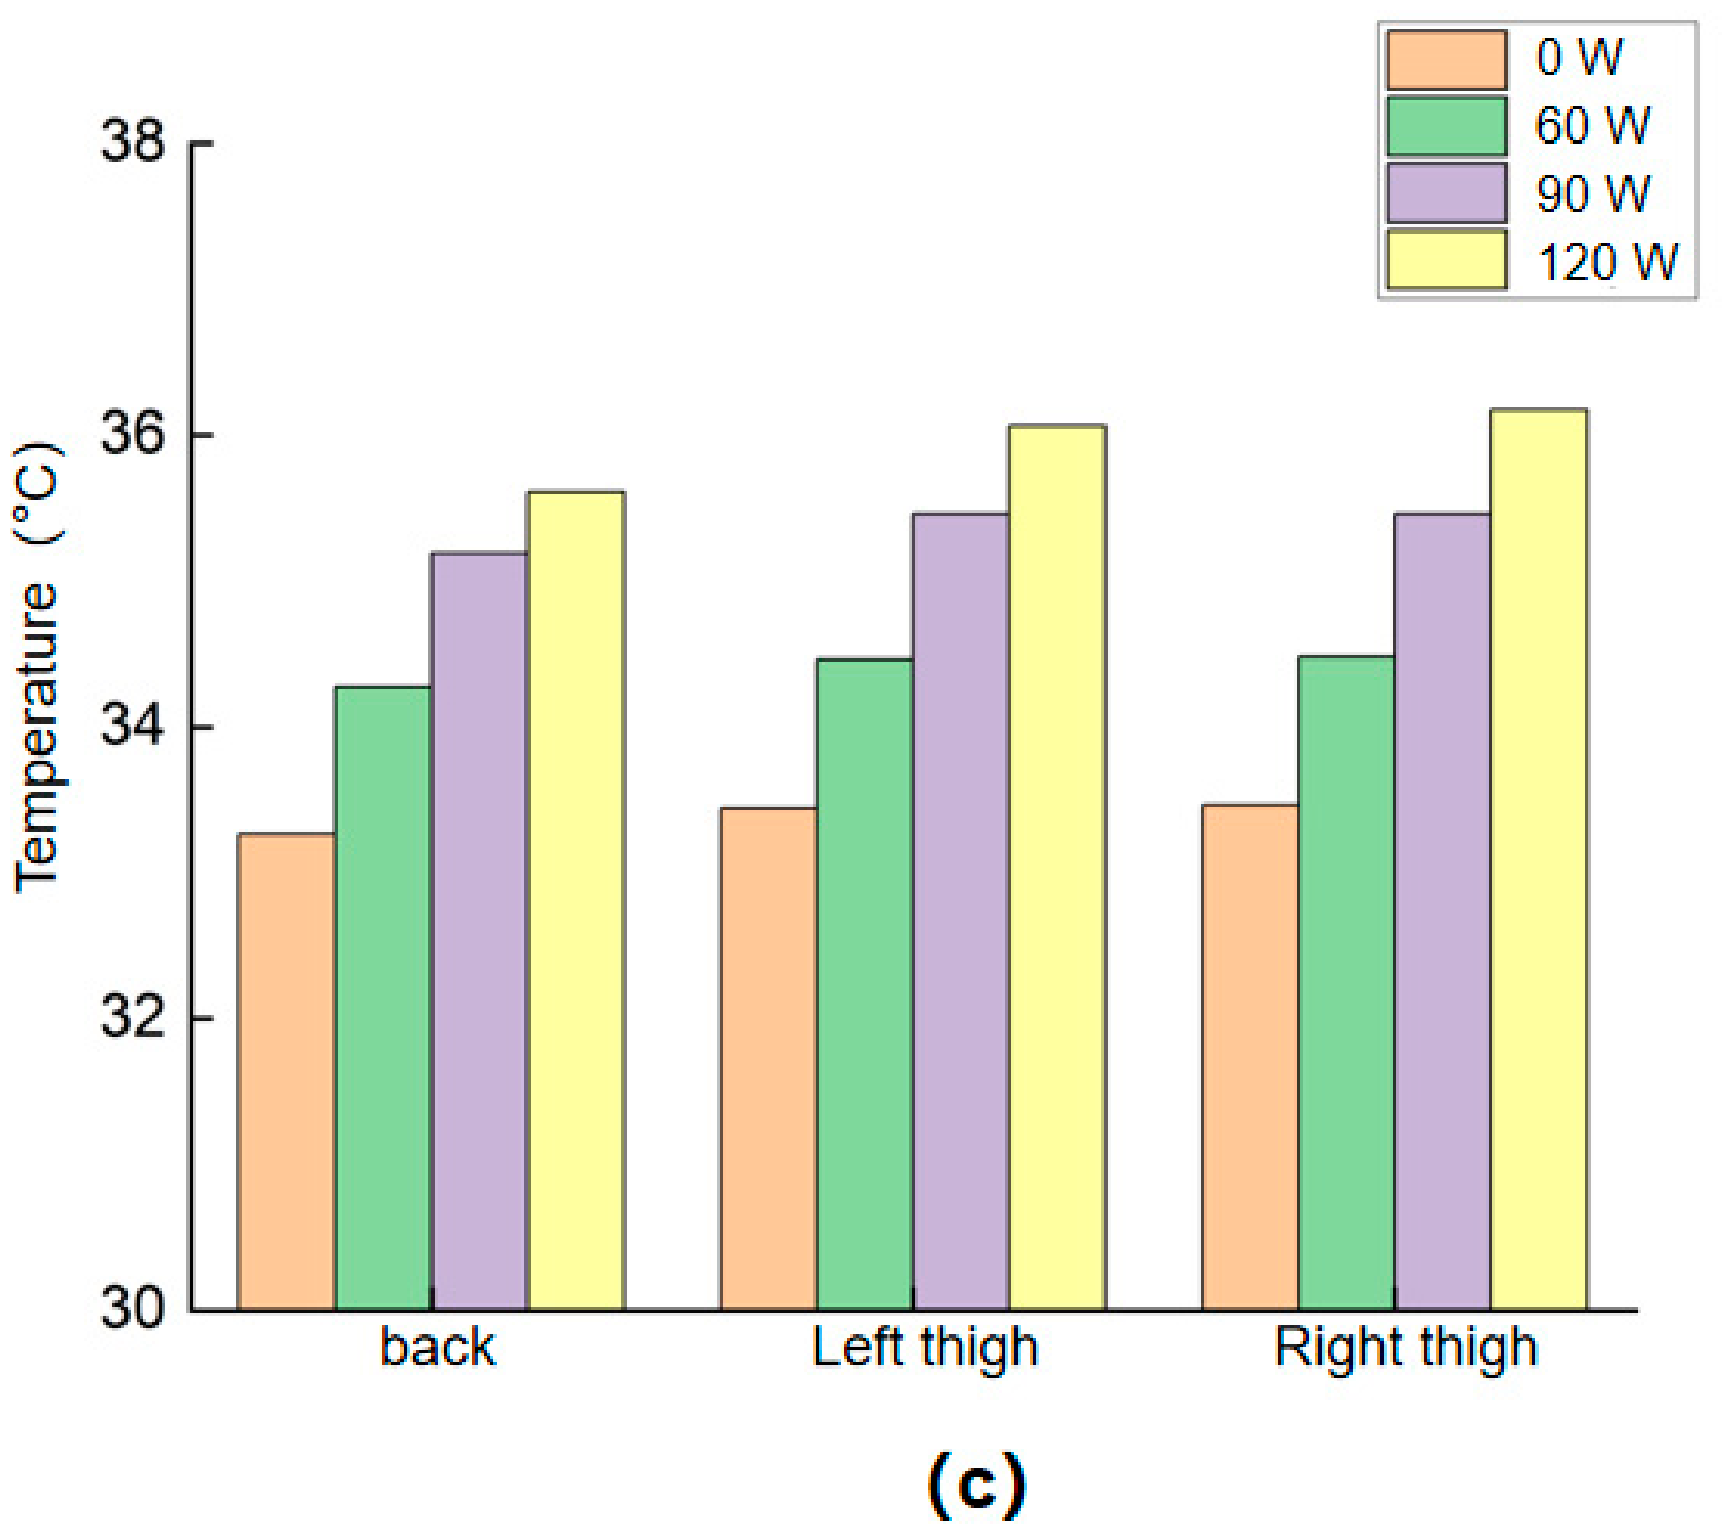
Occupant thermal and airflow fields at t = 900 s in winter: (a) air temperature adjacent to the clothing surface; (b) local air velocity over the anterior body segments; (c) skin temperature at the interface.
Figure 11c shows that increasing the seat-heating power raises the calculated skin temperature in the thigh cushion and backrest contact regions, with little effect on the airflow over the front of the body. This result indicates a stronger local thermal stimulus at the contact surface. However, temperature and velocity alone cannot establish a quantitative improvement in thermal sensation or comfort because the present model does not calculate local or whole-body sensation and has not been validated against subjective votes or physiological measurements.
4.2. Seat-Ventilation Results
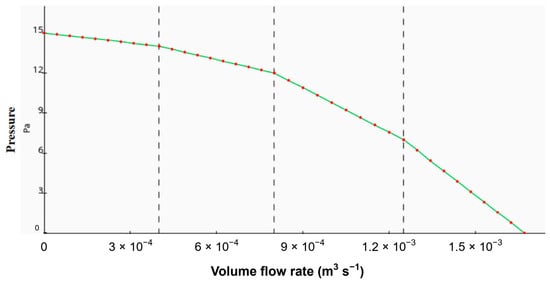
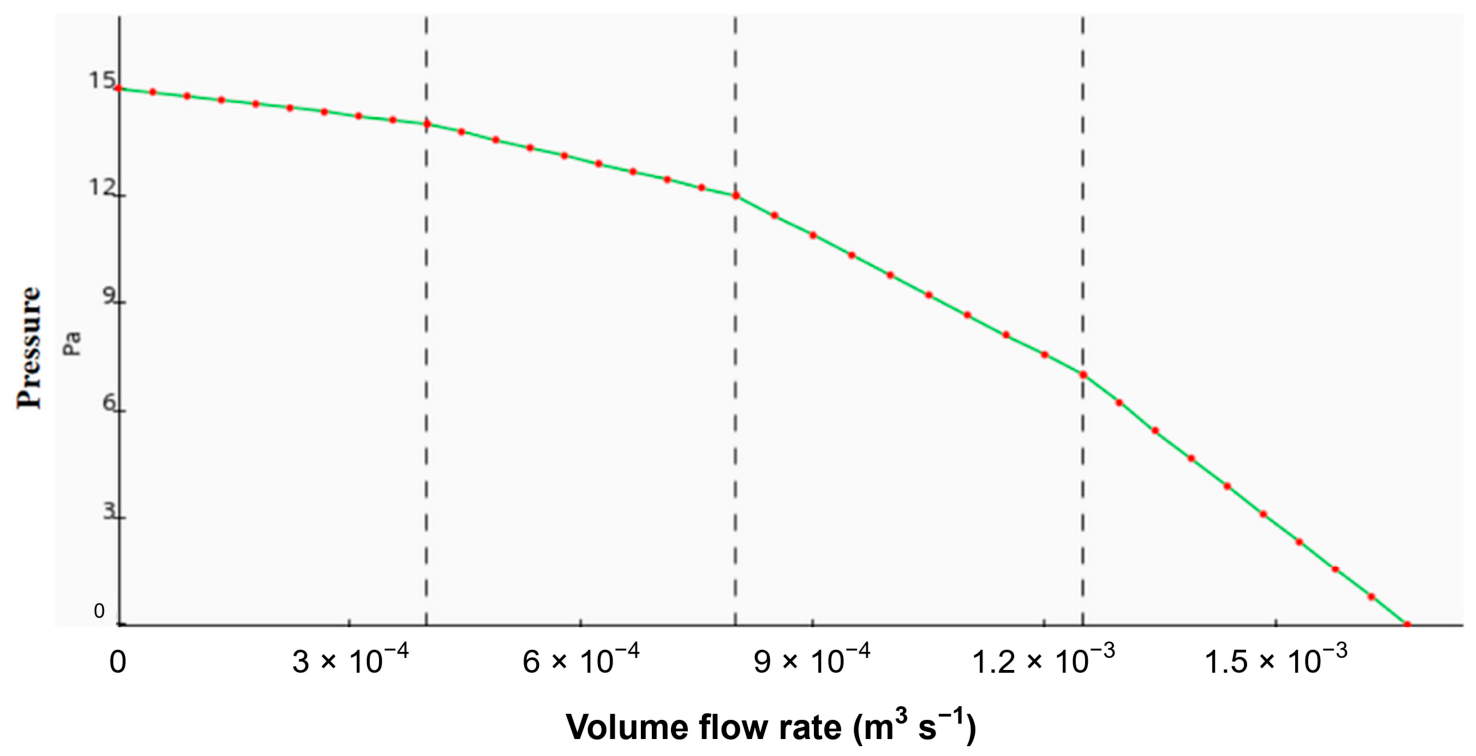
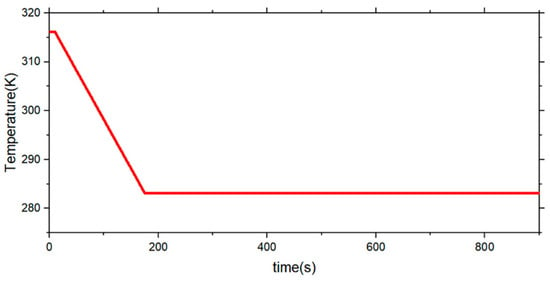
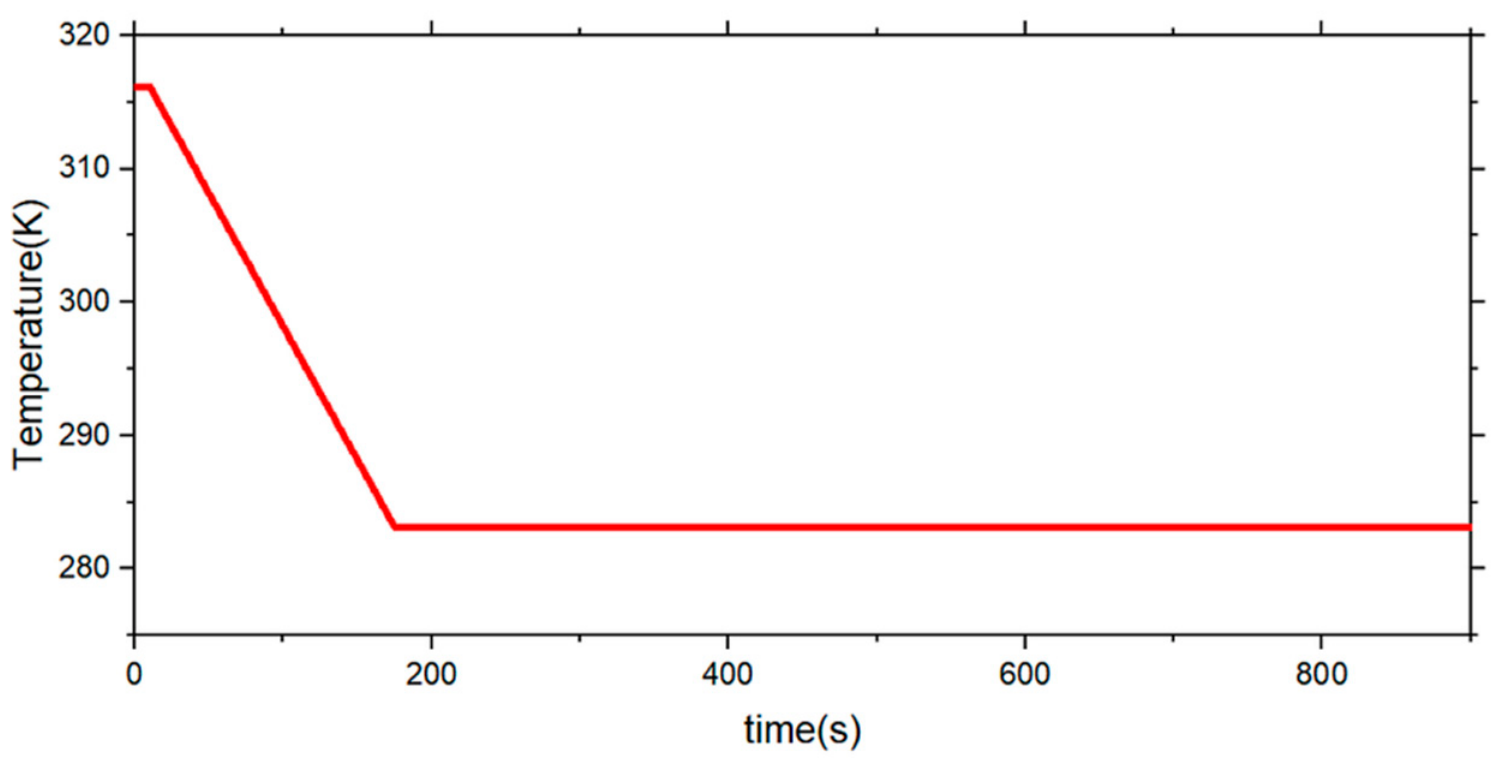
This section compares the effects of seat-ventilation fan speed under a common summer HVAC condition. One fan interface was defined for the cushion and another for the backrest; both used the experimentally measured pressure flow characteristic shown in Figure 12. The simulated fan speeds were 0, 1500, 3000, and 4500 rpm. The cabin supply-air velocity was 3 m/s, and the prescribed summer supply-air temperature history is shown in Figure 13. The ventilation system draws cabin air through the perforated leather and porous sponge into the internal seat ducts.
Figure 12.
Measured pressure—flow curve of the seat-ventilation fan.
Figure 13.
Prescribed cabin supply-air temperature profile for the summer cases.
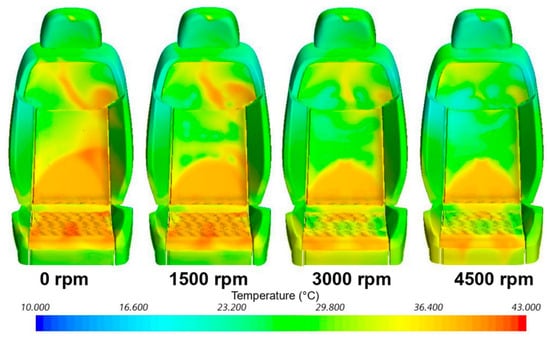
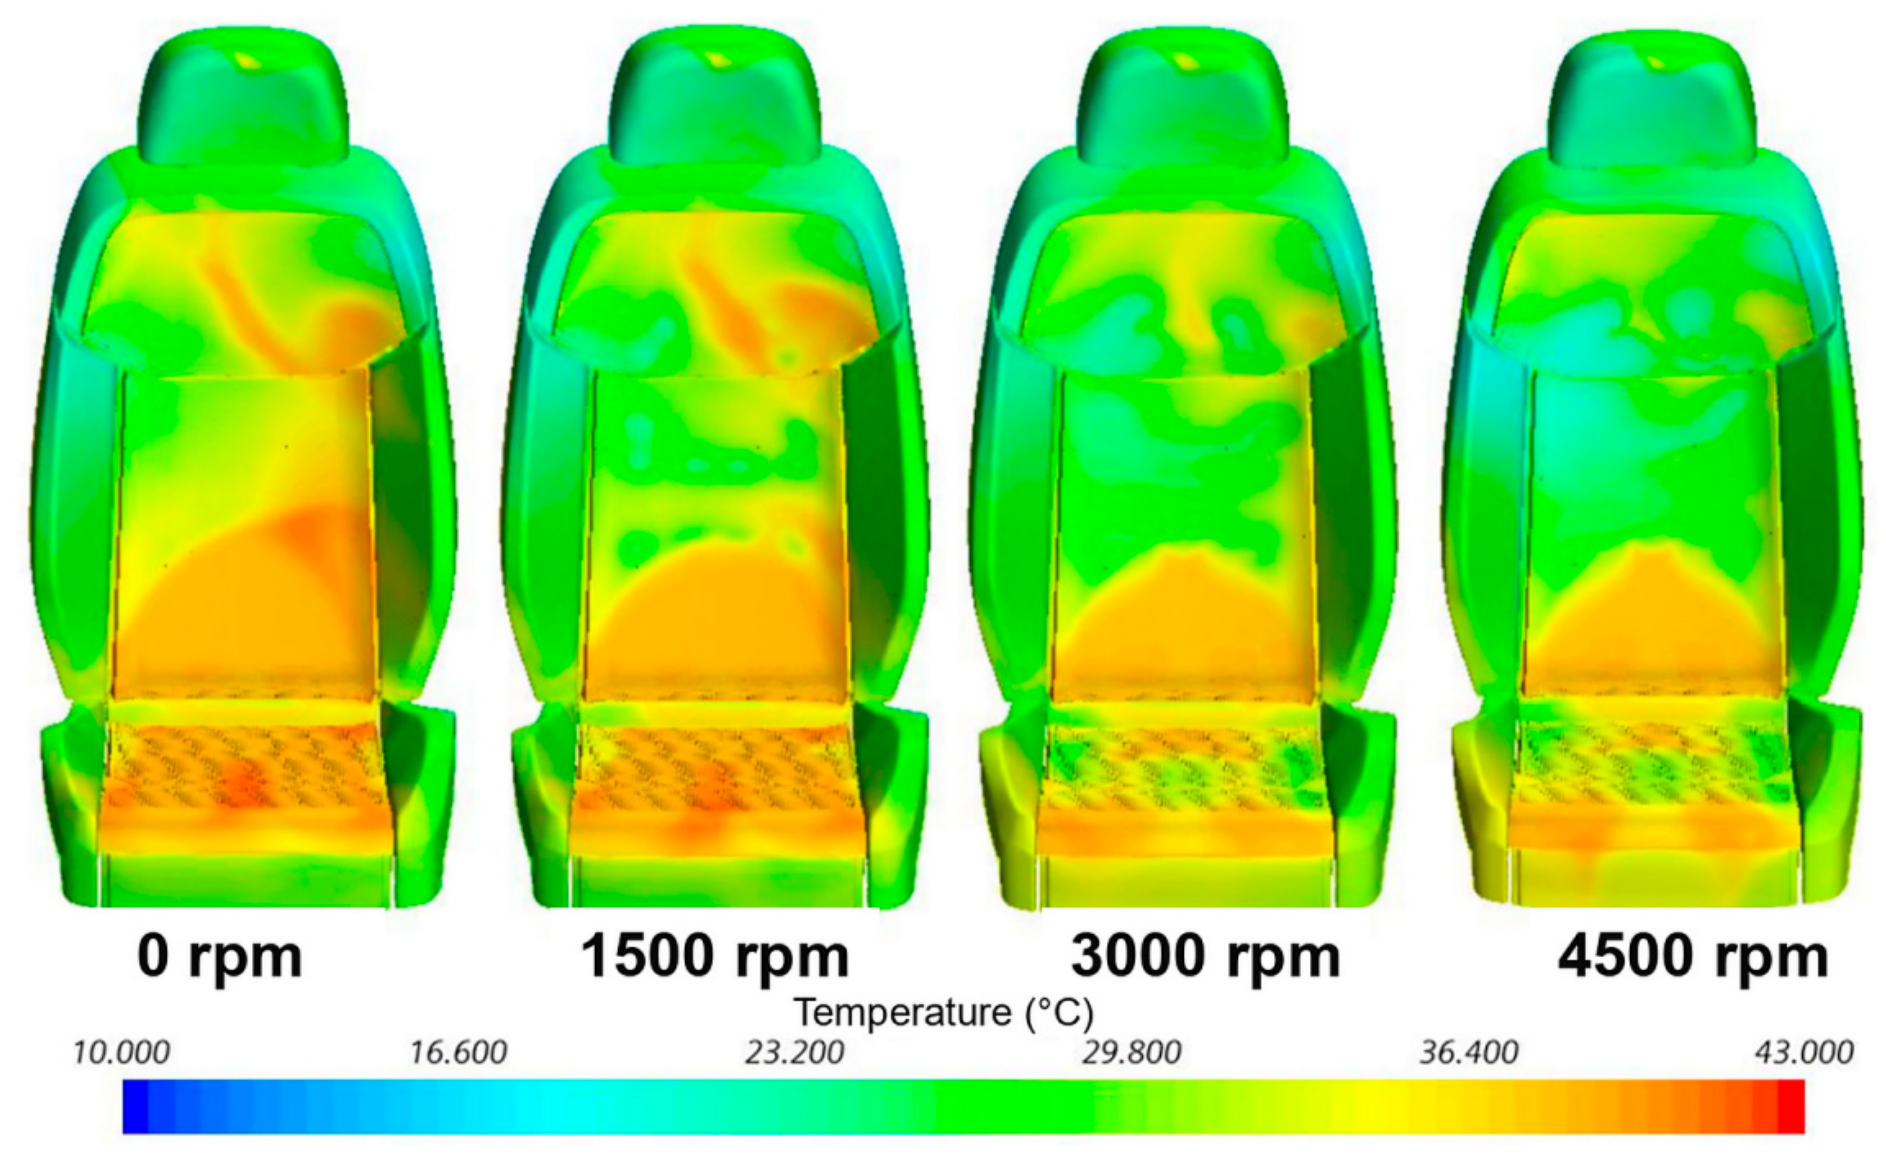
Figure 14 presents the seat-surface temperature fields at t = 900 s for fan speeds of 0, 1500, 3000, and 4500 rpm. The contact region remains warmer than the exposed seat surfaces because contact restricts convective heat exchange. Increasing the fan speed progressively cools the interface. Because the backrest ducts are concentrated in the upper region, their coverage of the lower back is limited, whereas the cushion ducts are distributed more uniformly. The backrest contact region therefore remains slightly warmer and cools more slowly than the thigh cushion contact region.
Figure 14.
Driver-seat surface temperature fields at t = 900 s in summer for fan speeds of 0, 1500, 3000, and 4500 rpm.
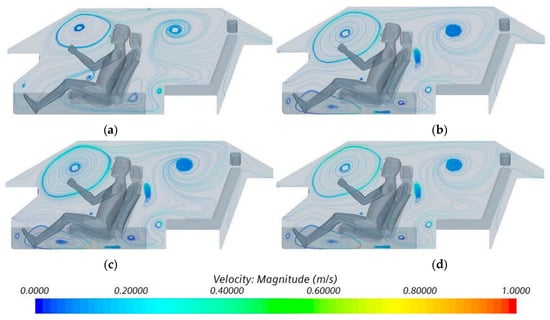
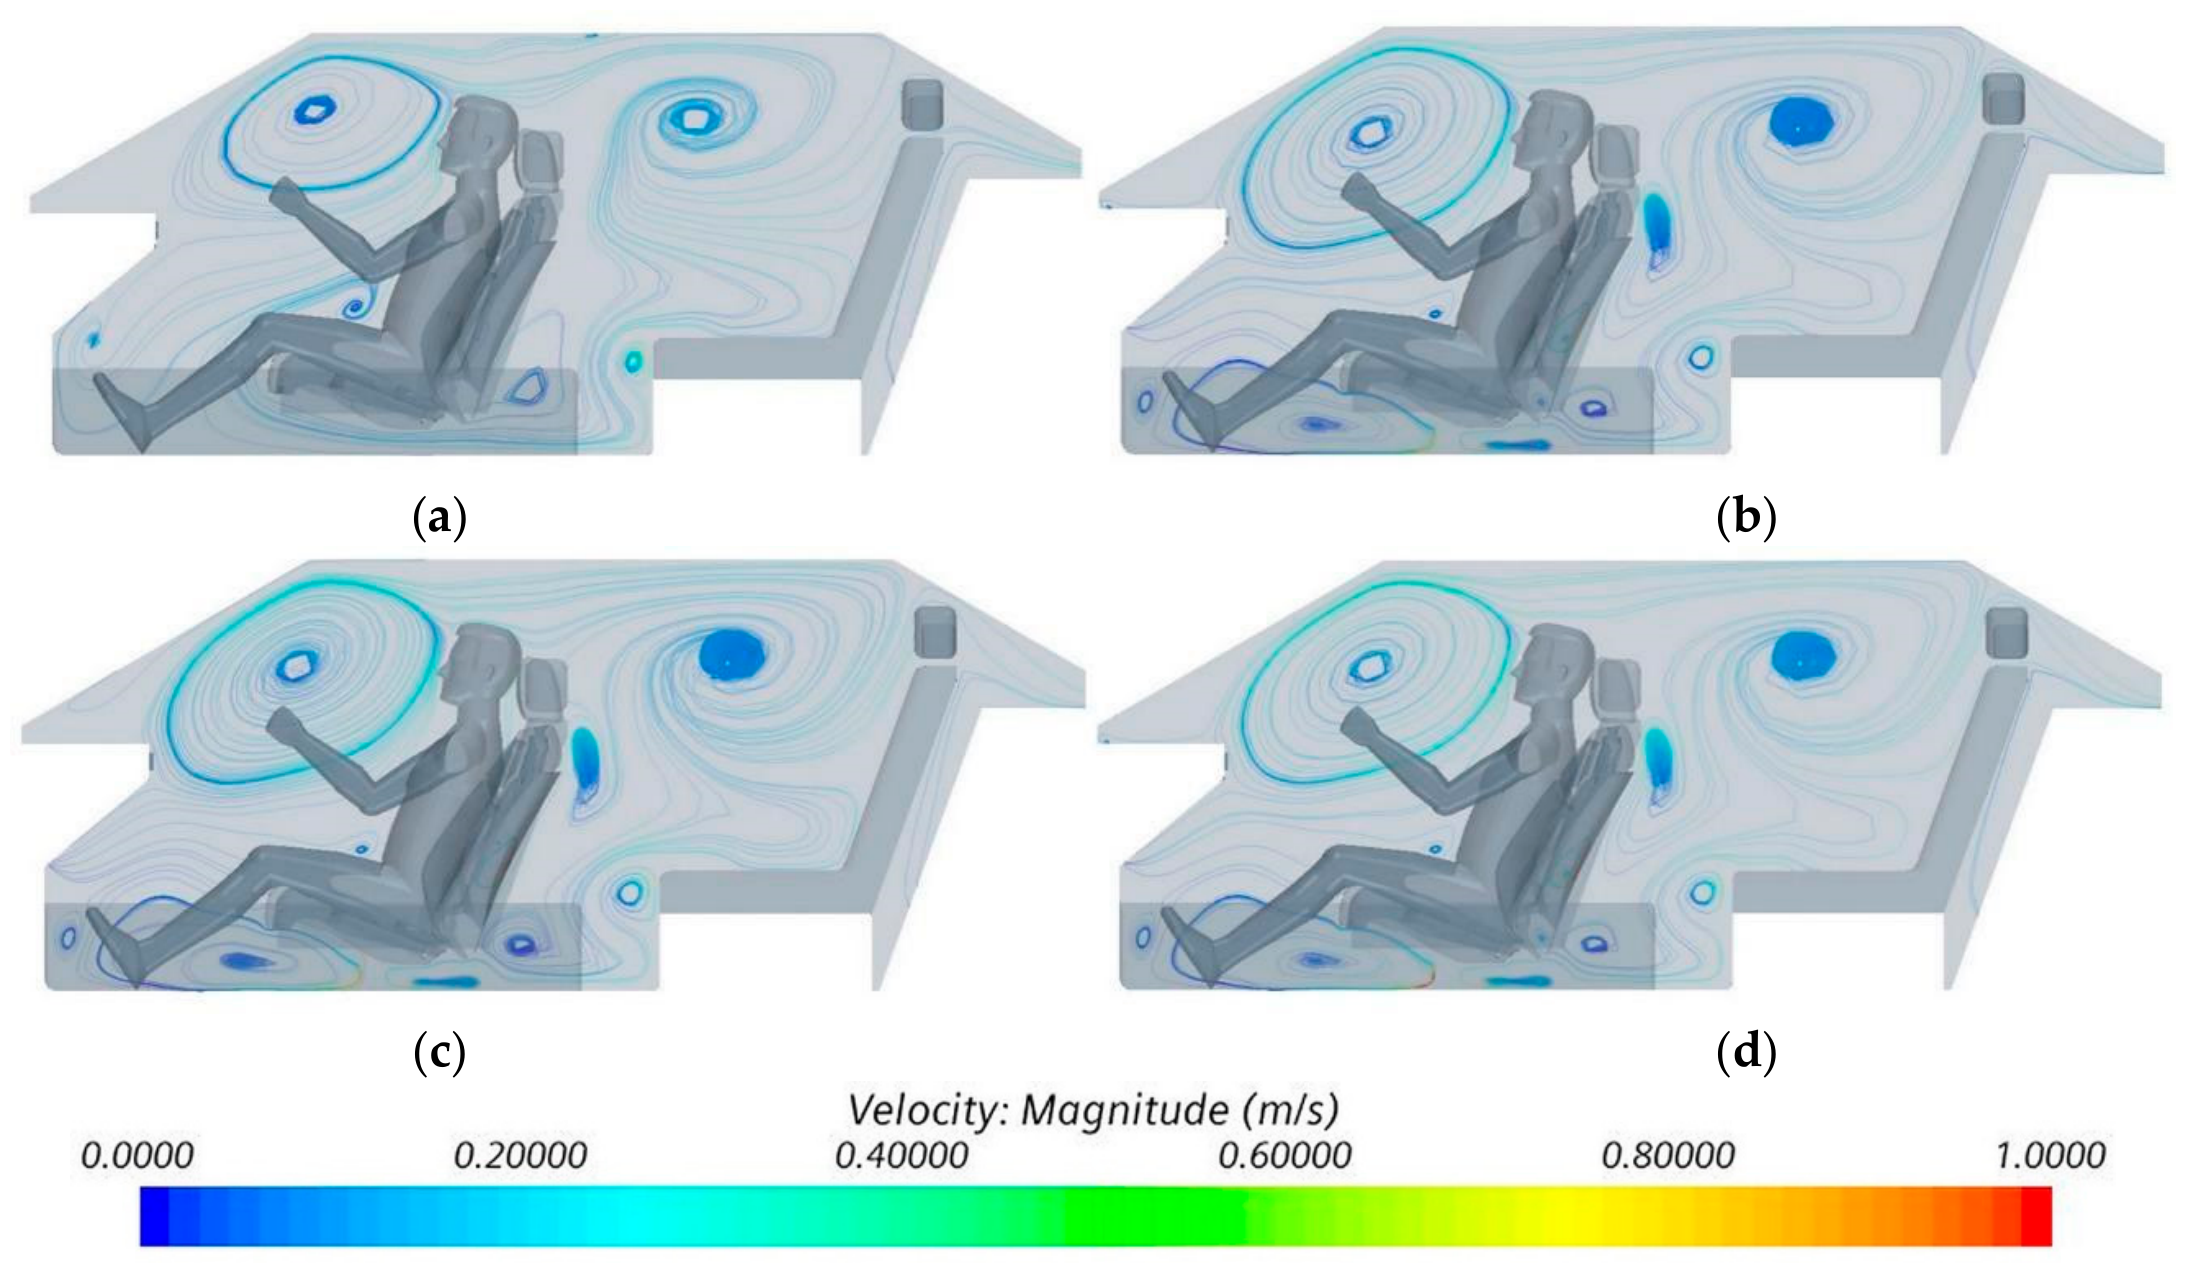
Figure 15 compares the cabin airflow patterns at t = 900 s. In the 0 rpm case, the HVAC jet first reaches the upper body and produces a recirculation region in front of the occupant. Part of the flow then travels along the roof toward the rear outlet, while another portion recirculates near the rear seat and lower legs. Activating seat ventilation introduces local suction through the seat and alters the nearby recirculation pattern, but the lower-leg velocities listed in Table 3 change only slightly. Within the simulated operating range, seat ventilation therefore has a much stronger local effect at the interface than on the airflow over the front of the occupant.
Figure 15.
Passenger-cabin airflow patterns at t = 900 s: (a) 0 rpm; (b) 1500 rpm; (c) 3000 rpm; (d) 4500 rpm.
Table 3.
Local air velocity over the lower legs under different seat-ventilation conditions at t = 900 s.
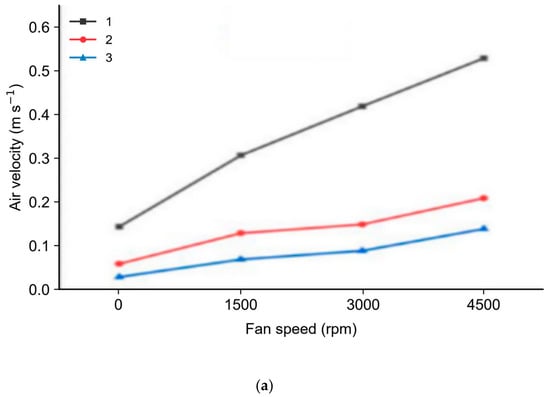
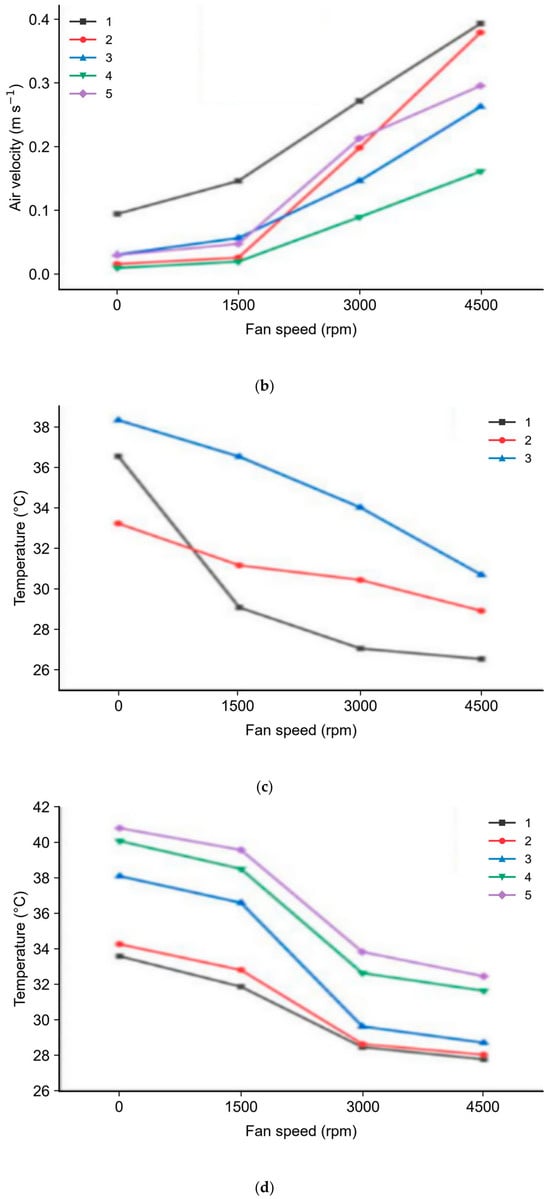
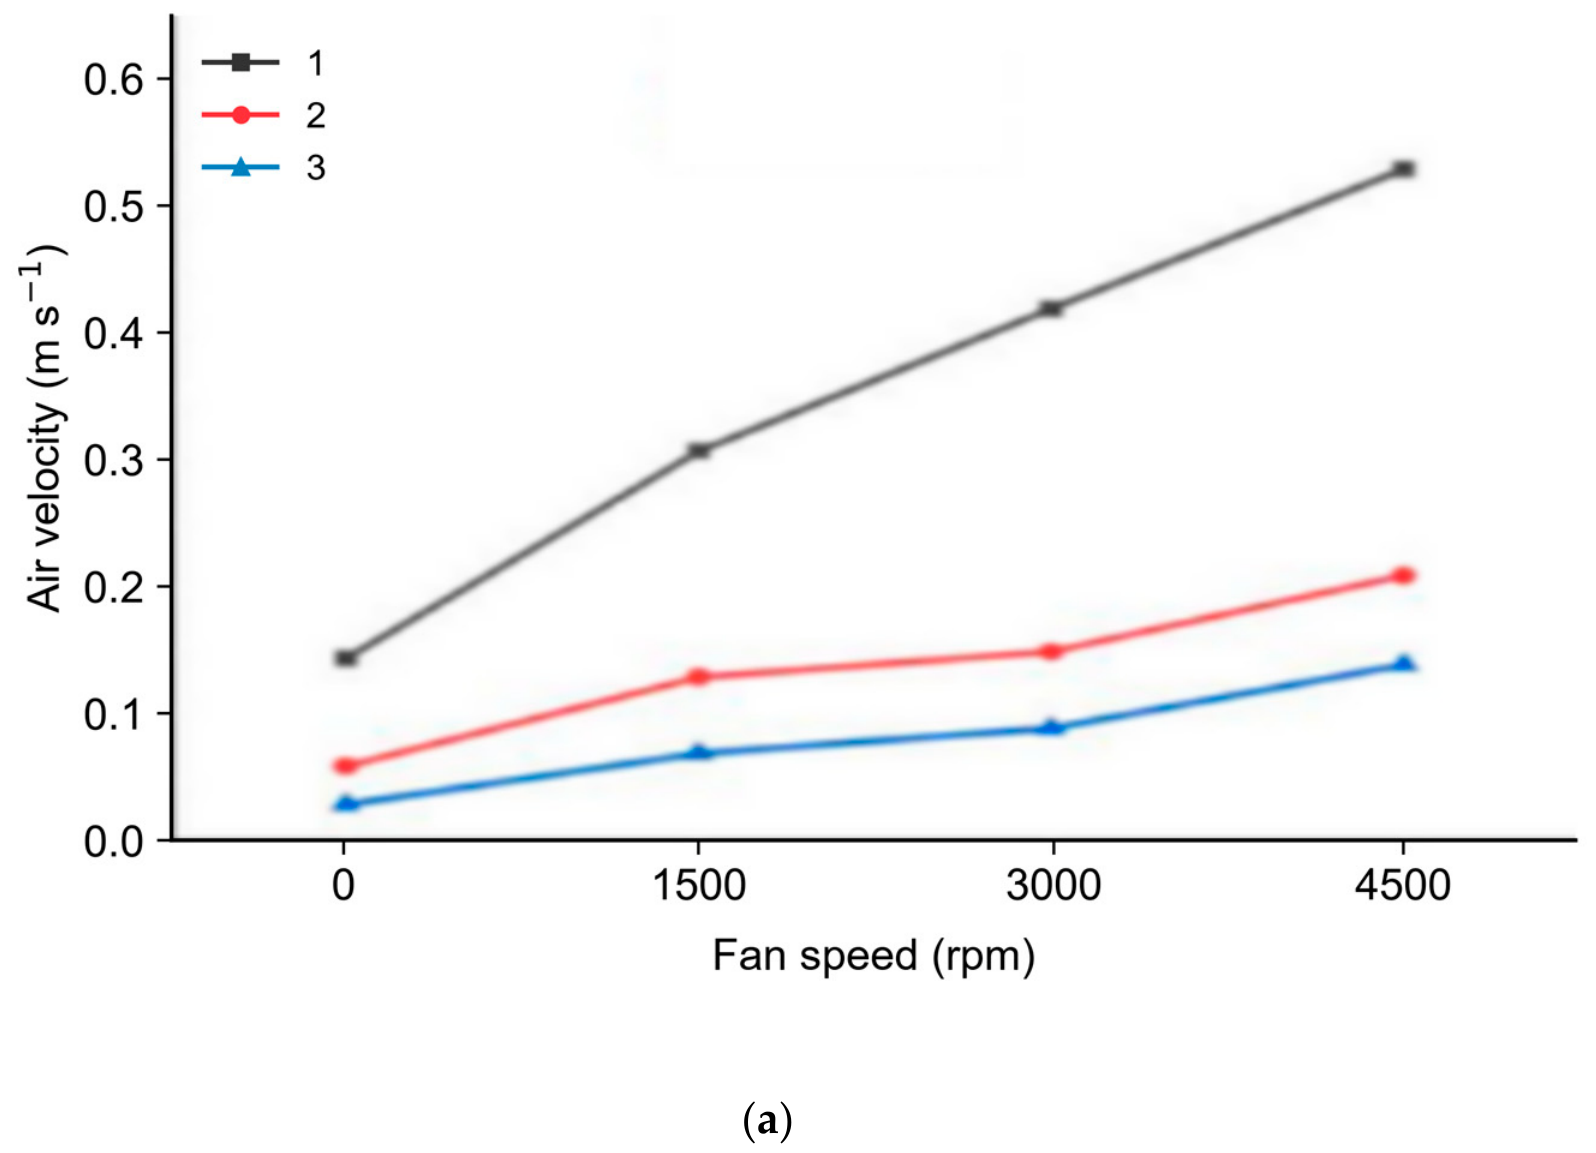
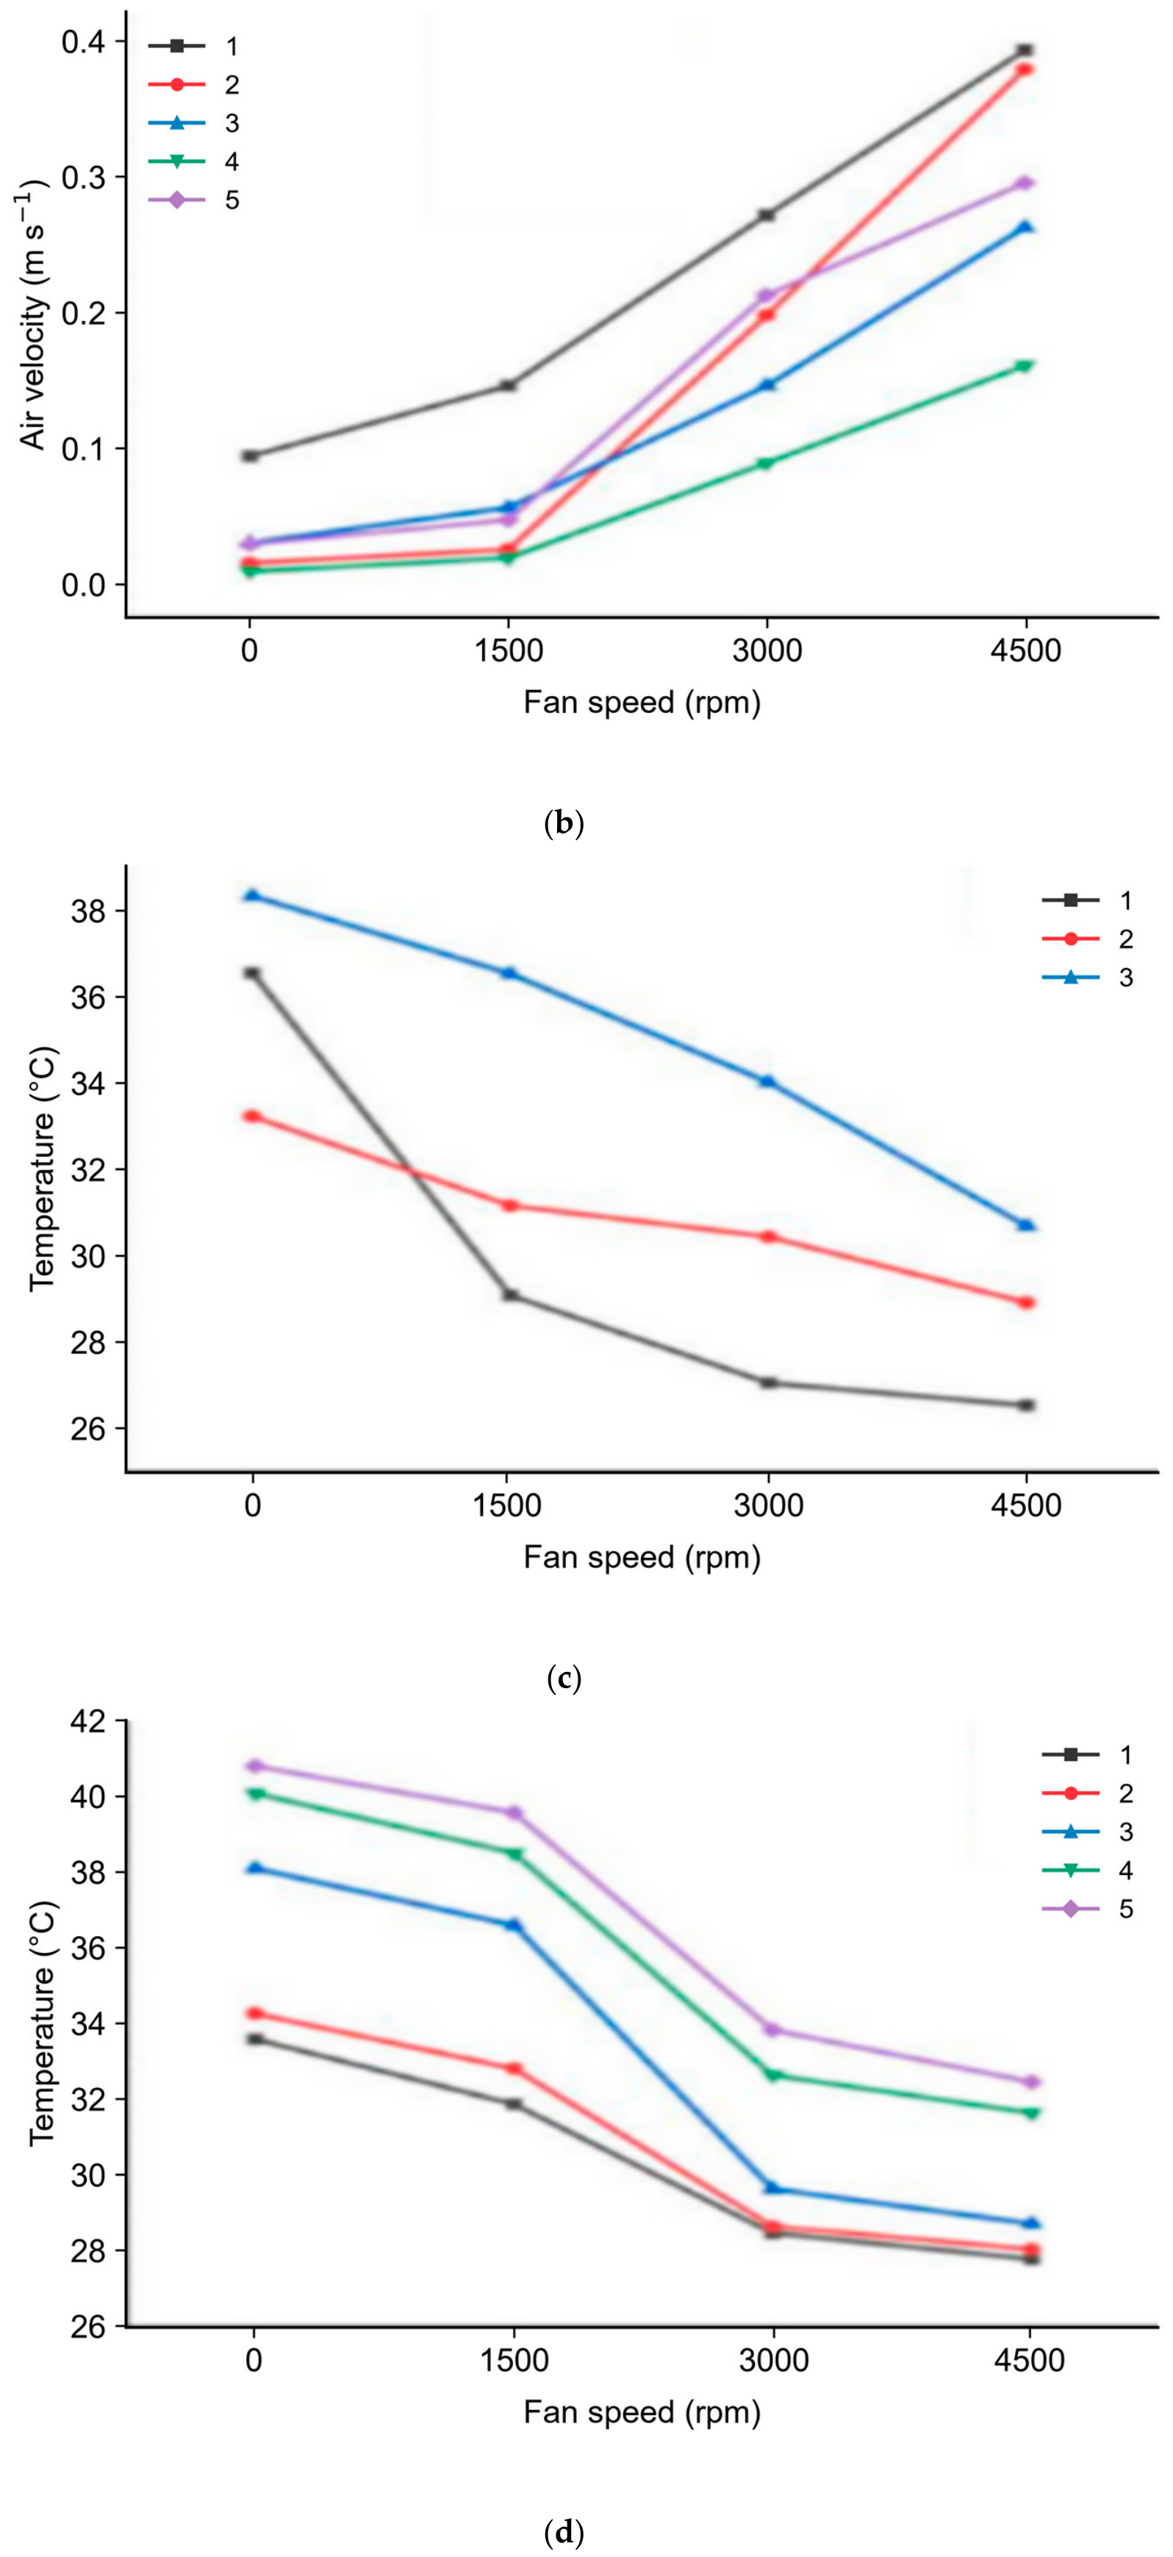
Figure 16a,b compare the local air velocities at the backrest and cushion monitoring points at t = 900 s. Seat ventilation produces the largest increases in airflow at monitoring points that are effectively connected to the internal ducts and near the edges of the contact region, where suction can draw cabin air through the porous layers.
Figure 16.
Seat-ventilation responses at the backrest and cushion monitoring points at t = 900 s: (a) backrest air velocity; (b) cushion air velocity; (c) backrest temperature; (d) cushion temperature.
Figure 7, Figure 10 and Figure 16 use the same monitoring-point coordinates. C5 is the exposed point between the thighs, where occupant blockage is lower and ventilation-induced cooling can be stronger than at the covered C1-C4 locations.
Figure 16c,d compare the corresponding temperatures. Increasing the fan speed lowers the temperature at most monitoring locations by drawing cabin air through the perforated surface and enhancing local convection. The calculated seat temperature remains higher when the occupant is present because heat exchange and airflow obstruction both modify the local microenvironment.
The strongest backrest cooling occurs near B1, which is closest to the effective duct coverage. The cushion response depends on the local duct layout, contact-pressure footprint, and exposure to cabin air. The response at exposed point C5 is therefore interpreted separately from those at the covered contact locations.
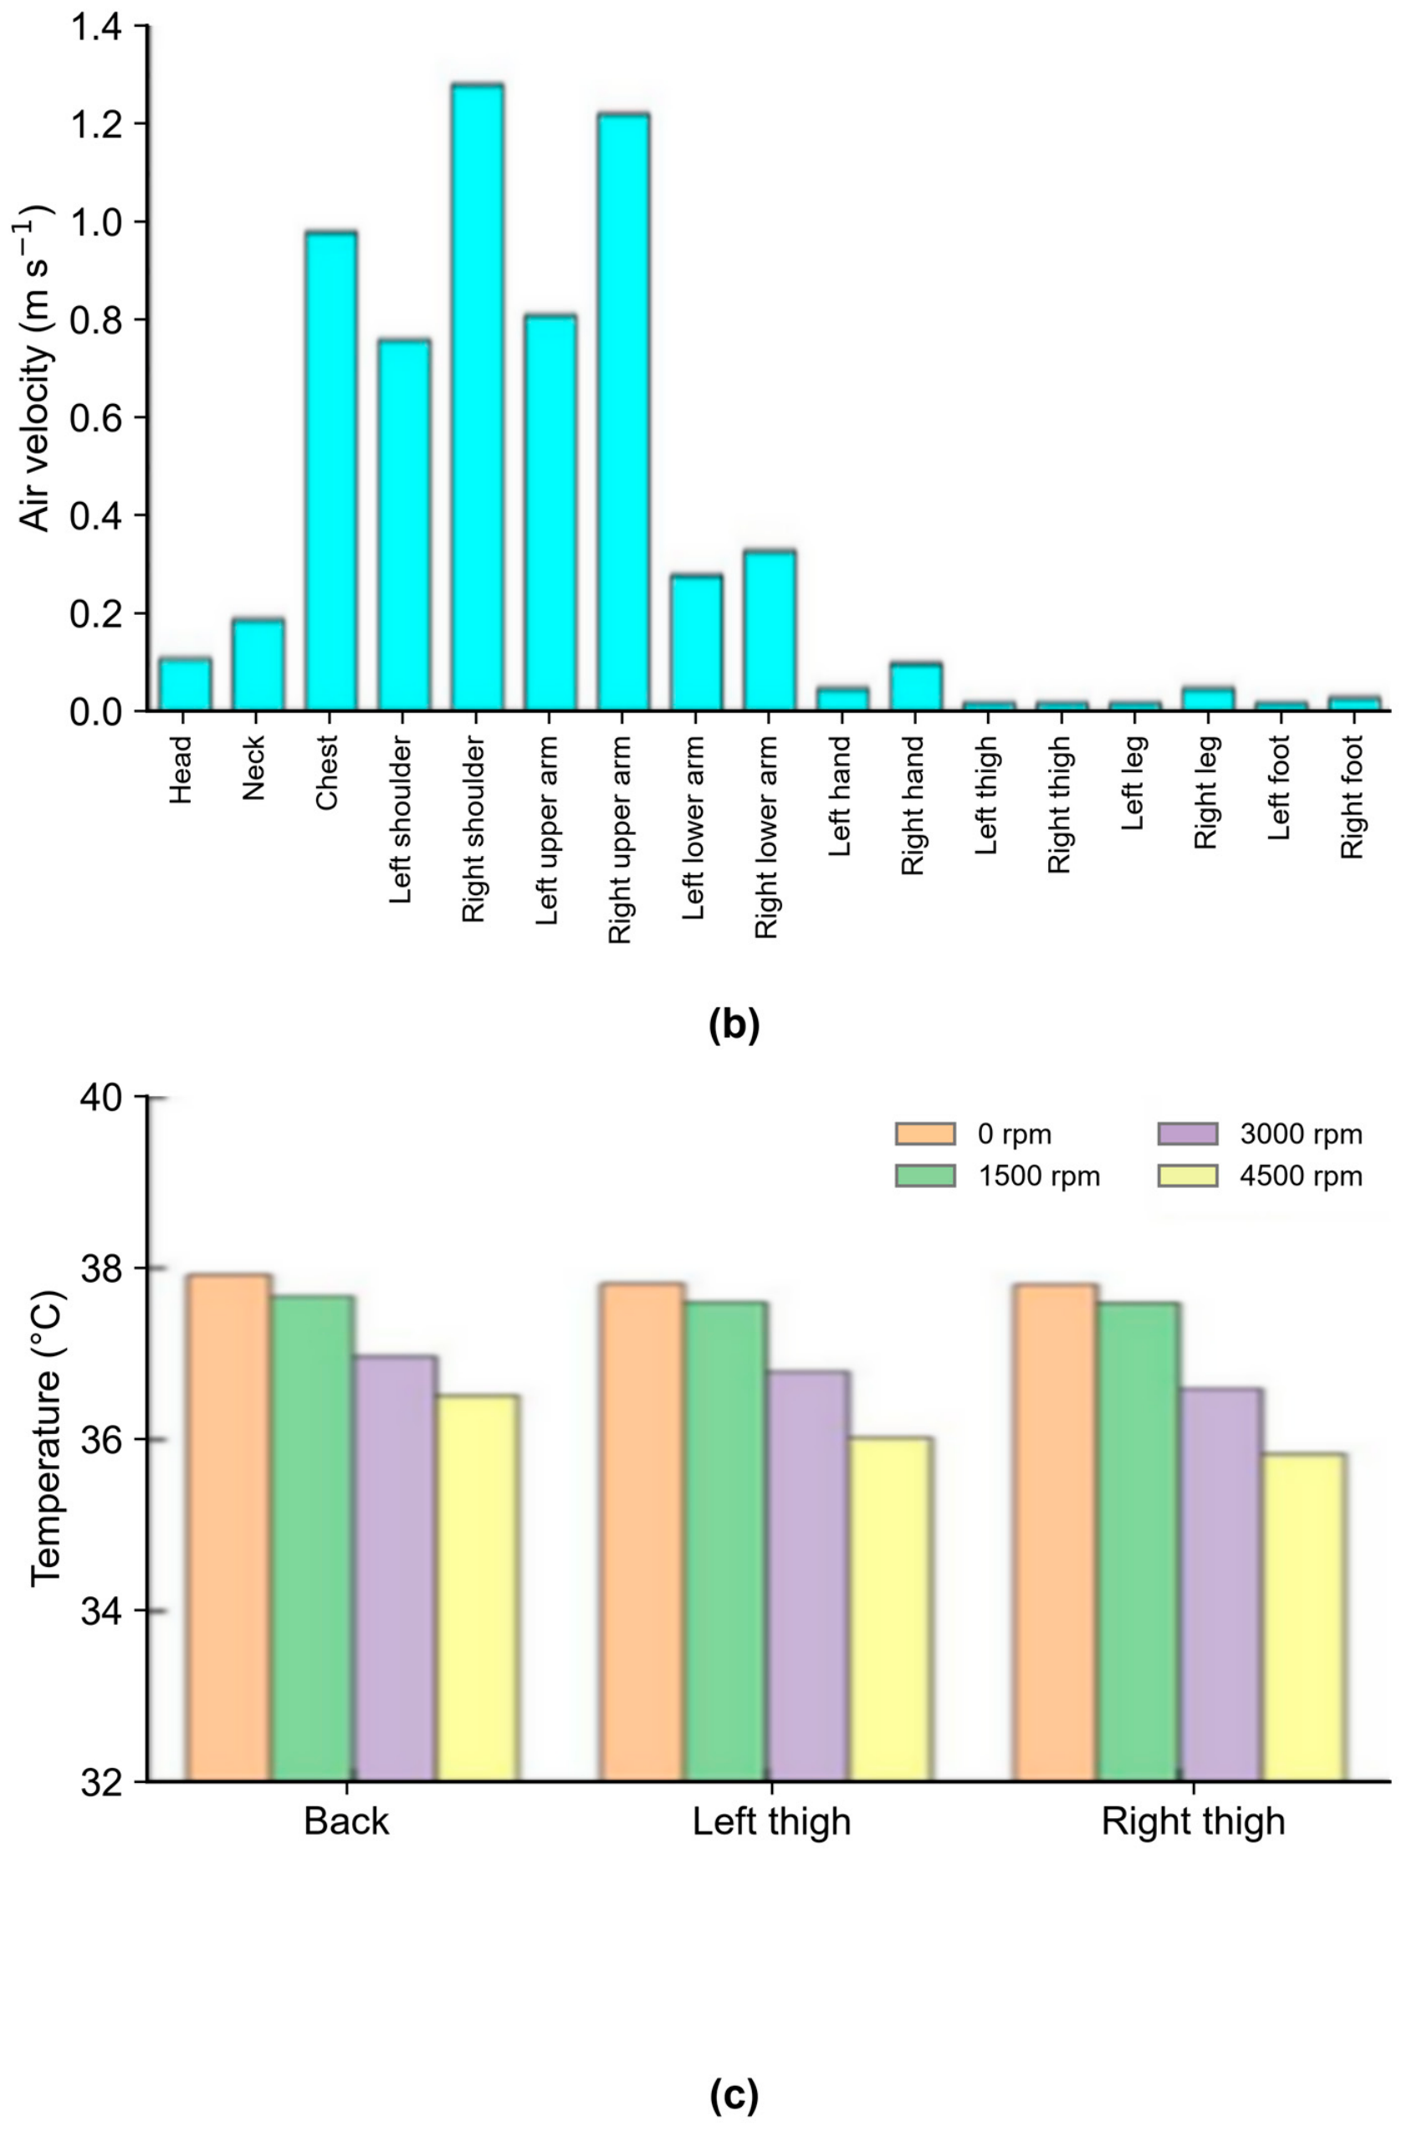
Figure 17a,b show the local air temperature and velocity adjacent to the anterior body segments at t = 900 s. Local velocities are lower around the head, neck, lower legs, and feet, which consequently remain warmer, whereas the chest and arms are cooled more strongly by the HVAC jet. Because summer clothing has relatively low thermal resistance, local air velocity has a pronounced effect on the outer-surface temperature. Nevertheless, thermal sensation depends on the combined effects of temperature, velocity, humidity, clothing, metabolic rate, and physiological state.
Figure 17.
Occupant thermal and airflow fields at t = 900 s in summer: (a) air temperature adjacent to the clothing surface; (b) local air velocity over the anterior body segments; (c) skin temperature at the interface.
Figure 17c shows that seat ventilation lowers the calculated skin temperature in the backrest and thighcushion contact regions as the fan speed increases. The predicted absolute summer skin temperatures remain high, plausibly because of the prescribed initial skin temperature of 36 °C, restricted convection within the compressed contact area, and the absence of sweating, vasomotor regulation, and other active thermoregulatory responses. The model may therefore overpredict absolute skin temperatures in the contact region during summer conditions. These results support only the comparative conclusion that ventilation enhances local cooling; the magnitude of any improvement in thermal sensation requires physiological or subjective validation.
5. Conclusions
A coupled cabin-CFD model was developed to investigate a detailed multilayer seat under winter heating and summer ventilation conditions. Its principal scientific contribution is a reproducible interface between CFD and thermophysiological modeling. By jointly resolving the seat layers, porous airflow, occupant contact, and cabin flow, the model provides the local thermal and flow boundary conditions required for subsequent stages of vehicle thermal-comfort assessment. The simulations compare airflow, seat-surface temperature, contact-region temperature, and occupant skin temperature for a short-duration, single-driver scenario.
- (1)
- The detailed seat representation resolves the perforated leather, breathable sponge, porous heating pads, foam, and internal ventilation ducts, thereby coupling heat conduction through the seat layers and airflow through the porous regions with the surrounding cabin flow.
- (2)
- Seat heating primarily affects the contact region through conduction and has little influence on the airflow over the anterior surface of the occupant. Seat ventilation also acts locally, producing the largest increases in airflow and cooling near effectively ventilated edges of the contact region while causing only small changes in lower-leg air velocity.
- (3)
- Heating and ventilation act through different mechanisms. Heating transfers energy from the pads through the seat layers to the occupant, whereas ventilation draws cabin air through the perforated and porous layers and enhances local convection. The detailed model can therefore be used to compare seat layouts and operating conditions and to provide boundary conditions for a separate thermophysiological comfort model.
- (4)
- The framework addresses the boundary-condition-generation stage of the overall thermal-comfort workflow. Table 2 documents the model inputs, numerical settings, assumptions, and outputs required for reproducibility. The spatially resolved fields of air temperature, air velocity, skin and contact-surface temperatures, and heat flux can be supplied to established physiological models such as the Fiala and Berkeley models and evaluated against future measurements. Experimental validation, active thermoregulation, subjective thermal sensation, and full-occupancy interactions remain outside the present scope and must be addressed before absolute thermal-comfort predictions can be made.
Author Contributions
Conceptualization, G.W.; methodology, Y.Z. and G.W.; software, Y.Z.; data curation, Z.L. (Zelin Liu), R.Z., Z.L. (Ziqiao Li) and H.C.; writing—original draft preparation, Y.Z., Z.L. (Zelin Liu), R.Z., Z.L. (Ziqiao Li) and H.C.; funding acquisition, Y.Z. and G.W. All authors have read and agreed to the published version of the manuscript.
Funding
This research was funded by the Guangxi Science and Technology Major Program, grant number GuikeAA23062067, and the National Natural Science Foundation of China, grant number 52372355.
Data Availability Statement
The data presented in this study are available from the corresponding author upon reasonable request.
Conflicts of Interest
The authors declare no conflicts of interest.
References
- Tan, J. Development Trends in Automotive Air-Conditioning Technology. Intern. Combust. Engine Accessories 2021, 3, 45–46. (In Chinese) [Google Scholar]
- Mao, Y.; Wang, J.; Li, J. Experimental and numerical study of air flow and temperature variations in an electric vehicle cabin during cooling and heating. Appl. Therm. Eng. 2018, 137, 356–367. [Google Scholar] [CrossRef] [Scilit]
- Warey, A.; Kaushik, S.; Khalighi, B.; Cruse, M.; Venkatesan, G. Data-driven prediction of vehicle cabin thermal comfort: Using machine learning and high-fidelity simulation results. Int. J. Heat Mass Transf. 2020, 148, 119083. [Google Scholar] [CrossRef] [Scilit]
- Basciotti, D.; Dvorak, D.; Gellai, I. A novel methodology for evaluating the impact of energy efficiency measures on the cabin thermal comfort of electric vehicles. Energies 2020, 13, 3872. [Google Scholar] [CrossRef] [Scilit]
- Chen, B.; Lian, Y.; Xu, L.; Deng, Z.; Zhao, F.; Zhang, H.; Liu, S. State-of-the-art thermal comfort models for car cabin environment. Build. Environ. 2024, 262, 111825. [Google Scholar] [CrossRef] [Scilit]
- Fang, G.; Li, H. Automobile Air-Conditioning Technology; China Machine Press: Beijing, China, 2002. (In Chinese) [Google Scholar]
- Fanger, P.O. Calculation of thermal comfort: Introduction of a basic comfort equation. ASHRAE Trans. 1967, 73, 4.1–4.20. [Google Scholar]
- Fiala, D.; Lomas, K.J.; Stohrer, M. A computer model of human thermoregulation for a wide range of environmental conditions: The passive system. J. Appl. Physiol. 1999, 87, 1957–1972. [Google Scholar] [CrossRef] [Scilit] [PubMed]
- Fiala, D.; Lomas, K.J.; Stohrer, M. Computer prediction of human thermoregulatory and temperature responses to a wide range of environmental conditions. Int. J. Biometeorol. 2001, 45, 143–159. [Google Scholar] [CrossRef] [Scilit] [PubMed]
- Zhang, P.; Su, X.; Gao, G.; Lin, Z.; Lu, W. Thermal comfort assessment in offices employing the Fiala model with impinging jet ventilation parameter optimization. Build. Environ. 2025, 284, 113455. [Google Scholar] [CrossRef] [Scilit]
- Zhang, H.; Arens, E.; Huizenga, C.; Han, T.; Dear, R.; Webster, T. Thermal sensation and comfort models for non-uniform and transient environments: Part I: Local sensation of individual body parts. Build. Environ. 2010, 45, 380–388. [Google Scholar] [CrossRef] [Scilit]
- Zhang, H.; Arens, E.; Huizenga, C.; Han, T.; Dear, R.; Webster, T. Thermal sensation and comfort models for non-uniform and transient environments, Part II: Local comfort of individual body parts. Build. Environ. 2010, 45, 389–398. [Google Scholar] [CrossRef] [Scilit]
- Zhang, H.; Arens, E.; Huizenga, C.; Han, T.; Dear, R.; Webster, T. Thermal sensation and comfort models for non-uniform and transient environments, Part III: Whole-body sensation and comfort. Build. Environ. 2010, 45, 399–410. [Google Scholar] [CrossRef] [Scilit]
- Zhang, Y.F.; Wyon, D.P.; Fang, L.; Melikov, A.K. The influence of heated or cooled seats on the acceptable ambient temperature range. Ergonomics 2007, 50, 586–600. [Google Scholar] [CrossRef] [Scilit] [PubMed]
- Feng, S.; Gu, Z.; Yu, G.; Shi, A.; Sun, X. Personalized Seat Heating in Hot-Summer and Cold-Winter Regions. Build. Energy Effic. 2023, 51, 64–70. (In Chinese) [Google Scholar]
- Ziolek, S.; Pryor, J.; Schwenn, T.; Steinman, A. Heated seat simulation study for thermal seat comfort improvement. SAE Int. J. Passeng. Cars—Mech. Syst. 2015, 8, 594–599. [Google Scholar] [CrossRef] [Scilit]
- Dong, W. Thermal Comfort of an Automotive Seat with Semiconductor Cooling and Temperature Control. Master’s Thesis, Wuhan University of Technology, Wuhan, China, 2019. (In Chinese) [Google Scholar]
- Zhang, P.; Djeddou, M.; Su, X.; Gao, G.; Lu, W. An impinging jet ventilation approach for automotive cabins: Promoting coughing droplet mitigation and thermal comfort enhancement. Appl. Therm. Eng. 2025, 281, 128696. [Google Scholar] [CrossRef] [Scilit]
- Lu, W.Z.; Lo, S.M.; Fang, Z.; Yuen, K.K. A preliminary investigation of airflow field in designated refuge floor. Build. Environ. 2001, 36, 219–230. [Google Scholar] [CrossRef] [Scilit]
- Kobayashi, T.; Sugita, K.; Umemiya, N.; Kishimoto, T.; Sandberg, M. Numerical investigation and accuracy verification of indoor environment for an impinging jet ventilated room using computational fluid dynamics. Build. Environ. 2017, 115, 251–268. [Google Scholar] [CrossRef] [Scilit]
- Yang, R.; Ng, C.S.; Chong, K.L.; Verzicco, R.; Lohse, D. Do increased flow rates in displacement ventilation always lead to better results? J. Fluid Mech. 2022, 932, A3. [Google Scholar] [CrossRef] [Scilit]
- Xu, M.; Patruno, L.; de Miranda, S. A pressure-velocity jump approach for the CFD modelling of permeable surfaces. J. Wind Eng. Ind. Aerodyn. 2023, 233, 105317. [Google Scholar] [CrossRef] [Scilit]
- Zhang, Y. Automotive Aerodynamics Numerical Simulation Technology; Peking University Press: Beijing, China, 2011; pp. 227–228. [Google Scholar]
- Huang, T.; Huang, J. Automobile Body Structure and Design; China Machine Press: Beijing, China, 1997. (In Chinese) [Google Scholar]
- Cao, J. Flow-Field Characteristics in a Vehicle Cabin Under Parking Ventilation for Temperature and Humidity Control. Master’s Thesis, Jilin University, Changchun, China, 2017. (In Chinese) [Google Scholar]
- Zhang, G.; Chen, B.; Liu, Z.; Liu, F. Lattice Boltzmann Study of Flow in Composite Porous-Medium Channels. Energy Sav. 2014, 5, 10–13. (In Chinese) [Google Scholar]
- Cai, P. Mesoscopic Study of Natural Convection in a Porous-Medium/Fluid Cavity Based on the Lattice Boltzmann Method. Master’s Thesis, Shandong Jianzhu University, Jinan, China, 2015. (In Chinese) [Google Scholar]
- GB/T 10000-2023; Human Dimensions of Chinese Adults. State Administration for Market Regulation; Standardization Administration: Beijing, China, 2023. Available online: https://openstd.samr.gov.cn/bzgk/std/newGbInfo?hcno=B19DCCA575D9406856ABF87A511EE11F (accessed on 13 July 2026).
- Wang, X.; Kong, L.; Fu, C.; Zhang, F. Design of a PTC Heater Control Scheme for Electric-Vehicle Air Conditioning. Beijing Automob. 2019, 2, 30–33. (In Chinese) [Google Scholar]

Disclaimer/Publisher’s Note: The statements, opinions and data contained in all publications are solely those of the individual author(s) and contributor(s) and not of MDPI and/or the editor(s). MDPI and/or the editor(s) disclaim responsibility for any injury to people or property resulting from any ideas, methods, instructions or products referred to in the content. |
© 2026 by the authors. Licensee MDPI, Basel, Switzerland. This article is an open access article distributed under the terms and conditions of the Creative Commons Attribution (CC BY) license.