


Abstract
Brake pad testing has attracted increasing scientific attention in recent years, particularly in focus of the upcoming EURO 7 regulation, which will introduce for the first time limits on PM10 emissions from tires and brakes. This study aims to compare the friction behavior determined using a Pin on Disc setup with that obtained from an inertia dynamometer test setup. For this purpose, a conventional low metallic brake pad material was tested with a ductile cast iron rotor. The test procedure was based on selected sections of the SAE J2522 standard (AK Master). The scaling method applied to the Pin on Disc system, as presented in this study, enables the calculation of deceleration based on the energy per contact area. After the Burnish section, the Pin on Disc setup systematically achieved a higher mean coefficient of friction of approximately 2 to 6% across the Speed/Pressure Sensitivity sections, with a larger offset of about 14% above 160 km/h. Meanwhile, the average coefficient of friction for the dynamometer test generally declined with speed, but on the Pin on Disc setup it only decreased up to 120 km/h. The coefficient of friction in Pin on Disc tests also decreased as pressure increased. SEM and EDX analysis showed the formation of bright primary metallic plateaus and darker, oxidized secondary plateaus. The disc tracks exhibited carbon- and oxygen-enriched tribological layers.
1. Introduction
The evaluation and development of brake pads have undergone significant transformation over the decades, driven by technological advancements, evolving safety standards and environmental considerations. Traditionally, brake pad testing concentrated on fundamental performance metrics such as deceleration rate, stopping distance, and wear resistance. Early methodologies relied on real-world driving simulations. However, the advent of modern testing equipment and computational modelling has expanded the scope of brake pad evaluation to include factors such as thermal stability [1,2], noise reduction [3,4] and environmental impact [5,6,7,8,9,10]. Nowadays, brake pad testing involves thermal and mechanical simulations and laboratory testing using inertia dynamometers and surface analysis, which provides detailed insights into material behavior [11].
Regulation EU 2024/1257 (Euro 7), adopted by the Council of the European Union, will become applicable on 29 November 2026. As well as tightening limits on exhaust pollutants, the regulation introduces limit values for brake particle emissions for vehicle categories M1 and N1 for the first time, targeting particles smaller than 10 μm (PM10). For categories M1 and N1 excluding class III, the emission limit is 3 mg/km for purely battery-electric vehicles and 7 mg/km for all other powertrains in these categories. For type approval purposes, manufacturers must assess brake emissions using the Worldwide Harmonised Light Vehicles Test Procedure (WLTP) [12].
Minimizing particle emissions through material modifications can significantly impact other critical brake pad properties. In addition to emission performance, environmentally oriented development and optimized testing under controlled conditions should ensure durability and safety, while also maintaining minimal environmental and health impacts, geometric stability, low water and oil absorbency, effective heat conduction, resistance to swelling due to moisture, and a stable coefficient of friction (COF) [13].
1.1. Brake Pad Composition
The composition of brake pads plays a critical role in their tribological performance. Modern brake pads are typically composed of non-asbestos organic (NAO) materials, low-metallic (LM) compounds, semi-metallic (SM) compounds or ceramic formulations. The composition of brake pads is generally very heterogeneous and can consist of up to 40 components [11,14]. These components can be categorized into four fundamental classes that determine the properties of the brake pad [14,15].
The first class includes abrasive particles (SiO2, ZrSiO4, quartz, SiC), which increase the COF. These particles are typically very hard and contribute to balance friction while promoting the formation of a tribological layer on the disc surface. Abrasives like SiC and ZrSiO4 also clean the contact surface, ensuring consistent friction during braking [11].
The second class consists of friction modifiers, which are used to lubricate the contact surface. This is generally achieved through the reaction of these components (graphite, copper or metals) with oxygen. These modifiers stabilize the COF and increase wear resistance [15,16].
The third class includes components that fill the space between abrasive and lubricating particles. These are often referred to as fillers and include materials such as fibers, barytes (BaSO4), vermiculite, clay (CaCO3), and iron oxide. Fillers improve the compactness of the brake pad, reduce costs and contribute to noise reduction [17,18].
The fourth category ensures the cohesion of the entire matrix and typically consists of binders such as phenolic resin, rubber, or metallic sintered powders. These binders provide mechanical stability, thermal resistance and a longer lifetime of the brake pad [15,19,20].
The material used in this study is an LM friction material. LM pads are developed and produced primarily for the European market [8]. The development of LM friction materials is driven by the need to meet stringent environmental regulations, such as reducing copper content to less than 0.5 wt% by 2025, while ensuring high braking performance under diverse operating conditions [14,20]. Numerous studies have shown that even minor changes in composition, particle size, or particle shape can lead to significant differences in brake performance [10,11,14,15,18].
1.2. Test Configurations
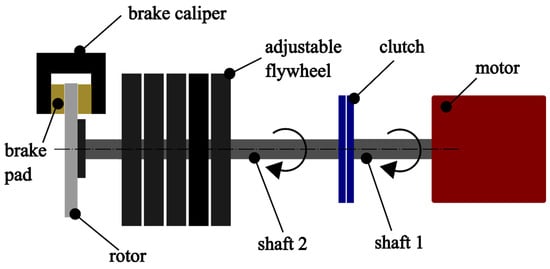
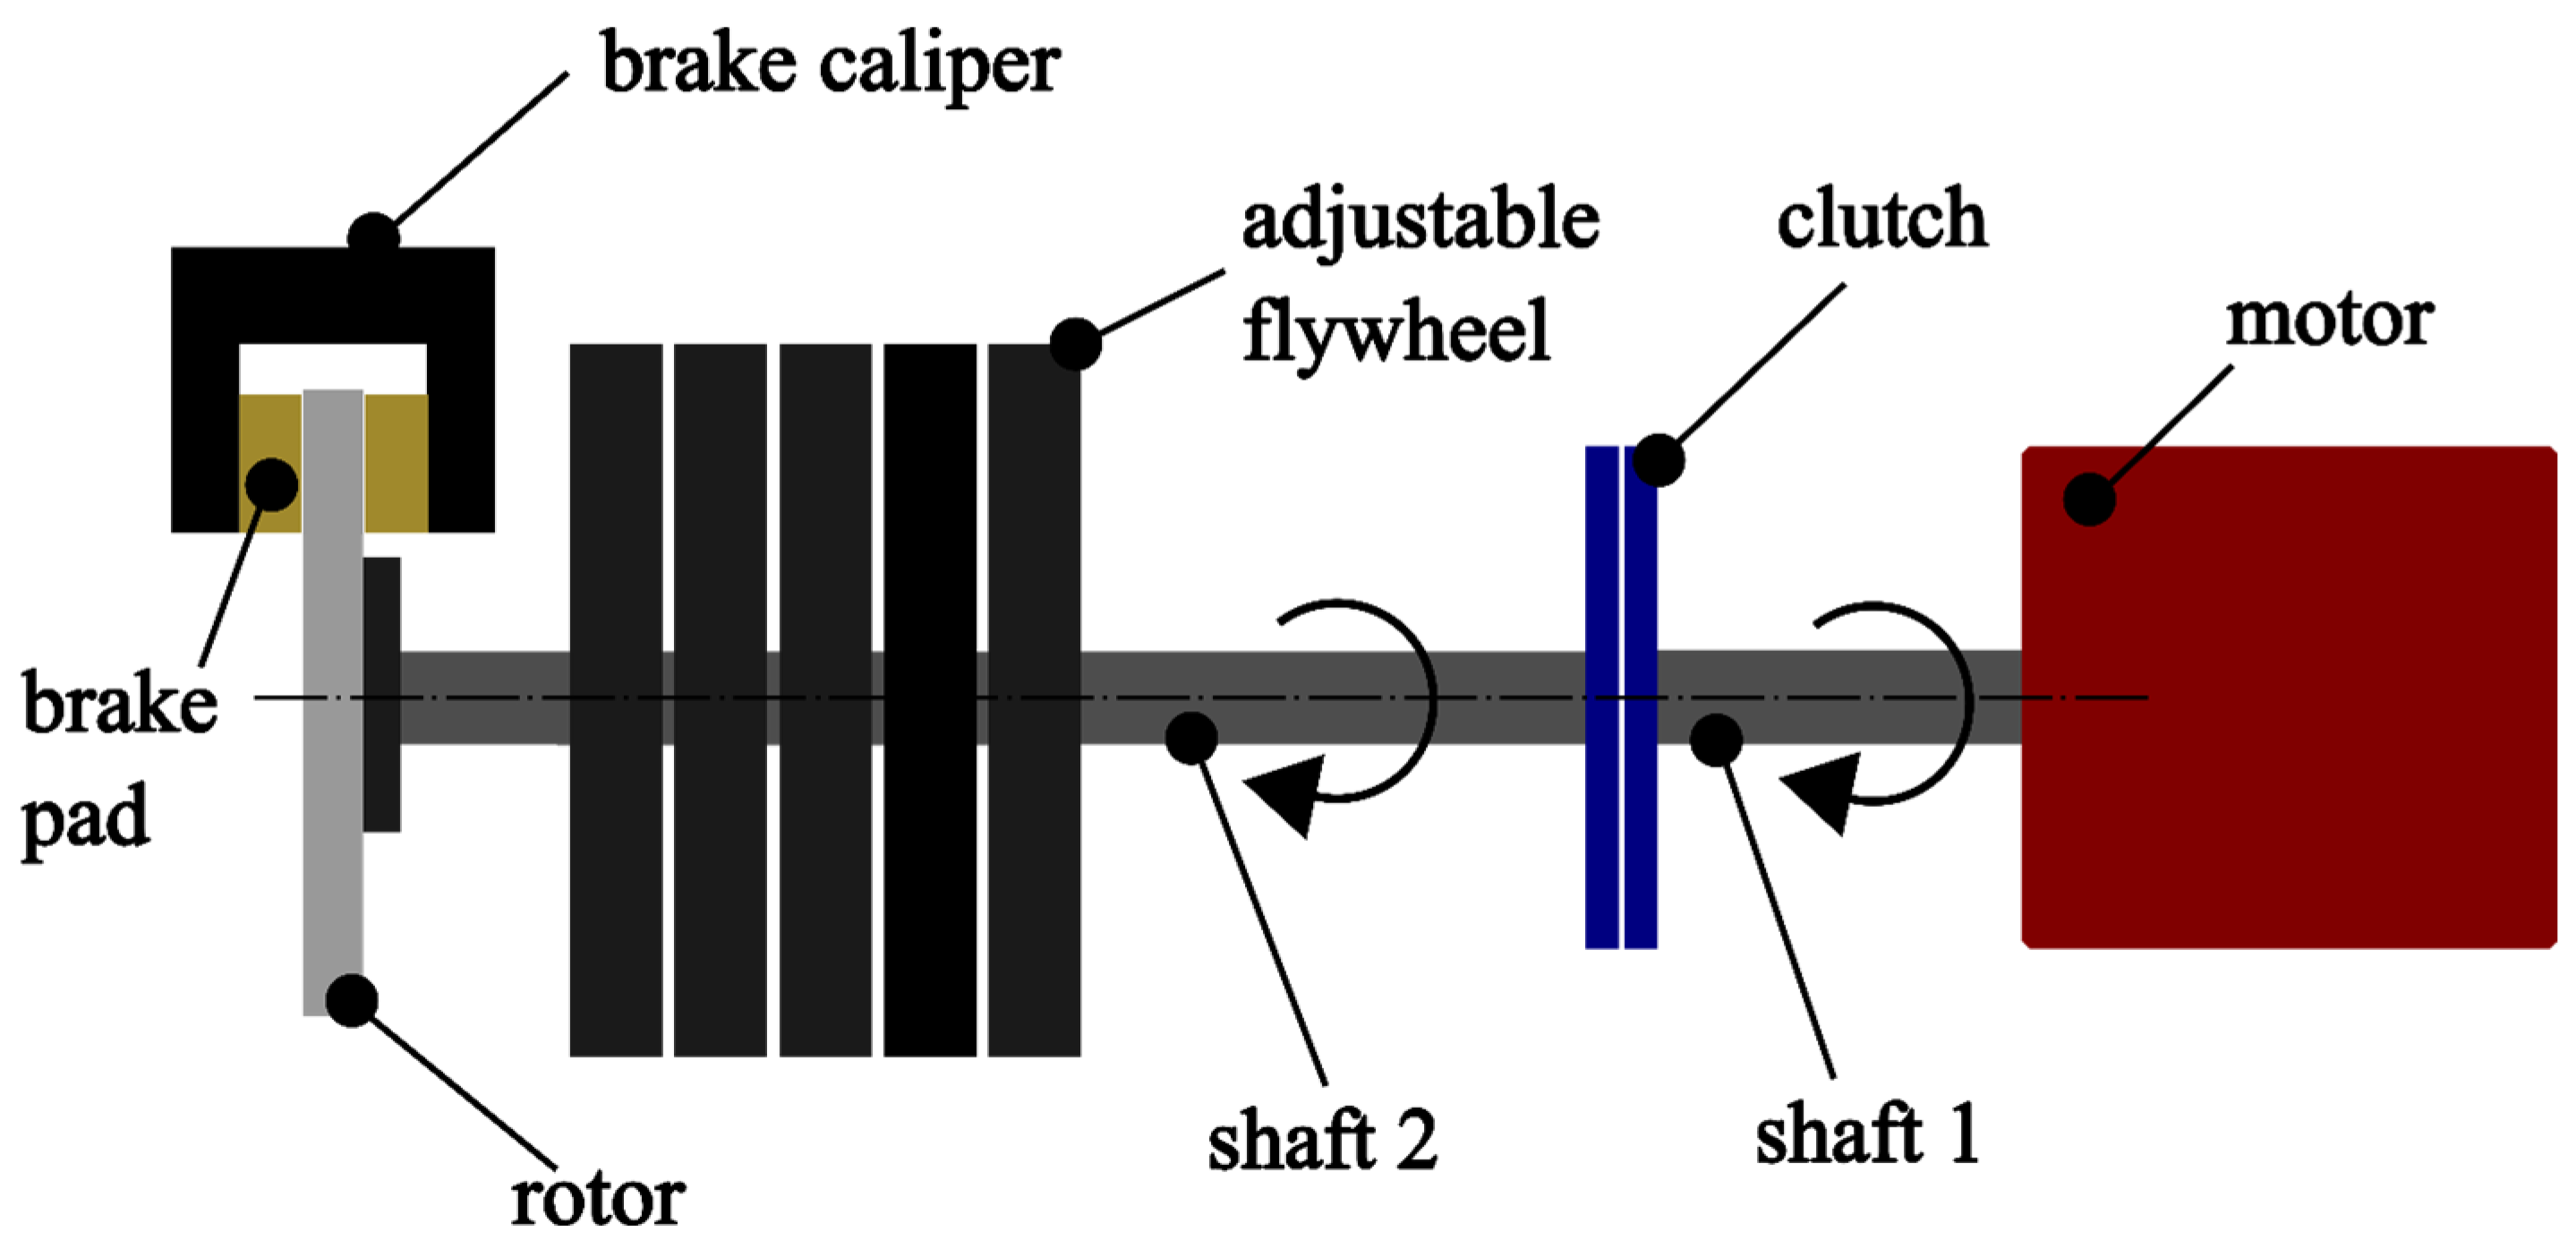
Brake pad performance is usually assessed using single-ended inertia dynamometers, which replicate vehicle braking and quantify the responses of friction, wear and temperature under defined conditions. These devices provide pressure- or deceleration-controlled brake cycles and the ability to acquire torque, speed, pressure and temperature at high frequencies, enabling standardized friction assessment in accordance with SAE J2522. In Figure 1 is a schematic inertia dynamometer test setup. An electric motor accelerates a flywheel via a clutch and shaft until it reaches the target rotational speed. The clutch is then disengaged and the hydraulic pressure is applied to the caliper, causing the brake pads to engage the rotating disc and decelerate the flywheel via friction-generated torque. Apparent friction for disc brakes is commonly reported using the COF, which is derived from the measured torque, applied pressure, piston area and effective radius, as defined in SAE J2522. This ensures consistent comparison across tests.
Figure 1.
Schematic representation of an inertia dynamometer.
For preliminary screening before dynamometer testing, researchers commonly use laboratory tribometers that offer compact setups, low cost, and precise environmental control. A range of methods is available for tribometer tests: Pin on Disc (PoD), Ball on Disc and Four Ball. Among these, the PoD apparatus is the most widely used for brake screening tests or specifically in research to identify wear mechanisms, damage mechanisms or particle emissions in tribological systems. Therefore, in most test setups a stationary pin is pressed against a rotating disc, with pin geometry selectable to emulate specific contacts, though cylindrical tips are typically preferred to simplify the contact mechanics. The majority of studies utilize a single pin against a rotating disc [6,7,15,17,21,22,23,24,25], while some explore two or three stationary pins against a rotating disc to adjust load distribution and contact stability [26,27]. In most cases, relatively low relative velocities of up to 5 m/s are achieved with PoD configurations [6,23,25,28] or constant velocities are applied during material testing [6,21,22,25,29].
Holmberg [30] investigates the tribological effects that manifest across different geometric scales, from nanotribology to teratribology. Understanding friction and wear mechanisms from a tribological perspective, as well as generating reliable friction and wear data for different material combinations and operating conditions, is crucial for determining the reliability and availability of machines and systems. However, scaling up our tribological knowledge from nano- and micro-contacts to the performance assessment and reliability prediction of large machines remains a major challenge for the tribology community.
The differences between scaled-down and full-scale test methods can be explained by applying physics-based scaling laws. Galileo’s “Two New Sciences” is widely cited as the origin of modern scaling philosophy [31,32]. Two categories of scaling are commonly used in the literature: geometry-based scaling (length, area, volume) and phenomenology-based scaling (thermal conductivity, electrical resistance) [32]. In practice, engineers often scale using equivalent energy absorbed per mass of friction material, equivalent heat transfer per contact area or equivalent power between sub-scale and full-scale tests. When selecting a test method, it is generally accepted that the wear mechanisms in service and in the test should be identical or at least similar [33,34,35].
However, these strategies are imperfect as they can violate one or more of the physical requirements relevant to friction and wear. Since friction and wear depend on the surface topography, environment, temperature distribution, sliding speed and normal load distribution, it is nearly impossible for a scaling method to satisfy all constraints.
Singireddy et al. [26] introduced a physics-based scaling approach for reduced-scale bench testing. This approach involves directly comparing the results of an SAE J2522 test procedure inertia dynamometer with a benchtop test setup operating under scaled load, speed and deceleration parameters. This method defines a scaling factor λ based on the ratio of apparent contact areas. Their results show reasonably comparable average COF values, with notable differences in the Speed/Pressure Sensitivity sections (200–170 km/h), where section averages diverge by up to approximately 30%.
2. Materials and Methods
The objective of this study is to analyze the influence on the COF using two different test configurations: a PoD tribometer and an inertia dynamometer. In order to achieve this objective, a reference test was conducted on an inertia dynamometer test bench in accordance with the AK Master procedure. The reference test and resulting data were generated by a German automotive OEM. The data set was provided to the authors for the present study. Consequently, this data serves as the external reference, which is compared with data obtained from PoD tribometer tests. This enables a consistent, side-by-side evaluation of friction behavior across both setups.
2.1. Materials
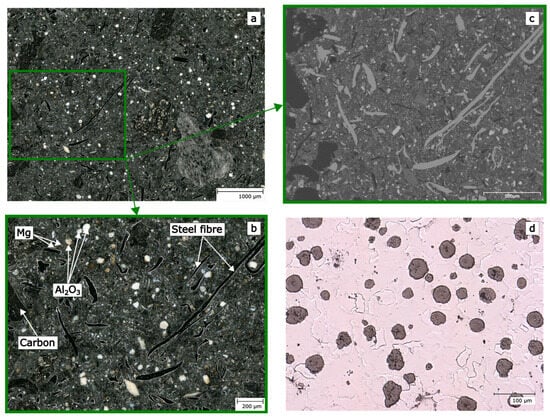
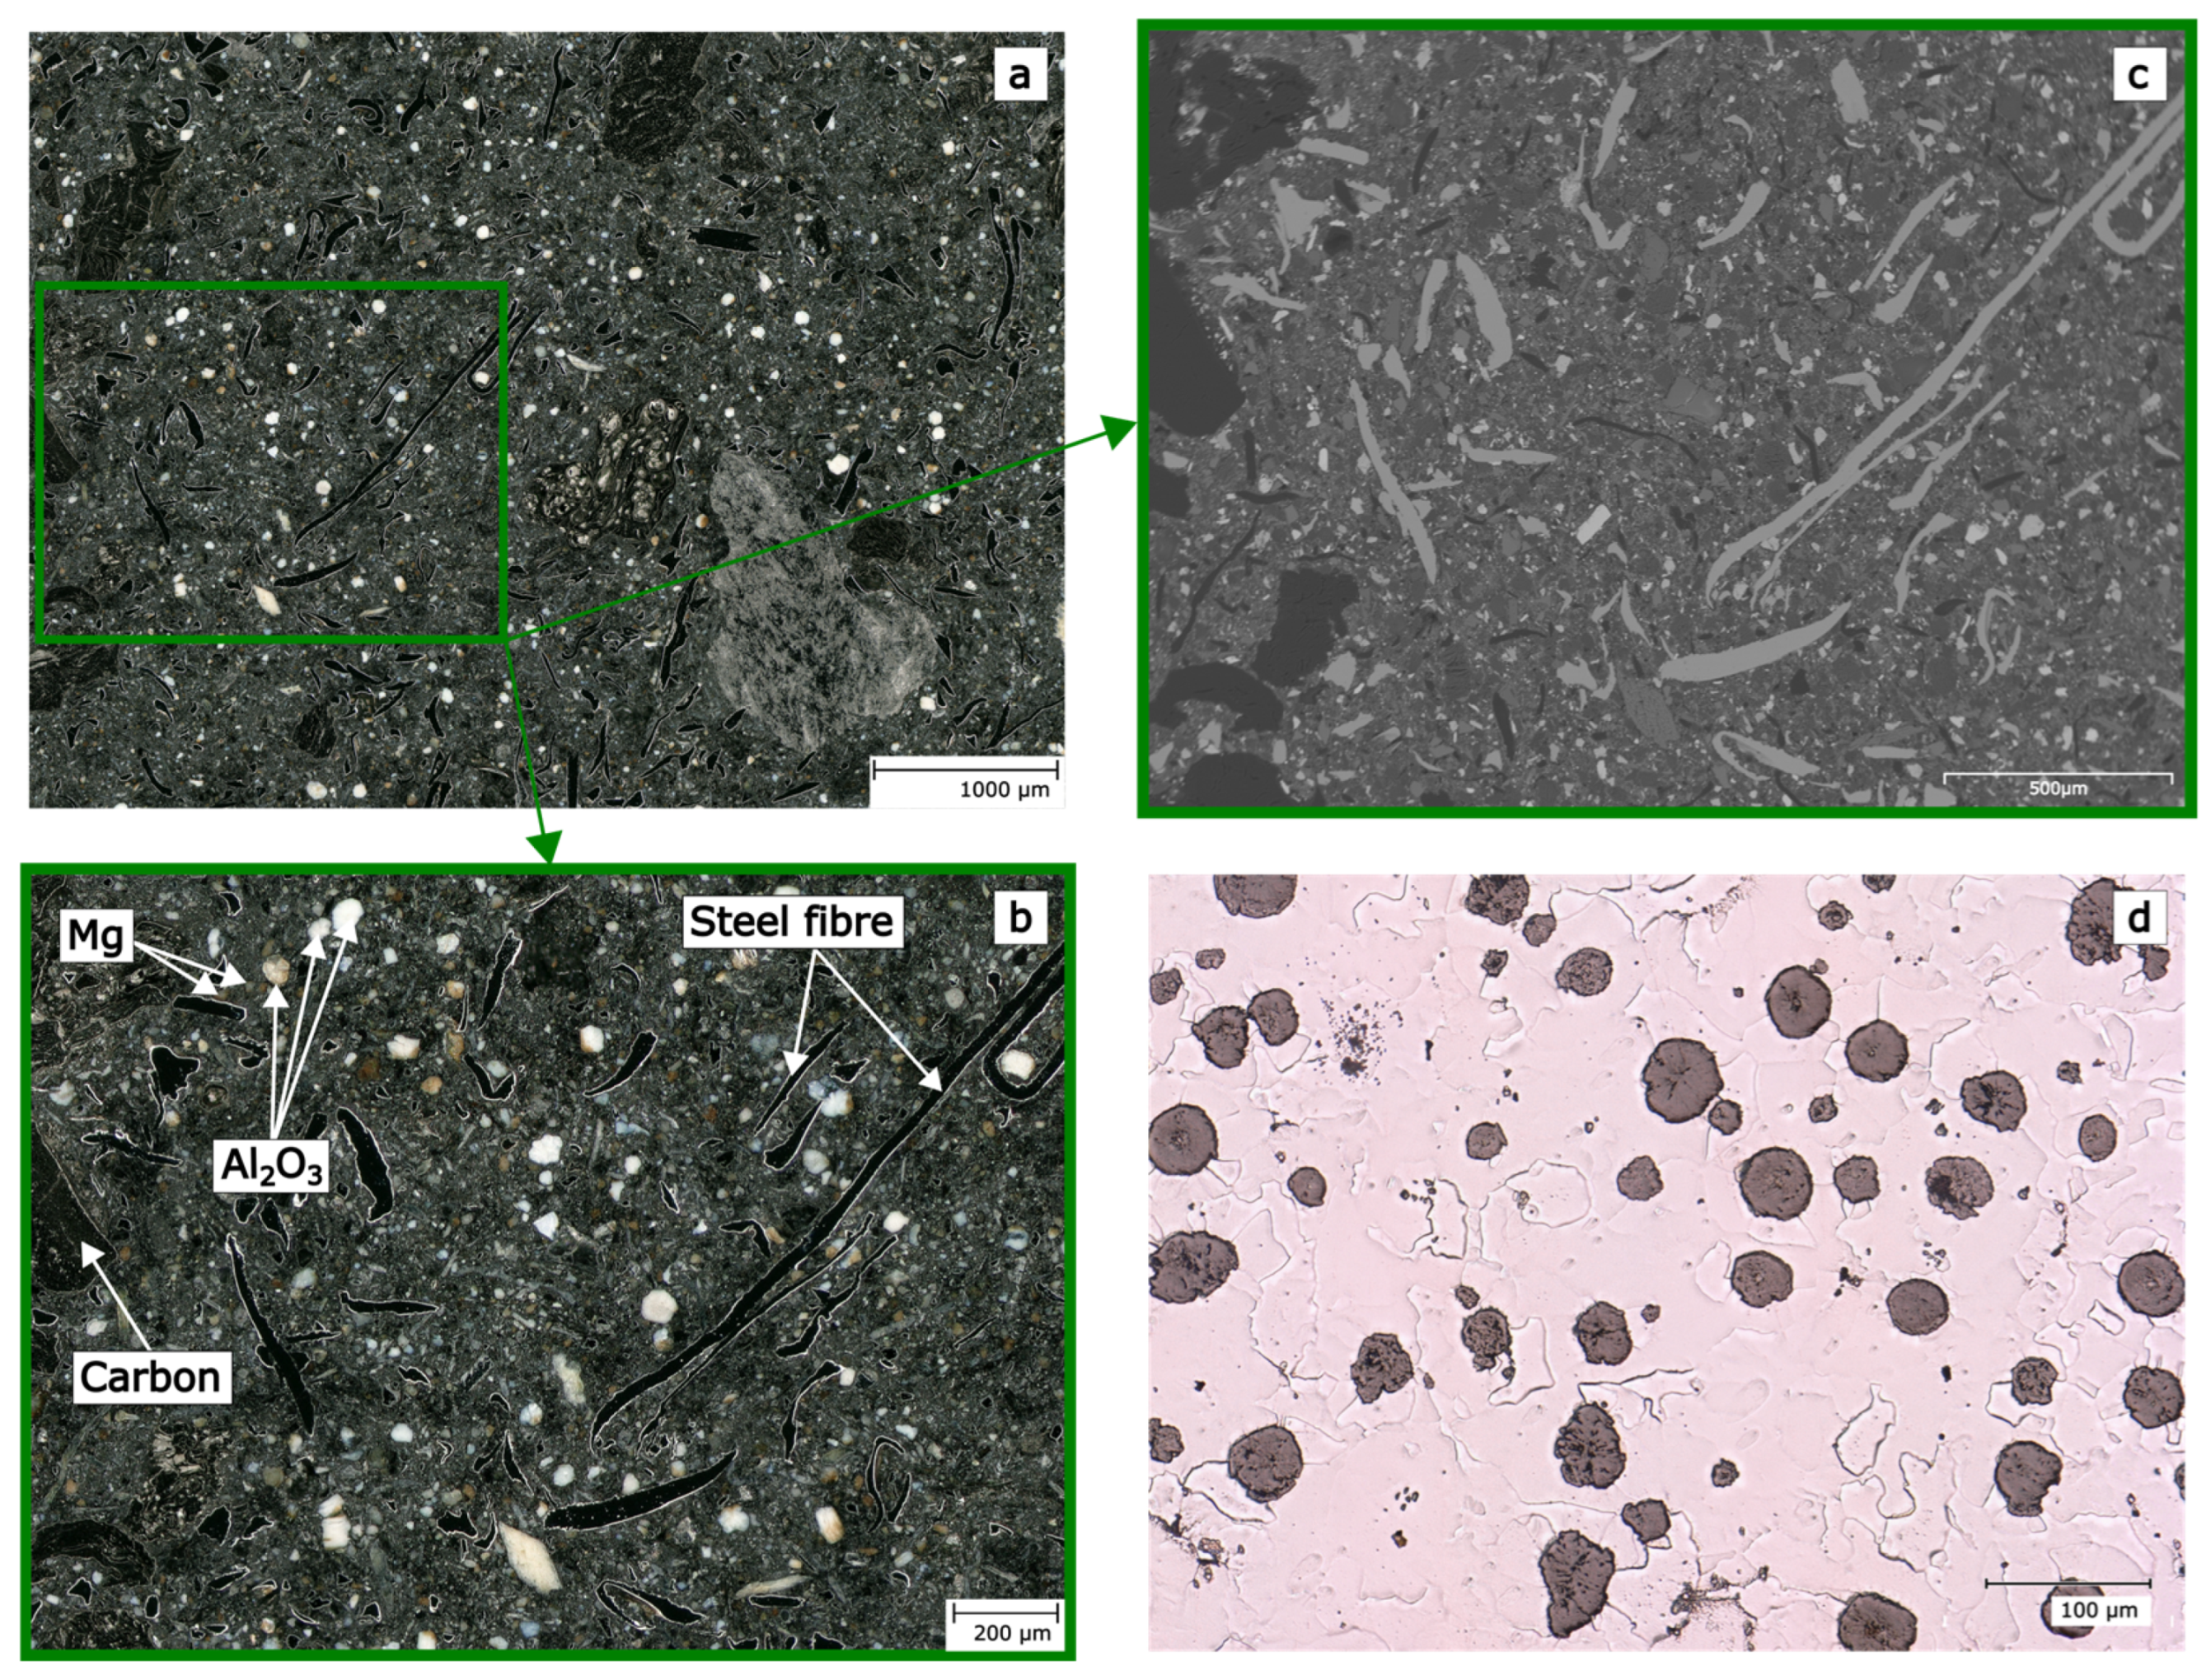
For the PoD tests, the same brake pad and disc pairing as on the reference test was utilized on the inertia dynamometer: a low metallic (LM) pad representative of the European market combined with a ductile cast iron disc. Representative micrographs of the LM pad microstructure, as shown in Figure 2a,b, were acquired using a Keyence VHX-5000 light microscope (Keyence Corporation, Osaka, Japan). Figure 2c presents scanning electron micrographs (SEM) of a polished brake pad. All SEM images utilized in this study were obtained using a Zeiss EVO 15 (Carl Zeiss AG, Oberkochen, Germany). These observations on the brake pad material revealed a heterogeneous microstructure comprising metallic phases, ceramic fillers, carbonaceous constituents, and elongated steel fibers embedded in the organic matrix. The chemical composition of the disc material, as provided by the manufacturer, is shown in Table 1.
Figure 2.
Micrographs of the brake pad and disc material: (a) overview of the brake pad material; (b) detailed micrograph of the brake pad; (c) detailed BSE image of the brake pad; (d) micrograph of the microstructure of the ductile cast iron disc material.
Table 1.
Chemical composition of ductile cast iron disc (EN-GJS-500-7C EN16482:2014).
The composition of the brake pad detected by EDX analysis is shown in Table 2. This finding is consistent with the literature reports on commercial friction materials, which indicate that elemental analyses (EDX/XRF) commonly detect Mg, Al, Si, S, K, Ca, Ti, Fe, Cu, Zn, Sn, Ba, and related oxides/phases within such pads [8,17,25,36,37].
Table 2.
Composition of brake pad material measured by EDX mapping of SEM image in Figure 2c (13.5 kV; results in weight-%).
A disc sample was polished and briefly etched using a 3% Nital solution to enhance phase contrast, as shown in Figure 2d. Table 3 presents the evaluated hardness and roughness measurements of the disc material prior to the test. This table also provides the density of the brake pad material, which is calculated based on height, diameter, and weight measurements of the pins. Vickers hardness of the disc was measured at a distance of 5 mm from the contact surface using a Zwick Roell ZHU 2.5 hardness testing machine (Ulm, Germany). The measurement of the average surface roughness (Ra) and the average height difference (Rz) was conducted radially to the machining direction at 120° intervals prior to testing, utilizing a Mahr Marsurf PS10 (Mahr GmbH, Göttingen, Germany).
Table 3.
Initial hardness and roughness measurements of disc material.
2.2. Preparation of Specimens
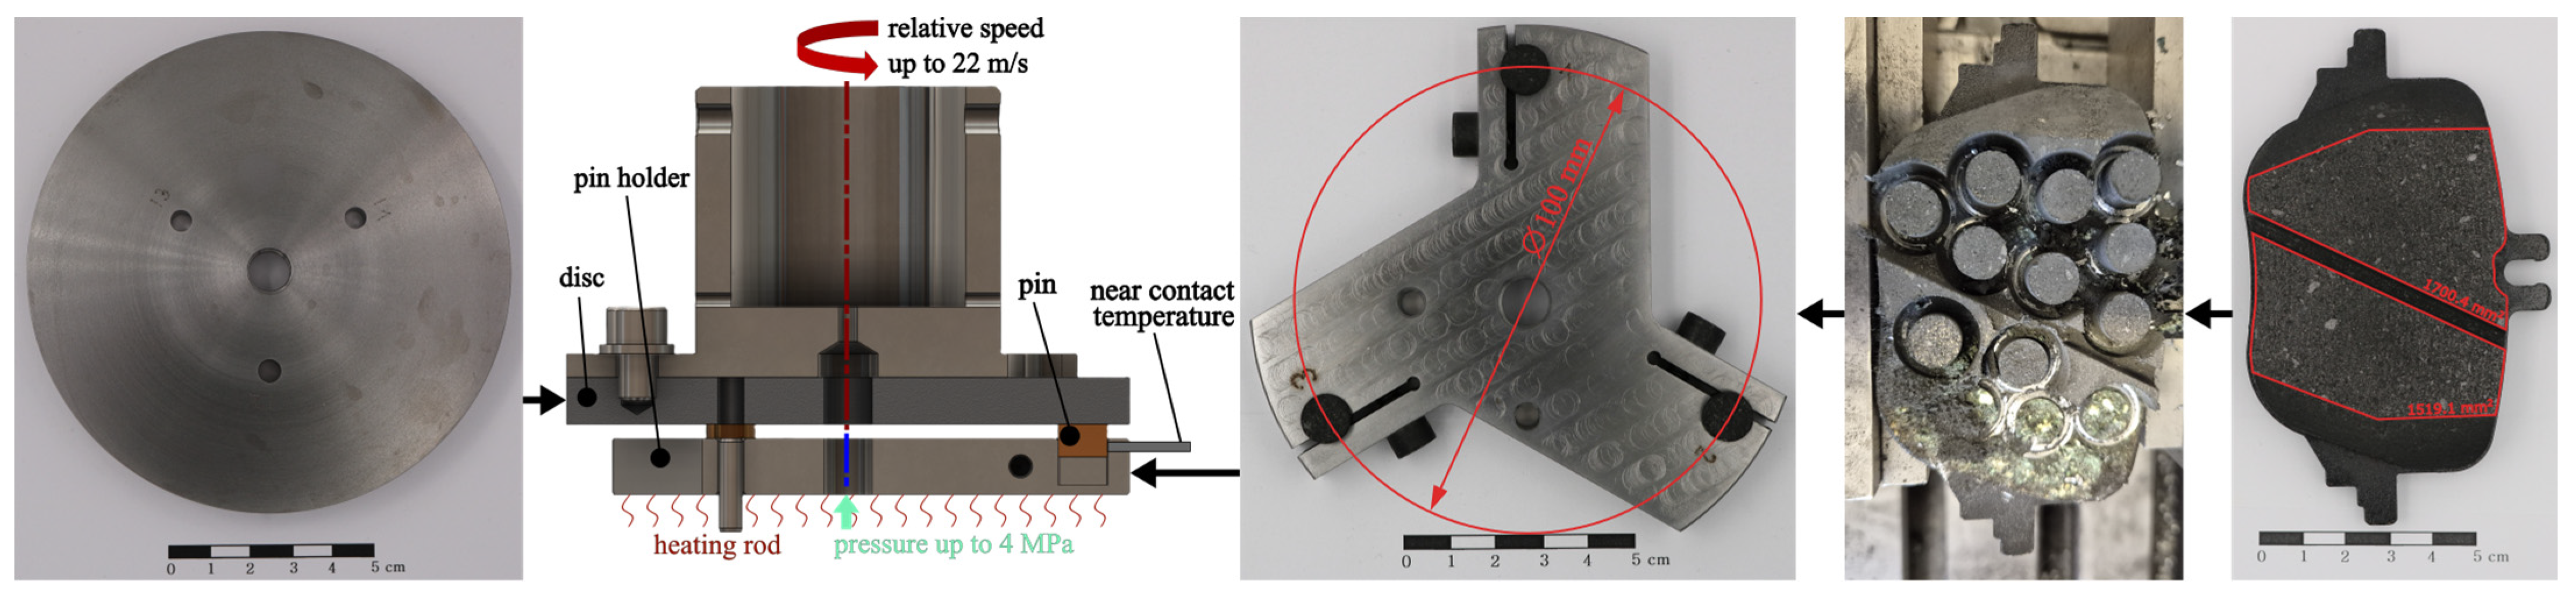
Figure 3 provides a schematic representation of the sample preparation, sample assembly, and a cross-section of the PoD test setup. The disc utilized for the experimental procedures was machined to a diameter of 120 mm and a thickness of 10 mm. The disc sample was subjected to rotational movement within the designated test setup. Consequently, the geometry was selected to minimize the deviation moment. The effective diameter of the contacting pins was 100 mm.
Figure 3.
Specimens and test configuration: (left) ductile cast iron disc; (center) schematic cross-section of the test setup; (right) initial brake pad, sample preparation and assembled pin holder.
The test pins were extracted from the brake pad using a conventional core drill (C. E. Fein 22283K diamond hole saw (Schwäbisch Gmünd-Bargau, Germany) with an outer diameter of 18 mm), a technique also utilized by Singireddy et al. [26]. The initial pin diameter was measured as 10.5 ± 0.1 mm. Pins were then mounted in the pin holder with the backing face upward and precision-turned on a lathe to a final height of 5.5 ± 0.01 mm. This procedure ensures that the run-in surface layer is removed and that there is minimal axial runout at the start of the test [38]. Preliminary trials confirmed that this step is essential to reduce vibration induced by frictional contact in this specific test configuration.
2.3. Pin on Disc Tribometer
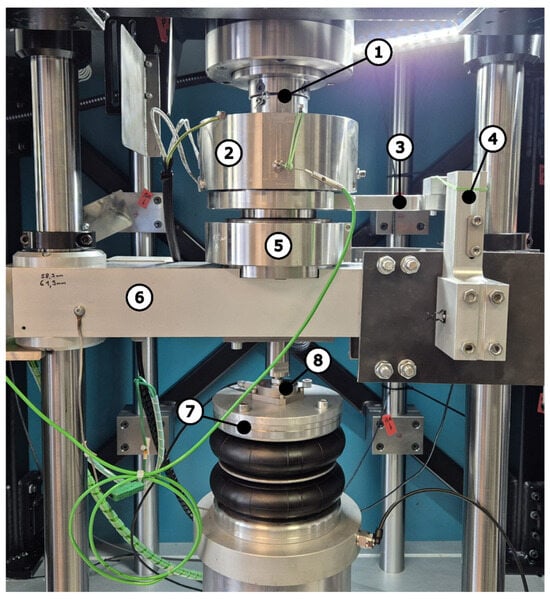
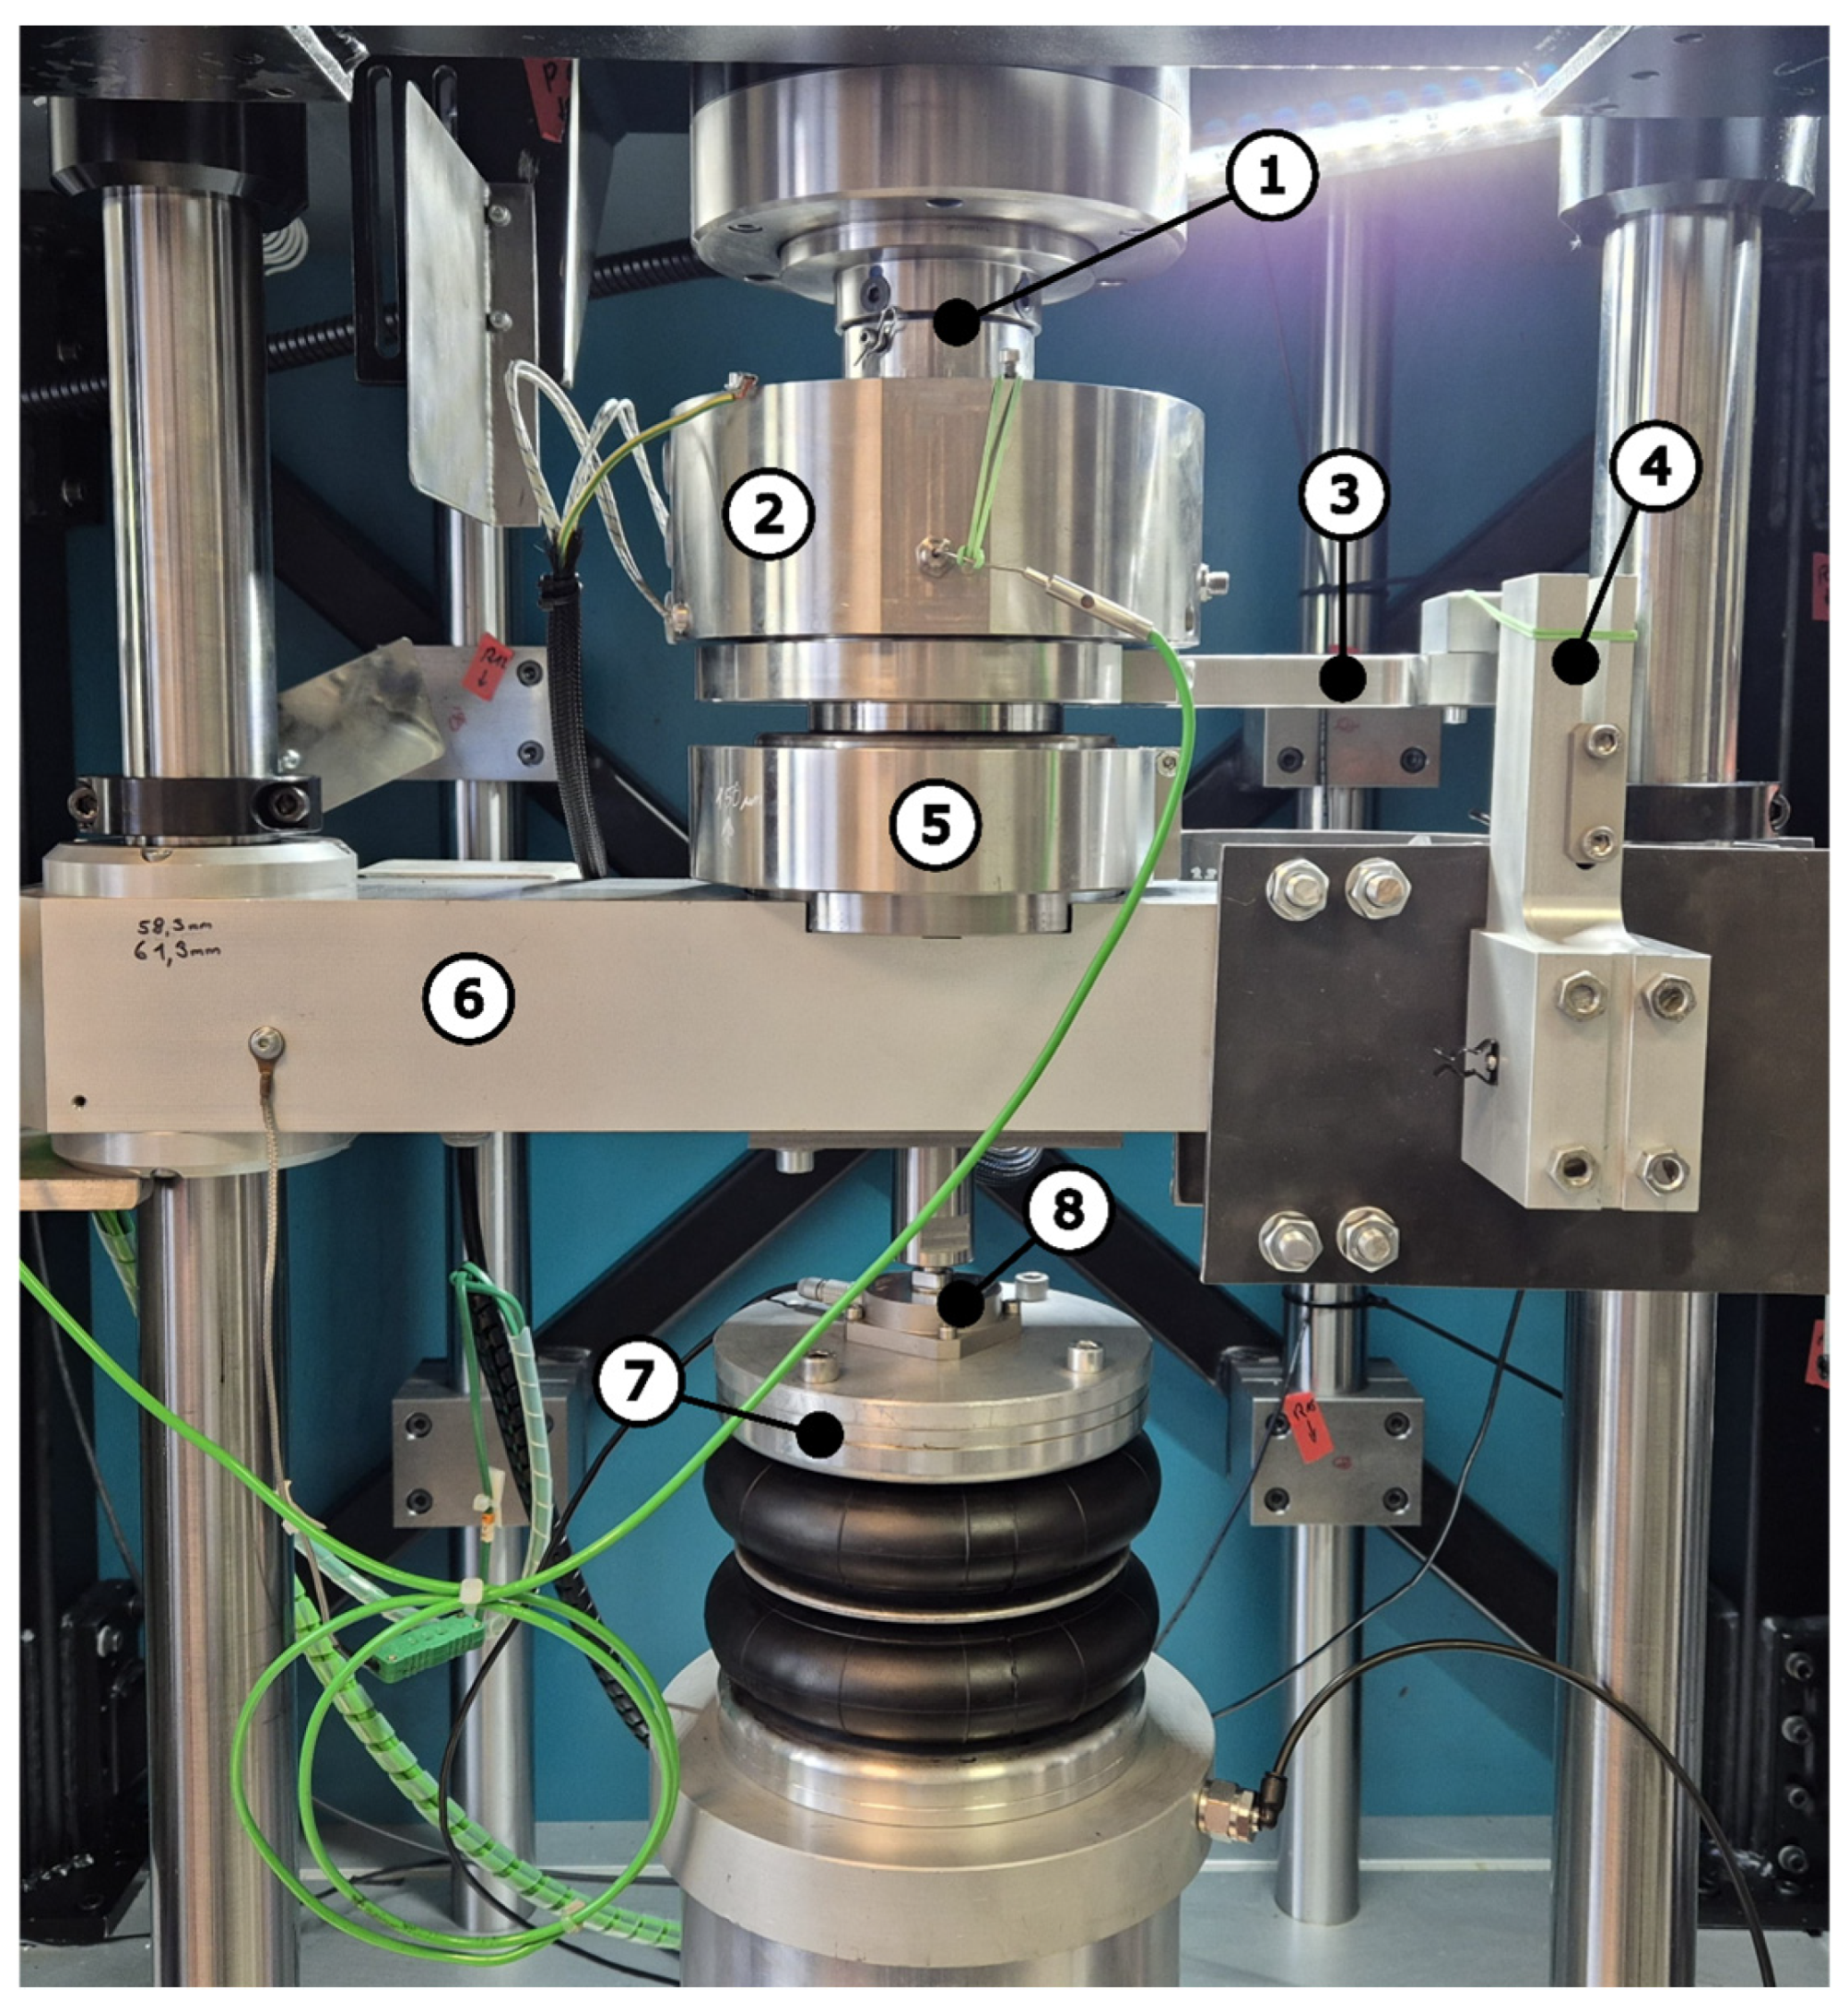
All experiments were conducted on a rotational tribometer TE92 of Phoenix Tribology (Phoenix Tribology Ltd, Newbury, United Kingdom) (see Figure 4). This test rig served as the base platform, augmented with targeted modifications to the drive, instrumentation, thermal control, and data acquisition chain. The servo synchronous motor was upgraded to an installed power of 10.4 kW in order to ensure stable speed control under elevated loads. The supervisory control of the rig was implemented using COMPEND as supplied with the tribometer, while motor actuation and drive parameters were executed via a Siemens controller. The configuration of the electric drive, the bearing system and the control system was necessary to guarantee precisely controlled deceleration ramps. The mechanical components of the test configuration are illustrated in Figure 3.
Figure 4.
PoD test rig: (1) cast iron lining fixation adapter, (2) test chamber, (3) lever arm, (4) load cell for friction force, (5) test cell bearing housing, (6) crosshead, (7) pneumatic air bellow, (8) load cell for normal force.
The ductile cast iron disc is mounted on the drive by an adapter that establishes a torque transmitting interface to the motor shaft and ensures concentricity (see Figure 3). Below the disc, the lower assembly is equipped with the pin holder, which is affixed to the rotating substructure. The lower assembly is mounted on a bearing system that enables rotation and the application of normal force. The tangential reaction force of the tribological contact is transmitted through a defined lever arm to a Phoenix Tribology SA 800 100 kg load cell (Phoenix Tribology Ltd, Newbury, United Kingdom), which is positioned at the end of the lever arm. The friction force is then obtained indirectly from the loadcell signal and the lever arm geometry. This enables continuous measurement of the friction force during testing.
The crosshead can be actuated in the vertical direction by a pneumatic air bellow. The reacting force of the bellow is coaxial with the center of the pin holder. The normal force can be monitored with a U2000 5 kN compressive load cell from Sherborne Sensor (Sherborne Sensors, Hampshire, United Kingdom) that is mounted on top of the pneumatic actuation.
The near-contact temperature is monitored using a K-type thermocouple, which is positioned at a depth of 3 mm below the actual contact surface and on the outer surface of the pin. The SAE J2522 standard permits the utilization of an infrared measurement system to monitor rotor temperature at the outer diameter of the inboard disc face as an alternative option. In order to ensure reliable results, it is essential that the measured rim area be coated with heat-resistant matte black paint. This is necessary to ensure stable emissivity that is compatible with the infrared system. However, this approach was not feasible with the test configuration used, as demonstrated in Figure 4. The installation of two cartridge heaters (600 W) was conducted at a depth of 15 mm below the tribological contact, with the objective of ensuring that the prescribed thermal boundary conditions were achieved. Data acquisition captures friction force, normal force, and rotational speed at a sampling rate of 1 kHz and near-contact temperature at a sampling rate of 10 Hz.
2.4. Test Conditions
SAE J2522 is a standardized test procedure for inertia dynamometers that is employed extensively in the context of component brake testing. In the context of these tests, the brake’s clamping force is applied hydraulically. The application of increased hydraulic pressure drives the caliper pistons and the pads towards the rotor, thereby generating the clamp force at the friction interface as defined by the caliper and pad geometry.
The SAE J2522 test procedure differentiates between pressure-controlled and deceleration-controlled brake applications. In this work, exclusively pressure-controlled cycles were conducted. Table 4 lists the sections of SAE J2522 that are covered by tribometer testing. These sections correspond to 312 brake events, enabling comprehensive testing and comparison of the COF between the test rigs.
Table 4.
Selected sections of the SAE J2522 test procedure for the PoD tests [26].
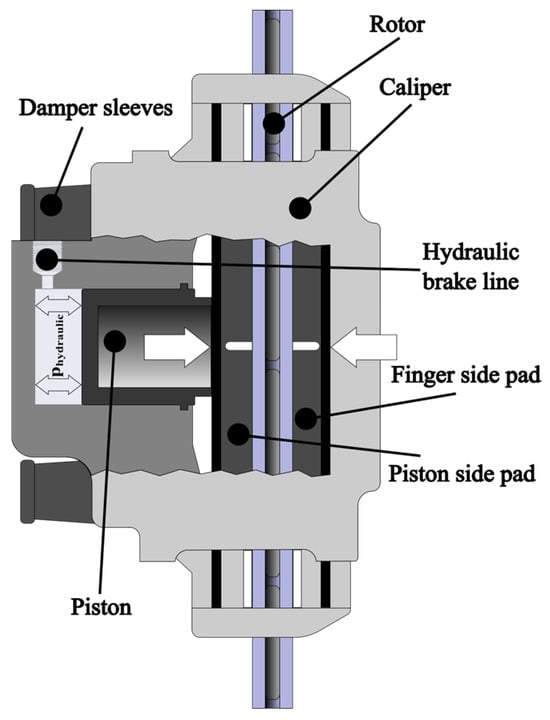
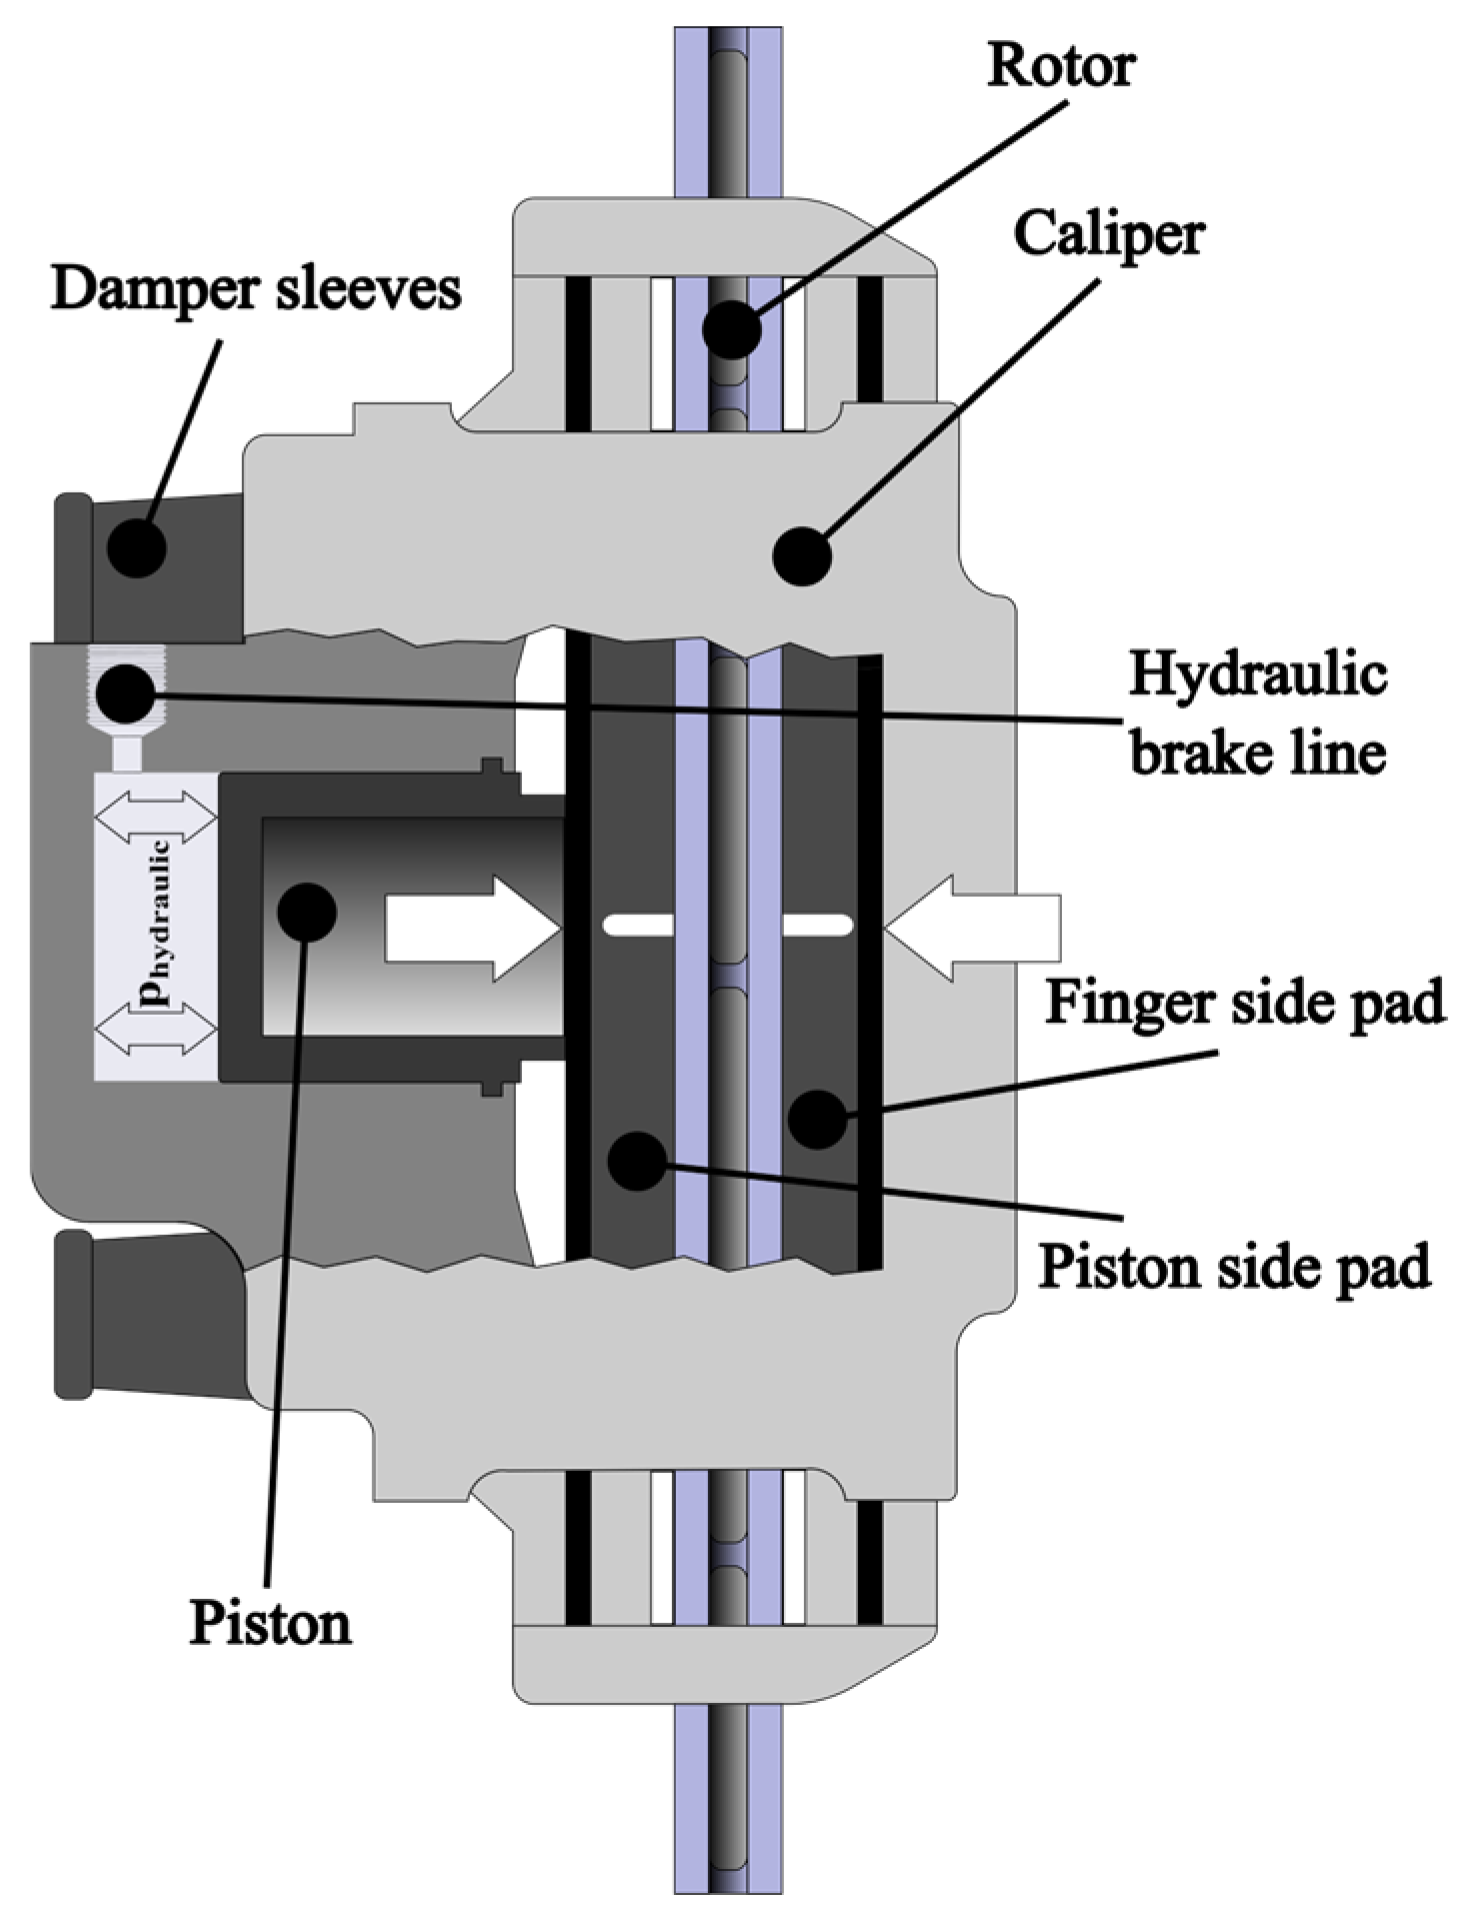
To achieve comparable results on the tribometer, this part of the study reveals how the test conditions were calculated. Figure 5 shows a floating caliper, which illustrates the mechanical components of a car’s disc brake system. This particular caliper is designed to move laterally, thereby applying pressure to both sides of the rotor using a single piston.
Figure 5.
Design of a floating caliper.
Accordingly, the nominal contact pressure applied in the tribometer pPoD is expressed in Equation (1), where phydraulic is the hydraulic line pressure, npistonareas is the number of effective piston areas, nbrakepads is the number of brake pads, Apiston is the effective piston area and Abrakepad is the nominal brake pad contact area.
Accordance to SAE J2522, the execution of brake applications occurs within the range of an initial vehicle speed to a final vehicle speed. The relative sliding speeds vDynamometer,0 and vDynamometer,1 between pad and disc are obtained based on the vehicle speed vPoD,0 and vPoD,1, the tire diameter dtire, and the effective friction radius rbrake,eff of the disc brake.
The effective friction radius of the brake can be determined from the outer radius ro and inner radius ri of the brake pad, which is expressed in Equation (4).
In this study, the relative sliding speeds on the tribometer vPoD,0 and vPoD,1 are equal to the relative sliding speeds on the inertia dynamometer. In the ensuing investigation, the subscript 0 denotes the initial value of the variable at the commencement of the brake application, while the subscript 1 denotes the final value.
The selected brake events are conducted at constant nominal contact pressure. Consequently, the deceleration of the disc is dependent on the friction force and the sliding distance, and thereby on the dissipated energy. In this study, it is assumed that the rotational energy EDynamometer,rot stored in the flywheel of the dynamometer, divided by the brake pad contact area Abrakepad, is equivalent to the frictional energy at the tribometer EPoD,friction, divided by the contact area of the three pins APin. Assuming a constant COF, Equation (5) facilitates the calculation of the deceleration required for each brake event.
Equations (6)–(8) illustrate the calculation of the rotational energy of the dynamometer’s flywheel, where I represent the moment of inertia of the flywheel, and the associated angular velocities ωDyn,0 and ωDyn,1.
The friction energy EPoD,friction in a single braking cycle on the tribometer can be calculated using Equation (9), which involves multiplying the friction force FR,PoD by the braking distance sPoD,1.
EPoD,friction = FR,PoD (sPoD,1 − sPoD,0)
Assuming a friction coefficient of 0.45 and given the surface pressure on the tribometer and the contact area of the pin APin, the friction force can be calculated using Equation (10). Furthermore, comparable friction levels for LM brake pads have been reported in the published literature [11,39].
FR,PoD = pPoD 3 APin μ
The distance covered during a single braking cycle can then be calculated via transformation of Equations (9) and (10). The distance after a brake cycle is expressed in Equation (11). In this context, it is presupposed that the distance traversed at time t0 is 0, as demonstrated in Equation (12).
sPoD,0 = 0 m
Assuming a constant deceleration aPod and integration establishes the relationship between deceleration , speed and distance x(t). This relationship is shown in Equations (13) and (14).
In order to derive the formula expression in Equation (13), it is necessary to substitute the quantities known from the derivation into Equation (15). It is evident that the deceleration in this work is dependent on several factors, including hydraulic pressure, the number of effective piston areas, the COF, the effective friction radius, and the moment of inertia. The hydraulic pressure is dependent on the section utilized, as outlined in SAE J2522. Equation (14) demonstrates that the deceleration at the tribometer is not influenced by the initial speed of the brake events.
Table 5 specifies the constants required to calculate the deceleration of a single brake event. The relevant parameters for the entire test program employed in the experiments are documented in Appendix A (Table A1).
Table 5.
Necessary parameters to calculate the deceleration of a brake event.
2.5. Tribological Testing
Figure 6 provides a schematic representation of a single brake cycle on a dynamometer and a tribometer. A comparison of the braking cycle of the dynamometer and the tribometer reveals that, in the case of the dynamometer, the normal force is applied in a relative short amount of time at the required maximum speed as a result of the near incompressibility of the hydraulic fluids.
Figure 6.
Visual representation of a single brake event on the dynamometer (left) and on the tribometer (right).
In accordance with SAE J2522, the maximum pressure ramp is defined as 250 bar/s. It is important to acknowledge the potential influence of brake pad engagement behavior on the measured COF on the dynamometer test rig. The normal force exerted on the tribometer is created by an air bellow that operates pneumatically. The application and stabilization of the clamping force lasts 30 to 40 s. Consequently, the normal force was applied prior to the acceleration of the shaft in the study. This facilitates the COF remaining unaffected by the engagement behavior of the friction lining. It should be noted that applying the normal force prior to acceleration generates more friction energy than specified in Equation (9).
In addition to analyzing the friction behavior of the brake pad, the gravimetric wear of the disc sample and the thickness change of the three pins were investigated. The degree of wear on the brake pad was measured using a micrometer, specifically a Mahr Micromar 40 EWR digital micrometer (Mahr GmbH, Göttingen, Germany), which has a measuring accuracy of ±0.001 mm. The measurement was performed following the application of a static load of 1027 N (equivalent to a maximum pressure of 4 MPa) and upon completion of the test. Prior to this, the pins were installed in the adapter as demonstrated in Figure 3, and the total thickness at the positions of the individual pins was measured. The mass of the disc was measured using a Kern 572 gravimetric scale (Kern & Sohn GmbH, Balingen, Germany), which has a measuring accuracy of ±0.01 g.
The thickness change of the pins and the gravimetric change were determined by subtraction of the corresponding measured values. Prior to measurement, the samples were cleaned with a forced flow of dry air to remove wear dust and debris. All measurements were taken at ambient temperature.
From the tribological tests, the specific wear rate Ka values for the disc and pad materials were determined using a modified Archard equation [40,41] for multiple brake cycles. The original form of the specific wear rate equation, typically applied under stationary sliding conditions, is presented in Equation (16), where V represents the worn volume, FN is the applied normal force and s is the sliding distance. The modified equation, shown in Equation (17), accounts for the cumulative effect of multiple brake stop cycles by expressing the product of FN·s as the sum of the products for each individual cycle. The wear volume of the disc was calculated using a density of 7.1 g/cm3, corresponding to ductile cast iron.
3. Results
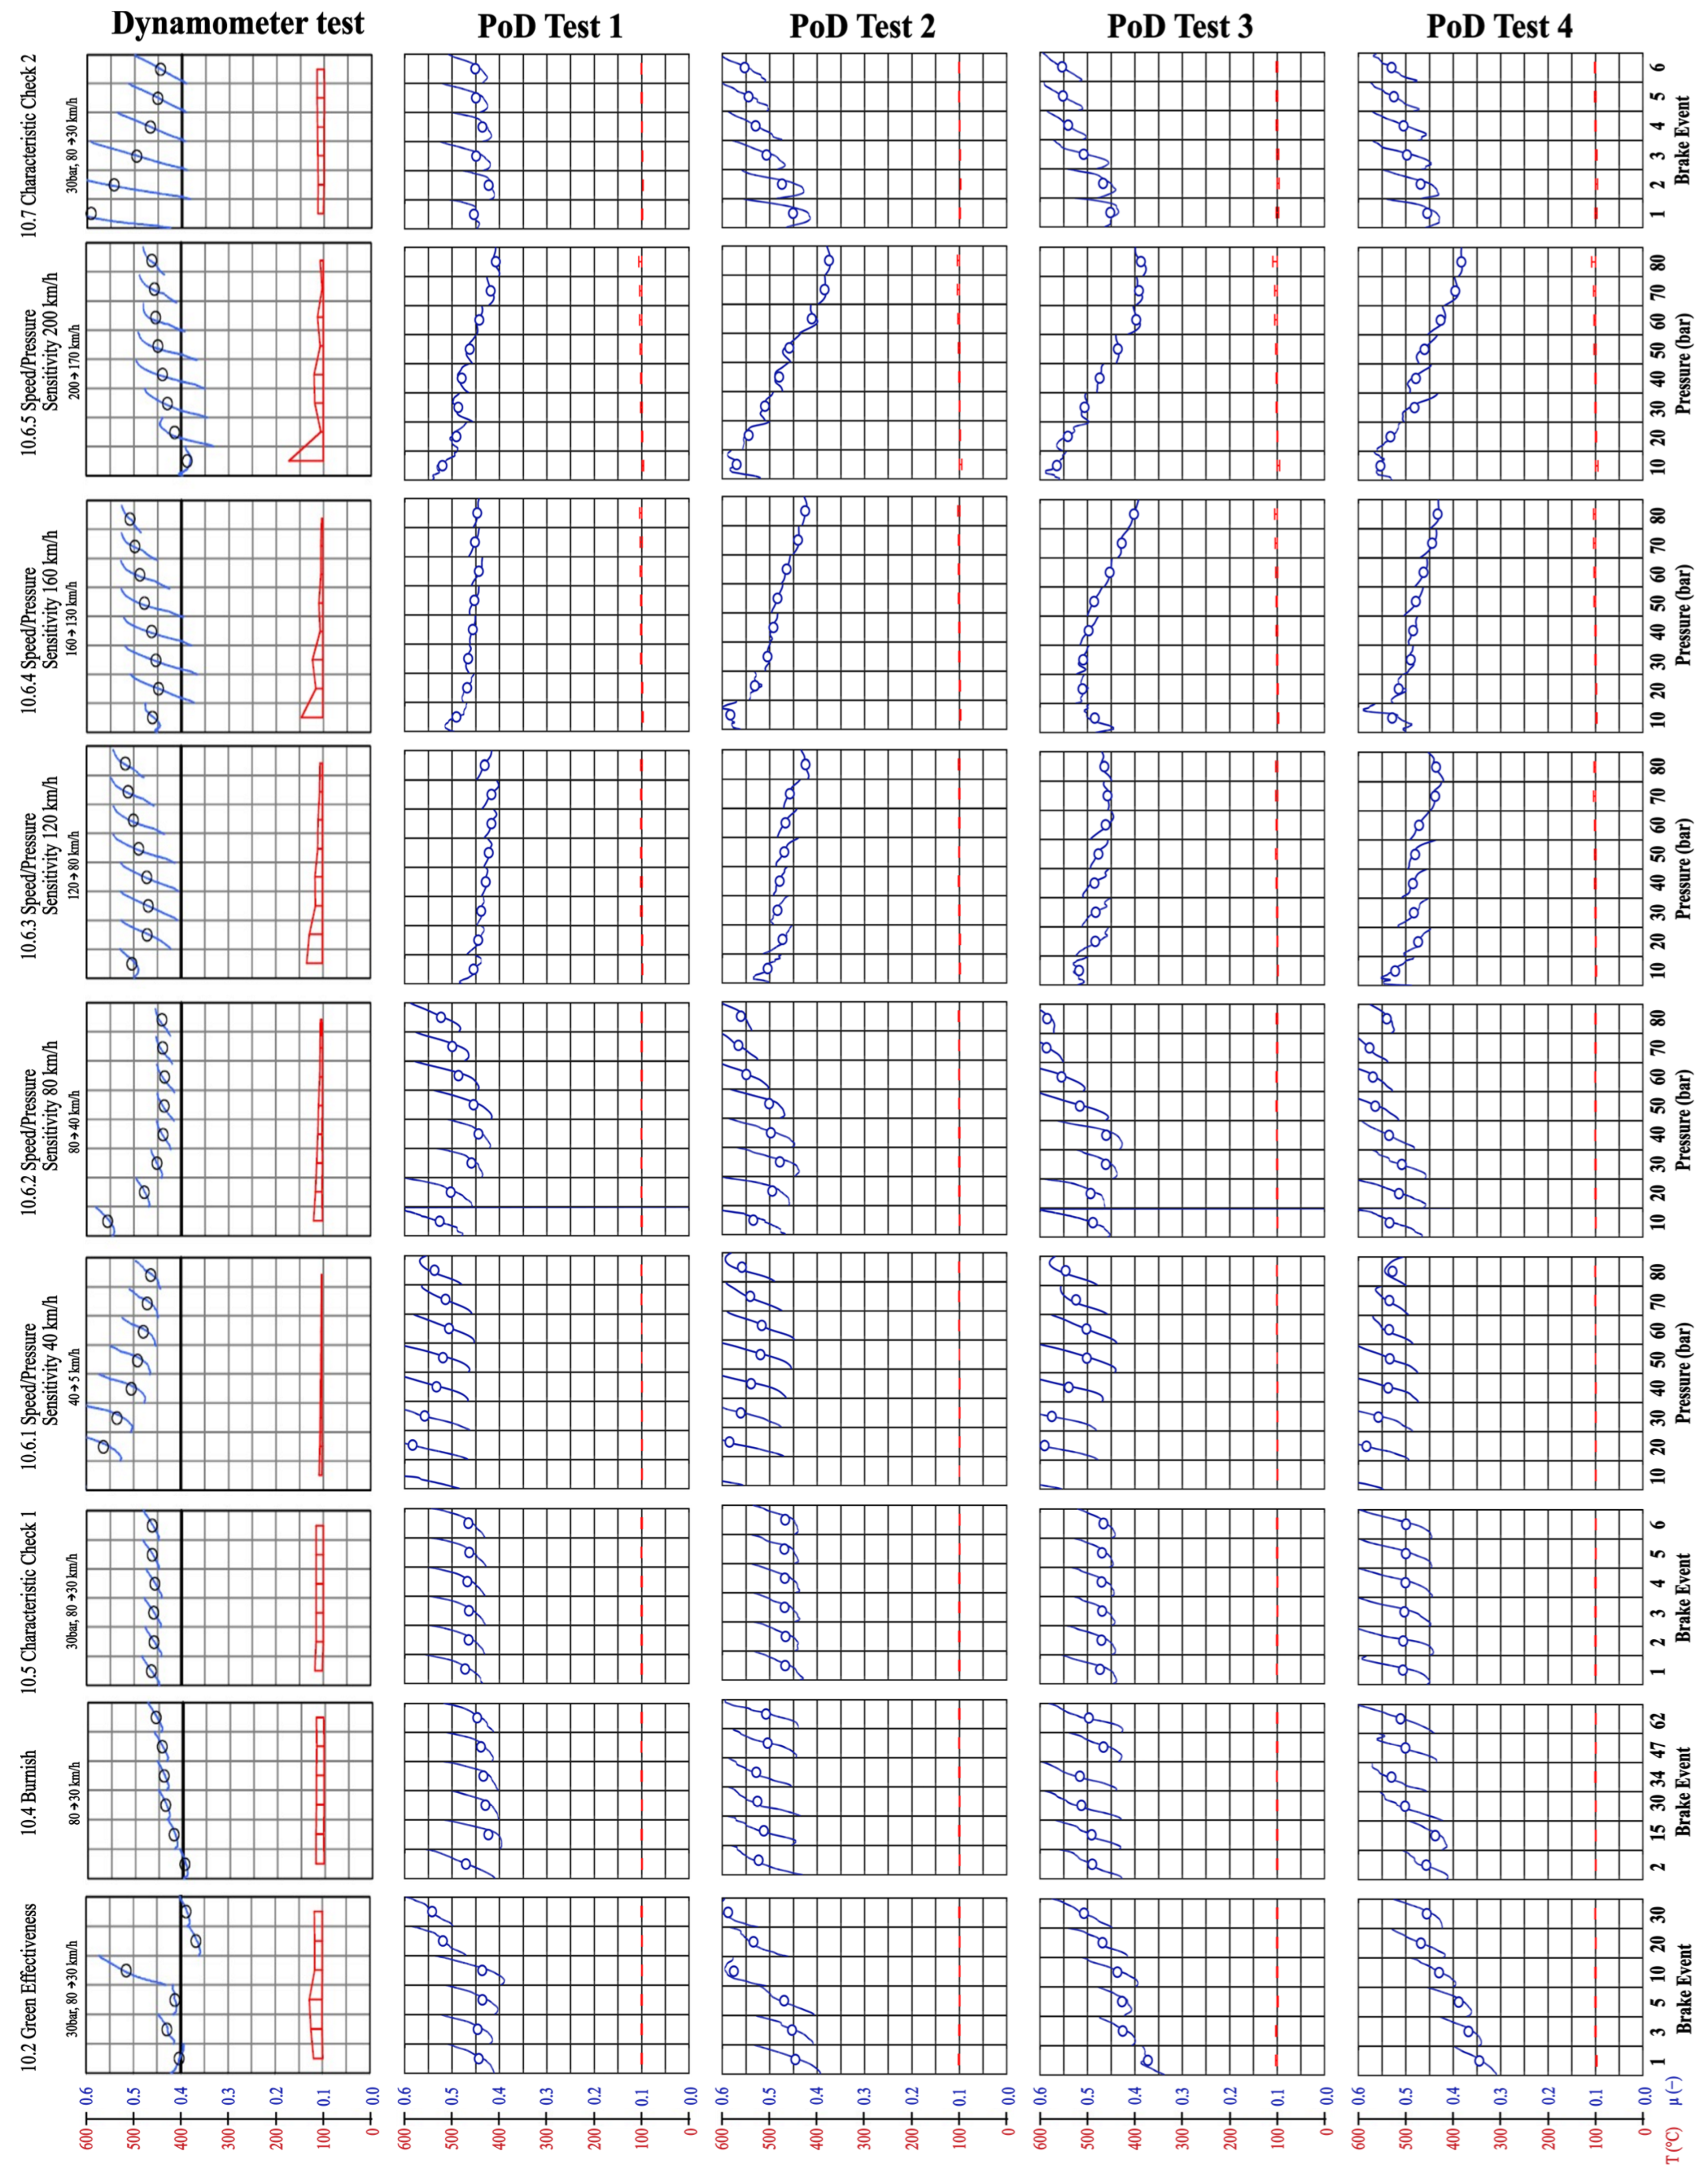
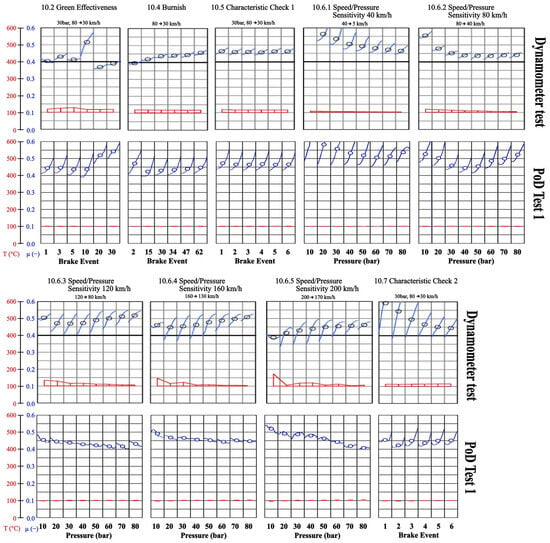
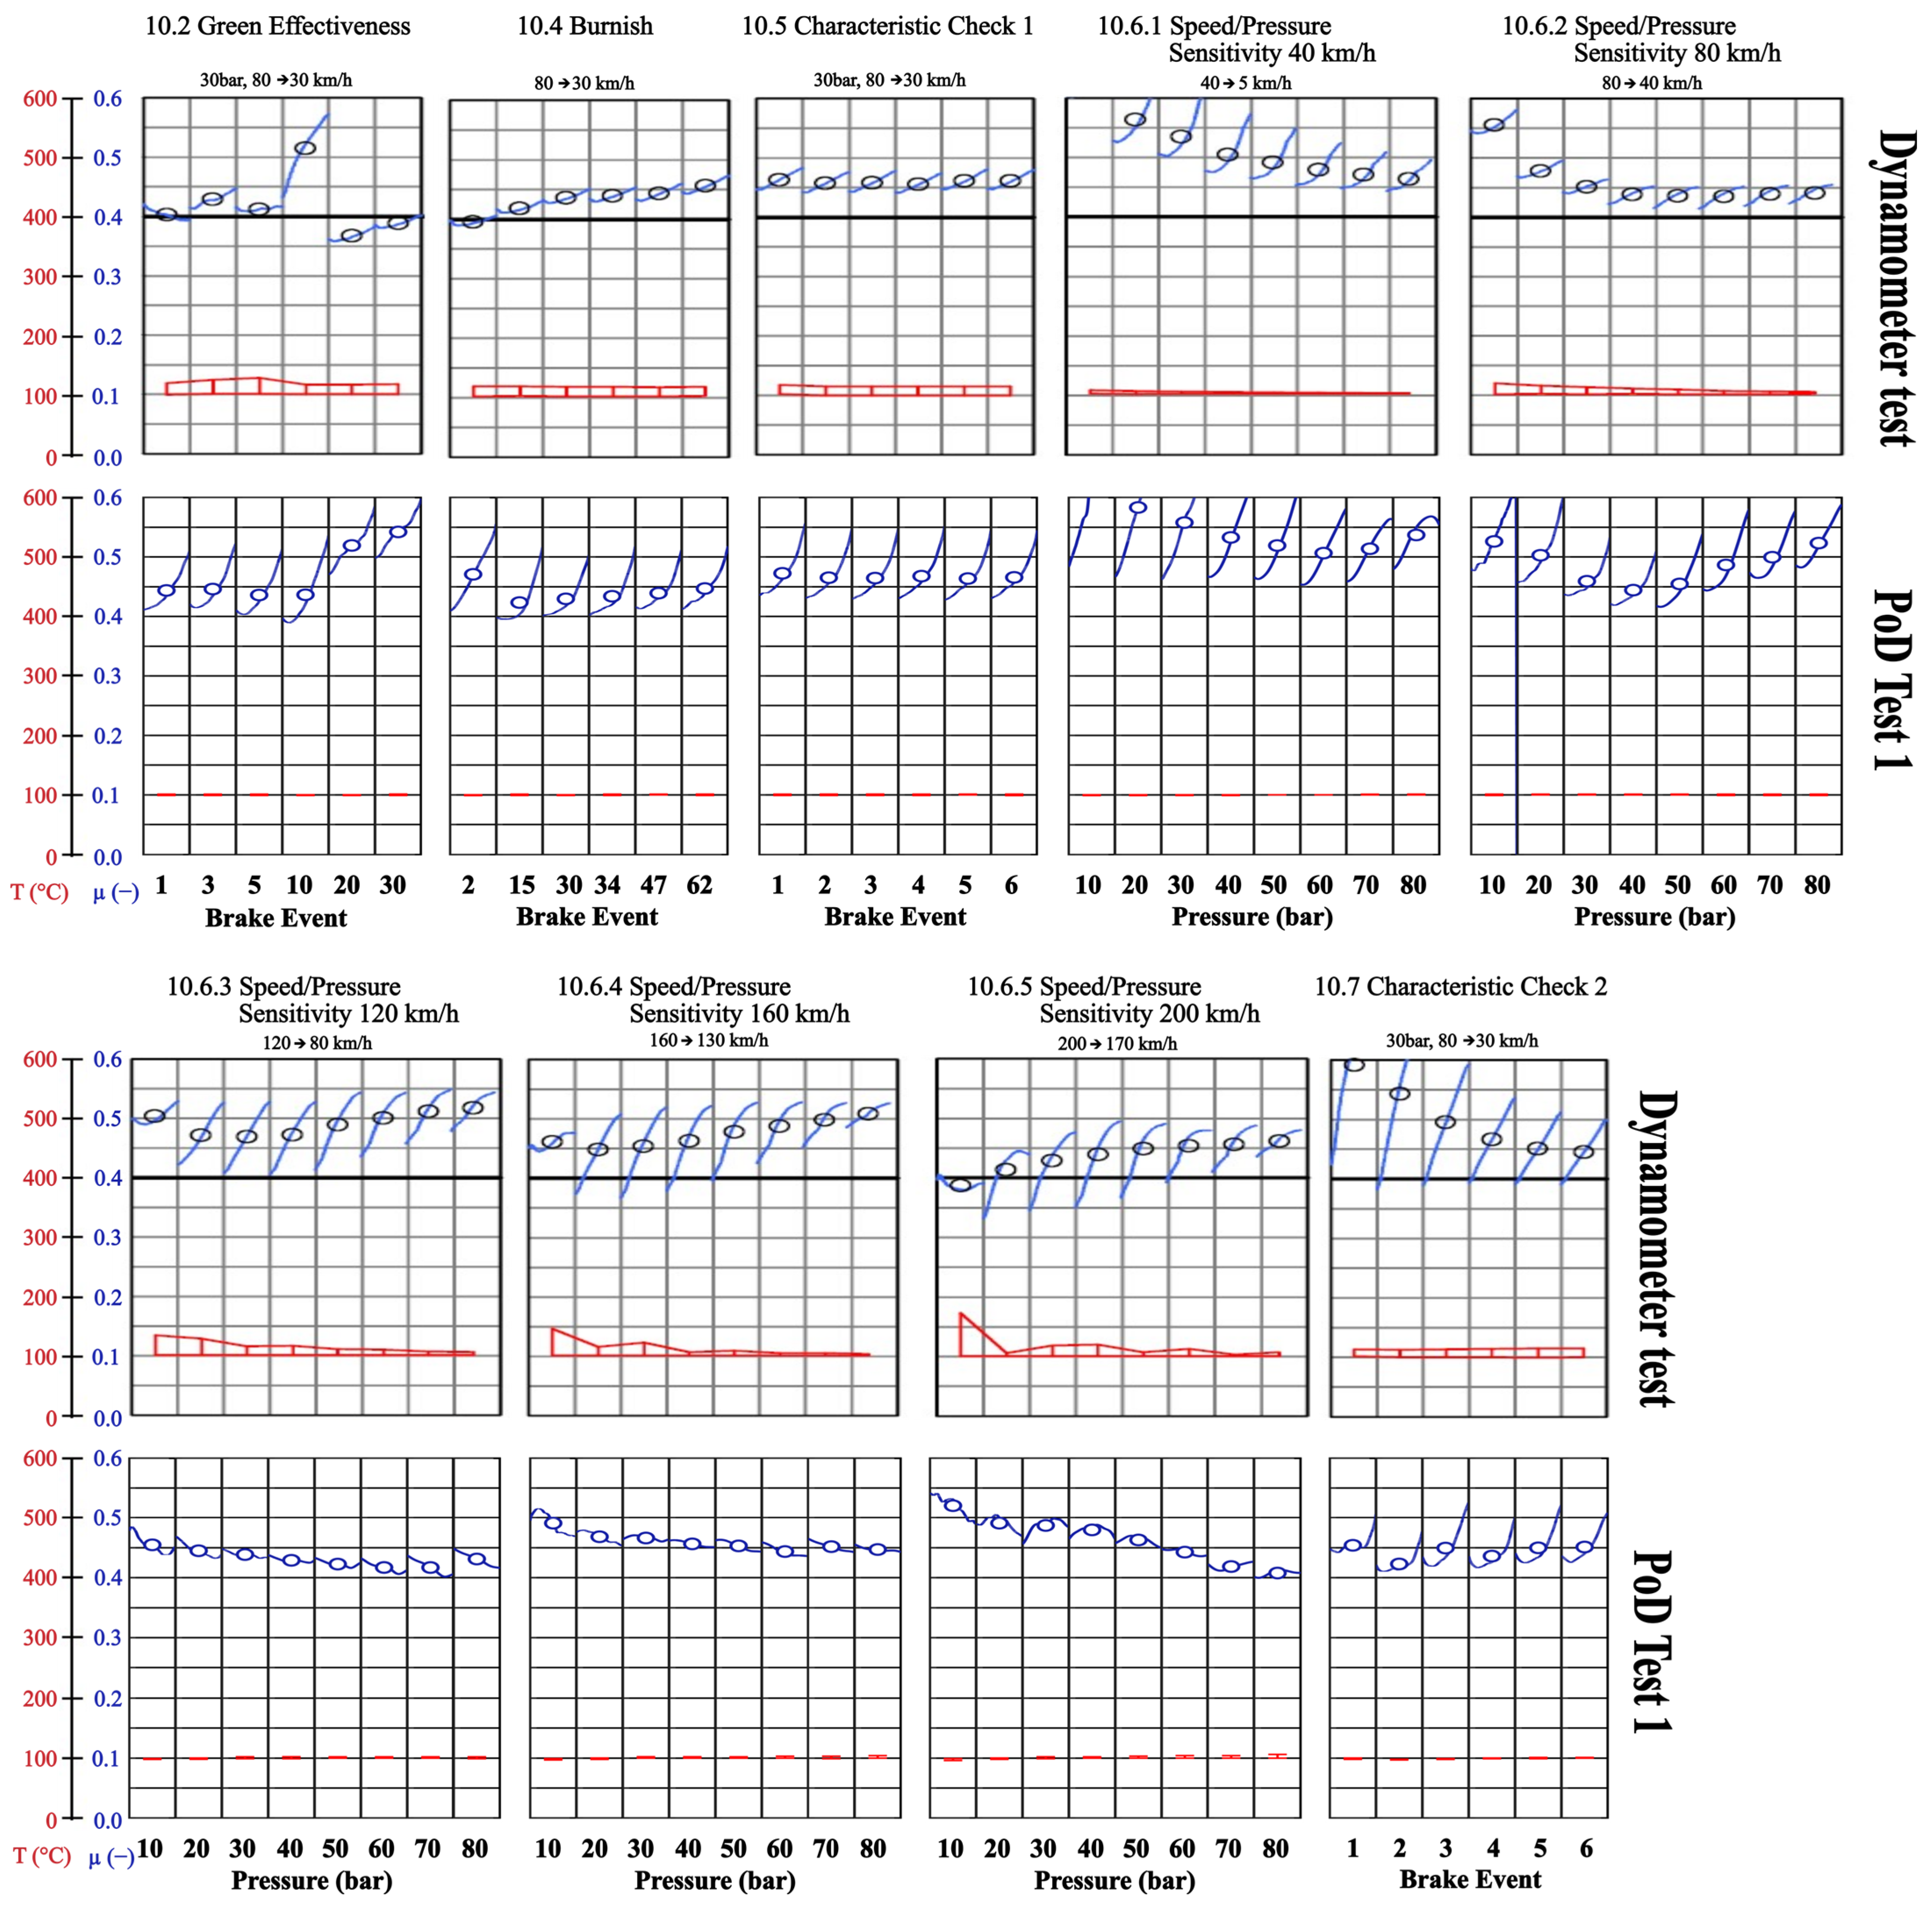
The average COF values from Sections 10.5 to 10.7 are summarized in Table 6. Figure 7 presents evaluation charts generated using the sections selected from SAE J2522 shown in Table 4. The full data set is provided in Appendix A (Figure A1). Each graph corresponds to a single brake application. The plots show the COF (in blue) as a function of time. The blue circular markers denote the mean COF of a single brake event, computed as the average over the measurement window of the brake event. During the post-processing stage, the x-axis of each curve is scaled to the width of the chart. It should be noted that the plotted data sets are derived from raw timeseries, comprising approximately 1600 to 1850 samples per brake event. The graphs also show the minimum and maximum near-contact temperatures of the brake pad (red) from the beginning of the braking process to 20 s afterwards.
Table 6.
Average COF values for PoD tests and dynamometer reference test.
Figure 7.
COF and near-contact temperature charts of the selected sections of the SAE J2522 standard test procedure: (top) dynamometer reference test; (bottom) PoD Test 1.
The Green Effectiveness section (10.2 in Figure 7) does not exhibit consistent friction trends across either test setup. Repeatable brake behaviors for snubs from 80 to 30 km/h are only observed after completing the 192-event Burnish section (10.4 in Figure 7). For Characteristic Value 1 (10.5 in Table 6), the average COF values measured on the PoD setup are approximately 0.02 higher than those obtained on the dynamometer. Across all Speed/Pressure Sensitivity sections (10.6.1–10.6.5 in Table 6), the mean COF on the PoD setup is systematically 0.01–0.03 higher. An exception occurs at 200 km/h, where the PoD test yields a COF approximately 0.07 higher. The friction levels determined for Characteristic Value 2 are measured directly after the 200 km/h pressure cycles (10.6.5 in Table 6). The average COF for Characteristic Value 2 (10.7 in Table 6) is very similar in magnitude on both test rigs. However, a closer examination of the individual brake events (10.7 in Figure 7) reveals that, on the dynamometer, the COF curves for the first four events are at a higher level. With an increasing number of brake events, the curve gradually returns to the baseline established in Characteristic Value 1. In general, the dynamometer test shows a decrease in average COF with increasing relative speed. On the tribometer, this trend is evident up to 120 km/h. Beyond this speed, the COF remains essentially constant or increases slightly. At low speeds, particularly up to 80 km/h, the dynamometer indicates a tendency for the COF to decrease with increasing brake pressure.
3.1. Speed Sensitivity of the Coefficient of Friction
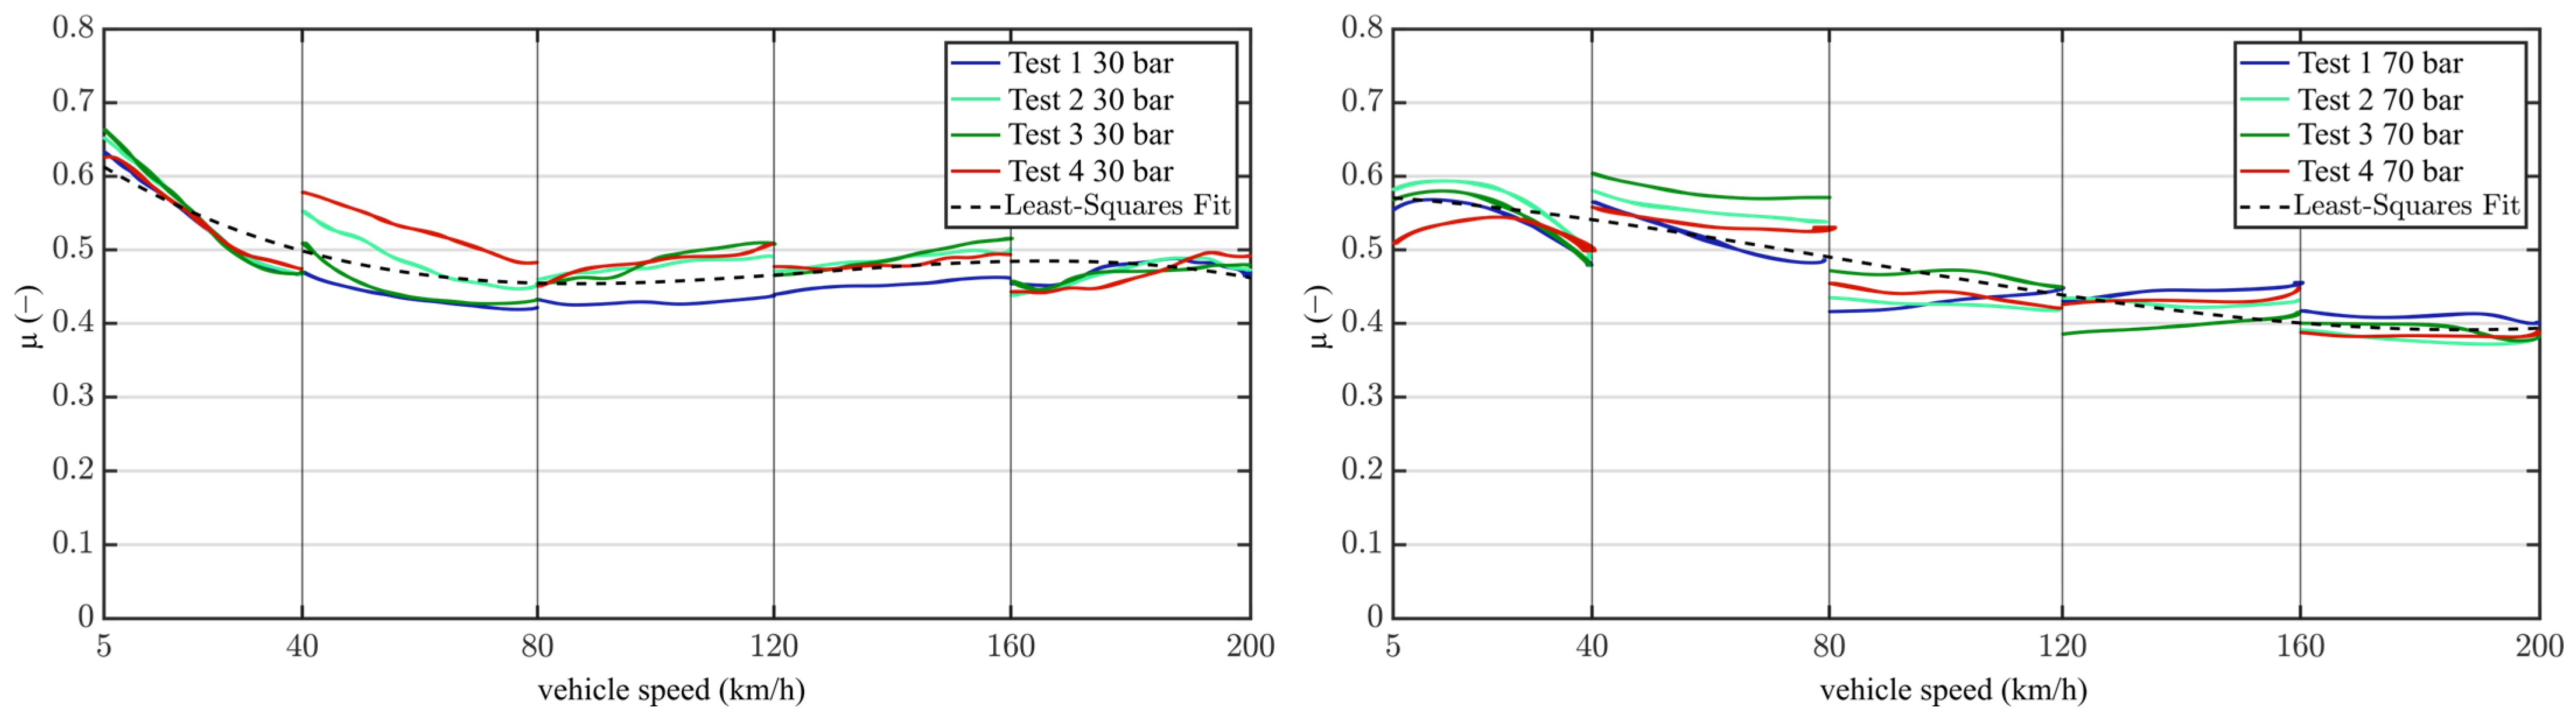
To analyses how the COF depends on sliding speed, Figure 8 shows the data from brake applications at 30 bar and 70 bar as determined from the experiments. Each visualization shows a total of 20 brake applications, with five data sets for each of the four experiments on the different speed levels. The dashed black curve was obtained by fitting a third-order polynomial to the data sets using the least-squares method on the overall data points. The fitted curve at 30 bar shows a pronounced downward trend up to a sliding speed of 80 km/h. Thereafter, the curve remains almost constant.
Figure 8.
Speed sensitivity of the 4 tests on the PoD tribometer at different pressure levels: (left) 30 bar; (right) 70 bar.
The fitted curve of the COF for 70 bar brake applications shows a more consistent decrease as the sliding speed increases. Collectively, these results indic −ate that friction tends to decrease at higher pressure levels. It is important to note that, for the purpose of these scaled PoD tests, a constant COF of 0.45 was utilized to calculate the deceleration ramps. In the sections corresponding to initial speeds of 120, 160 and 200 km/h, the COF predominantly remains within the range of 0.45 ± 0.05. However, at lower initial speeds and low-pressure levels, the COF increases to values of up to 0.65. Consequently, under these conditions, the tribometer introduces comparatively more energy than initially calculated. Furthermore, the overall error in the total energy remains low, as the energy calculated in Equation (9) depends on the sliding distance, which is relatively short for low-speed applications below 80 km/h. Kim et al. [42] investigated the influence of contact area on the velocity-dependent weakening of the COF in LM brake pads. Their findings demonstrated a decrease in COF from 0.7 to 0.4 as velocity increased. Similarly, Eriksson and Jacobson [43] observed a comparable μ–v relation in LM friction linings under both acceleration and deceleration conditions.
3.2. Near-Contact Temperature
On the PoD tribometer, the maximum near-contact temperature measured 3 mm below the friction interface at the outer surface of the pin was approximately 105 °C. The highest recorded values were observed in the 200 km/h and 80 bar cycles. It is important to note that the true flash temperatures at the contacting surface are significantly higher than at a depth of 3 mm. Several authors investigated the temperature distribution for disc and brake pad material [1,2,24,44]. The highest measured near-contact temperatures within the Speed/Pressure Sensitivity sections on the inertia dynamometer occurred at the lowest pressure level of a given stage, with a peak value of approximately 170 °C. In this study, the comparison of friction behavior across two test rigs and specimen geometries was restricted to selected sections to minimize thermal degradation of the lining.
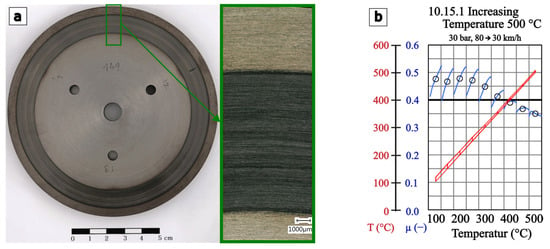
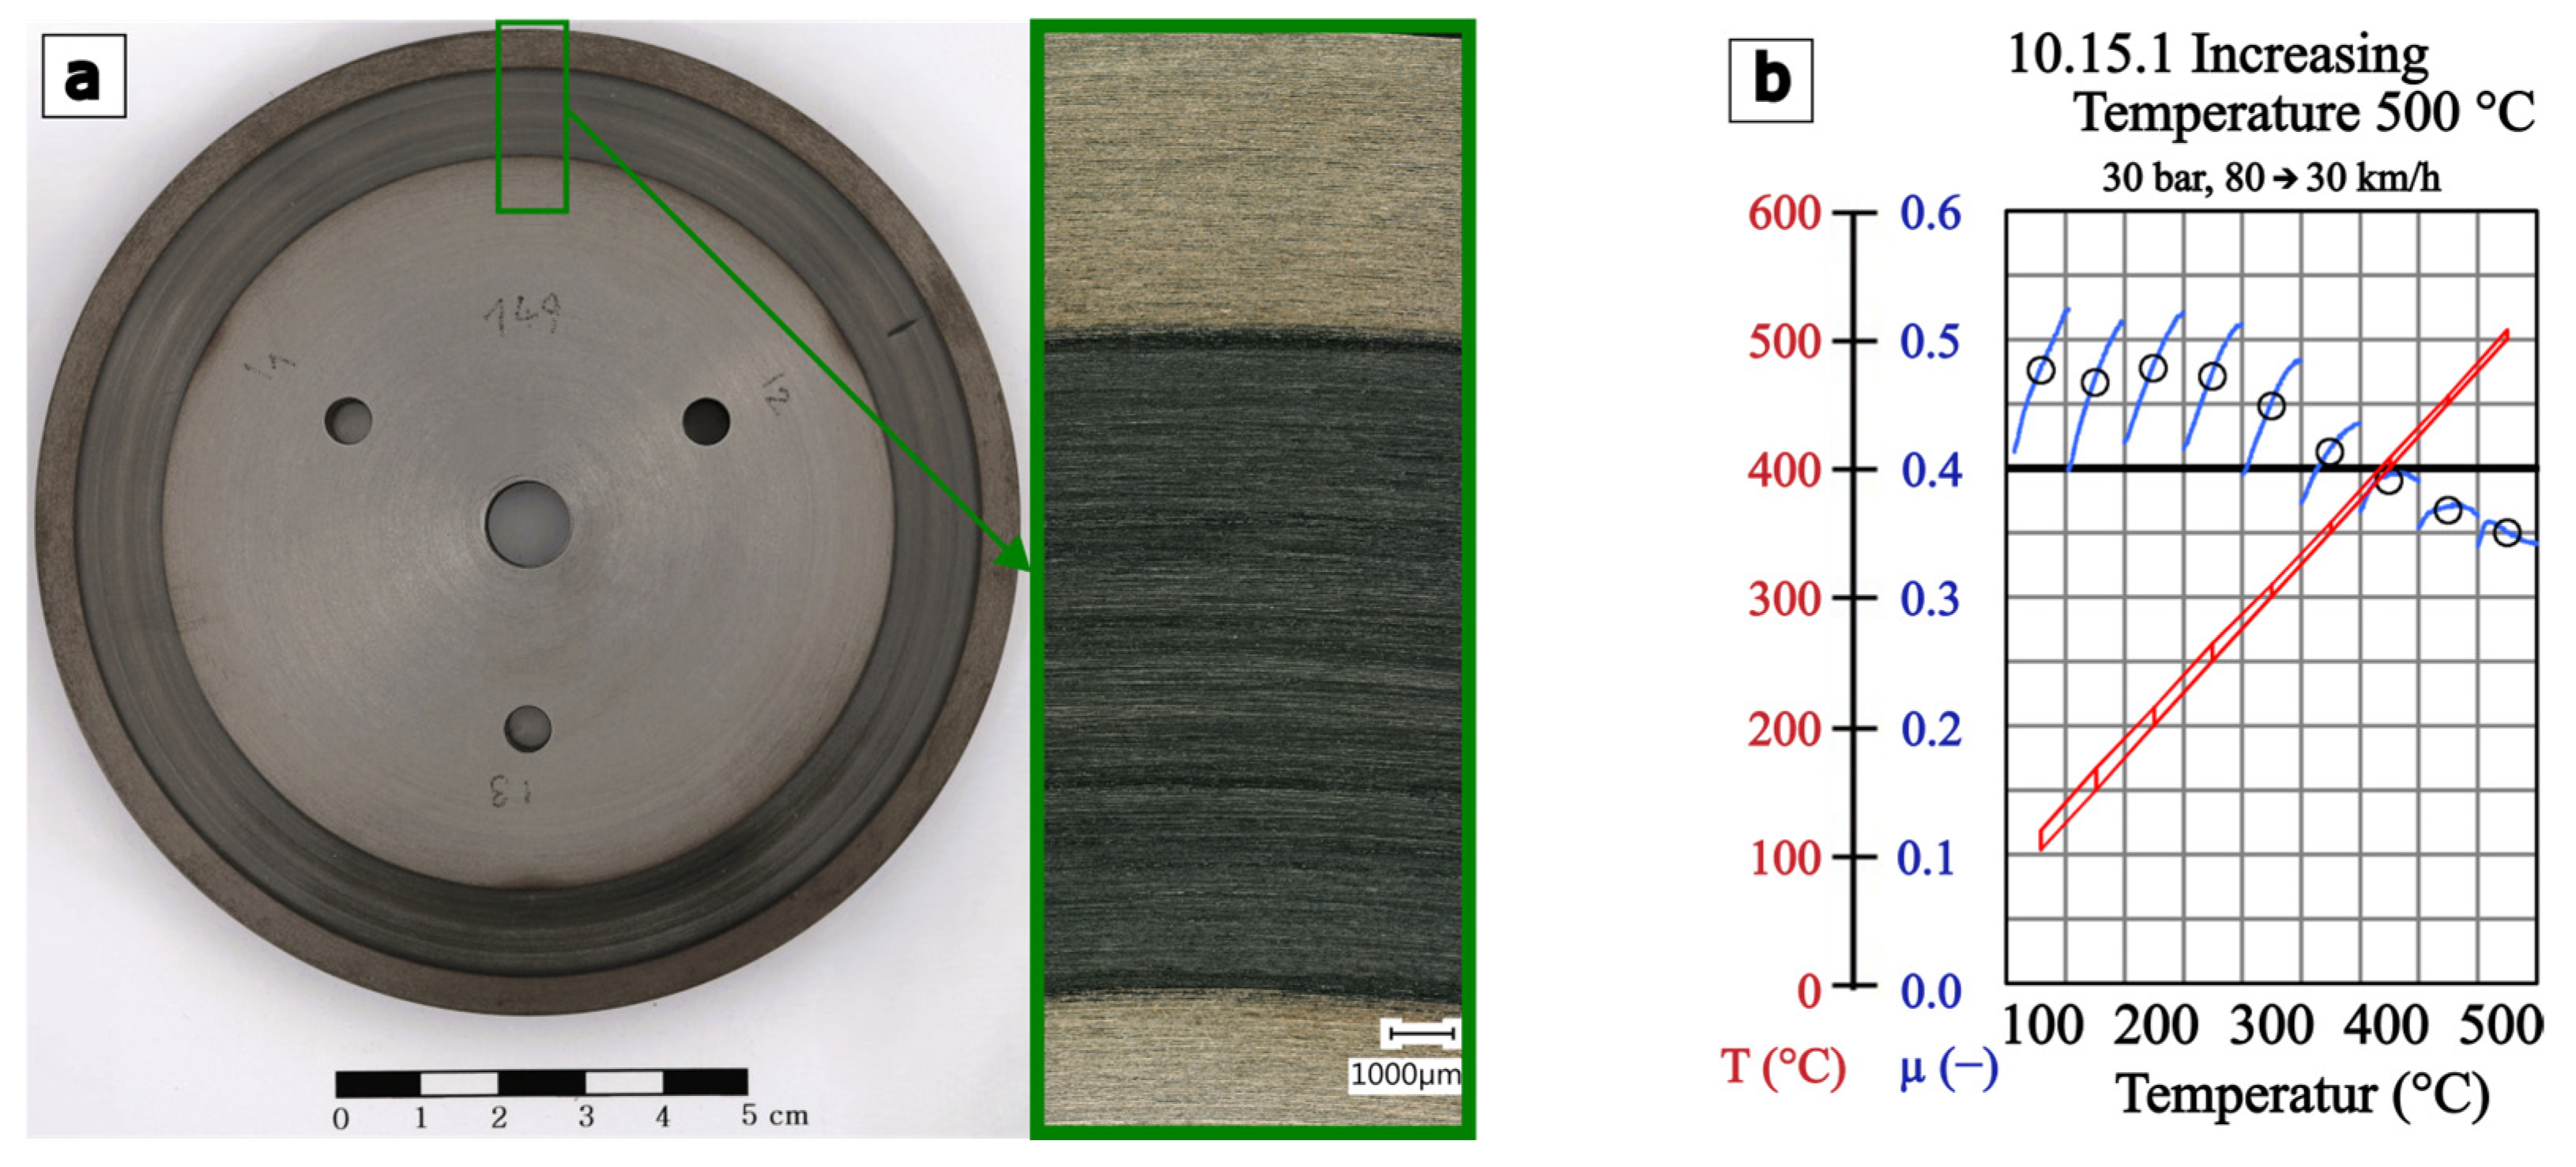
Although the measured maximal pin temperatures during the tests were in the range of 104.2 °C and 109.1 °C, subtle traces of temper colors are visible in Figure 9a on the disc surface outside the actual contact area. This observation suggests that the actual contact temperature was higher than 180. It should be noted that temper colors result from oxidation on the cast iron surface and are influenced by both the surface temperature and the duration of exposure [45]. Figure 9b shows the results of the Increasing Temperature section from the dynamometer test, where the contact temperature increased from 100 °C to 500 °C over nine braking events. The COF remained nearly constant up to 250 °C but declined noticeably beyond this threshold.
Figure 9.
(a) Images of the ductile cast iron surface after the test, (b) COF and contact temperature during the Increasing Temperature 500 °C section of the dynamometer test.
3.3. Wear Analysis
The wear of the brake friction lining and the disc is outlined in Table 7. The dynamometer values were recorded after the execution of a fully completed SAE J2522 test procedure, with an additional 121 brake applications performed. As a result, direct comparisons between pad and disc wear are not feasible. As illustrated in Table 7, the calculated wear rates for each test are determined with Equation (17). The mean wear rates for the brake pad sample and the disc sample measured on the tribometer were determined to be Ka,mod−brakepad = 5.30 ∓ 1.16·10−14 m2/N and Ka,mod−disc = 1.49 ∓ 0.32·10−14 m2/N. In comparison, the wear rates on the dynamometer were slightly lower, with values of 4.60·10−14 m2/N for the brake pad and 1.89·10−14 m2/N for the disc.
Table 7.
Brake pad wear, gravimetric disc wear and specific wear rates of both components.
Candeo et al. [41] investigated the correlation between wear emissions and brake materials for various NAO and LM brake pad materials. They observed wear rates in the range of 1.86 − 4.83·10−14 m2/N for LM brake pad materials and 0.71 − 1.29·10−14 m2/N for cast iron disc material. These results were obtained from scaled dynamometer tests using a test procedure that included sections of the SAE J2522 standard (e.g., Green Efficiency and Bedding), as well as slightly modified Speed and Pressure Sensitivity sections (20–110 bar and 40–160 km/h). Francesco et al. [19] investigated wear rates and COF of LM brake pads of the individual pad constituents to simulate the COF and wear of a brake system. The compound of the individual constituents of the low-steel brake pad was 4.4·10−14 m2/N and 2·10−14 m2/N for the disc, while the wear rates of the constituents were in the range of 1.3·10−13 m2/N (silicon carbide) to 1.1·10−15 m2/N (graphite). All in all, the wear rates observed in this study are high compared to values reported in the literature. However, several authors have demonstrated that wear rates are highly dependent on brake pad composition [19,41] and test parameters [24,46].
In Figure 9, wear grooves on the disc are clearly visible, and a darker band extends across the entire contact path. Carlevaris et al. [22] demonstrated that, for a pin with an almost exclusively graphite-based composition, a transfer layer forms on the disc surface that appears dark under an optical light microscope. This study also reported that this transfer layer develops under conditions of stable friction over the duration of the test. The adhesive interaction layers between the pad and the disc interface can substantially influence the friction behavior of a given material pairing [22,38,47]. Awe and Lattanzi [48] demonstrated that this protective tribological layer is more pronounced under higher loads, resulting in a lower COF than under lower loads.
3.4. Surface Analysis of the Cast Iron Lining
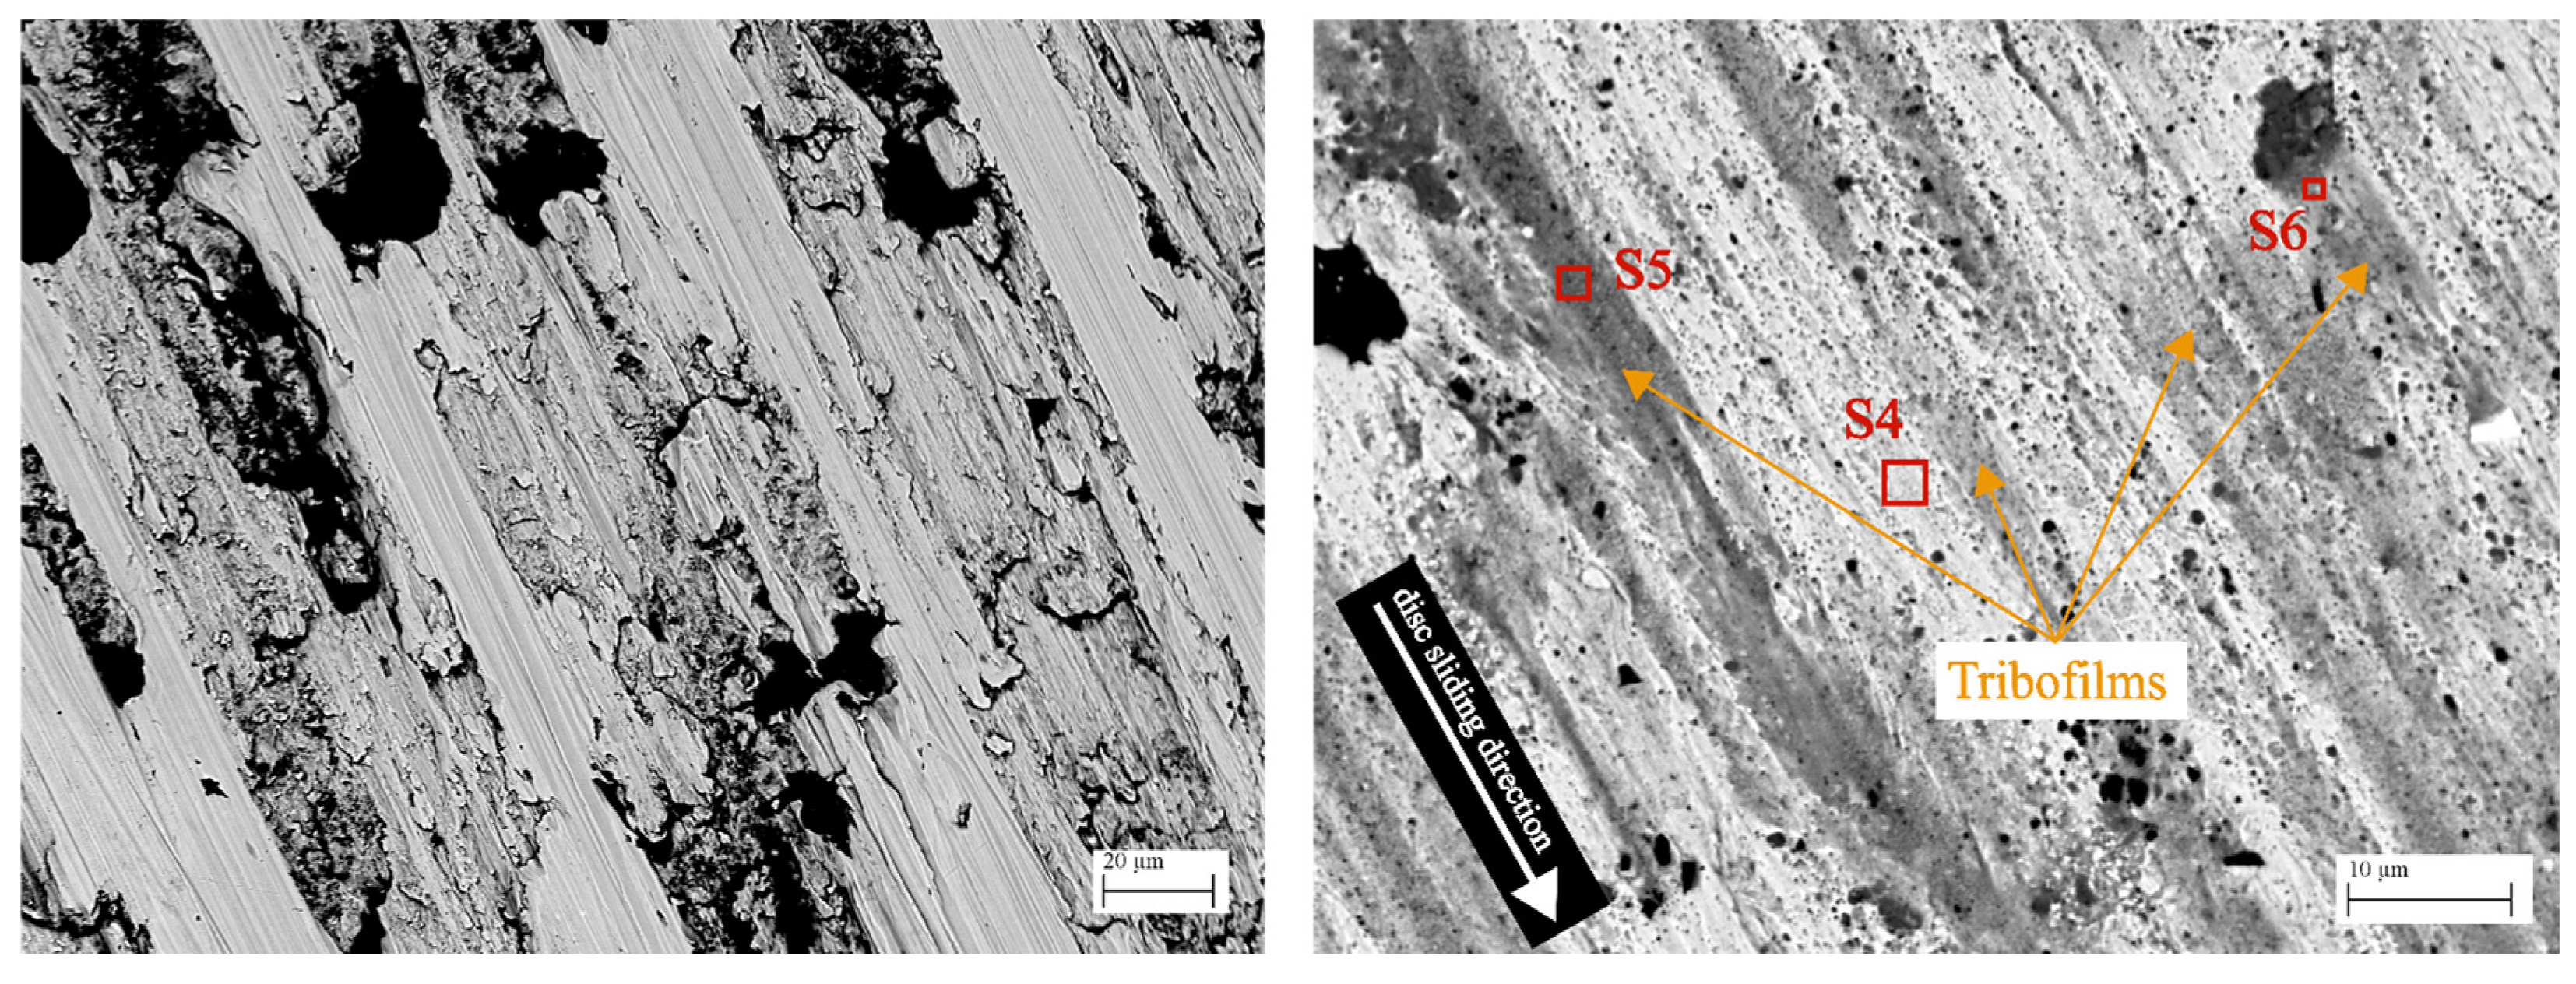
As illustrated in Figure 10, two SEM backscattered electron (BSE) images are presented, depicting the surface of a disc in its initial state and a disc that has undergone testing. Turning grooves, which are evident on the unused surface, are indicative of the manufacturing process. The dark regions correspond to graphite nodules that are characteristic of ductile cast iron, while the remaining area is dominated by the chemical composition of ferritic grains.
Figure 10.
BSE image of the cast iron lining: (left) initial disc surface; (right) worn disc surface.
The BSE image acquired within the wear track (see Figure 10 right) also indicates the presence of graphite nodules. Furthermore, the presence of brighter and darker regions of contrast is observed. EDX analysis (Table 8) indicates that the brighter regions (Spectrum 4) contain high concentrations of Fe, but also components of C, O and Si. Spectrum 4 indicates the chemical base composition of the ductile cast iron disc, as outlined in Table 8. Spectra 5 and 6, which were obtained from darker regions, exhibited reduced concentrations of Fe and elevated concentrations of C, O, Mg, Al, and Zn in comparison to Spectrum 4. EDX analysis reveals the presence of other elements in low concentrations, including S, Ca, and Ti, in both spectra. The compositional disparities observed between Spectra 4 and 5–6 indicate the development of tribological layers within the worn track. Barros et al. [49] investigated the influence of pressure and sliding speed on the formation of tribological layer on a brake disc surface. The study demonstrated that the quantity of tribological layer diminished with increasing pressure (1.5–4.5 MPa) and sliding speed (2–6 m/s). The lowest wear values were observed in conjunction with the presence of the greatest quantity of tribological layer on the disc surface.
Table 8.
EDX analysis results of the disc surface; 15 kV (results in weight-%).
3.5. Surface Analysis of the Friction Lining
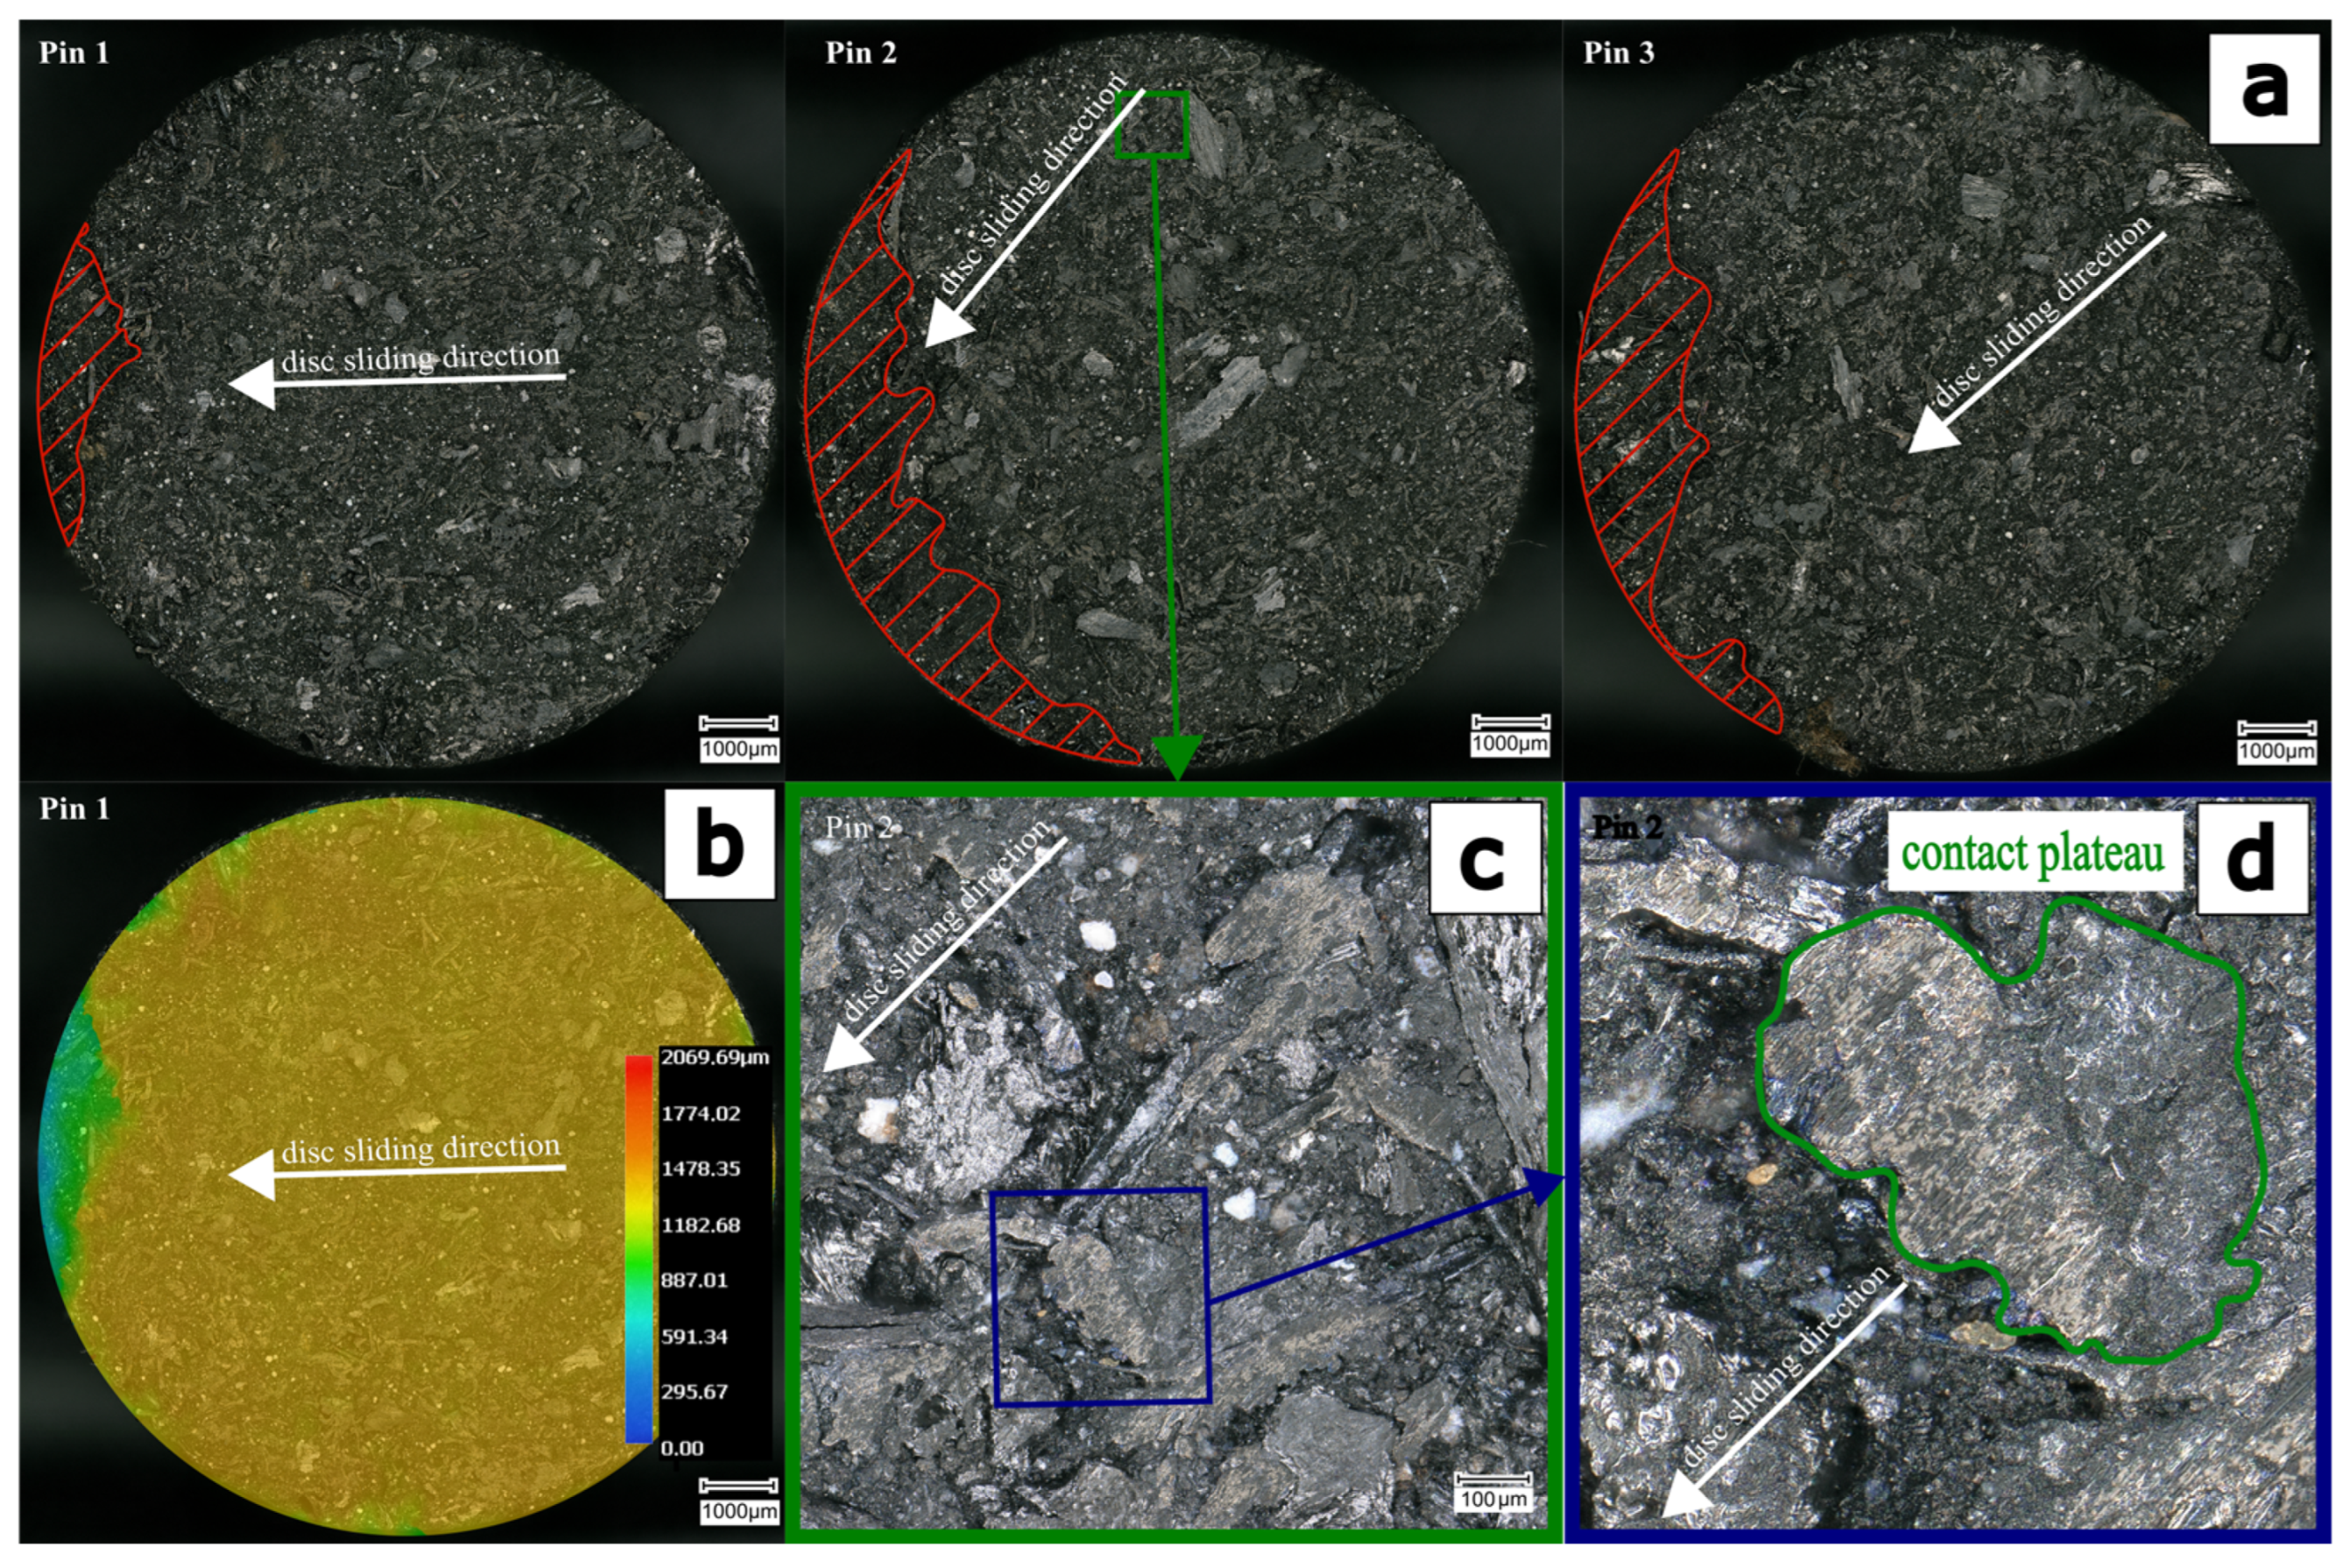
Figure 11 shows light microscopy images of the three pins from the second test. The regions highlighted in red in Figure 11a fractured and chipped during the test. Figure 11b shows a color-coded height profile of the pin to visualize its macroscopic topography. All pins exhibited a tendency to chip on the trailing side, which is the opposite of the engagement point. Such chipping reduces the effective contact area of the pins. For a constant normal load, a smaller nominal contact area increases the nominal contact pressure, which can result in higher local loading and increased wear. Consequently, the observed area reduction may serve as an indicator of increased wear, as reported in Table 7.
Figure 11.
Light microscopy images of the friction lining after the test: (a) surface analysis of the three pins after the test (chipped area is highlighted in red); (b) height profile of pin 1; (c) and (d) detailed images of the surface contact plateau (highlighted in green).
Eriksson and Jacobson [20], in “Tribological surfaces of organic brake pads,” describe the contact situation between an organic pad and a cast iron disc. Brake pads are composite materials comprising constituents with widely differing mechanical properties. The hardness of abrasive particles is approximately 100 times greater than that of solid lubricants. As a direct consequence of this, the nature of the contact situation becomes highly complex.
Several authors investigated primary and secondary contact plateaus, which form on the surface of the brake pad. Primary plateaus often consist of worn, mechanically stable fibers (frequently steel fibers), which are harder than the surrounding matrix and thus remain protruding. Functionally, these plateaus act as obstacles in the sliding interface. Debris released from the pad accumulates on leading edges of primary plateaus. Under the combined action of normal pressure and frictional heating, this debris becomes compacted and forms secondary plateaus. Secondary plateaus form and collapse locally, while loose wear particles traverse the intermediate layer between brake pad and disc. Owing to pad topography, the real contact area consisting of primary and secondary plateaus is small compared with the total nominal pad area. Plateau size depends on mechanical and thermal loading of the brake pad. Under mild braking, secondary plateaus typically measure 50–500 μm in diameter and cover roughly 10–20% of the nominal pad area. At higher temperatures and pressures, plateaus may exceed millimeter scale and can cover most of the pad surface. When mechanical and thermal load is reduced, degradation mechanisms dominate and the secondary plateau area correspondingly shrinks [47]. Overall, growth and degradation of secondary plateaus modulate the average composition of the sliding interface and thereby influence both the magnitude and stability of the COF. The regions surrounding these plateaus are typically composed of mechanically weaker constituents and are predominantly worn by third-body abrasion [5,35,38,50,51].
Figure 11c,d illustrate microscopic images obtained at ×1000 magnification. In the provided images, the contact plateaus of the brake pad material manifest as grey and brown areas. However, it is not possible to differentiate between the primary and secondary plateaus using light microscopy images.
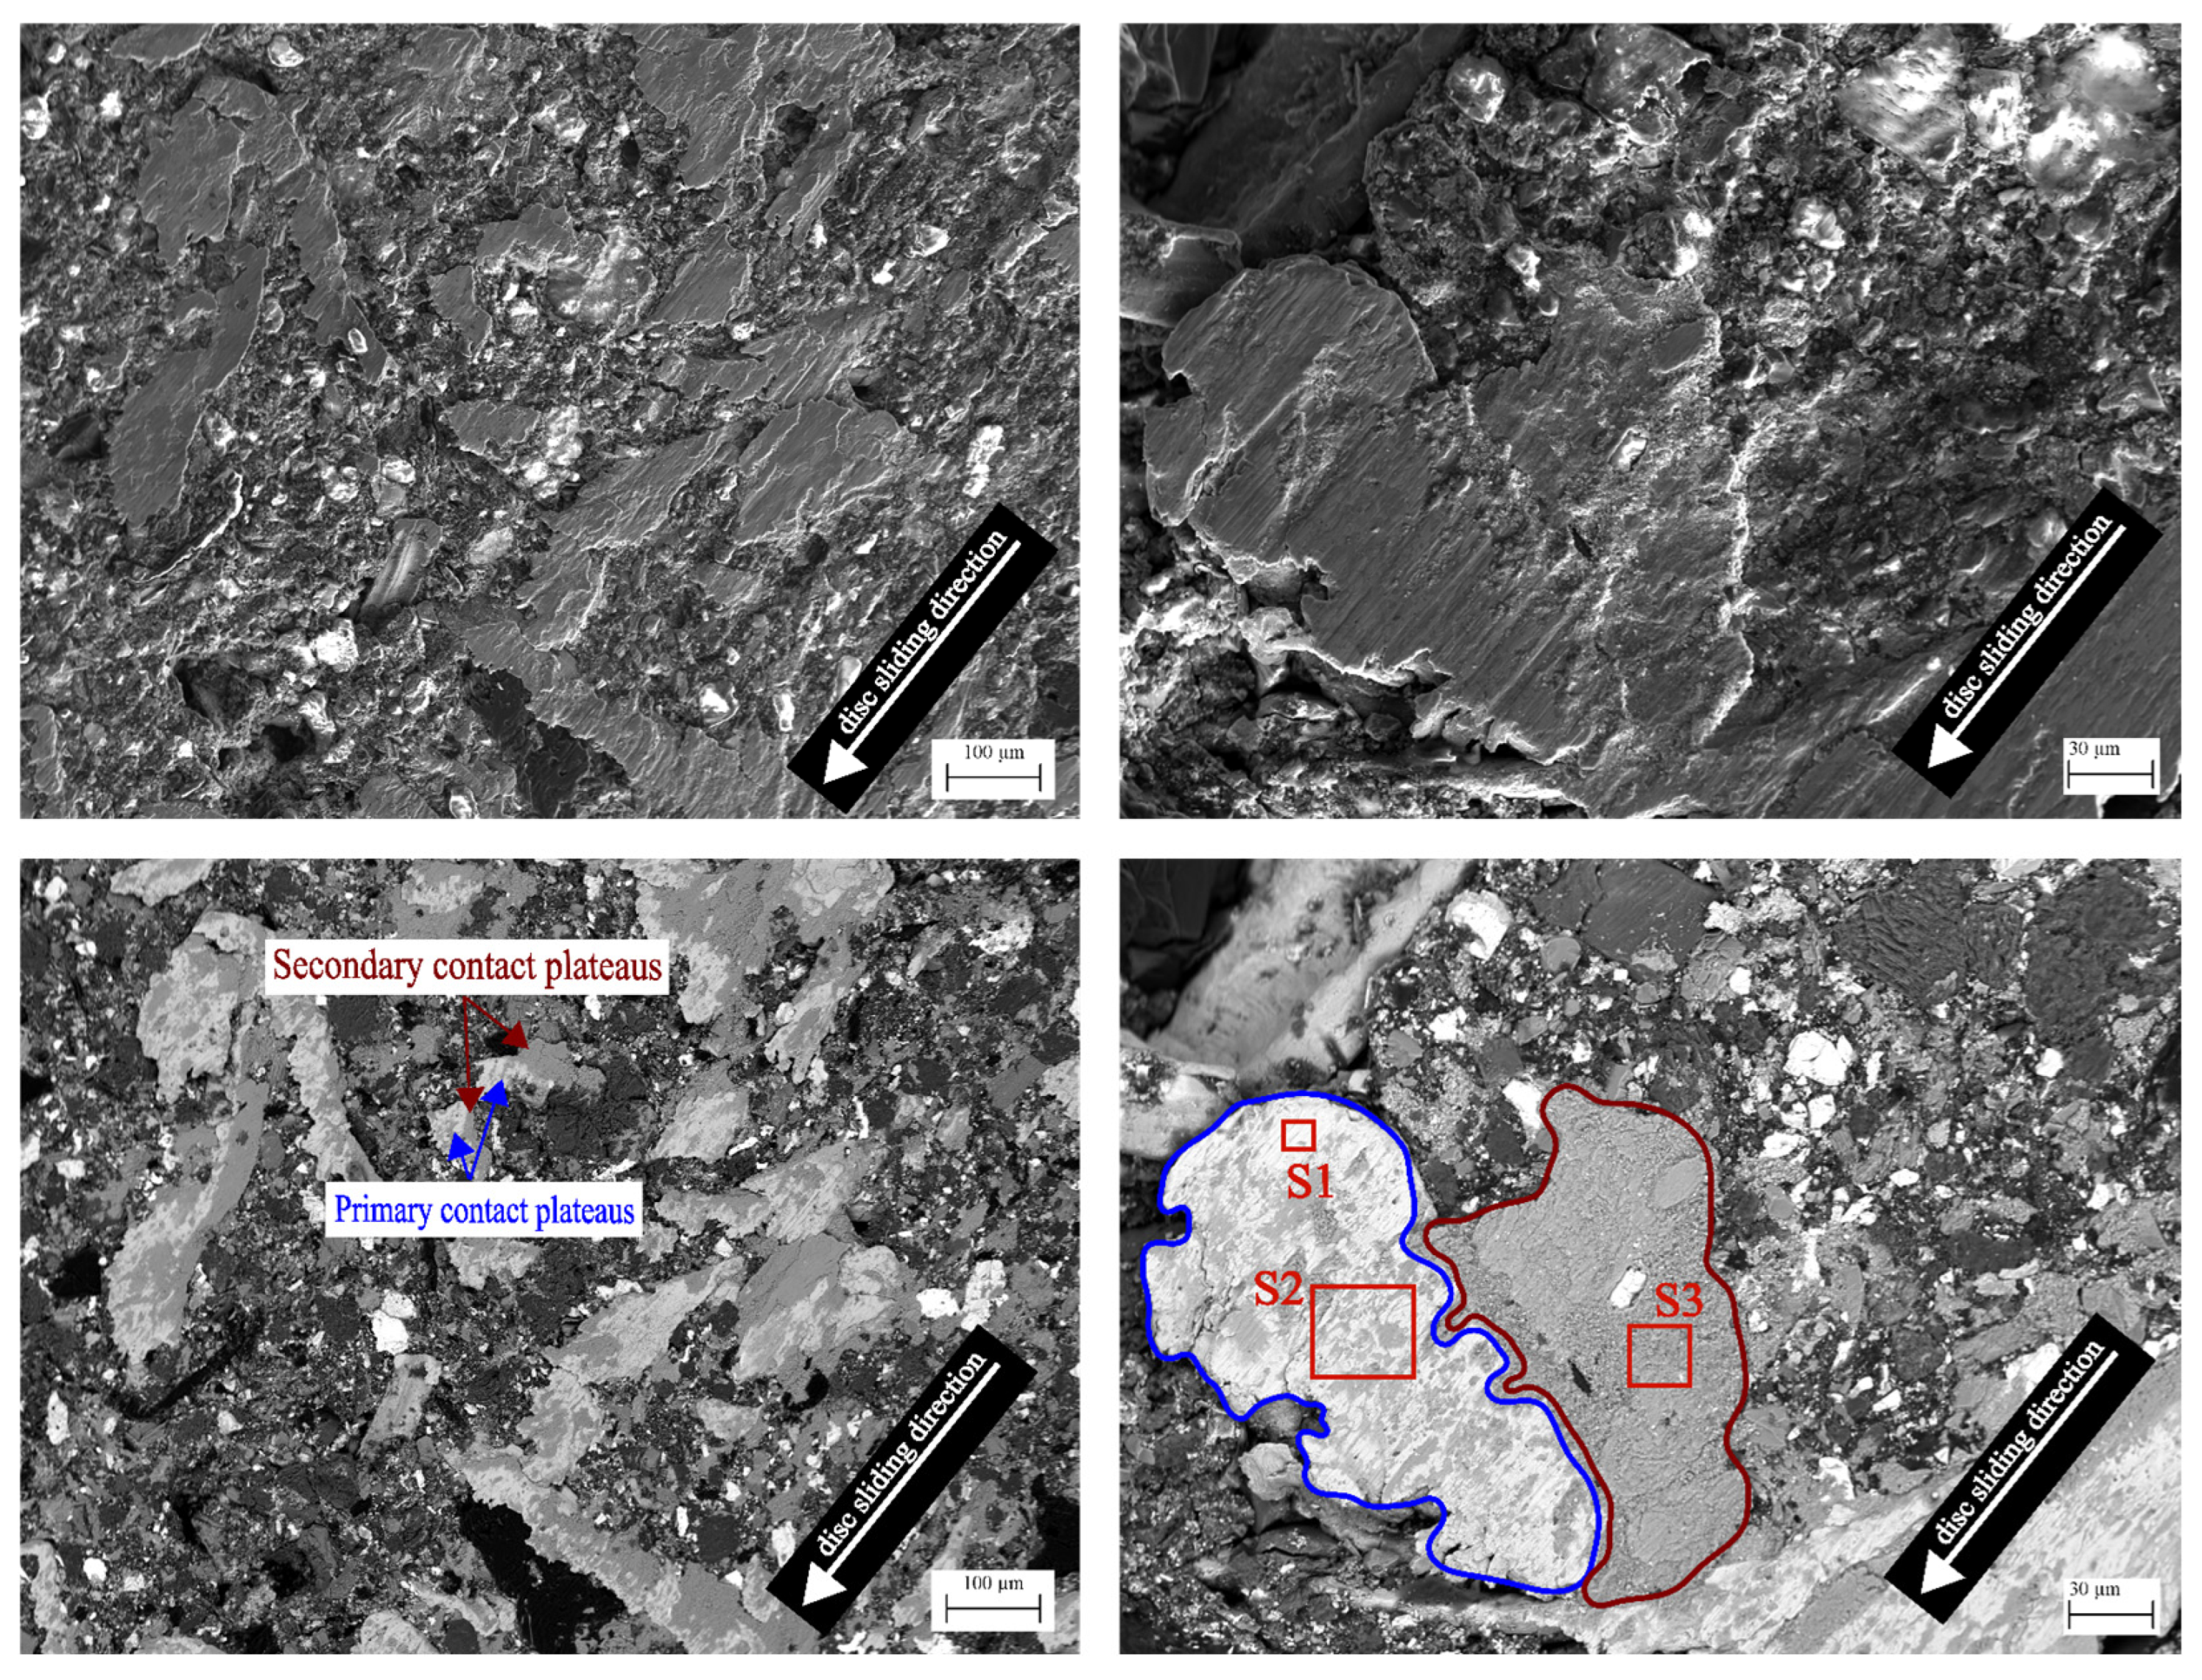
Figure 12 presents SEM images that distinguish between primary and secondary contact plateaus. In the BSE images, the primary metallic plateaus appear brighter than the secondary plateaus, which are formed by compacted, oxidized wear debris and appear darker. The left SEM image displays multiple plateaus, which are positioned in conjunction with the surrounding, lower-lying pad surface. The image on the right provides a detail of a single contact plateau with EDX measurement Spectra 1–3. The corresponding EDX results are summarized in Table 9. Spectrum 1, obtained from a primary plateau, is predominantly composed of Fe, with minor mass fractions of C and O. Spectrum 2 is dominated by Fe and iron oxides, but also contains elements such as Zn and Mg. Spectrum 3 is highly enriched by Fe and O, as well as typical pad constituents, including C, Mg and Zn. These elements also represent the main components detected in the tribological layers on the disc (Table 8). The darker subregions within a primary plateau indicate localized accumulation of oxidized wear debris embedded within the primary plateau.
Figure 12.
SEM images of the brake pad: (top) SEM images; (bottom) BSE images; (blue) primary contact plateaus; (red) secondary contact plateaus.
Table 9.
EDX analysis results of the brake pad surface; 15 kV (results in weight-%).
4. Conclusions
A PoD setup was used to investigate the friction behavior of three pins of an LM brake pad sliding against a ductile cast iron disc. Selected pressure-controlled brake events from the SAE J2522 test procedure were adjusted for the PoD by matching the frictional energy per nominal contact area to that of the inertia dynamometer. The deceleration for each brake event was derived accordingly. The brake pressure, sliding speed and initial temperature were equal to the dynamometer conditions. A series of four PoD tests with identical test parameters were conducted and analyzed. These results were then compared with those of a dynamometer reference test. Additionally, the surface topography and formation of tribological layers of both contact partners were analyzed and compared with the literature. The following conclusions were drawn from the analysis:
- The PoD test setup yielded systematically higher mean COF values than the dynamometer by approximately 0.01–0.03, with a larger offset of about 0.07 above 160 km/h. Overall, the mean COF measured on the dynamometer decreased with increasing velocity. In contrast, the PoD test results exhibited a less pronounced downward trend, primarily up to a velocity of approximately 120 km/h.
- The COF in the Speed/Pressure Sensitivity sections was pressure dependent. At 30 bar, the COF decreased markedly up to 80 km/h and then approached a plateau. In contrast, at 70 bar the COF declined more uniformly with speed. Increasing pressure yielded a decreasing COF across sliding speeds and exhibited weaker high-speed sensitivity than on the dynamometer.
- The wear rates determined in this study for the brake pad and disc were slightly higher than those reported in the literature, with mean values of Ka,mod−brakepad = 5.30 ∓ 1.16·10−14 m2/N and Ka,mod−disc = 1.49 ∓ 0.32·10−14 m2/N on the tribometer, compared to slightly lower values on the dynamometer. The discussion of wear behavior naturally leads to the consideration of contact temperature, as it plays a critical role in influencing the tribological system.
- The temperature 3 mm beneath the friction contact on the pin was measured to be approximately 100 °C, while temper colors suggest temperatures higher than 180 °C at the contacting surface. Further investigations into temperature distribution are necessary to facilitate a more profound comprehension of their impact on the tribological film formation, COF and wear on the scaled PoD tribometer test.
- The present study demonstrated that brake pad testing using a tribometer provides a useful approach for investigating the speed/pressure sensitivity of brake materials under 160 km/h. While the results obtained on the tribometer showed general agreement with dynamometer tests in selected SAE J2522 sections, they do do not fully support complete validation of novel brake materials.
Author Contributions
Conceptualization, R.S. and M.P.; methodology, R.S. and M.P.; validation, R.S., M.B. and M.P.; formal analysis, R.S.; investigation, R.S.; resources, F.G.; data curation, R.S.; writing—original draft preparation, R.S.; writing—review and editing, M.B., F.G. and M.P.; visualization, R.S. and M.B.; supervision, M.P. and F.G.; project administration, M.P. All authors have read and agreed to the published version of the manuscript.
Funding
This research received no external funding.
Data Availability Statement
The data presented in this study are available at the request of the corresponding author.
Conflicts of Interest
The authors declare no conflicts of interest.
Abbreviations
The following abbreviations are used in this manuscript:
| COF | Coefficient of Friction |
| PoD | Pin on Disc |
| SAE | Society of Automotive Engineers |
| SEM | Scanning Electron Microscope |
| EDX | Energy Dispersive X-ray Spectroscopy |
| BSE | Backscattered Electrons |
| EURO 7 | European Emission Standards (Stage 7) |
| LM | Low Metallic |
| SM | Semi-Metallic |
| NAO | Non-Asbestos Organics |
| XRF | X-Ray Fluorescence |
| OEM | Original Equipment Manufacturer |
| PM10 | Particulate Matter (10 μm) |
Appendix A
Table A1.
Test parameters for the selected sections of the SAE J2522 for PoD test series.
Figure A1.
COF and near-contact temperature charts of all test series of the selected sections of SAE J2522: (left) dynamometer reference test; (right) PoD tests 1–4.
References
- Belhocine, A.; Bouchetara, M. Thermal analysis of a solid brake disc. Appl. Therm. Eng. 2012, 32, 59–67. [Google Scholar] [CrossRef] [Scilit]
- Grzes, P.; Kuciej, M.; Yevtushenko, A. Numerical calculations of thermal stresses in a railway disk brake at the coupling of temperature, coefficient of friction, velocity, and wear. J. Therm. Stress. 2024, 47, 1297–1329. [Google Scholar] [CrossRef] [Scilit]
- Kim, S.; Lee, S.; Kim, S.; Nam, J. Influence of Brake Pad Temperature Variation on the Squeal Noise Characteristics of Disc’s In-Plane Vibration Mode. Sensors 2025, 25, 4080. [Google Scholar] [CrossRef] [Scilit] [PubMed]
- Zhang, P.; Wei, D.; Ding, X.; Zhang, L.; Qu, X. The deteriorated tribological and noise performances of copper-based brake pads induced by the increased content of flake graphite. Eng. Fail. Anal. 2025, 167, 109033. [Google Scholar] [CrossRef] [Scilit]
- Wang, Y.; Li, A.; Yin, H.; Su, S.; Lai, Y.; Chen, W.; Wang, X.; Tan, J.; Hao, L.; Shuai, S.; et al. Brake wear particles from various temperatures: Emission characteristics, generation processes and evolutions. Emerg. Contam. 2025, 11, 100554. [Google Scholar] [CrossRef] [Scilit]
- Wahlström, J.; Lyu, Y.; Matjeka, V.; Söderberg, A. A pin-on-disc tribometer study of disc brake contact pairs with respect to wear and airborne particle emissions. Wear 2017, 384–385, 124–130. [Google Scholar] [CrossRef] [Scilit]
- Wahlström, J.; Gventsadze, D.; Olander, L.; Kutelia, E.; Gventsadze, L.; Tsurtsumia, O.; Olofsson, U. A pin-on-disc investigation of novel nanoporous composite-based and conventional brake pad materials focusing on airborne wear particles. Tribol. Int. 2011, 44, 1838–1843. [Google Scholar] [CrossRef] [Scilit]
- Hagino, H.; Iwata, A.; Okuda, T. Iron Oxide and Hydroxide Speciation in Emissions of Brake Wear Particles from Different Friction Materials Using an X-ray Absorption Fine Structure. Atmosphere 2024, 15, 49. [Google Scholar] [CrossRef] [Scilit]
- Joo, B.S.; Chang, Y.H.; Seo, H.J.; Jang, H. Effects of binder resin on tribological properties and particle emission of brake linings. Wear 2019, 434–435, 202995. [Google Scholar] [CrossRef] [Scilit]
- Abdul Hamid, M.; Mat Lazim, A.; Abu Bakar, A.R. Brake Wear Particle Size and Shape Analysis of Non-Asbestos Organic (NAO) and Semi Metallic Brake Pad. J. Teknol. 2014, 71, 129–134. [Google Scholar] [CrossRef] [Scilit]
- Bilvatej, B.; Naveen, J.; Karthikeyan, N.; Norrrahim, M.N.F.; Knight, V.F.; Jawaid, M.; Sultan, M.T.H.; Dagalahal, M.R.; Chandrasekar, M.; Loganathan, T.M. Progress in polymeric and metallic brake pads: A comprehensive review. Proc. Inst. Mech. Eng. Part J J. Eng. Tribol. 2024, 238, 3–25. [Google Scholar] [CrossRef] [Scilit]
- Council of the European Union. Vehicle Emissions and Battery Durability (Euro 7): Technical Requirements and Certification Rules. Available online: https://eur-lex.europa.eu/legal-content/EN/TXT/HTML/?uri=LEGISSUM:4779927 (accessed on 13 March 2026).
- Balaji, S.; Kalaichelvan, K. Optimization of a Non Asbestos Semi Metallic Disc Brake Pad Formulation with Respect to Friction and Wear. Procedia Eng. 2012, 38, 1650–1657. [Google Scholar] [CrossRef] [Scilit][Green Version]
- Serrano-Munoz, I.; Magnier, V.; Brunel, F.; Dufrenoy, P. Influence of the Composition on the Compressive Behaviour of a Semi-Metallic Brake-Pad Material. Materials 2022, 15, 7911. [Google Scholar] [CrossRef] [Scilit] [PubMed]
- Mulani, S.M.; Kumar, A.; Shaikh, H.N.E.A.; Saurabh, A.; Singh, P.K.; Verma, P.C. A review on recent development and challenges in automotive brake pad-disc system. Mater. Today Proc. 2022, 56, 447–454. [Google Scholar] [CrossRef] [Scilit]
- Merie, V.V.; Cândea, V.C.; Bîrleanu, C.; Păşcuţă, P.; Popa, C.O. The influence of titanium dioxide on the tribological characteristics of a Fe-based friction composite material. J. Compos. Mater. 2014, 48, 235–243. [Google Scholar] [CrossRef] [Scilit]
- Saurabh, A.; Manoj, A.; Tiwari, S.K.; Saravanan, P.; Verma, P.C. Investigation on tribological behaviour of copper-free composite friction material under dry sliding at high-temperature. Mater. High Temp. 2024, 41, 386–398. [Google Scholar] [CrossRef] [Scilit]
- Ghazali, C.M.R.; Kamarudin, H.; Jamaludin, S.B.; Al Bakri, A.M.; Liyana, J. Mechanical Properties and Morphology of Palm Slag, Calcium Carbonate and Dolomite Filler in Brake Pad Composites. Appl. Mech. Mater. 2013, 313–314, 174–178. [Google Scholar] [CrossRef] [Scilit]
- Francesco, V.; Davide, C.; Yezhe, L.; Jens, W. Simulation of friction and wear for a low-steel brake material based on experimental pv-mapping of its basic constituents. Wear 2025, 572–573, 206037. [Google Scholar] [CrossRef] [Scilit]
- Baskar, P.; Shukla, K. Tribological and performance assessment of two wheeler brake pads using dynamometer testing. Sci. Rep. 2025, 15, 33653. [Google Scholar] [CrossRef] [Scilit] [PubMed]
- Blau, P.J.; Jolly, B.C. Wear of truck brake lining materials using three different test methods. Wear 2005, 259, 1022–1030. [Google Scholar] [CrossRef] [Scilit]
- Carlevaris, D.; Varriale, F.; Wahlström, J.; Menapace, C. Pin-on-disc tribological characterization of single ingredients used in a brake pad friction material. Friction 2024, 12, 2576–2593. [Google Scholar] [CrossRef] [Scilit]
- Österle, W.; Deutsch, C.; Gradt, T.; Orts-Gil, G.; Schneider, T.; Dmitriev, A.I. Tribological screening tests for the selection of raw materials for automotive brake pad formulations. Tribol. Int. 2014, 73, 148–155. [Google Scholar] [CrossRef] [Scilit]
- Straffelini, G.; Verlinski, S.; Verma, P.C.; Valota, G.; Gialanella, S. Wear and Contact Temperature Evolution in Pin-on-Disc Tribotesting of Low-Metallic Friction Material Sliding Against Pearlitic Cast Iron. Tribol. Lett. 2016, 62, 36. [Google Scholar] [CrossRef] [Scilit]
- Wei, L.; Zhang, H.Y.; Wang, X.Y.; Gai, J.Y.; Choy, Y.S. The effect of disc surface hardness on the tribology and emission behaviors of brake materials. Wear 2025, 580–581, 206316. [Google Scholar] [CrossRef] [Scilit]
- Singireddy, V.R.; Jogineedi, R.; Kancharla, S.K.; Farokhzadeh, K.; Filip, P. On scaled-down bench testing to accelerate the development of novel friction brake materials. Tribol. Int. 2022, 174, 107754. [Google Scholar] [CrossRef] [Scilit]
- Kermc, M.; Kalin, M.; Vižintin, J. Development and use of an apparatus for tribological evaluation of ceramic-based brake materials. Wear 2005, 259, 1079–1087. [Google Scholar] [CrossRef] [Scilit]
- Xiao, Y.; Zhou, L.; Zhao, H.; Wang, T.; Du, J.; Shen, M. The Evolution of Brake Disc Materials for Trains: A Review. Coatings 2025, 15, 628. [Google Scholar] [CrossRef] [Scilit]
- Pandita, N.; Dhull, U.; Nain, S.; Ahlawat, V. Tribo-performance assessment of brake friction composites prepared from agro-industrial-sea wastes using pin-on-disc. Polym. Compos. 2024, 45, 7602–7614. [Google Scholar] [CrossRef] [Scilit]
- Holmberg, K. Reliability aspects of tribology. Tribol. Int. 2001, 34, 801–808. [Google Scholar] [CrossRef] [Scilit]
- Ghosh, A. Scaling Laws. In Mechanics Over Micro and Nano Scales; Springer: New York, NY, USA, 2011; pp. 61–94. [Google Scholar]
- Peterson, M.A. Galileo’s discovery of scaling laws. Am. J. Phys. 2002, 70, 575–580. [Google Scholar] [CrossRef] [Scilit]
- Czichos, H.; Winer, W.O. Tribology: A Systems Approach to the Science and Technology of Friction, Lubrication and Wear. J. Lubr. Technol. 1978, 100, 513–514. [Google Scholar] [CrossRef] [Scilit]
- Pusterhofer, M.; Summer, F.; Wuketich, D.; Grün, F. Development of a Model Test System for a Piston Ring/Cylinder Liner-Contact with Focus on Near-to-Application Seizure Behaviour. Lubricants 2019, 7, 104. [Google Scholar] [CrossRef] [Scilit]
- Gussmagg, J.; Pusterhofer, M.; Summer, F.; Grün, F. Experimental visualization of the wear and scuffing evolution of a flake graphite cast iron cylinder liner. Wear 2023, 526–527, 204948. [Google Scholar] [CrossRef] [Scilit]
- Mosleh, M.; Blau, P.J.; Dumitrescu, D. Characteristics and morphology of wear particles from laboratory testing of disk brake materials. Wear 2004, 256, 1128–1134. [Google Scholar] [CrossRef] [Scilit]
- Verma, P.C.; Menapace, L.; Bonfanti, A.; Ciudin, R.; Gialanella, S.; Straffelini, G. Braking pad-disc system: Wear mechanisms and formation of wear fragments. Wear 2015, 322–323, 251–258. [Google Scholar] [CrossRef] [Scilit]
- Eriksson, M.; Jacobson, S. Tribological surfaces of organic brake pads. Tribol. Int. 2000, 33, 817–827. [Google Scholar] [CrossRef] [Scilit]
- Diana, A.; Conca, E.; Bartrolí, R.; Moreno, T.; Querol, X.; Padoan, E.; Abollino, O.; Inaudi, P.; Malandrino, M.; Amato, F. Particulate matter emissions from brake pads: A comparative study of low-steel and non-asbestos organic materials. Wear 2025, 576–577, 206131. [Google Scholar] [CrossRef] [Scilit]
- Archard, J.F. Contact and Rubbing of Flat Surfaces. J. Appl. Phys. 1953, 24, 981–988. [Google Scholar] [CrossRef] [Scilit]
- Candeo, S.; Nogueira, A.P.; Gialanella, S.; Straffelini, S. Wear-emission correlation in brake materials. Wear 2025, 562–563, 205650. [Google Scholar] [CrossRef] [Scilit]
- Kim, J.W.; Joo, B.S.; Jang, H. The effect of contact area on velocity weakening of the friction coefficient and friction instability: A case study on brake friction materials. Tribol. Int. 2019, 135, 38–45. [Google Scholar] [CrossRef] [Scilit]
- Eriksson, M.; Jacobson, S. Friction behaviour and squeal generation of disc brakes at low speeds. Proc. Inst. Mech. Eng. Part D J. Automob. Eng. 2001, 215, 1245–1256. [Google Scholar] [CrossRef] [Scilit]
- Qi, H.S.; Day, A.J. Investigation of disc/pad interface temperatures in friction braking. Wear 2007, 262, 505–513. [Google Scholar] [CrossRef] [Scilit]
- Totten, G.E. Steel Heat Treatment Handbook; CRC Press: Boca Raton, FL, USA, 2006; pp. 240–245. [Google Scholar]
- Wahlström, J.; Matejka, V.; Lyu, Y.; Söderberg, A. Contact Pressure and Sliding Velocity Maps of the Friction, Wear and Emission from a Low-Metallic/Cast-Iron Disc Brake Contact Pair. Tribol. Ind. 2017, 39, 460–470. [Google Scholar] [CrossRef] [Scilit]
- Eriksson, M.; Bergman, F.; Jacobson, S. Surface characterisation of brake pads after running under silent and squealing conditions. Wear 1999, 232, 163–167. [Google Scholar] [CrossRef] [Scilit]
- Awe, S.A.; Lattanzi, L. Comparative Evaluation of the Tribological Performance of Al-MMC and GCI Brake Rotors Through AK Master Dynamometer Testing. Lubricants 2025, 13, 380. [Google Scholar] [CrossRef] [Scilit]
- Barros, L.Y.; Poletto, J.C.; Buneder, D.; Flores, R.; Gehlen, G.; Neis, P.D.; Ferreira, N.F.; Matozo, L.T. An experimental study of the transition in the wear regime of brake friction materials. Polym. Compos. 2021, 42, 6310–6321. [Google Scholar] [CrossRef] [Scilit]
- Eriksson, M.; Lord, J.; Jacobson, S. Wear and contact conditions of brake pads: Dynamical in situ studies of pad on glass. Wear 2001, 249, 272–278. [Google Scholar] [CrossRef] [Scilit]
- Eriksson, M.; Bergman, F.; Jacobson, S. On the nature of tribological contact in automotive brakes. Wear 2002, 252, 26–36. [Google Scholar] [CrossRef] [Scilit]



Disclaimer/Publisher’s Note: The statements, opinions and data contained in all publications are solely those of the individual author(s) and contributor(s) and not of MDPI and/or the editor(s). MDPI and/or the editor(s) disclaim responsibility for any injury to people or property resulting from any ideas, methods, instructions or products referred to in the content. |
© 2026 by the authors. Licensee MDPI, Basel, Switzerland. This article is an open access article distributed under the terms and conditions of the Creative Commons Attribution (CC BY) license.