


Abstract
Lane-Keeping Assist Systems (LKAS) are widely used in modern passenger vehicles to support lateral vehicle control and reduce the risk of unintended lane departure. Although LKAS performance is commonly evaluated in relation to perception, control, and sensor fusion, the observable vehicle response may also depend on the mechanical condition of the chassis. This study presents a qualitative, measurement-based evaluation of the influence of intentionally introduced front-wheel toe misalignment on the observable response of a production LKAS under controlled proving-ground conditions. Experimental tests were conducted on the highway module of the ZalaZONE proving ground using a Lexus RX 450h equipped with a factory-installed LKAS function. Three front-wheel toe configurations were investigated: factory-specified alignment, single-wheel toe misalignment, and severe toe misalignment affecting both front wheels. Measurements were performed at 70, 90, and 110 km/h on straight and curved road sections. Vehicle speed, steering angle, lateral acceleration, and GNSS-based position data were recorded using CAN- and GNSS/IMU-based data acquisition. The qualitative comparison of the measured signal profiles indicated that the misaligned configurations were associated with a shifted steering-angle operating range and less uniform steering and lateral-acceleration responses. The most pronounced visible differences occurred under the severe toe-misalignment condition, particularly at higher speeds and in the curved section. As the analysis did not include quantitative effect measures or statistical comparisons, these observations are interpreted as exploratory tendencies rather than statistically validated changes in LKAS performance. The findings suggest that front-wheel toe condition should be considered in the measurement-based assessment, maintenance, and calibration of ADAS-equipped vehicles.
1. Introduction
Advanced Driver-Assistance Systems (ADAS) have become an essential part of modern passenger vehicles, supporting the driver in perception, decision-making, and vehicle-control tasks. These systems are designed to improve traffic safety, reduce driver workload, and increase driving comfort by assisting with functions such as adaptive cruise control, automatic emergency braking, lane-departure warning, and lane-keeping assistance [1]. Within the classification framework of driving automation, such systems are typically associated with lower automation levels, where the driver remains responsible for supervising the driving task and the surrounding environment [2].
Among ADAS functions, Lane-Keeping Assist Systems (LKAS) play a key role in supporting lateral vehicle control. Their primary task is to help the driver maintain the vehicle within the lane boundaries and reduce the risk of unintended lane departure. In production vehicles, LKAS generally relies on camera-based lane detection, vehicle-state estimation, and steering or braking interventions to correct the lateral position of the vehicle. The performance of such systems is commonly evaluated using variables related to lane position, lateral deviation, steering response, yaw rate, lateral acceleration, vehicle controllability, and driver interaction [3,4].
Previous research has investigated lane-keeping systems from several perspectives. A significant part of the literature focuses on control-algorithm development, including model-predictive control, robust control, learning-based methods, and lateral vehicle-dynamics control [5,6,7,8]. These approaches aim to improve path-tracking accuracy, reduce lateral deviation, ensure vehicle stability, and provide smooth steering intervention under different driving conditions. Other studies have examined lane-keeping behavior under high-speed driving, curved-road conditions, and external disturbances such as crosswind, where steering angle, yaw rate, sideslip angle, and lateral acceleration become particularly important for stable vehicle behavior [7,9].
The evaluation and validation of LKAS functions have also received increasing attention. Standardized experimental test methods have been proposed to assess the behavior of vehicles equipped with lane-keeping assistance systems [3,4]. Proving-ground, vehicle-in-the-loop, hardware-in-the-loop, and field-test approaches are commonly used to evaluate ADAS performance under controlled or semi-controlled conditions [9,10,11,12]. These methods are especially important because production LKAS functions often operate as proprietary systems, where the internal control logic is not directly accessible to researchers. Consequently, the observable vehicle response must be evaluated using external or onboard measurement signals, such as steering wheel angle, vehicle speed, lateral acceleration, yaw rate, and position data [4,11,12].
Recent test protocols and field studies also highlight that lane-support system performance depends on operational conditions such as speed, road curvature, lane width, lane marking quality, and road geometry [12,13]. These factors influence whether the system can reliably detect the lane and generate adequate lateral control intervention. In addition, studies dealing with driver-adaptive or haptic lane-keeping assistance systems show that steering intervention characteristics and driver perception are important aspects of LKAS performance evaluation [14,15]. Therefore, the assessment of LKAS cannot be limited to lane-detection accuracy alone; it must also consider the measurable dynamic response of the vehicle and the interaction between the assistance system and the physical vehicle platform.
Research addressing non-ideal LKAS operation has primarily concentrated on perception, calibration, and sensor-related errors. Romano et al. investigated the influence of artificially introduced LKAS camera misalignment and found that the imposed lateral-offset errors changed the mean lateral position of the vehicle and increased the number of steering reversals. These results demonstrate that calibration errors can modify the externally observable driver–vehicle response. However, the investigated error originated from the camera-based perception system rather than from the mechanical condition of the chassis or suspension [16].
Vehicle-dynamics-based LKAS research also indicates that lane-keeping response is coupled to the physical parameters and operating state of the vehicle. Quan et al. developed a robust lane-keeping controller using a linear parameter-varying vehicle model in which changes in longitudinal speed and roll motion influenced lateral-dynamic parameters, including tire cornering stiffness [17]. SAE J3048 similarly identifies vehicle speed, lateral acceleration, and equipment condition among the vehicle-related factors that may affect LKA operation [18]. These studies establish the importance of the physical vehicle response, but they mainly address controller robustness, simulation-based validation, or general system guidance rather than experimentally introduced mechanical faults in an unmodified production vehicle.
From a mechanical perspective, vehicle lateral dynamics depend not only on sensors and control algorithms, but also on the properties and adjustment of the chassis, steering system, suspension system, and tires [19]. Suspension geometry parameters, including toe, camber, and caster, affect tire-force generation, steering behavior, yaw response, straight-line stability, and cornering characteristics [19,20]. Consequently, deviations in wheel alignment can alter the physical response to which the lane-keeping controller applies its corrective action.
Among suspension geometry parameters, toe angle is particularly relevant because it directly influences the direction of the wheels relative to the vehicle longitudinal axis. In the present study, front-wheel toe was selected as the sole experimental variable because its influence is directly reflected in lateral vehicle bias, steering-angle offset, and corrective steering activity, which are closely related to the measured LKAS response. Limiting the investigation to toe also allowed the effect of a single alignment parameter to be evaluated without intentionally combining it with camber or caster variations. Incorrect toe settings may cause the vehicle to pull to one side, increase steering effort, modify lateral tire force generation, and change the steering wheel angle required to maintain straight-line motion or negotiate a curve [21]. Previous studies have shown that toe and camber settings influence handling behavior, lateral-acceleration response, yaw rate, steering wheel vibration, and cornering performance [20,22,23]. These findings indicate that wheel alignment errors can have measurable effects on vehicle-dynamic behavior and may therefore influence the observable operation of driver-assistance systems that rely on lateral vehicle response.
Existing wheel-alignment studies therefore provide an important mechanical basis for the present investigation. Lee and Choi [21] examined the detection of toe-angle misalignment using lateral tire force and tire-aligning moment, while other studies evaluated the effects of wheel-alignment parameters on handling, steering vibration, and cornering performance [20,22,23]. Spike et al. additionally investigated the influence of altered wheel-alignment parameters on autonomous path tracking and human-driver behavior in a simulation environment [24]. However, these investigations mainly concerned mechanical handling characteristics, fault detection, or simulation-based path-following control. Direct proving-ground evidence regarding the effect of intentionally introduced front-wheel toe misalignment on the externally measurable response of an original-equipment production LKAS remains limited.
More broadly, recent vehicle-system research has increasingly combined physics-based knowledge with data-driven and learning-based methods to improve model fidelity, interpretability, and transferability to real-vehicle applications. Physics-informed data-driven modeling has been applied to integrate experimentally collected vehicle data with high-fidelity models and optimization frameworks [25], while theory-constrained neural networks have been proposed to preserve physical interpretability within learned vehicle models [26]. Sim-to-real reinforcement-learning frameworks and physics-informed surrogate-assisted optimization further demonstrate how physical models, experimental data, and advanced control methods can be integrated within vehicle-development processes [27,28]. Although these studies primarily address electrified powertrain and energy-management problems rather than lateral vehicle control, the underlying methodological concepts are relevant to future extensions of the present work. In particular, similar physics-informed and data-driven approaches could support the identification of alignment-related disturbances and the development of predictive-maintenance or adaptive-compensation methods once sufficiently large multi-vehicle datasets become available.
This issue is especially relevant for ADAS-equipped vehicles. LKAS does not operate on an ideal vehicle model, but on the actual physical response of the vehicle. If the suspension geometry is not correctly adjusted, the system may need to compensate for a continuous lateral bias, asymmetric steering behavior, or altered tire–road interaction. As a result, the same production LKAS may exhibit different observable responses depending on the mechanical condition of the vehicle. This may appear in the form of increased steering-correction activity, larger steering-angle offsets, less uniform lateral acceleration, or reduced lane-keeping consistency.
From a maintenance and diagnostic perspective, ADAS evaluation and calibration should therefore not be considered independently of wheel alignment and suspension condition. Modern vehicle-service procedures increasingly require an integrated understanding of sensor calibration, steering-system operation, suspension geometry, and vehicle-dynamic response. Investigating the interaction between these areas may support the identification of mechanical faults that influence the measurable operation of lateral driver-assistance functions.
The aim of this study is therefore to experimentally evaluate the influence of suspension geometry misalignment on the observable response of a production vehicle LKAS under controlled proving-ground conditions. Three front-wheel toe configurations are investigated: factory-specified alignment, single-wheel toe misalignment, and severe toe misalignment on both front wheels. Measurements are performed at 70, 90, and 110 km/h on straight and curved road sections. Vehicle speed, steering angle, lateral acceleration, and GNSS-based position data are recorded using CAN and GNSS/IMU-based data acquisition.
Beyond identifying whether front-wheel toe misalignment changes the observable vehicle response, the study explores whether externally accessible signals, particularly steering angle and lateral acceleration, can provide practical supporting evidence that mechanical wheel alignment should be checked before ADAS calibration or diagnostic assessment. The present investigation does not aim to establish universal diagnostic thresholds; rather, it provides an experimentally grounded basis for the design of more extensive, statistically structured, multi-vehicle investigations.
The main contribution of this study is a measurement-based assessment of how suspension geometry misalignment affects LKAS-related vehicle-dynamic responses. Unlike studies focusing primarily on lane detection, control algorithm design, or environmental limitations, the present work evaluates the observable behavior of a production LKAS through measured vehicle signals under intentionally introduced suspension faults. The results provide experimental vehicle-level evidence that incorrect wheel alignment can influence steering correction activity, lateral dynamic response, and lane-keeping consistency. These findings support the need to consider suspension geometry in ADAS evaluation, calibration, inspection, and maintenance procedures.
2. Materials and Methods
2.1. Test Vehicle and Experimental Environment
The experimental investigations were carried out at the Zalaegerszeg Automotive Proving Ground (ZalaZONE), Hungary, under controlled proving-ground conditions. The objective of the measurement campaign was to evaluate the observable response of a production Lane-Keeping Assist System (LKAS) under different suspension geometry conditions.
A 2020 Lexus RX 450h passenger vehicle owned by Széchenyi István University was used as the test vehicle. The vehicle was equipped with a factory-installed LKAS function. The internal control strategy of the LKAS was not modified or accessed during the tests; therefore, the evaluation was based on externally measurable vehicle-dynamic signals and CAN-based vehicle data. This approach reflects the practical conditions of production-vehicle assessment, where the internal logic of proprietary ADAS functions is typically unavailable.
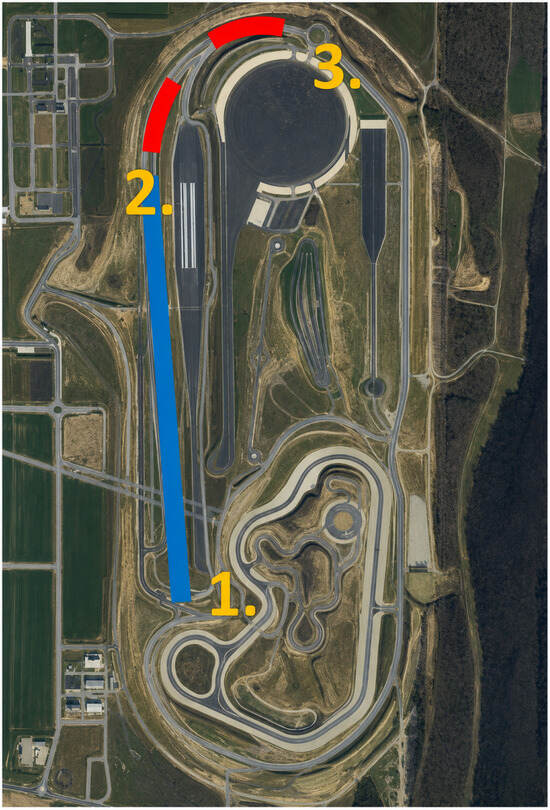
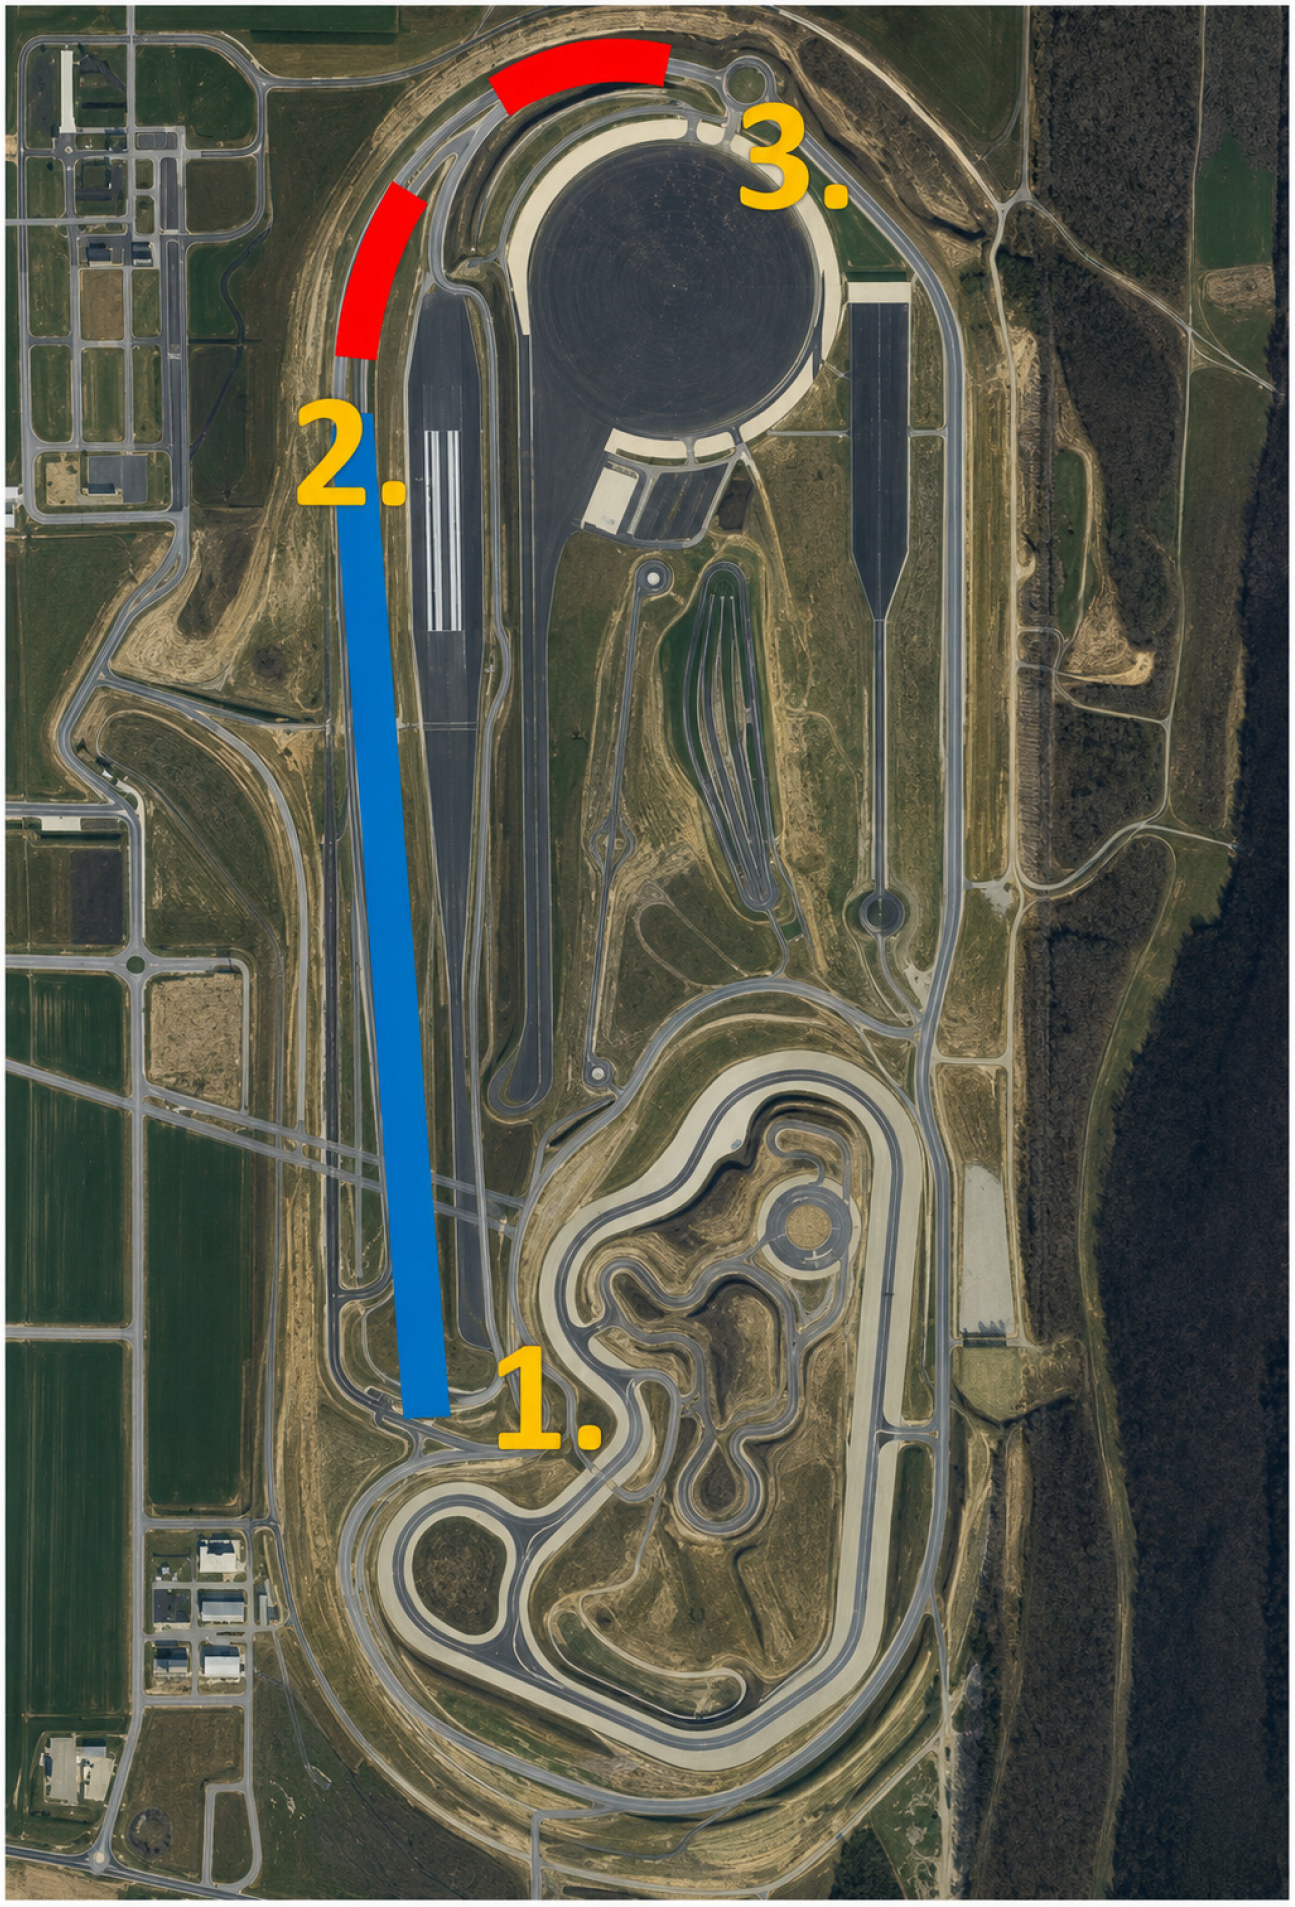
The highway module of the ZalaZONE proving ground (Figure 1.) was selected as the test environment because LKAS functions are primarily designed for highway and main-road driving conditions. The selected test section had a total length of approximately 1500 m and consisted of a 960 m straight segment followed by a 540 m curved segment with a radius of approximately 340 m. Measurements were performed along the full length of the module in order to evaluate LKAS response under both straight-line and cornering conditions.
Figure 1.
Layout of the evaluated test track at the ZalaZONE proving ground. Points 1–2 define the straight section, while Points 2–3 define the curved section.
Samples recorded between reference Points 1 and 2 were assigned to the straight section, whereas samples between Points 2 and 3 were assigned to the curved section.
To ensure repeatability between the investigated suspension configurations, GNSS coordinates were used to define the start and end points of the measurement runs, as well as the transition point between the straight and curved track sections, the values can be read in Table 1. The same track limits were used for each measurement case, which enabled a consistent comparison of vehicle response under different suspension settings.
Table 1.
Reference coordinates of the test section.
The reference points of the test section were defined as follows:
All measurements were performed on a single test day with the same vehicle, tires, and measuring equipment installed. Tire pressure and visible condition were checked before each measurement series, and no tire changes or intentional changes were made during the campaign. The tests were conducted in dry and clear weather conditions, without precipitation or significant cloud cover. Although daylight intensity and ambient temperature changed gradually during the full-day measurement campaign, no sudden or adverse changes in visibility were observed that could have significantly affected the perception of lane dividers. No intentional change was made to the vehicle-loading configuration, including the occupants and installed measurement equipment, during the test day; however, individual axle loads were not measured.
The measurement campaign was conducted as an exploratory comparative proving-ground investigation and was not intended to represent a formal certification or compliance assessment. Wind and ambient temperature were not actively controlled as independent experimental variables, so their possible residual influence cannot be completely excluded.
2.2. Suspension Geometry Configurations
Before the reference measurements, the suspension geometry of the vehicle was checked using a wheel-alignment system. This step was necessary because suspension parameters may change during normal vehicle use as a result of road irregularities, pothole impacts, curb contact, or general wear. Therefore, the initial condition of the vehicle had to be verified before the experimental misalignment configurations were introduced.
The measurements were performed using three front-wheel toe configurations. The first configuration represented the factory-specified alignment condition and was used as the reference case. The second configuration introduced a toe misalignment on the right front wheel, while the third configuration represented a more severe misalignment condition with incorrect toe values on both front wheels. The purpose of these configurations was to create different levels of lateral mechanical disturbance and to evaluate how the LKAS responded to them.
For clarity and consistency throughout the manuscript, the investigated suspension geometry configurations are hereafter referred to as follows:
- Category 1: OEM alignment—the factory-specified front-wheel toe configuration, used as the reference condition;
- Category 2: Single-wheel toe misalignment—an asymmetric configuration with an intentionally introduced toe misalignment on the right front wheel;
- Category 3: Severe toe misalignment—a more pronounced misalignment configuration with incorrect toe values on both front wheels.
These category names are used in the following tables, figures, and discussion to identify the suspension geometry conditions evaluated during the measurement campaign. The first configuration was treated as the baseline condition. In the second configuration, the asymmetric toe setting was expected to cause a lateral bias in the vehicle response. In the third configuration, the larger deviation from the nominal setting was expected to produce a more pronounced disturbance in straight-line running and cornering behavior. The values can be read in Table 2.
Table 2.
Front-wheel toe configurations used during the measurements.
Only the front-wheel toe values were intentionally modified between the test configurations; camber and caster were not considered experimental variables in the present measurement campaign.
2.3. Measurement Plan and Test Matrix
The measurement program was structured according to three vehicle speeds and three suspension geometry configurations. The selected speed levels were 70, 90, and 110 km/h. These values were chosen to represent typical non-urban and highway driving conditions in which LKAS functions are commonly active. The maximum investigated speed was limited to 110 km/h because the curved section of the proving-ground module had to be negotiated safely under the most severe suspension misalignment condition.
For each suspension configuration and speed level, measurements were carried out on both the straight and curved sections of the test track. Three repeated measurement runs were performed for each test case. This resulted in a consistent test matrix (Table 3.) that enabled the comparison of LKAS-related vehicle responses across different suspension settings, speeds, and road geometries.
Table 3.
Measurement test matrix.
Each measurement run was initiated from the same GNSS-defined starting area on the straight section. Before the start of the evaluated section, the vehicle was positioned approximately in the center of the lane and the steering wheel was returned to a near-neutral position. Longitudinal speed was maintained using the vehicle’s cruise-control function, while lateral steering support was provided by the production LKAS. The driver continuously supervised the vehicle and remained prepared to intervene for safety.
The LKAS actuator torque and the driver-applied steering torque were not recorded as separate measurement channels. Consequently, the measured steering-wheel-angle changes cannot be attributed exclusively to LKAS actuation and are interpreted as the observable response of the closed-loop LKAS–driver–vehicle system.
2.4. Data Acquisition System
Vehicle data were recorded using a data-acquisition system developed and configured for vehicle-dynamic measurements. A PacMod3 system was installed in the vehicle and used for reading and decoding CAN-based vehicle signals. The system enabled the recording of relevant vehicle-dynamic parameters during the measurement runs.
GNSS-based positioning was provided by a NovAtel RTK-corrected DGPS system. The positioning system was combined with an inertial measurement unit (IMU), which provided acceleration data. This configuration enabled the simultaneous recording of vehicle position, speed-related information, and acceleration signals. The measurement system was therefore suitable for evaluating the vehicle response along predefined track sections.
The data were recorded using ROS2-based data logging in rosbag and mcap formats, the parameters can be found in Table 4. This made it possible to store the measured signals synchronously and to evaluate the vehicle response after the tests. The recorded signals included GNSS position, vehicle speed, steering angle, and acceleration components.
Table 4.
Measured signals used for LKAS response evaluation.
2.5. Data Processing and Evaluation Method
The evaluation was based on the comparison of measured vehicle-dynamic signals under different suspension geometry configurations. GNSS coordinates were used to identify the same straight and curved track sections for each measurement run. This ensured that the vehicle responses were compared over identical track segments.
For each test case, the repeated measurement runs were aligned according to the GNSS-based position data. The measured signals were then evaluated as a function of vehicle position and test condition. This approach reduced the influence of small differences in time history between repeated runs and allowed the comparison of vehicle behavior at corresponding locations along the test track.
The present evaluation is descriptive and exploratory. The repeated runs were considered to assess whether similar overall signal tendencies were observable; however, no run-level quantitative performance indicators or inferential statistical tests were calculated. Accordingly, the terms “shifted”, “increased”, and “less uniform” are used only to describe visible differences in the measured signal profiles. These observations should not be interpreted as statistically significant effects or as direct quantitative measures of lane-keeping performance.
The primary evaluation signals were vehicle speed, steering angle, and lateral acceleration. Vehicle speed was used to verify the consistency of the test condition. Steering angle was used as an indicator of LKAS-related steering correction activity and the steering compensation required under each suspension configuration. Lateral acceleration was used to characterize the lateral dynamic response of the vehicle, particularly in the curved section of the test track.
The comparison focused on the following aspects:
- changes in steering angle behavior between the OEM and misaligned suspension configurations;
- increased steering correction activity caused by front-wheel toe misalignment;
- differences in lateral-acceleration response under straight-line and cornering conditions;
- the combined influence of vehicle speed, road curvature, and suspension misalignment on LKAS-related vehicle response.
Since the internal LKAS control algorithm of the production vehicle was not accessible, the analysis was intentionally limited to observable vehicle-dynamic responses. This measurement-based evaluation approach is relevant for practical vehicle diagnostics and ADAS maintenance, where service personnel and researchers typically rely on externally measurable signals rather than internal control software parameters.
2.6. Vehicle-Dynamic Basis of the Observed Response
To support the physical interpretation of the experimental results, the effect of front-wheel toe misalignment was considered using a simplified planar vehicle-dynamics framework. The purpose of this framework is not to reproduce the proprietary LKAS control algorithm or to provide a parameterized vehicle model, but to establish the mechanical relationship between toe misalignment, steering demand, lateral tire force, yaw response, and lateral acceleration [19,21].
Within the approximately linear operating range of a tire, the lateral tire force can be expressed as:
where is the lateral force of tire , is its cornering stiffness, and is the tire slip angle, with signs defined according to the adopted coordinate convention. A front-wheel toe offset changes the wheel heading relative to the vehicle longitudinal axis and therefore acts as an additional contribution to the effective front-tire slip angle. In simplified form, this relationship can be written as:
where is the road–wheel steering input, is the toe-angle offset, is the vehicle sideslip angle, is the yaw rate, is the distance between the vehicle center of gravity and the front axle, and is the longitudinal velocity. The CAN-based steering-wheel angle recorded in the present study was used as an observable indicator of the corresponding steering demand rather than as a direct measurement of the road–wheel angle.
If the left and right front toe values are unequal, their lateral-force contributions do not fully compensate each other. The resulting net lateral force and yaw disturbance can cause a lateral vehicle bias even when the nominal steering input is close to zero. The planar lateral-force and yaw-moment relationships can be expressed in simplified form as:
where is the vehicle mass, is the lateral acceleration, is the yaw moment of inertia, and and are the resultant front- and rear-axle lateral forces. Consequently, an asymmetric toe setting can modify both the lateral acceleration and yaw response of the vehicle. In a closed-loop lane-keeping situation, this mechanical disturbance must be counteracted through steering input, which can appear in the measured signal as a shifted mean steering angle and increased corrective steering activity.
During cornering, the required steady-state lateral acceleration can be approximated by:
where is the curve radius. The required lateral tire-force demand therefore increases approximately with the square of vehicle speed. The toe-induced disturbance is superimposed on this cornering demand and, depending on its direction, may either support or oppose the steering input required to follow the curve. This provides a physical explanation for the shifted steering-angle range and the less uniform lateral-acceleration response observed under the misaligned configurations, particularly at higher speeds. Because the internal LKAS strategy and the complete vehicle-model parameters were not available, these relationships are used as a physical interpretation of the measured trends rather than as a model-based prediction or validation.
3. Results and Discussion
The measured vehicle-dynamic signals were evaluated to determine how the different suspension geometry configurations influenced the observable response of the production LKAS. The analysis focused on vehicle speed, steering angle, and lateral acceleration because these signals provide direct information about the test condition, steering correction activity, and lateral dynamic response of the vehicle. The GNSS-based position data were used to separate the straight and curved sections of the proving-ground module and to compare the measurements over identical track segments.
The results are presented as a qualitative comparison of representative measured signal profiles. The purpose of the analysis is to identify directional tendencies between the three front-wheel toe configurations rather than to determine quantitative effect sizes or statistical significance.
A total of 18 measurement cases were evaluated, considering three suspension geometry configurations, three speed levels, and two track sections. For each test case, three repeated measurement runs were available. The evaluation was performed by qualitatively comparing the measured signal tendencies between the OEM alignment, the single-wheel toe misalignment, and the severe toe misalignment configurations.
3.1. Vehicle Speed Consistency
Vehicle speed was first evaluated to verify the comparability of the test runs. The selected target speeds were 70, 90, and 110 km/h. During the measurements, the vehicle speed remained sufficiently close to the target values in each test case, which made it possible to compare the LKAS-related vehicle responses under similar speed conditions. This was important because vehicle speed directly affects lateral dynamics, steering sensitivity, and the magnitude of lateral acceleration in curved sections.
In the straight section, the speed profiles were relatively uniform for all investigated suspension configurations. In the curved section, small variations occurred as a result of road geometry and driver supervision; however, these variations did not prevent the comparison of the main steering angle and lateral-acceleration tendencies. Therefore, the measured differences between the suspension configurations can be primarily associated with the different wheel alignment conditions rather than with large differences in vehicle speed.
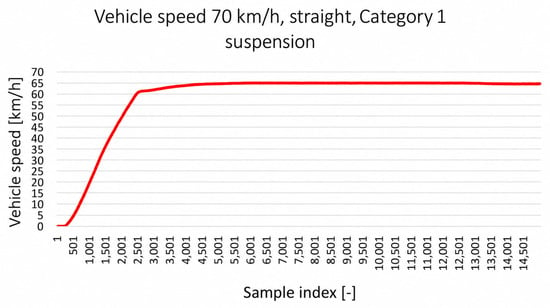
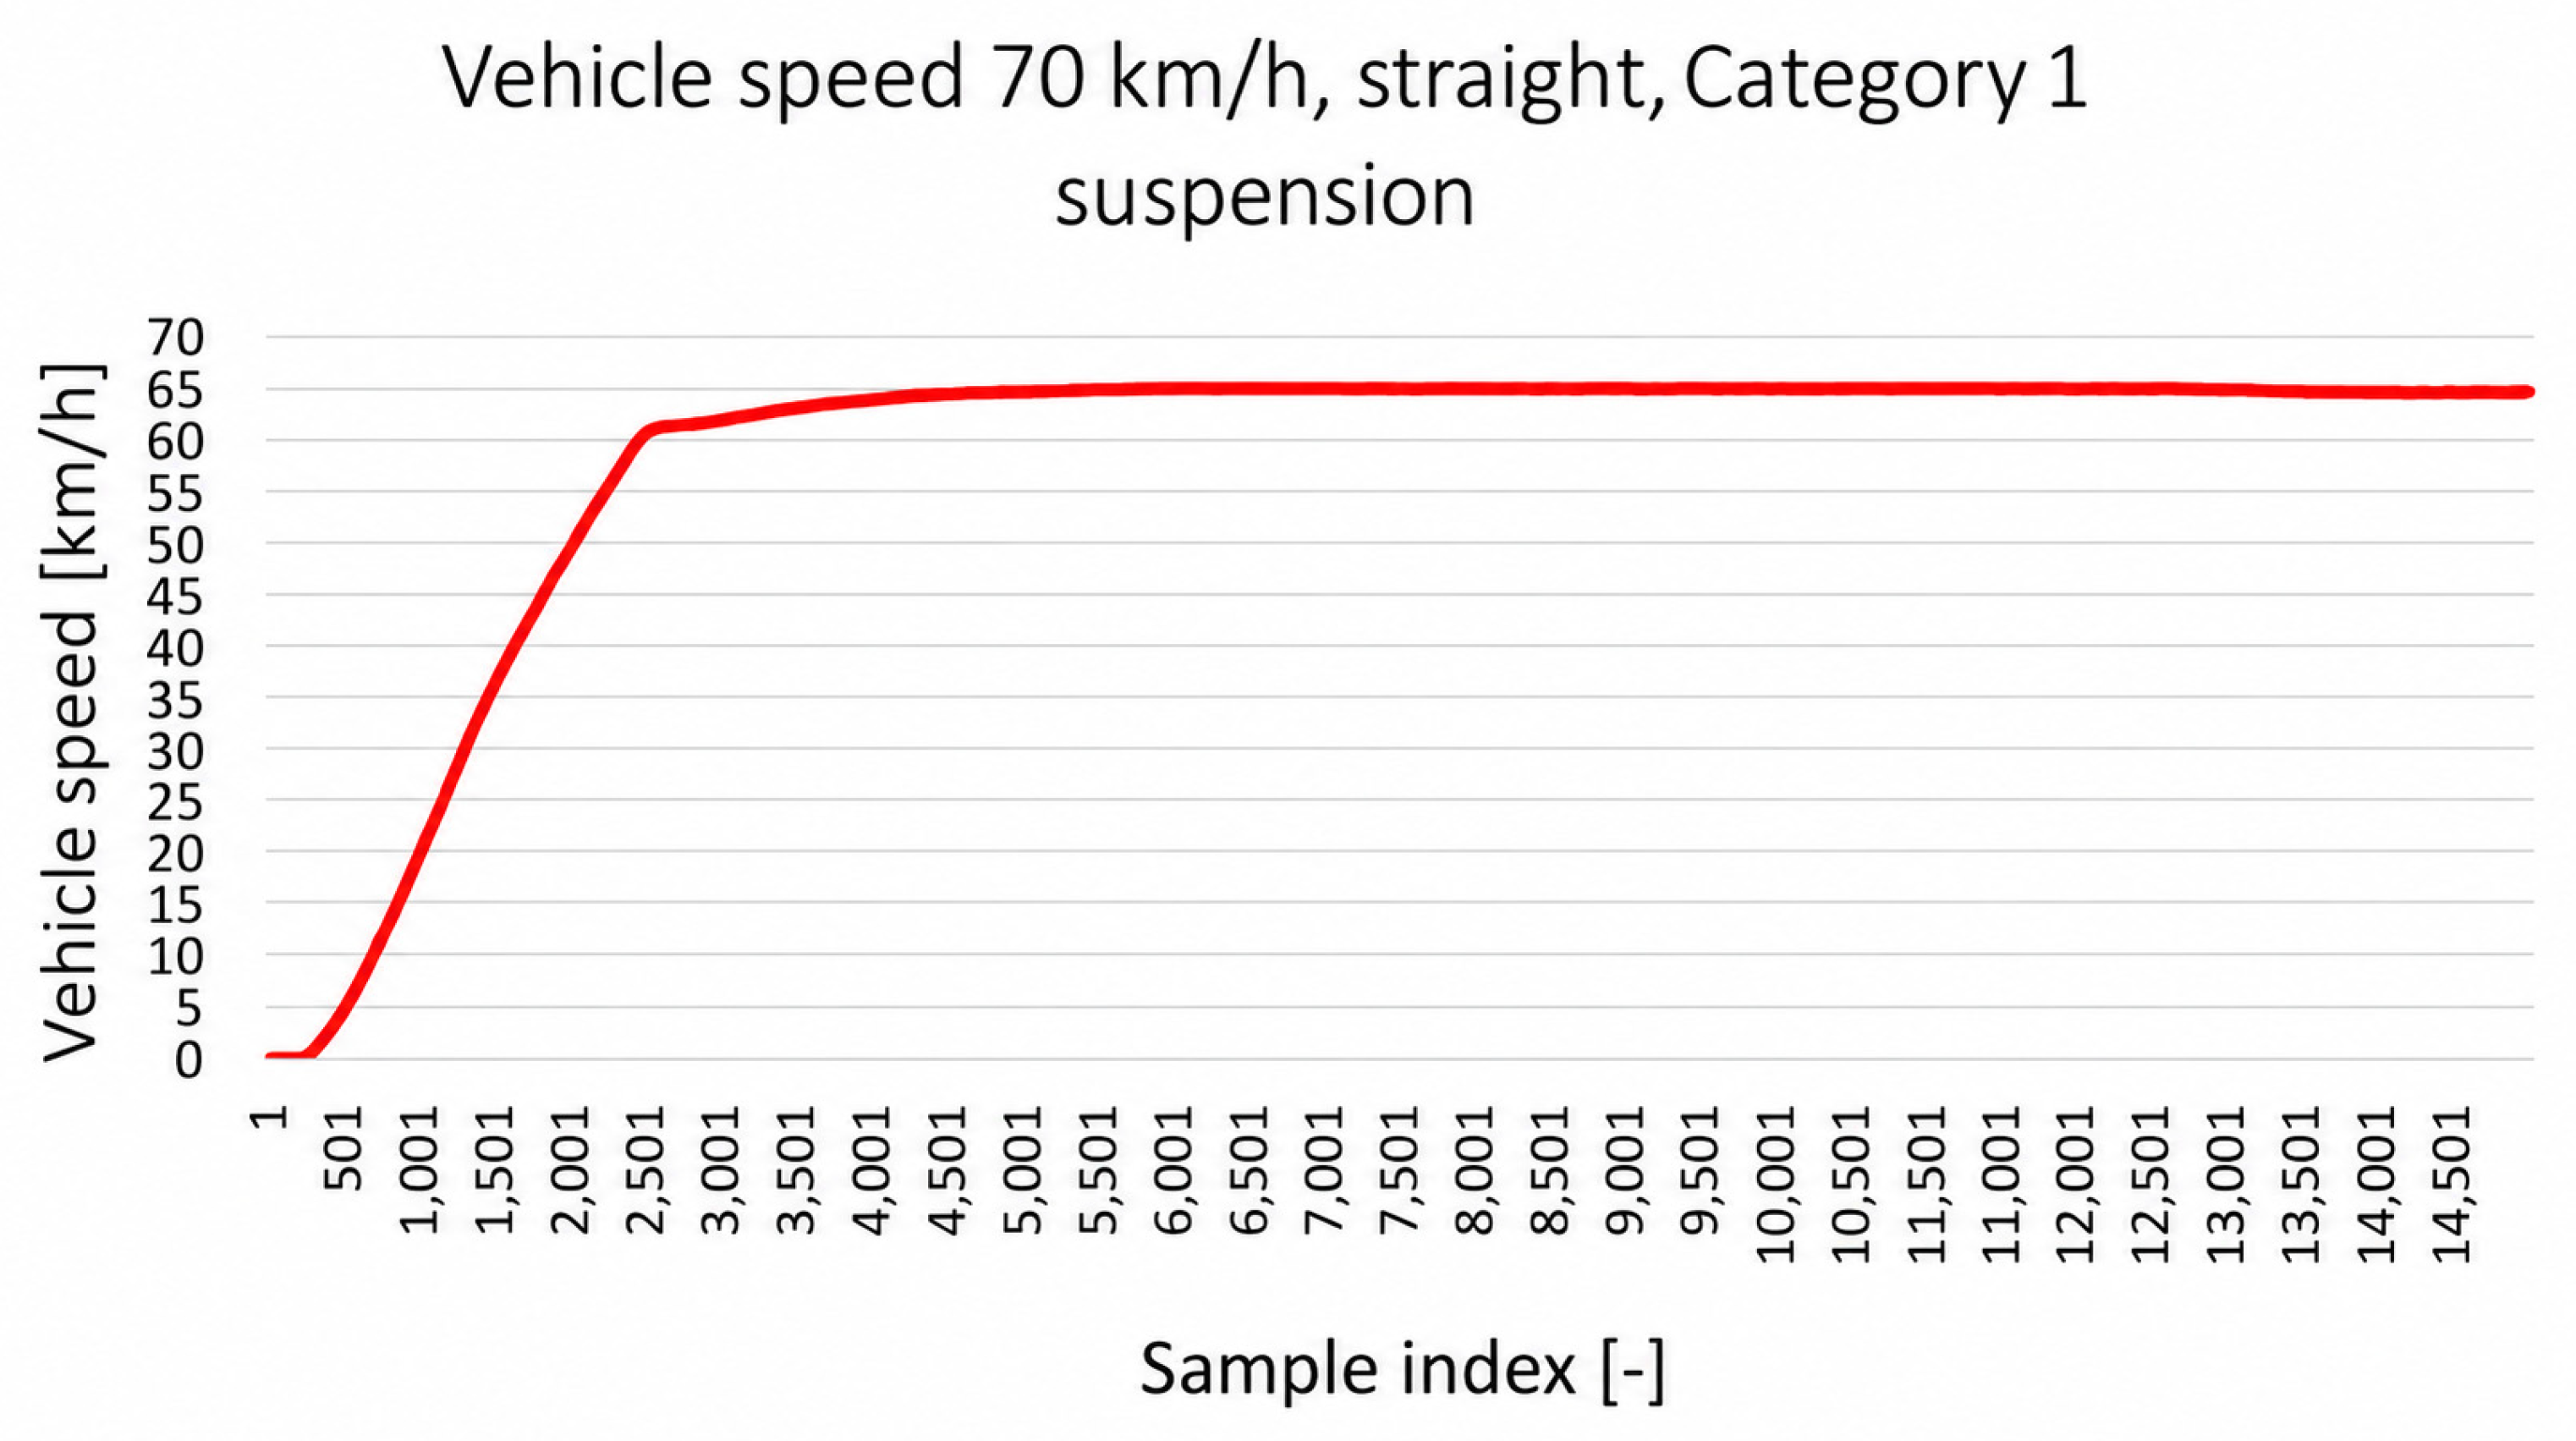
Figure 2 shows an example of the measured speed profiles for the 70 km/h straight-line case. The similarity of the speed curves confirms that the test condition was repeatable and that the vehicle-dynamic responses could be compared under consistent operating conditions.
Figure 2.
Result chart: vehicle speed at 70 km/h in the straight section.
3.2. Steering Angle Response
The steering angle signal was used as the main observable indicator of steering correction activity during LKAS operation. Under the OEM suspension-alignment condition, the steering angle remained relatively close to the neutral steering position in the straight section, with only small corrective movements. This behavior indicates that the vehicle did not require a continuous steering offset to maintain its lane position.
After the introduction of front-wheel toe misalignment, the steering angle response changed noticeably. In the single-wheel toe misalignment configuration, the vehicle tended to pull to one side, and the LKAS-related steering response compensated for this lateral bias. As a result, the steering angle showed a shifted operating range compared with the OEM condition. Instead of oscillating around the same neutral steering region, the vehicle required a continuous steering correction to maintain straight-line motion.
The effect became more pronounced in the severe toe misalignment configuration. The steering angle signal indicated larger correction demands and less uniform steering behavior, particularly at higher speeds and in the curved section. This suggests that the LKAS had to compensate not only for the road curvature, but also for the altered mechanical response of the vehicle caused by incorrect wheel alignment.
In the straight section, the misaligned vehicle could still be kept within the lane, but the steering angle signal showed that this required a biased steering position and more frequent small corrections. This is consistent with the expected effect of toe misalignment, which can generate asymmetric lateral tire forces and cause the vehicle to deviate from the intended path. The observable steering response therefore confirms that the suspension geometry condition affected the vehicle behavior during LKAS operation.
In the curved section, the interaction between road curvature and suspension misalignment became more significant. The vehicle entered the curve with a steering angle offset caused by the mechanical pull of the misaligned suspension. Depending on the direction of the curve and the direction of the lateral bias, the misalignment could either partially support or oppose the steering demand required to follow the lane. However, even in cases where the bias appeared to reduce the required steering correction in one part of the curve, the overall lane-keeping behavior became less consistent, especially near the curve exit.
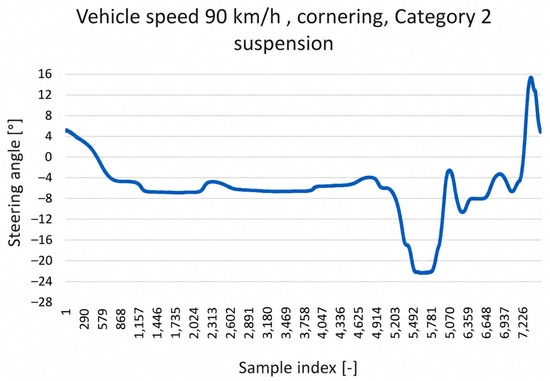
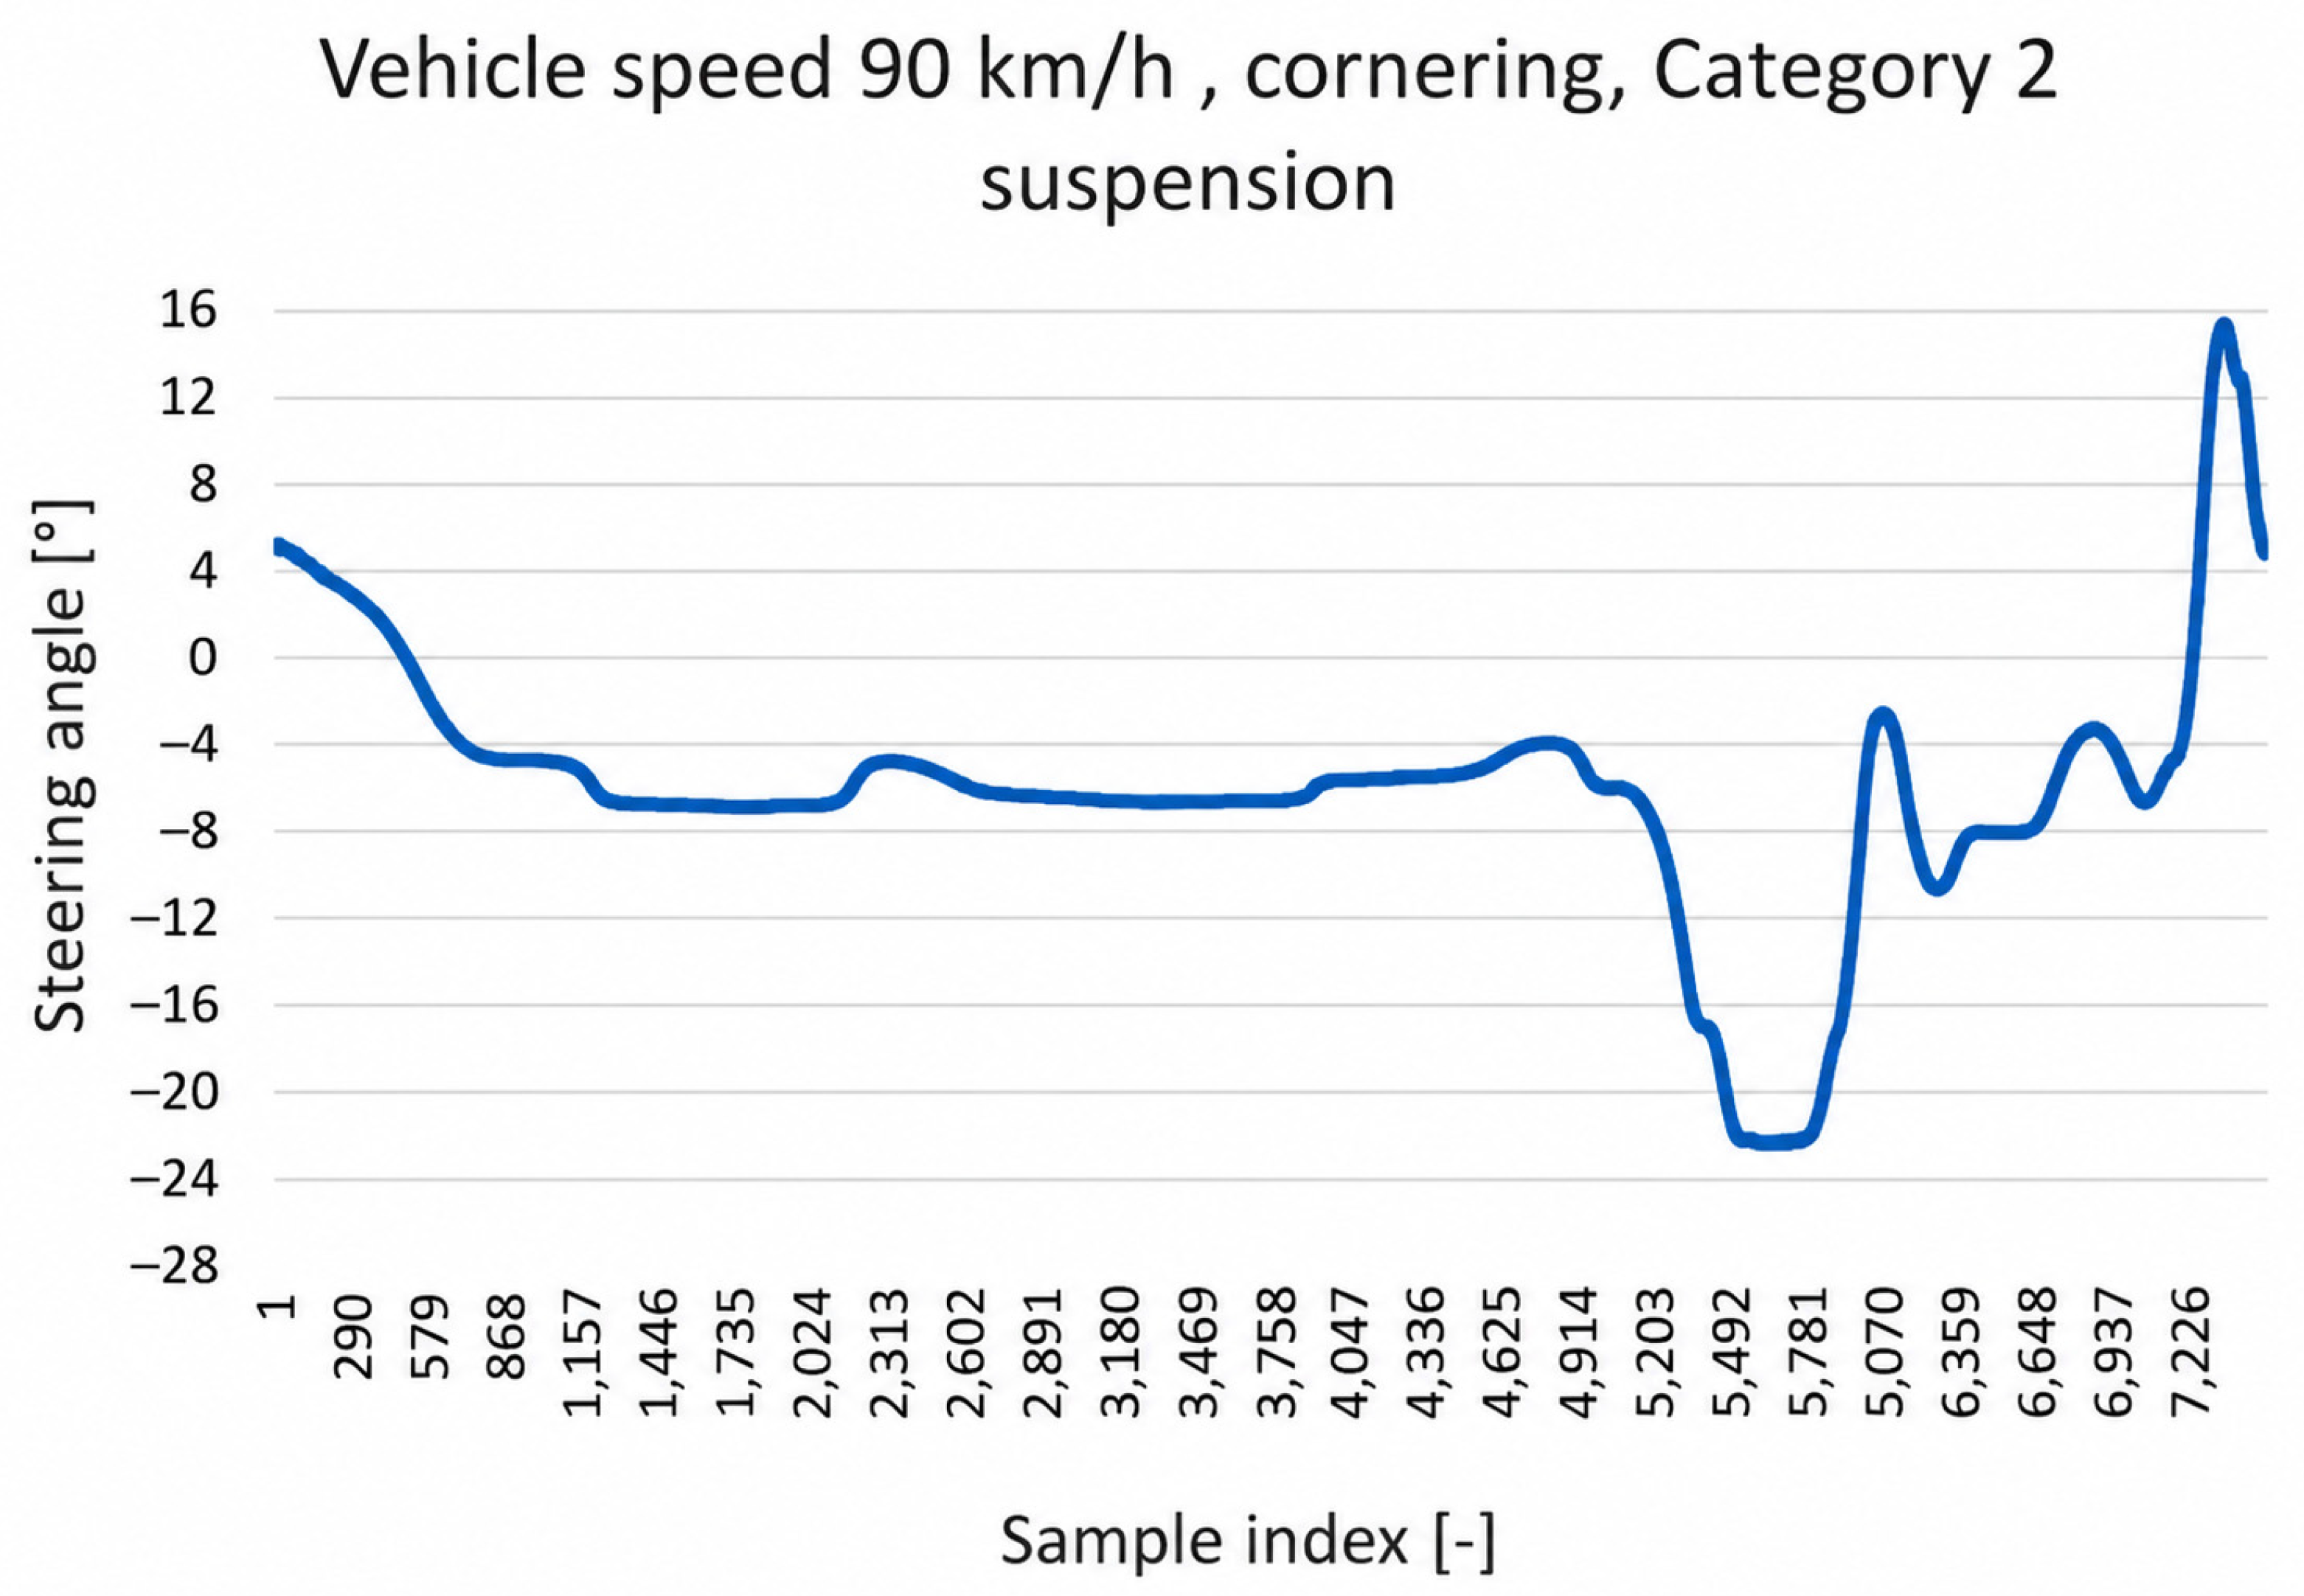
Figure 3 illustrates the steering angle response for the 90 km/h cornering case. Compared with the OEM alignment, the misaligned configurations showed a shifted and less uniform steering angle behavior. The results indicate that front-wheel toe misalignment can increase the steering compensation required during LKAS operation and can modify the observable steering-correction pattern.
Figure 3.
Result chart: steering angle response at 90 km/h in the curved section.
This behavior is consistent with the vehicle-dynamic relationships described in Section 2.6. Unequal front-wheel toe values introduce an additional slip-angle contribution and a corresponding lateral-force disturbance. Maintaining the desired path therefore requires a compensating steering input, which appears as a shifted steering-angle operating range. The more frequent variations observed under the severe misalignment condition can be interpreted as repeated corrections of the closed-loop LKAS–driver–vehicle system in response to the mechanically induced lateral bias.
3.3. Lateral-Acceleration Response
Lateral acceleration was evaluated as an indicator of the lateral dynamic response of the vehicle. Under the OEM alignment condition, the lateral-acceleration developed more uniformly, especially in the curved section, where a consistent lateral acceleration profile is expected due to the fixed track curvature and approximately constant speed.
The introduction of suspension geometry misalignment resulted in less uniform lateral-acceleration behavior. In the single-wheel toe misalignment configuration, small deviations and fluctuations appeared in the lateral-acceleration signal. These changes indicate that the vehicle response became less smooth and that the steering interventions required to maintain lane position influenced the lateral dynamic behavior.
The most significant changes were observed in the severe toe misalignment configuration, particularly at 110 km/h in the curved section. In this case, the lateral-acceleration signal showed larger fluctuations and a less stable development compared with the OEM condition. This suggests that the combination of high speed, road curvature, and incorrect suspension geometry increased the dynamic demand on the LKAS-related lateral response.
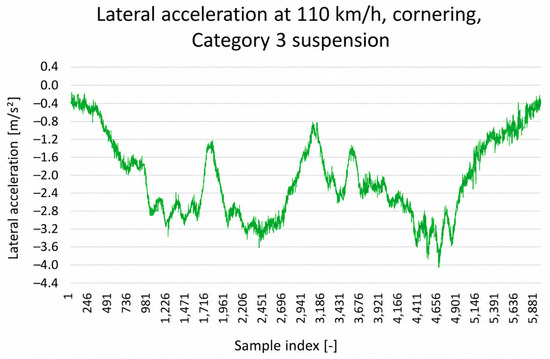
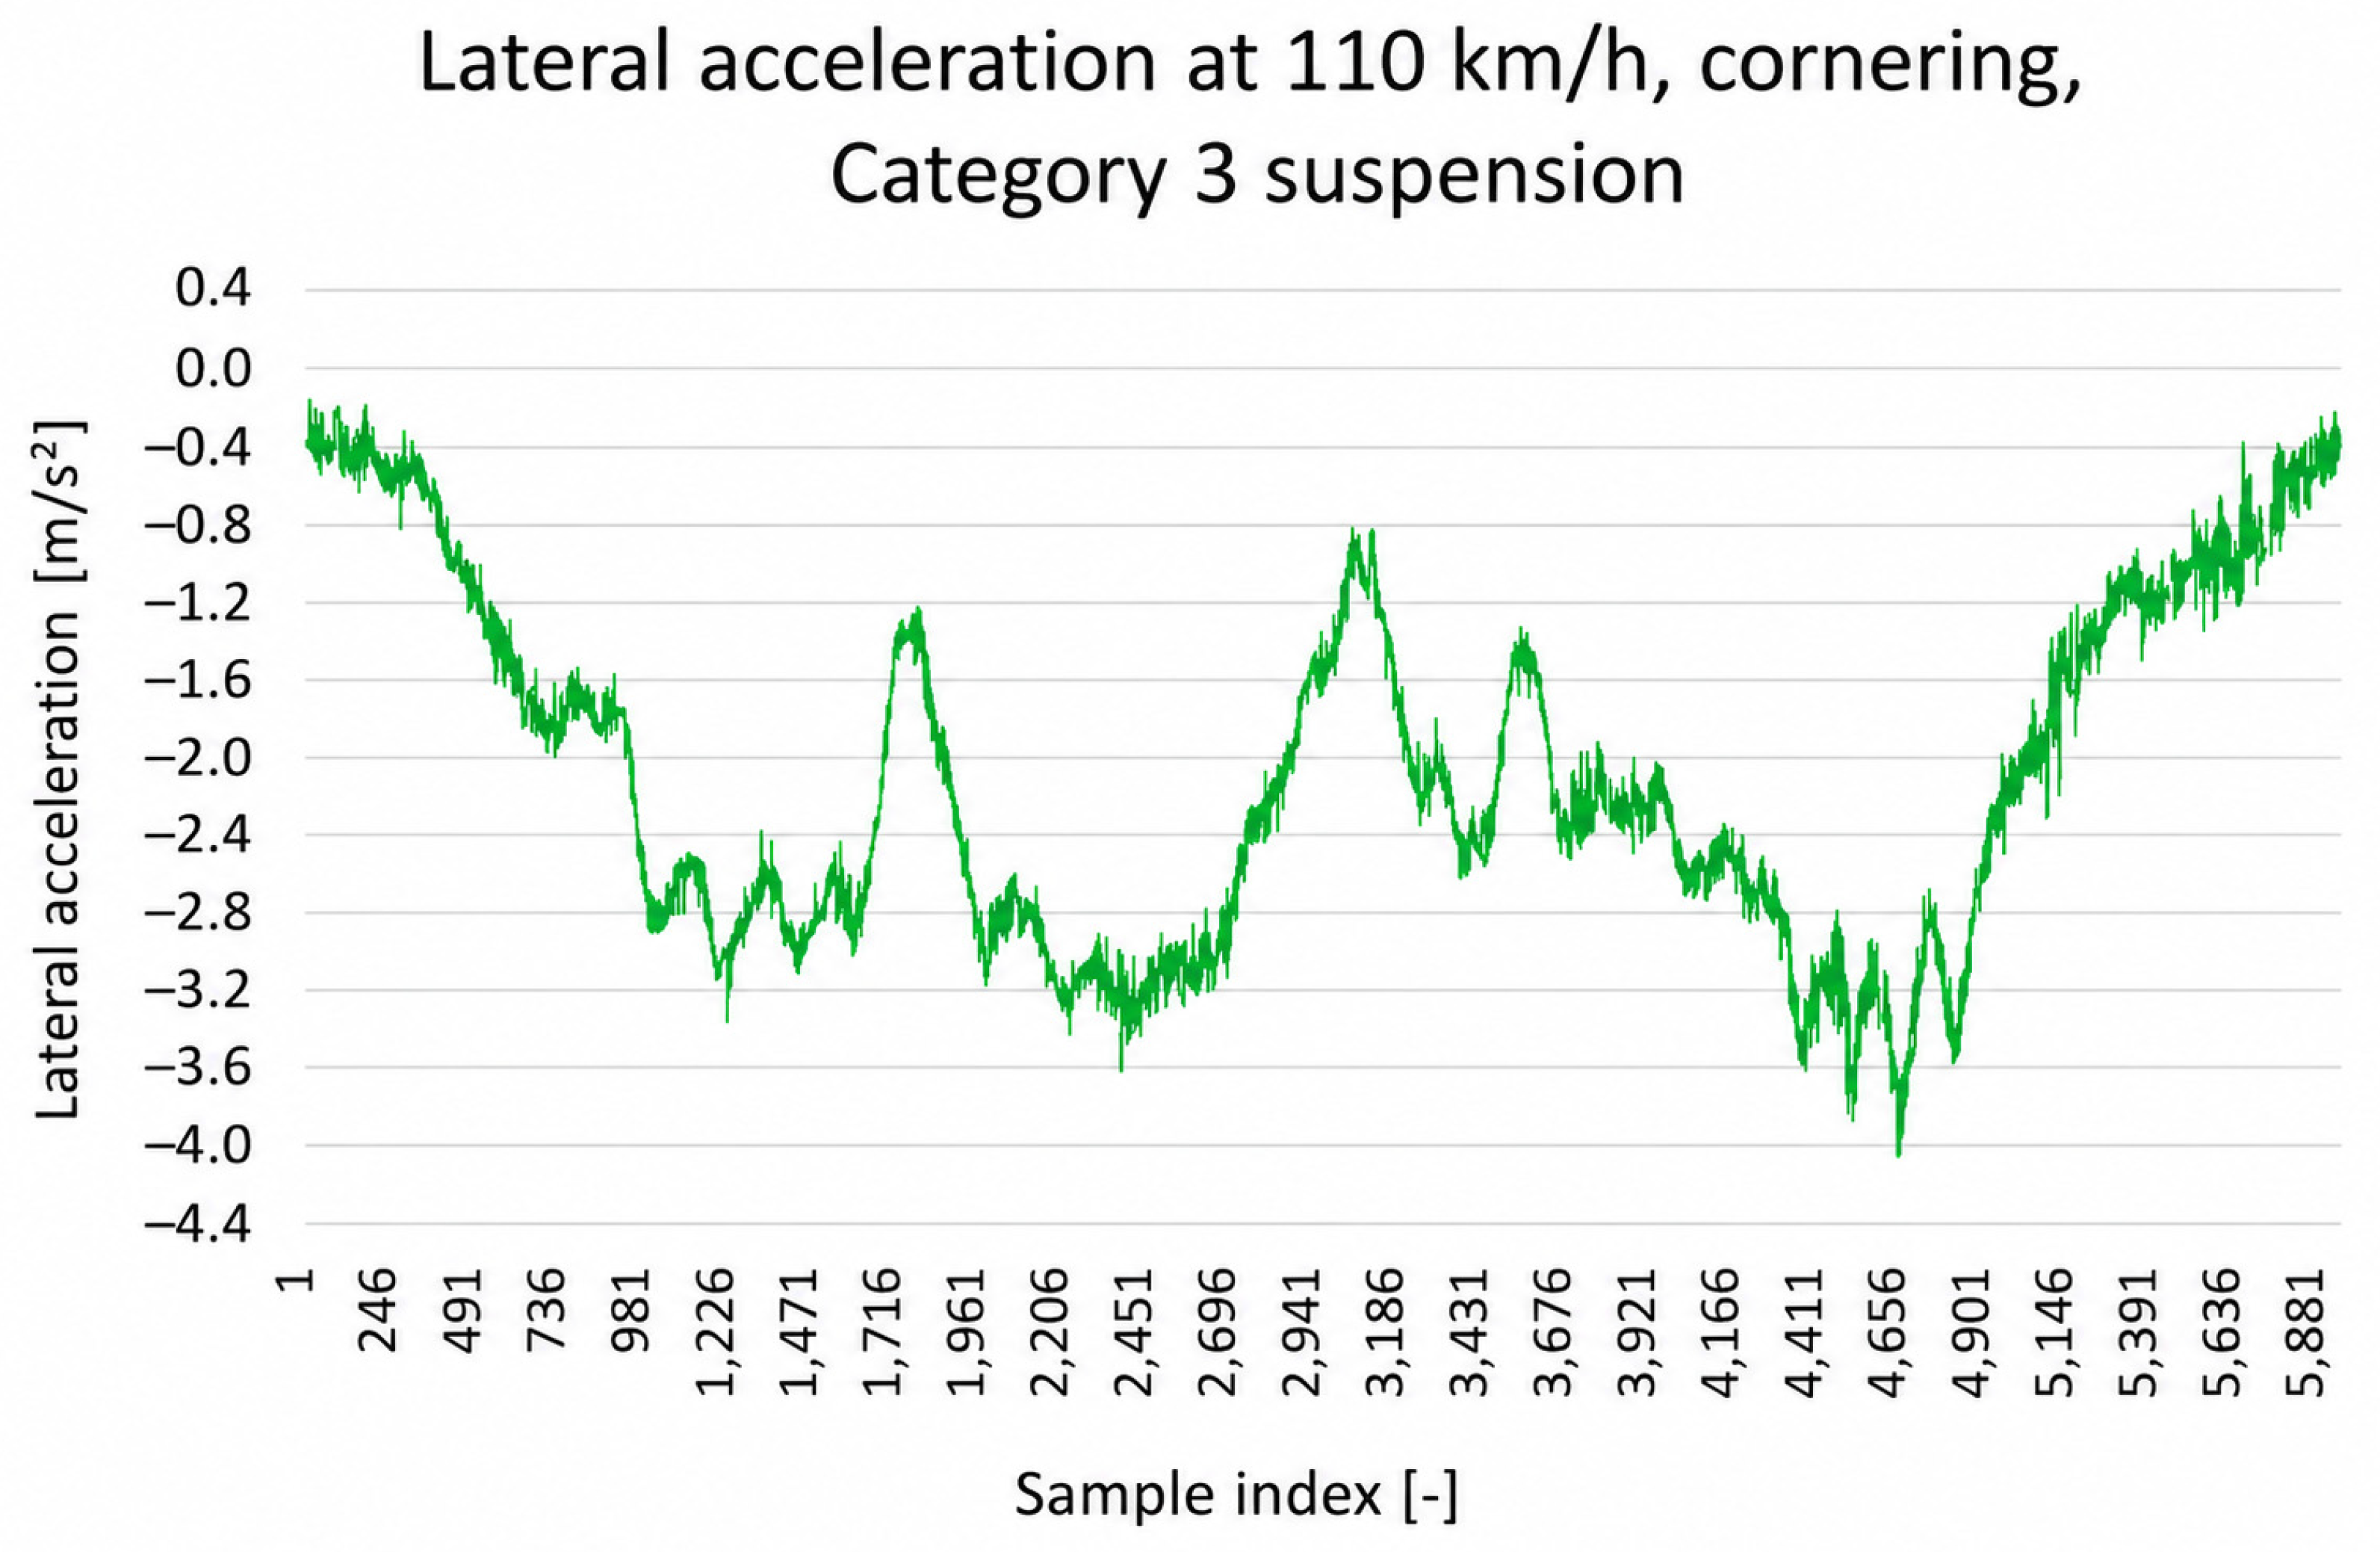
Figure 4 shows the lateral-acceleration response for the 110 km/h cornering case. The severe misalignment condition produced the most pronounced deviations, indicating reduced stability and less consistent lane-keeping behavior. These results are consistent with the steering angle observations, where larger and less uniform steering corrections were required under the same test condition.
Figure 4.
Result chart: lateral-acceleration response at 110 km/h in the curved section.
According to the lateral-force balance in Equation (3), variations in the resultant tire forces are directly reflected in the measured lateral acceleration. Toe misalignment modifies the effective front-tire slip angles, while the compensating steering inputs introduce additional time-dependent changes in lateral force and yaw response. The increased lateral-acceleration fluctuations under the severe misalignment condition are therefore mechanically consistent with the larger and less uniform steering corrections observed under the same operating condition.
3.4. Influence of Speed and Road Geometry
The effect of suspension misalignment became more visible as vehicle speed increased. At 70 km/h, the LKAS was generally able to maintain the vehicle within the lane under all investigated suspension configurations, although the steering angle signal already indicated a shifted operating range under misaligned conditions. At 90 km/h, the differences between the OEM and misaligned configurations became more noticeable, particularly in the curved section. At 110 km/h, the severe misalignment configuration produced the clearest deterioration in the measured response.
This tendency can be interpreted using the steady-state cornering relationship . For the same curve radius, increasing the vehicle speed from 70 to 110 km/h increases the nominal lateral-acceleration and tire-force demand by a factor of approximately . The lateral-force and yaw disturbances associated with toe misalignment are therefore superimposed on a substantially higher cornering demand at the maximum investigated speed. Furthermore, the vehicle covers a greater distance during a given steering or system-response delay. Consequently, steering-angle offsets and corrective transients can produce more apparent changes in the measured lateral response at higher speeds.
Road geometry also influenced the results. In the straight section, the main effect of toe misalignment appeared as a steering angle offset and increased correction activity. In the curved section, the misalignment interacted with the steering demand required by the road curvature. This led to less uniform steering and lateral-acceleration responses, particularly at the higher speed levels. The curved section therefore represented a more demanding condition for the LKAS because the system had to compensate for both the road geometry and the mechanical disturbance caused by incorrect suspension alignment.
3.5. Summary of Observed LKAS-Related Responses
Figure 2, Figure 3 and Figure 4 show representative examples of the measured vehicle speed, steering angle, and lateral-acceleration profiles under selected test conditions. A comparison of all front-wheel-alignment configurations is summarized in Table 5 and the following discussion. Under the conditions tested, the OEM configuration showed the most consistent observed response, while the configuration with a single wheel alignment deviation had a shifted steering angle operating range and more visible steering corrections. The configuration with a severe wheel alignment deviation showed the most pronounced qualitative differences, especially at higher speeds and on the curved section, where larger differences were seen in both the steering angle and lateral-acceleration profiles.
Table 5.
Qualitative cross-condition comparison of the observable vehicle responses for the three front-wheel toe configurations. The entries summarize tendencies identified across the investigated speeds and track sections; no quantitative effect size or statistical significance is implied.
These observations provide a qualitative comparison of the three tested setup conditions. Because the evaluation was exploratory and did not include quantitative effect measurements or statistical comparisons, we interpret the differences as recurring trends in the measured signal profiles rather than statistically validated differences in performance.
The main tendencies observed during the measurements are summarized in Table 5. The comparison shows that increasing deviation from the factory-specified suspension geometry resulted in increased steering correction activity, a shifted steering angle operating range, and less stable lateral-acceleration behavior. These effects were most evident in the curved section and at the highest investigated speed.
From an engineering perspective, the results suggest that the observable response of a vehicle equipped with LKAS may depend not only on the sensing and control functions, but also on the mechanical condition of the physical vehicle platform. Incorrect front-wheel-alignment settings can result in shifted steering operating points and less smooth lateral-response profiles. Consequently, chassis alignment can be a relevant supporting factor in ADAS calibration, performance evaluation and diagnostic verification. However, the current results do not define diagnostic thresholds and do not prove that steering angle or lateral-acceleration signals can independently identify wheel-alignment faults.
The most pronounced qualitative differences were observed in the case of severe wheel alignment deviation at 110 km/h on the curved section. In this case, the steering angle and lateral-acceleration profiles showed a less smooth evolution than in the original factory setting. These observations are consistent with the combined effect of vehicle speed, road curvature and mechanically induced lateral disturbance. However, they should not be interpreted as evidence of a quantitative reduction in the reliability or safety performance of the LKAS. Instead, the results encourage further statistically structured studies and support the consideration of vehicle mechanical inspections alongside ADAS maintenance and calibration procedures.
4. Conclusions
This study presented a measurement-based assessment of the effect of an intentionally introduced front-wheel-alignment deviation on the observable vehicle-level response during the operation of a production lane-keeping assist system. The experiments were conducted on a controlled test track using three front-wheel-alignment configurations, three vehicle speeds, and straight and curved road sections. Vehicle speed, steering angle, lateral acceleration, and GNSS-based position data were recorded to compare the measured response profiles under the tested setup conditions.
The qualitative comparison showed that the misaligned configurations resulted in a shifted steering-angle operating range and less smooth steering and lateral-acceleration responses compared to the factory-specified setup conditions. The observed steering angle offset on the straight section was consistent with the presence of mechanically induced lateral offset. On the curved section, the visible differences became more pronounced, as the vehicle response was influenced by both the road curvature and the changed front-wheel-alignment configuration.
The most pronounced qualitative changes were observed for severe wheel-alignment deviations, especially at the higher speeds tested. Under these conditions, the steering-angle and lateral-acceleration profiles showed larger visible deviations and less smooth development. These observations suggest that the mechanical alignment state of the vehicle may affect the externally measurable response of the lateral driving-assistance functions. However, since no quantitative effect measurements or statistical comparisons were performed, the results should be interpreted as exploratory trends rather than statistically validated changes in LKAS performance.
From an engineering and diagnostic perspective, the results support the consideration of front-wheel alignment when evaluating, calibrating, or diagnosing vehicles equipped with ADAS. Incorrect wheel-alignment settings can result in shifted steering operating points and increased variations in the measured vehicle response. Steering angle and lateral acceleration can therefore serve as useful supporting signals when investigating mechanical conditions that affect ADAS operation. However, the current results do not define diagnostic thresholds or confirm that these signals can independently identify wheel-alignment faults.
The study has several limitations. The experiments were conducted with a single vehicle model, a single production LKAS implementation, and a limited number of intentionally introduced front-wheel-alignment configurations. Accordingly, the conclusions are limited to the conditions studied and cannot be generalized to wheel camber, wheel roll, or other suspension geometric faults. Furthermore, the analysis was based on externally observable vehicle-dynamic signals, while the internal LKAS control strategy was not available. The evaluation did not include any quantitative performance indicators at the run level or inferential statistical analysis, and direct lane-center deviation was not available as an evaluation metric.
Future research should extend the investigation to different vehicle types, LKAS implementations, suspension geometry parameters, speed ranges, and real-world road conditions. A statistically designed measurement campaign should employ a multi-domain quantitative evaluation framework including lane-tracking accuracy, such as lateral-offset RMSE, maximum deviation, and the 95th-percentile deviation; steering demand, including mean steering-angle offset, steering-angle RMS or standard deviation, steering-reversal frequency, total variation, and LKAS and driver steering torque; lateral dynamics, including lateral-acceleration variance and yaw-rate tracking error; and repeatability, including mean values, standard deviations, and confidence intervals across repeated runs.
Real-world road testing should use only safety-approved alignment deviations and matched repeated routes covering different levels of crosswind, pavement roughness, lane-marking quality, road curvature, traffic density, and lighting and weather conditions. Synchronized lane-position, steering-angle, steering-torque, yaw-rate, GNSS/IMU, weather, and road-profile data should be recorded across multiple vehicles and LKAS implementations. These measurements could subsequently support online alignment-fault estimation using state observers or data-assisted estimators based on steering angle, yaw rate, lateral acceleration, and tire-force or tire-aligning-moment information. The estimated alignment bias could then be incorporated into gain-scheduled or linear-parameter-varying control, robust model-predictive control, or disturbance-observer-based steering compensation [6,17,21]. Such adaptive compensation is beyond the scope of the present exploratory study.
The present study should therefore be regarded as the initial experimental stage of a broader research program on mechanical-condition-aware ADAS diagnostics. The next stages are intended to extend the measurement protocol to multiple vehicle platforms and LKAS implementations and to generate larger synchronized datasets for quantitative and statistical analysis. In the longer term, these data may support the development of predictive-maintenance and diagnostic models capable of identifying alignment-related mechanical degradation from routinely available vehicle-dynamic signals.
Author Contributions
Conceptualization, Z.K.; methodology, Z.K. and M.J.; software, M.J.; validation, M.J.; formal analysis, Z.K.; investigation, Z.K. and M.J.; resources, Z.K.; data curation, Z.K. and M.J.; writing—original draft preparation, Z.K.; writing—review and editing, M.J.; visualization, Z.K. and M.J.; supervision, M.J.; project administration, Z.K. and M.J.; funding acquisition, M.J. All authors have read and agreed to the published version of the manuscript.
Funding
This research received no external funding.
Institutional Review Board Statement
Not applicable.
Data Availability Statement
The raw data supporting the conclusions of this article will be made available by the authors on request.
Conflicts of Interest
Author Zsolt Kovács was employed by the company Rába Vehicle Ltd. The remaining authors declare that the research was conducted in the absence of any commercial or financial relationships that could be construed as a potential conflict of interest.
Abbreviations
The following abbreviations are used in this manuscript:
| ADAS | Advanced Driver-Assistance Systems |
| LKAS | Lane-Keeping Assist System |
| GPS | Global Positioning System |
| SAE | Society of Automotive Engineers |
| ESP | Electronic Stability Program |
| OEM | Original Equipment Manufacturer |
| CAN | Controller Area Network |
| IMU | Inertial Measurement Unit |
| LiDAR | Light Detection and Ranging |
| ROS | Robot Operating System |
References
- Neumann, T. Analysis of Advanced Driver-Assistance Systems for Safe and Comfortable Driving of Motor Vehicles. Sensors 2024, 24, 6223. [Google Scholar] [CrossRef] [Scilit] [PubMed]
- SAE Standard J3016; Taxonomy and Definitions for Terms Related to Driving Automation Systems for On-Road Motor Vehicles. SAE International: Warrendale, PA, USA, 2021.
- ISO 22735:2021; Road Vehicles—Test Method to Evaluate the Performance of Lane-Keeping Assistance Systems. International Organization for Standardization: Geneva, Switzerland, 2021.
- Lee, S.-H.; Lee, S.-B. Test Evaluation Method for Lane Keeping Assistance System Using Dual Cameras. Machines 2021, 9, 310. [Google Scholar] [CrossRef] [Scilit]
- Bian, Y.; Ding, J.; Hu, M.; Xu, Q.; Wang, J.; Li, K. An Advanced Lane-Keeping Assistance System with Switchable Assistance Modes. IEEE Trans. Intell. Transp. Syst. 2020, 21, 385–396. [Google Scholar] [CrossRef] [Scilit]
- Lee, K.; Li, S.E.; Kum, D. Synthesis of Robust Lane Keeping Systems: Impact of Controller and Design Parameters on System Performance. IEEE Trans. Intell. Transp. Syst. 2019, 20, 3129–3141. [Google Scholar] [CrossRef] [Scilit]
- Wang, H.; Liu, B.; Qiao, J. Advanced High-Speed Lane Keeping System of Autonomous Vehicle with Sideslip Angle Estimation. Machines 2022, 10, 257. [Google Scholar] [CrossRef] [Scilit]
- Kővári, B.; Hegedűs, F.; Bécsi, T. Design of a Reinforcement Learning-Based Lane Keeping Planning Agent for Automated Vehicles. Appl. Sci. 2020, 10, 7171. [Google Scholar] [CrossRef] [Scilit]
- Liu, H.; Liu, C.; Hao, L.; Zhang, D. Stability Analysis of Lane-Keeping Assistance System for Trucks under Crosswind Conditions. Appl. Sci. 2023, 13, 9891. [Google Scholar] [CrossRef] [Scilit]
- Zhang, X.; Yang, W.; Tang, X.; He, Z. Estimation of the Lateral Distance between Vehicle and Lanes Using Convolutional Neural Network and Vehicle Dynamics. Appl. Sci. 2018, 8, 2508. [Google Scholar] [CrossRef] [Scilit]
- Park, C.; Chung, S.; Lee, H. Vehicle-in-the-Loop in Global Coordinates for Advanced Driver Assistance System. Appl. Sci. 2020, 10, 2645. [Google Scholar] [CrossRef] [Scilit]
- Reddy, N.; Farah, H.; Huang, Y.; Dekker, T.; van Arem, B. Operational Design Domain Requirements for Improved Performance of Lane Assistance Systems: A Field Test Study in The Netherlands. IEEE Open J. Intell. Transp. Syst. 2020, 1, 237–252. [Google Scholar] [CrossRef] [Scilit]
- Euro NCAP. Lane Support Systems Test Protocol; Version 4.2; European New Car Assessment Programme: Leuven, Belgium, 2024. [Google Scholar]
- Chen, J.; Chen, H.; Lan, X.; Zhong, B.; Ran, W. A Method to Develop the Driver-Adaptive Lane-Keeping Assistance System Based on Real Driver Preferences. Sensors 2024, 24, 1666. [Google Scholar] [CrossRef] [Scilit] [PubMed]
- Roozendaal, J.; Johansson, E.; de Winter, J.C.F.; Abbink, D.A.; Petermeijer, S.M. Haptic Lane-Keeping Assistance for Truck Driving: A Test Track Study. Hum. Factors 2021, 63, 1380–1395. [Google Scholar] [CrossRef] [Scilit] [PubMed]
- Romano, R.; Maggi, D.; Hirose, T.; Broadhead, Z.; Carsten, O. Impact of Lane Keeping Assist System Camera Misalignment on Driver Behavior. J. Intell. Transp. Syst. Technol. Plan. Oper. 2021, 25, 157–169. [Google Scholar] [CrossRef] [Scilit]
- Quan, Y.S.; Kim, J.S.; Chung, C.C. Robust Control for Lane Keeping System Using a Linear Parameter Varying Approach with Scheduling Variables Reduction. Int. J. Control Autom. Syst. 2022, 20, 2097–2106. [Google Scholar] [CrossRef] [Scilit]
- SAE Standard J3048_202402; Driver–Vehicle Interface Considerations for Lane Keeping Assistance Systems. SAE International: Warrendale, PA, USA, 2024. [CrossRef] [Scilit]
- Rajamani, R. Vehicle Dynamics and Control, 2nd ed.; Springer: New York, NY, USA, 2012. [Google Scholar]
- Huang, H.-H.; Tsai, M.-J. Vehicle Cornering Performance Evaluation and Enhancement Based on CAE and Experimental Analyses. Appl. Sci. 2019, 9, 5428. [Google Scholar] [CrossRef] [Scilit]
- Lee, H.; Choi, S.B. Online Detection of Toe Angle Misalignment Based on Lateral Tire Force and Tire Aligning Moment. Int. J. Automot. Technol. 2023, 24, 623–632. [Google Scholar] [CrossRef] [Scilit]
- Zhang, B.; Su, X. Influence Analysis of Dynamic Changes of Wheel Alignment Parameters on High-Speed Rocking Vibration of Steering Wheel. Measurement 2023, 217, 113079. [Google Scholar] [CrossRef] [Scilit]
- Bhosale, D.; Rahate, S.; Rege, K.; Palanivelu, S. To Study the Influence of Variation in Camber and Toe on Handling of Passenger Vehicle during Cornering. In Symposium on International Automotive Technology; SAE Technical Paper 2019-26-0073; SAE International: Pune, India, 2019. [Google Scholar] [CrossRef] [Scilit]
- Spike, N.; Bos, J.; Beard, J.; Robinette, D. Wheel Alignment Effects on Autonomous Vehicle Control vs. Human Driver in Simulation. In Proceedings of SPIE, Autonomous Systems: Sensors, Processing, and Security for Vehicles and Infrastructure; SPIE: Bellingham, WA, USA, 2019; Volume 11009, p. 110090C. [Google Scholar] [CrossRef] [Scilit]
- Lei, N.; Zhang, H.; Li, R.; Yu, J.; Wang, H.; Wang, Z. Physics-Informed Data-Driven Modeling Approach for Commuting-Oriented Hybrid Powertrain Optimization. Energy Convers. Manag. 2024, 299, 117814. [Google Scholar] [CrossRef] [Scilit]
- Lei, N.; Zhang, H.; Wang, H.; Hu, Z.; Chen, H.; Hu, J.; Wang, Z. Theory-Constrained Neural Network with Modular Interpretability for Fuel Cell Vehicle Modeling. IEEE Trans. Veh. Technol. 2025, 74, 8907–8920. [Google Scholar] [CrossRef] [Scilit]
- Lei, N.; Zhang, H.; Hu, J.; Hu, Z.; Wang, Z. Sim-to-Real Design and Development of Reinforcement Learning-Based Energy Management Strategies for Fuel Cell Electric Vehicles. Appl. Energy 2025, 393, 126030. [Google Scholar] [CrossRef] [Scilit]
- Lei, N.; Zhang, H.; Pang, Z.; Hu, J.; Chen, H.; Hu, Z.; Wang, Z. Physics-Informed Surrogate-Assisted Co-Optimization of Fuel Cell Electric Vehicle Powertrain and Energy Management for Long-Haul Heavy-Duty Applications. Appl. Energy 2026, 414, 127828. [Google Scholar] [CrossRef] [Scilit]

Disclaimer/Publisher’s Note: The statements, opinions and data contained in all publications are solely those of the individual author(s) and contributor(s) and not of MDPI and/or the editor(s). MDPI and/or the editor(s) disclaim responsibility for any injury to people or property resulting from any ideas, methods, instructions or products referred to in the content. |
© 2026 by the authors. Licensee MDPI, Basel, Switzerland. This article is an open access article distributed under the terms and conditions of the Creative Commons Attribution (CC BY) license.