


Abstract
Tire pressure is a key factor influencing vehicle dynamic behavior, controllability, and handling performance. This study investigates the effect of tire pressure distribution on steady-state cornering and self-steering behavior near the handling limit. Experimental tests were performed on standardized constant-radius circular tracks at the ZalaZONE Dynamic Platform using winter and summer tires. Starting from the manufacturer-recommended reference pressure, the vehicle was tested at increasing speeds until the slip limit was approached. Symmetric and asymmetric front–rear tire pressure configurations were evaluated to assess their influence on steering demand, lateral acceleration, and handling balance. The results indicate pressure-dependent changes in steering angle demand, achievable lateral acceleration, and self-steering characteristics under the investigated test conditions. Asymmetric front–rear pressure distributions were found to modify the understeer–oversteer balance, highlighting the importance of tire pressure distribution in vehicle controllability near the handling limit. The findings provide practical trend-level insights for future studies on vehicle dynamics, stability control, and steering assistance functions, particularly in operating conditions where tire pressure may deviate from nominal values.
1. Introduction
The dynamic behavior of a vehicle is influenced by a wide range of interacting factors, among which tire pressure plays a particularly significant role. As the only physical interface between the vehicle and the road, tires are responsible for transmitting longitudinal and lateral forces required for acceleration, braking, steering, and maintaining stability. Inappropriate tire pressure settings can lead to increased tire wear, extended braking distances, reduced handling performance, and, under extreme conditions, critical loss of vehicle stability [1,2,3].
In parallel with the rapid development of intelligent driver-assistance systems (ADAS) and emerging autonomous vehicle functionalities, the role of tire-related parameters in vehicle dynamics has gained renewed importance. Both human drivers and automated control systems rely on accurate and predictable vehicle responses to ensure safe operation. Consequently, the interaction between tire pressure and key dynamic response variables—such as steering angle, lateral acceleration, and self-steering behavior—has become increasingly relevant in the context of modern vehicle control and robustness assessment strategies [4,5,6].
However, most available studies focus either on nominal tire pressure settings, symmetric pressure variations, tire force modeling, or general handling performance. Less attention has been paid to experimentally documenting how asymmetric front–rear tire pressure distributions influence self-steering behavior during standardized steady-state circular driving near the handling limit. This gap is relevant because asymmetric pressure conditions may occur in real vehicle operation and can modify the balance between the front and rear axle cornering characteristics, thereby influencing controllability, steering assistance requirements, and vehicle stability margins. Recent research increasingly focuses on tire-state awareness as a key enabler for robust vehicle control and driver-assistance functions. This includes the estimation and monitoring of tire-related parameters such as pressure, temperature, friction potential, and cornering stiffness, which are critical for maintaining predictable vehicle behavior close to the handling limits. In parallel, significant attention has been devoted to limit-handling analysis and friction estimation techniques to improve the robustness of stability and steering assistance systems [7,8,9].
Despite these advances, experimental datasets obtained under steady-state, limit-handling conditions that explicitly investigate the influence of asymmetric tire pressure distributions remain scarce. In particular, the combined experimental evaluation of tire pressure effects on self-steering behavior across different tire types and track geometries is still limited, motivating further investigation in this area. Previous studies have extensively investigated tire pressure monitoring, tire force characteristics, tire-road friction estimation, tire modeling, and the general influence of inflation pressure on vehicle handling. These works provide an important basis for understanding the relationship between tire pressure, lateral force generation, and vehicle dynamic response. However, many available investigations focus on tire-level behavior, simulation-based analysis, nominal pressure settings, or simplified symmetric configurations. In contrast, the present study focuses on vehicle-level experimental measurements and directly compares symmetric and asymmetric front–rear pressure distributions using standardized circular-track tests. This positioning distinguishes the present work from studies that primarily address tire modeling or pressure monitoring and highlights its contribution as an experimental handling assessment under controlled proving-ground conditions [10,11,12].
Recent studies increasingly treat tire inflation pressure as part of a broader tire–road interaction problem rather than as an isolated operating parameter. Tire–road friction, contact patch behavior, temperature, wear, road texture, vertical load, and cornering stiffness jointly determine the lateral force generation capability of the tire and therefore influence vehicle handling and stability. Recent review studies emphasize that inflation pressure, temperature, load, tread condition, and road surface characteristics can substantially affect tire–road friction and stiffness-related parameters. In parallel, intelligent tire systems and real-time estimation methods have been proposed to identify tire stiffness, friction potential, and tire forces for advanced driver assistance and autonomous vehicle control applications. These developments confirm the relevance of vehicle-level experimental studies that investigate how tire pressure deviations and front–rear pressure distributions influence steering demand and self-steering behavior under controlled cornering conditions [11,13].
The present study addresses this gap by experimentally identifying characteristic handling patterns associated with different symmetric and asymmetric front–rear tire pressure configurations. The analysis is based on controlled circular-track measurements using two tire types and two track geometries, allowing the comparison of pressure-dependent self-steering trends under different lateral acceleration conditions. Although the general influence of tire inflation pressure on vehicle handling is well known, experimental evidence focusing specifically on asymmetric front–rear pressure distributions under steady-state limit-handling conditions remains limited. The novelty of the present work is therefore not the development of a new tire model, but the experimental identification of pressure-dependent self-steering trends using controlled circular-track measurements. By comparing symmetric and asymmetric tire pressure configurations across different tire types and track geometries, the study provides practical insight into how pressure distribution affects steering demand, achievable lateral acceleration, and the understeer–oversteer balance near the handling limit [14,15].
2. Materials and Methods
It should be noted that the present study focuses on the identification of pressure-dependent handling trends under controlled experimental conditions. The results are based on the evaluated measurement series for each tire pressure configuration, and no full statistical uncertainty analysis or significance testing was performed. Therefore, the observed differences between pressure configurations are interpreted as experimental trends rather than statistically generalized effects. Future work should include repeated test runs for each configuration, allowing the calculation of standard deviation, confidence intervals, and significance levels for the main evaluation parameters.
2.1. Test Methodology
The experimental investigation was based on a constant-speed, constant-radius circular test procedure, following the principles of steady-state directional control testing for passenger cars and light trucks, as described in SAE J266. This standardized procedure is widely used to evaluate vehicle handling behavior and self-steering characteristics under steady-state cornering conditions. To minimize the influence of tire wear and asymmetric loading, all test runs were conducted in both clockwise and counterclockwise directions, and the results were evaluated accordingly [16].
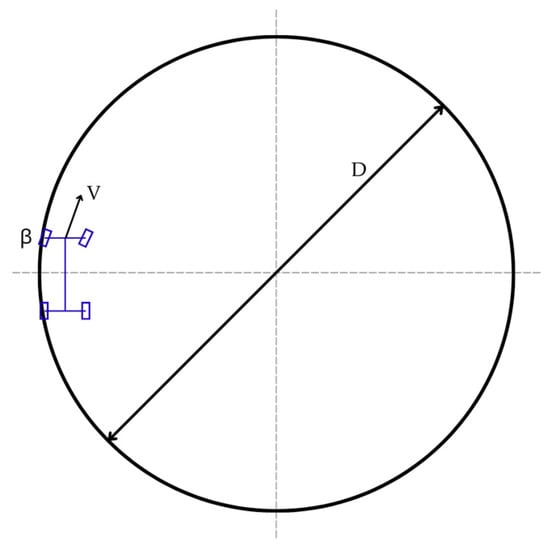
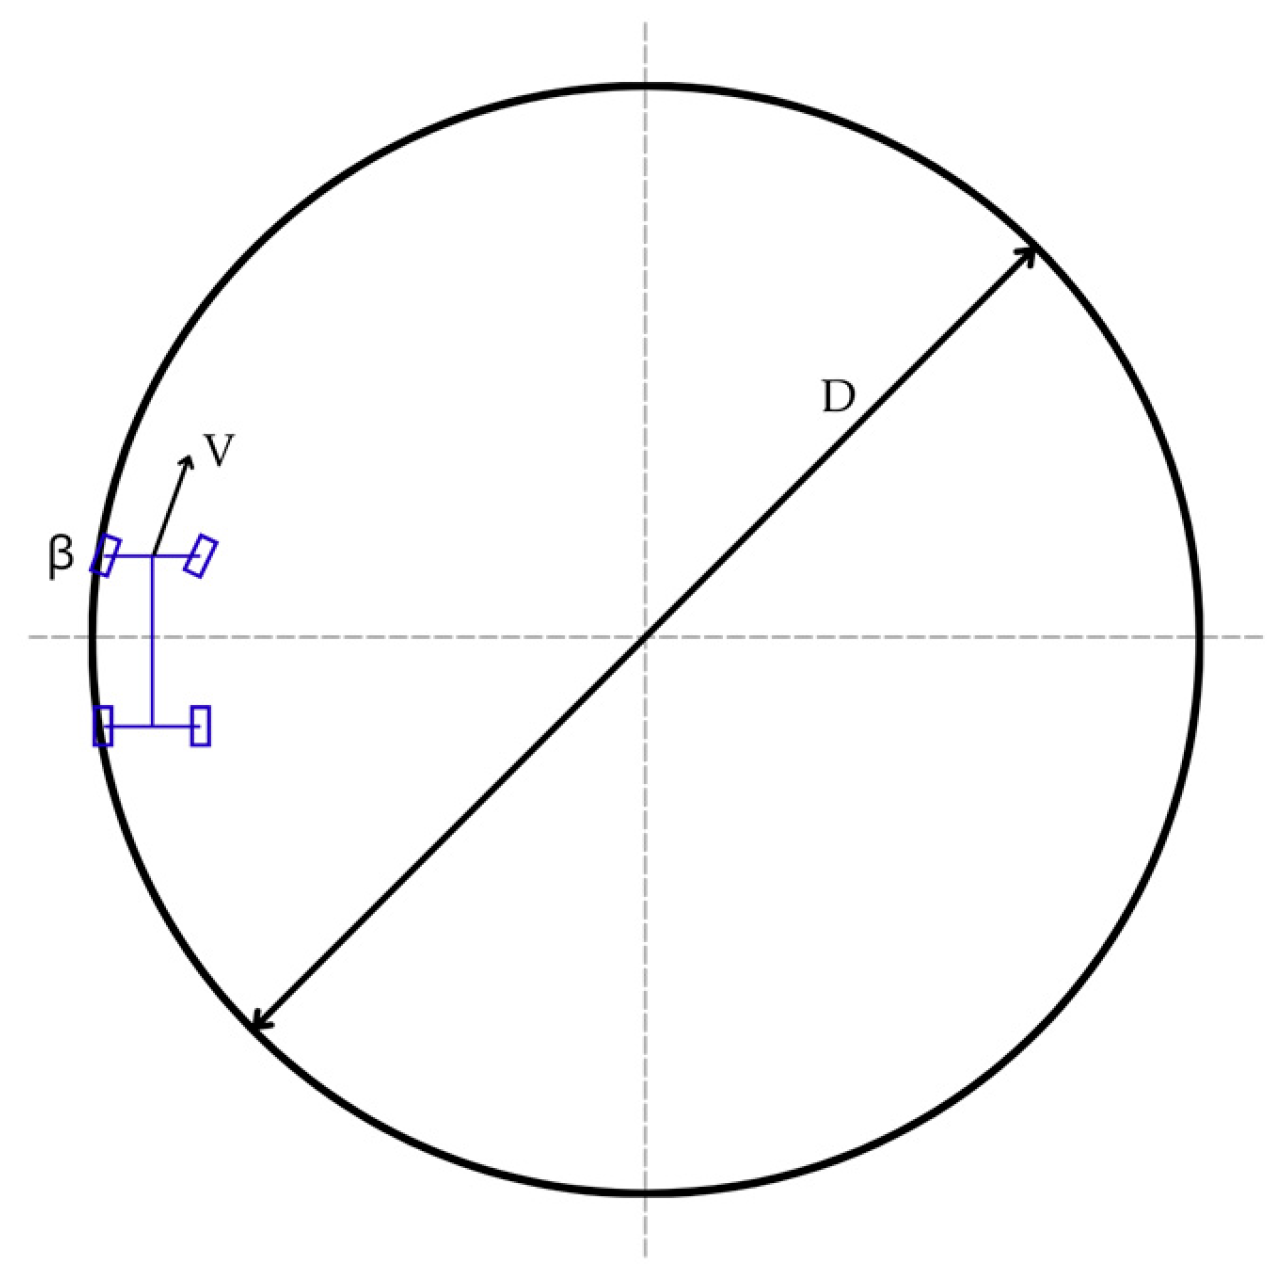
In Figure 1, β denotes the steering angle required to maintain the prescribed circular path at the given vehicle speed.
Figure 1.
Schematic of the constant-radius cornering test on a circular track (D = 100 m), showing vehicle velocity (V) and steering angle (β).
The following test conditions were required:
- a circular track with a diameter of 100 m and sufficient runoff area,
- precisely defined and adjustable tire pressure values,
- steering angle measurement capability,
- constant vehicle speed during each test run.
2.2. Test Procedure and Speed Increment
Vehicle speed was increased in discrete steps to approach the slip limit under controlled conditions.
The steering angle measured at 5 km/h was used as a kinematic reference condition for the evaluation of self-steering behavior. At this low speed, lateral tire slip and dynamic effects are negligible, allowing a stable reference steering angle to be obtained. This reference condition should not be interpreted as a neutral-steer condition in the dynamic sense. At 5 km/h, lateral acceleration and tire slip are negligible, and the measured steering angle mainly represents the kinematic steering requirement of the circular path.
The reference condition at 5 km/h is not part of the dynamic analysis; it serves solely as a baseline for expressing relative changes in steering demand. The interpretation of vehicle handling behavior and self-steering trends is therefore restricted to the higher-speed range, starting from 30 km/h, where steady-state cornering behavior near the handling limit becomes relevant. The omission of intermediate speed steps at 10 km/h and 20 km/h does not affect the interpretation of the self-steering characteristics in the limit-handling regime investigated in this study.
During the first measurement series, a speed limiter was activated above 30 km/h to ensure constant-speed operation.
2.3. Theoretical Background for Slip-Limit Estimation
The determination of the slip limit is based on the balance between vertical and lateral forces acting on the vehicle during steady-state cornering [17].
The vertical force component is governed by gravitational and normal forces:
where m is the vehicle mass and g is gravitational acceleration. The resulting normal force defines the maximum available tire-road friction.
The horizontal force component corresponds to the centripetal force required to maintain circular motion:
where v is vehicle speed and R is the radius of the circular path.
At the slip limit, the available friction force equals the required centripetal force:
Combining these expressions yields the theoretical maximum cornering speed:
Under idealized conditions (μ = 1), the calculated maximum speed for the 100 m diameter track is slightly below 80 km/h. In practice, the actual slip limit occurs at lower speeds depending on tire characteristics and pressure configuration. In the present steady-state circular tests, no significant longitudinal acceleration or braking was applied during the evaluated cornering phases. Therefore, the available tire-road friction potential was assumed to be used predominantly for lateral force generation. In terms of the Kamm friction circle, this corresponds to an operating condition where the longitudinal force component is small and the resultant tire force is dominated by the lateral component. Consequently, the simplified slip-limit estimation provides only an idealized reference and should not be interpreted as a direct measurement of the road friction coefficient.
2.4. Evaluation of Self-Steering Characteristics
Two key parameters were extracted from the circular test to characterize vehicle handling behavior:
- Self-steering factor, plotted on the vertical axis, defined as the ratio of the steering angle at a given speed to the steering angle measured at 5 km/h.
- Specific lateral acceleration, plotted on the horizontal axis, calculated from the achieved vehicle speed and normalized by gravitational acceleration and track radius.
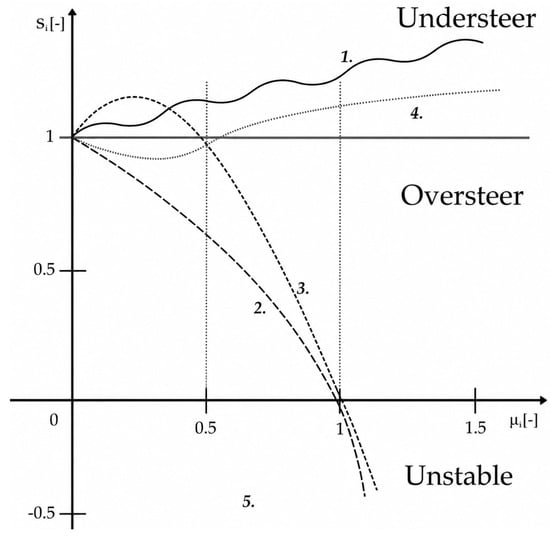
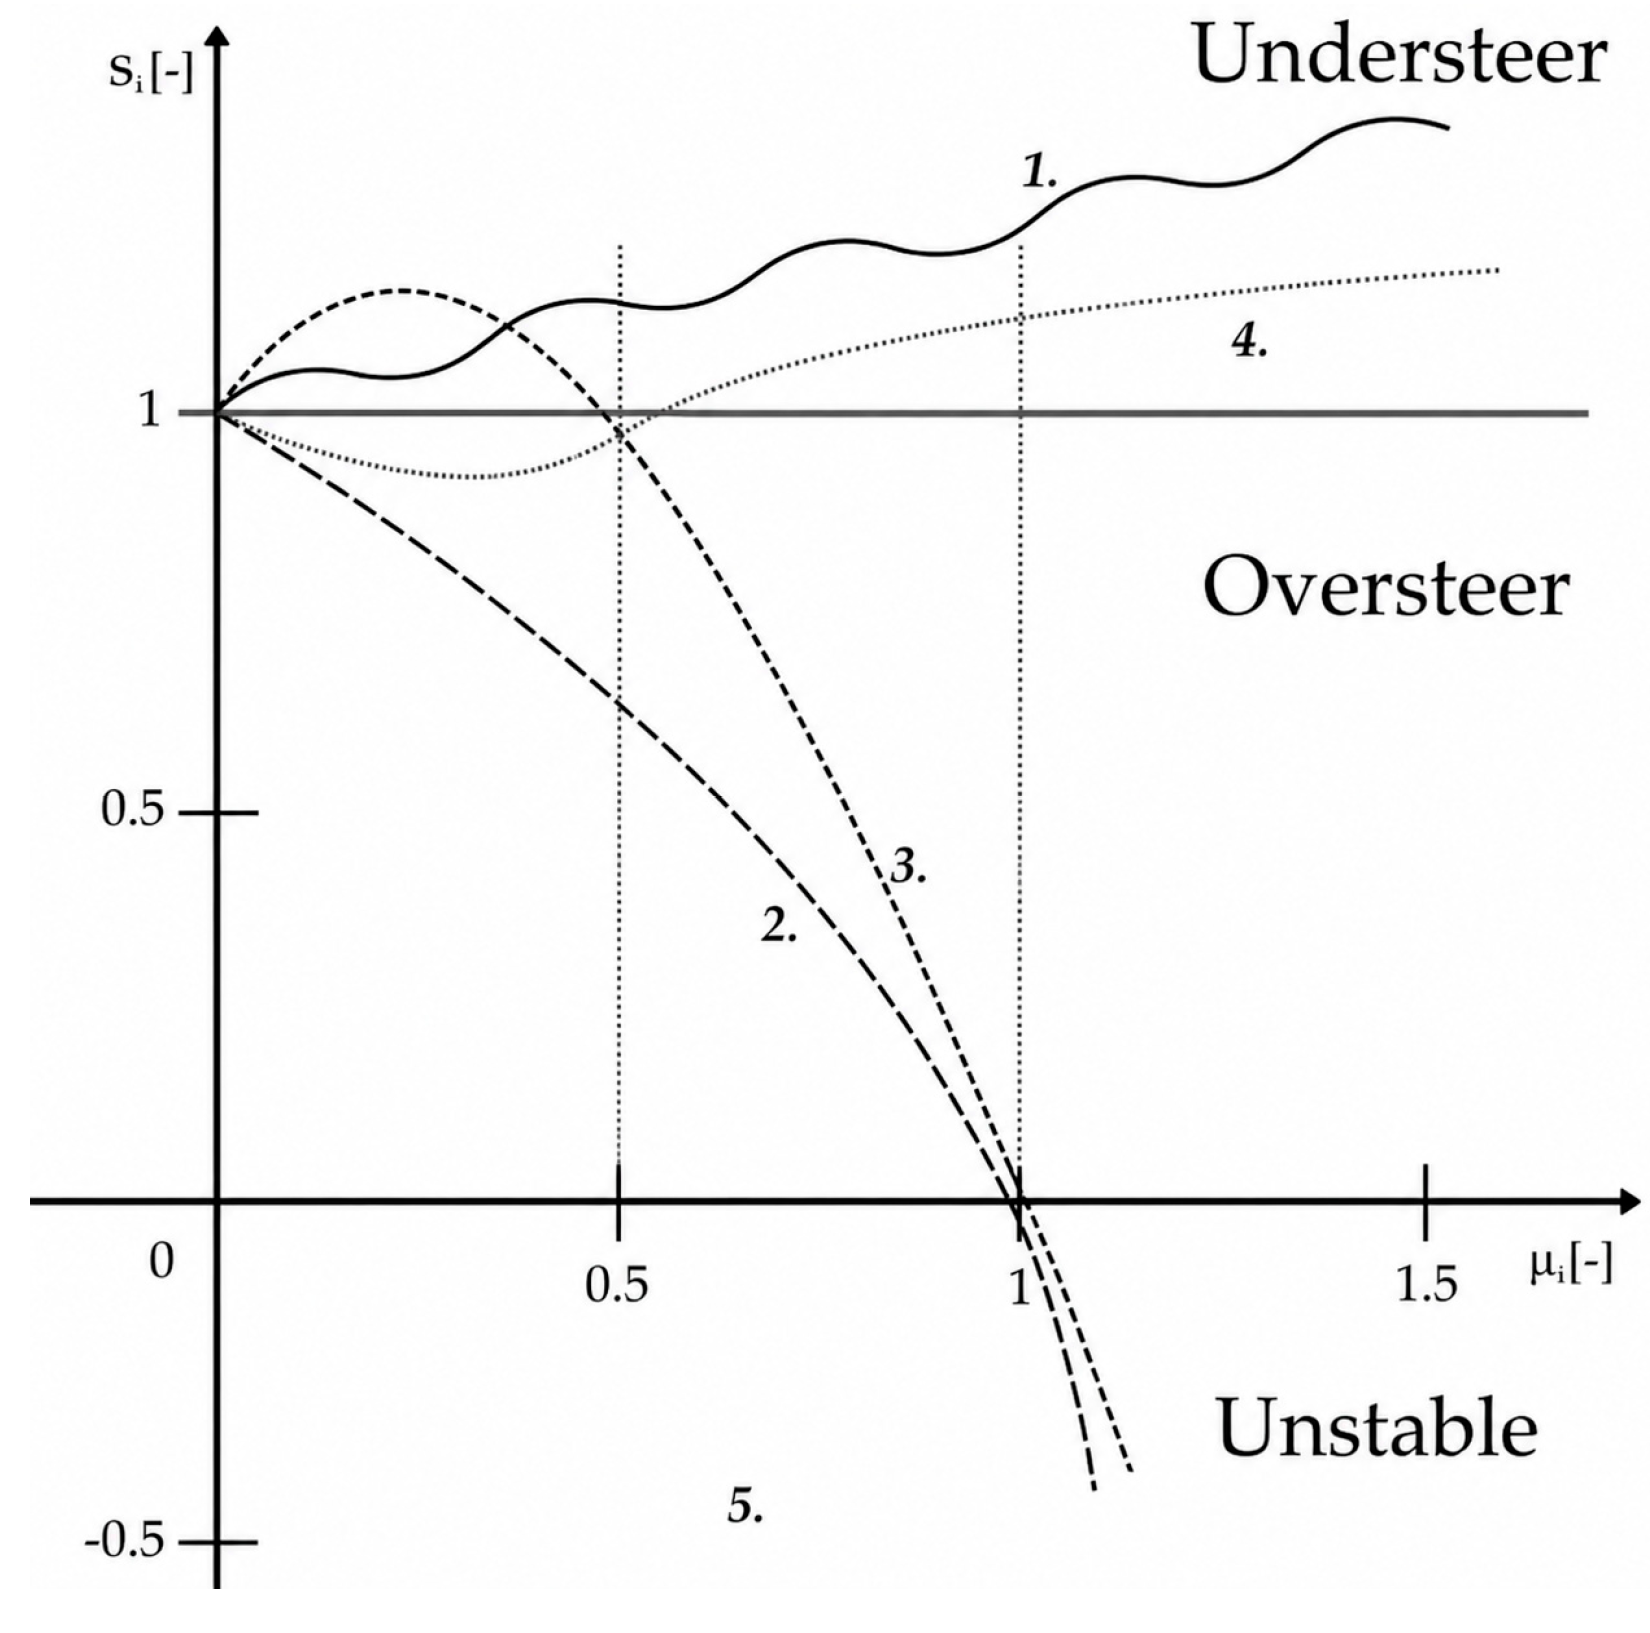
Based on these parameters, vehicle behavior can be classified into five characteristic categories, ranging from consistent understeer to unstable behavior where the required steering angle reverses direction. The conceptual representation is shown in Figure 2. For interpretative purposes, self-steering factor values greater than unity (Sk > 1) indicate an understeering tendency, whereas values below unity (Sk < 1) indicate an oversteering tendency. The categorization is based on the observed trend and progression of steering demand with increasing lateral acceleration, allowing a comparative interpretation of handling behavior across different tire pressure configurations rather than a quantitative classification [17,18].
Figure 2.
Self-steering characteristics: 1. steadily understeering, 2. steadily oversteering, 3. from understeer changes to oversteer, 4. from oversteer changes to understeer, 5. unstable condition.
In this study, the self-steering factor is denoted as Sk [-], the specific lateral acceleration as μs [-], and the steering angle as β [°]. The horizontal axis of the self-steering characteristic diagrams represents the specific lateral acceleration μs [-], which corresponds to the lateral acceleration normalized by gravitational acceleration and can therefore be interpreted as lateral acceleration expressed in g. These symbols and units are used consistently in the figures, tables, and discussion of the results. Figure 2. Conceptual representation of self-steering characteristics, adapted from standard vehicle dynamics interpretation of understeer and oversteer behavior [8,9]: 1. steadily understeering, 2. steadily oversteering, 3. transition from understeer to oversteer, 4. transition from oversteer to understeer, and 5. unstable condition.
2.5. Experimental Setup
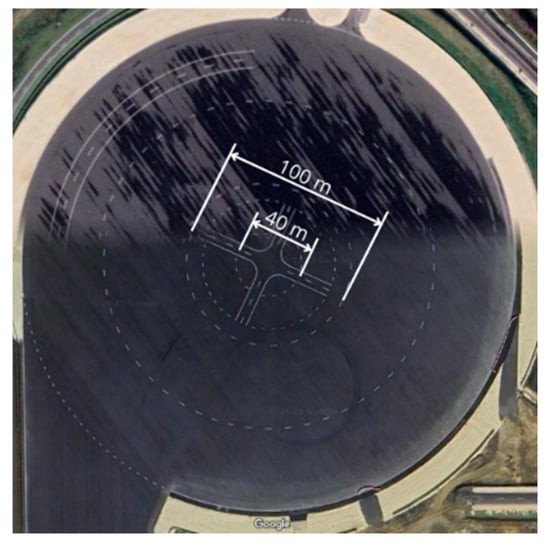
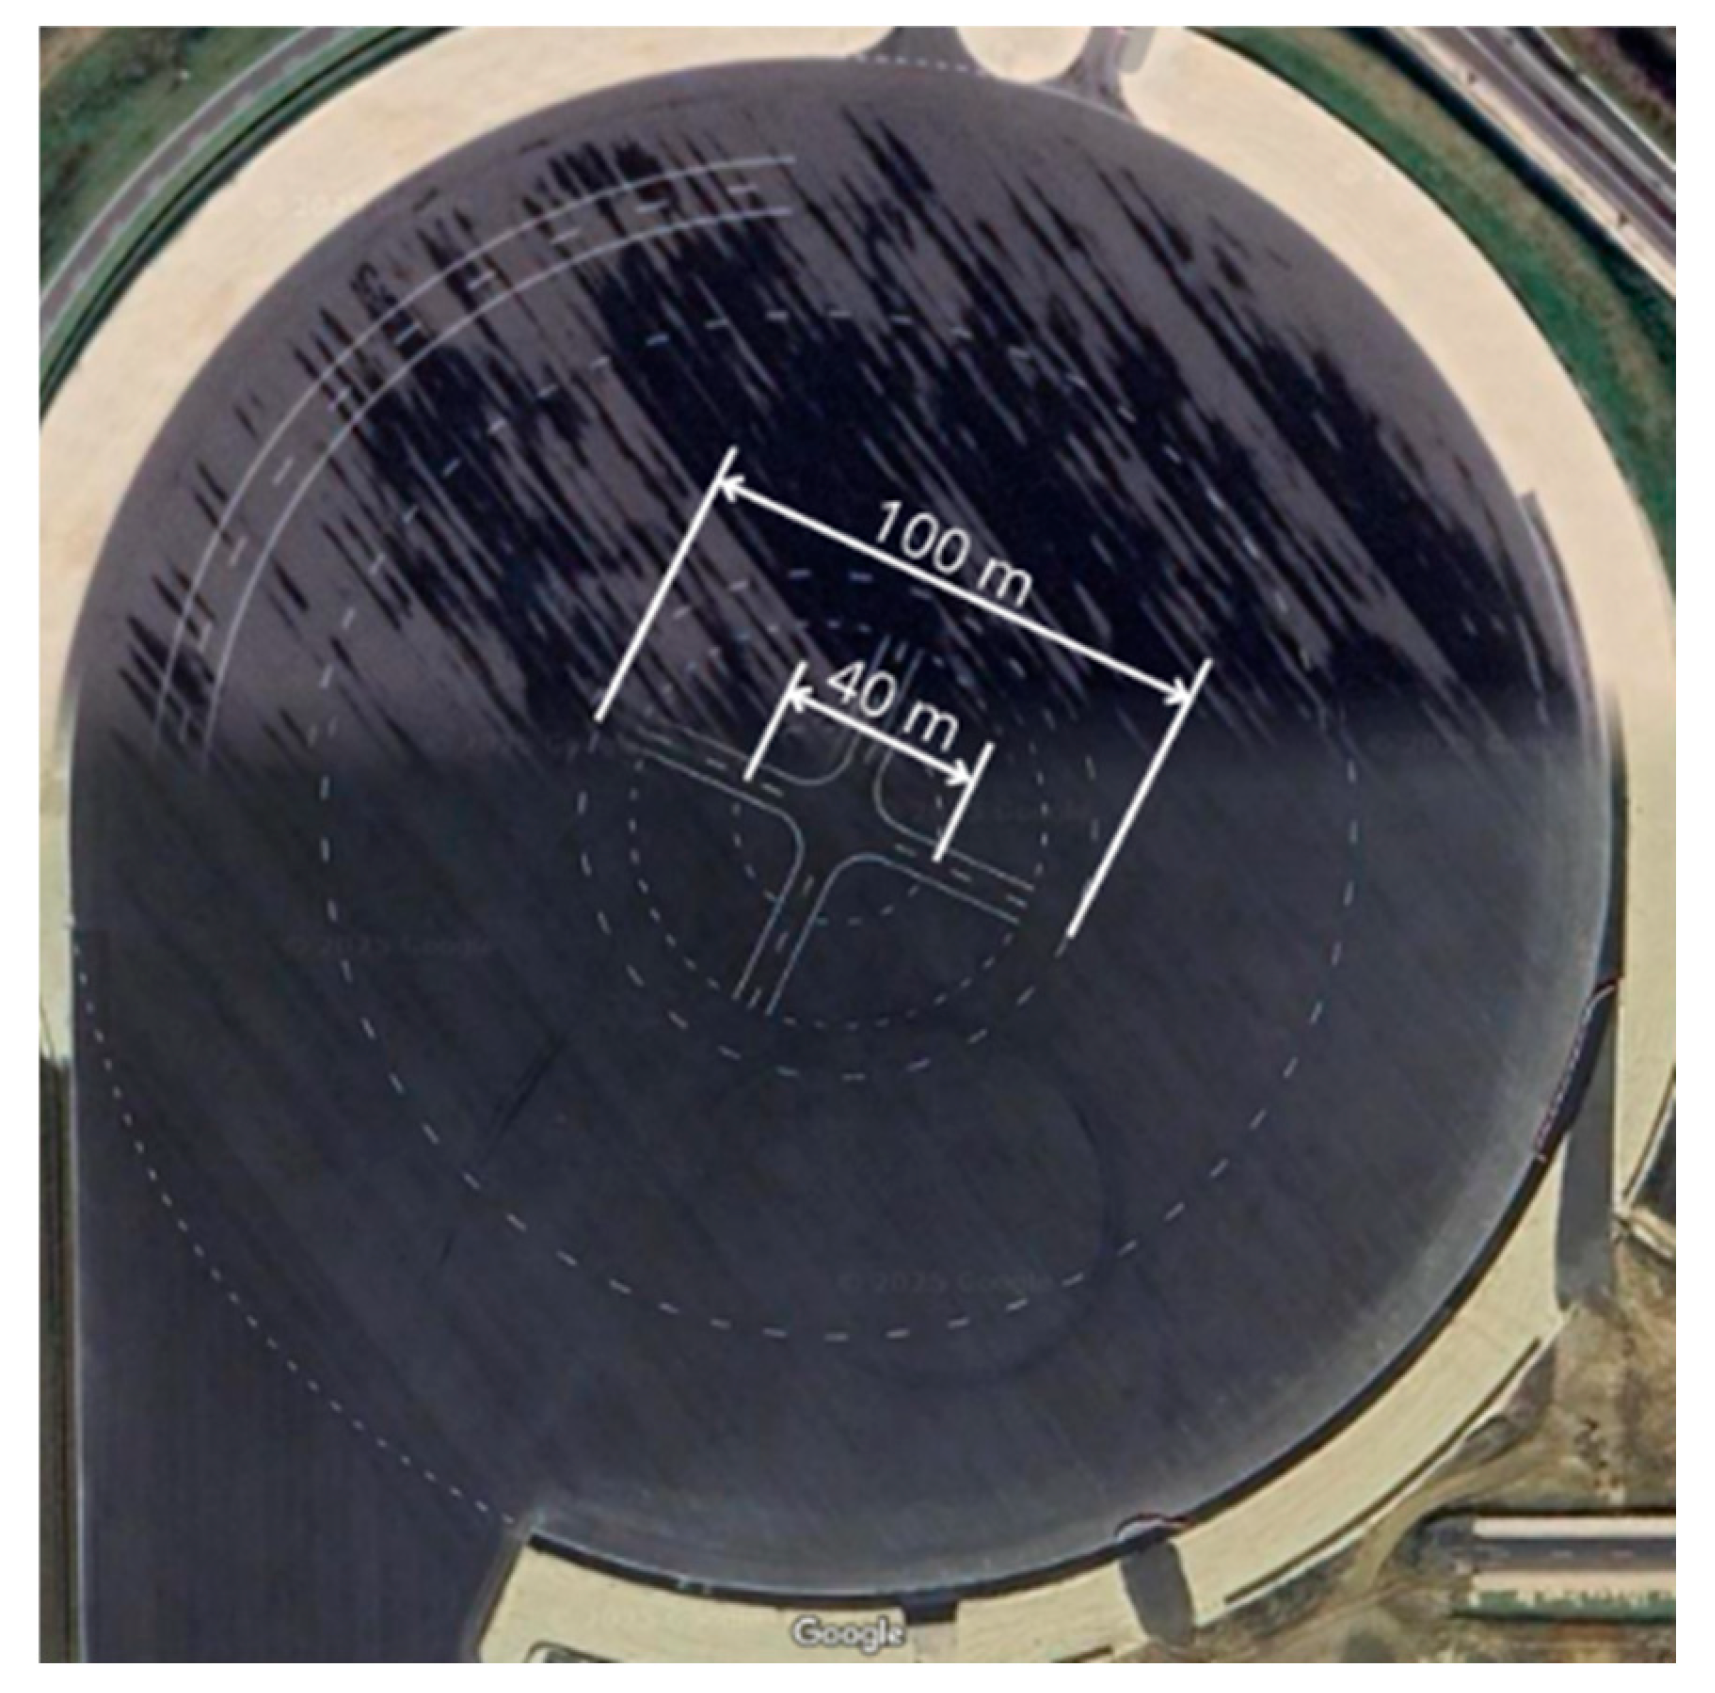
All experiments were conducted at the ZalaZONE Automotive Proving Ground in Hungary, using the Dynamic Platform, which provides pre-marked circular tracks with diameters of 100 m and 40 m (Figure 3). These standardized layouts ensured consistent and repeatable boundary conditions.
Figure 3.
ZalaZONE—Dynamic Platform location and layout.
2.6. Measurement System and Data Acquisition
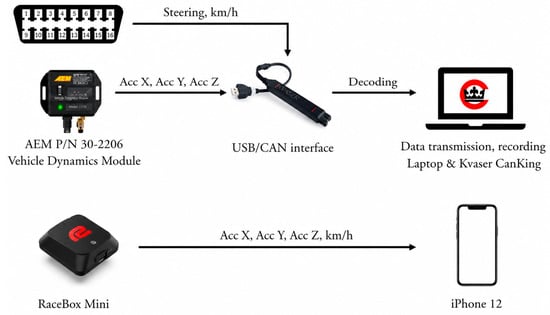
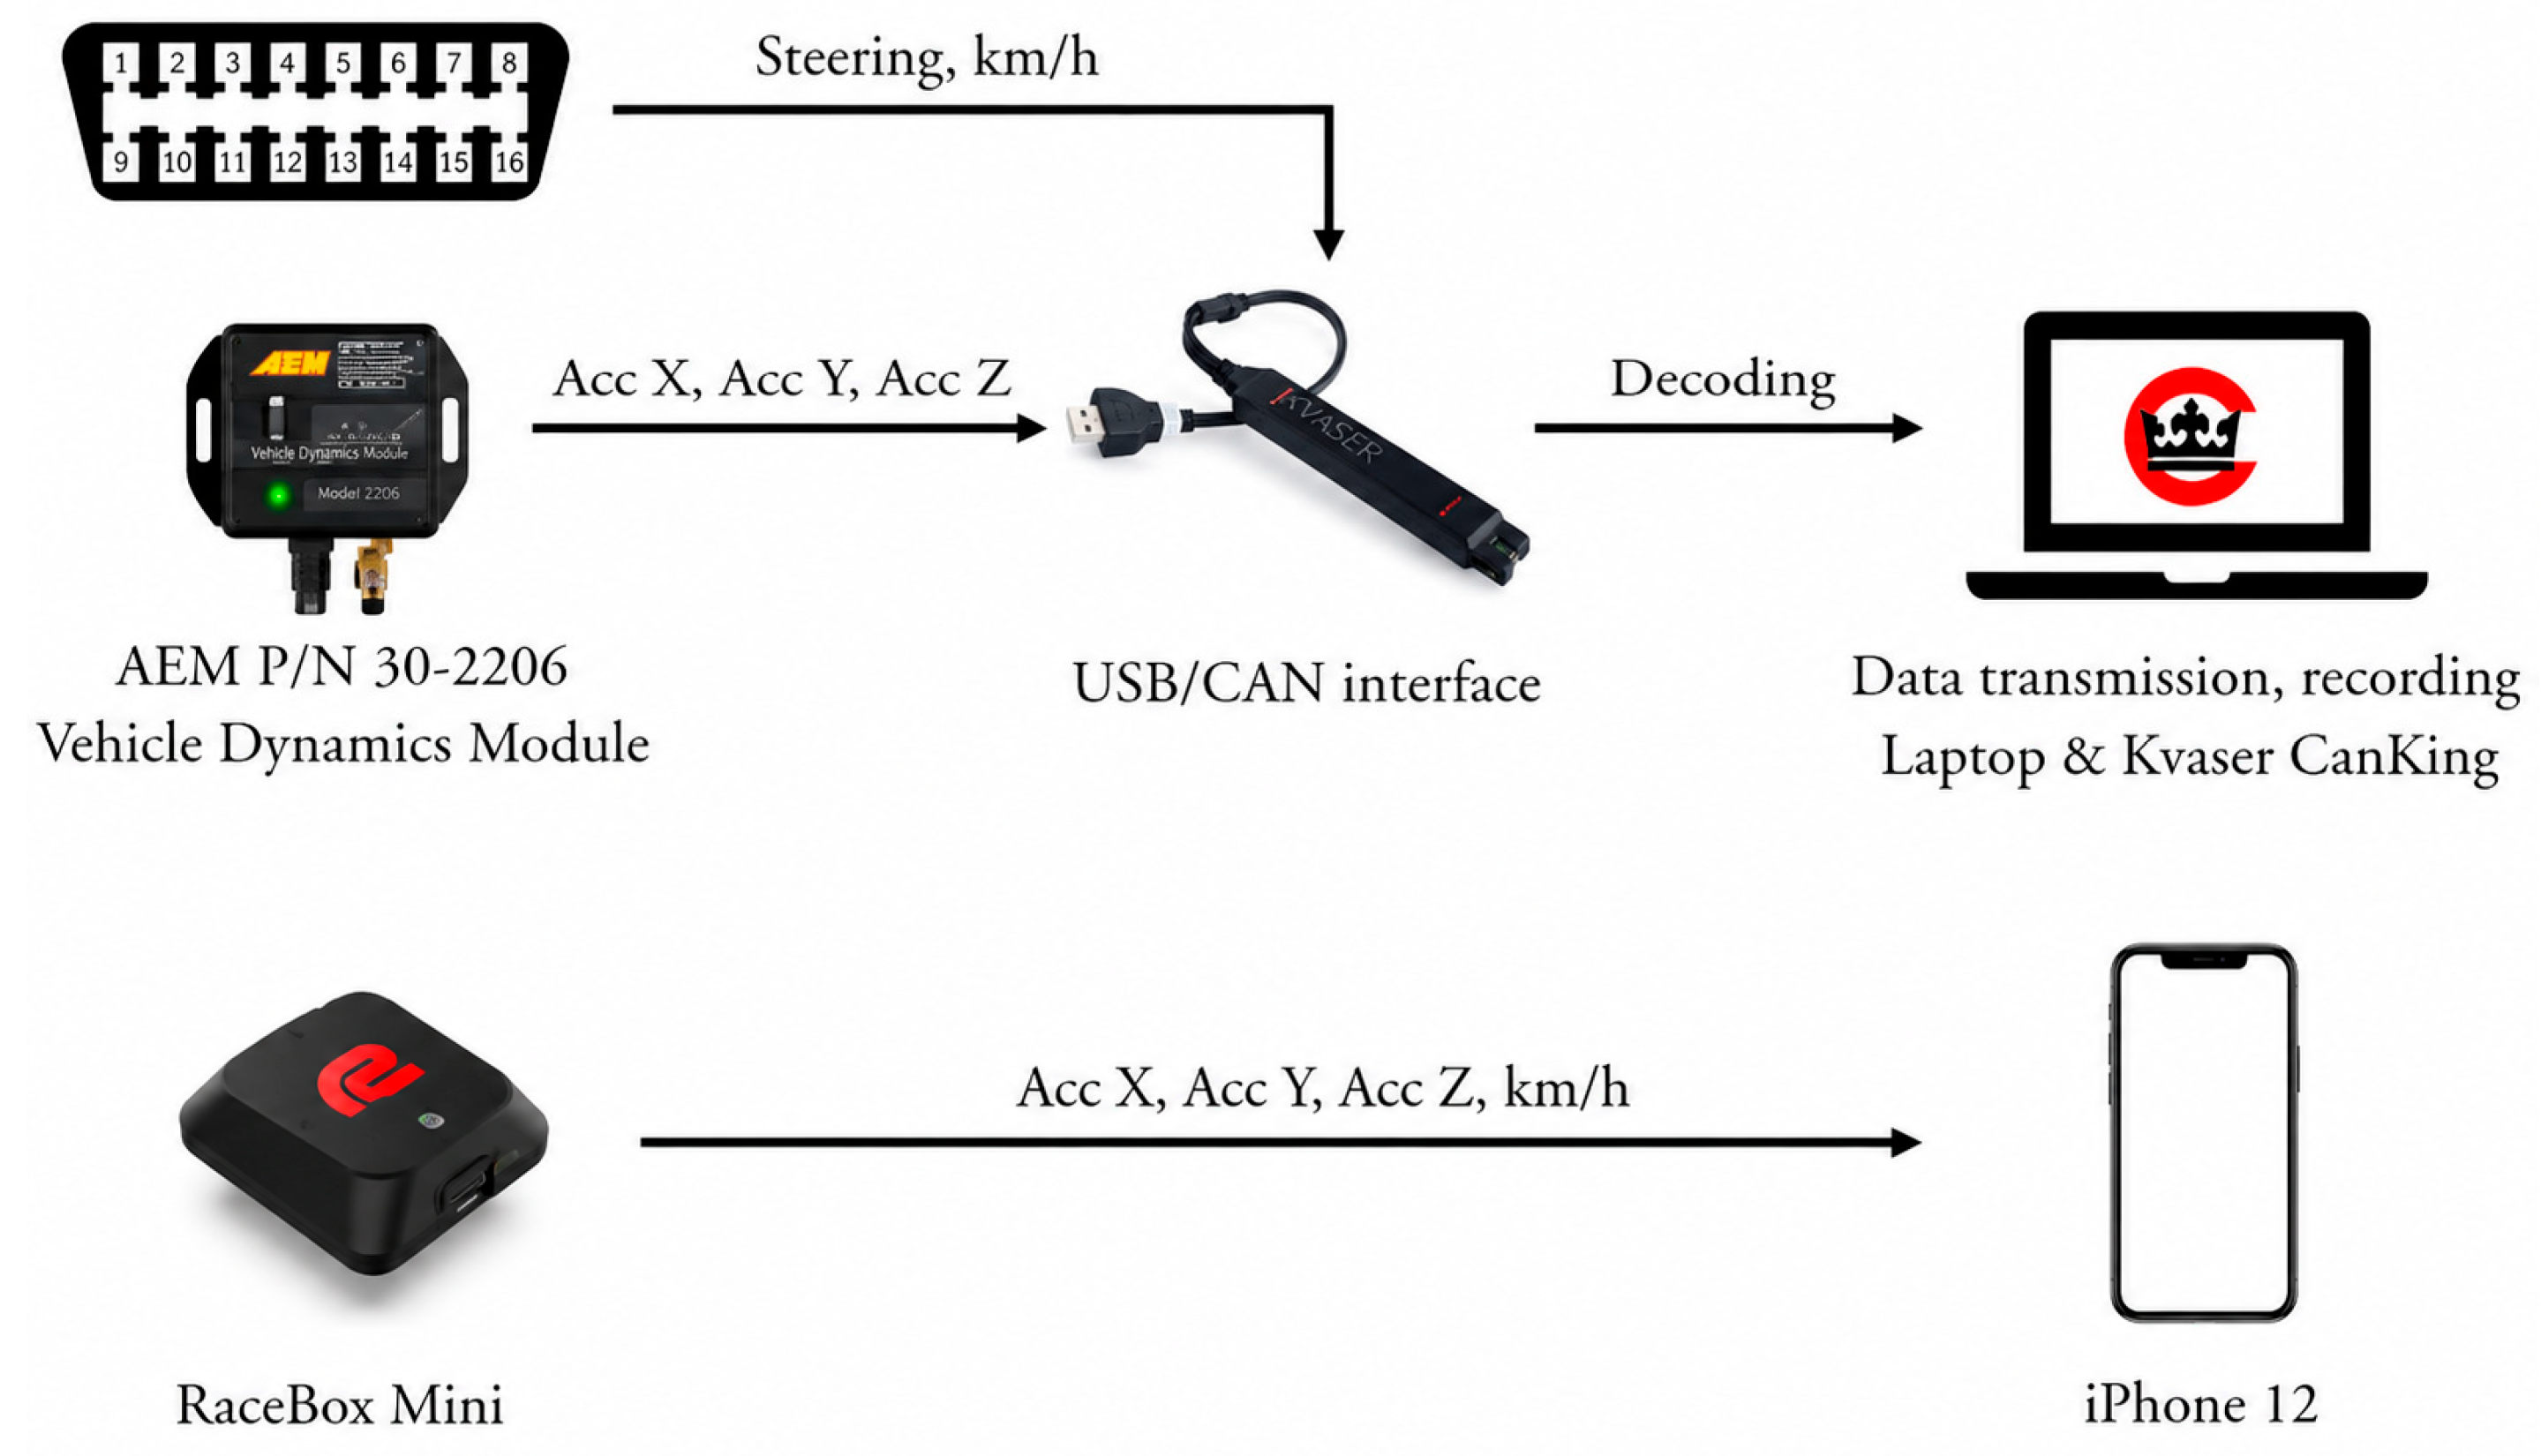
Vehicle dynamics data were acquired from the vehicle CAN network using an AEM Vehicle Dynamics Module (VDM, P/N 30-2206; AEM Performance Electronics, Hawthorne, CA, USA) as a data acquisition unit. Steering-related and vehicle motion signals were obtained from the original equipment manufacturer (OEM) sensors available on the CAN bus and recorded using a Kvaser USB/CAN interface with Kvaser CANking V6.24 software (Kvaser AB, Mölndal, Sweden) (Figure 4). The logged data were exported in text format and post-processed using Microsoft Excel (Microsoft Corporation, Redmond, WA, USA).
Figure 4.
Sensors and equipment for measurement.
Vehicle speed was derived from wheel-speed signals provided by the OEM system. Although the AEM VDM features an integrated GNSS receiver, GPS-based speed data were not used in the present analysis.
The AEM VDM was mounted near the vehicle’s center of gravity and aligned with the vehicle coordinate system according to the manufacturer’s installation guidelines.
2.7. Tire Configurations and Pressure Settings
Tires of identical size but designed for different seasonal applications were used during the experiments. The tests were carried out using a Continental WinterContact TS 860 S winter tire, 205/55 R16 91H, and a Continental EcoContact 6 summer tire, 205/55 R16 91V (Continental AG, Hanover, Germany). As a reference configuration, the manufacturer-recommended tire pressure of 2.5 bar was applied uniformly on both axles.
Tire pressures were adjusted and verified under cold conditions prior to each test run using a calibrated BGS-55410 tire pressure gauge (BGS technic KG, Wermelskirchen, Germany). The tire pressure values measured before and after each run showed no measurable difference, indicating that pressure changes due to short-term thermal effects were not observable within the applied test duration. However, tire temperature was not recorded directly; therefore, possible temperature-related changes in tire stiffness and grip could not be evaluated separately.
The defined pressure configurations and the manufacturer-recommended reference pressure were checked before each measurement run to ensure consistent test conditions. This approach allowed the investigation of tire pressure effects on vehicle handling behavior under controlled experimental conditions.
Measured lateral acceleration values obtained from the vehicle dynamics module were cross-validated using an external RaceBox Mini GPS-based measurement system (RaceBox, Sofia, Bulgaria) to ensure data consistency.
2.8. Physical Background of Tire Pressure Effects on Cornering Behavior
Tire inflation pressure influences vehicle cornering behavior primarily through its effect on tire cornering stiffness and the force–slip characteristics of the tire–road contact. The slope of the lateral force versus slip angle curve at small slip angles, commonly referred to as cornering stiffness, is a key parameter governing steady-state handling behavior. Changes in tire inflation pressure modify the effective stiffness and deformation behavior of the tire carcass, which in turn affects the generation of lateral forces and the required steering input during cornering. At higher inflation pressures, increased tire stiffness generally leads to reduced steering angles for a given lateral acceleration, while lower inflation pressures result in increased lateral compliance, which may alter handling characteristics as the lateral acceleration increases toward the grip limit [2,19].
These fundamental relationships provide the physical background for the experimental and simulation-based investigations presented in the following sections.
The present study does not attempt to identify numerical cornering stiffness parameters or develop a predictive tire model. Instead, the self-steering factor and the specific lateral acceleration are used as comparative indicators to evaluate how tire pressure distribution modifies vehicle-level handling trends.
3. Results
For clarity, only the most representative configurations are presented, including the baseline setup, the best- and worst-performing pressure combinations, and selected cases exhibiting pronounced changes in vehicle behavior. The results are grouped into simulation-based findings and experimental measurements with winter and summer tires.
3.1. IPG CarMaker Simulation Results
IPG CarMaker software available in the university laboratory environment (IPG Automotive GmbH, Karlsruhe, Germany) was used as a vehicle dynamics simulation environment for the analysis of longitudinal and lateral vehicle behavior under controlled driving scenarios. The exact software version could not be retrieved from the archived project environment. In this study, the simulation was applied to qualitatively illustrate steady-state cornering trends observed during the experimental measurements.
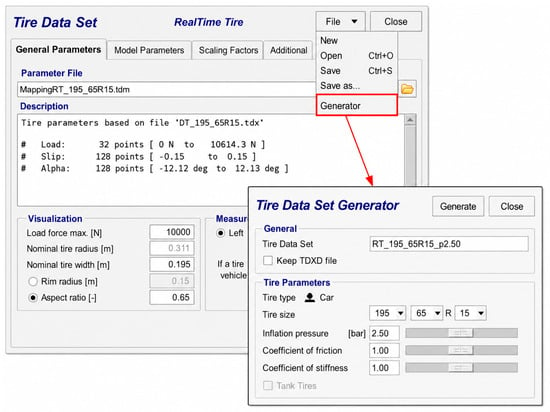
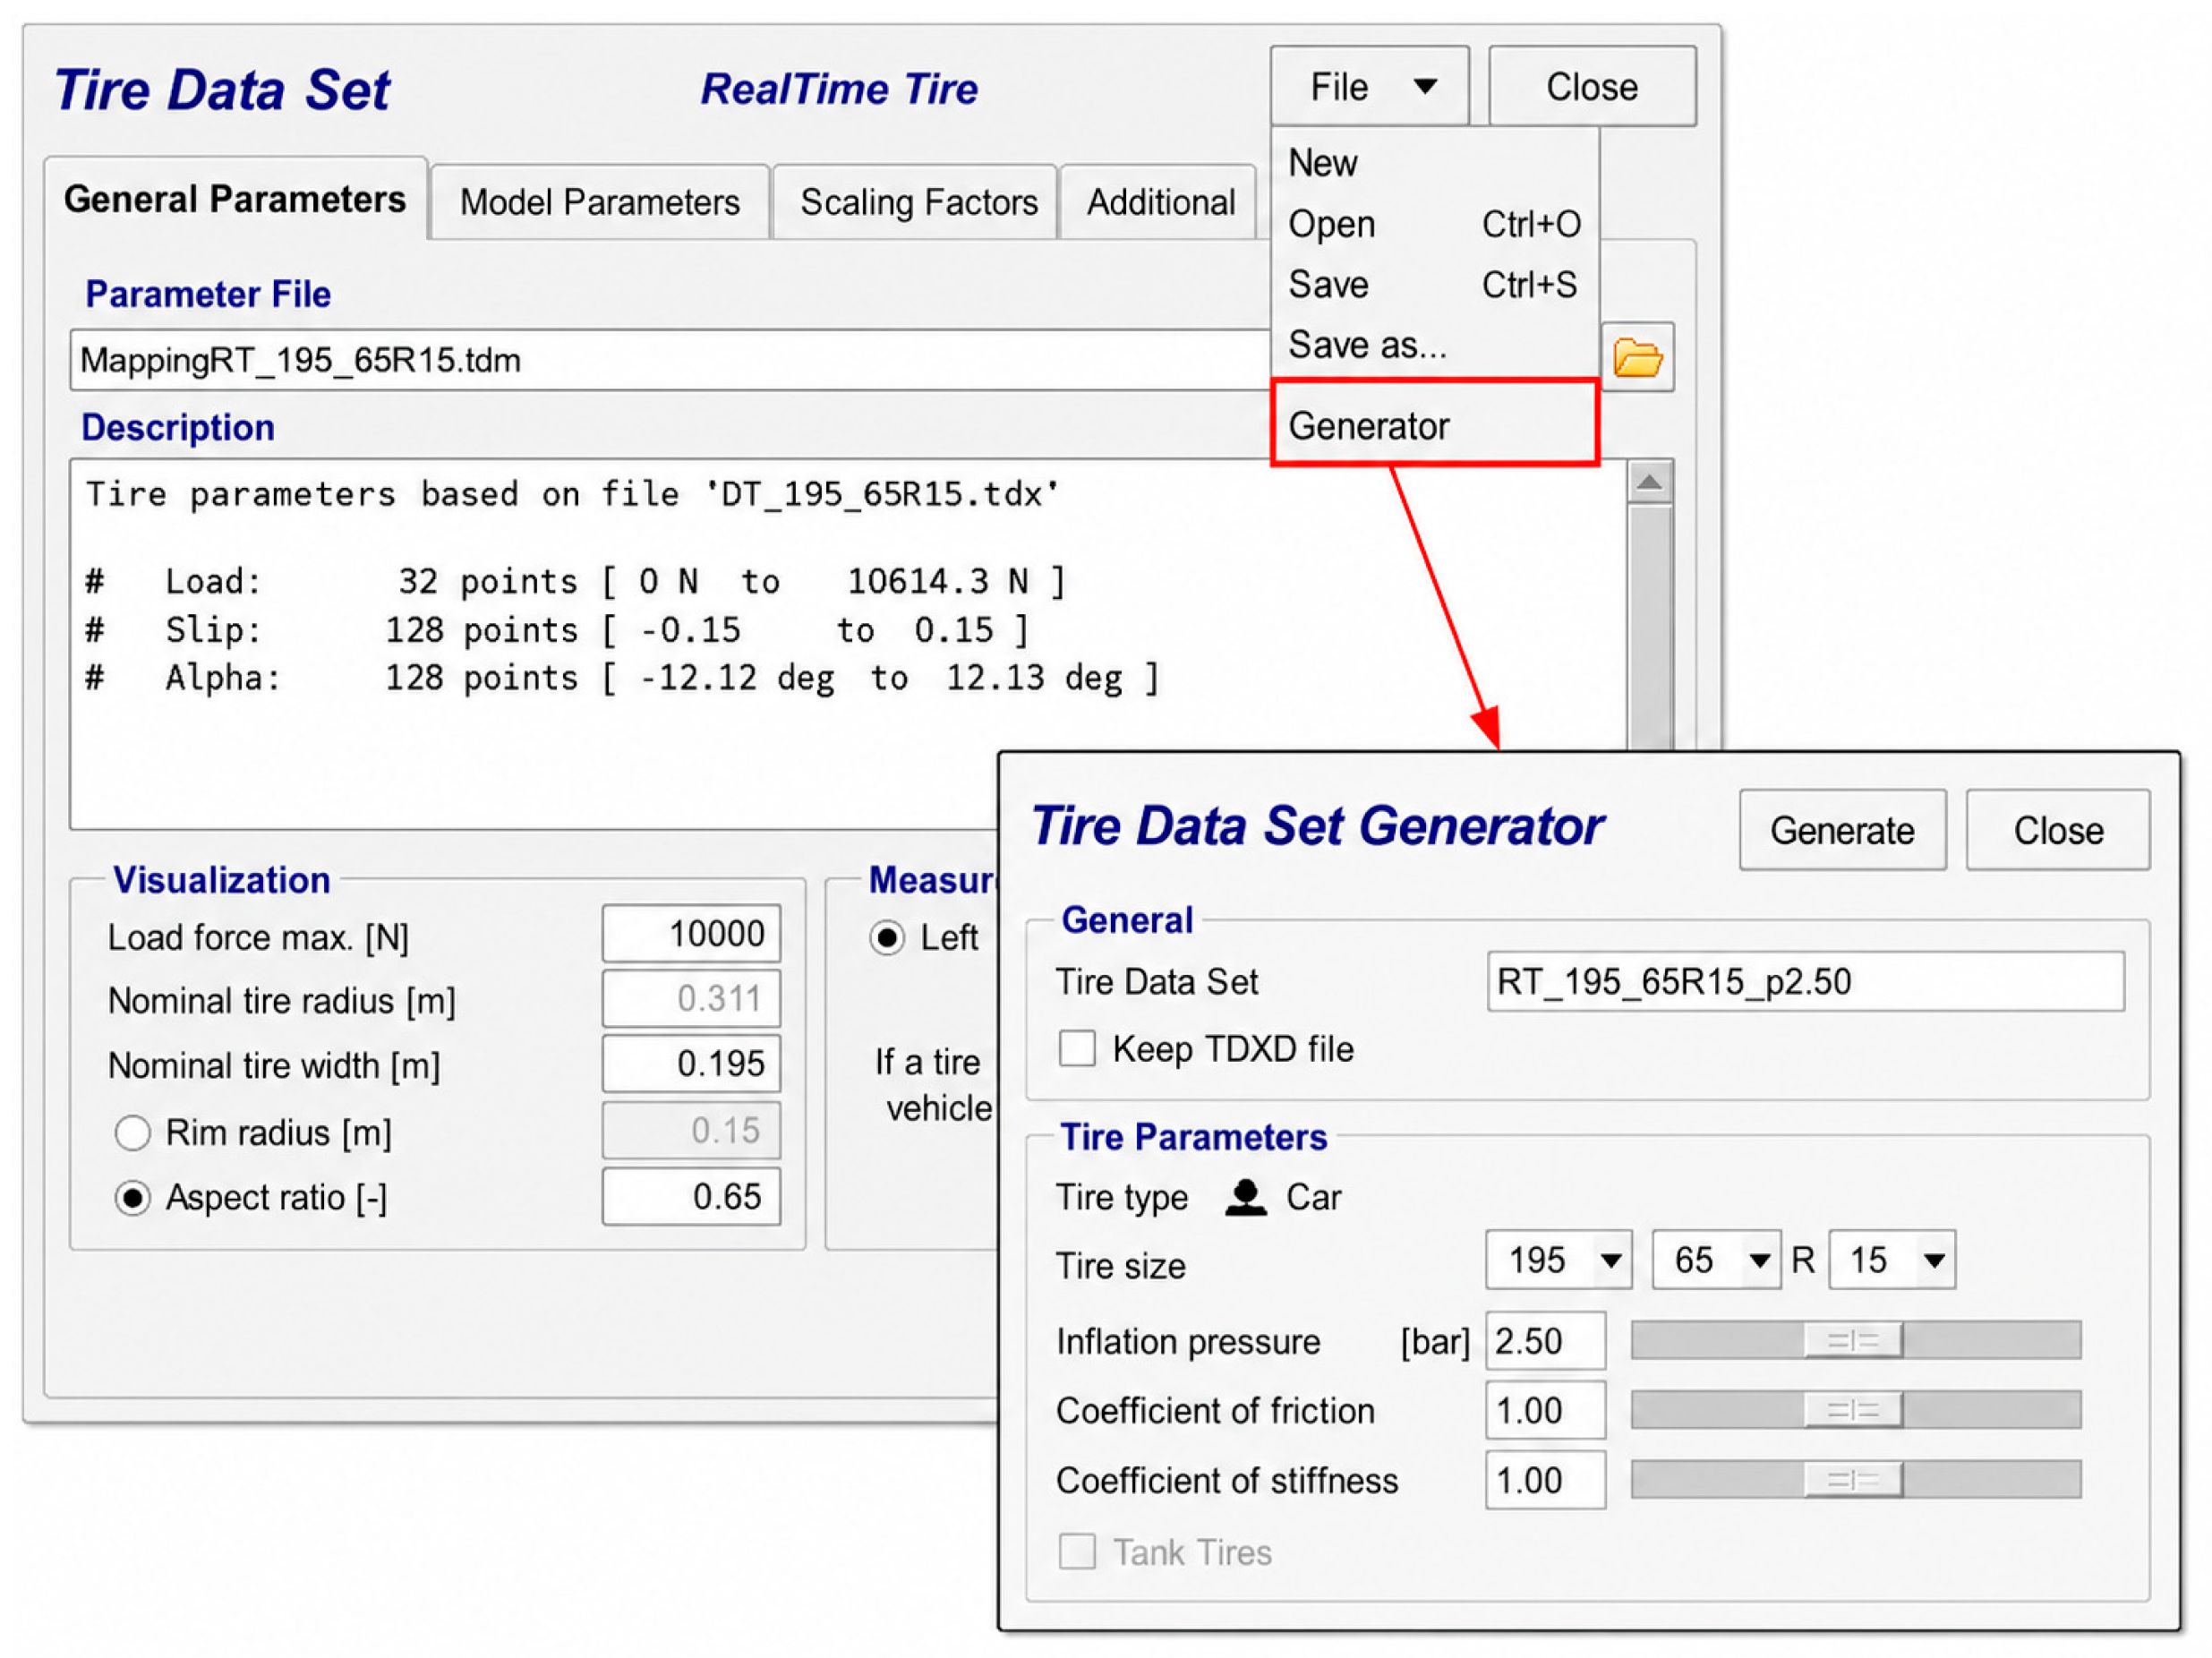
A generic tire model was used, generated with the IPG CarMaker Realtime Tire framework and the built-in Tire Data Set Generator (Figure 5). The tire model was defined based on geometric tire dimensions and inflation pressure, while default values were applied for friction and stiffness scaling parameters. No parameter identification or tuning based on experimental data was performed.
Figure 5.
Tire model definition in IPG CarMaker.
The simulated driving scenario consisted of a constant-radius circular track, corresponding to the steady-state cornering conditions applied during the experiments.
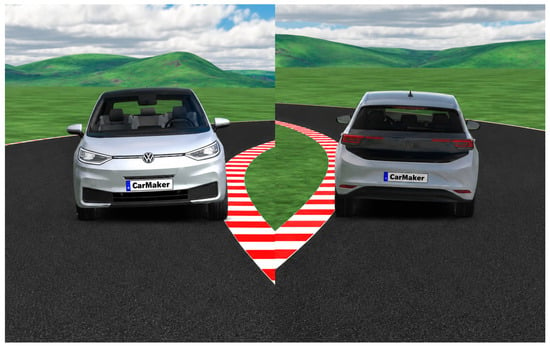
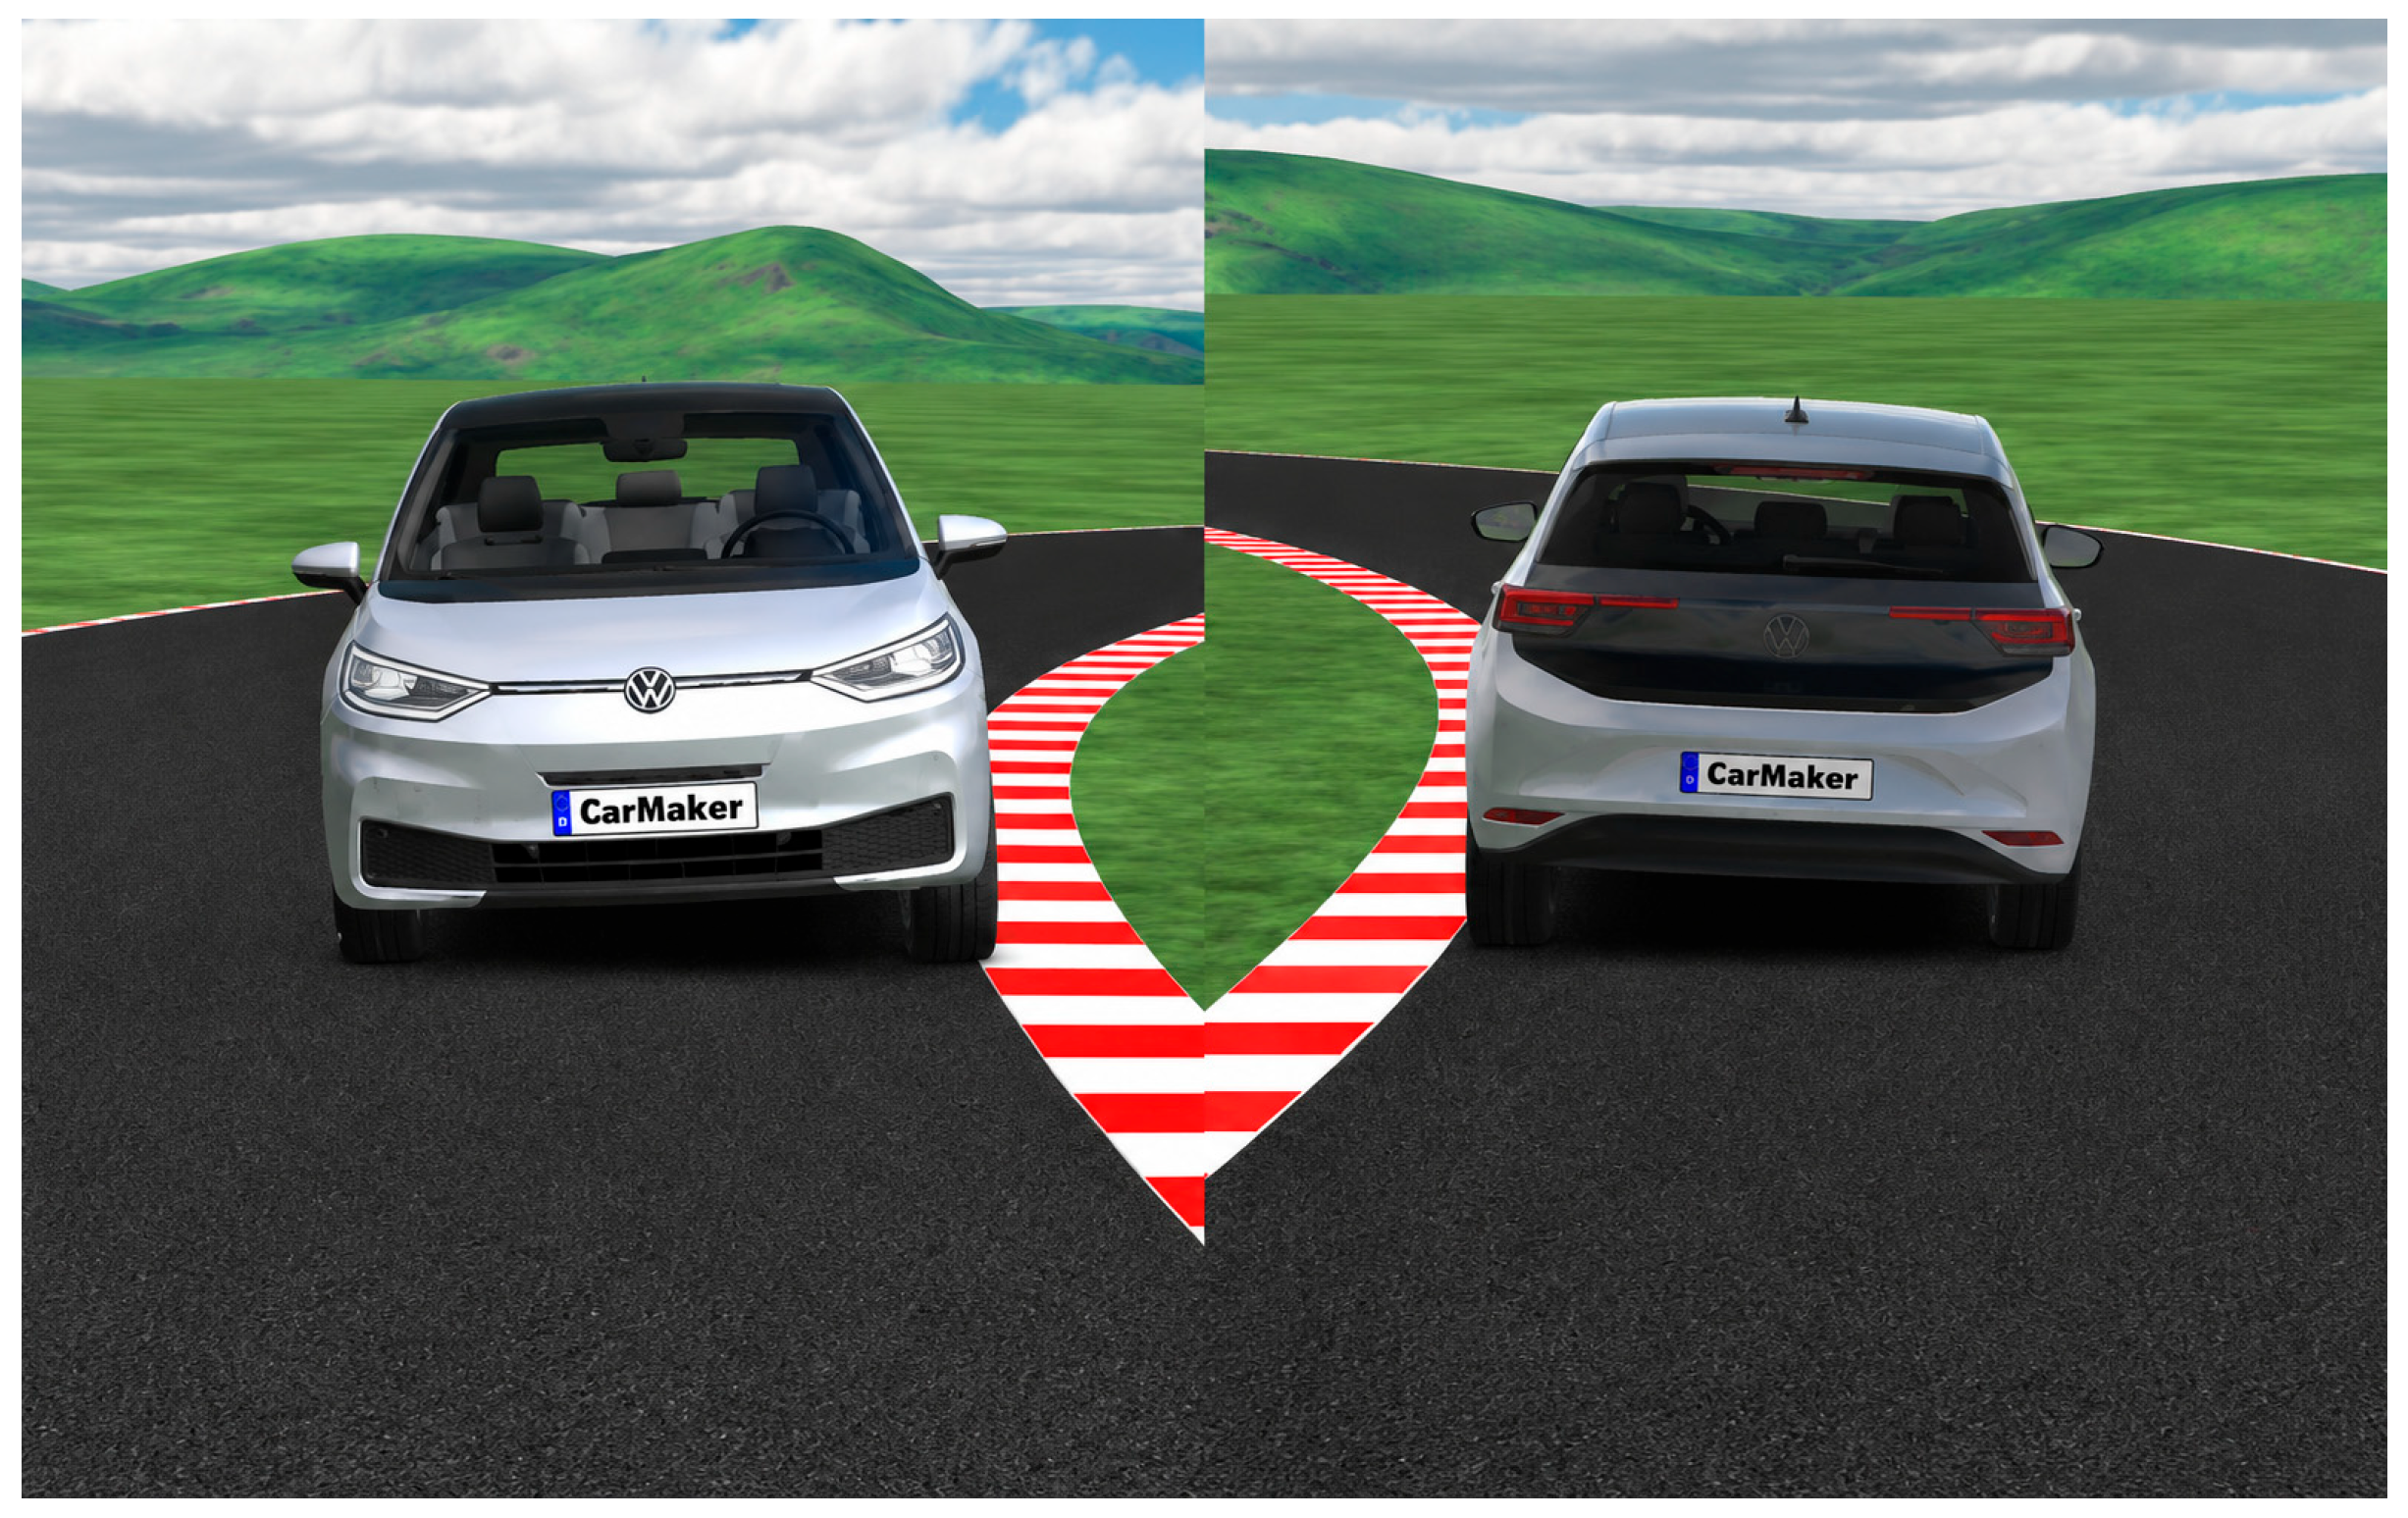
A predefined passenger car vehicle geometry available in the IPG CarMaker library was used (Figure 6). As an exact geometric model of the experimental vehicle was not available, the vehicle mass and inertial parameters were configured to match those of the tested vehicle, while accepting minor geometric differences.
Figure 6.
Vehicle model during steady-state cornering in IPG CarMaker.
The simulation results are intended for qualitative comparison and trend illustration only, without quantitative validation against experimental data (Figure 7).
Figure 7.
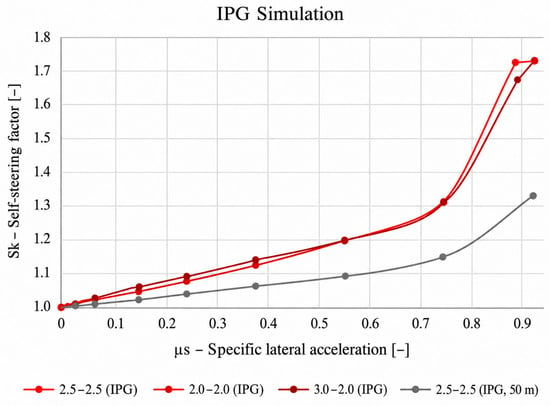
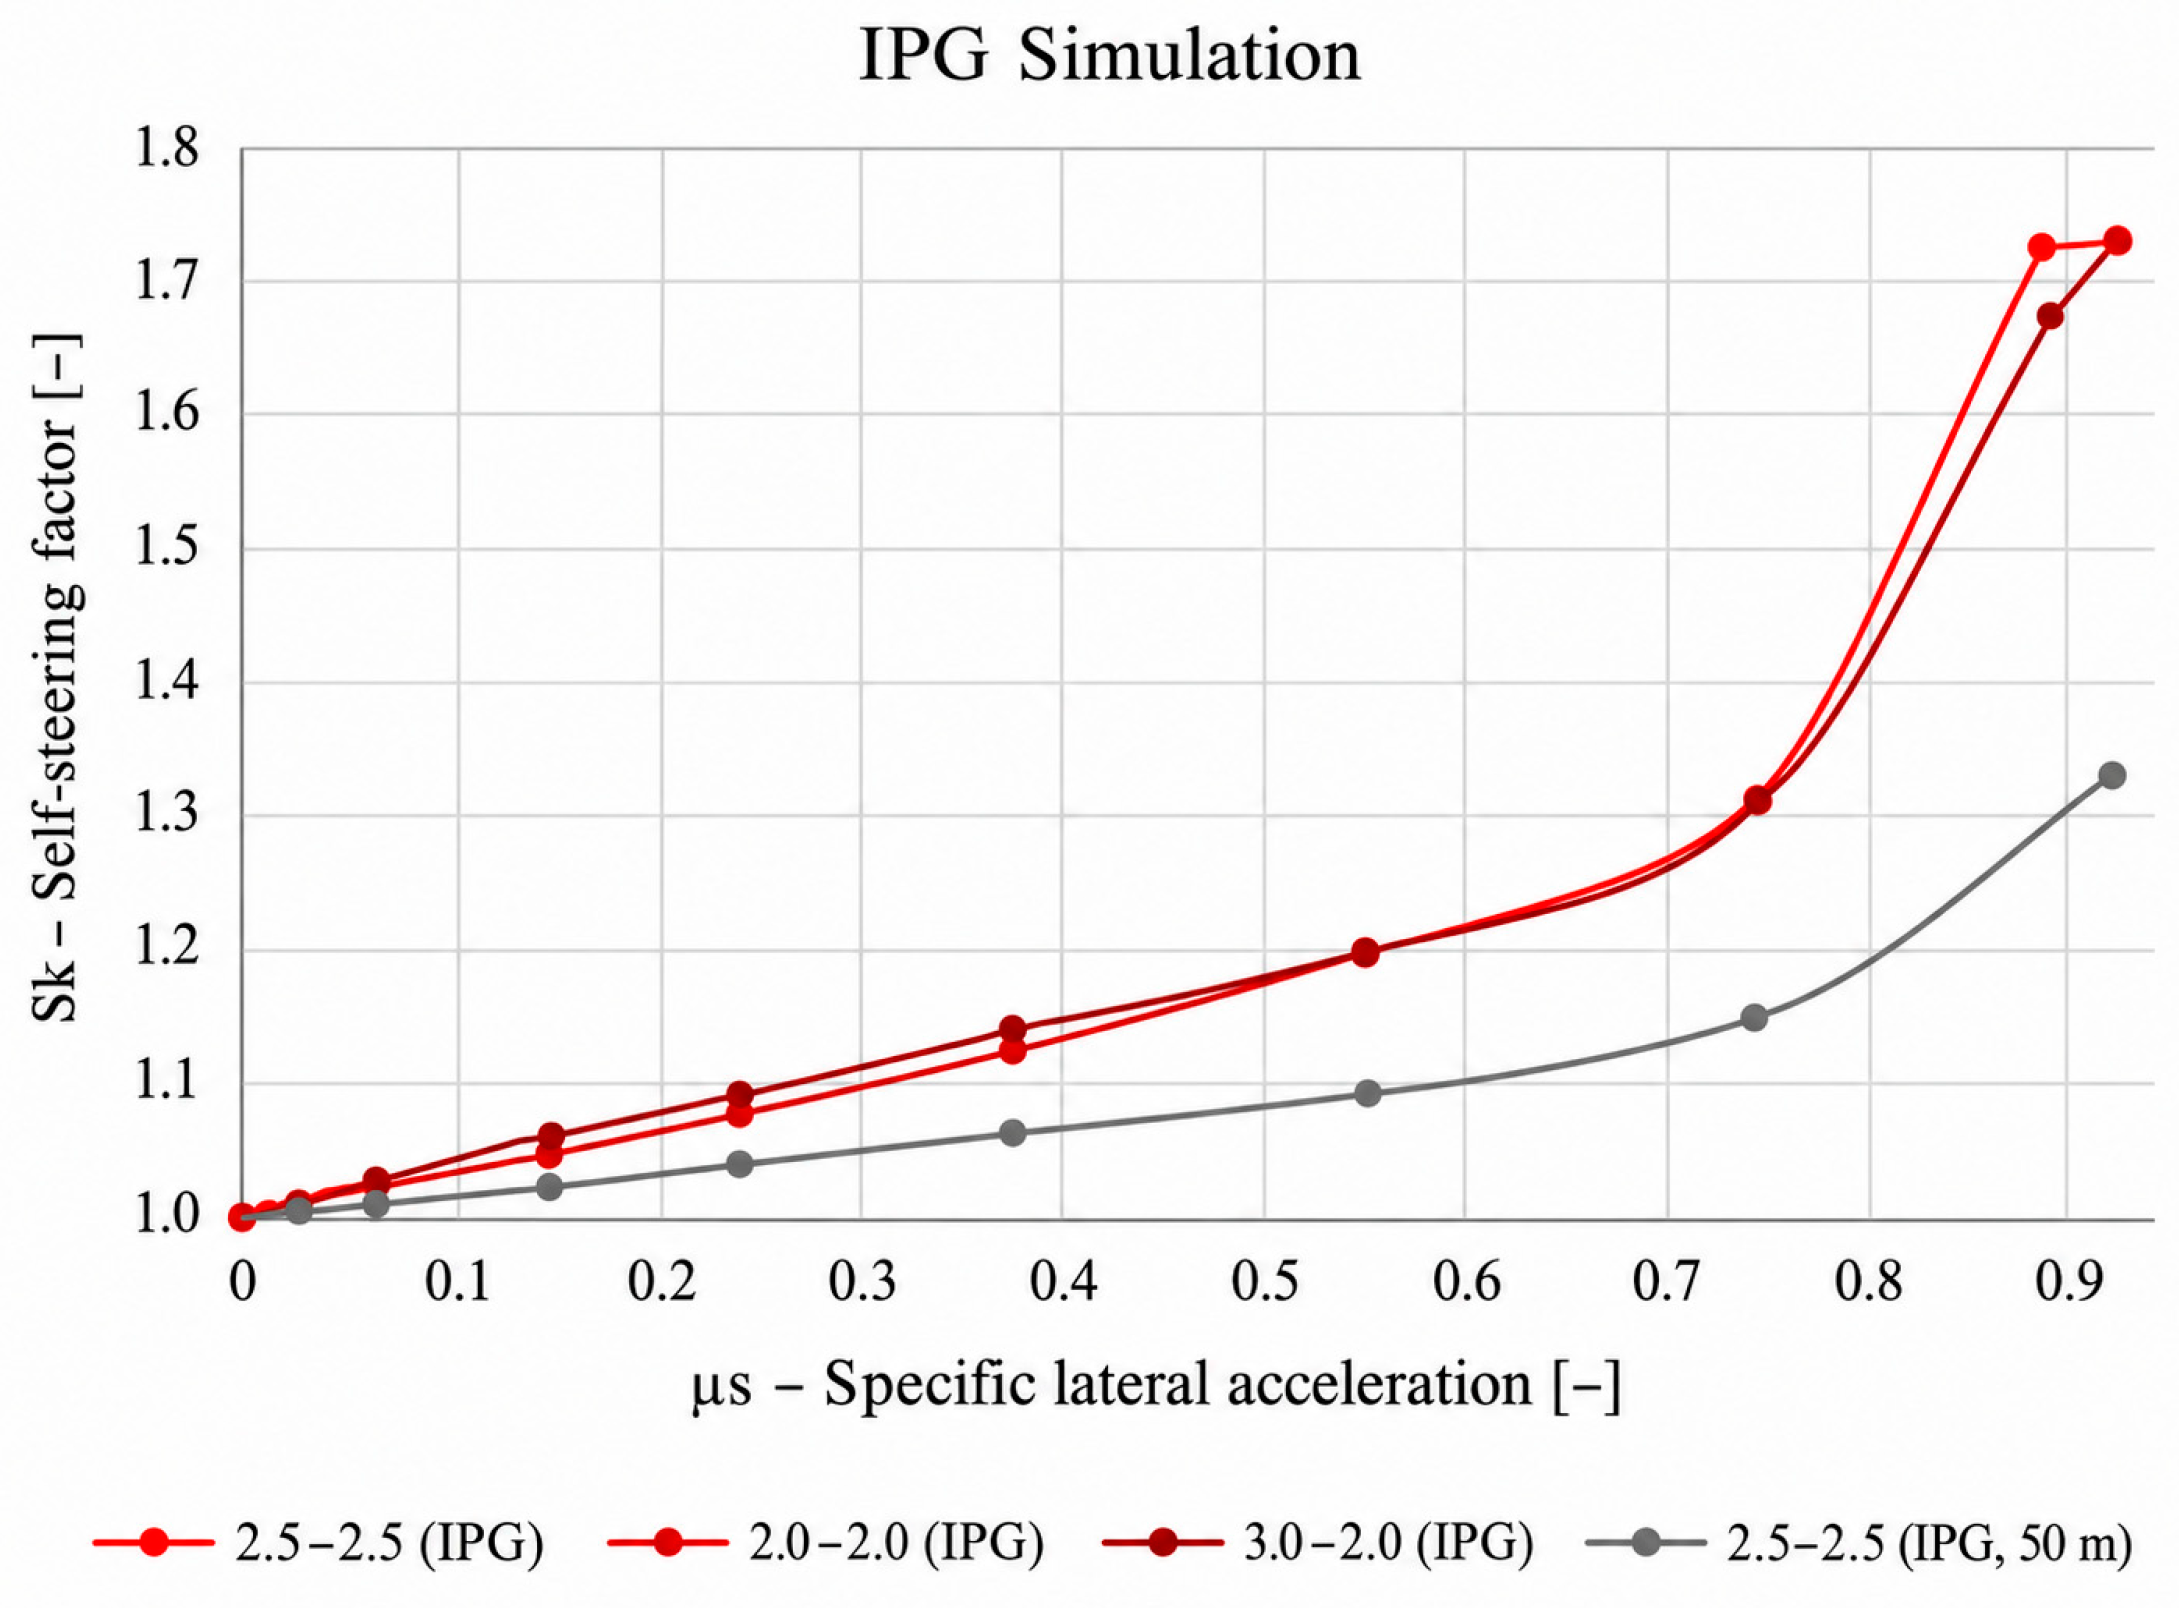
IPG CarMaker simulation results showing the relationship between self-steering factor and specific lateral acceleration for selected tire pressure configurations.
Illustrates the relationship between the self-steering factor and specific lateral acceleration for selected pressure settings. The baseline configuration (2.5–2.5 bar) exhibits a predominantly understeering behavior, with a gradual increase in steering demand as lateral acceleration increases.
Reducing the front axle pressure to 2.0 bar resulted in lower achievable lateral acceleration near the slip limit, accompanied by a steeper increase in the self-steering factor. This behavior indicates increased tire deformation and reduced lateral stiffness on the steered axle. In contrast, increasing the front axle pressure to 3.0 bar led to improved lateral stability, allowing higher cornering speeds and reduced steering input up to the slip limit.
A comparison between the 100 m and 50 m circular paths shows that (Table 1), at identical speeds, similar steering angles were required to maintain the trajectory, while the specific lateral acceleration increased substantially on the smaller-radius track. This confirms the strong influence of track geometry on lateral load demand and highlights the relevance of radius selection for cornering stability assessment.
Table 1.
IPG CarMaker simulation results for steady-state cornering under different tire pressure configurations.
A textual comparison with the experimental results was also performed in order to clarify the role and limitations of the simulation model. For the 100 m circular track, the IPG CarMaker simulation predicted a maximum cornering speed of approximately 80 km/h for the evaluated tire pressure configurations. In comparison, the measured maximum cornering speeds ranged from 68.60 to 76.63 km/h for winter tires and from 72.13 to 76.00 km/h for summer tires. This shows that the generic, non-calibrated tire model overestimated the absolute cornering speed compared with the experimental measurements.
Therefore, the IPG CarMaker results should not be interpreted as a quantitatively validated reproduction of the test vehicle and tires. Their role in this study is limited to qualitative trend illustration and to supporting the interpretation of steady-state cornering behavior under controlled conditions. The experimental measurements remain the primary basis for evaluating the influence of tire pressure distribution on self-steering behavior.
3.2. Winter Tire Measurement Results
This subsection summarizes the experimental results obtained with winter tires on a constant-radius circular track. The measurements focus on the relationship between tire pressure distribution, steering angle demand, and achievable cornering speed under steady-state conditions.
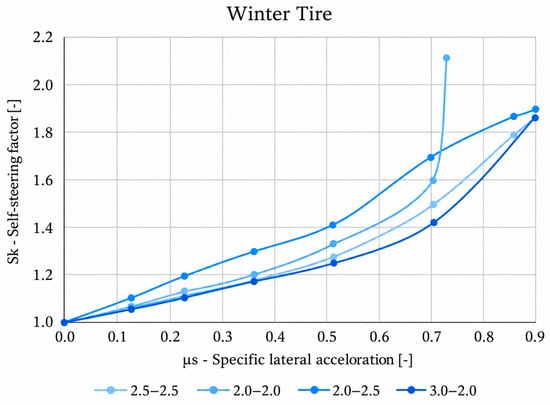
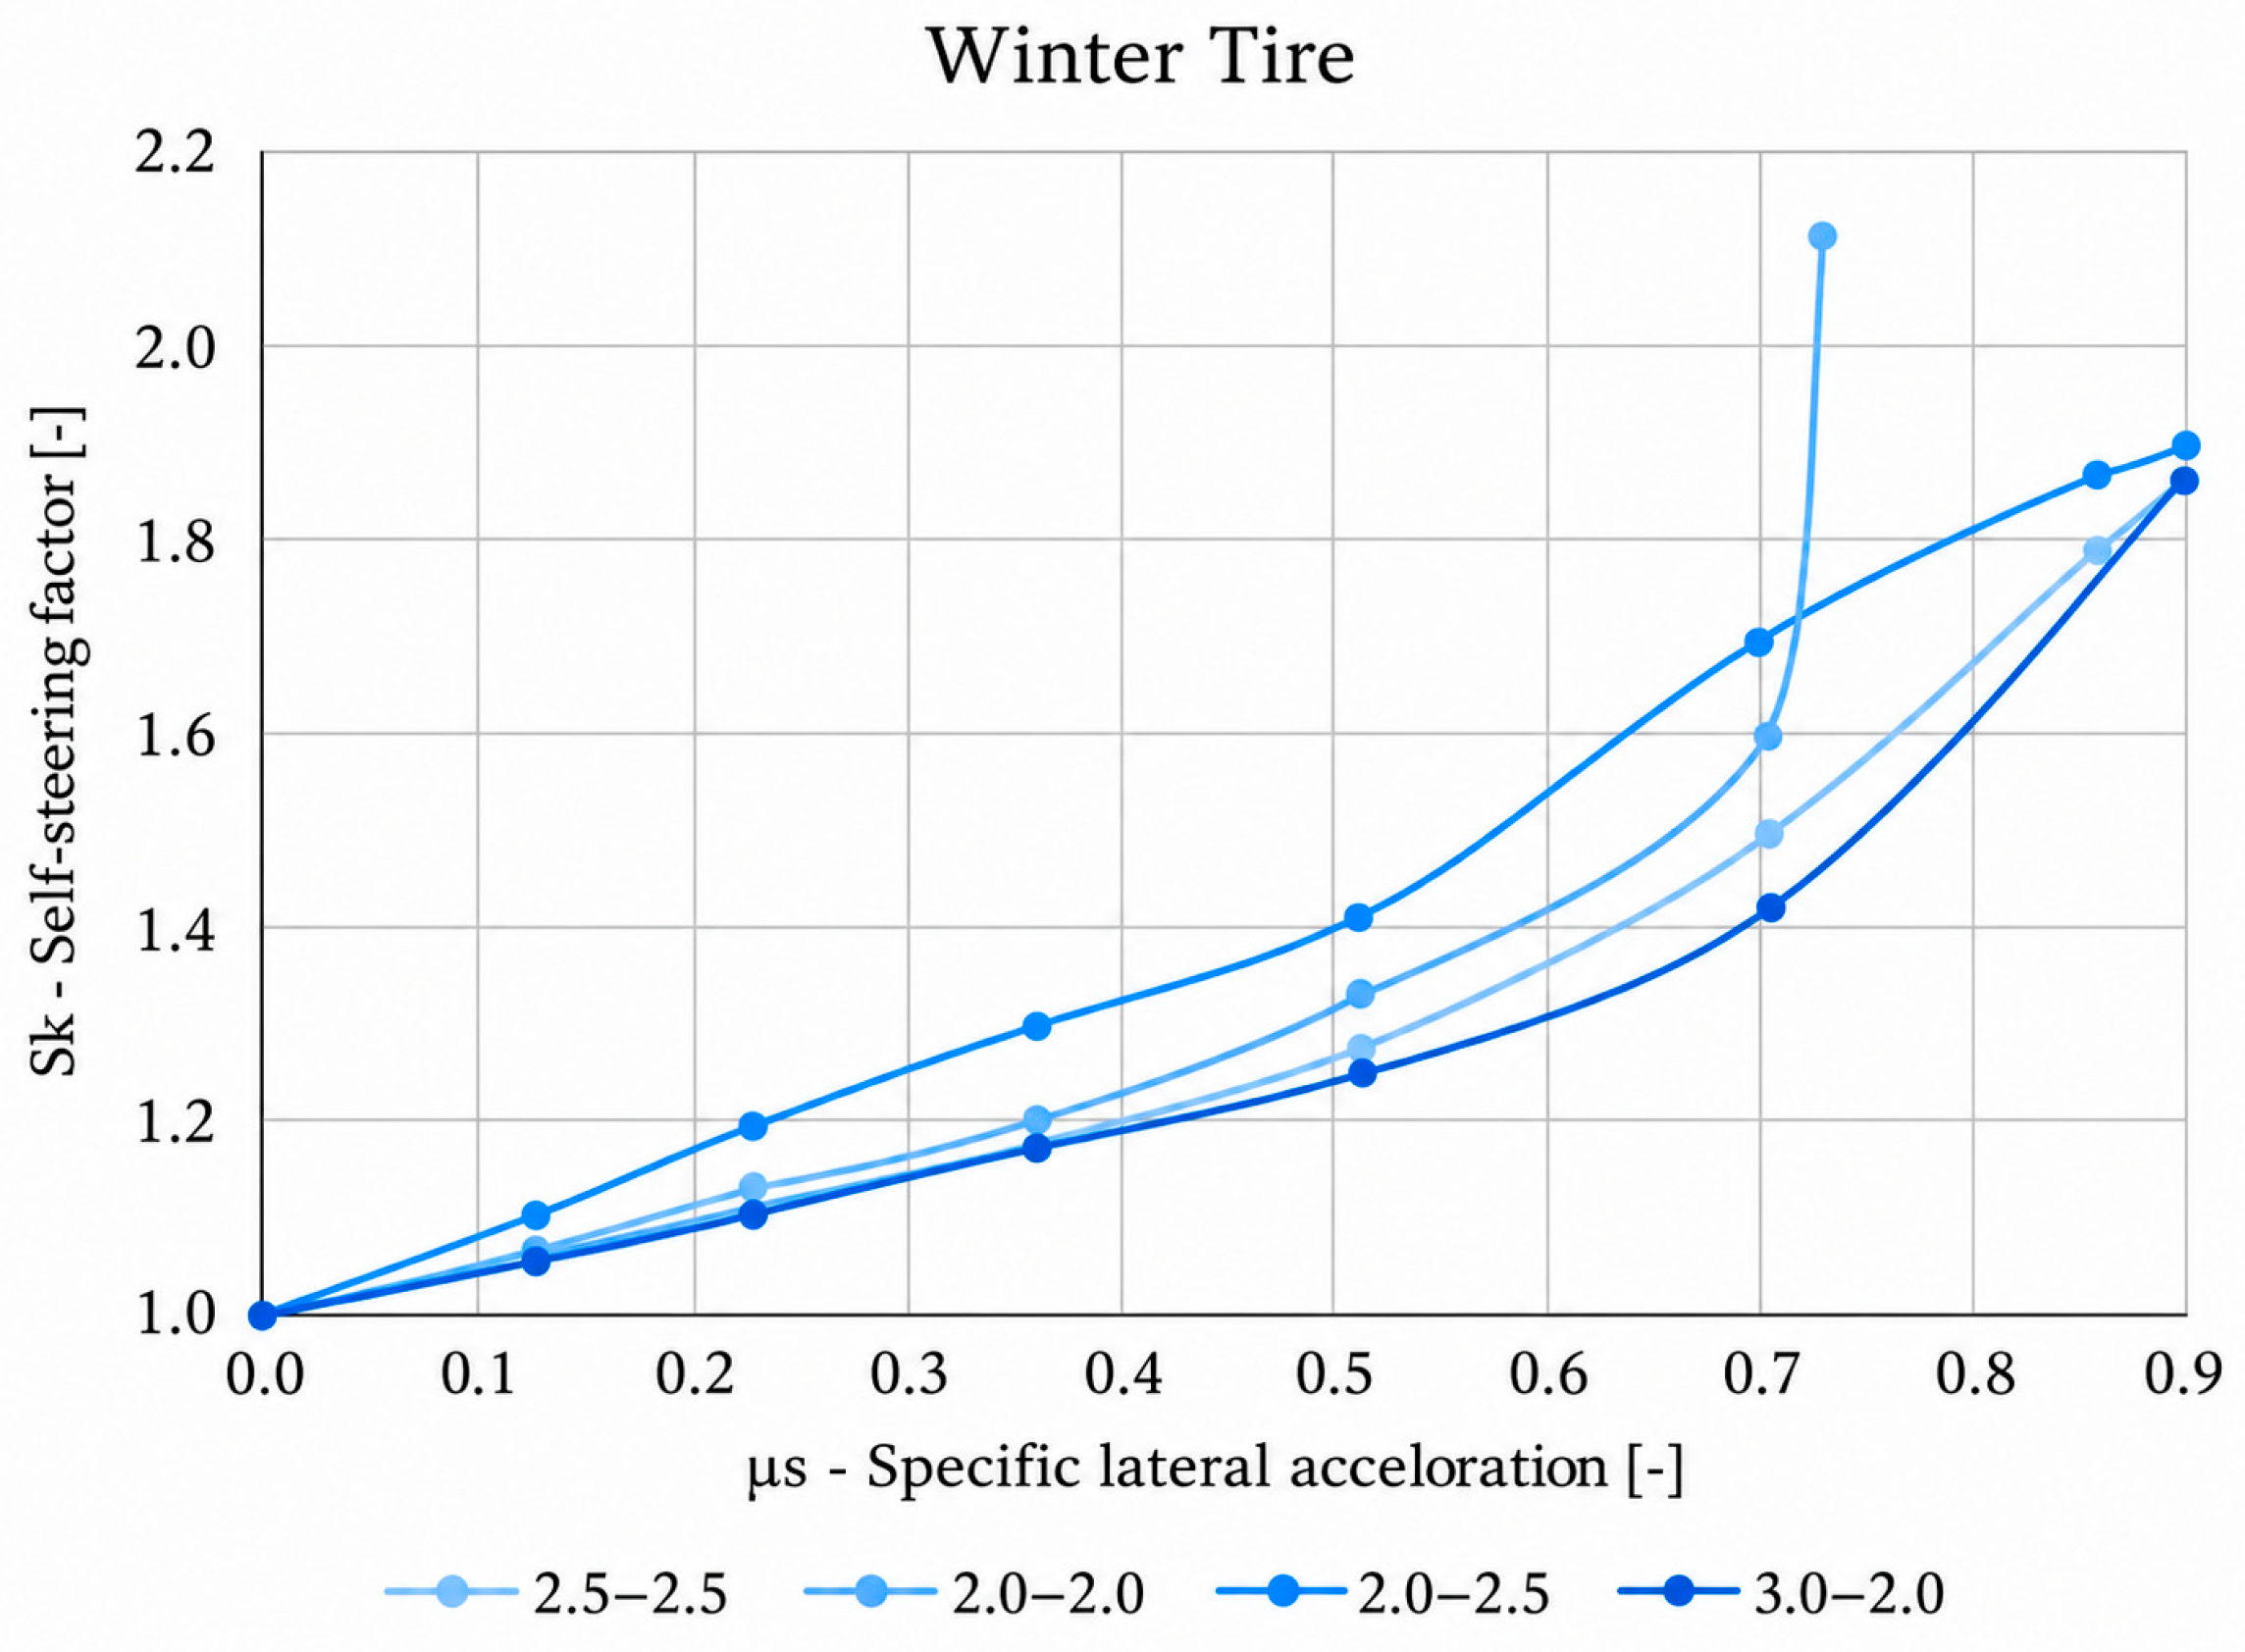
Experimental measurements with winter tires were performed under ambient temperatures between 21 °C and 25 °C, which are above the optimal operating range for this type. As a result, increased slip was observed across all pressure configurations (Figure 8). Presents the measured self-steering characteristics for selected pressure setups. Lower front axle pressure led to increased steering demand already at low lateral accelerations, indicating reduced cornering stiffness and earlier onset of understeer. Configurations with increased rear axle pressure (e.g., 2.0–2.5 bar) showed altered maneuverability, which can be attributed to the reduced rear contact area.
Figure 8.
Measured winter tire self-steering characteristics on the 100 m diameter circular track.
Using the symmetric 2.5–2.5 bar configuration as a baseline, clear quantitative differences can be observed among the highlighted pressure settings. Reducing the tire pressure to 2.0–2.0 bar resulted in a decrease in the maximum cornering speed from 74.88 km/h to 68.60 km/h, corresponding to a reduction of approximately 8.4%, while the steering angle variation increased by about 18.1% relative to the baseline.
In contrast, the asymmetric 3.0–2.0 bar configuration increased the maximum cornering speed to 76.63 km/h (approximately +2.3% compared to the baseline), accompanied by a moderate increase in steering angle variation of about 5.2%. The 2.0–2.5 bar configuration exhibited only minor deviations from the baseline, with a maximum cornering speed reduction of approximately 0.7% and a steering angle variation increase of about 4.3% (Table 2).
Table 2.
Measured steering angles and maximum cornering speed for winter tires under different tire pressure configurations on a 100 m diameter track.
3.3. Summer Tire Measurement Results on a 100 m Diameter
This subsection presents the measurement results obtained with summer tires on a circular track with a diameter of 100 m. The aim is to evaluate how different symmetric and asymmetric tire pressure configurations influence self-steering behavior and lateral performance near the handling limit.
Measurements with summer tires were conducted under more favorable ambient conditions (15–22 °C), resulting in improved grip and more distinct differences between pressure configurations. To avoid external influences, driver assistance systems were disabled during these tests.
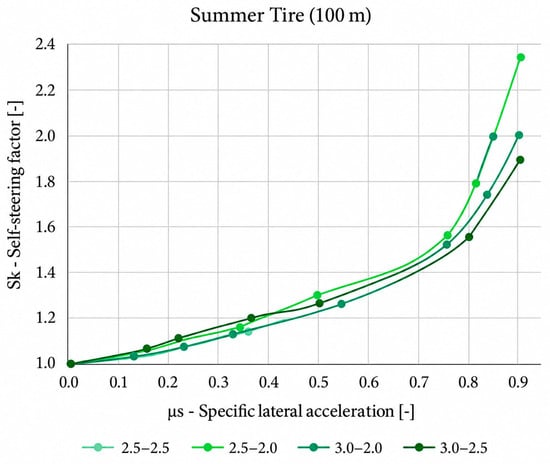
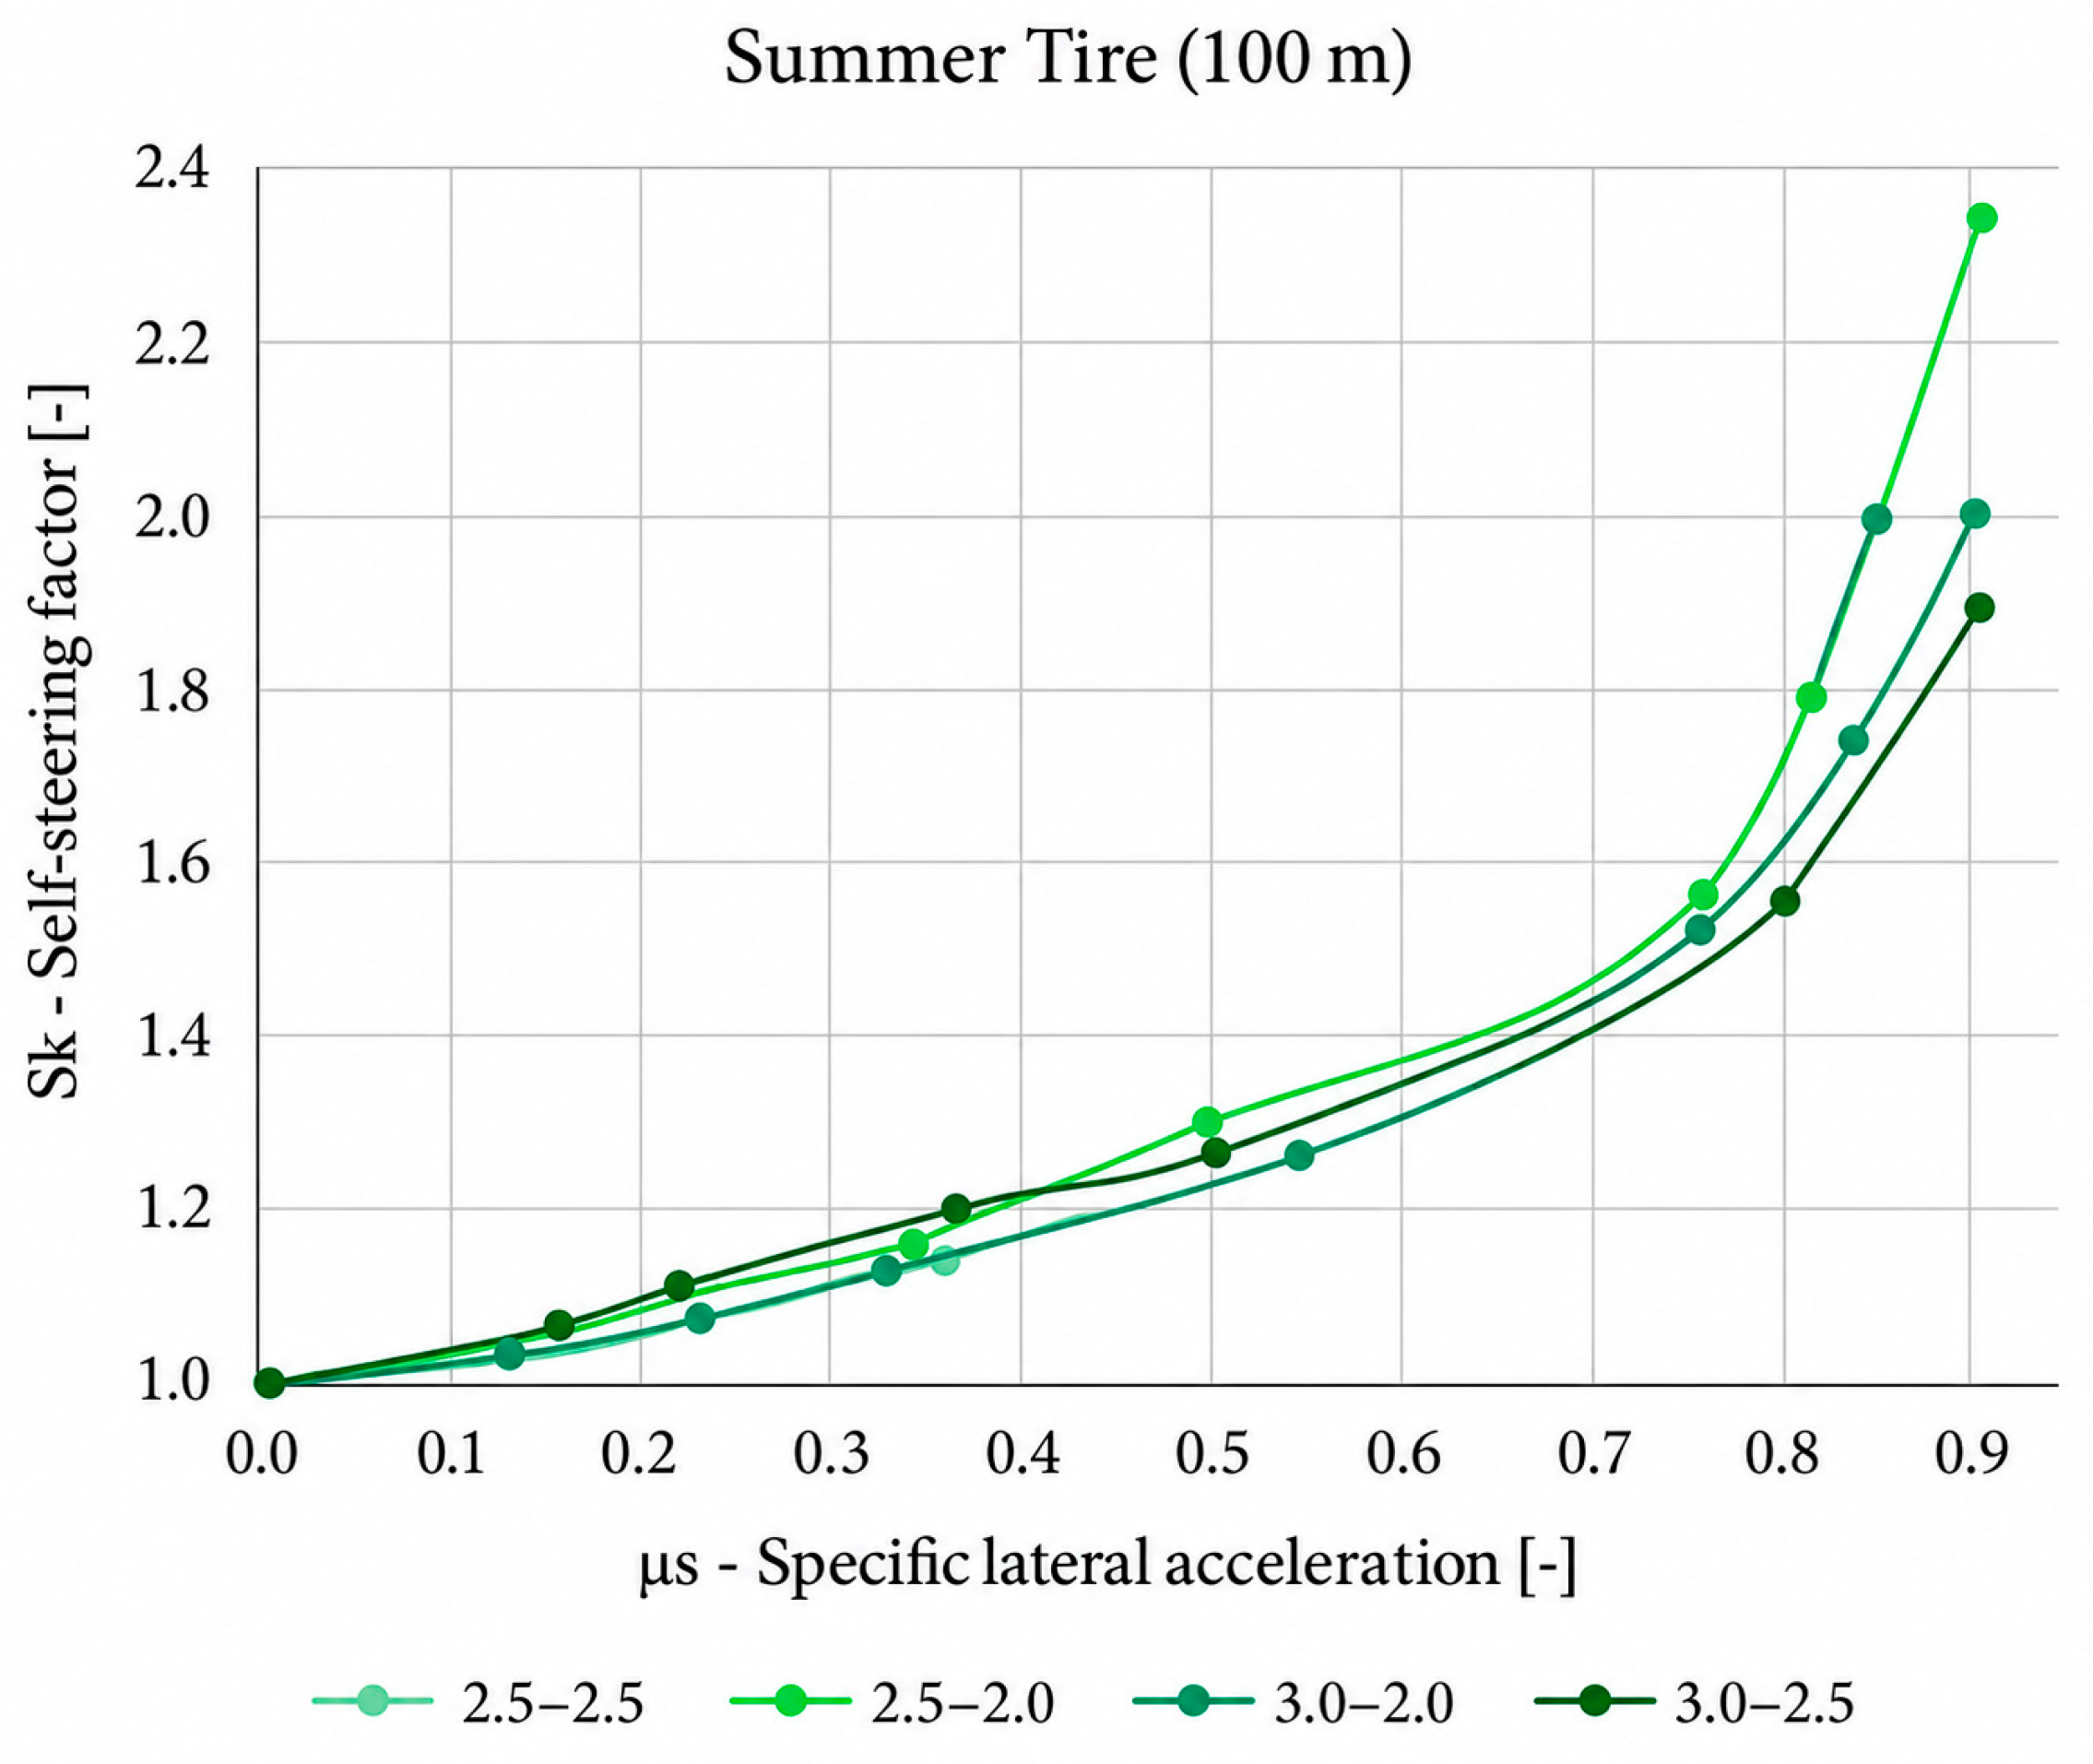
As shown in Figure 9, reduced front axle pressure again required higher steering angles, while lateral acceleration remained within an average range. Among the tested configurations, setups with elevated rear axle pressure combined with moderate front pressure demonstrated the highest lateral acceleration near the slip limit, highlighting the importance of rear axle pressure distribution.
Figure 9.
Measured summer tire self-steering characteristics on the 100 m diameter circular track.
Using the symmetric 2.5–2.5 bar configuration as a baseline, notable quantitative differences can be identified among the highlighted summer tire pressure settings. Increasing the pressure symmetrically to 3.0–3.0 bar raised the maximum cornering speed from 72.13 km/h to 75.87 km/h, corresponding to an increase of approximately 5.2%, while the steering angle variation increased by about 25.2% relative to the baseline.
Reducing the pressure symmetrically to 2.0–2.0 bar resulted in a moderate increase in maximum cornering speed to 74.50 km/h (+3.3%), accompanied by a steering angle variation increase of approximately 22.7%. The asymmetric 3.0–2.5 bar and 2.5–2.0 bar configurations yielded the highest cornering speeds of 76.00 km/h (approximately +5.4% compared to the baseline), while also exhibiting substantially higher steering angle variations of about 18.5% and 46.1%, respectively (Table 3).
Table 3.
Measured steering angles and maximum cornering speed for summer tires on a 100 m diameter track under different tire pressure configurations.
3.4. Summer Tire Measurement Results on a 40 m Diameter
This subsection investigates vehicle behavior on a tighter circular trajectory with a diameter of 40 m. Due to the increased curvature, this configuration emphasizes higher lateral load transfer and allows the assessment of tire pressure effects under more demanding steady-state cornering conditions.
To better represent conditions typical of urban driving, additional measurements were carried out on a smaller-radius circular track. Due to time constraints, a reduced set of pressure configurations was evaluated.
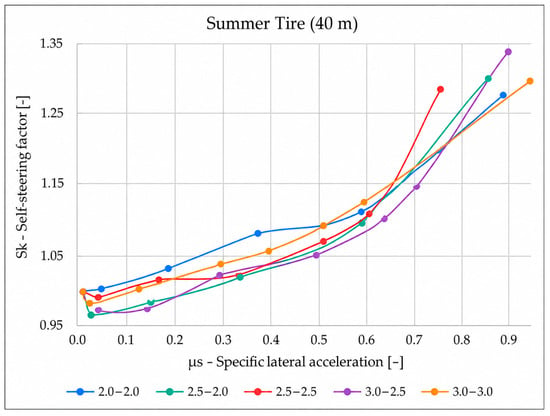
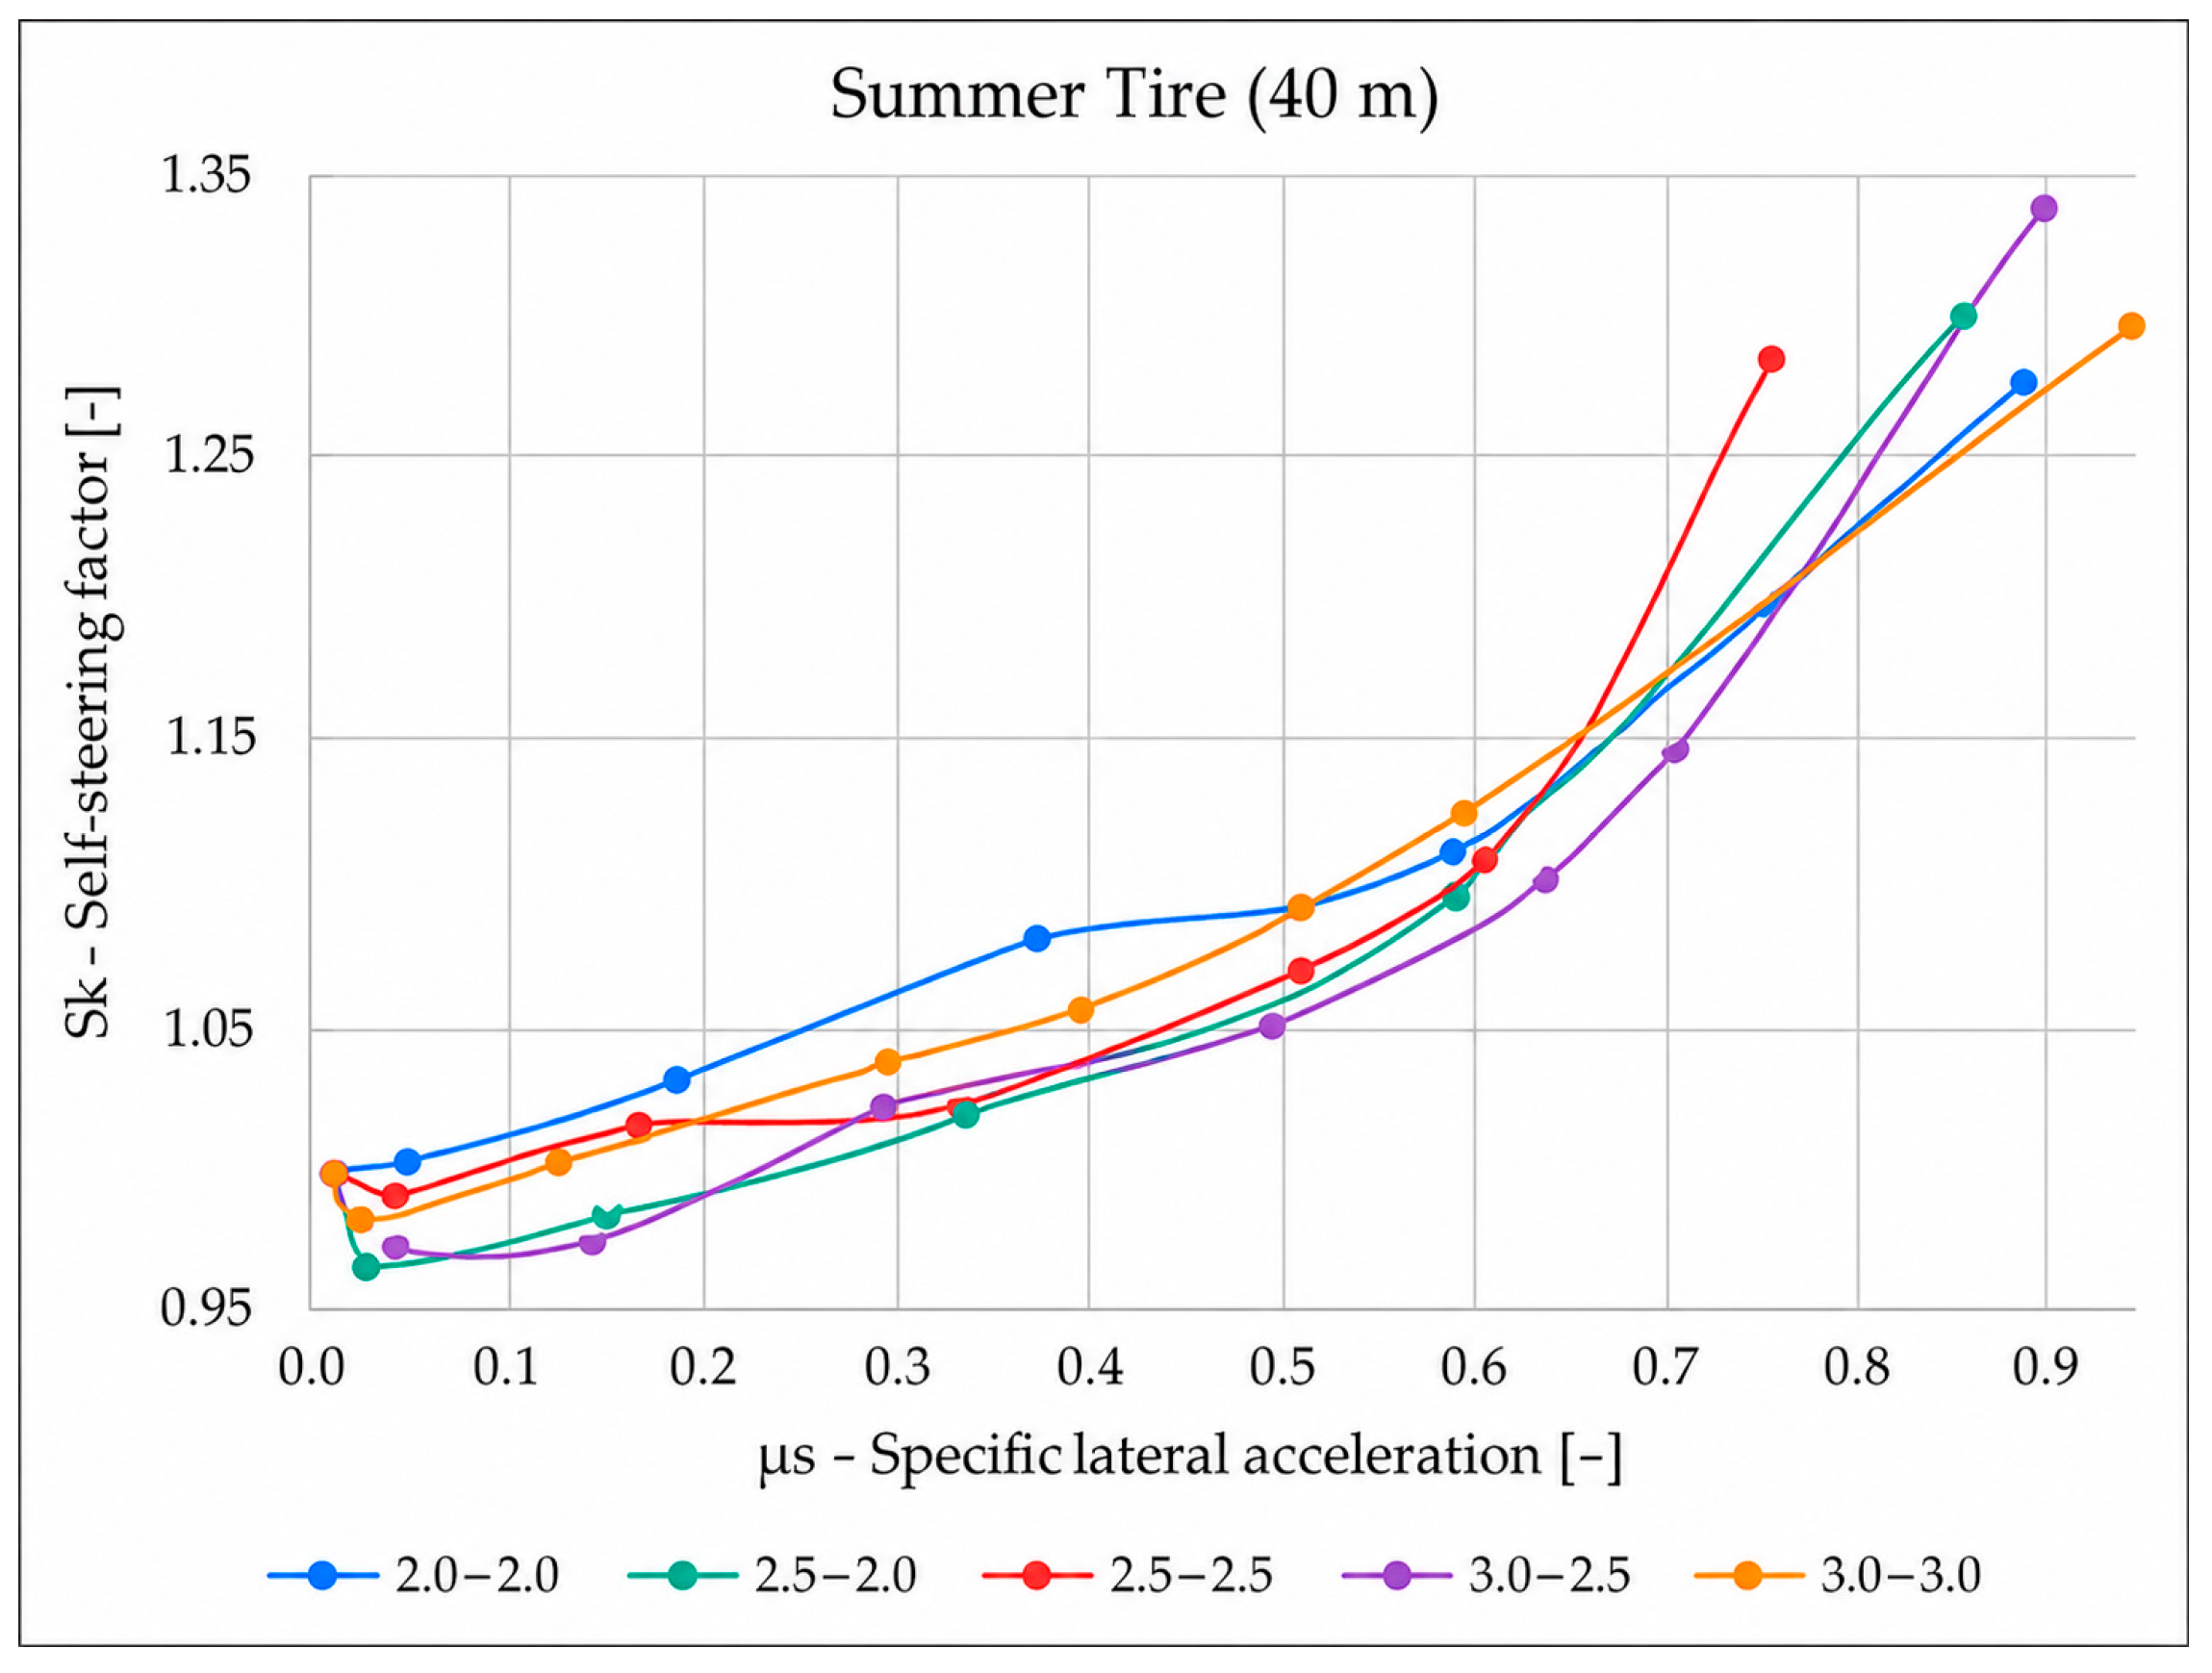
Figure 10 summarizes the results for the 40 m diameter tests. Equal pressure configurations (e.g., 2.0–2.0 bar and 3.0–3.0 bar) displayed similar self-steering trends, although higher absolute pressure enabled increased cornering speed and lateral acceleration before reaching the slip limit. Consistent with the results obtained on the larger radius, the manufacturer-recommended pressure setting again resulted in comparatively unfavorable handling characteristics.
Figure 10.
Measured summer tire self-steering characteristics on the 40 m diameter circular track.
Using the symmetric 2.5–2.5 bar configuration as a baseline, distinct quantitative differences can be observed under the higher curvature conditions of the 40 m diameter track. Reducing the tire pressure to 2.0–2.0 bar increased the maximum cornering speed from 43.85 km/h to 47.38 km/h, corresponding to an increase of approximately 8.1%, while the steering angle variation decreased slightly by about 1.4% relative to the baseline.
The asymmetric 3.0–2.5 bar configuration resulted in a comparable increase in maximum cornering speed to 47.75 km/h (+8.9%), accompanied by a notable increase in steering angle variation of approximately 6.4%. The symmetric 3.0–3.0 bar configuration yielded the highest maximum cornering speed of 49.00 km/h, representing an increase of approximately 11.7% compared to the baseline, while the steering angle variation increased by about 1.9% (Table 4).
Table 4.
Measured steering angles and maximum cornering speed for summer tires on a 40 m diameter track under different tire pressure configurations.
4. Discussion
The experimental results indicate that deviations from the manufacturer-recommended baseline tire pressure are associated with measurable changes in vehicle self-steering behavior under the investigated test conditions. In general, reduced tire pressures tended to increase steering angle demand and, in several configurations, reduced the maximum achievable cornering speed. In contrast, increased tire pressures often reduced the steering input required at comparable lateral acceleration levels, although less progressive behavior could occur as the grip limit was approached. In addition, asymmetric tire pressure configurations modified the balance between understeer and oversteer tendencies, indicating that not only the absolute pressure level, but also its distribution between the front and rear axles, plays an important role in determining steady-state handling characteristics.
From a physical point of view, the observed tendencies can primarily be explained by pressure-induced changes in tire cornering stiffness. Higher inflation pressures generally increase tire stiffness, resulting in smaller slip angles for a given lateral force and, consequently, lower steering input requirements. In contrast, lower inflation pressures reduce cornering stiffness, which leads to larger slip angles and increased steering demand at comparable lateral acceleration levels. Variations in front–rear pressure distribution directly alter the relative cornering stiffness of the two axles, thereby affecting the self-steering factor and the vehicle’s tendency toward understeer or oversteer. These findings support the interpretation that tire pressure affects steering behavior indirectly through modifications in tire force generation mechanisms rather than acting as an independent control parameter.
The evaluation of self-steering behavior in this study is based on a qualitative framework using the self-steering factor. Values above unity indicate understeering behavior, whereas values below unity correspond to oversteering tendencies. This approach enables a consistent comparison between test cases without relying on strict numerical thresholds, which would be highly sensitive to vehicle configuration, tire properties, and test conditions. As a result, the analysis focuses on relative changes and trends across different pressure settings rather than on absolute classification boundaries.
The inclusion of IPG CarMaker simulations complements the experimental investigation by providing a controlled reference environment. The simulations help illustrate geometric effects associated with track curvature and support the qualitative interpretation of tire-pressure-related handling tendencies. However, the simulation model was based on a generic, non-calibrated tire representation; therefore, it should not be interpreted as a quantitatively validated reproduction of the tested tires or the complete test vehicle. The comparison between simulation and measurement is consequently limited to trend-level interpretation, while the experimental results remain the primary basis for evaluating the influence of tire pressure distribution on self-steering behavior.
The interpretation of the results is subject to several limitations. First, the present analysis does not include a full statistical repeatability or uncertainty assessment. Therefore, the observed differences between tire pressure configurations should be interpreted as experimental trends rather than statistically verified effects. Second, the absolute values of steering angle demand, maximum cornering speed, and self-steering factor are vehicle-dependent. Vehicle mass distribution, suspension layout, steering system characteristics, and geometric parameters may influence the quantitative results and limit the direct transferability of the absolute values to other vehicle platforms. Third, tire temperature was not measured during the experiments; therefore, thermal effects could not be quantified directly. This aspect should be addressed in future studies.
Despite these limitations, the results consistently indicate that tire pressure distribution influences steady-state cornering behavior and self-steering characteristics under the investigated test conditions. The main contribution of the study is therefore the experimental demonstration of pressure-dependent handling tendencies on standardized circular tracks using different tire types and tire pressure configurations.
Future work should extend the present trend-based evaluation by estimating tire cornering stiffness parameters and developing calibrated predictive relationships between tire pressure, lateral force generation, and self-steering behavior.
5. Conclusions
This study investigated the effect of tire pressure distribution on steady-state cornering behavior and self-steering characteristics near the limit of handling, using a combination of experimental and numerical approaches. Measurements were performed on a standardized, constant-radius circular track with winter and summer tires, while IPG CarMaker simulations supported the interpretation of the observed trends under controlled conditions. The results indicate that tire pressure distribution can affect steering demand, available lateral acceleration, maximum cornering speed, and overall handling balance under the investigated steady-state cornering conditions.
Deviations from the manufacturer’s recommended base pressure were associated with observable changes in vehicle behavior. In general, reduced tire pressure increased the steering angle requirement and limited the ability to turn, while increased pressure reduced the steering requirement but could also modify stability as the grip limit was approached. Front-rear pressure differences further influenced the understeer-oversteer balance, indicating that not only the absolute pressure level but also its distribution between the axles plays an important role in vehicle handling.
The observed behavior can be primarily explained by pressure-dependent changes in the cornering stiffness of the tires. Changes in tire pressure alter the tire force-slip relationship, which affects slip angles, steering requirements, and the vehicle’s tendency to understeer or oversteer. The applied qualitative classification of self-steering characteristics proved to be suitable for comparing different pressure configurations and tire types. From a practical perspective, the results show that non-nominal tire pressures can significantly affect vehicle controllability near the grip limit and can support future studies on vehicle dynamic tuning and steering assist functions. However, the current work is limited to steady cornering and does not address transient maneuvers or temperature-dependent tire effects, which should be considered in future research.
Author Contributions
Conceptualization, M.J.; methodology, M.J.; formal analysis, M.J. and L.I.N.; investigation, M.J. and L.I.N.; resources, L.I.N.; writing—original draft preparation, L.I.N.; writing—review and editing, M.J., I.L. and L.I.N.; visualization, L.I.N.; supervision, I.L. All authors have read and agreed to the published version of the manuscript.
Funding
This research received no external funding.
Institutional Review Board Statement
Not applicable.
Data Availability Statement
The original contributions presented in this study are included in the article material. Further inquiries can be directed to the corresponding author.
Conflicts of Interest
The authors declare no conflicts of interest.
Abbreviations
The following abbreviations are used in this manuscript:
| ADAS | Advanced Driver Assistance System |
| ESP | Electronic Stability Program |
| μs | Specific lateral acceleration |
| Sk | Self-steering factor |
| β | Steering angle [°] |
| p | Tire inflation pressure [bar] |
| v | Vehicle speed [km/h] |
| R | Radius of circular path [m] |
References
- Zhang, Q.; Wang, J.; Sun, N.; Peng, X.; Pi, D.; Yin, G. Tire pressure monitoring methods for vehicles: Review and research perspectives. Measurement 2025, 256, 118379. [Google Scholar] [CrossRef] [Scilit]
- Guo, K.; Chen, P.; Xu, N.; Yang, C.; Li, F. Tire Side Force Characteristics with the Coupling Effect of Vertical Load and Inflation Pressure. SAE Int. J. Veh. Dyn. Stab. NVH 2018, 3, 19–30. [Google Scholar] [CrossRef] [Scilit]
- Fathi, H.; El-Sayegh, Z.; Ren, J.; El-Gindy, M. Analysis of Tire-Road Interaction: A Literature Review. Machines 2024, 12, 812. [Google Scholar] [CrossRef] [Scilit]
- Wu, J.; Wang, Z.; Zhao, Z. Influence of Tire Inflation Pressure on Vehicle Dynamics and Compensation Control on FWID Electric Vehicles. J. Dyn. Syst. Meas. Control 2020, 142, 071001. [Google Scholar] [CrossRef] [Scilit]
- Qin, Z.; Wang, J.; Liu, P.; Han, Y.; Guo, J.; Hong, H.; Chang, Y.; Shen, S. Real time tire stiffness estimation using enhanced GDM and RLS for autonomous vehicles. Sci. Rep. 2025, 15, 31863. [Google Scholar] [CrossRef] [Scilit] [PubMed]
- Feng, J.; Gao, Z.; Guo, B. An Adaptive Vehicle Stability Enhancement Controller Based on Tire Cornering Stiffness Adaptations. World Electr. Veh. J. 2025, 16, 377. [Google Scholar] [CrossRef] [Scilit]
- Xu, N.; Zhou, J.; Tang, Z.; Zhang, Z. Estimation of Tire-road Friction Limit with Low Lateral Excitation Requirement Using Intelligent Tire. SAE Int. J. Adv. Curr. Pract. Mobil. 2023, 5, 2457–2463. [Google Scholar] [CrossRef] [Scilit]
- Gu, T.; Li, B.; Quan, Z.; Bei, S.; Sun, X. A novel estimation method for tire-road friction coefficient using intelligent tire and tire dynamics. Mech. Syst. Signal Process. 2025, 235, 112872. [Google Scholar] [CrossRef] [Scilit]
- Wu, T.; Zhang, X.; Wang, D.; Zhang, W.; Pan, D.; Tao, L. Design and Implementation of Novel Testing System for Intelligent Tire Development: From Bench to Road. Sensors 2025, 25, 2430. [Google Scholar] [CrossRef] [Scilit] [PubMed]
- Xu, N.; Zhou, J.; Li, X.; Li, F. Analysis of the Effect of Inflation Pressure on Vehicle Handling and Stability under Combined Slip Conditions Based on the UniTire Model. SAE Int. J. Veh. Dyn. Stab. NVH 2021, 5, 259–277. [Google Scholar] [CrossRef] [Scilit]
- Furlan, M.; Mavros, G. On the relationship between tyre cornering stiffness and road surface roughness. Veh. Syst. Dyn. 2026, 64, 1023–1055. [Google Scholar] [CrossRef] [Scilit]
- Soica, A.; Gheorghe, C. Tire–Road Interaction: A Comprehensive Review of Friction Mechanisms, Influencing Factors, and Future Challenges. Machines 2025, 13, 1005. [Google Scholar] [CrossRef] [Scilit]
- Wang, G.; Li, X.; Jing, Z.; Wang, X.; Zhang, Y. Improvement in and Validation of the Physical Model of an Intelligent Tire Considering the Wear. Sensors 2025, 25, 2490. [Google Scholar] [CrossRef] [Scilit] [PubMed]
- Sharaf, A.M.; Mohamed, A.A. Influences of Controlling Tire Inflation Pressure on Handling Characteristics of Off-Road Vehicles. In Proceedings of the WCX SAE World Congress Experience, Detroit & Online, MI, USA, 5 April 2022. [Google Scholar] [CrossRef] [Scilit]
- Ye, J.; Zhang, Z.; Jin, J.; Su, R.; Huang, B. Estimation of tire-road friction coefficient with adaptive tire stiffness based on RC-SCKF. Nonlinear Dyn. 2024, 112, 945–960. [Google Scholar] [CrossRef] [Scilit]
- Steady-State Directional Control Test Procedures for Passenger Cars and Light Trucks; SAE International, 400 Commonwealth Drive: Warrendale, PA, USA, 2025. [CrossRef] [Scilit]
- Rajamani, R. Lateral and Longitudinal Tire Forces; SAE International: Warrendale, PA, USA, 2012; pp. 355–396. [Google Scholar] [CrossRef] [Scilit]
- Tandy, D.F.; Colborn, J.; Bae, J.C.; Coleman, C.; Pascarella, R. The True Definition and Measurement of Oversteer and Understeer. SAE Int. J. Commer. Veh. 2015, 8, 160–181. [Google Scholar] [CrossRef] [Scilit]
- Yang, C.; Xu, N.; Guo, K. Incorporating Inflation Pressure into UniTire Model for Pure Cornering; SAE International: Warrendale, PA, USA, 2016. [Google Scholar] [CrossRef] [Scilit]

Disclaimer/Publisher’s Note: The statements, opinions and data contained in all publications are solely those of the individual author(s) and contributor(s) and not of MDPI and/or the editor(s). MDPI and/or the editor(s) disclaim responsibility for any injury to people or property resulting from any ideas, methods, instructions or products referred to in the content. |
© 2026 by the authors. Licensee MDPI, Basel, Switzerland. This article is an open access article distributed under the terms and conditions of the Creative Commons Attribution (CC BY) license.