


Abstract
Advanced driver assistance systems, such as variations of Cruise Control (XCC) and Lane Keep Assist (LKA), are increasingly present in vehicles, raising questions about their effects on road safety and driver behavior. By partially taking over vehicle control, these functions may affect driver gaze behavior and the distance to traffic objects. Therefore, both effects need to be evaluated jointly for a controllability-related assessment. This work investigates driver behavior and vehicle guidance performance in cross-cultural naturalistic driving studies in China, Europe, and the USA. We analyze on- and off-road gaze patterns, surrounding traffic-object observation, and their relation to traffic-scene perception during manual and partially automated driving. Automatic video processing and vehicle surrounding models derive controllability-related indicators from visual perception gaps, traffic conditions, and predicted vehicle movements. XCC and LKA show small effects on off-road gaze behavior, while on-road gaze durations show stronger regional differences. XCC improves controllability-related indicators by increasing time headway and collision-related time reserves rather than by changing gaze behavior. As an example of scenario-specific effects, lane-change analyses show that XCC(+LKA) increase attention toward adjacent-lane traffic without adversely affecting controllability-related indicators in car-following situations. The combined evaluation supports the assessment of automated driving functions under real-world traffic conditions.
1. Introduction
In recent years, Advanced Driver Assistance Systems (ADAS) have made significant progress, particularly in the development of Automated Driving (AD) functions, SAE Level 1 and Level 2, and towards Level 3 functions [1]. These enhancements were achieved by accurate and reliable traffic object detection and scene interpretation. AD functions partially take control and improve stabilization and lane guidance, supporting the driver in various situations and scenarios. With more sophisticated functions, their isolated performance regarding safety becomes quantifiable in various scenarios. To give an example, previous work has shown that Cruise Control positively affects road safety. An evaluation of data collected in USA, China and Europe, and comparing studies between 2002 and 2019 (Europe), shows an increasing time gap to traffic objects ahead [2,3,4]. However, these findings describe the isolated effects of AD functions and do not yet consider their interaction with the driver.
Although AD functions influence vehicle guidance, the driver remains responsible for supervising the driving task and intervening when required. Therefore, the overall safety-related effect of an AD function depends on both the automation and the driver’s behavior. Studies have shown that drivers are the source of most accidents [2], whether they are distracted, fatigued, or fail to observe and respond appropriately to critical traffic situations [5,6,7].
Previous studies have reported that driver-related factors directly or indirectly contribute to more than 90% of all accidents. Driver distraction, driver fatigue, and missing surrounding perception have been identified as major contributing factors. Separate studies reported distraction in 80% of the investigated cases and fatigue in 22% of the investigated cases [8,9,10]. Therefore, the effects of AD functions need to be considered together with driver behavior in the corresponding traffic situation.
The primary task of a driver during vehicle guidance is to maintain safe vehicle control across varying traffic situations. How a driver perceives, evaluates, and responds to these situations depends on individual skills and knowledge. Without AD functions, the driver continuously performs the vehicle-guidance task and receives direct feedback from the vehicle’s response. In partially automated driving, parts of the vehicle-guidance task are performed by the AD function, reducing the driver’s active involvement in the control loop. To remain capable of intervening when required, the driver must maintain an adequate understanding of the current traffic situation. State-of-the-art AD functions like XCC do not consider the driver’s abilities in terms of skills and knowledge [11] in their type of operation (e.g., by driving monitoring [12]); their effectiveness varies with technological maturity and environmental conditions [13]. The driver must consider the type of automation control to intervene correctly, while driving with AD functions Levels 1 and Level 2. In addition, delegating parts of the vehicle-guidance task may reduce the driver’s anticipatory involvement in the driving task [14].
To examine this remaining driver contribution, it is necessary to investigate both the traffic situation and the driver’s situational awareness (SA) [15]. To be aware of the situation, a driver needs to (1) perceive the environment, (2) comprehend their relationship to the situation, and (3) project their future situational role [15]. Consequently, reduced road perception is a quantifiable indicator for reduced SA [15], reduced situation control [15], and reduced driver performance. To investigate this relationship, driver observation and the surrounding traffic situation need to be measured under real-world driving conditions. The detection of driver gaze direction, e.g., needed for measures defined in ISO 15007 [16] with the Percentage of eyes off the road, is not feasible in regular vehicles. Therefore, Naturalistic Driving Studies (NDS) and Field Operational Test (FOT) are state-of-the-art methods to investigate driver behavior and behavior adaptation in real-world traffic [17,18]. NDS/FOT uses vehicles with additional sensors for driver monitoring.
NDS data from Gothenburg show that using XCC and LKA slightly increases the duration of off-road glances, as segmented gaze direction, resulting in longer on-road glances [19]. However, when the driver’s gaze is not on the road, collision risk may increase and driving performance may deteriorate. Longer gaze off-road durations are associated with reduced SA (SA model of Endsley et al. [20]) and visual distraction [9,21]. Therefore, considering the scenario is essential to assess real-world gaze behavior and SA, not only in simulation [22]. Related work shows that the driver’s intention when overruling the gas while using XCC most often is to perform a maneuver, e.g., a lane change, and less often a more aggressive driving style [23]. Similarly, off-road glances to the rear during a lane change are an expected gaze pattern. While driving without headway traffic, there is no increased front collision risk by missing road perception.
The impact of reduced attention on situation awareness [24,25,26] is statistically quantifiable in descriptive research [27,28,29], considered in simulation studies [8,18] and used in risk-scoring approaches [30]. However, missing road observation needs to be considered together with the collision-related time reserves of the situation. This is particularly relevant for Level 1 and Level 2 automated driving functions, as these functions may affect both driver observation behavior and the distance to surrounding traffic objects. Therefore, a combined evaluation of driver observation and collision-related time reserves is needed to investigate the effects of these functions on controllability-related indicators.
This raises the question of how driver observation and collision-related time reserves jointly influence controllability-related indicators during SAE Level 1 and Level 2 automated driving in real-world traffic.
This work aims to quantify the effects of Level 1 and Level 2 automated driving functions on driver behavior and safety-related driving-performance indicators by relating driver observation to collision-related time reserves [5,31], across four consecutive contributions. First, this work provides a large-scale analysis of driver observation behavior based on gaze on the road, gaze off the road, and gaze off the leading traffic object in naturalistic driving data. Second, based on these empirical observations, cross-cultural baseline models of driver observation behavior are developed for China, Europe, and the USA. Third, building upon the CTTC metric previously introduced in [32], the present study develops an integrated analytical framework that combines driver-observation and traffic-criticality metrics across regions, driving modes, and real-world driving scenarios.
Fourth, the proposed framework is applied to evaluate the effects of Level 1 and Level 2 automated driving functions on driver behavior, situation-awareness-related indicators, and controllability-related indicators across continuous driving and selected driving scenarios. The proposed framework can support the development, regulatory approval, and monitoring of these functions by providing information on controllability-related indicators under real-world traffic conditions.
2. Materials and Methods
To address the previously identified research gap, this work develops and applies an approach for assessing driver behavior and driving performance during continuous use of SAE Level 1 and Level 2 AD functions. Using real-world traffic data from NDS, we utilized a retrospective analysis framework to examine the impact of AD on driving performance and road safety. Our analysis focused on various driving performance aspects, such as distance to surrounding traffic objects, driver glances, and joint measures. We use in-vehicle signal data and driver monitoring from dashboard-mounted cameras to achieve this. Through a comprehensive evaluation of pre-classified scenarios and situations, we assessed the impact of AD functions on driving performance during assisted and partially automated driving as compared to unassisted manual driving. We accomplished this by comparing driving performance metrics across various driving modes and familiar scenes, which were aggregated in time windows. The camera setup and the derived driver-monitoring features are illustrated in Figure 1.
Figure 1.
Illustration of the camera setup. (a) Cameras are installed at the A-pillar (A, green) and behind the right shoulder (B, red) to record the driver and the front (C, blue) and rear traffic (D, blue); (b) driver head pose and eye landmarks are derived from the A-pillar-mounted driver-monitoring camera.
2.1. Driving Performance with Automated Driving Functions
Driver performance is crucial to determine the type of interaction with ADAS. Safety functions play an important role in informing or warning the driver or directly intervening by temporarily taking control (inform or act) [8,25] within a single scenario. AD functions used as comfort functions operate across several scenarios and are designed to support driving tasks continually [33]. The driver and safety functions can overrule the AD function at any time (accelerator, brake, steering). AD functions have a non-scenario-related type of operation and no predefined scenario courses or patterns for their assessment. A time-continuous analysis by situation distributions over the entire activation period is feasible in continuous usage scenarios chunks [34,35].
Baseline chunks are defined by comparable scenarios that share the same automated driving (AD) function usage and consistent scenery attributes. Each scenario represents a 4 s interval and considers the states and events during the preceding 8 s and following 4 s. This window is based on the distribution of lane-change durations [36]. To avoid fragmentation of long-term states, short interruptions in the recorded AD-function usage of up to 4 scenarios, corresponding to up to 16 s, are interpolated when calculating the usage-block duration, provided the driver does not actively disable the function, as illustrated in Figure 2. Usage blocks provide the basis for quantifying frequency and duration and for examining potential temporal dependencies during function activation. Continuous lane-following chunks provide the baseline for the situation-based analyses. Detected maneuvers involving an active driving task, such as lane changes, and traffic interactions are excluded with the two preceding and one following scenario.
Figure 2.
Enumeration of continuous ADAS usage blocks and calculation of usage duration. The continuously labeled blocks represent the scenario chunks used in the analysis. Black represents the raw XCC activation state, blue represents the labeled block state, and the numbered circles identify the individual usage blocks.
We identify three scenario types to investigate (1) continuous AD function usage, (2) maneuvers and events with continuous AD function usage, and (3) maneuvers and events result in interruption of AD function usage. For continued usage (1), it is necessary to verify that the effects of AD functions on scenario/situation-based driver performance are independent. For instance, we need to ensure that the frequency of overruling gas while XCC usage does not increase over time to aggregate situations for a baseline. Maneuver and event scenarios (2, 3) do not consist of independent situations. The driver perception, action, and goal sequences are essential for driver and function performance. These scenarios are analyzed using specific performance indicators that are often only meaningful with fixed scenario patterns. This separation supports regional comparability by defining common traffic conditions for continuous baseline chunks and fixed, event-related traffic conditions for maneuver and event evaluation.
2.2. Situation and Scenario Detection
This framework uses human-understandable features from surrounding traffic objects, such as position and kinematics, and driver image processing to identify the driver’s time-continuous gaze direction from NDS. It quantifies and estimates the driver-related situational knowledge and the corresponding effects of AD functions. To achieve this, we use a joint measure of established collision-related metrics, such as the temporal distance to headway objects and the sequences of driver gaze estimation for criticality indication.
2.2.1. Study and Dataset
We considered for this evaluation a subset from a larger NDS with data recorded between 1 January 2018 and 1 March 2020 in Europe (primarily Germany), China, and the USA [2]. The dataset remains relevant because the SAE Level 1 and Level 2 definitions and basic driver-system interaction remain applicable to vehicles still in use, while ongoing system development requires continuous evaluation. The data provide a long observation period and include Level 1 and Level 2 AD functions with a head-up display. Further, we consider study sections where one participant (primary driver) received a vehicle for approximately three months. We use data from 20 sections in the USA, 25 in China, 35 in Europe. Other drivers using the test vehicle within this section were identified trip-wise and considered separately as secondary drivers.
Test-setup: The vehicles are equipped with data loggers that record all internal vehicle communication (CAN/Ethernet) which is preprocessed to a sampling rate of 10 Hz. Four cameras are installed, two observe ahead and rearward traffic and two observe the driver. Traffic videos are necessary for NDS evaluation [37], and the driver’s information, such as head pose and the driver’s face (see Figure 1) are important to determine driver behavior and gaze behavior regarding SA. While traffic recording is used for manual validation of algorithms, driver videos are used for automatic processing of head pose and glance direction.
Vehicle equipment: All test vehicles have the same equipment of AD functions:
- Dynamic Cruise Control (DCC): Controls vehicle speed independently from surrounding traffic objects.
- Adaptive Cruise Control (ACC): Controls the vehicle’s distance to a leading vehicle ahead and speed.
- Lane Keeping Assist (LKA): supports the driver to stay in the middle of the road lane by controlling the steering wheel.
DCC and ACC represent mutually exclusive operating modes of the longitudinal-control function and are summarized as XCC throughout this work. The current function state and settings, such as preset speeds or distance, are directly recorded in in-vehicle signals. All system states, kinematics, surrounding perception, and ADAS driver information and intervention are within the in-vehicle signal.
Dataset: Approx. 8000 h (speed > 0) are included in the dataset, of which approx. 1300 h have been pre-processed with head, head pose, and eye landmarks (Figure 1).
2.2.2. Surrounding Traffic Objects
Investigating surrounding traffic objects is limited to the vehicle’s internal surrounding model, integrated for ADAS [38]. Figure 3 shows considered objects on the same and the adjacent lane of the ego-vehicle. In longitudinal traffic, the first and second object in and against the driving direction on both adjacent lanes are considered. On the ego lane, the first and second objects in the driving direction and the object directly behind are considered. Further traffic objects ahead in a crossing direction were handled independently (neglected in unidirectional traffic).
Figure 3.
Surrounding traffic objects relative to the ego vehicle’s position. Relevant objects are located in the same or adjacent lanes, and gray arrows indicate their potential movement directions.
The maneuvers of these objects are detected and considered if they are relevant for the ego-vehicle’s guidance. The backward traffic needs to be investigated for maneuvers of the ego-vehicle, especially for interaction and awareness when performing a lane change. Each object is described by its lateral (lat) and longitudinal (long) distance from the ego-vehicle’s closest point. Further, the absolute velocity (vel), the acceleration in the longitudinal direction (acc), and the relative speed to the ego-vehicle (vel-rel) are relevant for considering current and predicted future positions as part of a driving situation [20]. Most important regarding front collision risk is the vehicle directly ahead (E00).
2.2.3. Non-Intrusive Driver Monitoring
To estimate missing situational knowledge (reduced SA), e.g., when a driver looks off the road and the traffic ahead, driver monitoring is necessary [3]. Driver monitoring in NDS must be without additional wearable sensors and trip-specific (re-) calibration [2]. Non-invasive driver observation is key to avoiding unnecessary impairment of the study’s naturalistic character (active task and noticeable sensor), even if this means that the data is less precise than head-mounted eye trackers, which allow e.g., driver-specific gaze profiles [39]. For a large-scale evaluation, driver monitoring needs to be realized as an automatic process either on-board or off-board during post-processing. In both cases, a gaze classifier is a method to detect missing visual perception based frequently on dashboard camera eye-tracking algorithms. This work uses a dashboard camera-based facial landmark approach for driver glance direction classification from Dari et al. and a multilabel glance classifier for target traffic objects ahead presented in previous work [40,41]. Figure 4 illustrates these glance classification algorithms’ spatial classes and cockpit areas.
Figure 4.
Illustration of the glance-direction classes with green zone numbers. The traffic-object observation classifier predicts whether the closest object in each of eight spatial zones ahead and to the side of the ego vehicle is observed or not observed. The spatial zones are indicated by red boundaries and black numbers.
For the cockpit area gaze classes, we define zones 5 (windshield) and 7 (Speedometer, including head-up display) as on-road glances (GOnR) and all other zones as off-road glances (GOffR). We interpret GOnR and GOffR as separate signals and improve the data quality in three data filtering steps for future processing. First, sequences (continuous enumeration) that have no situation-snapshot of at least 80% confidence score for the glance class (bad quality face landmarks or head pose angles) for at least 0.1 s are removed from the dataset. Then the gaze data set is down-sampled in the timeline to 10 Hz (from ~12 Hz framerate). Missing timesteps were considered neither on nor off the road. Second, both signals were filtered with a simple sliding window approach (H: [1, 2, 1] ≥ 3) to interpolate or filter states that are valid for at least 0.1 s. In doing so, we apply the method by Morando et al., who proposed a filter for 0.15 s for the physiological minimum fixation time, adjusted to this sampling rate [19]. Finally, we use the cumulatively summed GOnR and GOffR, with a reset to zero for each glance, not in the class. All sequences with an unrealistic long glance duration greater 5 s GOffR and 12 s GOnR were not considered as valid. In the same way, as to the cockpit area classes, the traffic object zones are also interpreted as separate signals and filtered.
Morando et al. found for the distribution in Gothenburg that GOffR corresponds to a lognormal distribution and GOnR to an inverse Gaussian distribution. For better comparability, this work will be based on this assumption and will verify the goodness of distribution.
2.2.4. Driver-Related Situation Measures
One objective quantification criterion for driving performance in situations is criticality–measured, e.g., based on the time gap to object ahead (THW, TTC) [37]. Whenever the driver is limited in performing maneuvers to keep the vehicle in a safe state, this increases criticality. When (a) the driver’s reaction reserve to prevent an incident is not sufficient for its skills, the maneuver options for this situation are reduced. Further, if (b) the subjective situational knowledge reasoned by driver perception (road, target) and perception concerning objective criticality is not sufficient, the driver’s controllability of the situation is reduced. Controllability is not directly observable as a cognitive state, a subjective driver assessment, or a rule-based classification. Instead, it is defined as a model-based, situation-specific indicator that quantifies the driver’s ability to keep safe control in a given traffic scenario. This indicator combines objective measures of collision-related time margins with estimates of visual perception derived from the driver’s observed gaze behavior. Accordingly, controllability is interpreted as a property of the driver–situation interaction inferred from observable traffic dynamics and driver behavior rather than as a direct measurement of the driver’s internal mental state or situation awareness.
Driver subjective time reserve (no road observation): A traffic object may be present in the driving situation and detectable from an objective perspective, while remaining unperceived by the driver [42]. Thus, missing traffic observation may result in an underestimated objective accident risk. Controllability is represented by a model-based assessment of the maneuvering options assumed to be known to the driver to respond to an unexpected event in a situation. The driver’s gaze behavior, particularly the duration that the road or a traffic object ahead is not observed, is an indicator of the driver’s SA. Therefore, secondary tasks are always a trade-off between how much controllability a driver is willing to release for them, although this is hard to quantify. Cumulative GOffR duration indicates the upper edge of perception that further indicates missing SA.
The impact of cumulative GOffR as an indicator of missing driver knowledge on SA, can only be quantified in the context of objective criticality, e.g., by position and movement of surrounding vehicles and maneuver capabilities. Controllability is operationalized by combining collision-related time reserves with the estimation of visual perception. The Closest Time To Collision (CTTC) metric does not directly measure controllability. Instead, it provides a model-based indicator of the observation-conditioned temporal reserve in longitudinal traffic. CTTC combines the duration for which the driver does not observe the headway road with the relative motion between the ego-vehicle and the traffic object ahead (E00) [31].
A local time coordinate is defined for each continuous gaze-off-road sequence. The reference time t = 0 corresponds to the last valid observation of E00 immediately before the start of the gaze-off-road sequence. The relative longitudinal distance drel,0, the ego-vehicle velocity vego,0, and the velocity of E00 vE00,0 are determined at this reference time. The model assumes that E00 decelerates with the predefined acceleration amin < 0 during the current gaze-off-road duration TGOffR. For the empirical analysis, amin was set to −9 m/s2. The implemented value is a rounded approximation of the general maximum longitudinal deceleration [43] and represents a standardized conservative full-braking event, rather than the transient braking dynamics of an individual vehicle. The same parameter was applied consistently across all driving modes. Equation (1) calculates the resulting conservative remaining relative distance:
Equation (2) defines CTTC as the conservative remaining relative distance divided by the corresponding closing velocity at the end of TGOffR:
If CTTC falls below the driver’s reaction time, avoiding a collision depends on the future motion of E00 or on driver intervention. For interpretation, CTTC is compared with the median TTR of 0.99 s reported in [7] as a simplified, non-participant-specific reference.
CTTC is interpreted as a conservative indicator of observation-conditioned controllability. Table 1 summarizes the assessment framework: GOnR, GOffR, and GOffLV characterize driver observation, THW and TTC traffic criticality, while CTTC links GOffR with the collision-related time reserve for the controllability-related assessment.
Table 1.
Overview of metrics used in the controllability-related assessment.
3. Evaluation and Assumptions
The frequency and duration of continuous LKA, XCC, and XCC + LKA use vary across Europe, China, and the USA. The interpolation of short interruptions increases the calculated usage-block duration, particularly for LKA and XCC + LKA. Figure 5 compares uninterrupted activation durations with the resulting usage-block durations. Missing availability is the most frequent reason for LKA interruption, while short-term XCC interruptions result from manual braking by the driver. The median activation time of LKA ranges from 9.30 min in China to 14.13 min in Europe, but uninterrupted usage time with system availability is lower. The median continuous XCC usage varies from 3.13 min in China to 5.20 min in the USA. Regional-related differences in LKA usage are stronger than for XCC. Data also shows that participants in the USA have longer continuous XCC usage than those in Europe and China. Frequent usage duration in all three regions is shorter than 30 min. Median XCC + LKA usage is between 3.8 min in China and 4.67 min in the USA, where the frequency below 3 min is almost the same.
Figure 5.
Activation-duration distributions for (a) LKA, (b) XCC, and (c) XCC + LKA in China, Europe, and the USA. The dashed lines in panels (b) and (c) indicate the corresponding raw activation durations.
The evaluation of potential temporal dependencies showed no relevant effect of function runtime or activation frequency on THW or the distance to the lane boundary. Further, we found that the THW in 5 min after activation has no relevant variations.
In the corner case when a driver manually overrules AD functions in continuous usage, manual acceleration (XCC) or steering (LKA), the function preset acceleration based on the configured velocity and distance is temporarily manually controlled. Data showed that the frequency and time-share of overruling situations do not change during a study period or a usage sequence block. Figure 6 illustrates the frequency of XCC overruling situations within usage sequence blocks as event frequency and time-share. Within the first 18 min, which accounts for 80–85% of the total time, overruling events vary in a few percent and the time-share is almost constant. Therefore, we assume that scenarios may be interpreted independently of the position/time within a trip or study. Nevertheless, the dataset contains multiple observations from the same participants, trips, and continuous driving sequences and cannot be considered fully independent.
Figure 6.
XCC overruling during continuous use. (a) Frequency of overruling events within usage blocks in China, Europe, and the USA; (b) the time-share during which XCC was overruled. The first 18 min, indicated with a dashed line, covers more than 80% of the scenarios.
4. Results
In this section, we present the results from our dataset. We quantify driver performance aspects (objective criticality, gaze behavior, and controllability) in three different AD configurations in China, Europe, and the USA. The baseline builds situations without a maneuver of ego-vehicle in unidirectional traffic during continuous AD usage. We present specific gaze behavior models for the different AD functions (combinations) and compare them with empirical data from previous work. Furthermore, we investigate how AD features affect the frequency of (critical and low controllability) situations during continuous AD usage. We investigated the effects of manual overruling AD functions and the reaction on system-related deceleration. Finally, we showcase how gaze behavior and controllability during lane change are affected by AD usage.
4.1. Continuous Scenario Chunks
For driver monitoring, we consider a sub-dataset of approximately 280 h from trips with a total duration of at least 30 min. Because the processing time required for drivermonitoring did not allow an evaluation of the entire study dataset, the longest eligible trips of each participant were selected. This selection balances the participants’ contributions to the processed dataset as far as possible and provides a homogeneous basis for data processing. However, it does not ensure equal highway-driving exposure across participants.
Complete trips are processed to preserve the real-world occurring sequence and frequency of situations and scenarios. To improve the comparability of traffic and scenario conditions across regions, scenario selection within these trips was restricted to daytime driving on multi-lane highways and freeways with unidirectional traffic and vehicle speeds above 50 km/h at the scenario level. Each baseline scenario chunk represents continuous driving without performed maneuver or surrounding traffic interactions. Detected interactions, including lane changes, cut-ins and other detected interaction scenarios, are excluded from the baseline, as illustrated in Figure 2. This provides a common regional baseline, while interactions are analyzed separately under defined scenario conditions.
Several analyses involving THW and TTC focus on car-following situations to contextualize longitudinal traffic interactions and limit variation in traffic conditions, although car-following is not used as a general chunk-selection criterion.
4.1.1. Controllability Metrics and Driver Traffic Observation
Within the resulting baseline scenarios, drivers drove manually for 56.32% of the analyzed time, used LKA for 17.40%, used XCC for 9.85%, and used XCC + LKA for 16.43%. These proportions represent the function usage observed within the continuously processed trips. The four driving modes were not balanced to equal time-shares because this would require removing valid data and could change the naturally occurring frequency and sequence of situations and scenarios. The comparison therefore uses the available baseline situations within the continuously processed trips rather than four artificially balanced samples.
For the ADAS analysis, we truncate the GOnR and GOffR at 8.0 s. Truncating to a maximum duration of 8.0 s has a negligible effect on the GOffR durations. The type of distribution is similar for GOnR and GOffR across different regions. Previous work shows the GOnR distribution fits an inverse Gaussian distribution and GOffR distribution with a lognormal distribution [19]. Using maximum likelihood estimation and the sum of squared errors, we found that the lognormal and inverse Gaussian distributions provided the best fit to our data. The lognormal and inverse Gaussian distributions model GOffR and GOnR durations, respectively:
The empirical and fitted distributions for GOnR and GOffR gaze durations of up to 5 s during manual driving are shown in Figure 7. The fitting error is substantially lower for durations greater than 0.5 s than for shorter glances. The corresponding region-specific distribution parameters are provided in Table 2 and Table 3.
Figure 7.
Empirical distributions of (a) GOffR and (b) GOnR durations of up to 5 s during manual driving. Gray bars represent the empirical data, orange lines represent the fitted distributions, and black lines represent the reference distributions reported by Morando et al. [19].
Table 2.
Gaze off the road distribution function and fit error (SSE).
Table 3.
Gaze on the road distribution function and fit error (SSE).
4.1.2. Gaze on and Gaze off the Road Durations
To be aware of their surroundings, drivers must continuously look at the road ahead. We analyzed GOnR and GOffR duration for 70 drivers with the highest driving exposure, illustrated in Figure 8. We calculated each driver’s empirical durations individually and determined the mean by time-share and driver-weighted curve (driver mean). For the driver’s mean data, we only included trips with at least 5 min of using an assistance function and ignoring the first and last 20 s of each activation sequence. This ensured that non-representative scenario compositions did not skew the weighting. Across all four driving states, mean GOnR durations (more than 90% at 2 s) were longer than mean GOffR (less than 50% at 2 s) durations. The data showed continuous gaze on the road was longer than off the road, and the GOnR dispersion between individual drivers was more distinct.
Figure 8.
Distributions of GOnR and GOffR durations during (a) manual driving, (b) LKA use, (c) XCC use, and (d) XCC + LKA use. The (left) column shows the driver-level CDFs as well as the overall and driver-normalized means. The (right) column compares the driver-normalized GOnR and GOffR distributions across China, Europe, and the USA.
We compared the mean values of GOnR and GOffR for assisted and unassisted driving, and the data shows the same distribution type. However, the driver-weighted distribution for XCC (+LKA) showed a trend for longer GOnR duration compared to the overall time-share. When comparing manual driving in different regions, we found that the GOnR duration in Europe and the USA was almost the same but longer than in China, where drivers had lower GOnR distribution in all driving states. Additionally, we observed that using XCC results in longer GOnR durations for drivers in the USA, and this effect was even more pronounced when combined with LKA.
In China, the duration of gaze on the road (GOnR) is increased by XCC and LKA, as demonstrated in Figure 9 using a regional comparison view based on time-share. LKA usage results in a more pronounced extension of the mean GOnR by over 0.5 s, which is even more pronounced than the effect of XCC and XCC + LKA. Additionally, GOffR durations lasting longer than 2 s were less frequent during LKA use but slightly more frequent during XCC(+LKA) use. Data show that in Europe, the effect is less pronounced than in China. The distributions indicate a similar but smaller trend towards longer off-road glances, confirmed by a low effect size. LKA, XCC, and XCC + LKA have a slightly lesser effect on GOffR duration, with an effect size of less than 0.2 [44]. However, XCC(+LKA) increase the duration of the gaze on the road. During manual driving in the USA, the GOffR duration is shorter than in other regions, but the calculated effect of this deviation is small. In China, Europe, and the USA, no robust evidence for systematic risk compensation, i.e., the intentional acceptance of prolonged GOffR durations due to increased confidence in the AD function, was observed [45]. In all regions, the use of XCC(+LKA) empirically shows slightly longer GOffR durations, however, the corresponding effect sizes were small (see Table 4).
Figure 9.
Empirical distributions of GOnR and GOffR durations during manual driving and ADAS comfort-function use in (a) China, (b) Europe, (c) the USA, and (d) the combined NDS dataset.
Table 4.
Effect of LKA, XCC and XCC + LKA in gaze on and off the road duration.
4.1.3. Gaze on Traffic Object Ahead
We found, considering all scenarios, that the driver’s gaze is approximately 26% of the time when looking at the road (zones 4, 5) directed at a traffic object directly ahead. Figure 10 illustrates the distribution of individual driver’s mean time-share while looking at one of the 8 zones. On average (by drivers), their gaze is in 20.55% of the time directly on the traffic object ahead (zone 4 and 5). Considering preset traffic objects in ADAS/AD baseline scenarios, the driver’s gaze is oriented at 14.38% on the object in zone 4 and in 2.55% in zone 5 (Figure 10a). Most frequently, the driver’s gaze direction is on the ego lane or adjacent lanes-drivers observe the far center of the road. A shift to the right lane (far distance) is noticeable (Figure 10b).
Figure 10.
Driver-level mean gaze frequencies across spatial zones. (a) Frequency with which the closest traffic object was observed in each zone; (b) gaze frequency across road zones independent of object presence. In panel (b), the near- and far-distance straight-ahead zones are combined.
At low THWs, observing the traffic object ahead is important for accident avoidance. At distances below 50 m (zone 4), the frequency of gaze on that traffic object increases. In addition to the higher criticality, the larger field of (drivers) view occupied by the object is also important. With increasing THW, the proportion of the field of view is reduced, and the observation expands to the scene around the objects. The spread in gaze behavior between individual drivers regarding the glances on the vehicle ahead is high. We found the same in GOffR/GOnR evaluations. The mean duration a driver does not look toward the leading traffic object (GOffLV) is between the mean GOffR and GOnR duration.
Figure 11 illustrates the GOffLV as the cumulative distribution function (similar format). Except for XCC use in China, approximately 60–80% of the observed GOffLV durations were no longer than 2 s. In all regions, drivers using XCC(+LKA) have longer durations than manual driving. In China and the USA, using LKA reduces the GOffLV slightly but not relevant, and XCC + LKA results in shorter GOffLV than with XCC alone. In Europe, the effect of different comfort functions is less distinct. All 3 AD function states result in longer GOffLV in comparison to manual driving: LKA (effect-size: 0.14), XCC (effect-size: 0.16), XCC + LKA (effect-size: 0.23). So, data show a small effect of XCC + LKA on gaze behavior and none for XCC or LKA alone. Although XCC shows longer GOffLV durations in China, its low usage frequency results in a limited sample size and, consequently, limited statistical robustness of this observation. This effect is illustrated in cumulative visualization, but corresponding effect sizes were small, LKA (effect-size 0.08), XCC (effect-size: 0.17), XCC + LKA (effect-size: 0.16).
Figure 11.
Empirical distributions of GOffLV durations during manual driving and ADAS comfort-function use in (a) China, (b) Europe, (c) the USA, and (d) the combined NDS dataset.
4.1.4. Gaze off the Road and Controllability
To investigate the controllability-related assessment regarding front-collision, we evaluate scenarios following a traffic object with THW ≤ 6 s from the baseline. The CTTC values of this baseline subset are shown in Figure 12. In addition to the CTTC results, situations with TTC values between 2 and 7 s were less frequent during XCC and XCC + LKA use than during manual driving (values above 7.1 s were truncated). Figure 12 compares the overall TTC distribution of the selected baseline scenarios with the CTTC distributions separated by AD-function usage. Most TTC values are above 3 s, showing that the selected baseline scenarios are not primarily characterized by low collision-related time reserves. When the observed GOffR duration is considered, the CTTC distributions extend to substantially lower values and include CTTC = 0 s. CTTC values around and below 1 s occur most frequently during manual driving, whereas the distributions for LKA, XCC, and XCC + LKA remain shifted toward higher CTTC values. The greater reduction in the controllability-related time reserve during manual driving results from the combination of lower initial longitudinal time reserves and the observed GOffR durations. For XCC and XCC + LKA, the less frequent TTC values between 2 and 7 s and the larger THW explain the shift toward higher CTTC values. The corresponding shift during LKA use cannot be attributed to longitudinal control and is further evaluated by comparing CTTC within the GOffR-duration classes. Figure 12 therefore shows how the relative frequency of CTTC values differs in vehicle-interaction scenarios depending on AD-function usage and identifies reductions in the remaining time reserve that are not represented by the overall TTC distribution alone.
Figure 12.
Distribution of Closest Time To Collision during manual driving and LKA, XCC, and XCC + LKA use.
The relation between GOffR duration and CTTC indicates that the effect of GOffR on the remaining time reserve differs between the driving modes. Higher CTTC values during LKA use remain visible within comparable GOffR-duration classes and therefore are not explained by GOffR duration alone. Since LKA does not control longitudinal distance, this difference reflects the scenario-related longitudinal time reserves during LKA use. The observed combination of LKA use, GOffR duration, and longitudinal time reserve therefore reflects different usage conditions rather than a direct longitudinal effect of LKA. A higher initial time reserve reduces the relative effect of missing road observation and counteracts differences resulting from gaze behavior. During manual driving, the median CTTC falls below the median reaction-time reference of 0.99 s for GOffR durations of 2.0–2.5 s. When using XCC or XCC + LKA, the median CTTC drops below the median reaction-time reference for GOffR durations of 2.5–3.0 s. With further increasing GOffR duration, the median CTTC reaches 0 s for all driving modes. The relation between CTTC and GOffR duration for the individual driving modes is summarized in Table 5.
Table 5.
Closest Time To Collision vs. Gaze off the road duration.
4.1.5. Overruling XCC
Manual overruling XCC by the accelerator is, besides braking of the object ahead, the main reason for small THWs below 1 s while using XCC(+LKA). Figure 13 shows the minimum THW distribution (THW ≤ 4 s) within scenarios using XCC(+LKA). The distribution summarizes data from four XCC distance configuration settings, resulting in up to four frequent THW peaks. The dark green bars show the distance to the vehicle ahead (E00) while continuing XCC distance control. The stacked light green bars indicate the distance while XCC is activated but overruled by the driver (accelerator). The lines illustrate the cumulative probability of the THW as cdf. The gray line is the cdf of continuous XCC(+LKA) control, the black line shows the manual overruling, and the orange line represents the manual baseline without AD as a reference. Data show that the THW is increased by continued XCC(+LKA) control compared to manual driving. The frequency of THW ≤ TTR of overruling is similar or slightly lower than pure manual driving. For THW > 1.1 s, the manual overruling results in closer distances to the leading objects. The scenario frequency of gaps smaller than TTR is lower while continuous XCC(+LKA) control than with overruled accelerator. The combined usage of XCC vs. XCC + LKA did not reveal relevant differences (as expected from the independent mode of operation between LKA and XCC). However, an additional reduction of the minimum time gaps under TTR compared to manual driving is shown. This is similar for all three investigated regions and in combination with LKA.
Figure 13.
Minimum time-headway distributions (THW ≤ 4 s) during (a) XCC and (b) XCC + LKA use. Dark-green bars represent continuous system control, and light-green bars represent manual accelerator overruling. The CDFs compare the frequencies of low THW values with the manual-driving baseline.
A manual overruling of the gas pedal during continuous AD usage results in lower distances to the traffic object ahead (E00) and in enhanced road observation. A simple time-share analysis shows that with a larger accelerator-pedal position, the percentage GOffR (PGOffR) drops from 21.8% (accelerator = 15–30%) to 14.7% (accelerator > 90%) in a monotonous and almost linear manner. In the baseline scenarios, this is shifted to more road observation, 18.2% PGOffR at 25–30% accelerator and 11.9% PGOffR at above 90% accelerator. In scenarios when a driver overrules XCC(+LKA), the PGOffR is reduced for small accelerator-pedal position (lt. 45%). The GOffR duration is neither sensitive to the accelerator with XCC(+LKA) nor in pure manual control.
Investigating gaze vs. THW independent of AD functions and regions shows that GOffR and PGOffR increase with larger THW. The median GOffR increases from 0.5 s (at THW = 0.4 s) to 0.8 s (at THW = 10 s). PGOffR increases from approx. 18% to 34% in the same interval. Figure 14 shows the GOffR percentiles (25th, 50th, 75th) and PGOffR vs. THW. The median GOffR was neither strongly affected by increasing THW (constant about 0.4–0.5 s) in manual driving nor by LKA and XCC(+LKA) assisted driving. The PGOffR in the baseline is lower than in the overall time-share, so drivers look more frequently on the road. Further, we found that drivers have 15% PGOffR in close following scenarios (THW:0.5–1.0 s). This increases with larger time gaps (THW: 3.5–4.0 s) to approx. 20% PGOffR.
Figure 14.
GOffR-duration percentiles and PGOffR as functions of time headway. The black line indicates the median GOffR duration, and the gray lines indicate the 25th and 75th percentiles. The dashed lines show PGOffR for all, baseline and XCC-overruling scenarios.
In a „close” following scenario, driver’s road observation during manual driving, with LKA and XCC(+LKA), is almost the same with 15% PGOffR. While AD-function usage in comparison to manual driving, PGOffR does not increase with larger THW and stays continuously below 20% PGOffR. When examining the effect of the manual overruling of the gas pedal, the driver does not have a higher PGOffR when using XCC(+LKA). Above 2.5 s THW, the number of overruling scenarios is low (see Figure 13, manual gas).
4.2. Maneuvers and Events While Using Automated Driving Functions
As representatives of various transitions, we investigate two scenario types, (1) AD-function intended braking and (2) manually operated lane changes, that frequently occur in normal operation. How drivers (re-)act is an indicator for their SA, the ability to assess the situation correctly, and confidence in the AD function.
4.2.1. XCC Intended Deceleration
The XCC function brakes within a defined range (not sufficient or designed to handle critical situations), most frequently triggered by approaching a traffic object ahead. The driver has three options to (re-)act on the event by (i) allowing the function to operate continuously, (ii) disabling the function by manual braking, and (iii) overruling the accelerator and suppressing deceleration. On freeways and multi-lane federal highways, drivers allowed XCC to continue control in object following scenarios (ACC-mode) in 88.6% (median, std. 6.6%) of all braking events. Hence, the driver does not perform additional manual braking. Without traffic objects ahead, XCC (DCC-mode) is not switched off in 72.6% of the events, here, the braking intrusion and deceleration amplifier are often low.
Figure 15 shows the THW and acceleration minimum value of each scenario during XCC-intended braking for the three (re-)action types for all NDS scenarios. Driver response does not clearly correlate with the distance to the vehicle ahead (THW) or the system deceleration amplifier. The driver overrules the XCC most often when the vehicle finally stops or in lane change scenarios (including cut out/cut in). Nevertheless, the driver responds more frequently in scenarios with low THWs. But the type of reaction, accelerating or decelerating, cannot be determined from the distance behavior only. We found stronger maximum deceleration when manually taking control–so drivers are applying more deceleration than the system would and not just overruling with the same vehicle response. Starting at a deceleration of 1 m/s2, a higher deactivation rate is observed with increasing intensity.
Figure 15.
Panel (a) illustrates the minimum THW distribution (THW < 4 s) when XCC decelerates actively (braking pressure). Panel (b) illustrates the minimum acceleration (deceleration) distributions of XCC system brakes. The green distributions represent the scenarios without driver interaction, the blue line driver reaction by acceleration, and the red line driver reaction by braking.
Besides the need for a driver reaction indicated by the distance to traffic objects ahead, the SA may affect the reaction type. An evaluation of the last 2.5 s before and 2 s after braking is shown in Figure 16a. For events without driver intervention, the raw data and the fitted PGOnR curve (6th order polynomial) increase continuously to 70.9%, from 2.5 s before braking time. In scenarios with manual braking, the average PGOnR is continuously highest in the previous 2.5 s and beyond the TTR (here factored by a period 0.8–1.2 s). In the last 1 s before the vehicle brakes, drivers look off the road for longer than 0.3 s in 75% of the scenarios. The maximum is reached before the TTR expires. In scenarios overruling the accelerator, the PGOnR continued to increase beyond the situation (t = 0) of the first braking and TTR. Compared to the baseline, the effect on road perception is not relevant. XCC braking results only in a few cases in a change of gaze direction towards the road, so data does not show that braking leads directly to an enhanced road perception. Considering the time when the longitudinal acceleration was stopped might provide further information. The time-share a driver looks at the traffic object ahead increases continuously until braking (33%) and beyond TTR (34%) (see Figure 16b). We found a slightly stronger effect in scenarios drivers deactivate the AD function. The maximum is between the braking time and the TTR. When analyzing the results, it must be considered that a vehicle at a low distance implicitly supports a higher percentage of direct observation –occupying a large part of the driver’s field of view.
Figure 16.
Gaze behavior before and after XCC-initiated braking. (a) Empirical data and fitted PGOnR curves for manual braking (red), accelerator overruling (blue), and events without driver intervention (green) with solid lines representing the fitted curves; (b) percentage of gaze directed toward the leading vehicle for manual braking (red) and events without driver intervention (green).
4.2.2. Lane Change Scenarios
In comparison to the presented scenario above, a lane change does not consist of independent situations, but a fixed sequence of tasks/states. The maneuver can roughly be subdivided into the segments (normal travel, intention, approaching the lane boundary, passing the lane boundary, approaching the center of the lane, normal travel) [46]. Lane change maneuvers are often associated with interaction with other road users, which can lead to increased criticality issues [47]. Due to more frequent head movements of the driver before and during the lane change [48], the influence of subjective criticality by missing perception also increases. At least the object ahead E00, the upcoming object ahead E10/E20 after the lane change and oncoming vehicles from the rear R10/R20 need to be considered for vehicle guidance. The driver needs to analyze the situation in the ego lane and consider situations that may arise from the interaction with objects in the adjacent lanes.
Lane change with a traffic object ahead: Traffic objects ahead affect the maneuver at a low distance and when the ego-vehicle approaches only. This occurs most frequently when a driver changes the lane to the left, e.g., for overtaking. The time gap reduces during the approach maneuver, and THWmin is in the transition phase of the ego-vehicle between the road lanes. Further, we investigate the effect of XCC(+LKA) usage. XCC + LKA is defined when XCC is continually active, and LKA is active immediately before approaching the lane boundary. Using XCC(+LKA), the mean THWmin increases in non-urban scenarios with speeds between 50–180 km/h (excluding acceleration/deceleration lanes). The frequency of critical low-distance events is less affected than the mean value. But the 5th percentile of lowest THWs is still small affected (effect-size) by XCC.
We found for XCC(+LKA), less time gaps with THW below 1.1 s than during manual driving. A similar effect is measurable for China, Europe, and the USA. Figure 17 illustrates the THW distribution in manual driving and THW-cdf for manual XCC(+LKA) separated by regions. During a lane change to the left, XCC results in increased time gaps compared to manual driving. Especially in China, the effect of XCC usage differs from XCC + LKA usage in the interval 1–4 s THW (effect-size: 0.27), towards lower time gaps. Data show XCC(+LKA) increase THW also in China. In Europe and USA, the distance behavior of XCC and XCC + LKA showed only minor differences. Overall, the cross-cultural differences with XCC (using the same software configuration) are negligible. When changing lanes to the right while following a traffic object ahead, the frequency of THWmin below TTR is reduced. Data from China show that THWmin decreases outgoing from 20% while manual driving and less than 10% while driving with XCC(+LKA). The time gap frequency between 2–4 s is almost the same (converges cdf). Even if the effect size on the overall distribution is small (XCC: 0.30, XCC + LKA: 0.25), the time gaps increase. Besides the increase of THWmin before the lane change, there is a similar effect on the THW on the target lane (E10/E20). When changing lanes to the left, the THW increases measurably in all regions, e.g., in Europe by 0.15 s with XCC(+LKA)-(effect-size of XCC/XCC + LKA: China: 0.21/0.28; Europe: 0.23/0.28; USA: 0.27/0.20 is small).
Figure 17.
Time-headway distributions (THW ≤ 4 s) to the leading vehicle E00 before left lane changes in (a) China, (b) Europe, and (c) the USA. The CDFs compare manual driving with XCC and XCC + LKA use.
Lane change-traffic object in the rear: Regarding front collision criticality, each lane change of the ego-vehicles represents a cut-in for oncoming traffic objects. We found time gaps to oncoming traffic objects in the rear (R10/R20) of approaching and passing traffic object does not differ between manual driving and XCC(+LKA) use. Figure 18 shows the TTC distribution to the rear traffic objects in the last 3 s before a lane change and the cumulative distribution functions from manual driving and XCC(+LKA). Each lane change is represented with up to 6 situations (samples) from 2 Hz measure. The TTC of the traffic object R10 during a lane change to the left (into the faster lane) shows small variation in an accident-relevant time range (only from TTC > 5 s). Fewer speed variations between road lanes decrease the frequency of TTC values (adjacent lane) close to zero in China compared to, e.g., Europe. The TTC values in China are generally larger; only 20% of the lane changes to the left result in TTC smaller than 50 s. The effect of XCC(+LKA) on TTC is not relevant in all regions. In the USA, the TTC increases slightly by XCC and XCC + LKA, in Europe, the TTC increases by XCC and is negligibly affected by XCC + LKA.
Figure 18.
TTC distributions of rear traffic object R10 during the final 3 s before a left lane change in (a) Europe and (b) China. The CDFs compare manual driving with XCC and XCC + LKA use. TTC values close to zero indicate passing traffic objects.
Lane change-gaze direction: With increasing lateral acceleration, also the driver’s gaze direction shifts from observing the straight orientation in the ego-lane, to the side and over the shoulder. Data show, with higher amplifier of lateral acceleration, the driver gaze goes from approx. 20% PGOffR during 0 m/s2 lateral acceleration to 38%/47% at 3 m/s2 to left/right.
Investigating the time before a lane change shows, the driver increasingly observes the target side of the lane change. In doing so, the driver misses the headway traffic temporarily. They often look to the side or over the shoulder in the last 3 s before the vehicle crosses the lane boundary. The result is a reduction of the PGOnR. We found drivers performing a lane change right spend less time observing the adjacent lane (see Figure 19). In both directions, the time fraction of gaze on the target lane is at its maximum of about 1 s before crossing the lane boundary (right: >17%, left: >20%). With XCC(+LKA), drivers observe the adjacent lane up to 8% more often in the last 3 s, leading to up to 5% less PGOnR. When using XCC + LKA, the effect is even stronger than with XCC.
Figure 19.
Gaze-direction time-shares around lane-boundary crossing. (a) Gaze directed toward the headway road; (b) gaze directed toward the target side of the lane change.
Further, the gaze on the traffic object ahead (E00) decreases sharply, before a lane change. For lane change to the right, the PGOnLV drops below 12% and increases beyond the lane boundary departure to 18%. The shape of lane change to the left is similar, but the GOnLV is higher (see Figure 20). Before crossing the lane boundary with the outer front wheel, the PGOnR reduces.
Figure 20.
Percentage of gaze directed toward the leading vehicle E00 during left lane changes (green) and right lane changes (red). (a) Timeline while approaching the lane boundary; (b) timeline while passing the lane boundary.
Even though the PGOffR is higher, the GOffR duration is only slightly increased by XCC(+LKA) (mean value of the maximum GOffR: +0.15 s, effect-size: 0.18). Analyzing the individual situations with a TTC smaller than 7 s and TTC > 0 s, all AD-function usage conditions show a clear reduction in the controllability-related time reserve from TTC to CTTC for headway objects. This reduction reflects the distribution of driver observation between headway objects and approaching rear traffic during lane changes. In contrast to the baseline scenarios, CTTC during XCC use is at a similar level to manual driving. Figure 21 shows TTC and CTTC during lane changes.
Figure 21.
TTC and CTTC distributions and corresponding CDFs for TTC ≤ 7 s during lane changes. TTC provides the objective reference, while CTTC is shown for manual driving (orange), XCC use, and XCC + LKA use.
5. Discussion
This work examines how driver observation and collision-related time reserves affect controllability-related indicators during real-world use of SAE Level 1 and Level 2 AD functions. This work contributes knowledge about how drivers perceive the environment, act, and interact in traffic while assisted and partially automated driving with XCC and LKA compared to manual driving. The scenario-oriented NDS design enabled a combined interpretation of driver observation and collision-related time reserves during continuous function use and selected driving scenarios. We investigate the role of the driver’s response regarding criticality and controllability during continuous AD function use and dedicated disengagement scenarios. We quantify effects on driver behavior, focusing on driver perception as an indicator related to the controllability of situations. Thus, we use one of the major opportunities in traffic observation through NDS-the joint evaluation of driver and vehicle perception. The discussion first evaluates continuous function use, collision-related time reserves, and driver observation separately. It then combines these findings in the controllability-related assessment.
Continuous function use differed between regions and was fragmented under real-world driving conditions, while the differences for combined XCC + LKA use were smaller. Data show both the percentage usage and the continuous usage time of XCC and LKA differ in China, Europe, and the USA. The activation duration of LKA (not explicitly active) is longer than XCC and consequently XCC + LKA. XCC activation times were shortest in China, followed by Europe and the USA. The evaluated XCC activation sequences may be interpreted as the driver’s preference for assisted driving, which is interrupted due to system or confidence constraints. Compared with the raw usage duration, average activation is less than half as long and indicates a high fragmentation in real-world traffic. Contrary to expectations, based on the traffic density in the regions, we found in Europe a higher fragmentation than in China. However, it must be noted that some participants deactivate AD functions before maneuvers, and the total trip and sequence duration limits the usage duration reachable. For the XCC + LKA usage period, the differences between regions were small. In the USA, Fridman et al. investigated driving durations using Tesla Autopilot and reported a median usage duration of 2.2 min and a mean duration of 4.8 min [49]. In comparison to that, we found slightly longer continuous usage in the USA raw data (before chunking), approximately a factor of 1.1 for 25th, 50th, and 75th percentiles.
The larger THW during XCC and XCC + LKA use increased collision-related time reserves, but this interpretation depends on the driver perceiving the relevant traffic situation. The effect of these AD usage chunks on criticality in terms of front collision risk has been investigated in previous work. For the dataset used in the present study, previous analyses showed that XCC increases THW [2], including gaps within the reaction-time-relevant range of 0–1.1 s [5]. Mobileye describes a safe distance with reserves for maneuvers is an indicator for safe (automated) driving [50]. Including driver reaction time defines an even better indicator for safe manual, tactical guidance. We found that based on the reaction time on braking vehicles ahead (15th 0.8 s, 50th: 0.99 s, 85th: 2.01 s) [7], the steering time reserve is increased by the large time gaps using XCC(+LKA). Accordingly, the larger THW is associated with lower criticality. However, this implies that the driver perceives the surrounding vehicle and knows the situation.
Published PGOnR values vary considerably across automation functions and study designs; the present results are within this range and show only small reductions during XCC and XCC + LKA use.
Previous work used PGOnR distributions as indicator of attention and found, e.g., 86.3% PGOnR while following vehicles ahead (THW: min: 0.57 s, avg: 1.89 s, max: 3.75 s) [27]. Studies conducted in the USA show that driver observed the road without automation between 74.3% [51] and 85% [52]. With increasing automation levels, previous work found decreasing PGOnR, e.g., 78% using ACC [29,53]. For XCC + LKA, including Tesla Autopilot, Morando et al. reported a reduction in PGOnR from 76% during manual driving to 64% [54], while Gaspar et al. found a minor reduction of 0.4% from 74.3% to 73.9% [51]. We found an even higher effect PGOnR was 87.4% during manual driving and decreased to 84.7% during XCC use and 85.9% during XCC + LKA use. One potential reason for the higher road observation is the head-up display installed in each vehicle in this NDS.
Function-related gaze changes were small compared with regional and driver-level variation, and PGOnR depended more strongly on THW than GOffR duration. Doing so, we found in the USA slightly higher PGOnR than in Europe and substantially higher than in China (manual driving: 77.0%, XCC + LKA: 74.7%). Contrarily to findings in the USA, we found in Europe an almost constant and no reduced PGOnR by XCC(+LKA). Further, we found that the PGOnR strongly depends on the THW while GOffR durations are less sensitive. Further, we found no time dependency for the PGOffR and GOffR duration within one continuous activation chunk and over the study period of three months for each participant. Feldhütter et al. reported a change in the PGOnR during automated driving in simulator studies comparing minute 5 and 20 of a trip [55]. In our data, PGOffR increased by 0.02 s, which is far below the standard deviation, and 75th percentile of GOffR is slightly affected. At least the boxplot whiskers with 1.5xIQD differ by 0.2 s which could provide limited support for that finding. This difference may be related to the simulator context or to the low number of continuous 20 min automation sequences in the real-world dataset. Previous work, including Morando et al., does not consider the temporal course of XCC + LKA use and therefore cannot further support this finding. The relationship between inattention and crashes and near-crashes has been extensively addressed in the literature, and previous investigations show its relevance [56]. Seppelt et al. found a correlation between crashes and near-crashes and insufficient road attention [9], supported by the SHRP2 report by Victor et al. [52]. The need to consider driver perception during automated driving is one of the challenges of Level 1 and Level 2 automated driving. Morando et al. presented a reference model for the duration of road glances (GOnR, GOffR) [19] which is a more appropriate indicator in continuous usage (than in specific scenarios). Even if mean PGOffR increases, this may not result in reduced surrounding perception when drivers observe the road more frequently.
In this study, XCC(+LKA) has only a small effect on GOnR and GOffR, which is in line with the findings of Morando et al. investigating XCC + LKA. However, the proposed distribution for GOnR differs from those in our dataset. A likely reason is their more intrusive post-processing filter so that it does not contain short glances of less than 0.3 s. The cumulative GOnR/GOffR distributions are not directly comparable since we apply a very restrictive scenario filter for typical Level 1 and Level 2 automation scenarios as a baseline. The mean cumulative GOnR of all drivers using XCC(+LKA) is lower than the mean of all data.
When evaluating gaze durations by region, we found that LKA and XCC(+LKA) have no relevant effect on the duration driver looks at a particular area. With a higher traffic density in China, GOnR durations are generally shorter than in Europe and the USA. The differences between single drivers are unexpectedly high. We found the GOnR distribution with LKA is in absolute values almost the same in all three regions. GOffR duration becomes shorter in China and Europe in comparison to manual driving. A reasonable explanation is that in this region, XCC is also disengaged more frequently; thus, a substantial part of LKA usage consists of complex scenarios. The driver wants to use XCC + LKA but temporarily stays with LKA active or on standby.
Drivers primarily observed the far ego lane and leading traffic objects; differences in GOffLV between functions did not indicate a reduced controllability-related assessment when comparable time gaps were considered. According to Lappi et al., when facing the road, a driver observes the traffic ahead, respectively the far road of the ego-lane, if feasible [57]. The spatial gaze distribution observed in this study is consistent with these findings. Drivers directed their gaze most frequently toward the far ego lane in unidirectional traffic, with a secondary preference for the far-right lane. Driver primary observed vehicles ahead in the ego lane, which is strongly supported by the occupancy frequency. Besides following the overall traffic situation, e.g., for tactical guidance, observing a traffic object ahead (E00) is among the most crucial to avoiding front crashes. In a follow-up scenario, the mean driver GOffLV in all considered regions and for all AD functions is below 1.8 s. Due to the shorter GOffR durations and the longer GOnR durations, the GOffLV fits between GOffR and GOnR. A separation by automation functions shows that XCC leads more strongly than XCC + LKA to longer GOffLV. Considering THW, indicating equal GOffLV are measured for equal time gaps. Consequently, this change does not suggest reduced controllability-related reserves. It must be noted that the underlying algorithm tends to classify vehicles in front as observed, especially when looking at the head-up display or glances close to the traffic object ahead in the adjacent lanes [41]. Object-specific observation must therefore be interpreted together with the corresponding time gap rather than as an isolated loss of perception.
When gaze and time reserves were evaluated jointly, GOffR durations above 2 s were associated with lower CTTC values but the larger THW during XCC and XCC + LKA use preserved more observation-conditioned time reserve than manual driving. GOffR duration is an established indicator of missing road observation. Victor et al. found in a joint evaluation of TTC and GOffR that GOffR equal to or greater than 2 s was associated with increased TTC-based criticality [52].
The CTTC metric quantifies the effect of missing perception of a traffic object on the controllability-related assessment of a situation. According to the definition of situation awareness by Endsley and Garland, perception is just the first layer, and comprehension and projection are necessary to understand a situation [20]. Inversely we measure missing perception and quantify a valid indicator for missing situational knowledge. CTTC evaluation shows only a minor reduction of controllability by GOffR durations while using Level 1 and Level 2 AD functions. It is essential that even if AD can result in reduced SA and anticipatory driving, this does not offset the beneficial effect of larger THW. Consistent with the TTC-based findings of Victor et al. [52], the present analysis shows that GOffR durations between 2.0 and 2.5 s during manual driving are associated with reduced observation-conditioned time reserves, with a median CTTC of 0.62 s. This value is lower than the median TTR of 0.99 s reported in [7] and, relative to this reference, suggests that timely independent driver control may not be feasible under the modeled conditions. For the same GOffR-duration class, the median CTTC was 1.19 s for LKA, 1.80 s for XCC, and 1.42 s for XCC + LKA. This combined interpretation directly addresses the central question by showing that the same duration of missing road observation can correspond to different controllability-related reserves depending on the traffic situation.
Driver intervention reduced system-controlled time gaps and was associated with increased road monitoring at low THW. The short-term deceleration analysis did not show a systematic gaze response caused by braking alone. During continuous XCC(+LKA) use, the distance to the traffic objects ahead is controlled by the system on the one hand and by the driver (overruling) on the other. Pauwelussen et al. found that manual accelerating is most often reasoned by speed adaption before lane changes and is rare in continuous object-following scenarios [23]. Nevertheless, even in scenarios where no immediate lane change occurs (greater than 4 s), the accelerator is overruled in about 50% of all scenarios with a minimum THW of less than 0.9 s. The THW due to XCC(+LKA) is higher than manual overruled for all regions. At low THW values, manual accelerator input was associated with higher PGOnR. This pattern is consistent with increased road monitoring during induced shorter time gaps but does not directly measure the driver’s situation awareness. Thereby the frequency of THW of smaller TTR does not fall below that of pure manual driving. Data show, neither during XCC-controlled longitudinal driving nor during manual overruling, a higher frequency of critical low time gaps than manual driving. In all three regions, the resulting manual THW of XCC + LKA is slightly longer than that of XCC.
The evaluation of driver gazes in XCC(+LKA) disengagement scenarios shows that observation of the road increases before the first deceleration. Previous work found increasing road observation over the last 20 s before an autopilot disengagement, equivalent to XCC + LKA [54]. In contrast, the present scenario-based analysis considers the final 4 s before braking to assess the direct effect associated with the braking event. Earlier events are only relevant in a path guidance context and cannot be included in this analysis. Data show that the time-share a driver looks at the traffic object before an active braking event also increases. The overruling and deceleration scenarios show how driver action can affect the time-reserve while road observation remains situation-dependent.
During lane changes, XCC and XCC + LKA were associated with larger reserves and more gaze toward the relevant adjacent-lane, without a corresponding change in rear-traffic TTC or THW. Several related works illustrate the gaze behavior and coverage of reverse traffic when a driver performs a lane change. McCall et al. presented a lane change intention classification in 2007, and Martin et al. presented a lane change maneuver prediction in 2018 based on driver gaze [48,58]. Scenario- and maneuver-based applications using glances came up for partially automated driving [58,59]. In this work, we investigate how gaze behavior is affected by AD functions and their effect on driving performance. Evaluating 3 s before and after crossing the lane boundary, we found a larger minimum THW to the traffic object ahead using XCC(+LKA). The CTTC-based controllability-related indicator is higher than during unassisted manual driving, an effect that is frequently associated with the larger THW. Previous studies found a dependency on drivers’ GOffR duration and skill level. Expert drivers look in one direction or at a vehicle for a shorter time but with higher frequency than non-professional [60].
We found that THW and TTC are not dependent on XCC(+LKA) in scenarios interacting with approaching traffic objects from the rear in the adjacent lane. The data show a higher proportion of rear-traffic observations toward the lane-boundary crossing, mainly within the final 2 s before crossing. However, this does not result in a different frequency of scenarios with minimum TTC or THW. A driving simulation study by Hayashi et al. [61] confirms the results in general by demonstrating that a higher time-share looking to the mirror does not directly result in lower-risk lane changes in the faster lane. The lane-change findings extend this interpretation to a maneuver-specific context in which gaze distribution is changed toward the target lane.
Overall, driver observation and collision-related time reserves have complementary but unequal effects on the controllability-related assessment. Within the analyzed scenarios, Level 1 and Level 2 functions were associated mainly with changes in available time reserves, while changes in gaze behavior were smaller and depended on the region, driver, and scenario.
Nevertheless, several limitations should be considered. An NDS is always limited by its sampling characteristics and the low level of control over driving situations. The dataset was recorded with a single vehicle type and 15 vehicles in three metropolitan areas in China, Europe, and the USA. Only approximately 280 h of highway driving were processed because processing the complete driver-monitoring dataset was not feasible. The longest trips of each participant that met the selection criteria were used to retain continuous driving sequences and balance the participants’ contributions as far as possible. As a result, situations present in the full dataset may be under- or overrepresented. The scenario restrictions establish comparable analysis conditions, but do not account for regional differences in overall traffic density.
However, this selection does not ensure equal exposure across participants or driving modes. The data were recorded between 2018 and 2020. Their applicability to other vehicles, regions, and newer system generations requires further evaluation.
Automated scenario detection and gaze-zone classification may propagate errors across processing steps. The driver-vehicle observation classifier achieved an F1 score of 0.88 and a weighted F1 score of 0.90. The results are limited to daytime driving without sunglasses and to vehicles equipped with a head-up display. Multiple observations originate from the same participants and trips and cannot be considered fully independent. The findings therefore describe the analyzed scenario distributions rather than independent effects at the driver level.
6. Conclusions
Quantifying and understanding the role of driver behavior and driving performance in front collision risk in Level 1 and Level 2 automated driving is essential to enhance road safety. Driver behavior affects vehicle control and traffic perception, and both contribute to reducing collision risk. ADAS, in general, and automated driving functions, could be improved by the estimated driver perception in the same manner as a vehicle state and adapt timings and courses for (re-)action in their type of operation. In this work, we address the driver effect on missing visual perception and the effect on front collision risk using eye-tracking and surrounding traffic objects in naturalistic traffic data. We present gaze on/off the road and gaze on/off the leading vehicle empirical data and models for China, Europe, and the USA with Level 1 and Level 2 vs. manual driving as a baseline and investigate common scenarios with driver (tactical) task during partially automated driving. The presented methods and results may further support the assessment of assisted-driving concepts that increasingly integrate driver gaze into driver supervision and maneuver-related interactions, including emerging L2+ systems.
We have four findings from this work. (1) While continuous usage of Level 1 and Level 2 functions, neither the THW nor the driver gaze is affected by the continuous AD usage duration. So, situations were evaluated as independent of their temporal position within a trip or activation sequence. (2) We extend the state-of-the-art reference models for gaze on/off the road by distinguishing between China, Europe, and the USA. Further, we present an empirical distribution for the gaze off the leading vehicle that is not targeted in NDS literature so far. (3) We found that the driver actively enforces low THWs (regarding the time to react) to the traffic object ahead. (4) We investigate missing scene perception and how this affects SA and consequently controllability regarding reserves to prevent front collisions. We show that the same duration of missing road perception (from gaze) with XCC(+LKA) was associated with smaller reduction of controllability-related indicators than unassisted manual driving, because the corresponding situations had extended time reserves. Our findings for gaze behavior could be used as a baseline for simulation and scenario-related evaluations. Simulations, e.g., for scenario-based ADAS assessment or driver models in general, can use customized baselines for certain AD functions and in certain countries.
Author Contributions
Conceptualization, N.E.; methodology, N.E.; software, N.E.; validation, N.E.; formal analysis, N.E.; investigation, N.E.; resources, N.E.; data curation, N.E.; writing—original draft preparation, N.E.; writing—review and editing, A.R.; visualization, N.E.; supervision, A.R.; project administration, N.E.; funding acquisition, N.E. All authors have read and agreed to the published version of the manuscript.
Funding
This research was funded by Bayerische Motoren Werke.
Informed Consent Statement
Informed consent was obtained from all subjects involved in the study. The identifiable image presented in Figure 1 depicts the first author of this manuscript, who provided written informed consent for publication of the image.
Data Availability Statement
The datasets presented in this article are not readily available because they contain personal data, including images and video recordings of study participants, and were collected by BMW Group Safety Department for a dedicated research purpose under predefined usage and access restrictions. Requests to access the datasets may be directed to the corresponding author.
Acknowledgments
We applied the FLAE approach for the sequence of authors.
Conflicts of Interest
Nico Epple was formerly employed in the BMW safety department. The data were collected for the dedicated purpose of safety evaluation and were made available for use in the author’s doctoral research. BMW funded the research but had no role in the analysis or interpretation of the data or in the writing of the manuscript.
Abbreviations
The following abbreviations are used in this manuscript:
| ADAS | Advanced Driver Assistance Systems |
| AD | Automated Driving |
| ACC | Adaptive Cruise Control |
| CTTC | Closest Time To Collision |
| DCC | Dynamic Cruise Control |
| GOnR | Gaze On the Road |
| GOffR | Gaze Off the Road |
| GOffLV | Gaze Off the Leading Vehicle |
| LKA | Lane Keep Assist |
| NDS | Naturalistic Driving Studies |
| PGOnR | Percentage Gaze On the Road |
| PGOffR | Percentage Gaze Off the Road |
| SA | Situational Awareness |
| SSE | Sum of Squared Errors |
| THW | Time Headway |
| TTC | Time To Collision |
| TTR | Time to React |
| XCC | Dynamic and Adaptive Cruise Control |
References
- SAE J3016:2021; Taxonomy and Definitions for Terms Related to Driving Automation Systems for On-Road Motor Vehicles. SAE International: Warrendale, PA, USA, 2021. Available online: https://www.sae.org/standards/j3016_202104-taxonomy-definitions-terms-related-driving-automation-systems-road-motor-vehicles.
- Epple, N.; Dari, S.; Drees, L.; Protschky, V.; Riener, A. Influence of Cruise Control on Driver Guidance—A Comparison between System Generations and Countries. In Proceedings of the Intelligent Vehicles Symposium (IV); IEEE: Piscataway, NJ, USA, 2019; pp. 614–619. [Google Scholar]
- Filzek, B. Abstandsverhalten auf Autobahnen—Fahrer und ACC im Vergleich. Doctoral Dissertation, Technische Universität Darmstadt, Darmstadt, Germany, 2002. [Google Scholar]
- Augst, M.; Regan, M.; Benmimoun, M. Disentangling the effects of advanced driver assistance system functions in field operational tests: Recommendations from the European “euroFOT” project. In Proceedings of the 8th ITS European Congress, Lyon, France, 6–9 June 2011. [Google Scholar]
- Neukum, A.; Naujoks, F.; Kappes, S.; Wey, T. Kontrollierbarkeit unerwarteter Eingriffe eines Bremsassistenzsystems aus Perspektive des Folgeverkehrs. Conference: 9. In Proceedings of the Workshop Fahrerassistenzsysteme 2014; Uni-DAS e.V.: Walting, Germany, 2014. [Google Scholar] [CrossRef] [Scilit]
- Sontges, S.; Koschi, M.; Althoff, M. Worst-case Analysis of the Time-To-React Using Reachable Sets. In Proceedings of the 2018 IEEE Intelligent Vehicles Symposium (IV); IEEE: Piscataway, NJ, USA, 2018; pp. 1891–1897. [Google Scholar] [CrossRef] [Scilit]
- Coley, G.; Wesley, A.; Reed, N.; Parry, I. Driver Reaction Times to Familiar but Unexpected Events; Published Project Report PPR 313; IHS: Bracknell, UK, 2008. [Google Scholar]
- Bärgman, J.; Victor, T. Holistic assessment of driver assistance systems: How can systems be assessed with respect to how they impact glance behaviour and collision avoidance? IET Intell. Transp. Syst. 2020, 14, 1058–1067. [Google Scholar] [CrossRef] [Scilit]
- Seppelt, B.D.; Seaman, S.; Lee, J.; Angell, L.S.; Mehler, B.; Reimer, B. Glass half-full: On-road glance metrics differentiate crashes from near-crashes in the 100-Car data. Accid. Anal. Prev. 2017, 107, 48–62. [Google Scholar] [CrossRef] [Scilit] [PubMed]
- Fitch, G.; Soccolich, S.; Guo, F.; McClafferty, J.; Fang, Y.; Olson, R.; Pérez-Toledano, M.A.; Hanowski, R.J.; Hankey, J.; Dingus, T.A. The Impact of Hand-Held And Hands-Free Cell Phone Use on Driving Performance and Safety-Critical Event Risk; DOT HS 811 757; National Highway Traffic Safety Administration: Washington, DC, USA, 2013.
- Ulbrich, S.; Menzel, T.; Reschka, A.; Schuldt, F.; Maurer, M. Defining and Substantiating the Terms Scene, Situation, and Scenario for Automated Driving. In Proceedings of the Intelligent Transportation Systems Conference (ITSC); IEEE: Piscataway, NJ, USA, 2015; pp. 982–988. [Google Scholar] [CrossRef] [Scilit]
- Khan, M.Q.; Lee, S. A Comprehensive Survey of Driving Monitoring and Assistance Systems. Sensors 2019, 19, 2574. [Google Scholar] [CrossRef] [Scilit] [PubMed]
- Skokan, A. Field Testing of ADAS Technologies in Naturalistic Driving Conditions. Vehicles 2025, 7, 135. [Google Scholar] [CrossRef] [Scilit]
- Morando, A.; Victor, T.; Dozza, M. Drivers anticipate lead-vehicle conflicts during automated longitudinal control: Sensory cues capture driver attention and promote appropriate and timely responses. Accid. Anal. Prev. 2016, 97, 206–219. [Google Scholar] [CrossRef] [Scilit] [PubMed]
- Fridman, L.; Reimer, B.; Mehler, B.; Freeman, W.T. Cognitive Load Estimation in the Wild. In Proceedings of the Conference on Human Factors in Computing Systems (CHI); Mandryk, R., Hancock, M., Perry, M., Cox, A., Eds.; ACM: New York, NY, USA, 2018; pp. 1–9. [Google Scholar] [CrossRef] [Scilit]
- ISO 15007-1:2020; Road Vehicles—Measurement and Analysis of Driver Visual Behaviour with Respect to Transport Information and Control Systems. International Organization for Standardization (ISO): Geneva, Switzerland, 2020.
- Lee, J.D.; Moeckli, J.; Brown, T.L.; Roberts, S.C.; Schwarz, C.; Yekhshatyan, L.; Nadler, E.; Liang, Y.; Victor, T.; Marshall, D. NHTSA Report: Distraction Detection and Mitigation Through Driver Feedback Appendices; National Highway Traffic Safety Administration: Washington, DC, USA, 2013.
- Alam, M.R.; Batabyal, D.; Yang, K.; Brijs, T.; Antoniou, C. Application of naturalistic driving data: A systematic review and bibliometric analysis. Accid. Anal. Prev. 2023, 190, 107155. [Google Scholar] [CrossRef] [Scilit] [PubMed]
- Morando, A.; Victor, T.; Dozza, M. A Reference Model for Driver Attention in Automation: Glance Behavior Changes During Lateral and Longitudinal Assistance. IEEE Trans. Intell. Transp. Syst. 2019, 20, 2999–3009. [Google Scholar] [CrossRef] [Scilit]
- Endsley, M. Theoretical Underpinnings of Situation Awareness: A Critical Review. In Situation Awareness Analysis and Measurement; Lawrence Erlbaum Associates: Mahwah, NJ, USA, 2000; pp. 3–33. [Google Scholar]
- Zhang, Z.; Yang, L.; Lv, C. Highly Discriminative Driver Distraction Detection Method Based on Swin Transformer. Vehicles 2024, 6, 140–156. [Google Scholar] [CrossRef] [Scilit]
- Huang, A.; Derakhshan, S.; Madrid-Carvajal, J.; Nosrat Nezami, F.; Wächter, M.A.; Pipa, G.; König, P. Enhancing Safety in Autonomous Vehicles: The Impact of Auditory and Visual Warning Signals on Driver Behavior and Situational Awareness. Vehicles 2024, 6, 1613–1636. [Google Scholar] [CrossRef] [Scilit]
- Pauwelussen, J.; Feenstra, P.J. Driver Behavior Analysis During ACC Activation and Deactivation in a Real Traffic Environment. IEEE Trans. Intell. Transp. Syst. 2010, 11, 329–338. [Google Scholar] [CrossRef] [Scilit]
- Shirpour, M.; Khairdoost, N.; Bauer, M.A.; Beauchemin, S.S. Traffic Object Detection and Recognition Based on the Attentional Visual Field of Drivers. IEEE Trans. Intell. Veh. 2023, 8, 594–604. [Google Scholar] [CrossRef] [Scilit]
- Karim, M.M.; Yin, Z.; Qin, R. An Attention-Guided Multistream Feature Fusion Network for Early Localization of Risky Traffic Agents in Driving Videos. IEEE Trans. Intell. Veh. 2024, 9, 1792–1803. [Google Scholar] [CrossRef] [Scilit]
- Kwakye, K.; Seong, Y.; Yi, S.; Aboah, A. DriveSAM: Cognitive Perspective on Driving Maneuvers Based on Drivers’ Attention Using Eye Gaze Data. In Proceedings of the International Conference on Industrial Engineering and Operations Management; IEOM Society International: Southfield, MI, USA, 2023. [Google Scholar] [CrossRef] [Scilit]
- Tijerina, L. Driver Eye Glance Behavior During Car Following on the Road. In SAE Technical Paper Series; SAE International: Warrendale, PA, USA, 1999. [Google Scholar] [CrossRef] [Scilit]
- Khattak, Z.H.; Li, W.; Karnowski, T.; Khattak, A.J. The role of driver head pose dynamics and instantaneous driving in safety critical events: Application of computer vision in naturalistic driving. Accid. Anal. Prev. 2024, 200, 107545. [Google Scholar] [CrossRef] [Scilit] [PubMed]
- Tivesten, E.; Victor, T.; Morando, A. The timecourse of driver visual attention in naturalistic driving with adaptive cruise control and forward collision. In Proceedings of the 4th International Driver Distraction and Inattention Conference; ARRB Group Ltd.: Sydney, Australia, 2015. [Google Scholar]
- Chen, J.; Zhang, Q.; Chen, J.; Wang, J.; Fang, Z.; Liu, Y.; Yin, G. A Driving Risk Assessment Framework Considering Driver’s Fatigue State and Distraction Behavior. IEEE Trans. Intell. Transp. Syst. 2024, 25, 20120–20136. [Google Scholar] [CrossRef] [Scilit]
- Junietz, P.; Schneider, J.; Winner, H. Metrik zur Bewertung der Kritikalität von Verkehrssituationen und -szenarien. In Workshop Fahrerassistenzsysteme und Automatisiertes Fahren, 11th ed.; Junietz, P., Ed.; Uni-DAS e.V.: Darmstadt, Germany, 2017. [Google Scholar]
- Epple, N.; Dari, S.; Riener, A. Probabilistic Time-To-Collision: Correlation of Driver Gaze and Surrounding Objects. In Proceedings of the Vehicular Technology Conference (VTC2020-Fall); IEEE: New York, NY, USA, 2020. [Google Scholar] [CrossRef] [Scilit]
- Handbook of Driver Assistance Systems: Basic Information, Components and Systems for Active Safety and Comfort; Winner, H., Hakuli, S., Lotz, F., Singer, C., Eds.; Springer International Publishing: Basel, Switzerland; Cham, Switzerland, 2016. [Google Scholar] [CrossRef] [Scilit]
- Rößger, E.; Zehle, H. Vorgang und Terminologie der Raumfahrzeug Führung. In Forschungsberichte des Landes Nordrhein-Westfalen 1258; VS Verlag für Sozialwissenschaften: Wiesbaden, Germany, 1963. [Google Scholar] [CrossRef] [Scilit]
- Dozza, M.; Bärgman, J.; Lee, J.D. Chunking: A procedure to improve naturalistic data analysis. Accid. Anal. Prev. 2013, 58, 309–317. [Google Scholar] [CrossRef] [Scilit] [PubMed]
- Wang, X.; Yang, M.; Hurwitz, D. Analysis of cut-in behavior based on naturalistic driving data. Accid. Anal. Prev. 2019, 124, 127–137. [Google Scholar] [CrossRef] [Scilit] [PubMed]
- Benmimoun, M.; Eckstein, L. Detection of Critical Driving Situations for Naturalistic Driving Studies by Means of an Automated Process. J. Intell. Transp. Urban Plan. 2014, 2, 11–21. [Google Scholar] [CrossRef] [Scilit]
- Neumann, T. Analysis of Advanced Driver-Assistance Systems for Safe and Comfortable Driving of Motor Vehicles. Sensors 2024, 24, 6223. [Google Scholar] [CrossRef] [Scilit] [PubMed]
- Gogola, M.; Ondruš, J. Enhancement of ADAS with Driver-Specific Gaze Profiling Algorithm—Pilot Case Study. Vehicles 2025, 7, 145. [Google Scholar] [CrossRef] [Scilit]
- Dari, S.; Kadrileev, N.; Hullermeier, E. A Neural-Network-Based Driver Gaze Classification System with Vehicle Signals. In Proceedings of the International Joint Conference on Neural Networks (IJCNN), Glasgow, UK, 19–24 July 2020; pp. 1–7. [Google Scholar] [CrossRef] [Scilit]
- Epple, N.; Chopra, H.; Riener, A. How Do Drivers Observe Surrounding Vehicles in Real-World Traffic? Estimating the Drivers Primary Observed Traffic Objects. In Proceedings of the Intelligent Vehicles Symposium (IV); IEEE: Piscataway, NJ, USA, 2021; pp. 594–601. [Google Scholar] [CrossRef] [Scilit]
- Schneider, J.S. Modellierung und Erkennung von Fahrsituationen und Fahrmanövern Fuer Sicherheitsrelevante Fahrerassistenzsysteme. Doctoral Dissertation, Chemnitz University of Technology, Chemnitz, Germany, 2010. [Google Scholar]
- Kudarauskas, N. Analysis of Emergency Braking of a Vehicle. Transport 2007, 22, 154–159. [Google Scholar] [CrossRef] [Scilit]
- Coe, R. It’s the effect size, stupid: What effect size is and why it is important. In Proceedings of the British Educational Research Association Annual Conference, Exeter, UK, 12–14 September 2002. [Google Scholar]
- Gründl, M. Fehler und Fehlverhalten als Ursache von Verkehrsunfällen und Konsequenzen für das Unfallvermeidungspotenzial und die Gestaltung von Fahrerassistenzsystemen. Doctoral Dissertation, University of Regensburg, Regensburg, Germany, 2005. [Google Scholar] [CrossRef]
- Rehder, T.; Muenst, W.; Louis, L.; Schramm, D. Learning lane change intentions through lane contentedness estimation from demonstrated driving. In Proceedings of the 2016 IEEE 19th International Conference on Intelligent Transportation Systems (ITSC); IEEE: Piscataway, NJ, USA, 2016; pp. 893–898. [Google Scholar] [CrossRef] [Scilit]
- Rodemerk, C.; Habenicht, S.; Weitzel, A.; Schmitt, T.; Winner, H. Development of a general criticality criterion for the risk estimation of driving situations and its application to a maneuver-based lane change assistance system: 2012 Intelligent Vehicles Symposium Alcalá de Henares, Spain, 3–7 June 2012. In Proceedings of the 2012 IEEE Intelligent Vehicles Symposium; IEEE: Piscataway, NJ, USA, 2012; pp. 264–269. [Google Scholar] [CrossRef] [Scilit]
- McCall, J.C.; Wipf, D.P.; Trivedi, M.M.; Rao, B.D. Lane Change Intent Analysis Using Robust Operators and Sparse Bayesian Learning. IEEE Trans. Intell. Transp. Syst. 2007, 8, 431–440. [Google Scholar] [CrossRef] [Scilit]
- Fridman, L.; Brown, D.; Kindelsberger, J.; Angell, L.; Mehler, B.; Reimer, B. Human Side of Tesla Autopilot Exploration of Functional Vigilance in Real World Human Machine Collaboration; MIT-AVT Study: Cambridge, MA, USA, 2019. [Google Scholar]
- Shashua, A.; Shalev-Shwartz, S. A Plan to Develop Safe Autonomous Vehicles. And Prove It; Mobileye: Jerusalem, Israel, 2017. [Google Scholar]
- Gaspar, J.; Carney, C. The Effect of Partial Automation on Driver Attention: A Naturalistic Driving Study. Hum. Factors 2019, 61, 1261–1276. [Google Scholar] [CrossRef] [Scilit] [PubMed]
- Victor, T.; Dozza, M.; Bärgman, J.; Boda, C.-N.; Engström, J.; Flannagan, C.; Lee, J.D.; Markkula, G. Analysis of Naturalistic Driving Study Data: Safer Glances, Driver Inattention, and Crash Risk; Transportation Research Board: Washington, DC, USA, 2014. [Google Scholar] [CrossRef] [Scilit] [PubMed]
- Yang, B.; Inoue, K.; Yan, Z.; Wang, Z.; Kitazaki, S.; Nakano, K. Influences of Level 2 Automated Driving on Driver Behaviors: A Comparison With Manual Driving. IEEE Trans. Intell. Transp. Syst. 2024, 25, 144–158. [Google Scholar] [CrossRef] [Scilit]
- Morando, A.; Gershon, P.; Mehler, B.; Reimer, B. Driver-initiated Tesla Autopilot Disengagements in Naturalistic Driving. In Proceedings of the 12th International Conference on Automotive User Interfaces and Interactive Vehicular Applications; ACM: New York, NY, USA, 2020; pp. 57–65. [Google Scholar] [CrossRef] [Scilit]
- Feldhütter, A.; Gold, C.; Schneider, S.; Bengler, K. How the Duration of Automated Driving Influences Take-Over Performance and Gaze Behavior. In Advances in Ergonomic Design of Systems, Products and Processes; Schlick, C.M., Duckwitz, S., Flemisch, F., Frenz, M., Kuz, S., Mertens, A., Mütze-Niewöhner, S., Eds.; Springer: Berlin/Heidelberg, Germany, 2017; pp. 309–318. [Google Scholar] [CrossRef] [Scilit]
- Klauer, S.; Dingus, T.A.; Neale, T.V.; Sudweeks, J.; Ramsey, D.J. The Impact of Driver Inattention On Near Crash/Crash Risk: An Analysis Using the 100-Car Naturalistic Driving Study Data; Department of Transportation: Washington, DC, USA, 2006.
- Lappi, O.; Rinkkala, P.; Pekkanen, J. Systematic Observation of an Expert Driver’s Gaze Strategy-An On-Road Case Study. Front. Psychol. 2017, 8, 620. [Google Scholar] [CrossRef] [Scilit] [PubMed]
- Martin, S.; Vora, S.; Yuen, K.; Trivedi, M.M. Dynamics of Driver’s Gaze Explorations in Behavior Modeling and Maneuver Prediction. IEEE Trans. Intell. Veh. 2018, 3, 141–150. [Google Scholar] [CrossRef] [Scilit]
- Xing, Y.; Lv, C.; Wang, H.; Wang, H.; Ai, Y.; Cao, D.; Velenis, E.; Wang, F.-Y. Driver Lane Change Intention Inference for Intelligent Vehicles: Framework, Survey, and Challenges. IEEE Trans. Veh. Technol. 2019, 68, 4377–4390. [Google Scholar] [CrossRef] [Scilit]
- Mori, M.; Miyajima, C.; Angkititrakul, P.; Hirayama, T.; Li, Y.; Kitaoka, N.; Takeda, K. Measuring driver awareness based on correlation between gaze behavior and risks of surrounding vehicles. In Proceedings of the Conference on Intelligent Transportation Systems (ITSC); IEEE: Piscataway, NJ, USA, 2012; pp. 644–647. [Google Scholar] [CrossRef] [Scilit]
- Hayashi, H.; Kamezaki, M.; Manawadu, U.E.; Kawano, T.; Ema, T.; Tomita, T.; Catherine, L.; Sugano, S. A Driver Situational Awareness Estimation System Based on Standard Glance Model for Unscheduled Takeover Situations. In Proceedings of the Intelligent Vehicles Symposium (IV); IEEE: Piscataway, NJ, USA, 2019; pp. 798–803. [Google Scholar] [CrossRef] [Scilit]
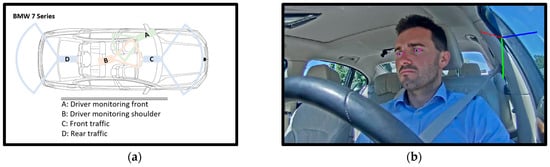
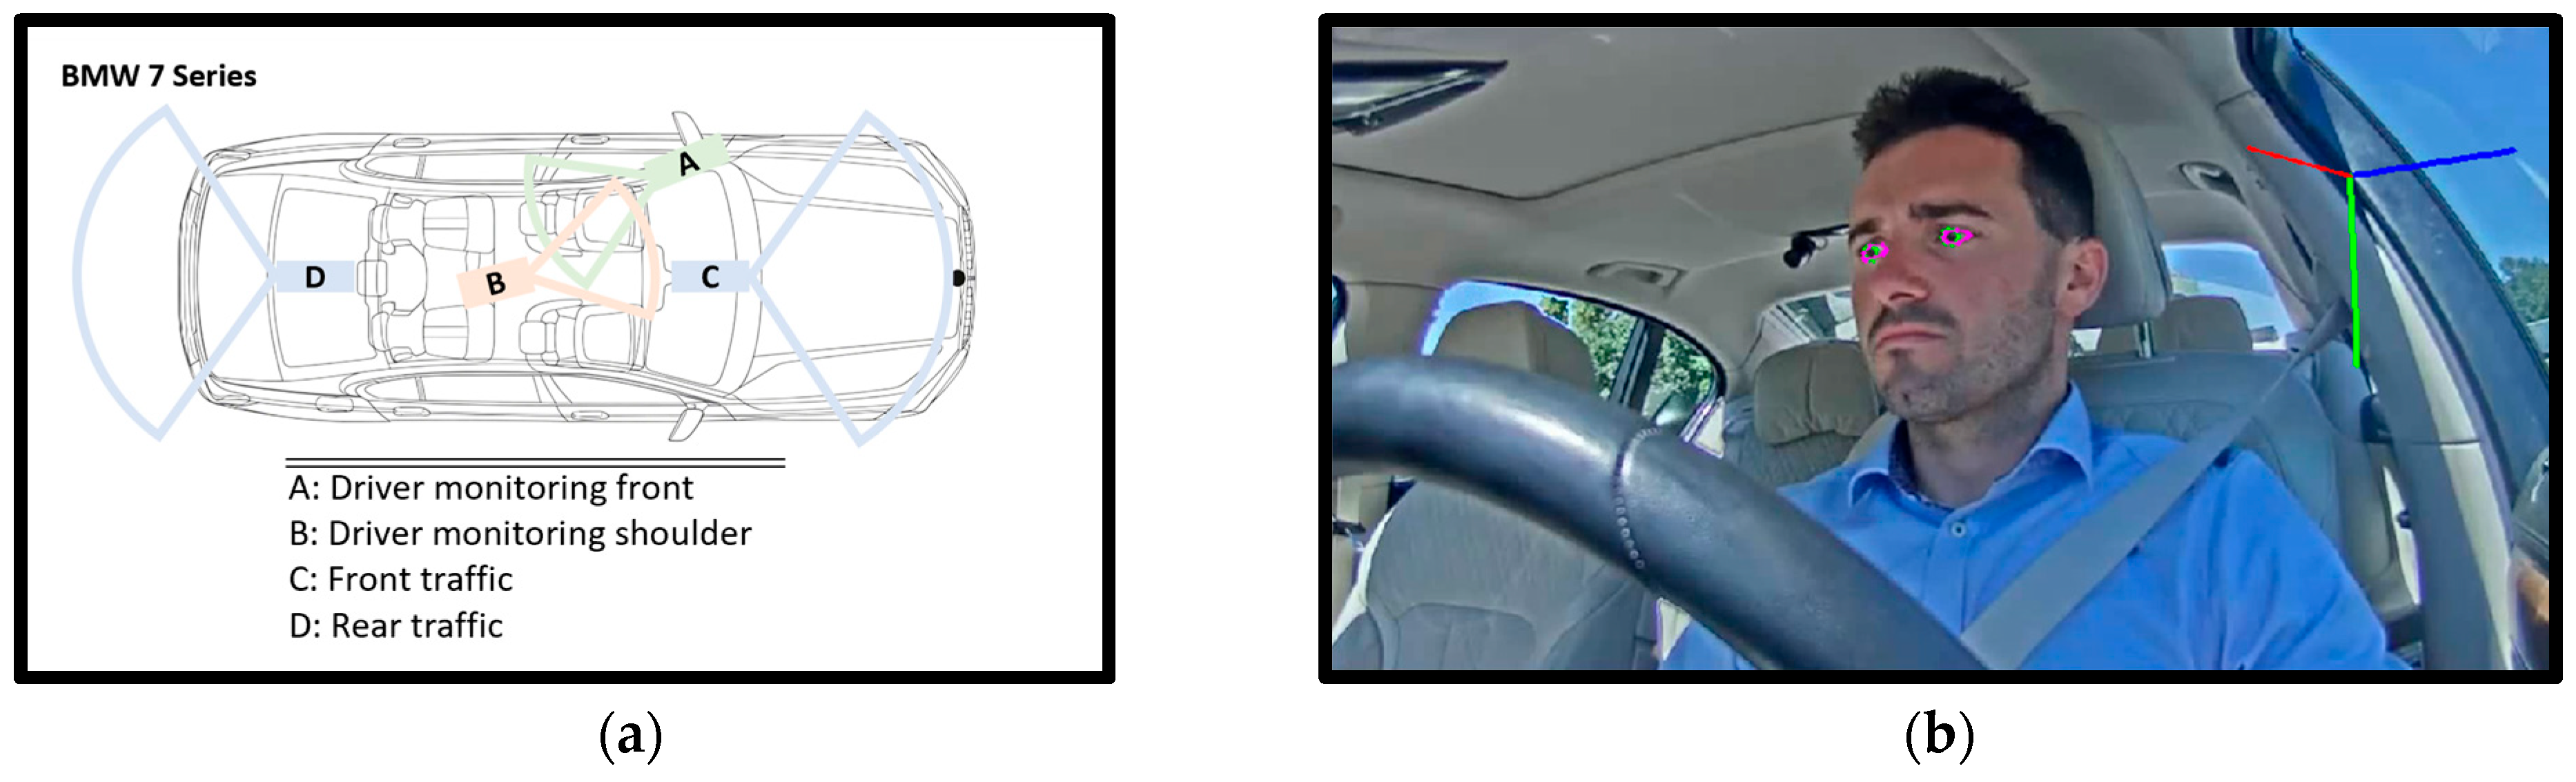
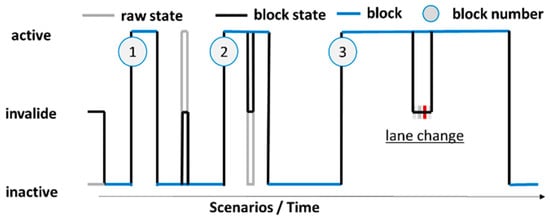
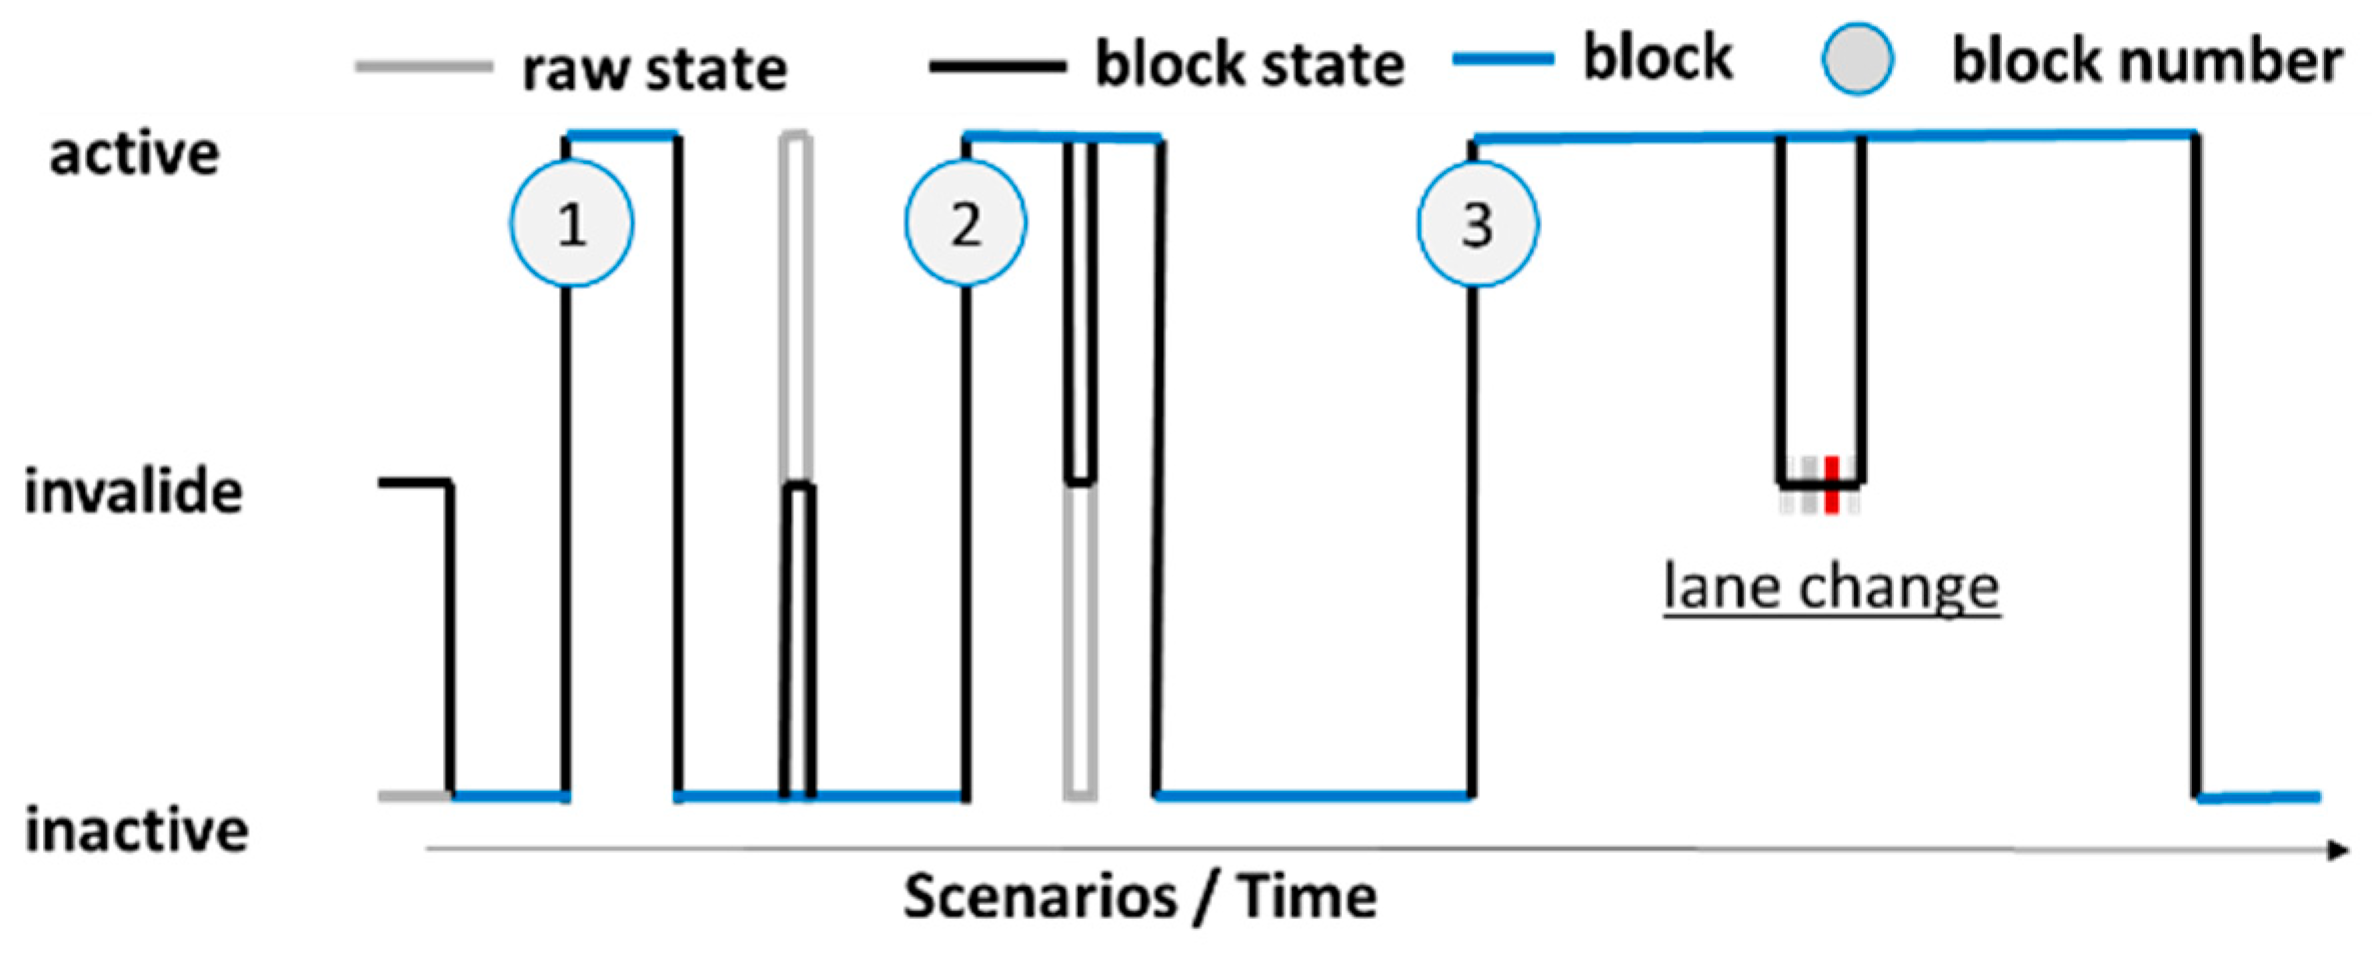
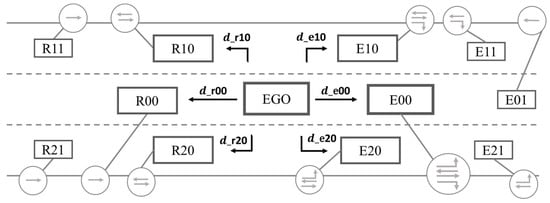
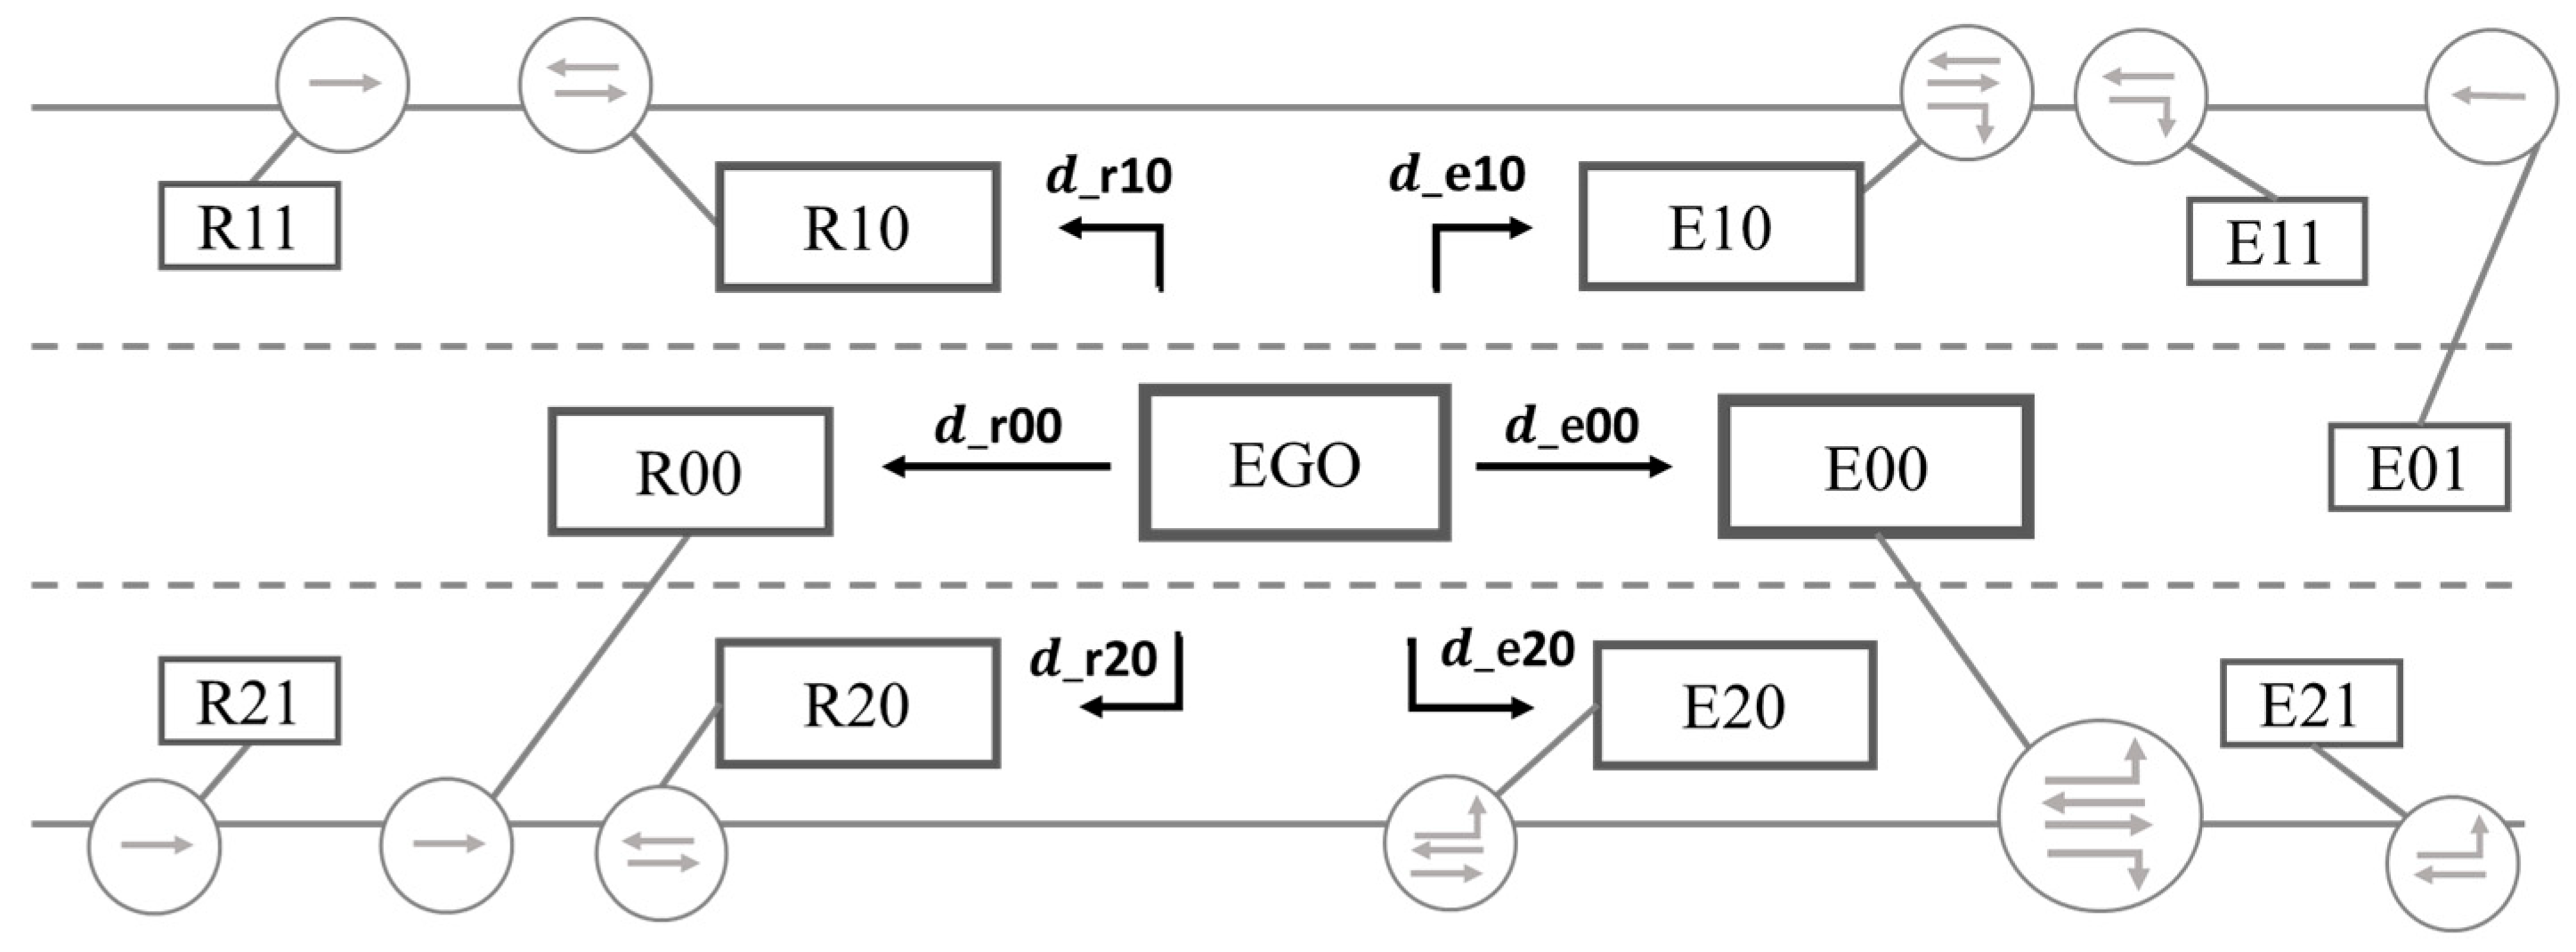
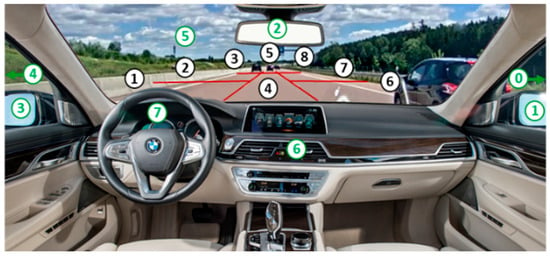
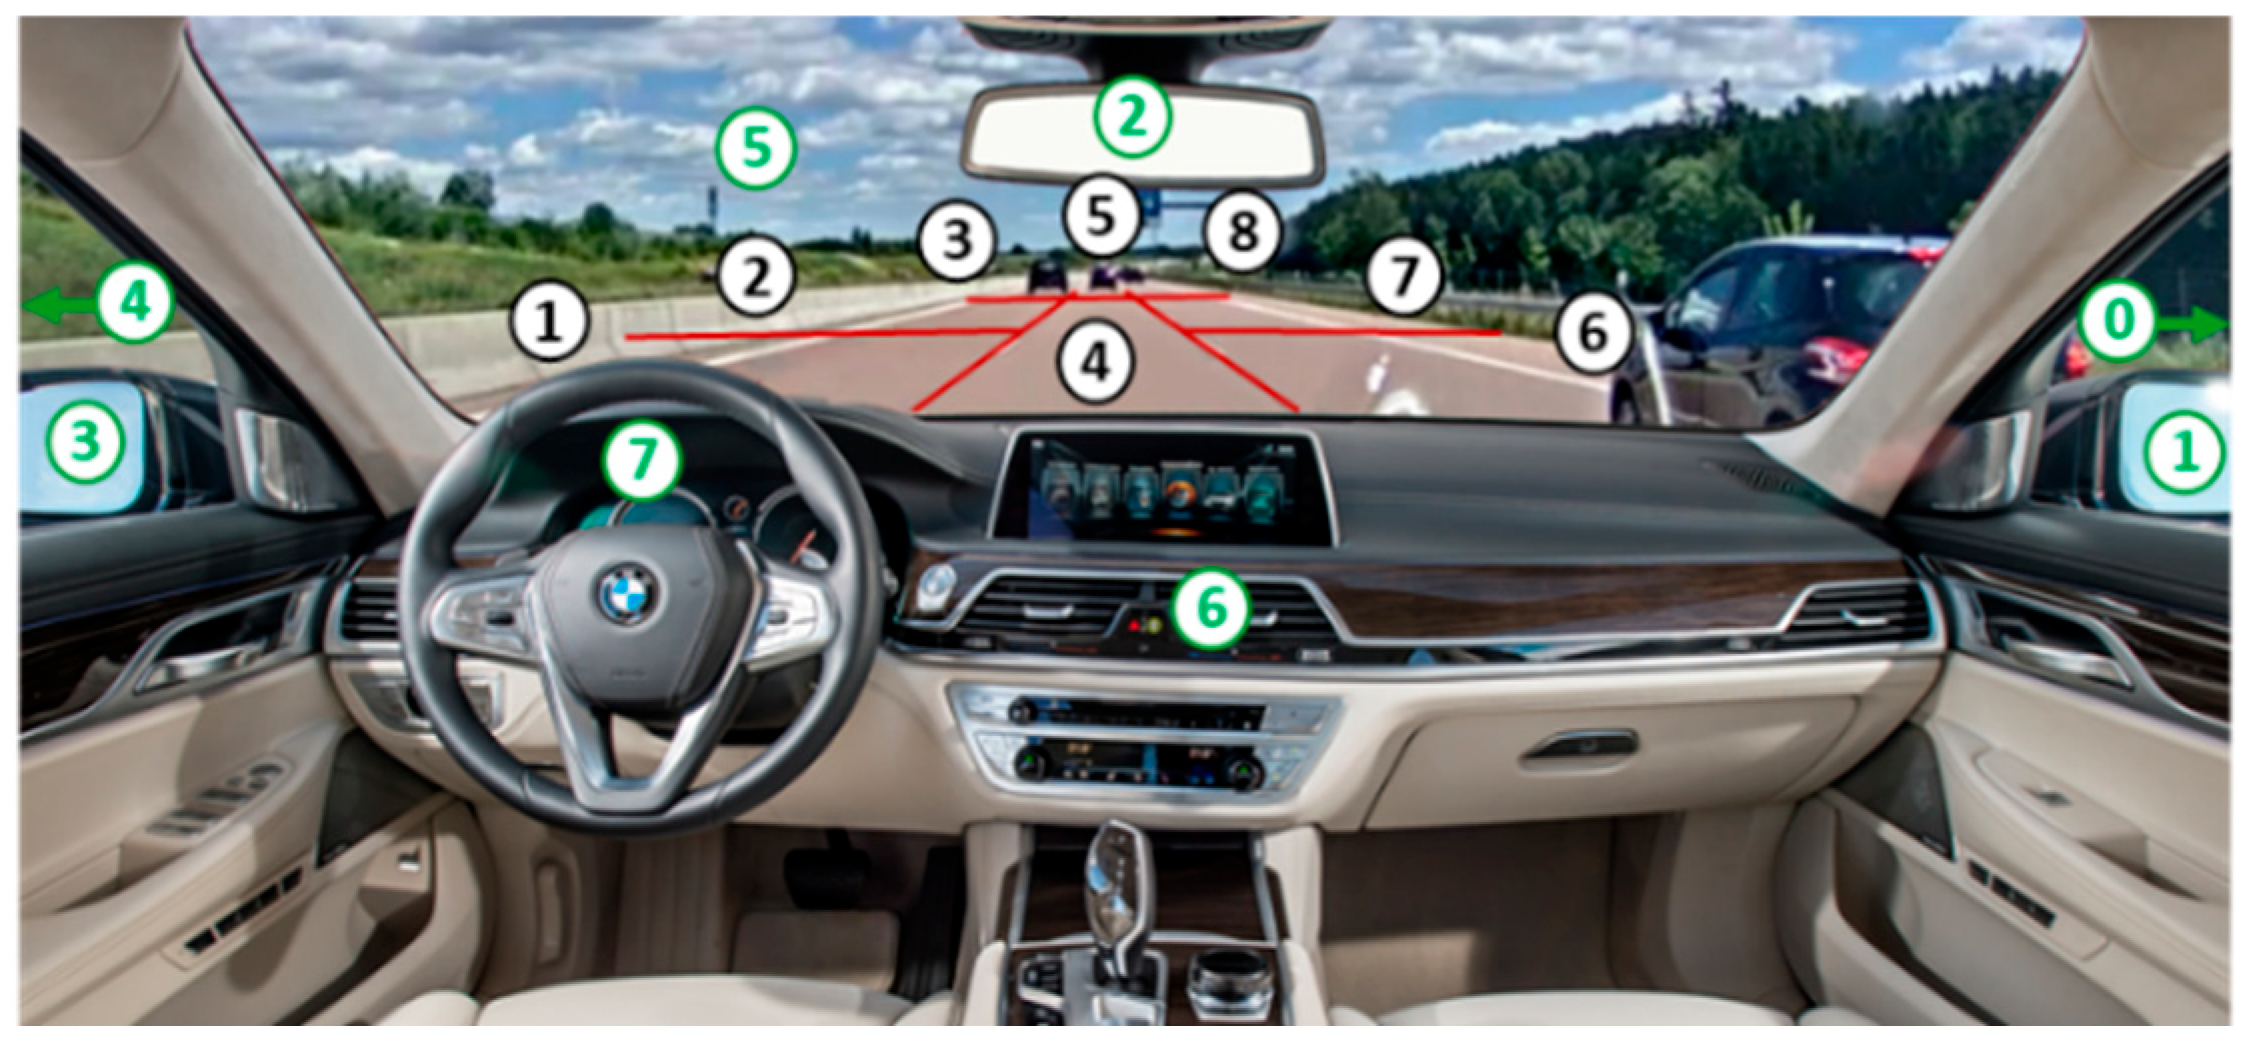
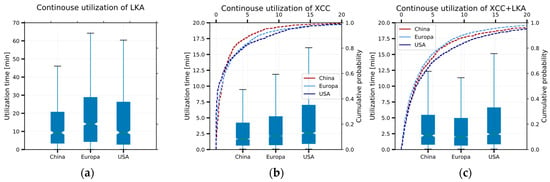
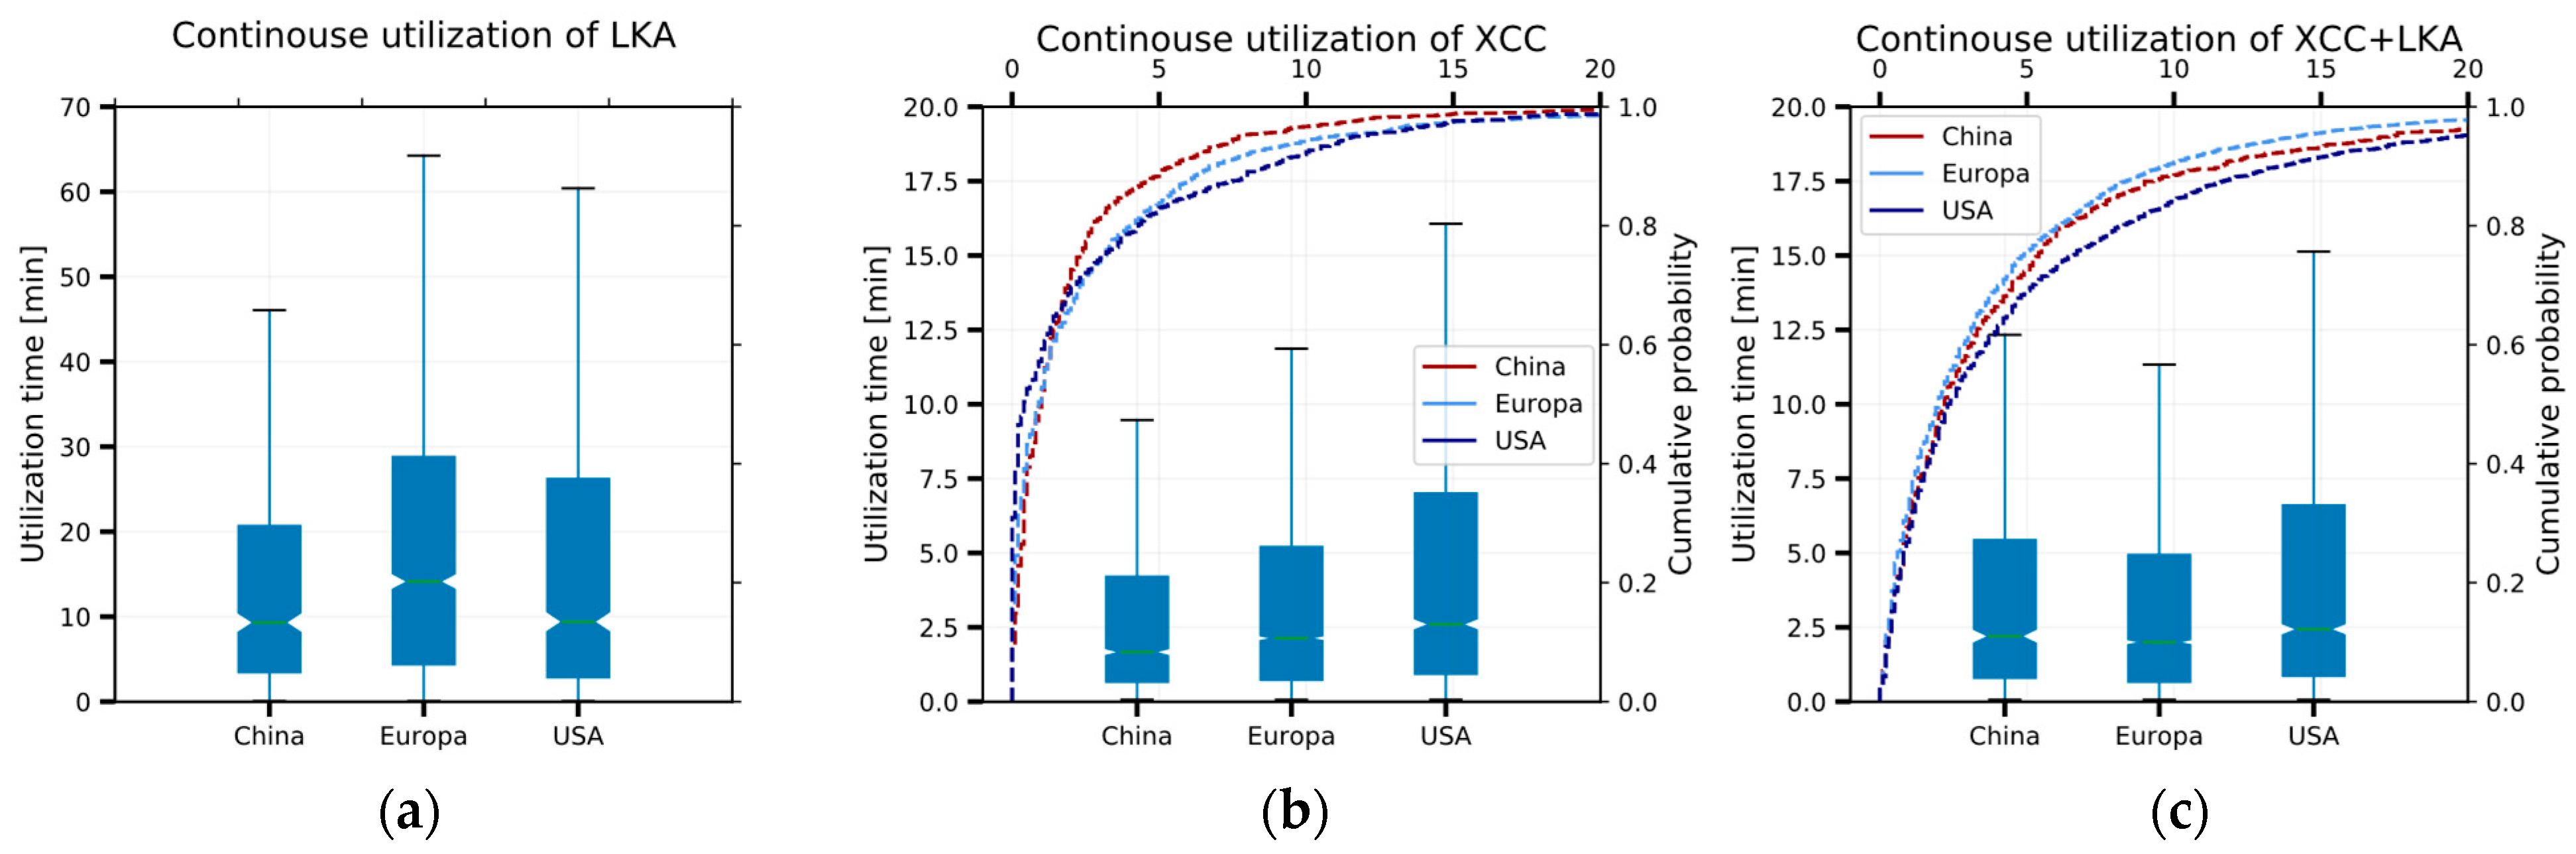
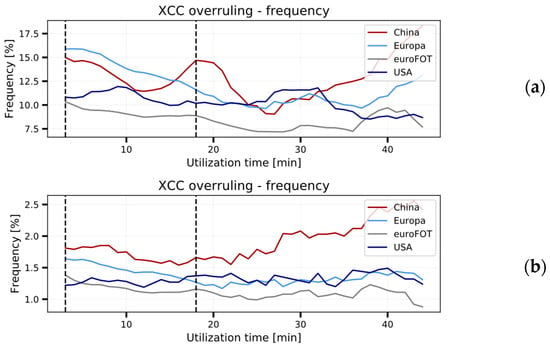
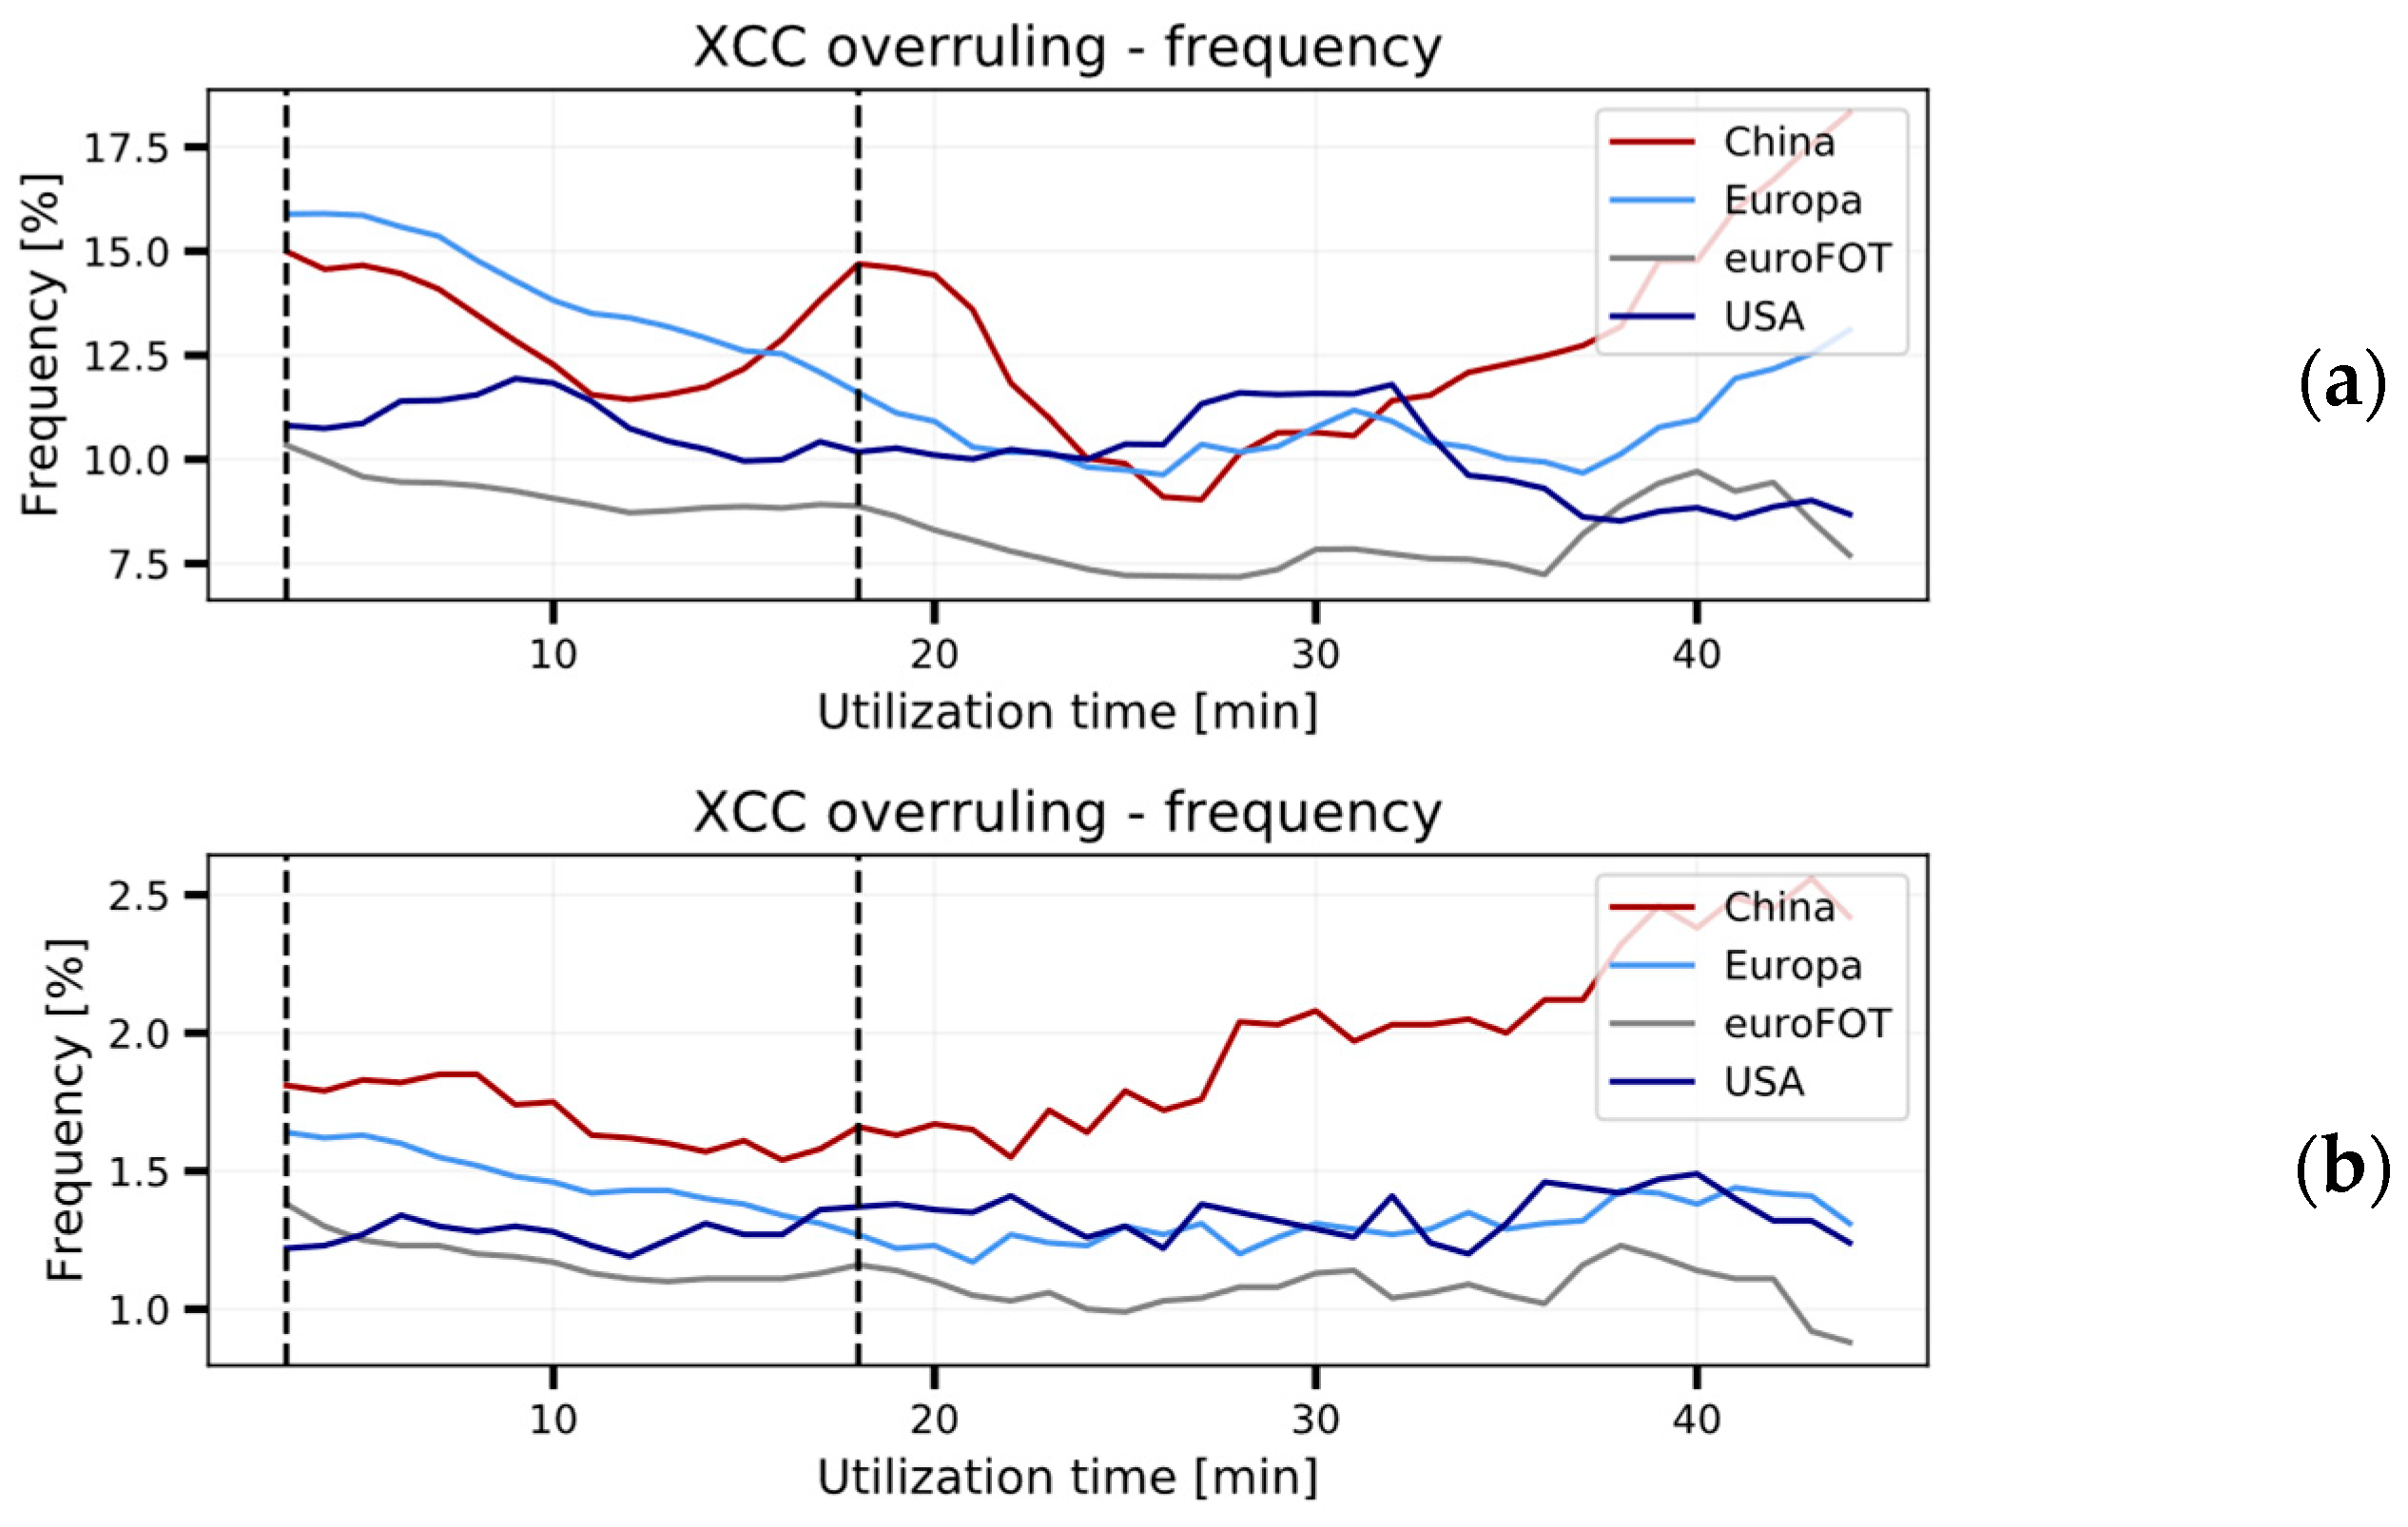
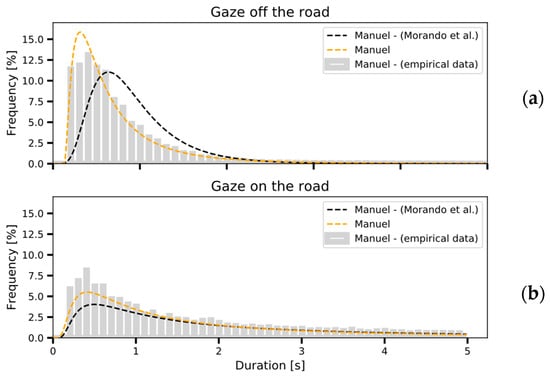
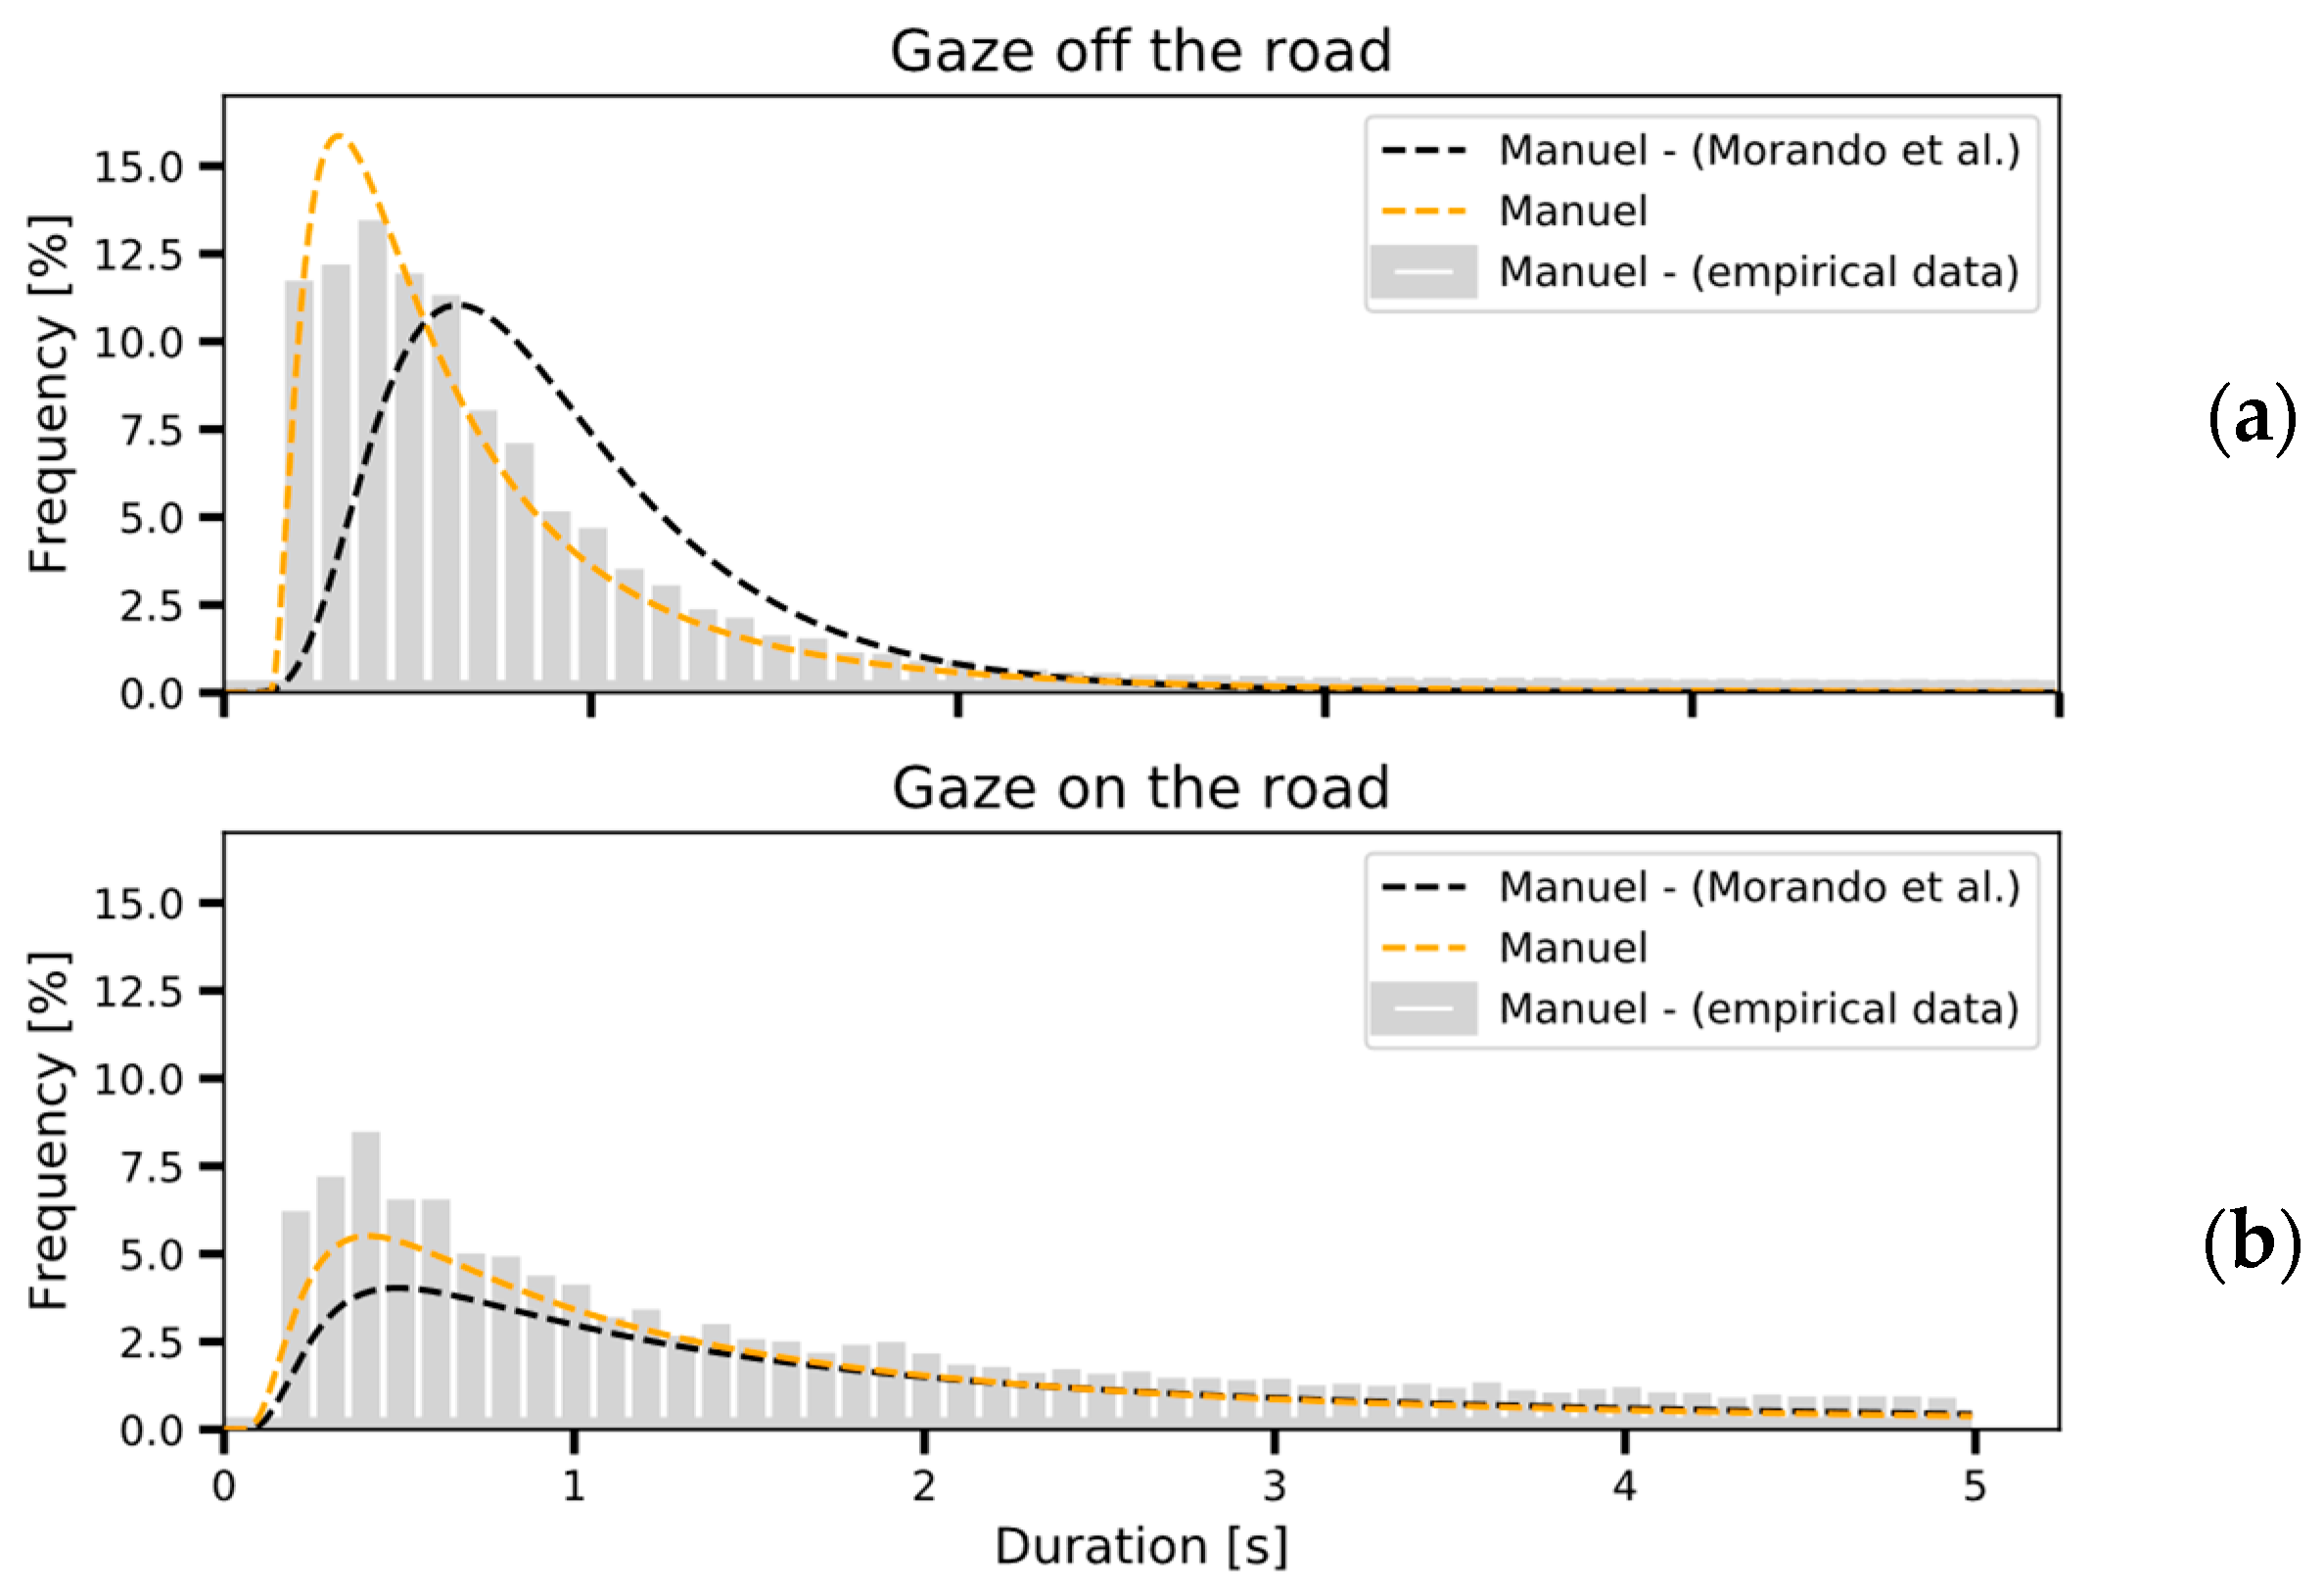
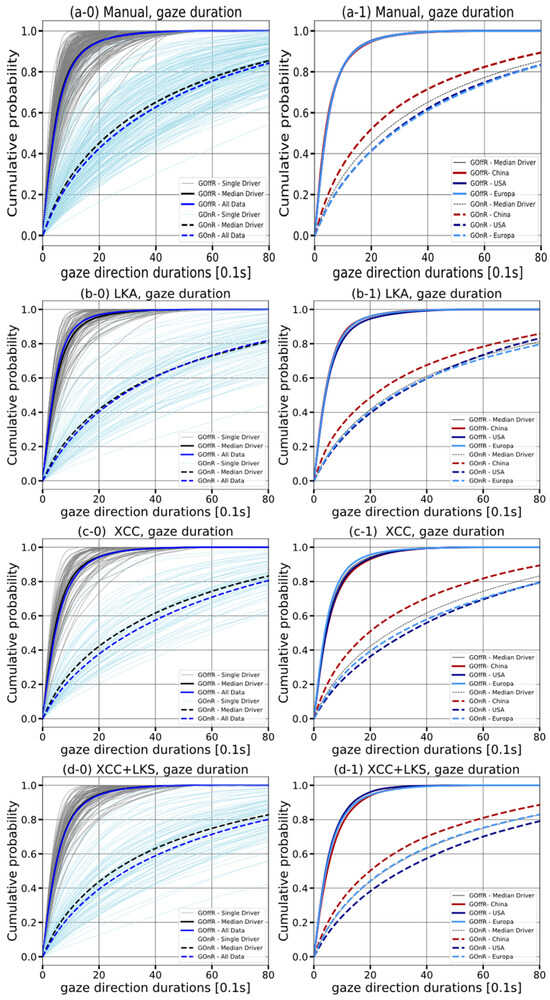
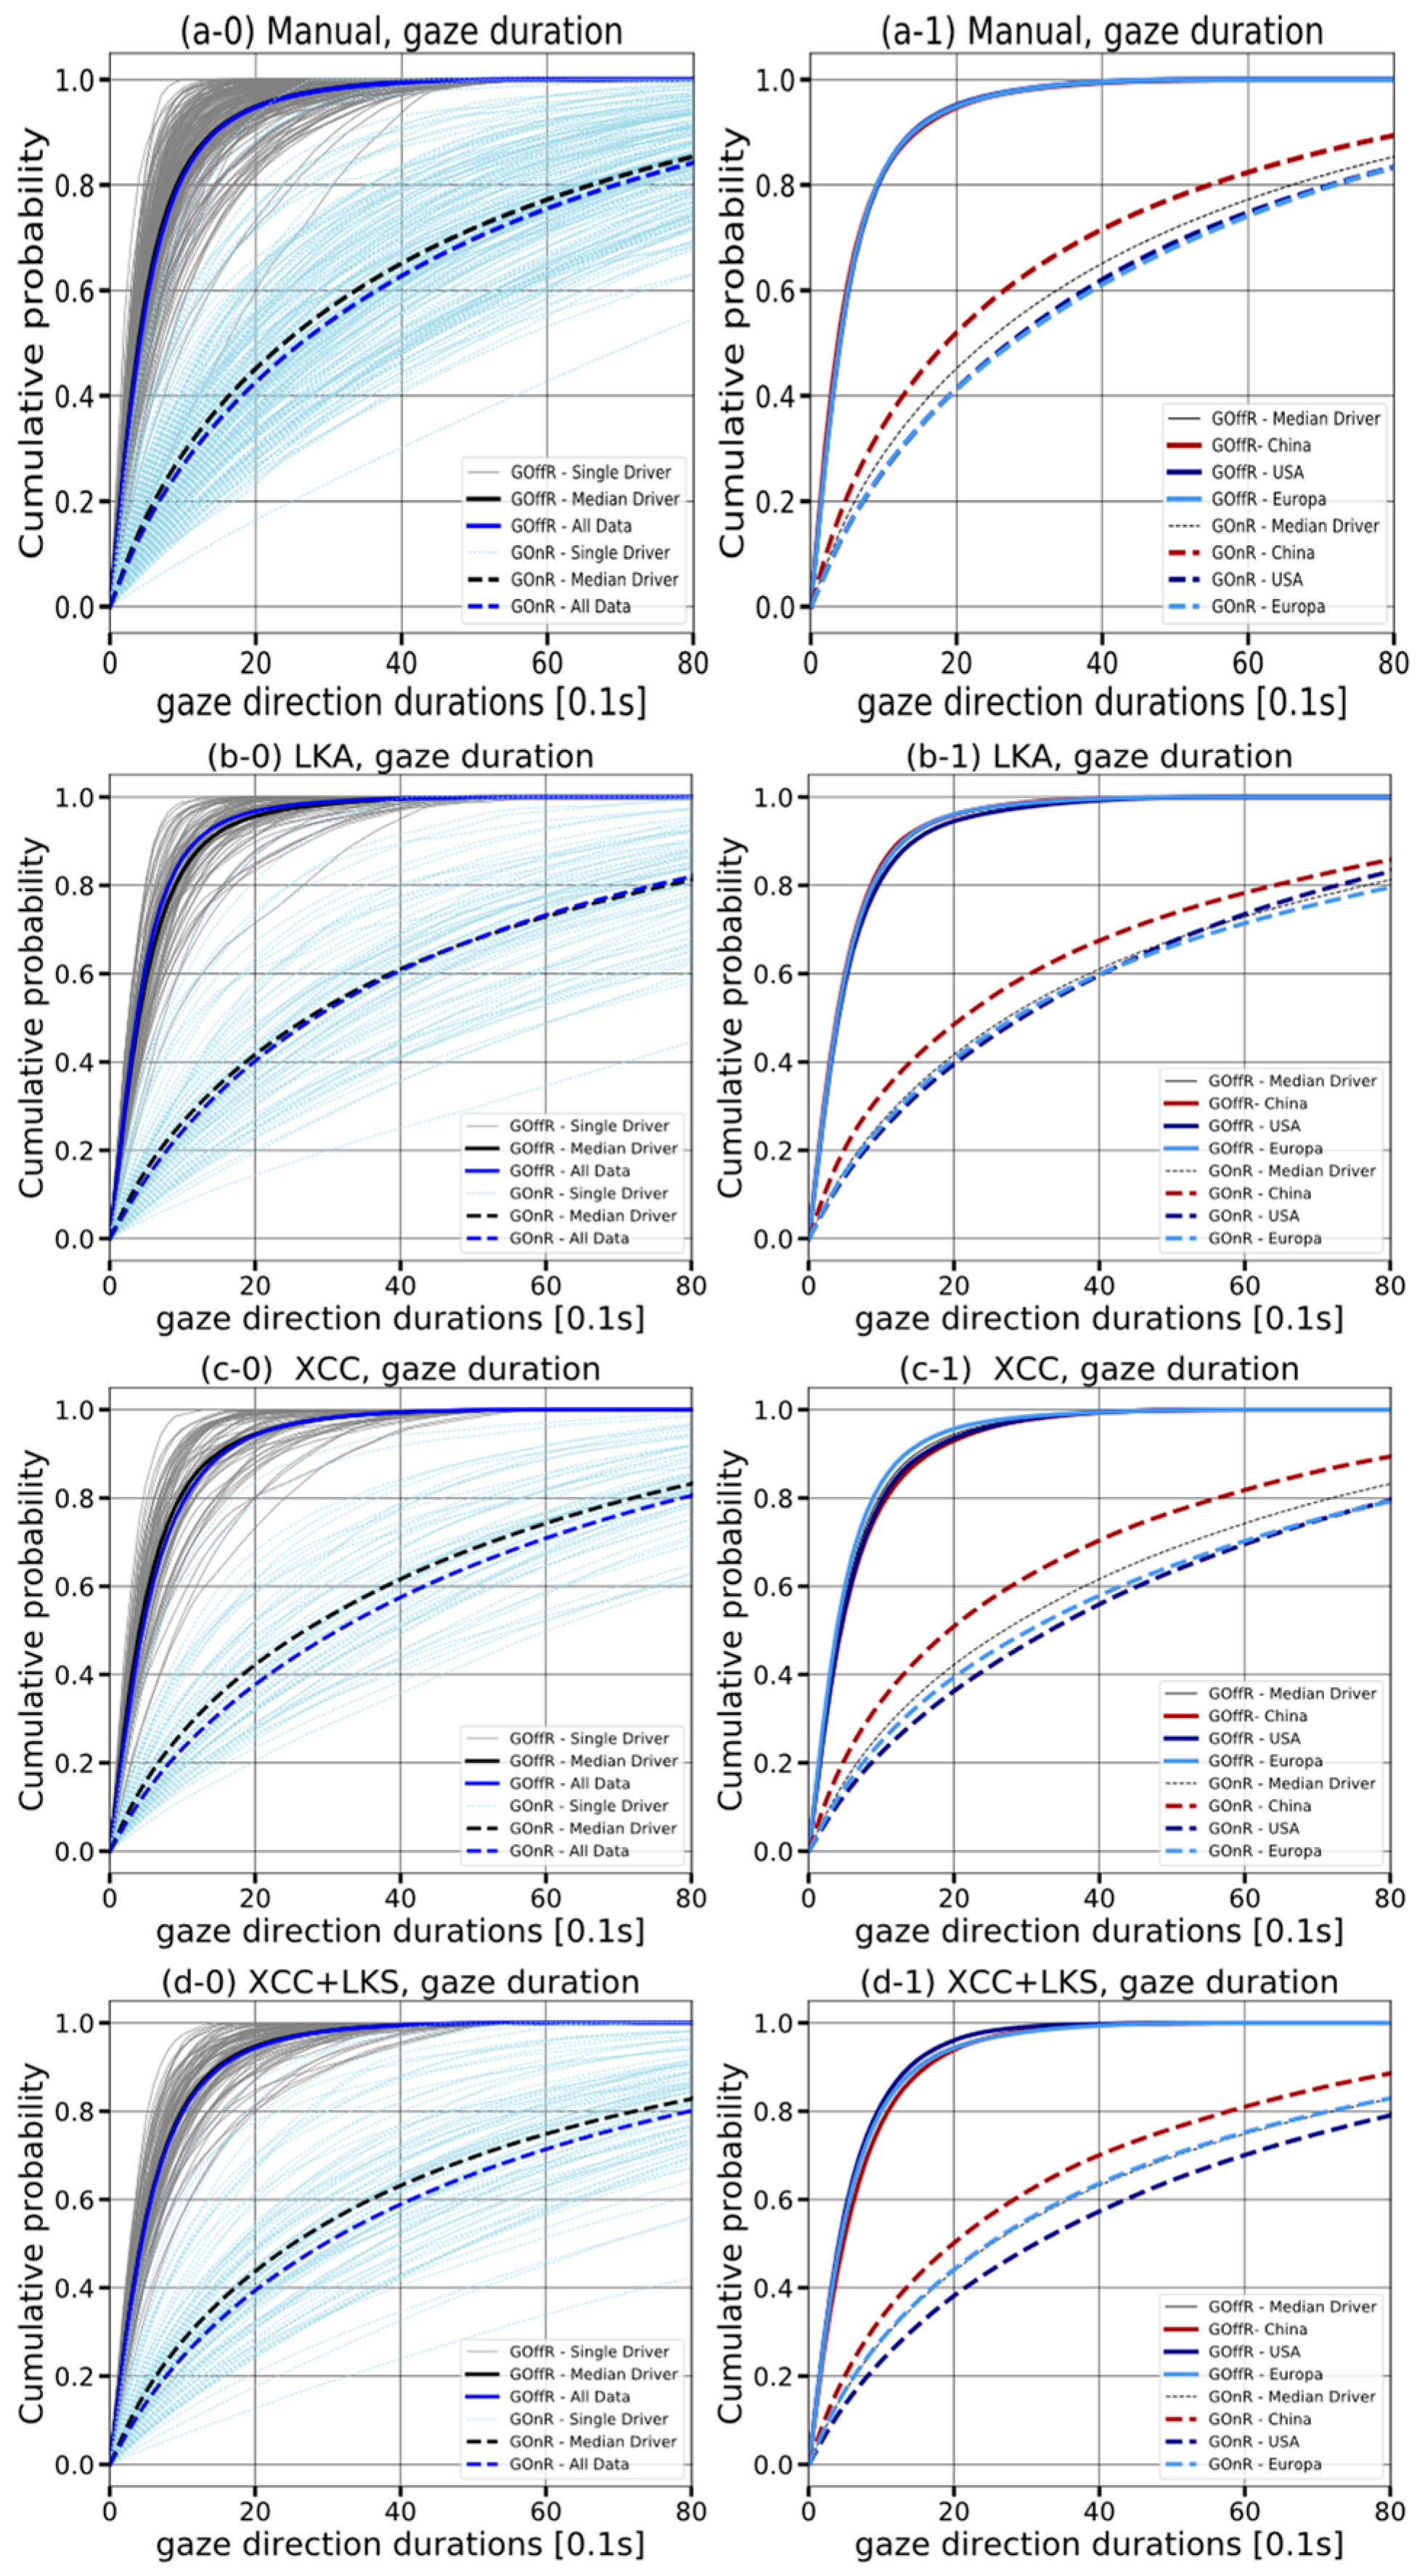
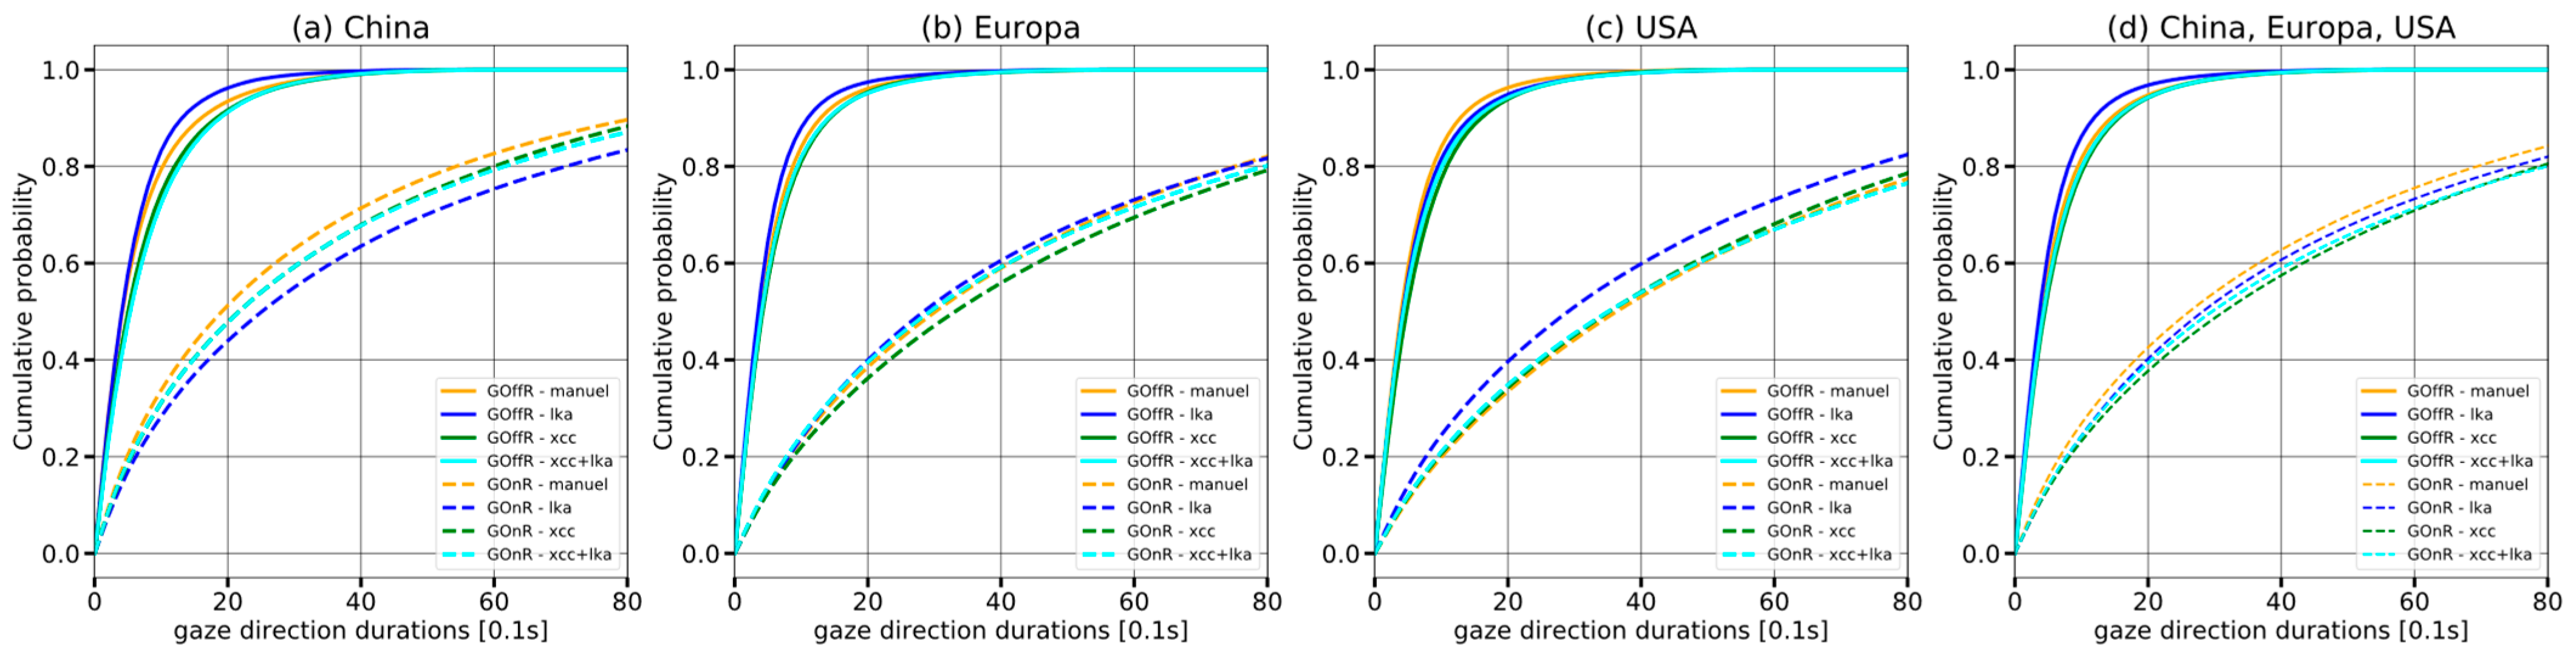
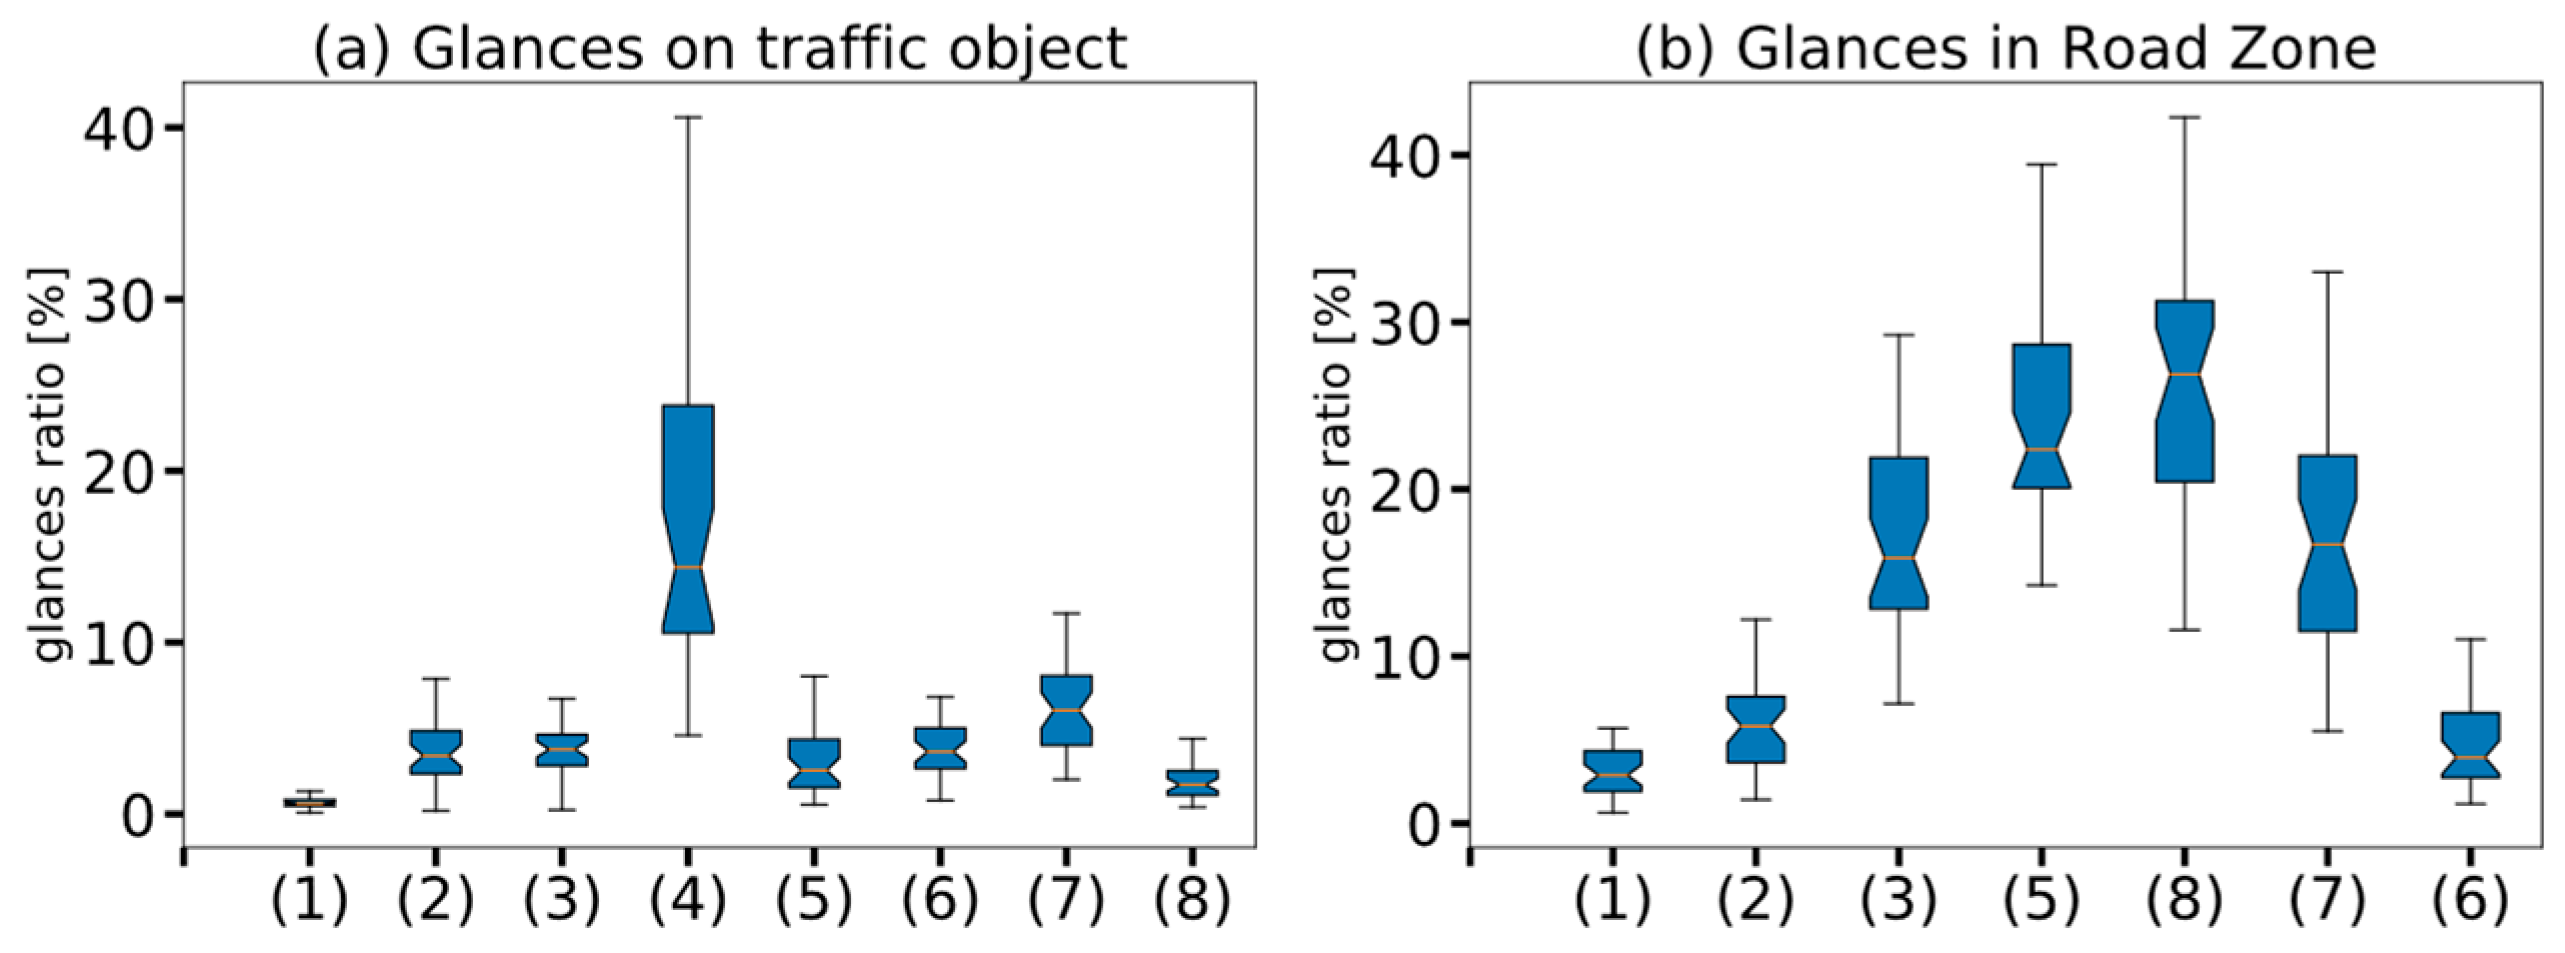
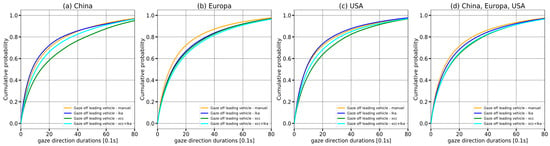
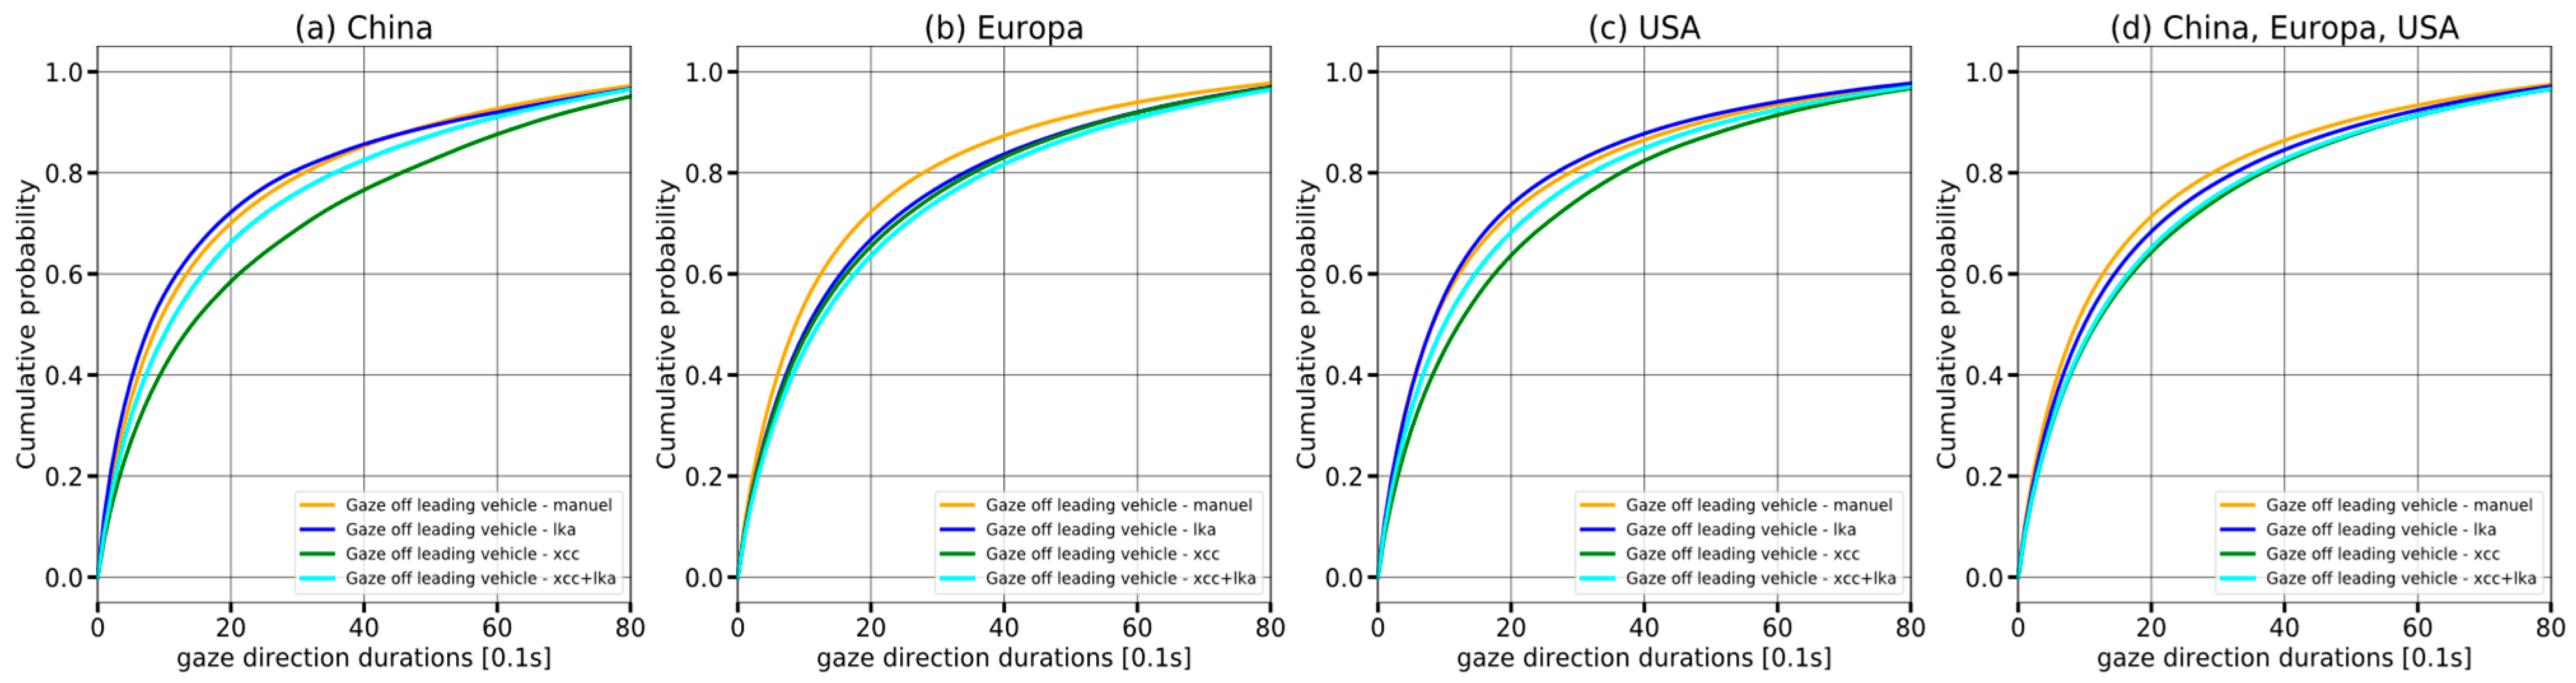
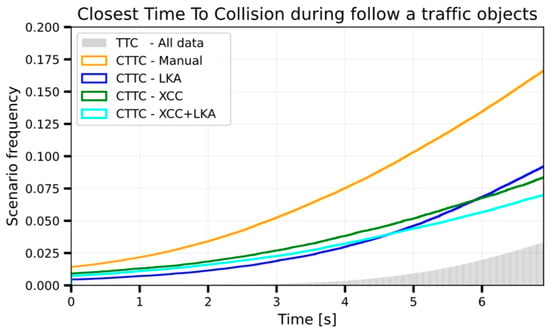
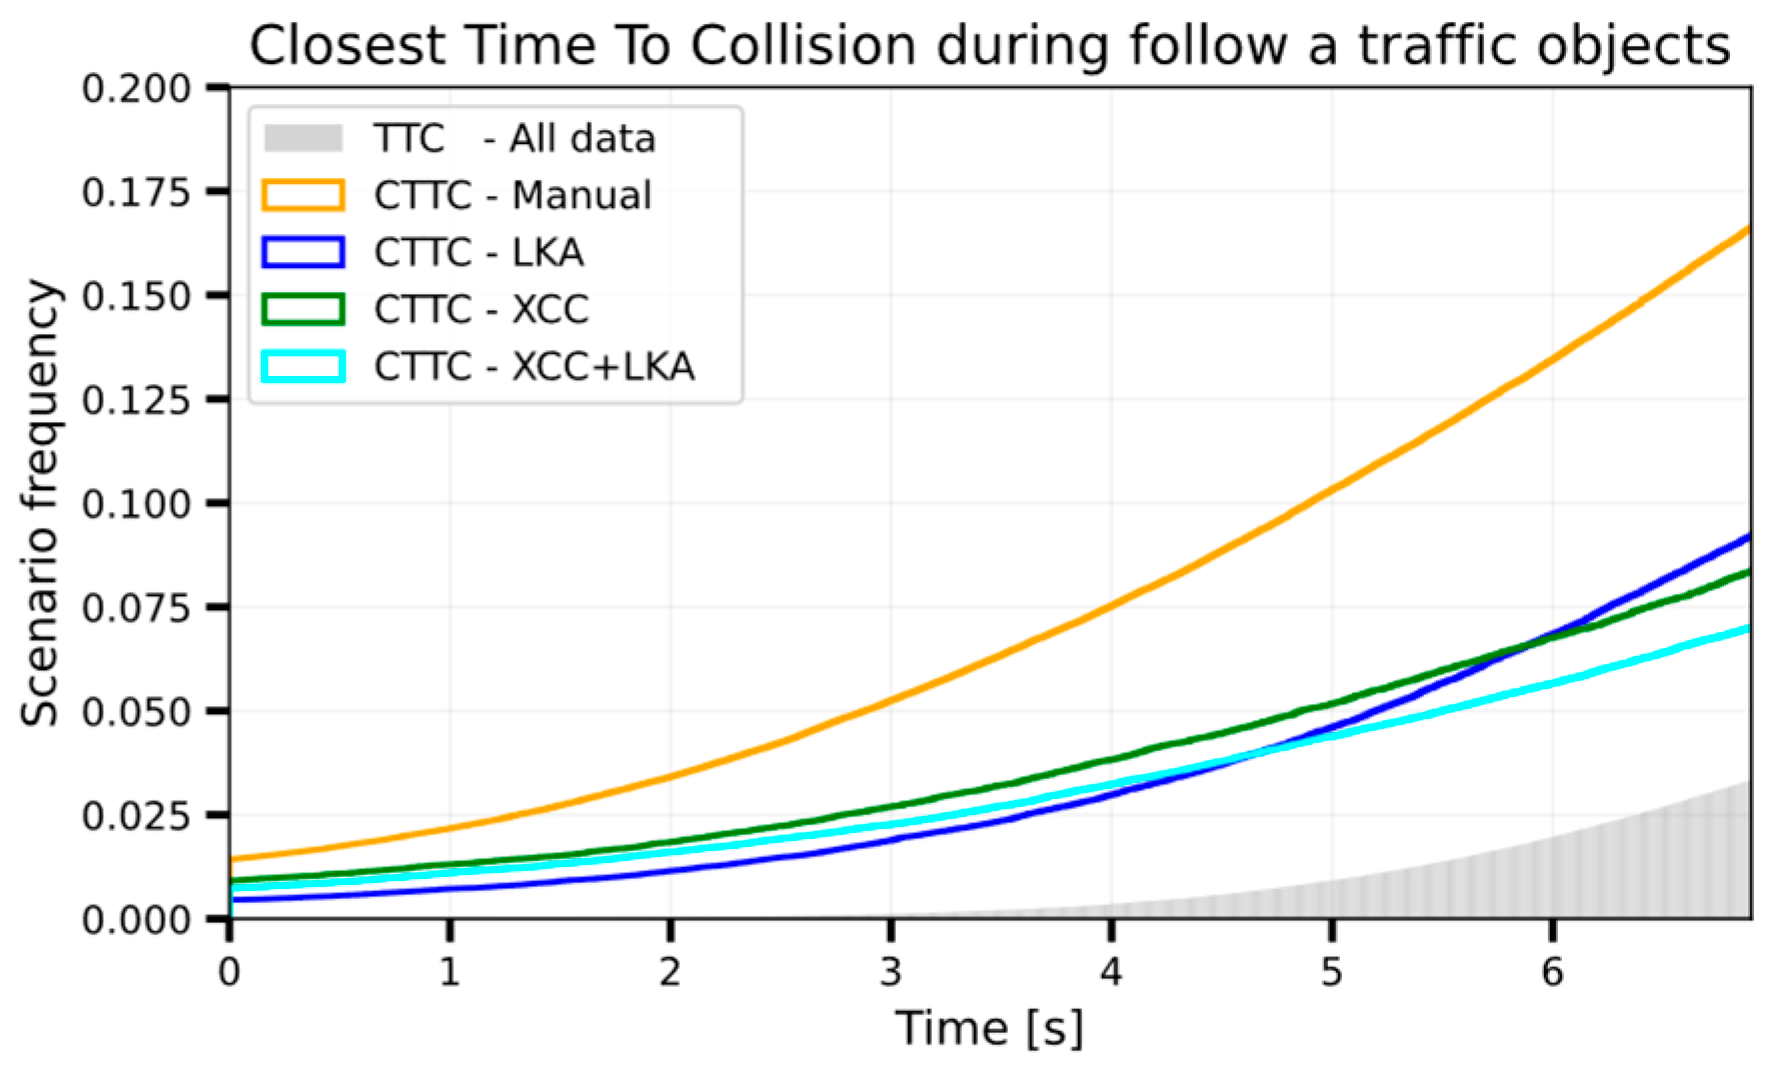
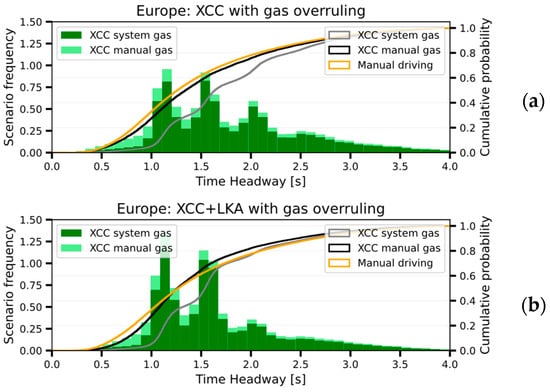
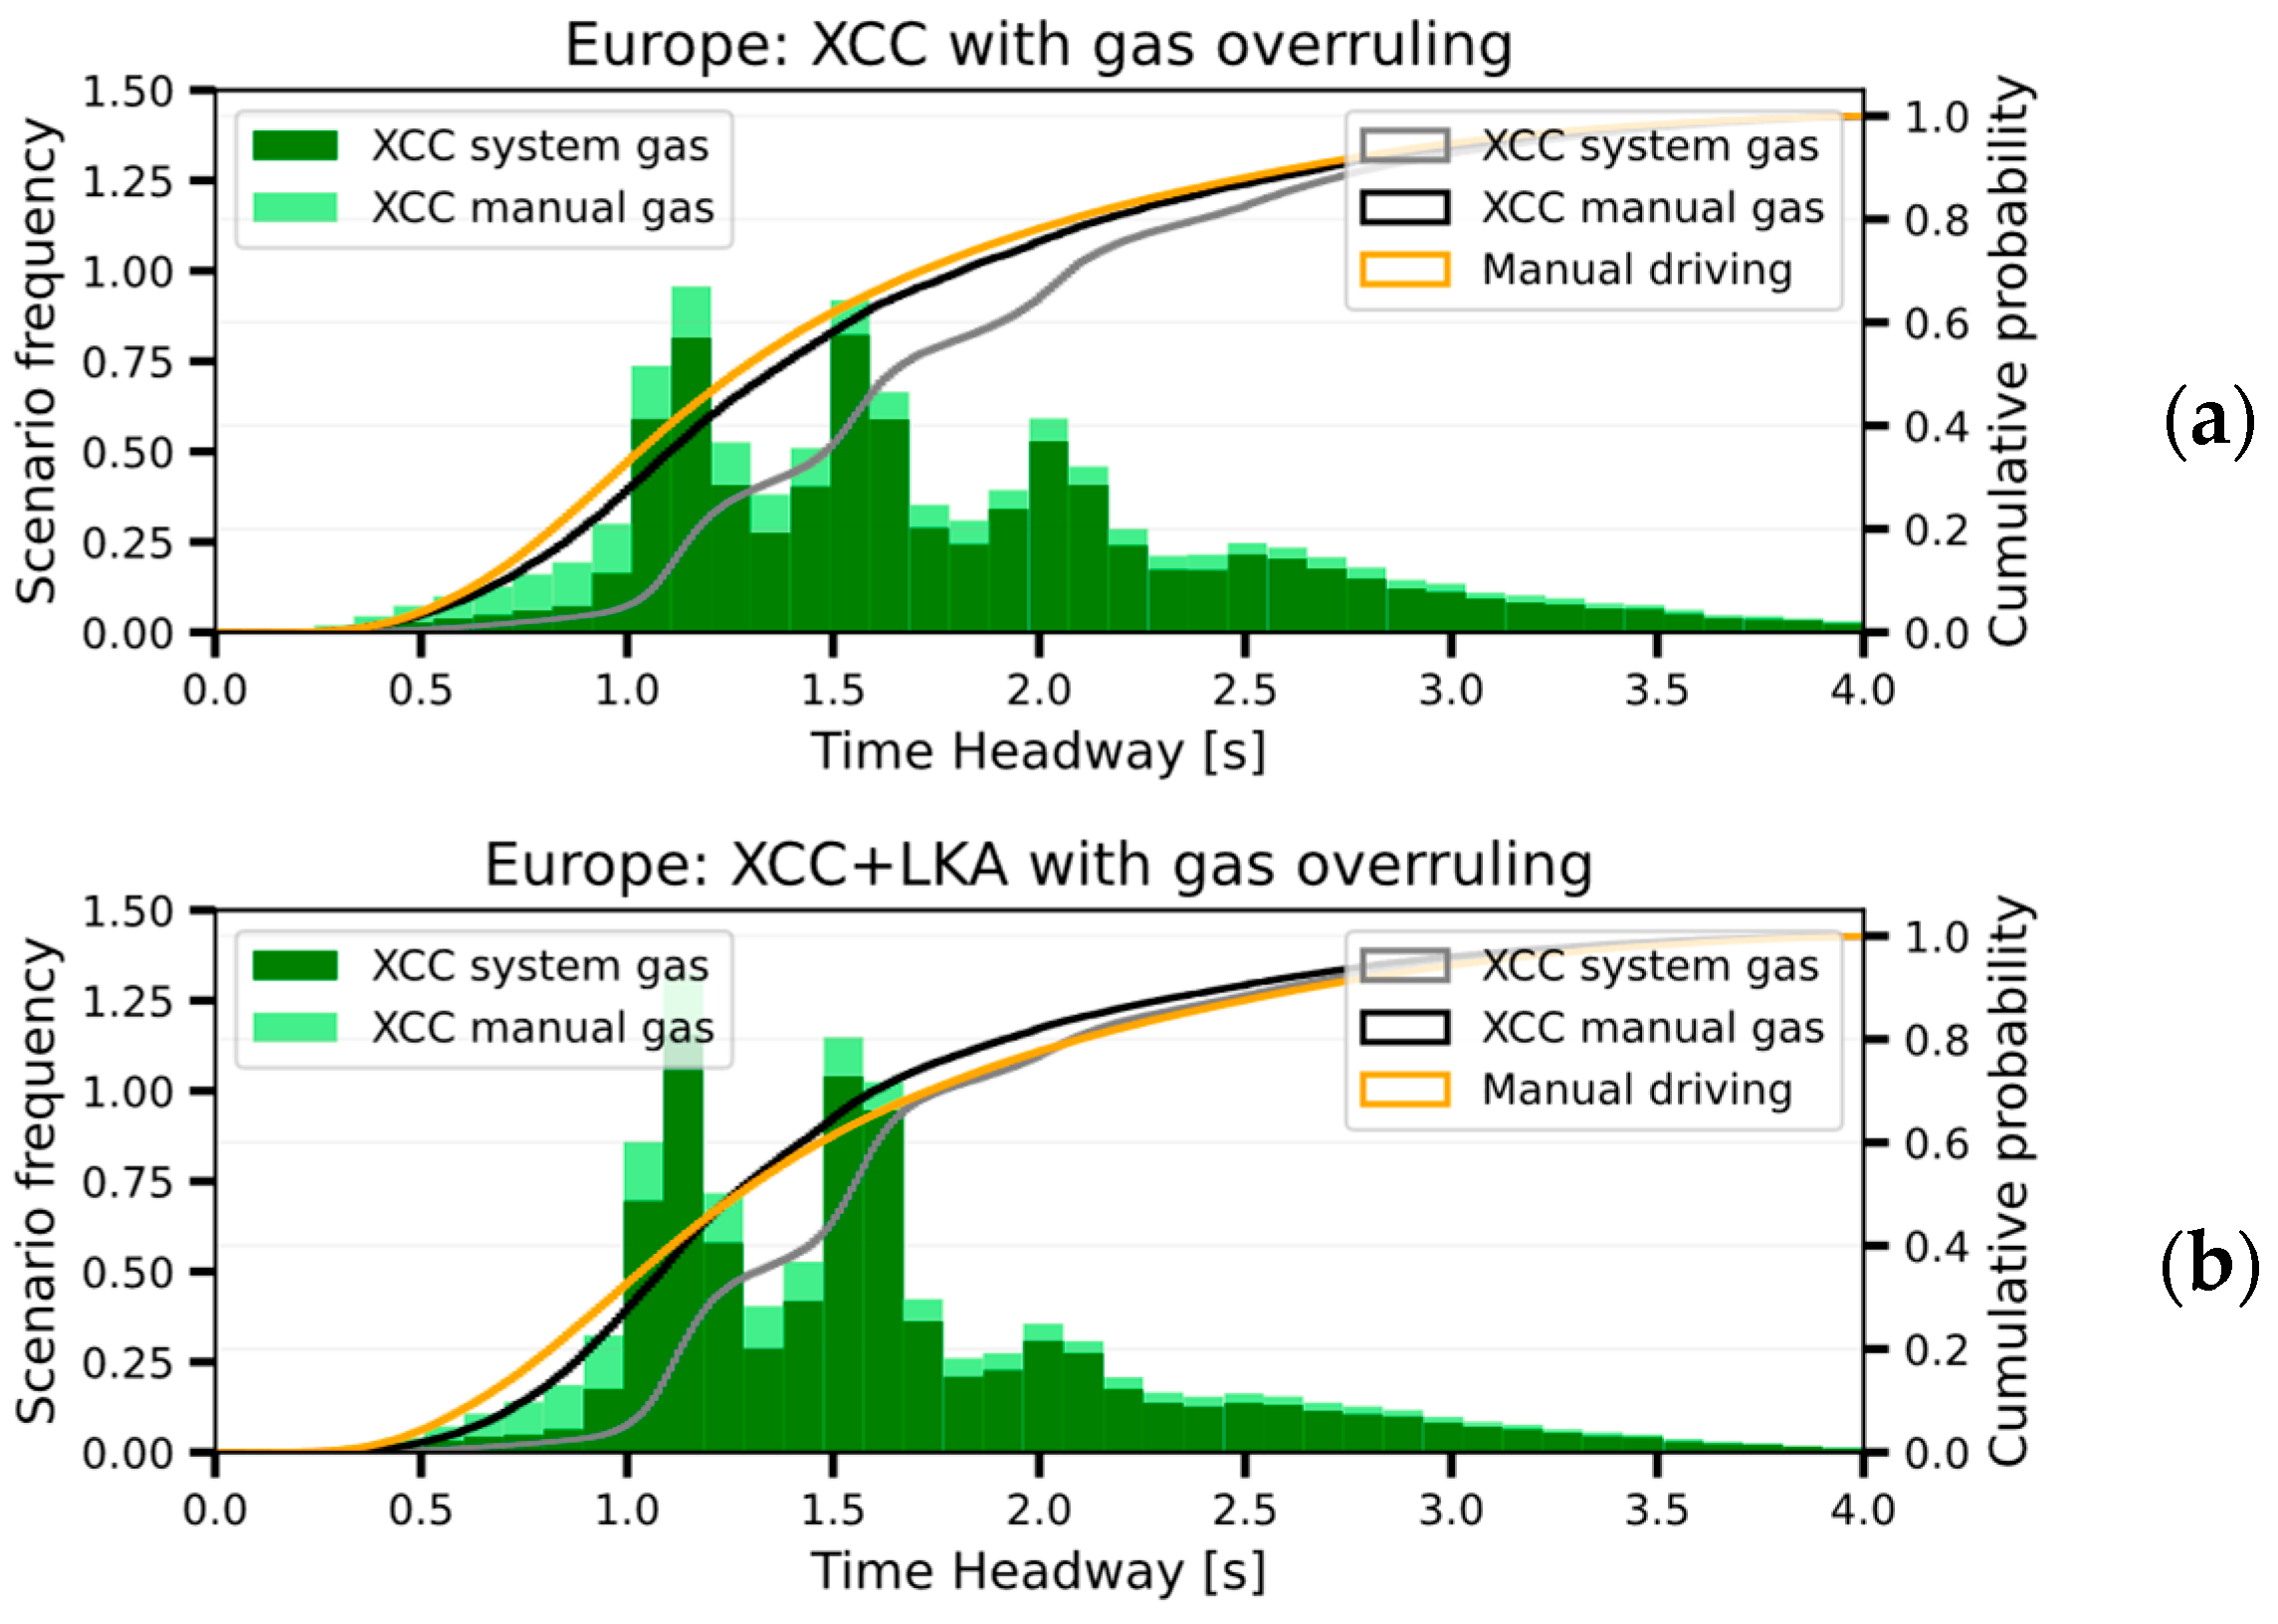
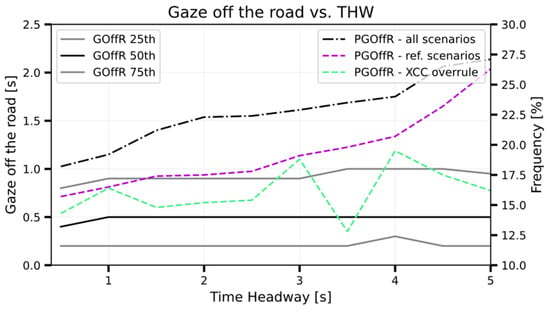
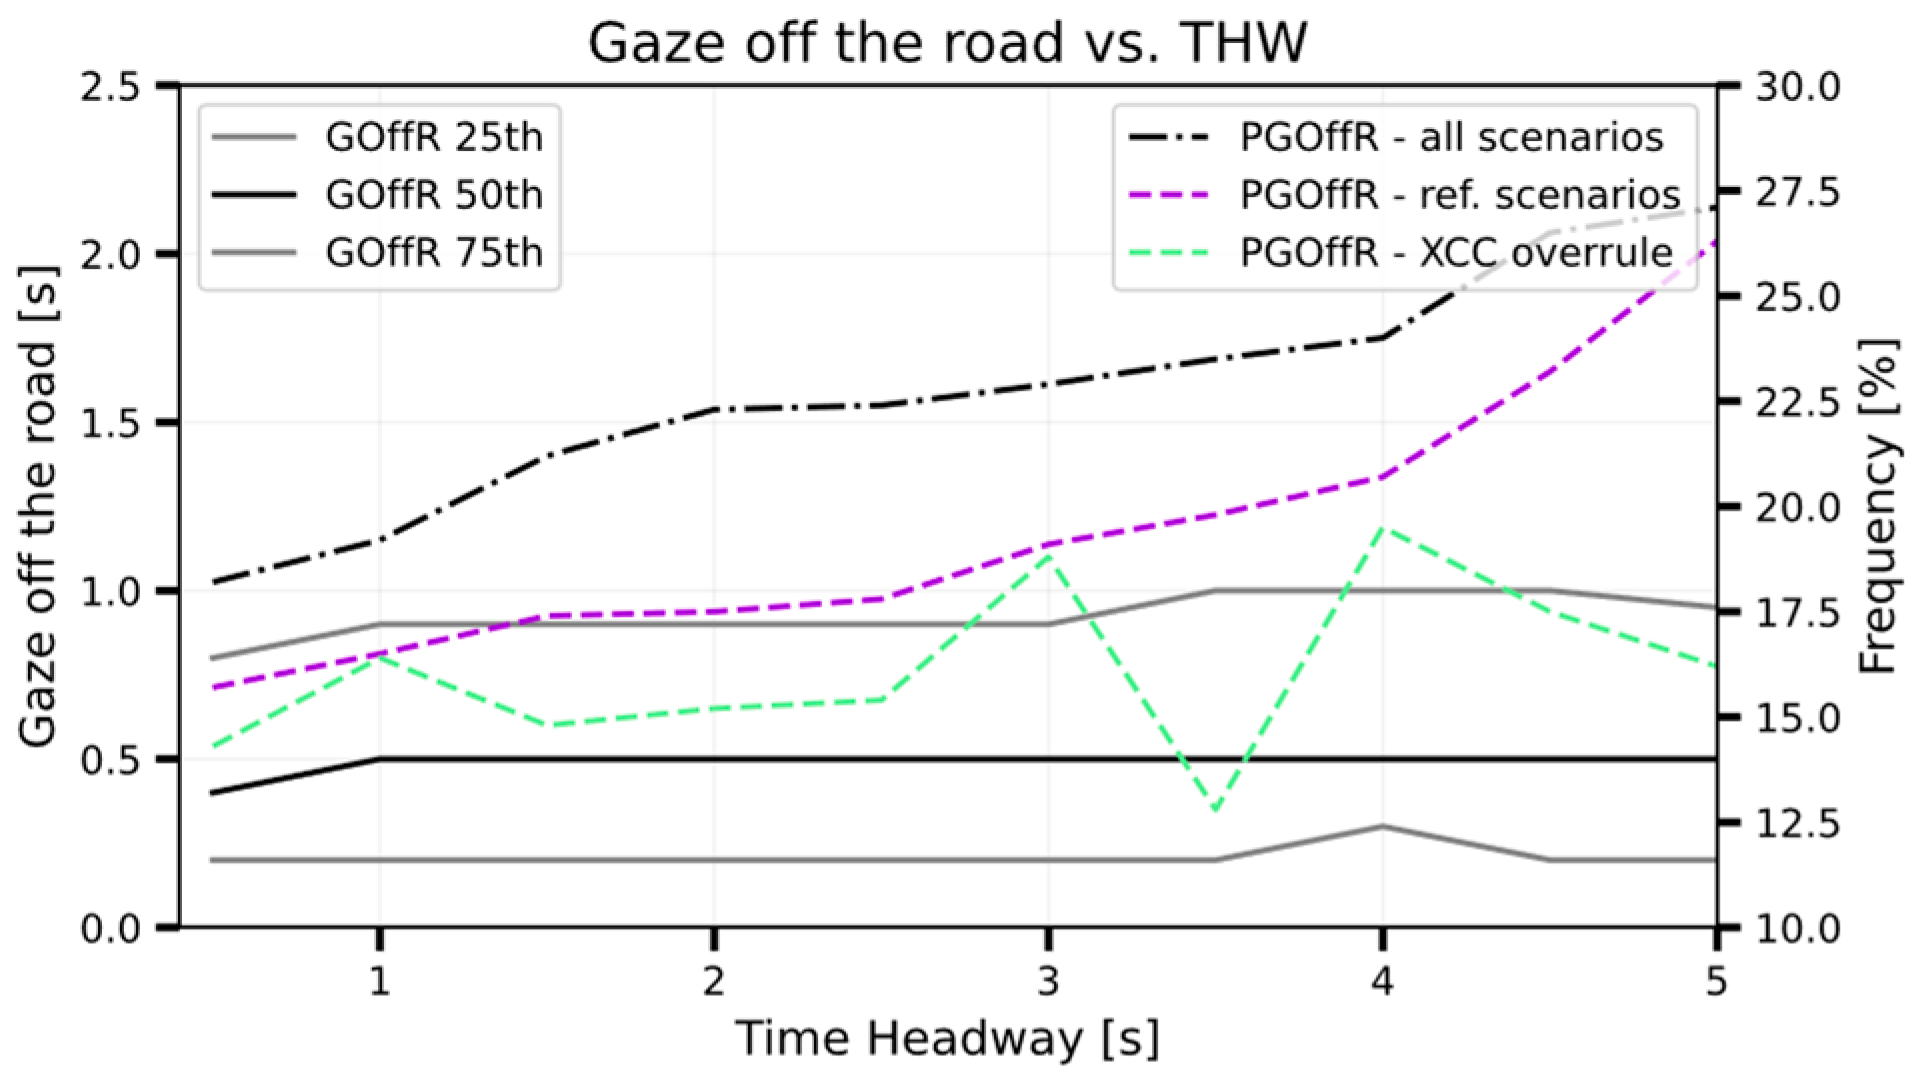
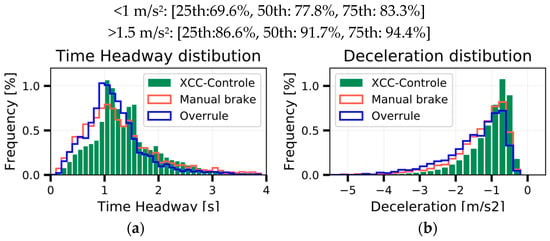
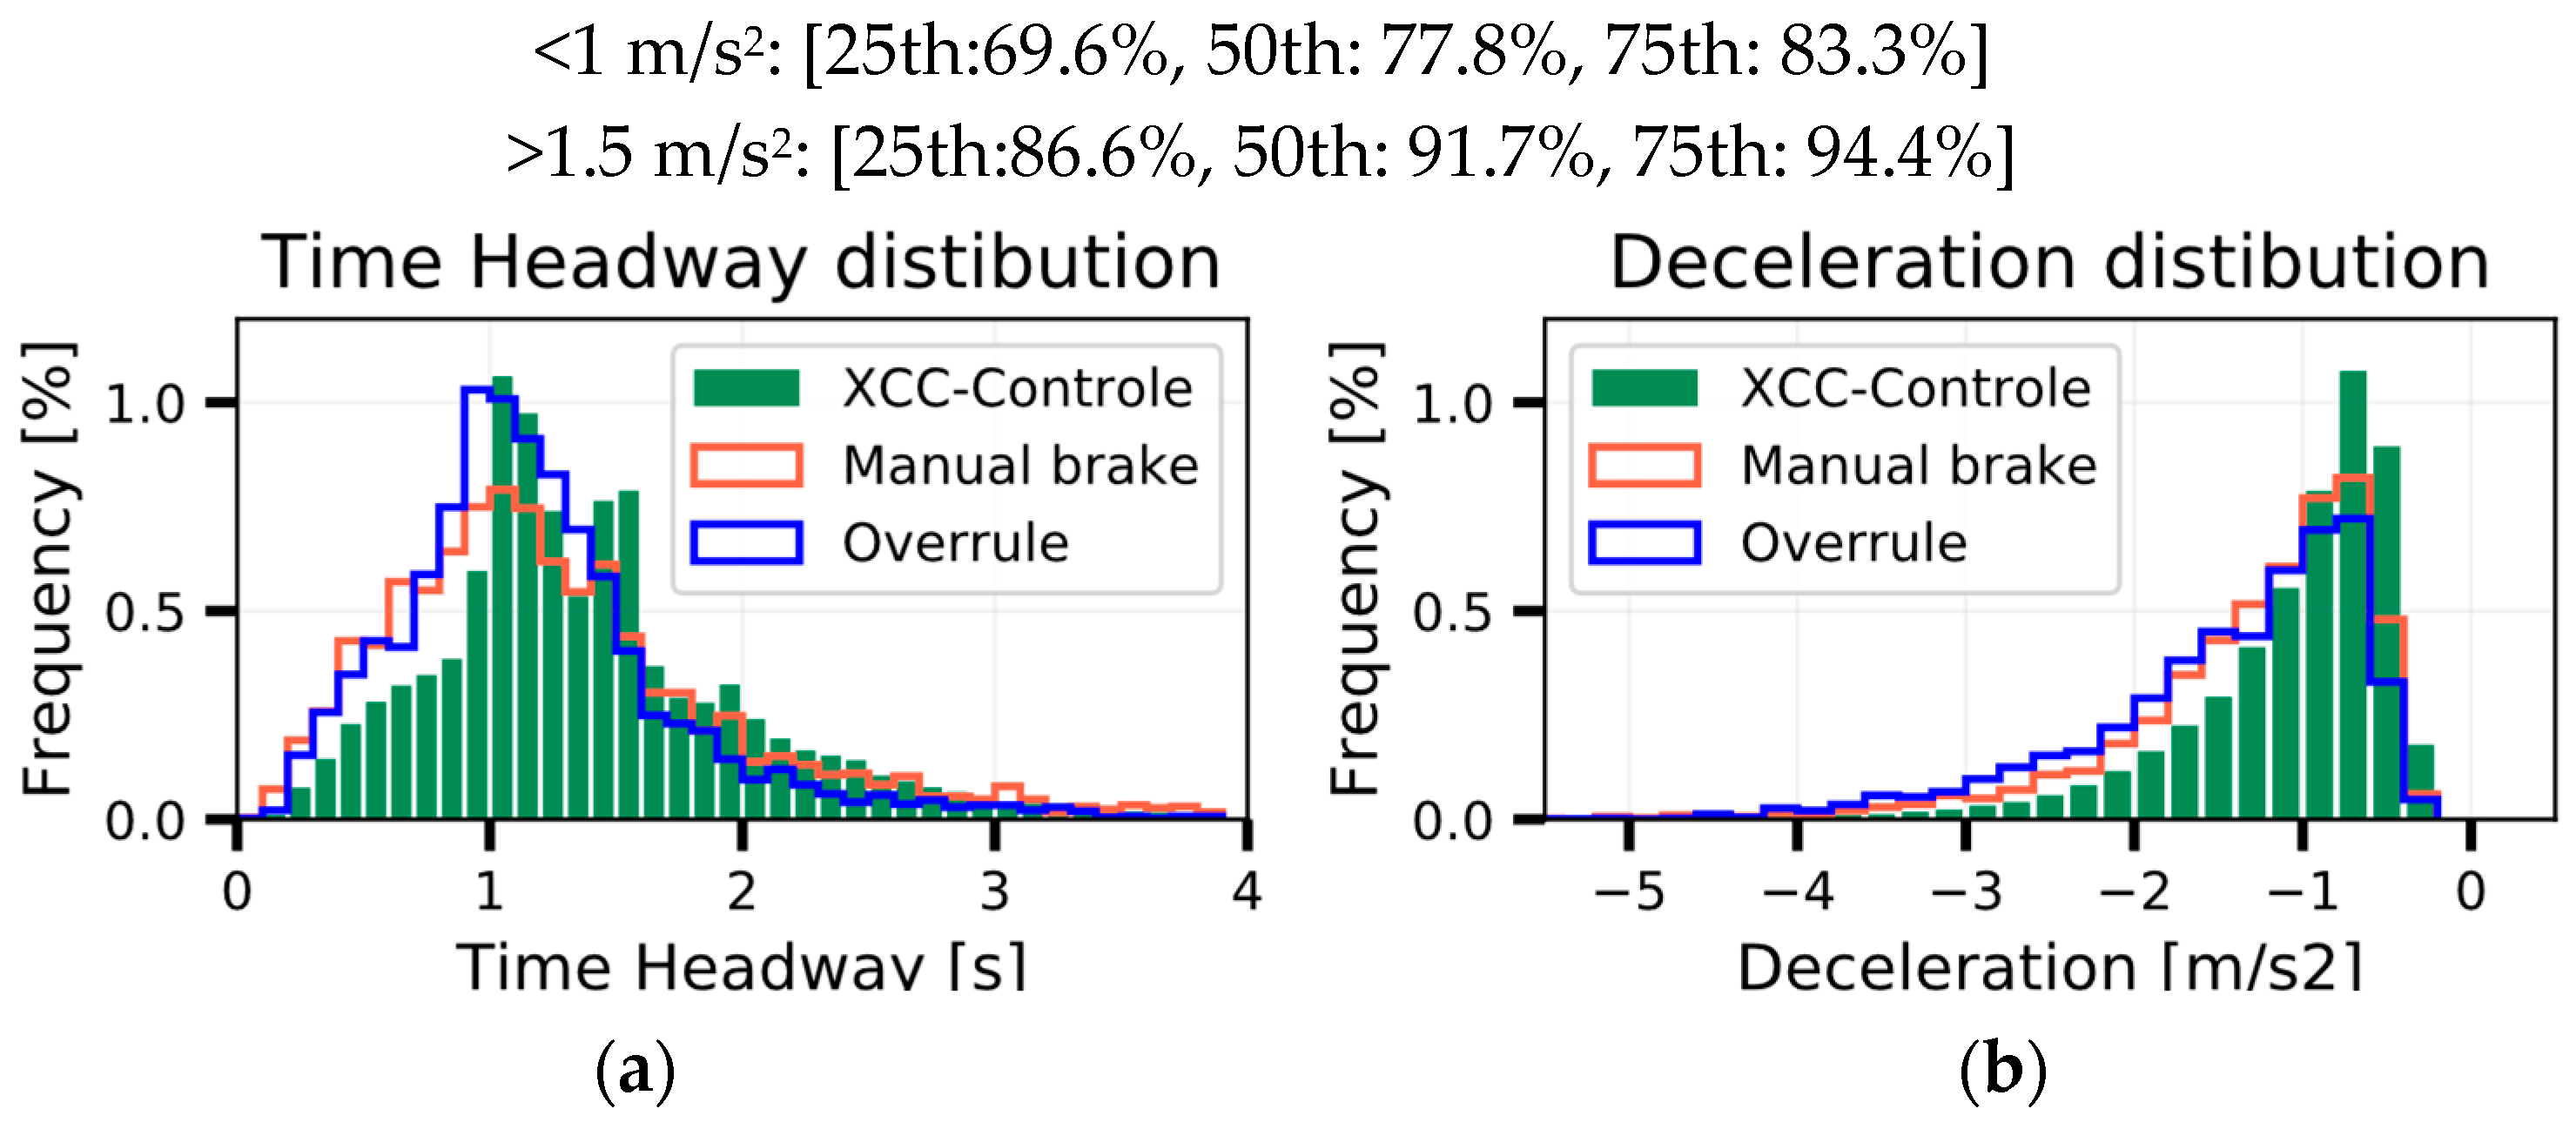
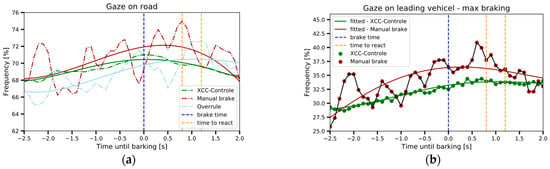
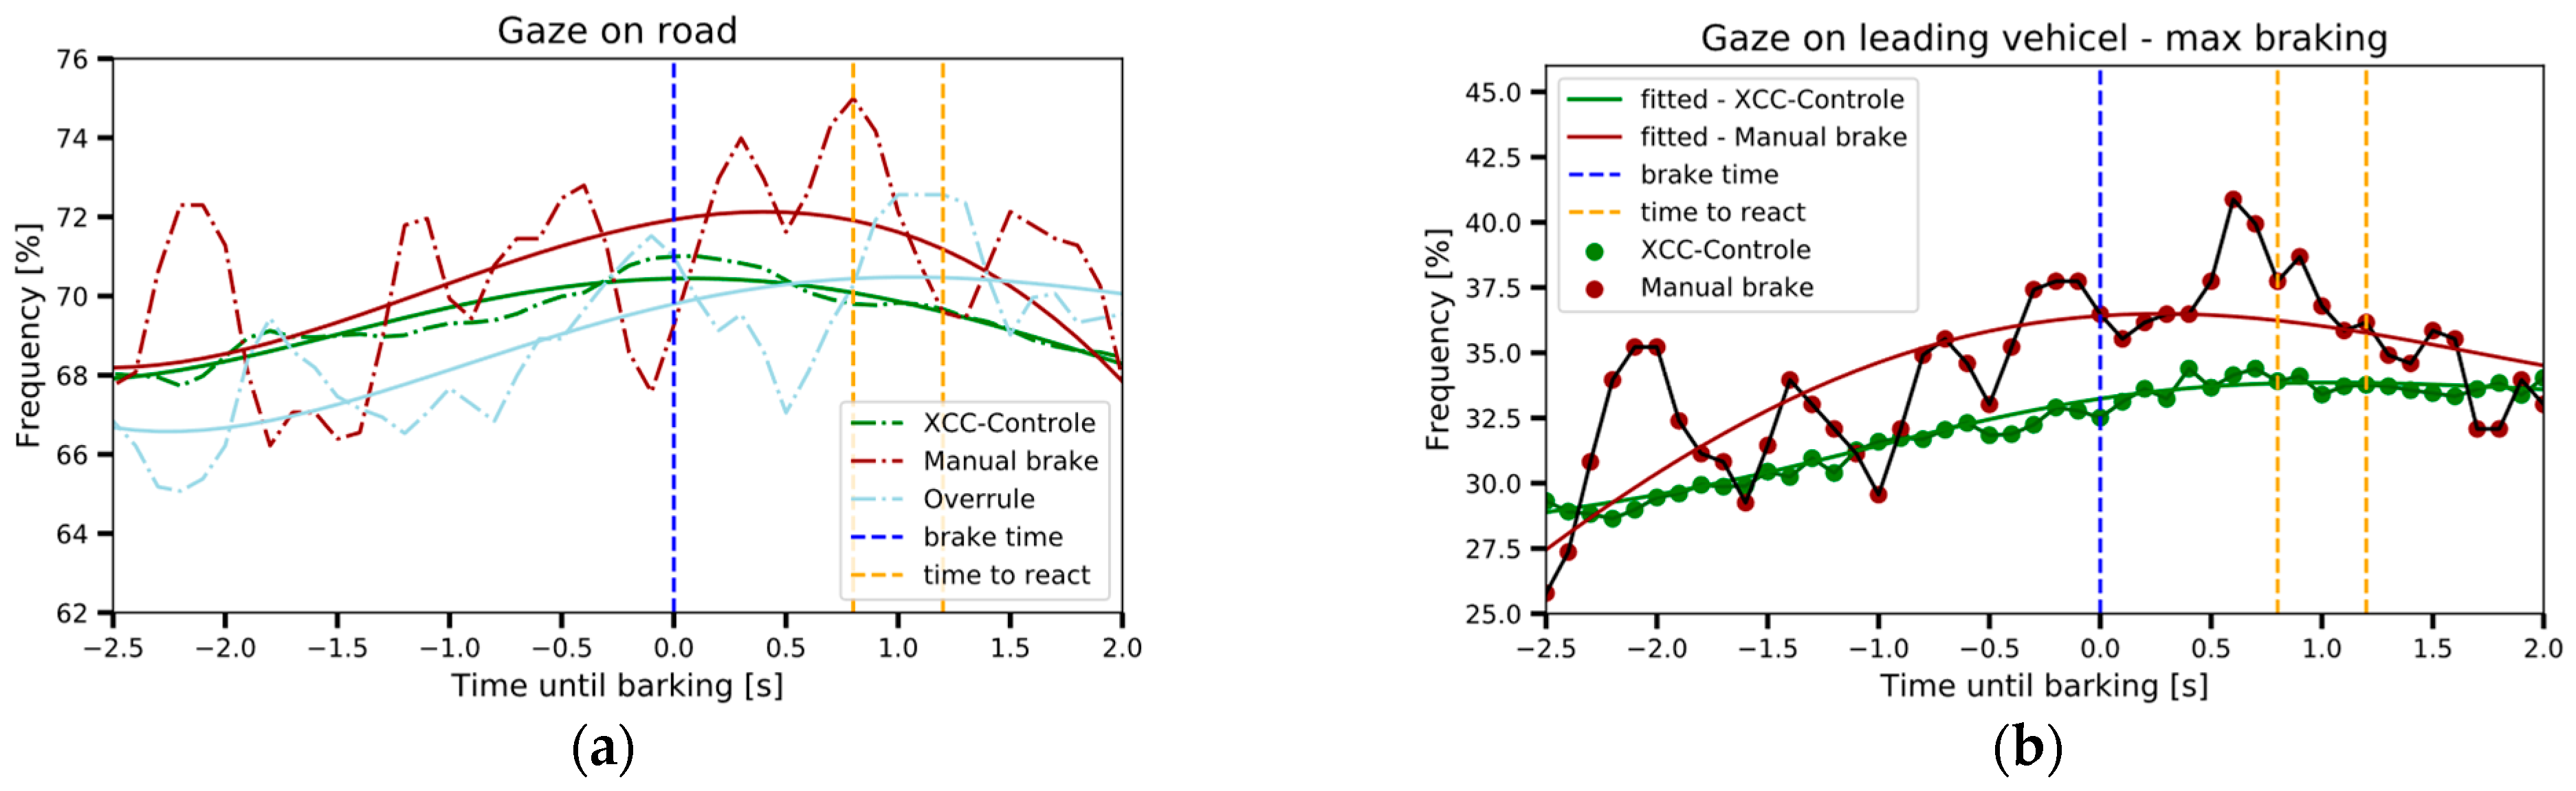
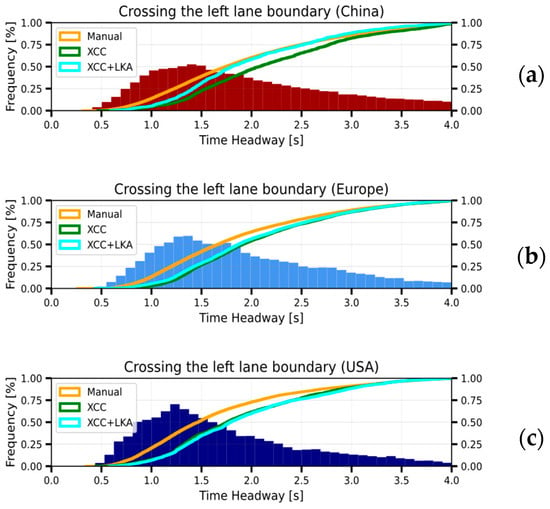
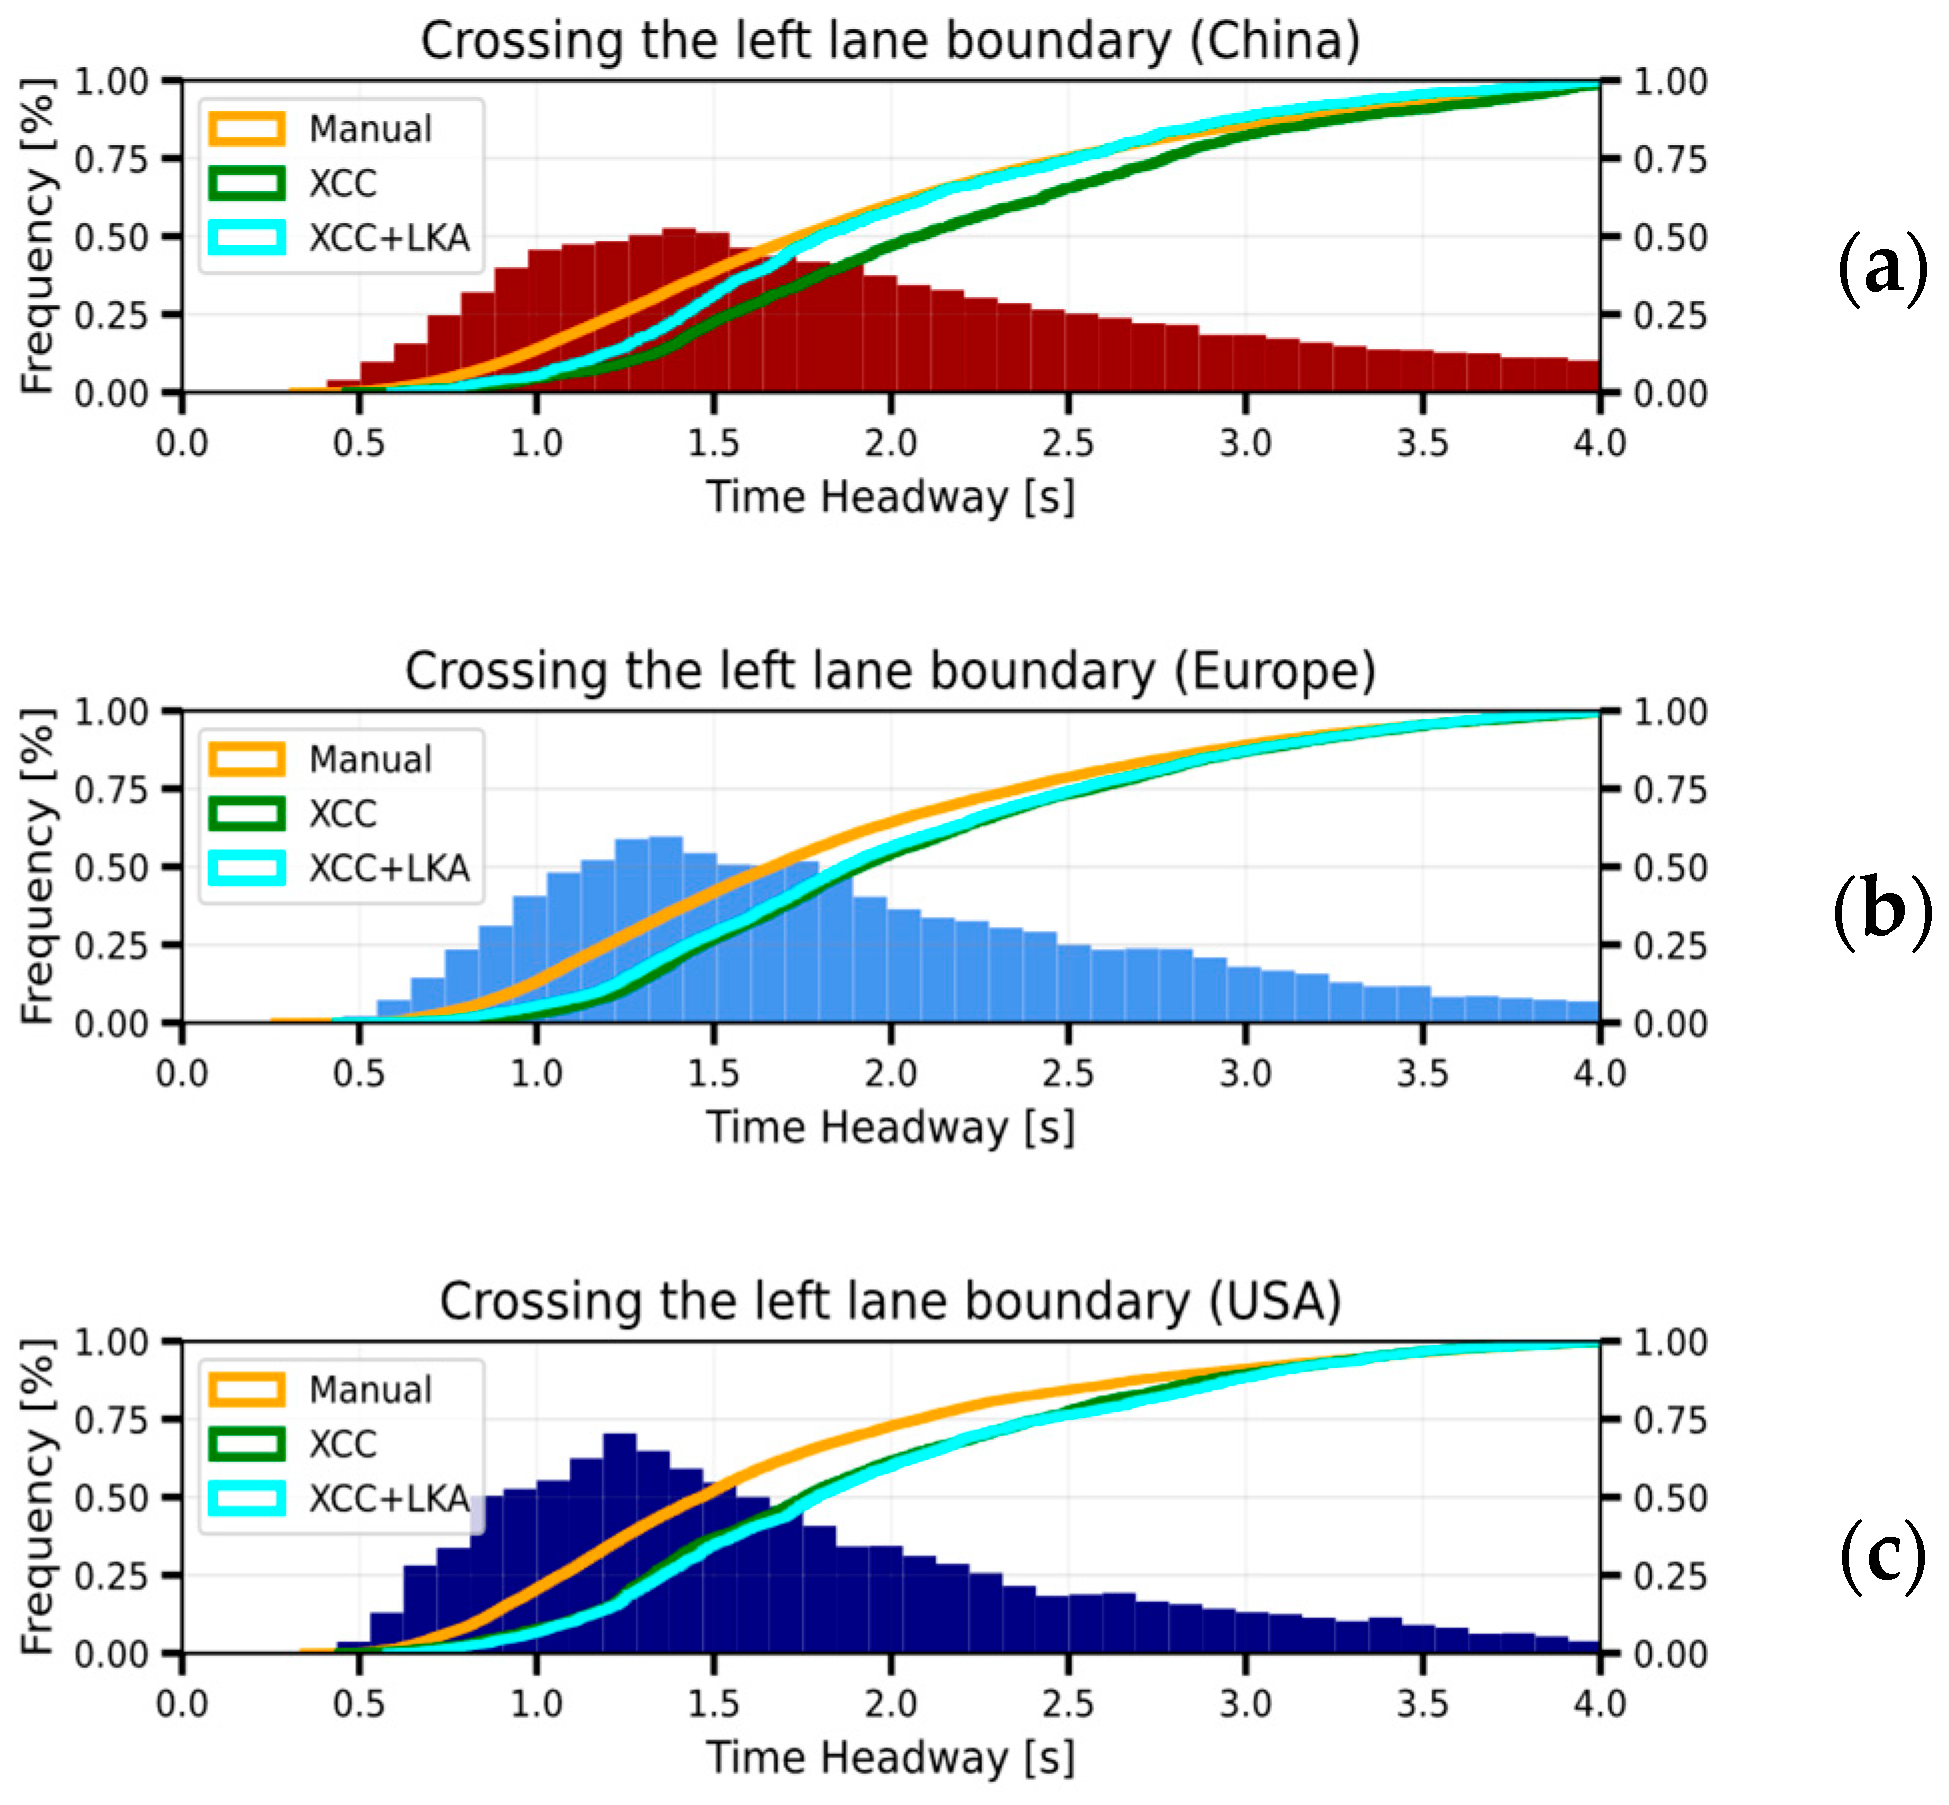
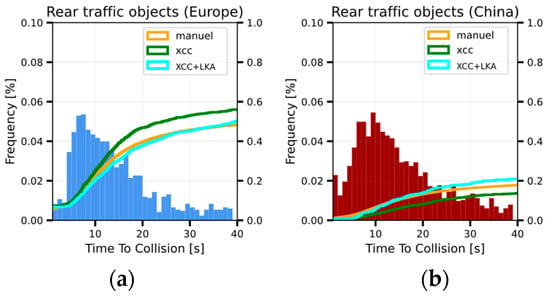
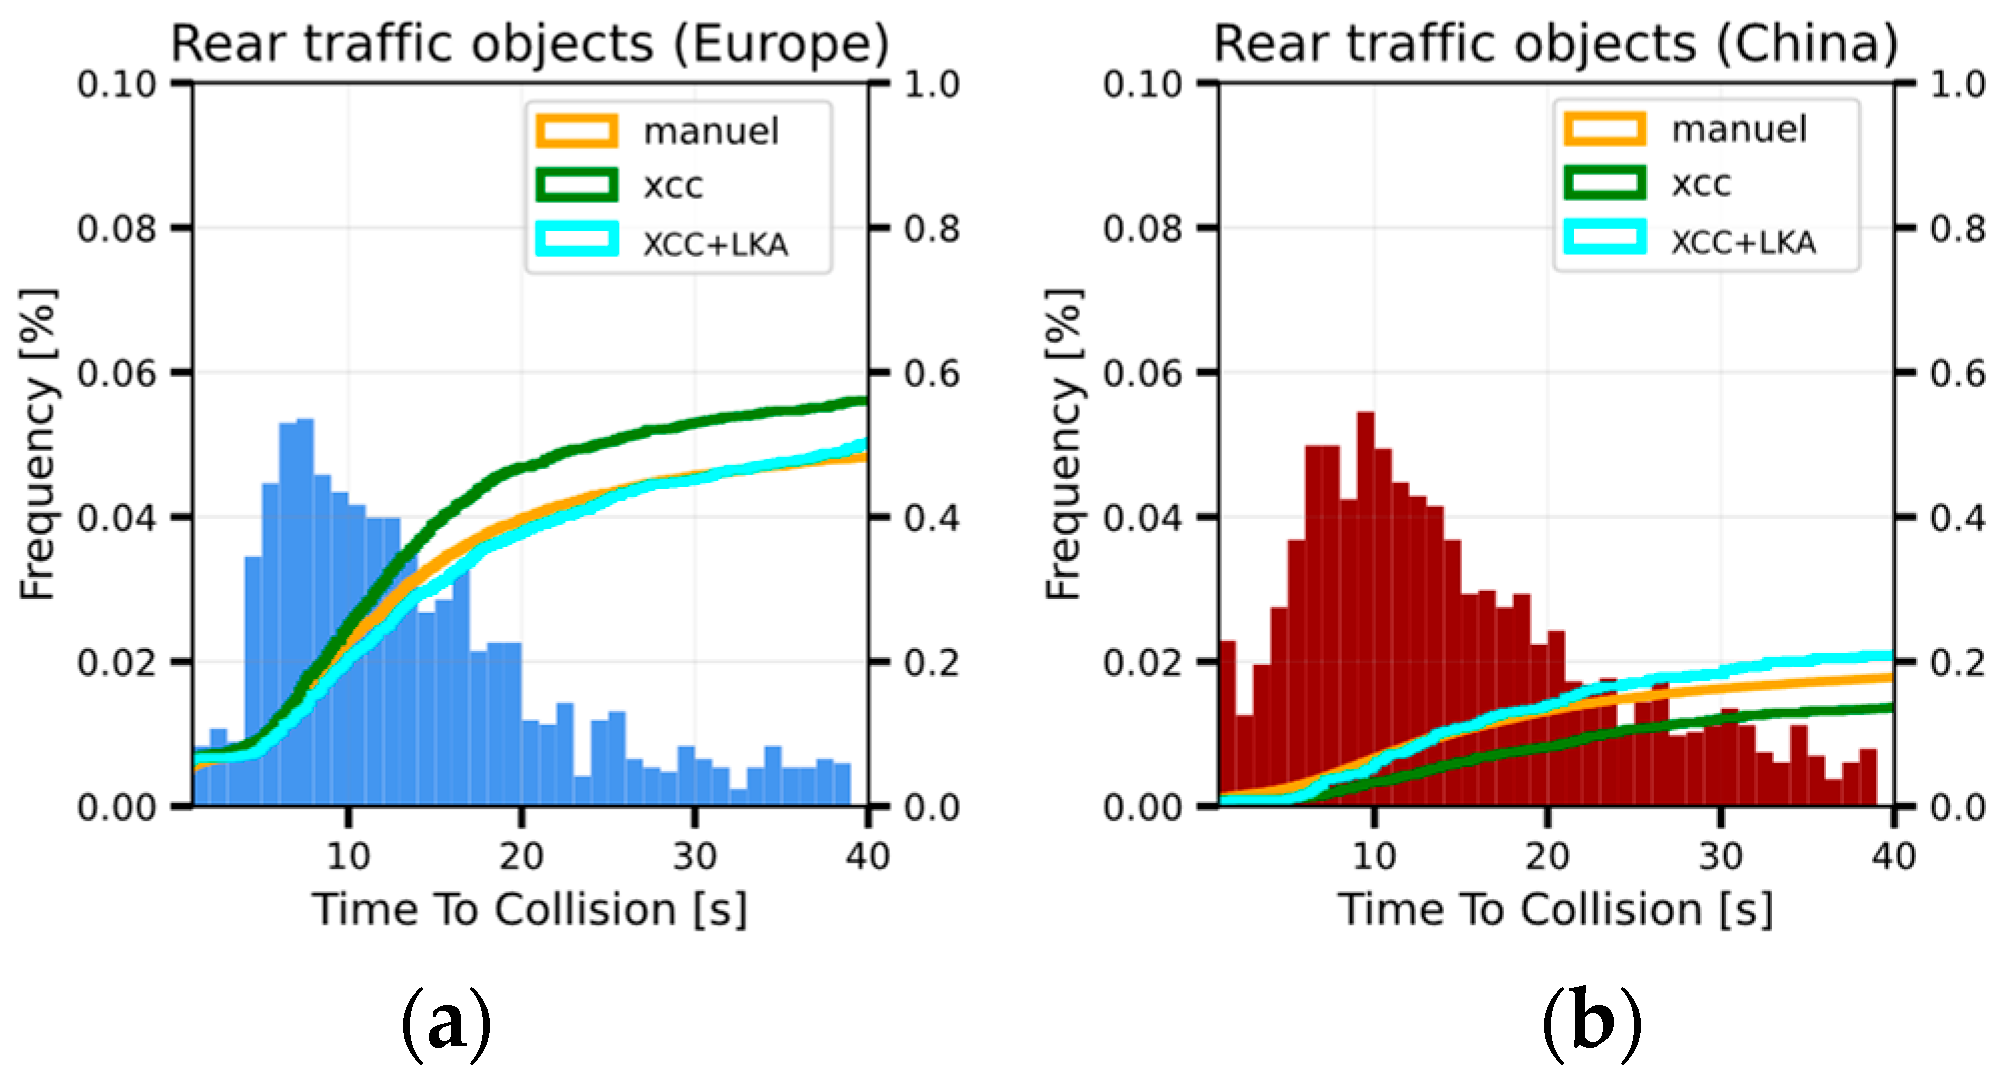
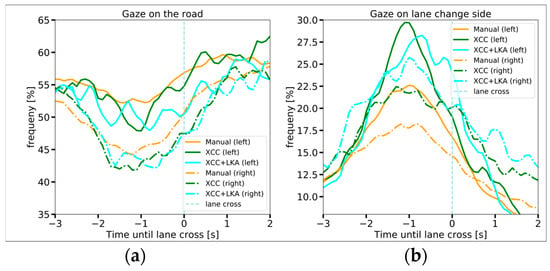
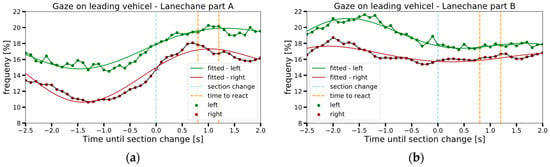
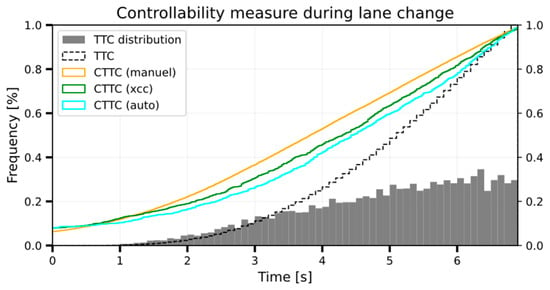
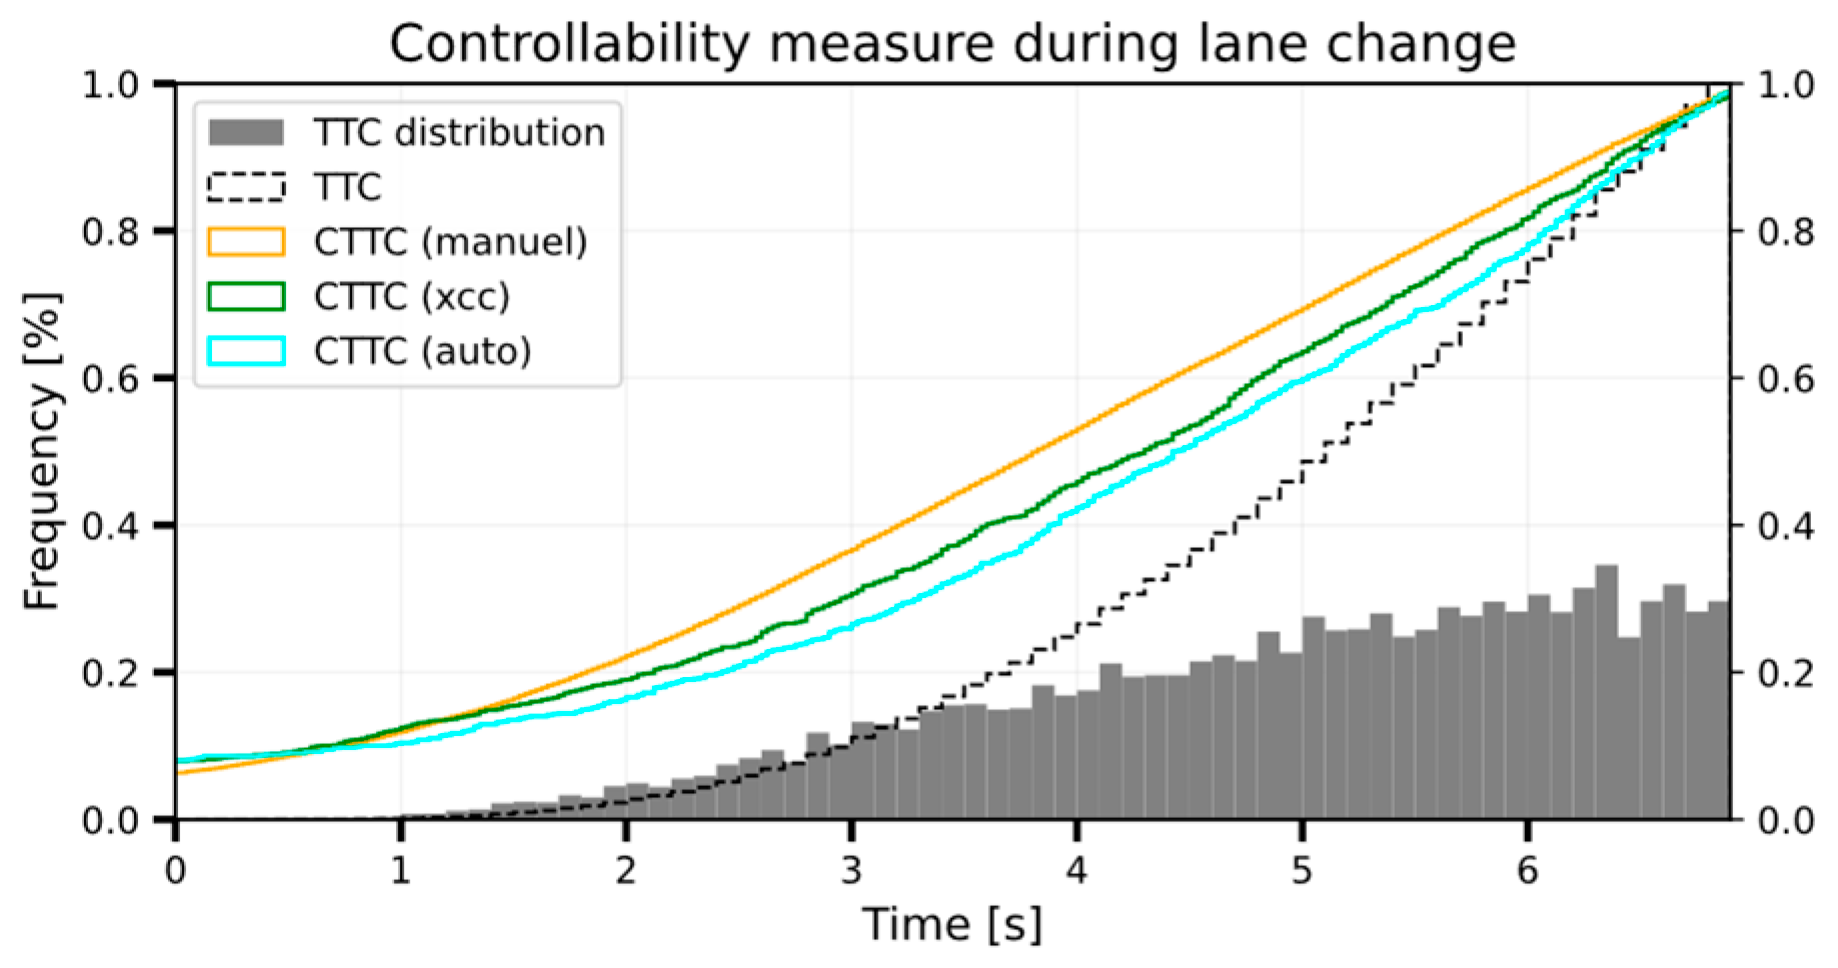

Disclaimer/Publisher’s Note: The statements, opinions and data contained in all publications are solely those of the individual author(s) and contributor(s) and not of MDPI and/or the editor(s). MDPI and/or the editor(s) disclaim responsibility for any injury to people or property resulting from any ideas, methods, instructions or products referred to in the content. |
© 2026 by the authors. Licensee MDPI, Basel, Switzerland. This article is an open access article distributed under the terms and conditions of the Creative Commons Attribution (CC BY) license.