


Abstract
Open-road testing is essential for intelligent connected vehicles (ICVs), yet mileage alone does not capture the difficulty of the scenarios encountered by automated and assisted driving functions. This study proposes a field-oriented scenario-complexity evaluation method for ICV open-road testing. A scenario-element library is constructed from standards, accident-investigation experience, system failure modes, and field-test observations. Environmental, road, and traffic-flow factors are integrated into a weighted complexity index. The case analysis uses recorded scenario conditions, perception outputs, vehicle-function states, and driver interventions. The field-test campaign covered more than 10,000 km in the Pearl River Delta, from which twelve illumination-related trial records were selected for the case analysis presented in this paper. These trials illustrate variations in the complexity scores and observed functional degradation across three illumination-related scenario families. The results can support the selection of demanding test scenarios and the organization of scenario libraries, with complexity scores interpreted alongside functional outcomes rather than as estimates of accident risk.
1. Introduction
Intelligent connected vehicles (ICVs) integrate automated driving, vehicle intelligence, and connectivity to improve transport safety, efficiency, and driving performance. Recent advances in learning-based autonomous driving have improved end-to-end decision-making, trajectory planning, and vehicle motion control [1,2,3]. As these functions move from controlled demonstrations toward large-scale deployment on public roads, their safety and reliability must be evaluated across diverse real-world operating conditions. Closed proving grounds can reproduce selected maneuvers under controlled conditions, but they cannot represent the full diversity of public-road operation, including variations in traffic, infrastructure, illumination, weather, road users, and communication environments. Open-road testing therefore remains essential for verifying advanced driver-assistance systems and connected automated driving functions [4,5]. Previous research has also examined demanding driving situations involving road geometry and vehicle interaction. For example, Macioszek and Tumminello investigated vehicle-to-vehicle communication at roundabouts using microscopic traffic simulation [6]. Such studies highlight the need to consider road layout and surrounding traffic when describing the demands placed on connected and automated vehicles.
The practical challenge is that open-road testing is straightforward to quantify but difficult to evaluate. Mileage, test duration, and geographic coverage describe exposure rather than scenario difficulty. Routes of equal length may impose markedly different demands on perception, decision-making, localization, human–machine interaction, and vehicle control. Strong backlighting, worn lane markings, dense mixed traffic, tunnel entrances, communication interruptions, and cut-in events can substantially increase these demands. A quantitative description of scenario complexity can help test managers document demanding conditions and select representative scenarios for further evaluation.
Scenario-based testing is an important framework for automated-driving verification. International standards and industry initiatives increasingly describe tests through scenarios, operational design domain constraints, road-network models, and criticality indicators [7,8,9,10,11,12,13,14]. These approaches serve different purposes, including scenario specification, reproducible test design, and the assessment of critical interactions. For open-road test management, a related task is to organize heterogeneous observations of illumination, road geometry, markings, communication conditions, and surrounding traffic into a consistent scenario description. A scenario-complexity index is intended to support this descriptive task. Its value should be interpreted separately from the probability or severity of an accident.
This study develops a scenario-complexity assessment framework for open-road ICV testing. The scenario-element library covers environmental, road, human, vehicle, and traffic-flow factors, while the quantitative index combines environmental, road, and traffic-flow scores using expert-assigned weights. Human and vehicle factors are retained in the library to document the context of the observed events; they are not represented as separate dimensions in the present index. The field-test campaign covered more than 10,000 km in the Pearl River Delta, whereas the quantitative case analysis presented in this paper comprises twelve trial records from three illumination-related scenario families. The study contributes a structured scenario-element library, an interpretable weighted index, and a case-based examination of complexity scores alongside perception degradation, function exits, and driver interventions. The case analysis illustrates the application of the framework within the reported conditions; it does not establish validation across all scenario dimensions or geographic regions. The index is intended to be interpreted alongside event-level criticality measures, such as time to collision (TTC), rather than as an estimate of accident risk.
The remainder of this paper is organized as follows. Section 2 reviews scenario-based verification, criticality metrics, and public-road testing. Section 3 presents the scenario-element library and complexity model. Section 4 describes the data acquisition system and open-road campaign. Section 5 presents the representative cases, complexity scores, and observed functional outcomes. Section 6 discusses applicability and limitations, and Section 7 presents the conclusions.
2. Related Work
2.1. Scenario-Based Testing and Criticality Assessment
Scenario-based verification provides a formal framework for automated-driving tests. The International Organization for Standardization (ISO) defines a scenario-based safety-evaluation framework in ISO 34502:2022 [7]. The Association for Standardization of Automation and Measuring Systems (ASAM) provides OpenSCENARIO and OpenDRIVE for standardized descriptions of dynamic scenarios and road networks [8,9,10]. These standards support repeatable testing but do not themselves supply the open-road complexity scores used in this study.
Research on scenario definitions and criticality metrics complements these standards. Formal definitions distinguish scenes, situations, and scenarios, while scenario-based test design organizes validation around reproducible driving conditions [11,12]. Metrics such as TTC, post-encroachment time, and required deceleration characterize specific aspects of traffic interactions [13,14]. These measures and a scenario-complexity index address related but distinct questions. Criticality metrics describe aspects of an interaction relevant to safety, whereas the proposed index summarizes environmental, road, and traffic-flow conditions that may challenge sensing and vehicle operation. A high complexity score does not, by itself, establish a high accident probability, and a low score does not establish that an interaction is safe. The measures should, therefore, be considered together when interpreting field-test events.
2.2. Public-Road Testing and Field-Operable Complexity Evaluation
Data-driven scenario-generation studies and public-road research demonstrate the importance of field data for automated-vehicle development [15]. Public-road experience influences perceived risk and technology acceptance among passengers [16]. Administrative road test reports, by contrast, typically emphasize mileage, operating conditions, and disengagements [17]. These studies motivate structured documentation of both test exposure and the complexity of encountered scenarios.
Previous studies have examined road-test scenario evaluation and the broader landscape of automated-driving system testing [18,19,20]. These studies provide context for organizing and interpreting road tests, while broader reviews identify testing and validation as persistent challenges [21]. Related work also considers vehicle performance under changing operating conditions. Aemalla and Mopidevi combined bidirectional long short-term memory (BiLSTM) speed prediction with model predictive control (MPC) for electric-vehicle energy and thermal management [22]. That study addresses predictive control rather than open-road scenario-complexity scoring but provides a complementary example of evaluating vehicle performance under variable operating conditions. The present study focuses on documenting scenario conditions and interpreting selected field-test cases through a weighted complexity index. Compared with scenario-description frameworks, the proposed index adds a numerical summary of selected scenario conditions. Compared with event-level criticality metrics, it has a broader descriptive scope but does not directly quantify collision imminence. Quantitative comparison requires explicit scoring rules and appropriate validation; the cases reported here illustrate the framework within the available test conditions.
3. Materials and Methods: Scenario Library and Complexity Evaluation
3.1. Scenario-Element Library
The proposed method begins with a scenario-element library rather than a single accident or maneuver type. This design follows the principle that a scenario describes the environment, road geometry, traffic participants, and dynamic evolution of a driving task [7,11,12]. Perception and control demands may arise from combinations of illumination, lane-marking quality, road curvature, traffic density, and surrounding-vehicle behavior. Table 1 groups these elements into environmental, road, human, vehicle, and traffic-flow factors. The classification draws on accident-investigation experience, intelligent-driving system logic, and accumulated field-test observations. The library describes the scope of event documentation; it is broader than the three dimensions included in the numerical index.
Table 1.
Condensed scenario-element library for open-road complexity evaluation.
3.2. Complexity Dimensions
For field implementation, the numerical index uses three dimensions: environmental, road, and traffic-flow complexity. Human and vehicle factors remain in the library for event documentation and interpretation; they are not separate dimensions of the present index. This choice limits the index to the three groups represented in the current scoring scheme and does not imply that human or vehicle factors are unimportant. Environmental complexity captures weather, illumination, and communication interference. Road complexity captures geometry, markings, traffic-control devices, and road facilities. Traffic-flow complexity captures vehicle dynamics and interactions with surrounding road users. Table 2 and Table 3 summarize the scoring framework. The index is distinct from an event-level safety assessment, which requires complementary criticality measures [13,14]. The environmental complexity score is defined as follows:
where senv,i denotes the score assigned to environmental element i. Table 2 summarizes the threshold descriptions for weather, illumination, and communication conditions. The related quantities include rainfall intensity, visibility, illuminance, Global Positioning System (GPS) signal availability, network performance, and vehicle-to-everything (V2X) communication. The Global Navigation Satellite System (GNSS) terminology in Table 2 refers to the broader satellite-navigation category. These descriptions identify the conditions to be coded; numerical point values, absent-element treatment, and missing-data rules are separate implementation details. An unmeasured condition should not be interpreted as a confirmed absence of that element. The historical element-by-element point allocations, interval-boundary rules, and absent-element conventions are not recoverable from the retained records. Table 2, Table 4 and Table 5 therefore document the reported coding cues rather than a complete reproducible numerical rubric. The listed thresholds are retained as descriptive categories; their item-specific derivation from external standards has not been established.
Cenv = Σ senv,i
Table 2.
Environmental-factor scoring criteria used for open-road complexity evaluation.
Table 3.
Operational interpretation of the three complexity dimensions.
Table 4.
Road-factor scoring logic retained from the original scene library.
Table 5.
Traffic-flow scoring logic for dynamic open-road interactions.
The road and traffic-flow complexity scores are defined analogously:
Croad = Σ sroad,j and Cflow = Σ sflow,k
Road scores describe static or semi-static infrastructure features, including the geometric and marking conditions listed in Table 4. Traffic-flow scores include the dynamic conditions in Table 5, such as longitudinal or lateral acceleration, low-speed congestion, short TTC, and interactions with vulnerable road users. Table 5 also retains a driver-assistance fault item. Fault states, TTC, and vehicle acceleration may partly reflect the response of the system under test rather than external scene conditions alone. If these quantities contribute to the score, their association with a similar functional outcome is not an independent validation. Such comparisons require the overlapping outcome-related inputs to be identified and excluded from the predictor.
3.3. Weighted Total Complexity Index
The total index combines environmental, road, and traffic-flow scores using expert-assigned weights. The dimensions represent different types of demand: traffic interactions may change rapidly, whereas road and environmental conditions may impose sustained demands on perception and localization. Equation (3) is a first-order additive approximation intended to provide an interpretable summary of these dimensions. It does not include interaction terms for combinations such as adverse lighting with worn markings or curved-road geometry. The occurrence of such combinations motivates recording the contributing elements but does not establish that their joint effect is additive. Total scenario complexity is defined as follows:
where α, β and γ denote the weights for environmental, road, and traffic-flow complexity, respectively. Table 6 reports eight engineer-provided weight sets. Each reported set sums to one, and the arithmetic means are α = 0.40, β = 0.35, and γ = 0.25. These values represent the panel’s judgments rather than coefficients estimated from the twelve trial outcomes. Across the eight reported sets, environmental weights range from 0.30 to 0.50, road weights from 0.20 to 0.50, and traffic-flow weights from 0.20 to 0.30. The elicitation protocol and panel-experience information are unavailable. These ranges describe weight dispersion, not inter-rater agreement or ranking sensitivity. Variation among the reported weights does not by itself establish agreement between experts or stability of the scenario ranking. The index provides a scenario-level descriptor to be interpreted alongside event severity, function disengagement, and driver intervention; it does not replace TTC or other safety-related measures.
Ctotal = α Cenv + β Croad + γ Cflow
Table 6.
Expert-derived weights used in the total scenario-complexity index.
The analysis reported below is at the level of a selected trial record. Campaign mileage describes the wider testing exposure and is not a sum of complexity scores. No continuous route-level segmentation or duration-weighted aggregation is reported here. Comparing complete routes would require consistent event boundaries and an explicit rule for combining scores over time or distance. The original trial boundaries, the use of instantaneous or interval-summary scores, and the treatment of event duration cannot be verified from the retained scoring records.
4. Field Test System and Open-Road Campaign
4.1. Data Acquisition System
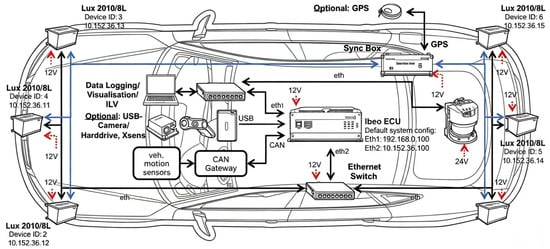
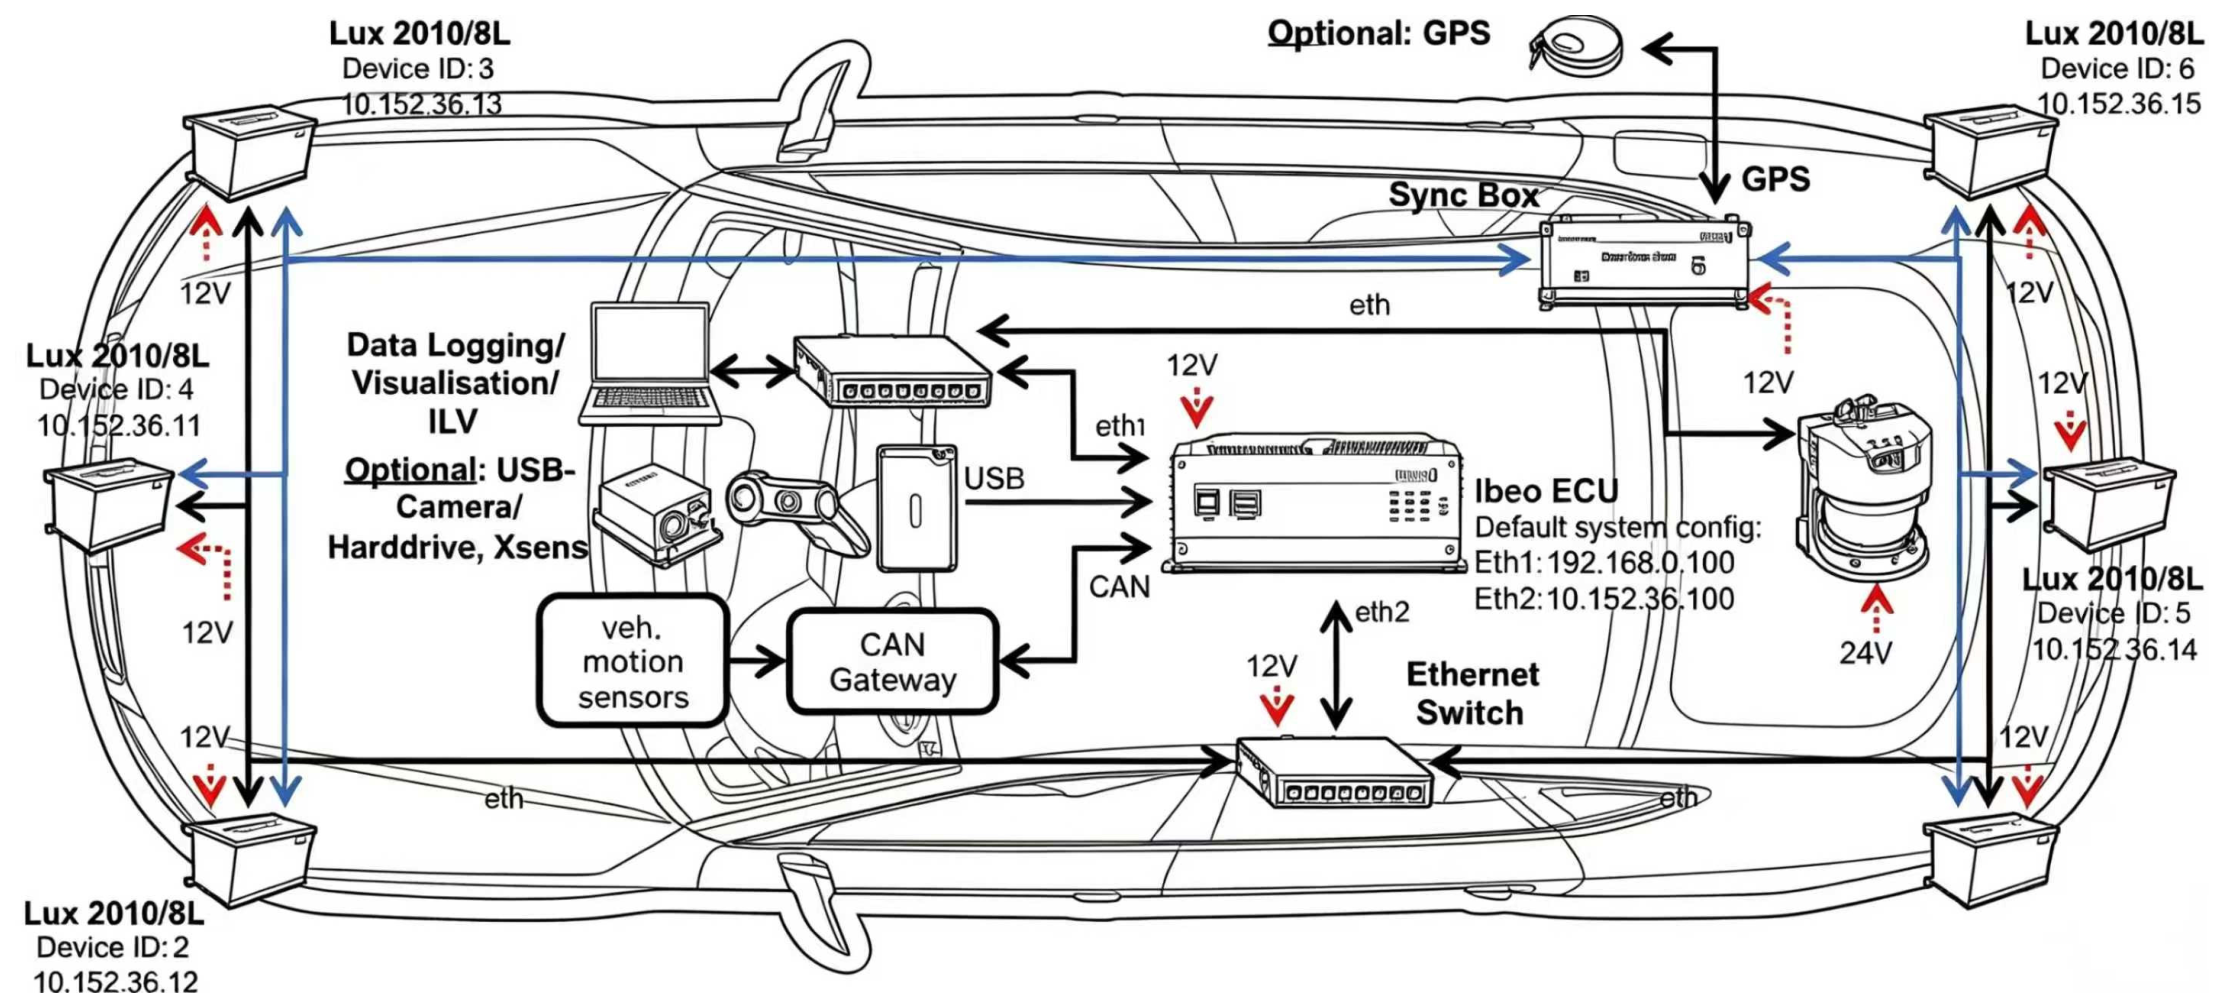
Open-road data were collected using an integrated active-safety assessment and scene-data acquisition system. Figure 1 shows a schematic platform architecture, including an electronic control unit (ECU), Controller Area Network (CAN), Universal Serial Bus (USB), Ethernet, and light detection and ranging (LiDAR) components. The retained field-test equipment lists describe data loggers with six bus inputs, eight USB ports, four Ethernet interfaces, and 2 TB of storage per vehicle. They also list six video channels covering the dashboard, forward scene, driver, left and right mirrors, rear scene, a GPS receiver, and an on-board diagnostics (OBD) connection for CAN acquisition. Figure 1 depicts a broader sensor architecture rather than the verified installed configuration for every trial; the equipment lists do not establish that all illustrated sensors were used in the twelve cases. Equipment model identifiers, manufacturer details, and acquisition-software versions are not disclosed because of the enterprise’s confidentiality requirements.
Figure 1.
Schematic architecture of the active-safety assessment and scene-data acquisition platform.
The acquisition architecture allows scene conditions to be examined alongside vehicle-function observations. In the present cases, the reported quantities include illuminance, solar angle, perception confidence, vehicle speed, function mode, warnings, and driver intervention. These quantities are used for case interpretation; the paper does not report a complete route-level complexity time series. A dashboard image illustrates the displayed function state but does not by itself establish signal definitions, measurement accuracy, or synchronization. The retained reports and event archive do not document channel-specific sampling rates, calibrated measurement uncertainties, inter-device synchronization accuracy, or the input signals and calculation model used for the reported TTC values. These values cannot therefore be independently recomputed from the available materials. Timestamped CAN acquisition windows are not treated as verified scenario durations.
4.2. Test Routes and Exposure
The field records describe testing in Guangzhou, Shenzhen, Foshan, Dongguan, Huizhou, and other Pearl River Delta cities. The reported campaign covered more than 10,000 km across expressways, general highways, urban and rural roads, tunnels, and underground parking areas. Testing included clear, cloudy, and rainy weather and daytime, evening, and nighttime illumination. Table 7 presents the exposure summary reported for the campaign; its road-type distances sum to 10,643 km. This coverage describes the source context of the study; it does not mean that every recorded kilometer was assigned a complexity score. The quantitative case analysis is limited to the twelve trial records presented in Section 5, and the regional coverage does not establish performance in other geographic settings.
Table 7.
Summary of open-road test exposure.
5. Results: Typical Scenario Analysis
Three illumination-related scenario families are examined: strong backlighting with lane-marking degradation, backlighting during preceding-vehicle following, and a bright-to-dark transition at a tunnel entrance. Four trial records are presented for each family, giving twelve records in total. Table 8 reports the recorded conditions, functional responses, and total complexity scores. The analysis examines how the scores are interpreted alongside the observed responses. It does not independently validate the road and traffic-flow dimensions, establish ranking robustness, or demonstrate a statistical relationship between the index and functional failure.
Table 8.
Recorded conditions, functional responses, and complexity scores for twelve trials.
5.1. Strong Backlighting and Lane-Marking Recognition Failure
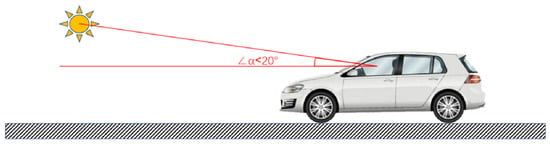
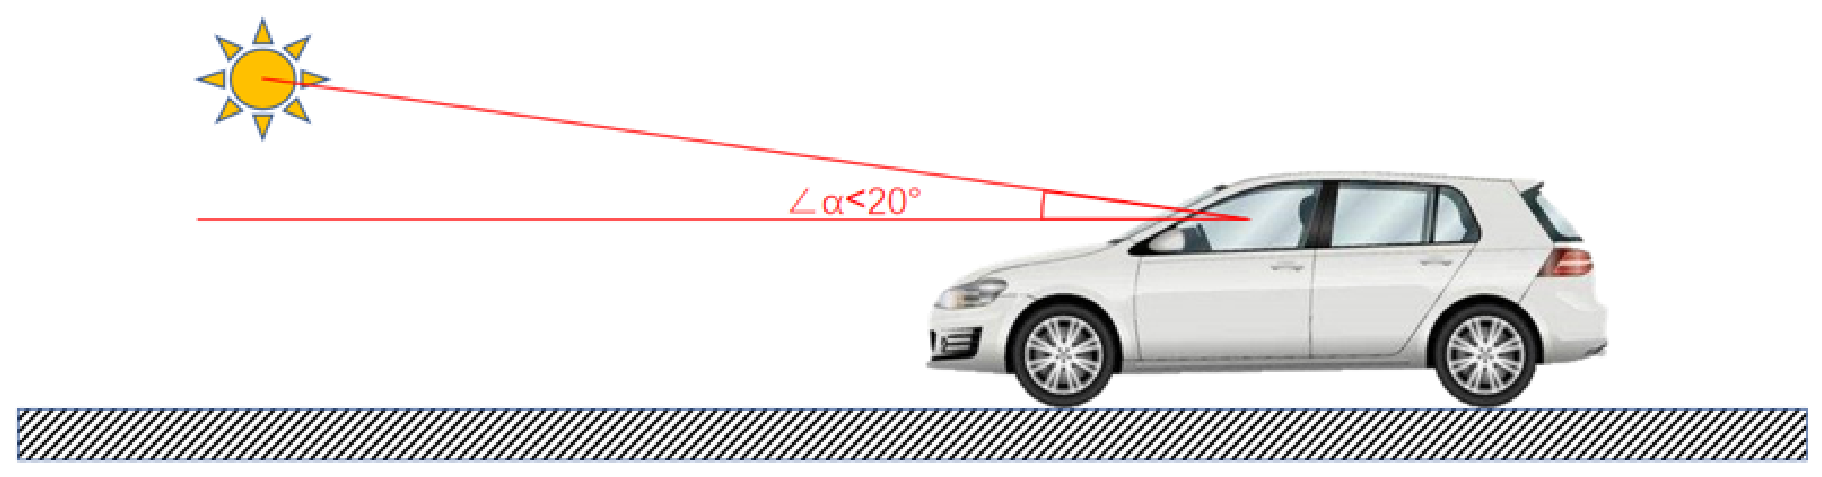
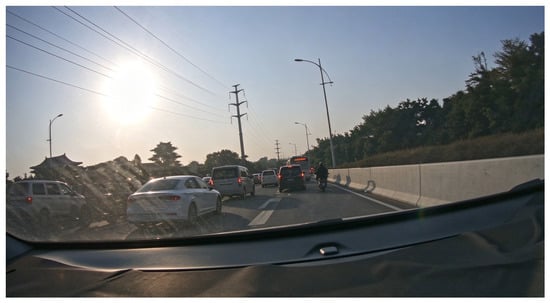
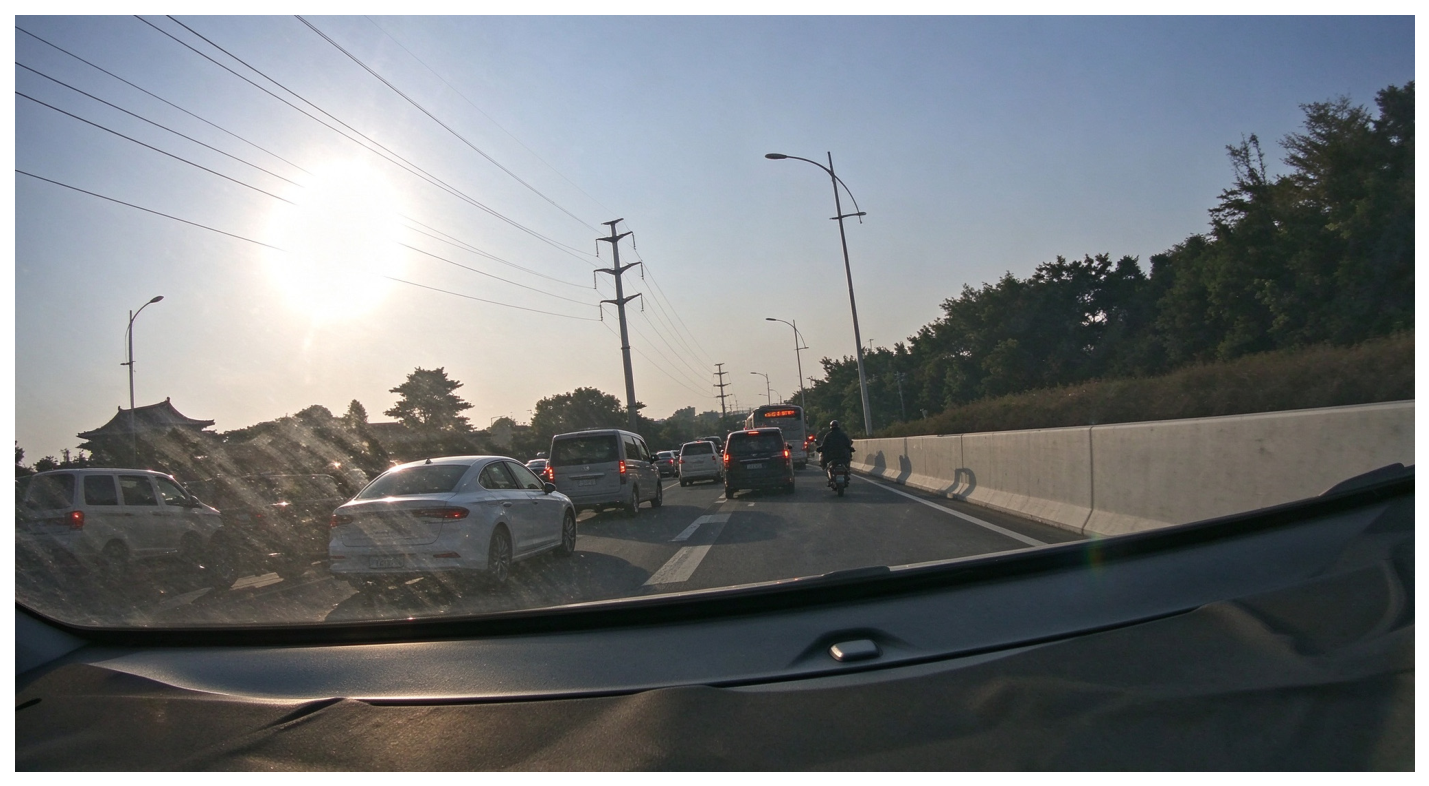
In trial T1-3, the test vehicle traveled at 60 km/h in integrated cruise assist (ICA) mode on a concrete road under strong backlighting. The solar elevation angle was 16°, the angle between the incident sunlight and the vehicle heading was 3°, and forward illuminance reached 22,000 lx. Lane-marking recognition confidence was 28–35%, compared with 92–98% under the control condition, while the reported lateral deviation exceeded ±0.8 m. Lateral assistance disengaged. After approximately 28 m of travel beyond the direct backlighting region, illuminance decreased to 4200 lx and recognition confidence recovered to above 90%; lateral assistance then returned to normal without driver intervention. Figure 2 illustrates the lighting geometry, while Figure 3 and Figure 4 provide illustrative field records of the road context and dashboard indication. They are not used as time-matched quantitative evidence for the speed or confidence values of T1-3.
Figure 2.
Schematic of solar elevation and incident-light direction under backlighting.
Figure 3.
Field image of a strong-backlighting scene associated with lane-marking recognition failure.
Figure 4.
Illustrative dashboard record of lateral-assistance status under backlighting.
5.2. Vehicle-Following Response Under Backlighting
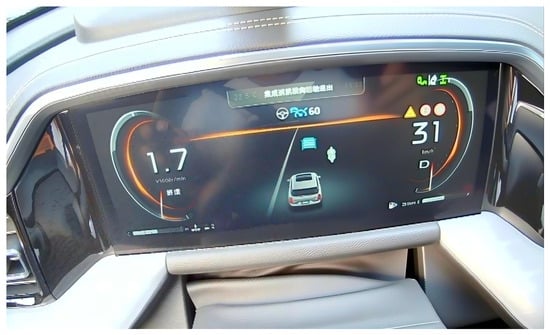
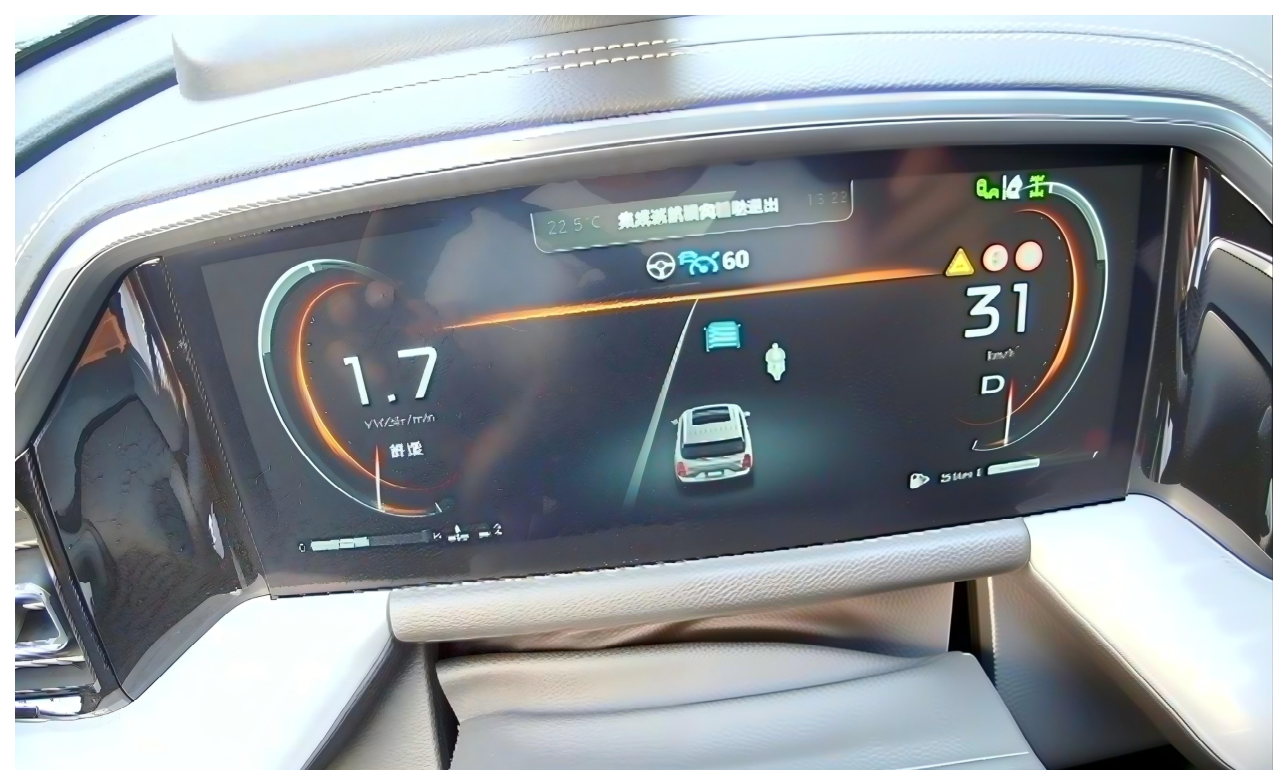
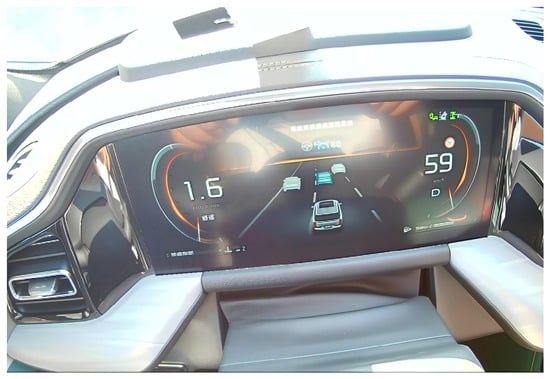
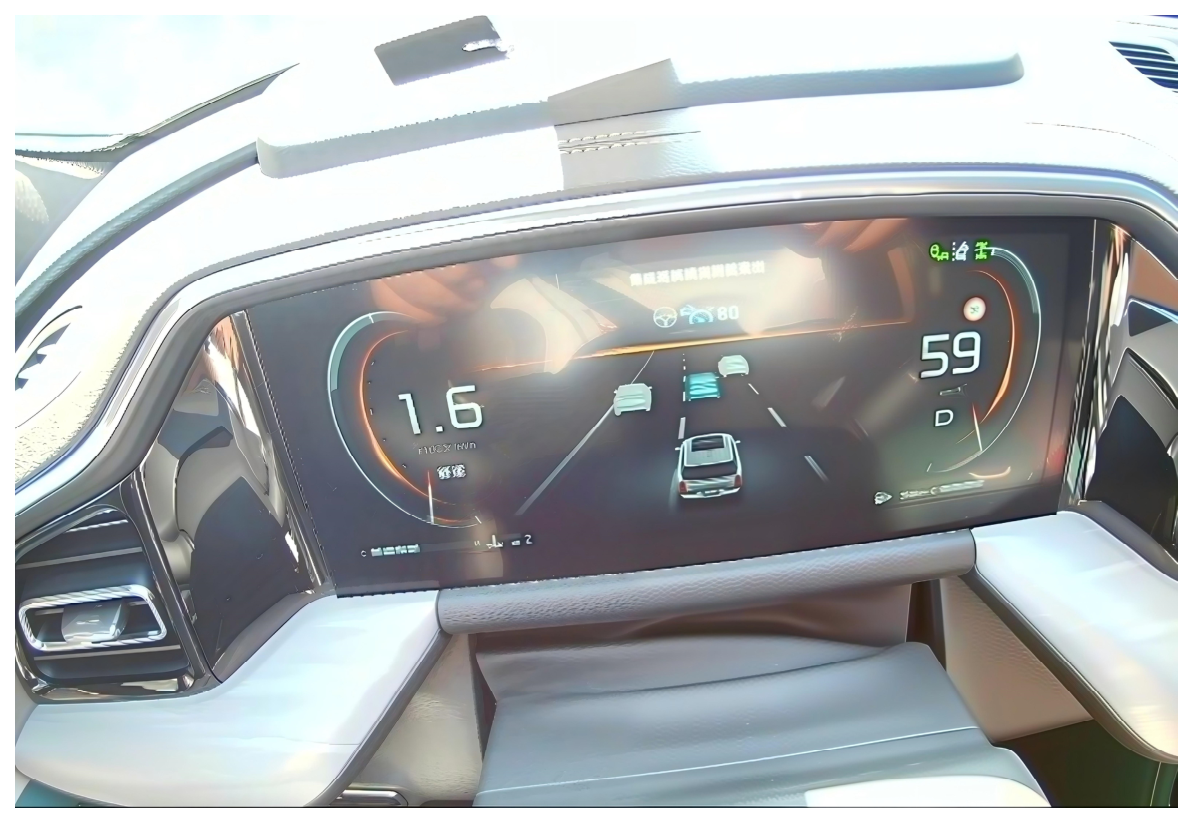
In trial T2-3, the vehicle traveled at 26 km/h in traffic-jam assist (TJA) mode on Xinjiao Middle Road. The solar elevation angle was 15°, the angle between the incident sunlight and the vehicle heading was 11°, and forward illuminance was 18,000 lx. When following a black sport utility vehicle (SUV), TTC decreased from 1.2 s to 0.42 s within 0.8 s as the preceding vehicle slowed slightly. Recognition confidence fluctuated between 65% and 88%, and the driver braked, with a reported maximum deceleration of 2.1 m/s2. The corresponding white-car record at the same reported illuminance had a minimum TTC of 0.58 s without driver takeover. Because both target type and color differed, this comparison does not isolate target reflectance as a causal factor. Figure 5 is an illustrative dashboard record of the vehicle-following context and is not used to establish the reported speed or TTC of T2-3. The adaptive cruise control (ACC) labels in Table 8 refer to the longitudinal-assistance context of these records.
Figure 5.
Illustrative dashboard record in the traffic-jam-assist vehicle-following context.
5.3. Bright-to-Dark Transition at a Tunnel Entrance
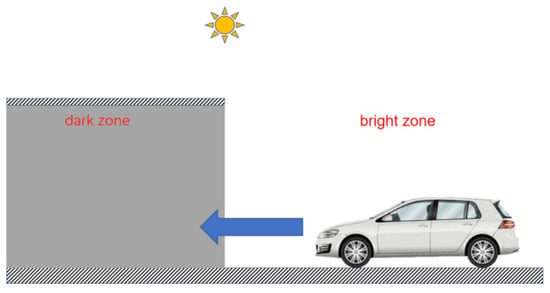
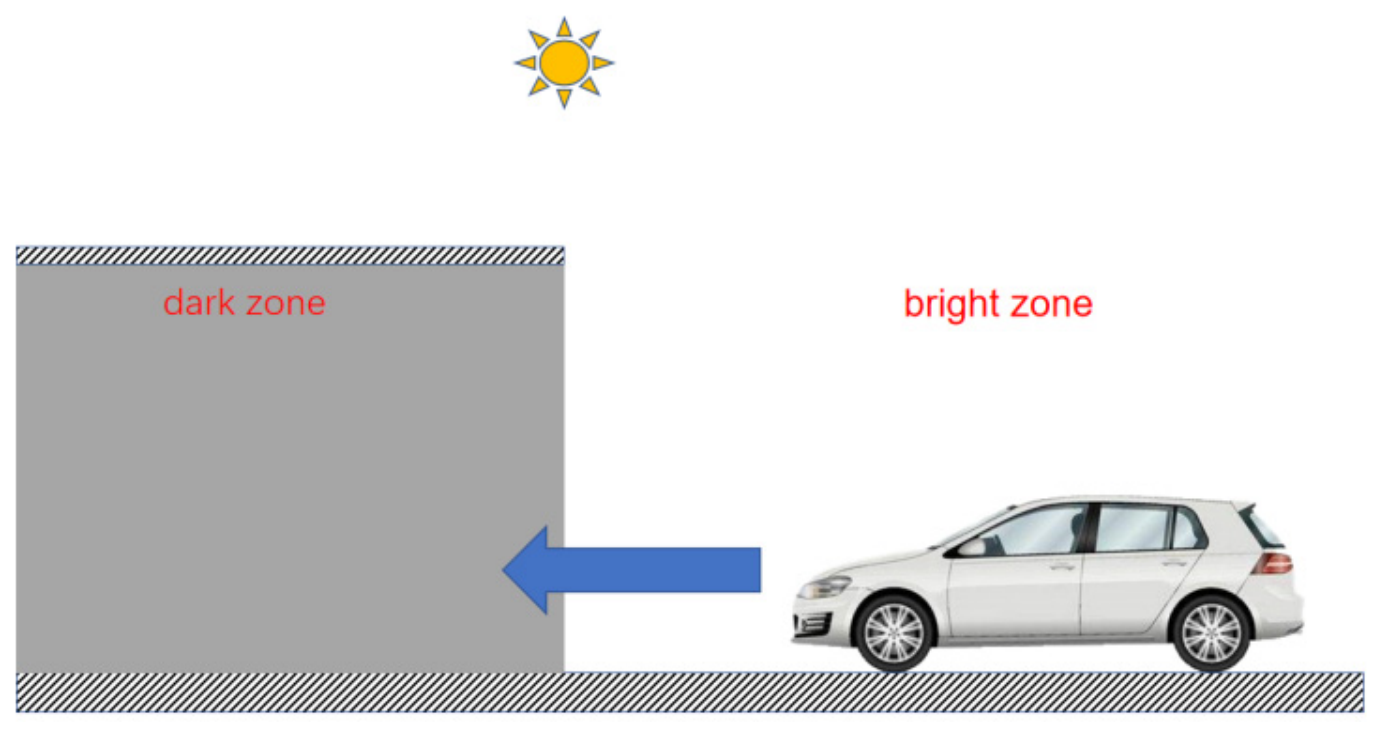
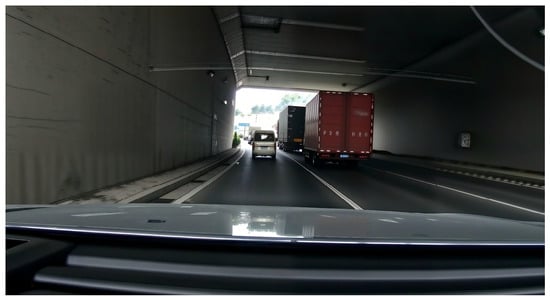
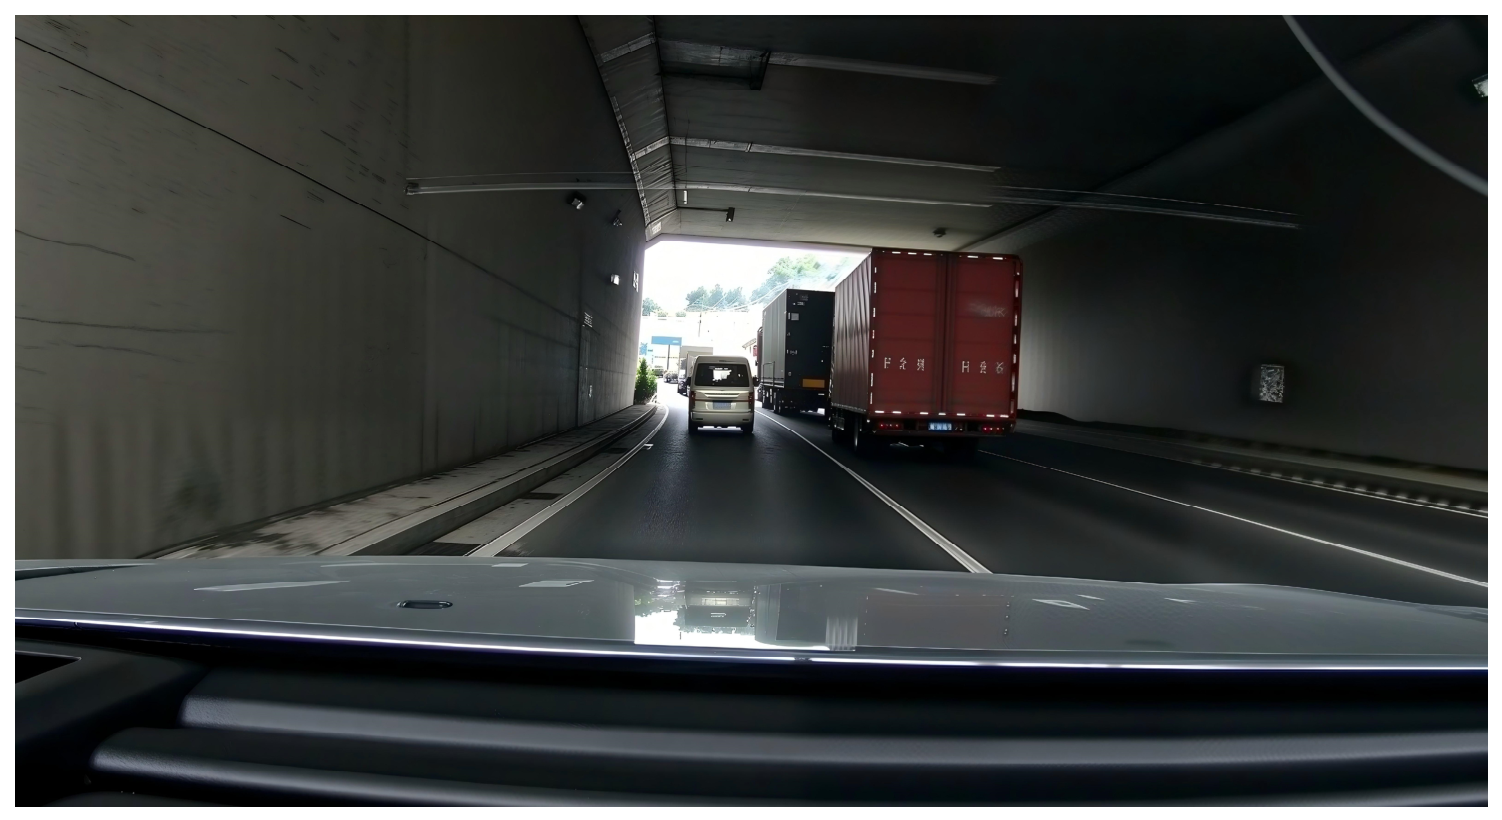
In trial T3-3, illuminance was approximately 31,000 lx outside the tunnel and 22 lx inside the unlit tunnel, giving a reported illuminance ratio of 1409 within 1 s. The vehicle entered at 62 km/h in ICA mode. Lane-marking confidence fell from 95% to 41%, lateral assistance disengaged, and the maximum lateral offset was 0.35 m. The reported recovery time was 2.2 s, after which lateral assistance restarted without driver takeover. The 80 km/h record at the same reported ratio had 33% confidence, a lateral offset of 0.52 m, and a recovery time of 3.1 s. The ratio is based on illuminance in lux, rather than a separate measurement of surface luminance. Figure 6 and Figure 7 illustrate the tunnel-entry geometry and road context. Table 8 summarizes the twelve trial records.
Figure 6.
Schematic of the bright-to-dark transition at a tunnel entrance.
Figure 7.
Field image of the bright-to-dark transition at the tunnel entrance.
5.4. Complexity Ranking and Interpretation
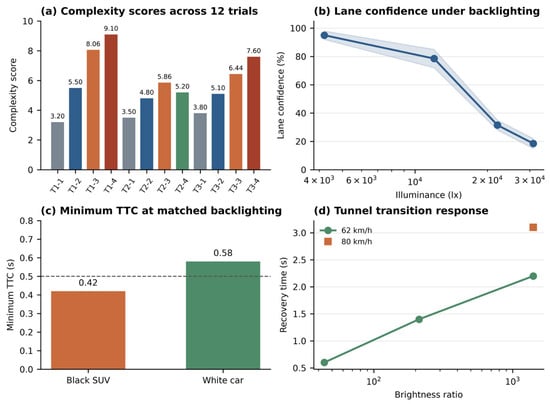
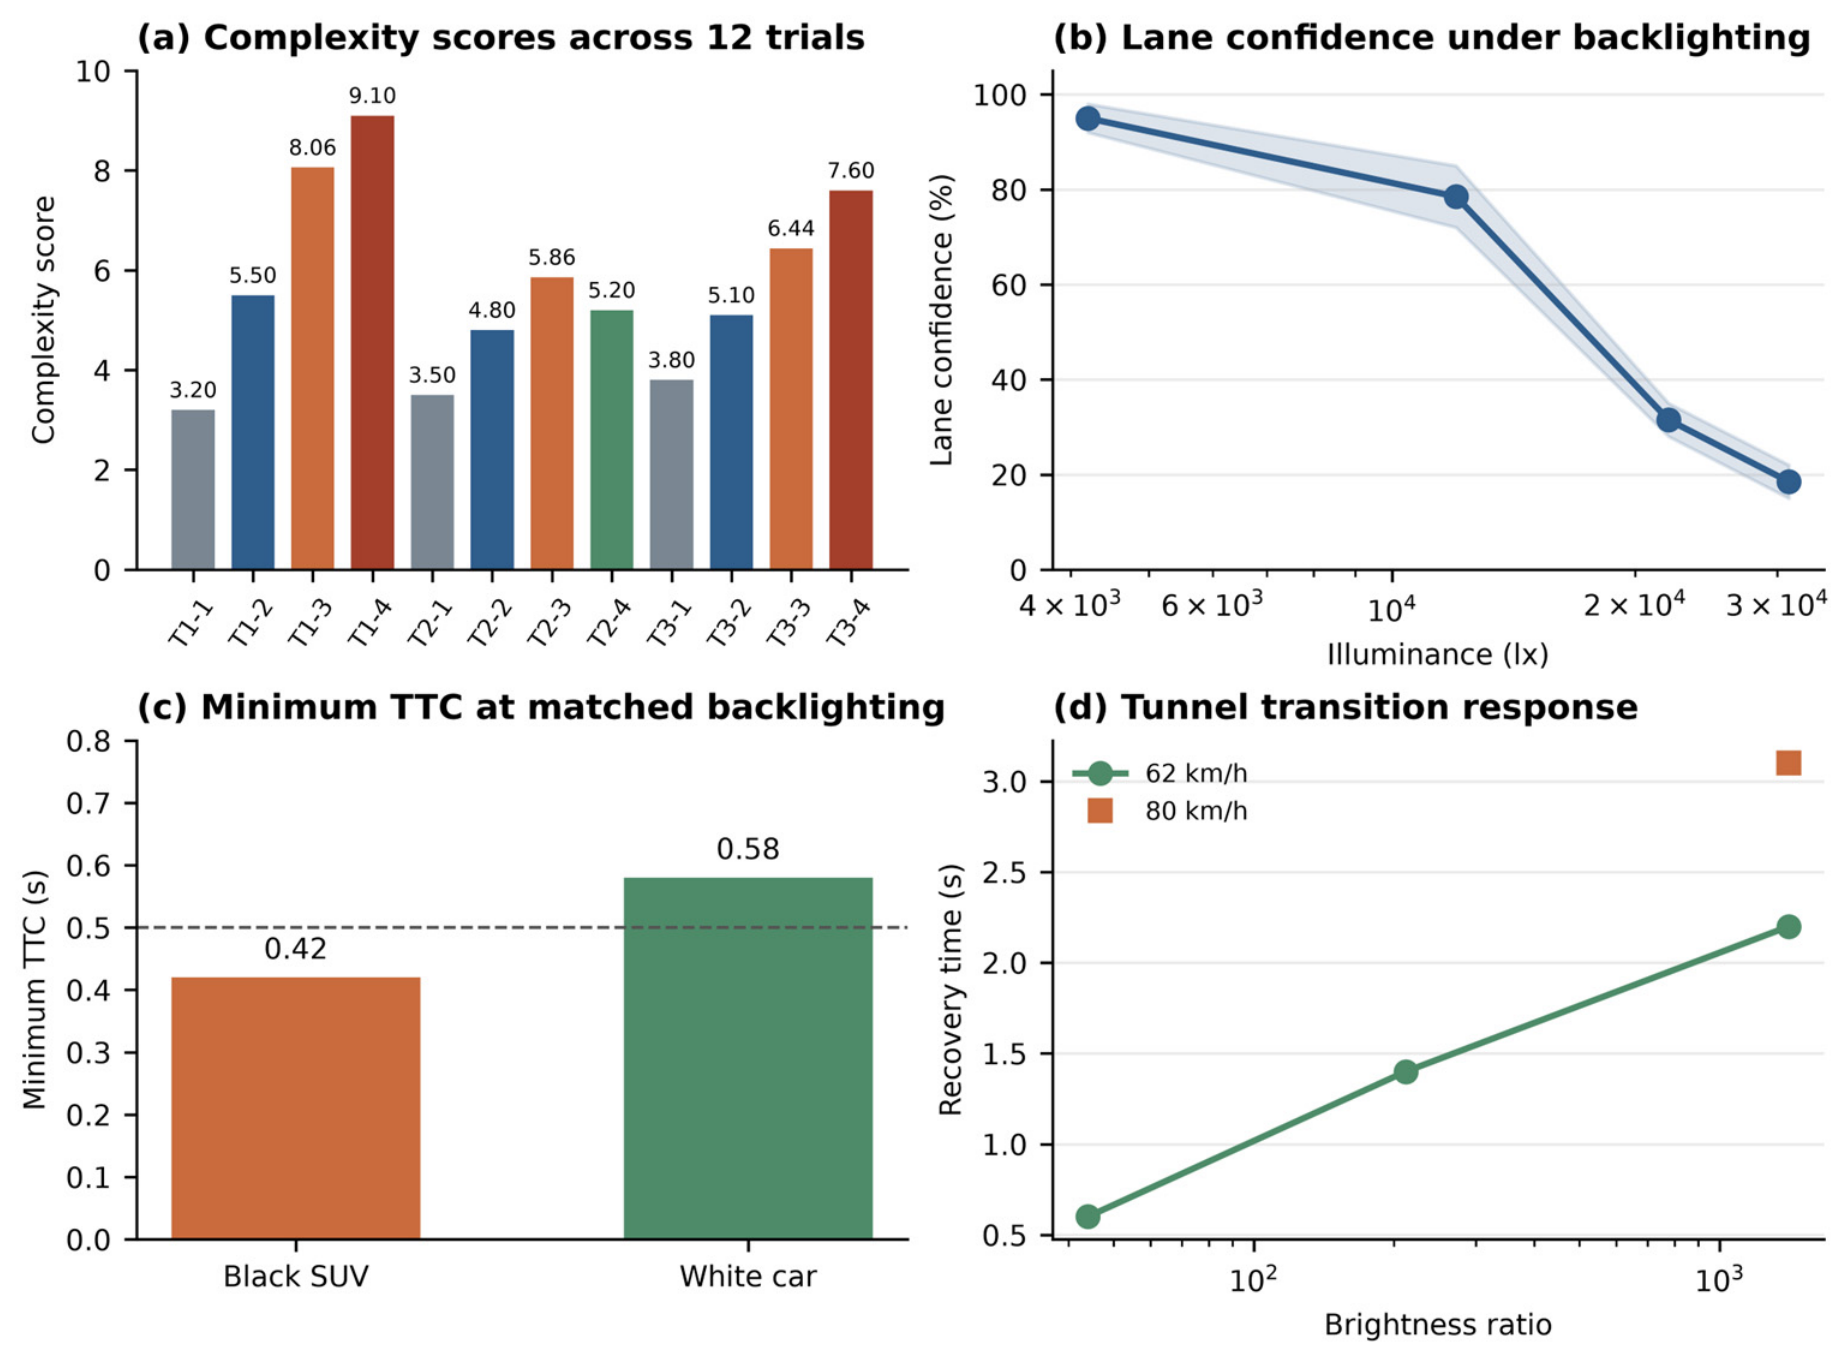
The reported scores range from 3.20 to 9.10 across the twelve trials (Table 8 and Figure 8a). T1-4 ranked first (9.10), whereas T1-1 ranked last (3.20). T1-3, T2-3 and T3-3 scored 8.06, 5.86 and 6.44 and ranked second, fifth, and fourth among all twelve trials. Table 9 summarizes these three representative cases; its ranks of first, third, and second refer only to this three-case subset. The two tables therefore use different ranking populations. Figure 8 presents the recorded responses alongside the scores. The shaded band in panel b denotes recorded confidence ranges, not a statistical confidence interval. The dashed 0.5 s line in panel c is the threshold used in the scoring scheme, not a universal safety boundary. The examples show variation within the reported illumination conditions; they do not establish an independent statistical validation of the composite score or its advantage over illuminance alone.
Figure 8.
Complexity scores and recorded functional responses in the illumination-related trials. (a) Complexity scores for the twelve trials; (b) lane-marking recognition confidence versus illuminance under backlighting, with the shaded band indicating recorded confidence ranges; (c) minimum TTC for the black-SUV and white-car records, with the dashed line indicating the 0.5 s scoring threshold; (d) tunnel-transition recovery time versus illuminance ratio at 62 and 80 km/h.
Table 9.
Three representative cases, with ranks within this subset.
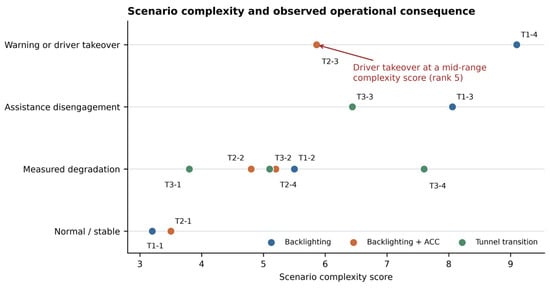
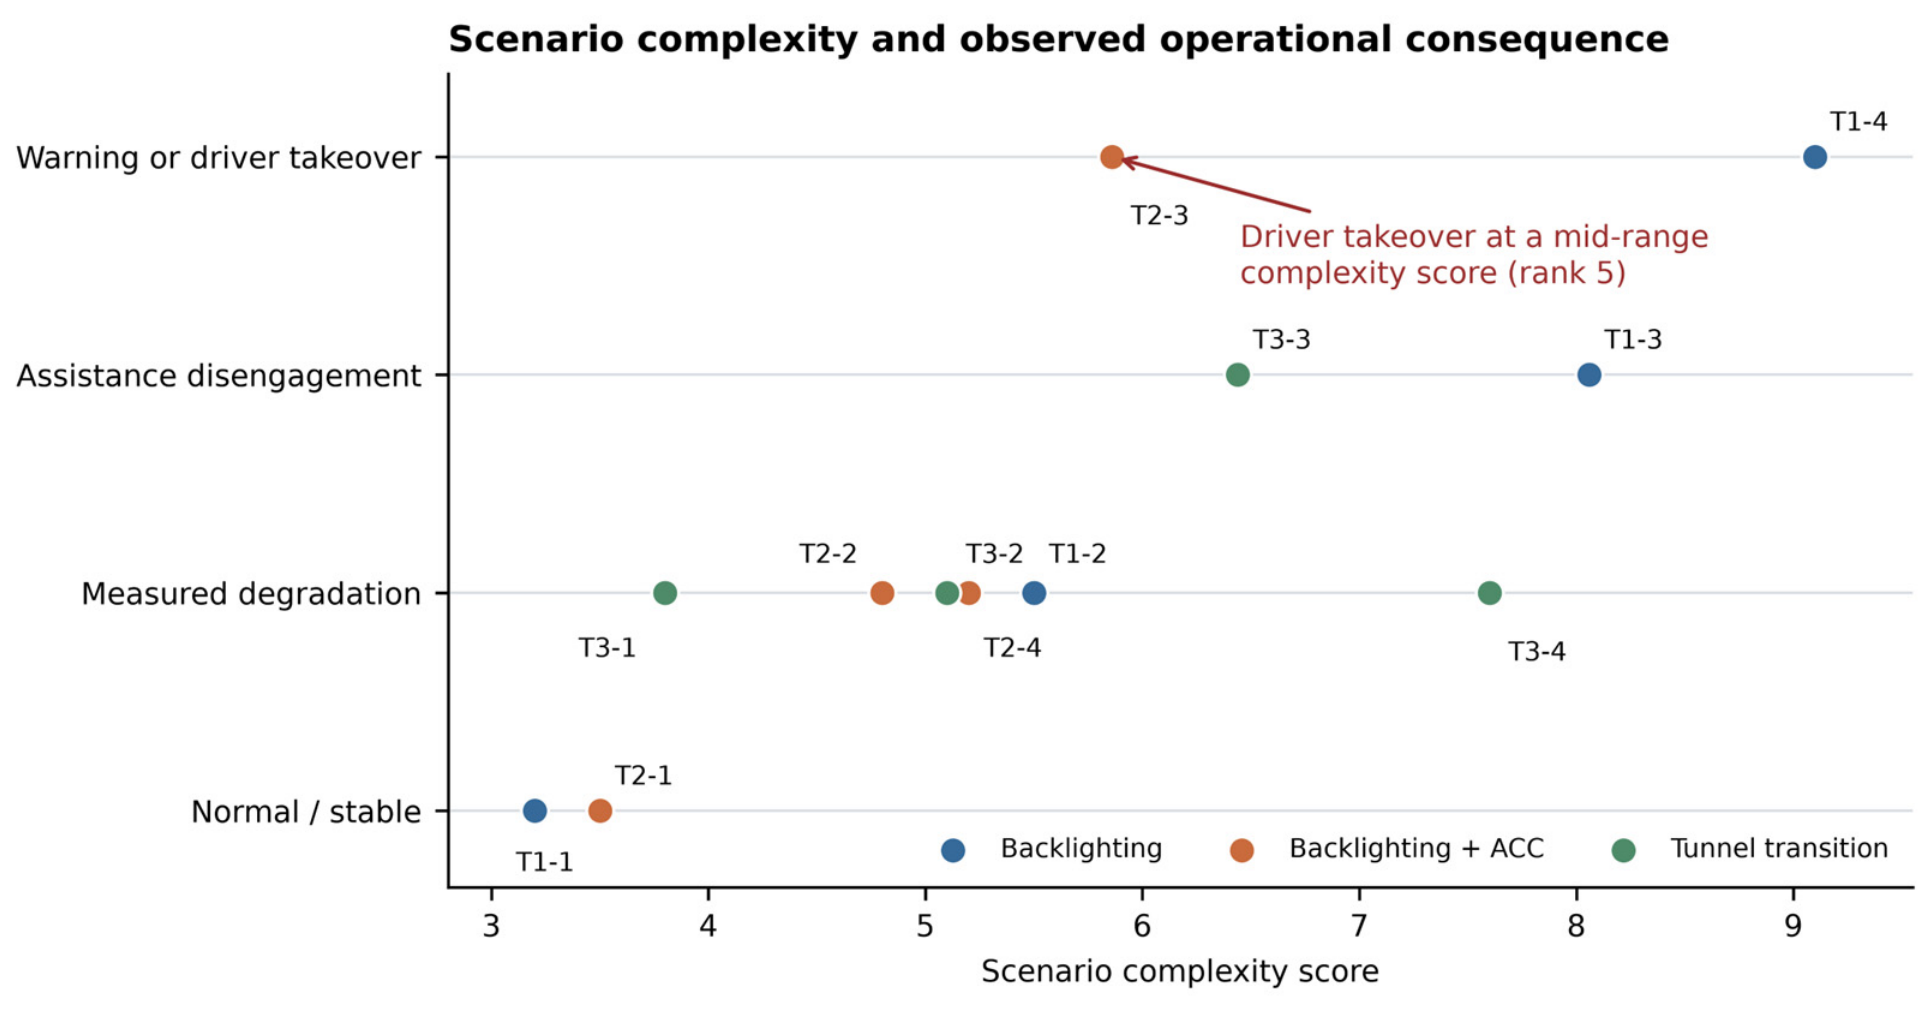
The ranking requires careful interpretation because the index describes scenario complexity rather than accident risk. T2-3 ranked fifth among the twelve trials but involved driver braking when the minimum TTC was 0.42 s. T3-4 ranked third and had a lateral offset of 0.52 m and a recovery time of 3.1 s. These observations show why score rank cannot replace the interpretation of functional outcomes. Figure 9 uses ordered descriptive categories for normal or stable operation, measurable degradation, assistance disengagement, and warning or driver takeover. These categories summarize the recorded function states; their numerical spacing is not a calibrated severity scale or an accident-probability estimate. In addition, a comparison with TTC or fault outcomes is not independent if the same quantities also enter the complexity score. Complexity scores should therefore be reported alongside intervention, TTC, deceleration, function state, and event outcome.
Figure 9.
Complexity scores and descriptive functional-outcome categories for the twelve trials.
6. Discussion
The proposed framework treats mileage and scenario conditions as complementary descriptions of open-road testing. Mileage indicates exposure volume, while the scenario library records the conditions encountered by the target functions. The present analysis illustrates this distinction through selected illumination-related trials. It provides a basis for documenting demanding conditions and selecting cases for closer examination but does not demonstrate complete route comparison or independent validation of all three scoring dimensions.
The scenario library can also support the organization of cases for simulation, replay, or proving-ground reconstruction. A useful event record should retain environmental, road, and traffic-flow conditions together with the observed function state and driver response [8,9,10,11,12]. Scenario selection and safety interpretation nevertheless serve different purposes. TTC, required deceleration, post-encroachment time, and disengagement records remain relevant to safety assessment [13,14,17]. The complexity score summarizes selected demands on sensing and operation; it does not estimate accident probability or replace those measures. Where outcome-related variables are included in the scoring scheme, they must be separated from the outcome before any predictive association is interpreted.
Several limitations affect the interpretation of the results. The weights reflect judgments from eight engineers, and the reported mean weights do not establish inter-rater agreement or ranking robustness. The original element-level point allocations, absent-element conventions, dimension scales, and item-specific threshold sources are unavailable, so the reported total scores cannot be independently reconstructed. The environmental, road, and traffic-flow component scores for the twelve trials are also unavailable; a worked reconstruction and reweighting analysis cannot be provided from total scores alone.
The twelve records cover three illumination-related families and do not independently validate road-dominated or traffic-flow-dominated conditions. Target type and color differ in the vehicle-following comparison, limiting attribution to reflectance. The expert-elicitation protocol, trial segmentation, channel-specific sampling rates, calibrated measurement uncertainties, synchronization accuracy, and TTC calculation details cannot be verified from the retained records. Furthermore, the presented results do not establish independent replication or a statistical relationship between complexity and functional failure, nor do they quantitatively demonstrate an advantage over illuminance, illuminance ratio, or TTC. The regional field coverage also limits geographic generalization. These constraints restrict the present conclusions to a descriptive, case-based application of the framework. Broader validation remains a task for future research; the index is not a standalone safety-certification measure.
7. Conclusions
This study presents a scenario-element library and an expert-weighted complexity index for open-road testing of intelligent connected vehicles. The library covers environmental, road, human, vehicle, and traffic-flow factors; the numerical index combines the environmental, road, and traffic-flow dimensions with mean weights of 0.40, 0.35, and 0.25. The reported field campaign covered more than 10,000 km in the Pearl River Delta, while the quantitative case analysis comprises twelve illumination-related trial records. The reported scores range from 3.20 to 9.10. T1-3, T2-3, and T3-3 rank second, fifth, and fourth among those twelve records, respectively.
The cases illustrate why complexity scores and functional outcomes should be interpreted together. T2-3 involved the driver braking at a minimum TTC of 0.42 s despite its fifth-place complexity ranking. In the tunnel records, the 62 km/h and 80 km/h conditions had reported recovery times of 2.2 s and 3.1 s, respectively, at an illuminance ratio of 1409. These observations support documenting scenario demands alongside function exits, driver intervention, and recovery, rather than treating score rank as accident risk. The framework can support scenario selection and scenario-library organization within this descriptive scope. Complete-route comparison, weight robustness, geographic transfer, and predictive relationships with functional failures are not established by the presented cases.
Author Contributions
Writing—original draft preparation and data curation, Y.W. (Yu Wang); investigation, data curation, and writing—review and editing, J.Z.; writing—review and editing and data curation, Y.Z.; writing—review and editing, visualization, and methodology, Y.W. (Yong Wang). All authors have read and agreed to the published version of the manuscript.
Funding
This work was supported in part by the Key-Area Research and Development Program of Guangdong Province (Department of Science and Technology of Guangdong Province) under Grant 2023B0909040002.
Data Availability Statement
The field-test data contain proprietary vehicle information, test-route records, and operational details and are not publicly available. Access requests may be directed to the corresponding author, subject to permission from the data owner and applicable confidentiality restrictions.
Conflicts of Interest
Author Jianhua Zhou was employed by the company CATARC Automotive Test Center (Guangzhou) Co., Ltd. The remaining authors declare that the research was conducted in the absence of any commercial or financial relationships that could be construed as a potential conflict of interest.
References
- Wang, Y.; Wang, P.; He, H.; Wu, J.; Tang, Y.; Kuang, Z. Q-Advantage Integrated Human-Guided Reinforcement Learning for Safe End-to-End Autonomous Driving. IEEE Trans. Intell. Transp. Syst. 2026, 27, 2957–2969. [Google Scholar] [CrossRef] [Scilit]
- Pei, S.; Wang, Y.; Zhu, Y.; Sun, C.; Li, Q.; Zhao, Y.; Tan, H. Safe and Stylized Trajectory Planning for Autonomous Driving via Diffusion Model. arXiv 2026, arXiv:2602.04329. [Google Scholar] [CrossRef] [Scilit]
- Wang, Y.; Tang, J.; Li, Q.; Zhao, Y.; Sun, C.; He, H. Model-Free Control Framework for Stability and Path Tracking of Autonomous Independent-Drive Vehicles. IEEE Trans. Transp. Electrif. 2025, 11, 8863–8875. [Google Scholar] [CrossRef] [Scilit]
- National Highway Traffic Safety Administration. Automated Driving Systems 2.0: A Vision for Safety; U.S. Department of Transportation: Washington, DC, USA, 2017.
- Kalra, N.; Paddock, S.M. Driving to Safety: How Many Miles of Driving Would It Take to Demonstrate Autonomous Vehicle Reliability? RAND Corporation: Santa Monica, CA, USA, 2016. [Google Scholar]
- Macioszek, E.; Tumminello, M.L. Simulating Vehicle-to-Vehicle Communication at Roundabouts. Transp. Probl. 2024, 19, 45–57. [Google Scholar] [CrossRef] [Scilit]
- ISO 34502:2022; Road Vehicles—Test Scenarios for Automated Driving Systems—Scenario-Based Safety Evaluation Framework. International Organization for Standardization: Geneva, Switzerland, 2022.
- ASAM. ASAM OpenSCENARIO 2.0.0: Domain-Specific Language for Scenario Description. ASAM e.V. 2022. Available online: https://publications.pages.asam.net/standards/ASAM_OpenSCENARIO/ASAM_OpenSCENARIO_DSL/v2.0.0/index.html (accessed on 10 August 2026).
- ASAM. ASAM OpenSCENARIO XML: Standard for the Description of Dynamic Content in Driving Simulation Applications. ASAM e.V. Available online: https://www.asam.net/standards/detail/openscenario-xml/ (accessed on 10 August 2026).
- ASAM. ASAM OpenDRIVE: Standard for the Description of Road Networks. ASAM e.V. Available online: https://www.asam.net/standards/detail/opendrive/ (accessed on 10 August 2026).
- Ulbrich, S.; Menzel, T.; Reschka, A.; Schuldt, F.; Maurer, M. Defining and Substantiating the Terms Scene, Situation, and Scenario for Automated Driving. In Proceedings of the 2015 IEEE 18th International Conference on Intelligent Transportation Systems; IEEE: New York, NY, USA, 2015; pp. 982–988. [Google Scholar] [CrossRef] [Scilit]
- Menzel, T.; Bagschik, G.; Maurer, M. Scenarios for Development, Test and Validation of Automated Vehicles. In Proceedings of the 2018 IEEE Intelligent Vehicles Symposium; IEEE: New York, NY, USA, 2018; pp. 1821–1827. [Google Scholar] [CrossRef] [Scilit]
- Westhofen, L.; Neurohr, C.; Koopmann, T.; Butz, M.; Schütt, B.; Utesch, F.; Neurohr, B.; Gutenkunst, C.; Böde, E. Criticality Metrics for Automated Driving: A Review and Suitability Analysis of the State of the Art. Arch. Comput. Methods Eng. 2023, 30, 1–35. [Google Scholar] [CrossRef] [Scilit]
- Tulpule, P.; Chen, B.-S.; Vaidya, U. Criticality Assessment of Simulation-Based AV/ADAS Test Scenarios; SAE Technical Paper 2022-01-0070; SAE International: Warrendale, PA, USA, 2022. [Google Scholar] [CrossRef] [Scilit]
- Cai, J.; Deng, W.; Guang, H.; Wang, Y.; Li, J.; Ding, J. A Survey on Data-Driven Scenario Generation for Automated Vehicle Testing. Machines 2022, 10, 1101. [Google Scholar] [CrossRef] [Scilit]
- Pascale, M.T.; Rodwell, D.; Coughlan, P.; Kaye, S.-A.; Demmel, S.; Dehkordi, S.G.; Bond, A.; Lewis, I.; Rakotonirainy, A.; Glaser, S. Passengers’ Acceptance and Perceptions of Risk While Riding in an Automated Vehicle on Open, Public Roads. Transp. Res. Part F Traffic Psychol. Behav. 2021, 83, 274–290. [Google Scholar] [CrossRef] [Scilit]
- California Department of Motor Vehicles. Autonomous Vehicle Permit Holders Report a Record 9 Million Test Miles in California in 12 Months. 2024. Available online: https://www.dmv.ca.gov/portal/news-and-media/news-releases/autonomous-vehicle-permit-holders-report-a-record-9-million-test-miles-in-california-in-12-months/ (accessed on 10 August 2026).
- Wang, R.; Zhu, Y.; Zhao, X.; Xu, Z.; Zhou, W.; Liu, T. Research Progress on Test Scenario of Autonomous Driving. J. Traffic Transp. Eng. 2021, 21, 21–37. [Google Scholar] [CrossRef]
- Wang, R.; Sun, Y.; Song, J. Evaluation Method and Test Verification of Road Test Scenes for Autonomous Vehicles. Automot. Eng. 2021, 43, 620–628. [Google Scholar] [CrossRef]
- Tang, S.; Zhang, Z.; Zhang, Y.; Zhou, J.; Guo, Y.; Liu, S.; Guo, S.; Li, Y.-F.; Ma, L.; Xue, Y.; et al. A Survey on Automated Driving System Testing: Landscapes and Trends. ACM Trans. Softw. Eng. Methodol. 2023, 32, 124. [Google Scholar] [CrossRef] [Scilit]
- Koopman, P.; Wagner, M. Challenges in Autonomous Vehicle Testing and Validation. SAE Int. J. Transp. Saf. 2016, 4, 15–24. [Google Scholar] [CrossRef] [Scilit]
- Aemalla, S.R.; Mopidevi, S. A Hybrid BiLSTM-MPC Predictive Control Strategy for Energy and Thermal Management of Electric Vehicles with Real-Time Validation. Sci. Rep. 2026. advance online publication. [Google Scholar] [CrossRef] [Scilit]

Disclaimer/Publisher’s Note: The statements, opinions and data contained in all publications are solely those of the individual author(s) and contributor(s) and not of MDPI and/or the editor(s). MDPI and/or the editor(s) disclaim responsibility for any injury to people or property resulting from any ideas, methods, instructions or products referred to in the content. |
© 2026 by the authors. Licensee MDPI, Basel, Switzerland. This article is an open access article distributed under the terms and conditions of the Creative Commons Attribution (CC BY) license.