


Abstract
External human–machine interfaces (eHMIs) may shape reported trust, concern, and acceptance of automated vehicles. This exploratory secondary analysis examines whether a three-item concern index adds information beyond perceived risk and trust while accounting for repeated observations. The dataset contains 310 trials from 10 participants. The legacy security-adjacent concern (SAC) label is retained for traceability, but the index is interpreted as general concern rather than a validated security construct. The Gaussian participant-clustered generalized estimating equations use bias-reduced covariance estimation and approximate Student’s t-inference with nine degrees of freedom. SAC was negatively associated with standardized acceptance in Model 1 (B = −0.765; 95% CI: −0.903 to −0.626). After adding perceived risk and trust, the coefficient was −0.175 (95% CI: −0.369 to 0.020; p = 0.073). Its approximately 77% attenuation is a specification-dependent coefficient change, not a measure of shared psychological mechanisms. Pooled and participant-centered item diagnostics did not support separating SAC from risk and trust. Reduced specifications, independence working correlation, and a participant jackknife supported a negative overall concern–acceptance relationship but not a precise independent SAC contribution. Text and non-text eHMIs were each associated with higher acceptance than no eHMI; their direct contrast was imprecise and does not establish equivalence. Original-condition summaries revealed variation masked by broad grouping. The contribution is a reproducible measurement and inference reassessment, with no direct test of trust calibration, communication integrity, or cybersecurity resilience.
1. Introduction
External human–machine interfaces (eHMIs) are a proposed communication layer between automated vehicles and people outside the vehicle. Their engineering purpose is not simply to display information, but to supplement vehicle motion with an additional cue about operational state or intended action. Because pedestrians, cyclists, and other drivers normally combine vehicle kinematics with informal human cues, external communication becomes especially relevant when a highly automated vehicle has no visible human driver [1,2].
A central design problem is whether the external message is interpreted as credible and consistent with what the vehicle is actually doing. Prior eHMI studies show that communication can improve transparency, perceived safety, and trust, while mismatches between an external signal and vehicle kinematics can undermine those responses [3,4,5]. This creates an important distinction between the visual format of an eHMI and the broader judgment that the vehicle and its communication are dependable. The latter judgment may include suspicion, perceived harm, and perceived security in addition to conventional trust and risk ratings.
Trust must be distinguished from trust calibration. Appropriate reliance concerns whether trust is aligned with what automation can actually do [6]. This dataset records reported confidence, dependability, and trust, but contains no independent reliability benchmark against which calibration can be assessed. We, therefore, use reported trust throughout. Likewise, the in-vehicle interface literature [7] offers context for trust and acceptance but should not be treated as direct evidence about external communication to road users.
The eHMI literature spans differences in signal semantics, activation, vehicle motion, and display placement [1,2,3,4,5,8]. Reviews organize this diversity but do not justify interpreting text/non-text comparisons as pure modality effects. A useful reanalysis should retain the original configurations descriptively and make explicit the information sacrificed when reducing them to broad groups.
Cybersecurity provides one possible motivation for studying these judgments, because a compromised automated vehicle or manipulated eHMI could theoretically present misleading information. However, direct evidence about a cyberattack requires a direct manipulation or measurement of phenomena such as spoofing, message injection, replay, unauthorized control, or authentication failure. Experiments that explicitly expose participants to security-related automated-vehicle failures show that such events can alter trust and risk perception [9,10]. General questionnaire items about suspicion or security are not equivalent to those manipulations.
Technical AI resilience offers a complementary engineering perspective. Moskalenko, Kharchenko, and Semenov [11] evaluate resource-constrained AI under faults and adversarial disturbances using performance-oriented tests. Their work concerns engineering robustness and recovery, not eHMI user perceptions. It helps define why a security-related questionnaire response cannot establish a system’s objective resilience.
The publicly available Autonomous Vehicle Communication Strategies dataset contains repeated eHMI trials with post-trial perceptions. The present work retains the legacy label security-adjacent concern (SAC) for its three-item index but interprets it conservatively as general concern. Suspicion, anticipated harm, and low perceived security motivate an exploratory examination of negative evaluations; they do not establish a separate security-related latent variable. The question is whether this index contributes information beyond conventional trust and perceived risk, rather than whether cybersecurity risk has been measured.
A second issue is methodological. The workbook contains 310 trial rows but only 10 independent participants. Ignoring clustering can overstate independent information. GEE [12] with a bias-reduced covariance estimator [13] addresses dependence, but neither method removes the limitations imposed by so few clusters. The reanalysis, therefore, compares model complexity, working correlation, and inferential choices and emphasizes uncertainty rather than a significance threshold.
The source study already examined eHMI designs, perceptions, and acclimation. The present contribution is narrower: a transparent audit of an exploratory concern composite, explicit cluster-aware uncertainty, and sensitivity to correlated constructs and model specifications. Interface associations are contextual reassessments of existing data, not independent replication. Differences from the source study’s text/non-text findings cannot be assigned to any single change because scoring, adjustment, and inference also differ.
RQ1 asks how general concern (legacy SAC) is associated with acceptance under participant clustering. RQ2 asks how the coefficient changes when related perceived risk and trust measures enter the model, and whether item diagnostics support discriminant specificity. RQ3 asks how eHMI presence, grouped configurations, and vehicle yielding are associated with concern and acceptance. Road-user mode is an adjustment factor. These are exploratory association questions; no demographic moderation, causal mediation, display location effect, or technical cybersecurity outcome is tested.
2. Materials and Methods
2.1. Data Source and Repeated-Trial Structure
This is a secondary analysis of de-identified public data from the Autonomous Vehicle Communication Strategies Project (Project No. 20ITSUNM32). No new participants or experimental observations were collected. The source project used immersive VR in pedestrian, cycling, and driving simulator contexts. The supplied workbook has two header rows; data begin at Excel row 3. All 310 data rows were retained. Participant, date, mode, yielding, interface, and every item used in the composites were complete; no imputation or row exclusion was required.
The analytical unit in the public workbook is a trial. Ten unique participants generated 310 repeated trials: 141 driving, 104 pedestrian, and 65 cycling observations. Participants encountered one automated vehicle per trial and evaluated it after yielding or non-yielding interactions. Most participants completed multiple interface conditions and returned for a second testing session. Because these observations are nested within participants, participant—not trial—is the independent clustering unit for inference. The original project report attributes the small participant sample to COVID-19 testing constraints.
2.2. eHMI Condition Coding
The five original configurations and no-eHMI baseline were coded A–E and N. A denotes an LED windshield strip, B side-mirror arrows, C grille text, D roof text, and E driver-side-door text. N denotes no interface. A–B form the non-text group and C–E the text group. These broad groups reduce the number of configuration coefficients from five to two in a small sample and correspond to the distinction examined in the source study. They are bundled design categories, not an isolated manipulation of modality. Original-condition counts by mode, descriptive outcomes, and exploratory condition-specific models are reported in Appendix A, Table A4 and Table A5.
Yielding, session, and road-user mode describe experimental context. Session 2 is each participant’s later testing date; all participants had two dates. Driving is the mode reference, non-yielding the yielding reference, and N the interface reference. Text and non-text grouping cannot separate content, placement, animation, or visibility. In particular, E has no pedestrian trials, so its coefficient relies on an additive adjustment across the observed modes and cannot identify a door-display association for pedestrians.
2.3. Construct Operationalization
All study measures were derived from post-trial questionnaire responses. Continuous composites were retained on their original scale orientation, with higher values representing more of the named construct. No continuous outcome was dichotomized in this reanalysis.
Perceived risk was the mean of three items assessing deception, underhanded behavior, and wariness. Trust was the mean of three positive items assessing confidence, dependability, and overall trust in automated vehicles. These items were based on the trust-in-automation framework used by the source project [14].
SAC averages post-trial suspicion (Excel column X), anticipated harmful or injurious outcomes (Z), and reverse-coded perceived security (AB; recoded as 8 minus the raw 1–7 response). We retain SAC only as the legacy analytical label; its substantive interpretation is a general concern index. No separate security construct is assumed or validated. The three items capture related negative evaluations, and the security item may itself be read as general safety or reassurance. NASA-TLX frustration is excluded. This post hoc index measures neither attacks nor technical compromise, and its use serves a measurement audit rather than a claim of security-specific novelty.
Acceptance is the continuous mean of eight adapted Van Der Laan items [15] in Excel columns AE–AL. AE, AF, AH, AI, and AK are recoded as 8 minus the raw value; AG, AJ, and AL are unchanged. Higher scores indicate greater acceptance. Every item must be observed to calculate a composite; all required items are complete in this workbook. No continuous outcome is dichotomized.
Task load is the unweighted mean of the six 1–21 NASA-TLX columns AM–AR [16], retained exactly as recorded, including the performance response. It is, therefore, the recorded-item composite rather than a newly validated workload scale. Cronbach’s alpha is estimated from pooled trial-level item responses. It describes covariance across these repeated responses, mixes within-person and between-person variation, and provides neither independent-participant reliability nor discriminant validity. No alpha confidence intervals or independent-row significance tests are used. Table A1 gives the full item mapping; Table A2 provides pooled, participant-centered, and participant-mean correlations. Descriptive HTMT ratios [17] are calculated from absolute item correlations before and after participant centering; they are overlap screens, not a multilevel measurement model validation. Ten participants are insufficient for a credible confirmatory multilevel factor analysis.
2.4. Participant-Clustered Statistical Analysis
Gaussian GEE with identity link and participant clustering [12] was fitted using Python 3.12.14, statsmodels 0.15.0, pandas 2.2.3, NumPy 2.3.5, and SciPy 1.17.0. Exchangeable working correlation is the main specification; independence is a sensitivity analysis. An intercept is included. The statsmodels GEE.fit implementation uses cov_type = “bias_reduced”, applying the Mancl–DeRouen leverage adjustment to cluster residuals [13]. Iteration uses maxiter = 200 and ctol = 1 × 10⁻⁸, with the default residual scale estimate and no case weights. All fitted models converged. Point estimates are marginal associations and combine within-person and between-person information; they are not person-fixed-effect estimates.
Model 1 includes SAC, task load, two mode indicators, yielding, any eHMI, and session (eight coefficients including the intercept). Model 2 additionally includes perceived risk and trust (10 coefficients including the intercept). Model 2 is an overlap diagnostic and is especially fragile with 10 clusters; it is not a confirmatory model of independent psychological mechanisms. Covariates represent experimental context or workload, and no automated selection or interactions are used. A four-coefficient reduced model includes only SAC, any eHMI, yielding, and an intercept. Intermediate models add only risk or only trust to Model 1; a complementary model excludes SAC while retaining risk and trust. These sensitivity specifications trade adjustment for reduced complexity and do not remove confounding or compensate for limited participant diversity.
Acceptance, SAC, risk, trust, and task load are standardized using pooled means and population standard deviations (ddof = 0) for Models 1–2 and specification checks; indicators remain 0/1. Thus, continuous-predictor coefficients are outcome-SD changes per predictor SD, whereas indicator coefficients are outcome-SD group differences. Presentation-category and original-condition models instead use raw 1–7 acceptance and SAC outcomes. All main confidence intervals use B ± t(0.975, G − 1) × SE with bias-reduced SE; two-sided p-values use the same Student’s t reference (G = 10; df = 9). This pragmatic choice is more conservative than a normal approximation but is not an exact finite-sample correction; df are not the trial residual df or G minus the parameter count. Expanded-model inference remains precarious when the parameter count approaches G. Supplementary CSVs retain normal-approximation p-values for comparison. No threshold establishes confirmatory evidence.
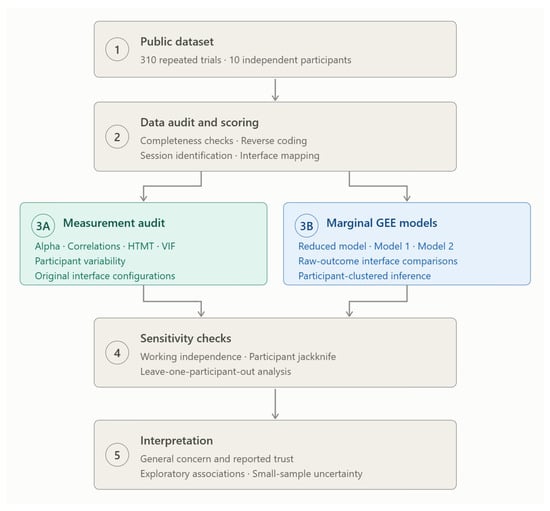
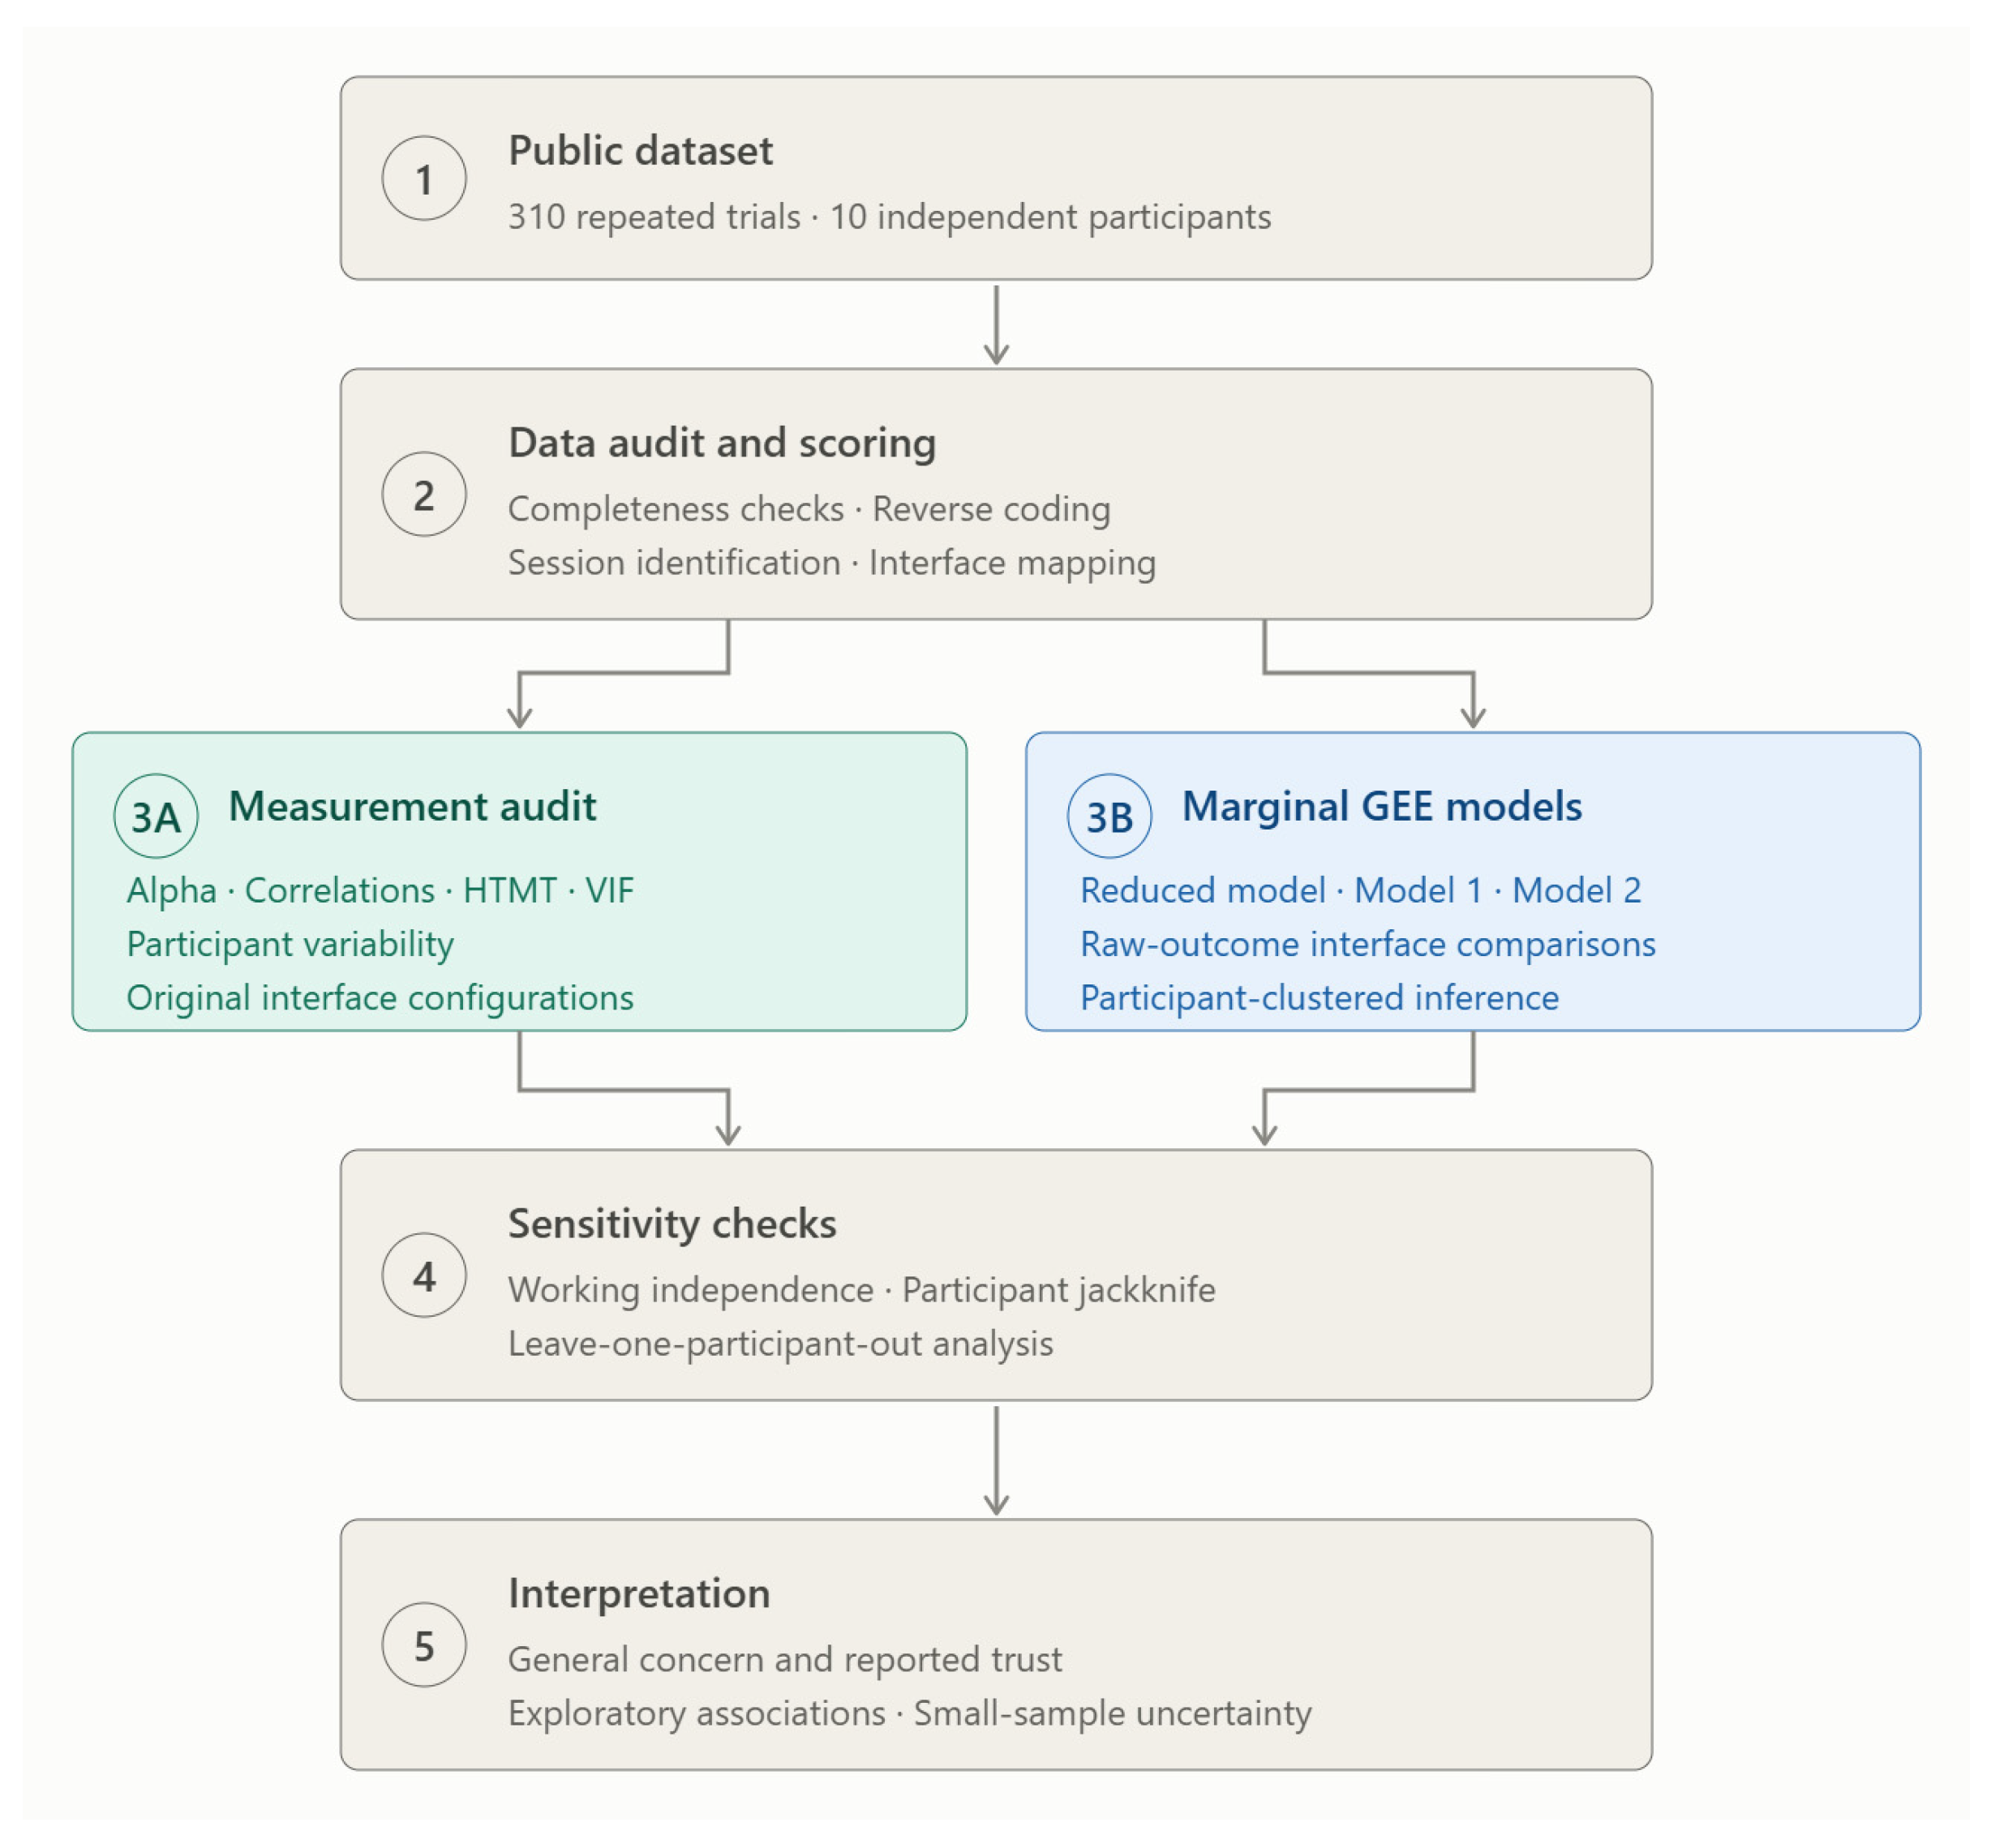
A participant is omitted in turn from Models 1–2 while full-sample standardization remains fixed; refit intervals use df = 8. A separate participant jackknife evaluates alternative uncertainty estimation. Raw-outcome presentation models adjust for mode, yielding, and session; contrasts use the fitted covariance matrix. Six-condition models replace grouped indicators with A–E indicators relative to N. Their 10 coefficients make them descriptive sensitivity analyses rather than design selection models. Figure 1 illustrates the overall analytical framework, including data preparation, the measurement audit, participant-clustered modeling, and sensitivity analyses.
Figure 1.
Analysis framework. The measurement audit and marginal models provide complementary evidence; neither converts repeated trials into independent participants.
3. Results
3.1. Repeated-Measures Data Structure
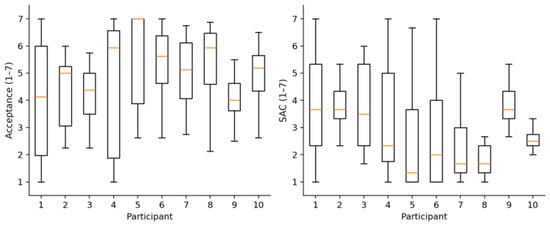
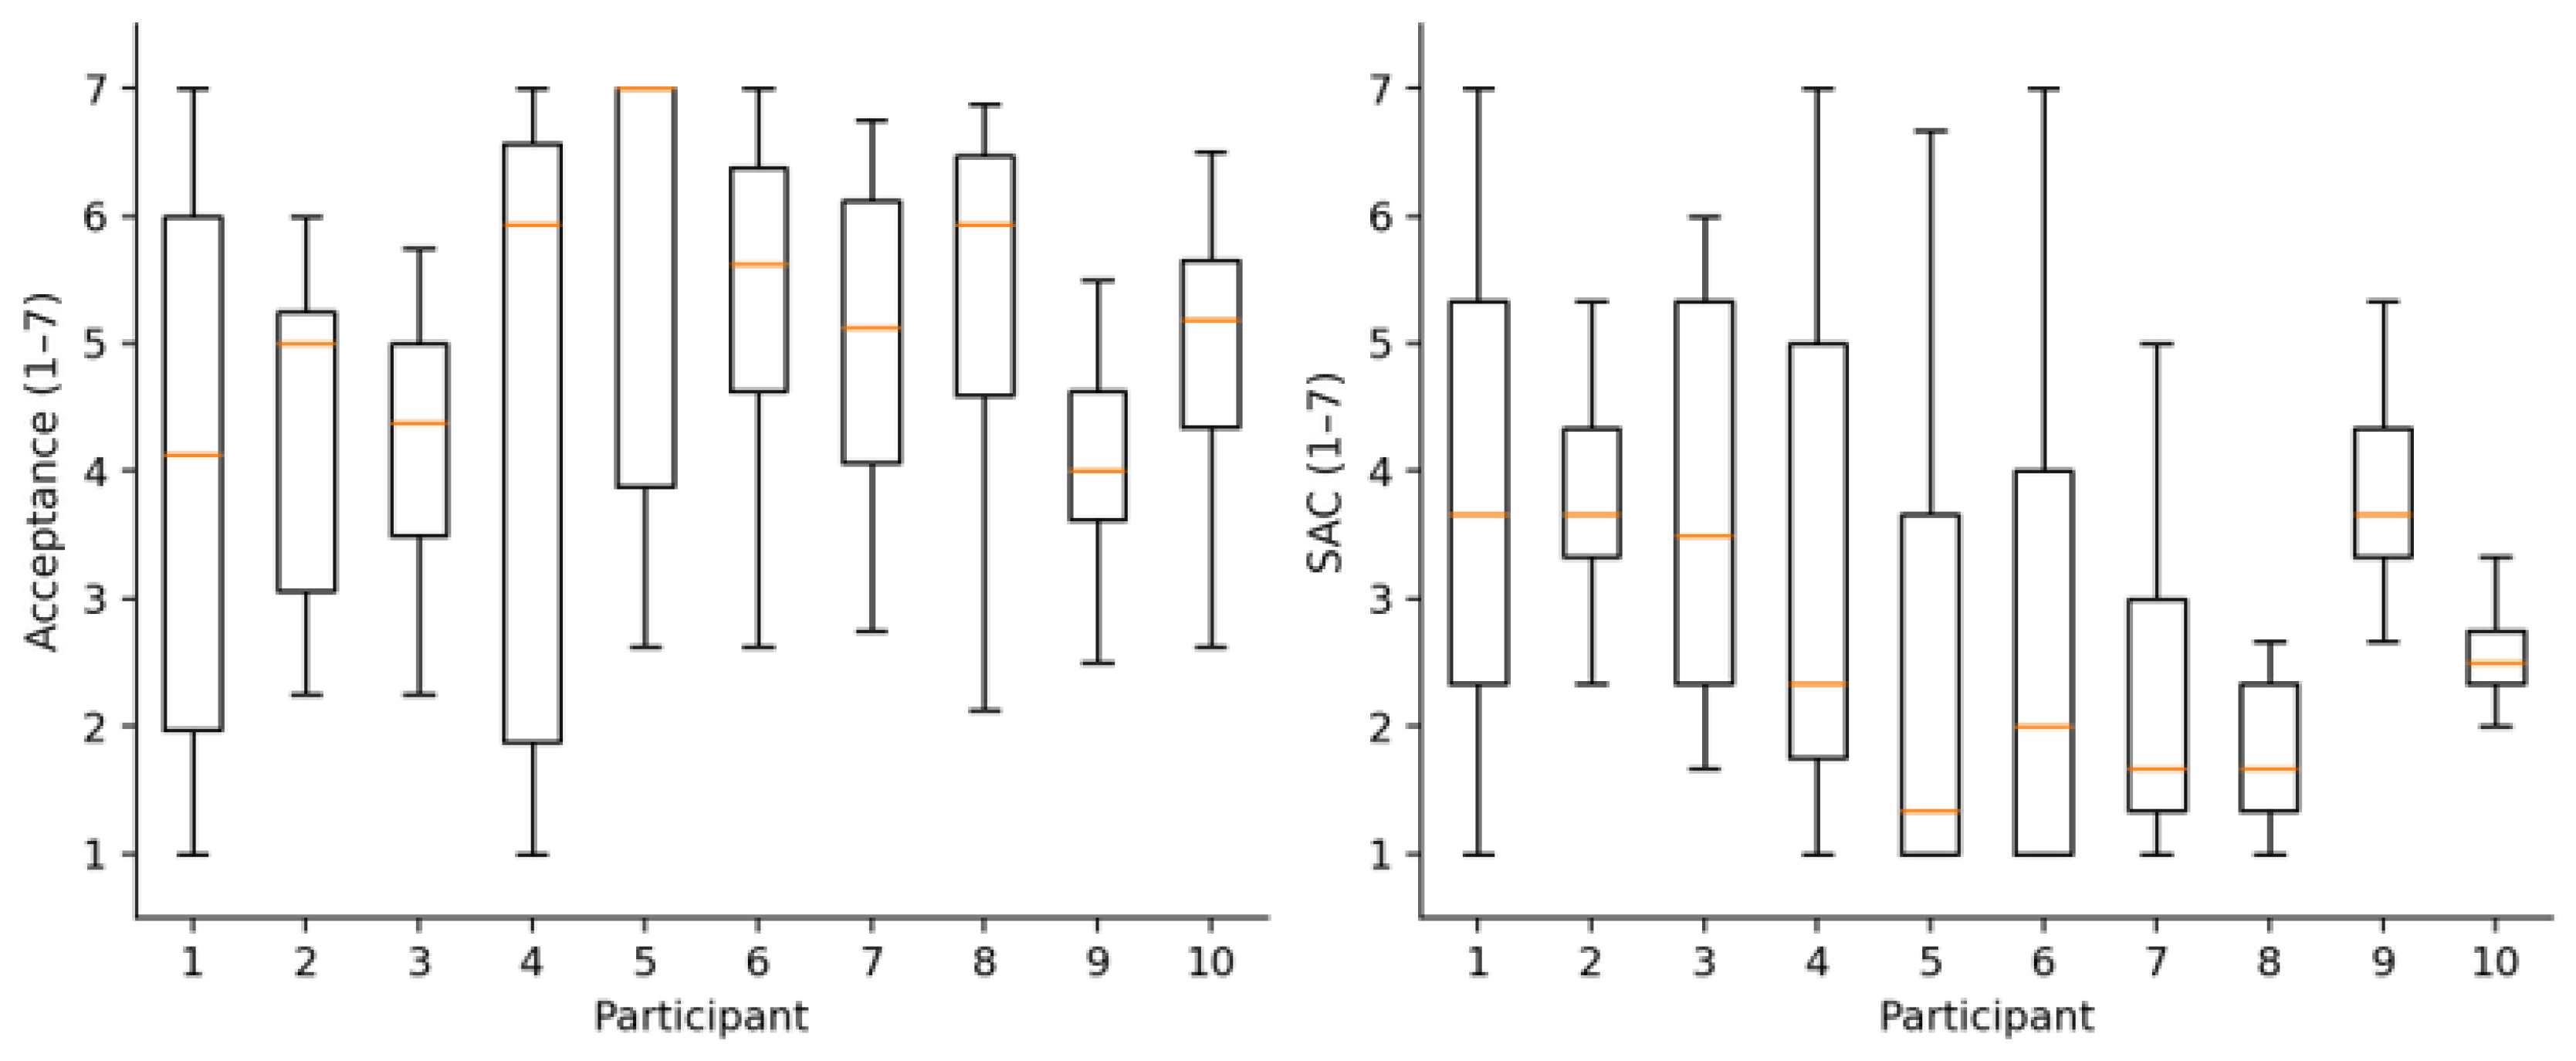
The dataset comprised 10 unique participants who generated 310 repeated observations. The imbalance between trial count and participant count is central to interpretation: all 310 rows contribute information about repeated responses, but the independent sampling unit is the participant. Driving contributed 141 trials from 10 participants, pedestrian scenarios 104 trials from nine participants, and cycling 65 trials from five participants. There were 151 text-eHMI trials, 106 non-text trials, and 53 no-eHMI trials. Yielding occurred in 243 trials and non-yielding in 67; each testing session contributed 155 trials. Table 1 summarizes the repeated-measures structure of the dataset, including the number of participants, trial observations, road-user modes, and experimental conditions. Figure 2 presents the participant-level distributions of acceptance and general concern, highlighting the variability in responses across the 10 participants.
Table 1.
Repeated-measures structure of the analytical dataset.
Figure 2.
Participant-level distributions of acceptance and general concern (legacy SAC). Boxes show medians and interquartile ranges, whiskers extend to 1.5 times the interquartile range, and outliers are hidden. These are descriptive trial distributions, not independent-participant confidence intervals.
3.2. Construct Reliability and Overlap
The pooled alpha values were 0.907 for risk, 0.936 for trust, 0.856 for SAC, 0.968 for acceptance, and 0.743 for task load (Table 2). SAC correlated with risk at 0.910 and trust at −0.870 in pooled trials; after participant centering, these correlations were 0.900 and −0.887. The corresponding correlations among the 10 participant means were 0.966 and −0.837. The pooled HTMT was 1.031 for SAC/risk and 0.968 for SAC/trust; the participant-centered HTMT was 1.022 and 0.986. These descriptive ratios do not support discriminant specificity. Values above one can occur for this empirical ratio and are not probabilities. SAC’s VIF is 8.43 in the four-construct diagnostic and 8.79 in the full Model 2 design matrix (risk: 6.34; trust: 4.57). Complete correlations, HTMT, and VIFs appear in Table A2 and Table A3. High alpha does not override the overlap problem.
Table 2.
Operationalization, reliability, and descriptive statistics of the reanalysis constructs.
3.3. General Concern and Acceptance Under Participant Clustering
In Model 1, standardized SAC was negatively associated with standardized acceptance (B = −0.765; 95% t-interval: −0.903 to −0.626; p < 0.001). Any eHMI versus none was associated with higher acceptance. Other adjusted estimates are shown in Table 3. Although Model 1 includes fewer coefficients than Model 2, its eight coefficients are estimated from only 10 clusters, warranting caution about model complexity.
Table 3.
Participant-clustered GEE models examining SAC and overlapping perception factors in relation to standardized acceptance.
In Model 2, SAC’s coefficient was −0.175 (95% t-interval: −0.369 to 0.020; p = 0.073). A normal reference gives p = 0.042 for the same coefficient and bias-reduced standard error, whereas the t reference gives p = 0.073, illustrating sensitivity to the inferential reference distribution. The change from −0.765 to −0.175 is approximately 77% of Model 1’s absolute coefficient. It describes the sensitivity of a conditional regression coefficient to correlated covariates, not a percentage of shared variance, a mediated effect, or shared psychological mechanisms. Risk remained negative and trust positive in this specification (Table 3). Correlations, HTMT, and VIFs—not coefficient attenuation alone—provide the direct descriptive evidence of overlap.
3.4. Communication Presence, Presentation Format, and Vehicle Yielding
Raw acceptance averaged 2.84 (SD: 1.32) with no eHMI, 4.98 (SD: 1.43) with non-text configurations, and 5.07 (SD: 1.48) with text configurations. The SAC means were 4.44 (SD: 1.49), 2.83 (SD: 1.38), and 2.89 (SD: 1.45), respectively. Adjusted associations relative to no eHMI were positive for acceptance and negative for SAC in both categories (Table 4). The text-minus-non-text contrast was 0.128 acceptance points (95% t-interval: −0.259 to 0.514; p = 0.474) and −0.010 SAC points (−0.290 to 0.270; p = 0.937). These intervals do not establish equivalence, modality irrelevance, or absence of differences between individual designs.
Table 4.
Adjusted GEE contrasts for eHMI presentation category, vehicle yielding, and other experimental conditions.
Yielding was associated with an estimated 1.188-point increase in acceptance (95% t-interval: −0.068 to 2.445; p = 0.061) and a 1.279-point decrease in SAC (−2.204 to −0.354; p = 0.012). The positive acceptance estimate is uncertain under t-based inference. Mode coefficients are adjustments rather than evidence for a hierarchy of user preferences. The original-condition acceptance means ranged from 4.50 for D (roof text) to 5.64 for C (grille text), showing that aggregation can mask variation within the text group. Table A4 gives all condition-by-mode counts; Table A5 retains individual-condition adjusted estimates, treated as exploratory because each model has 10 coefficients and the design is incompletely crossed.
3.5. Leave-One-Participant-Out Robustness Check
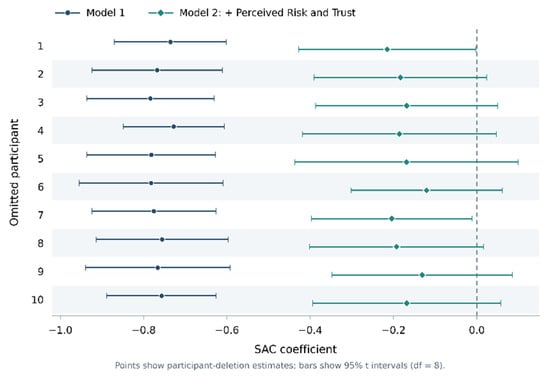
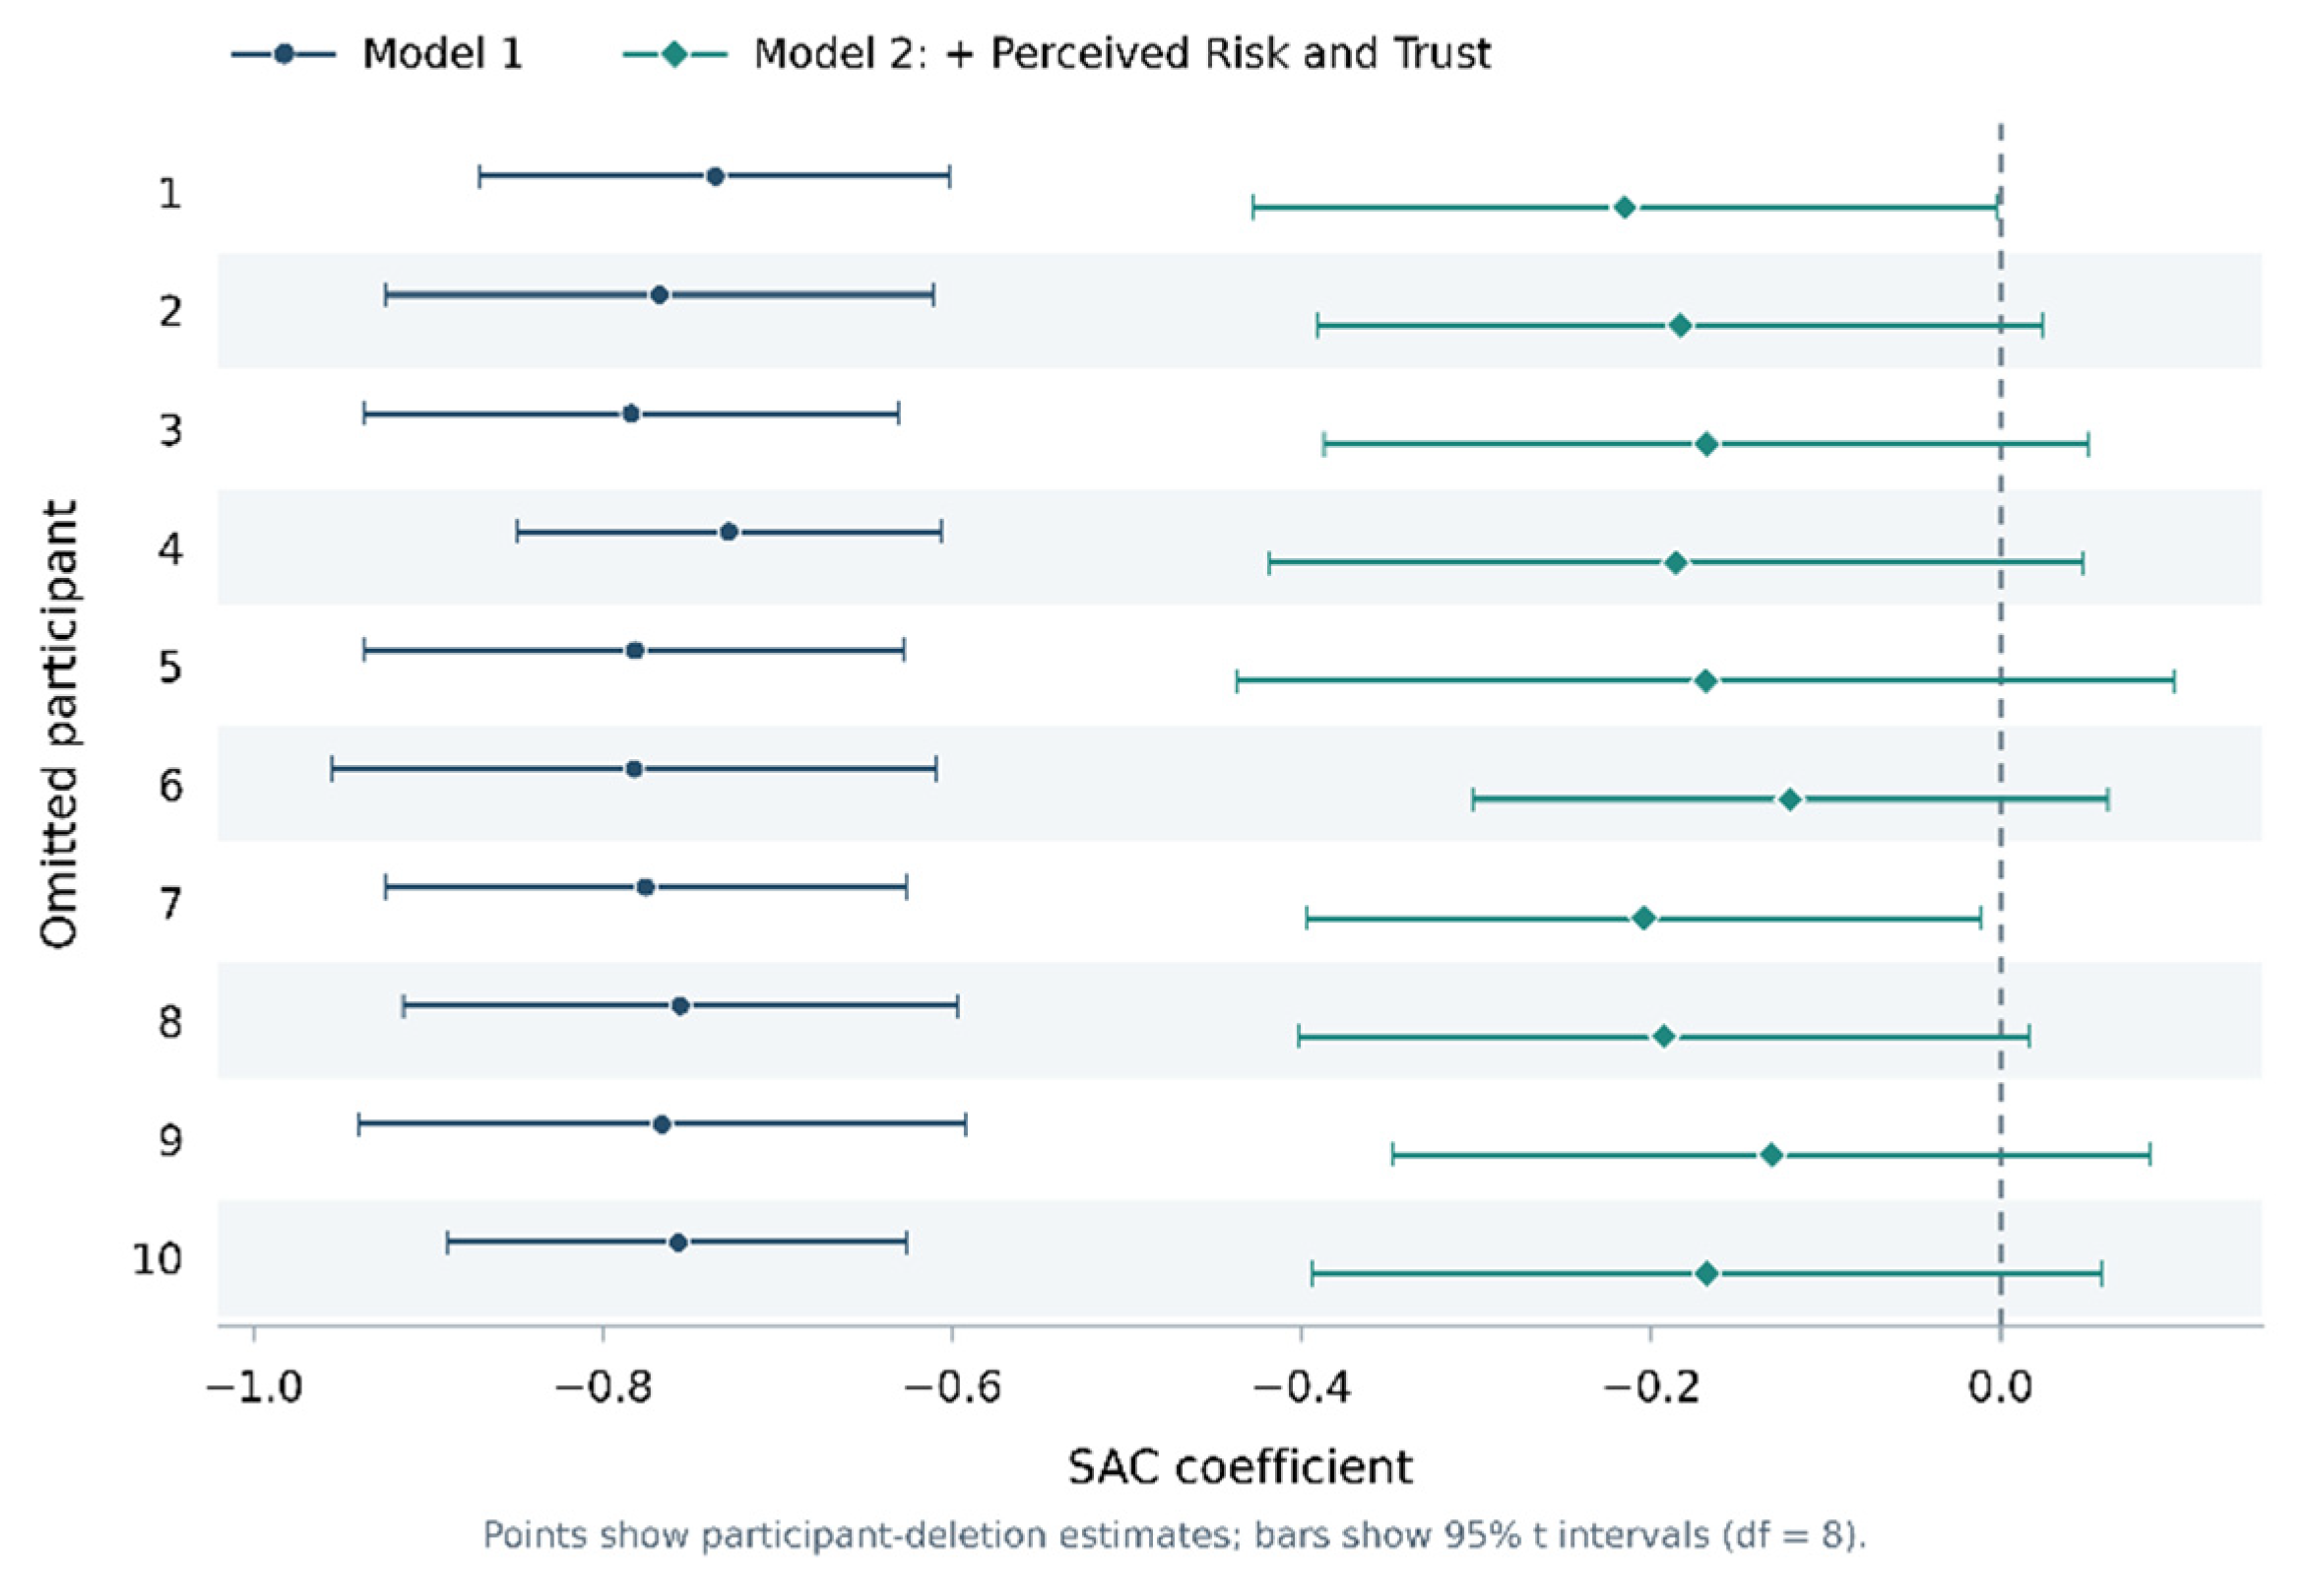
With pooled standardization fixed across refits, leave-one-participant-out SAC estimates ranged from −0.784 to −0.728 in Model 1 and −0.215 to −0.120 in Model 2. These ranges summarize all 10 participant deletion refits. Model 2’s 95% t-intervals included zero in eight of 10 refits (df = 8). Figure 3 displays every estimate and interval. A delete-one-participant jackknife, with covariance equal to (G−1)/G times the sum of centered coefficient outer products, gave SAC intervals of −0.890 to −0.639 in Model 1 and −0.366 to 0.017 in Model 2 (df = 9; expanded-model p = 0.069). The jackknife is an alternative sensitivity calculation, not an exact remedy for 10 clusters.
Figure 3.
SAC coefficients after omitting each participant. Outcome and continuous predictors retain full-sample standardization. Error bars use bias-reduced GEE covariance and Student’s t-intervals with eight degrees of freedom; Model 2 remains imprecise.
3.6. Sensitivity to Specification and Working Correlation
The reduced four-coefficient model gave a SAC coefficient of −0.779 (−0.918 to −0.641). Under working independence, SAC was −0.753 in Model 1 and −0.185 in Model 2; the latter interval again included zero (−0.387 to 0.017). Adding risk alone gave −0.450 and adding trust alone −0.382 under exchangeable correlation. Table 5 summarizes these checks. They support a negative overall relationship but show that its conditional magnitude depends on which correlated perceptions are included.
Table 5.
SAC coefficient sensitivity across model complexity and working correlation.
4. Discussion
4.1. General Concern Is Not Empirically Isolated from Trust and Risk
The principal measurement finding is that the legacy SAC index cannot be convincingly isolated from general risk and trust in these data. Suspicion, anticipated harm, and low perceived security form a coherent negative evaluation, but the pooled and participant-centered correlations and HTMT values do not support a separate security construct. The approximately 77% coefficient change is only a regression specification contrast. Collinearity, conditional adjustment, measurement error, and shared response tendencies may contribute; this percentage cannot quantify a common psychological process.
This distinction matters for interpretation. A questionnaire response such as feeling suspicious of an automated vehicle or judging it less secure may be relevant to future security research, but it cannot reveal whether a participant detected spoofing, authentication failure, malicious message manipulation, or any other technical attack. Direct cybersecurity studies explicitly manipulate failures or attack-related events and then measure the resulting human response [9,10]. The present results should be positioned as a measurement and hypothesis-generating finding that identifies where a security-adjacent signal may overlap with broader perceived risk and trust.
GEE estimates marginal associations using both within-person and between-person information. Clustering corrects the treatment of repeated responses but does not, by itself, isolate within-person effects or remove participant-level confounding. The additional participant-centered correlations show that the overlap is not solely a between-person phenomenon. Nevertheless, 10 participants cannot support a stable multilevel measurement model or broad generalization. The t-based inference and jackknife both leave Model 2’s incremental SAC association imprecise.
4.2. What the Interface and Vehicle Behavior Results Add
The positive interface-presence associations are compatible with earlier eHMI evidence [1,2,3,4,5], including the source study, and are not presented as a new discovery. Text and non-text grouping is useful for reducing parameter count but compares bundles of content, location, animation, and visibility. A small, uncertain grouped contrast cannot establish equivalence or justify choosing any modality without further testing. The condition-level variation in Table A4 illustrates the information lost through aggregation, while Table A5 remains too fragile to support an individual-design ranking.
Yielding had a negative association with concern and a positive but imprecise association with acceptance under t-based inference. This is compatible with users considering observed vehicle behavior alongside an external message, but it does not identify a causal communication-by-kinematics mechanism. Experiments explicitly manipulating message–motion consistency are more suitable for that question [3,4].
The broad text/non-text grouping also should not be mistaken for a location test. In the source experiment, message content and physical placement were bundled within specific concepts. Prior work has shown that display location can affect crossing intention and visual attention [8], but the present data cannot isolate a grille, roof, windshield, mirror, or door effect. A purpose-built factorial experiment would be required to distinguish content, location, timing, and vehicle motion.
4.3. Implications for Security-Aware eHMI Evaluation
Four concepts require separate evaluation. Subjective trust is the respondent’s confidence in the vehicle. Perceived security is a self-reported impression that can overlap with safety and reassurance. Communication integrity concerns whether messages are authentic, timely, and unaltered relative to their intended source and content. Objective system resilience concerns maintaining or recovering specified performance under defined faults, attacks, or other disturbances. The first two are perceptual; the latter two require technical tests and performance criteria. The present questionnaire cannot establish either integrity or resilience.
Technical resilience studies such as [11] evaluate performance under specified disruptive conditions and recovery criteria. Future eHMI work should pair such tests with, rather than infer them from, user perceptions. Trust calibration would additionally require an objective reliability benchmark and evidence concerning appropriate reliance [6]. A reassuring interface could increase subjective trust without improving message integrity or technical resilience.
A stronger validation design would independently manipulate message content, display location, activation timing, and vehicle kinematics, and then add controlled integrity failures such as spoofed, delayed, replayed, or contradictory messages. Outcomes should distinguish comprehension, behavioral response, trust calibration, perceived risk, acceptance, and security-specific judgments. Such a design would make it possible to determine whether a user is reacting to poor communication quality, inconsistent vehicle behavior, or an actual integrity threat.
4.4. Methodological Implications for Secondary eHMI Analyses
The analysis also illustrates a practical issue for secondary use of simulator data. A workbook may contain hundreds of rows while representing only a small number of independent people. In such settings, statistical methods, descriptive language, and manuscript claims should all reflect participant-level independence. Repeated-measures GEE, mixed models, or other cluster-aware approaches are preferable to methods that implicitly treat every trial as a new participant. Reporting both the number of trials and the number of unique contributors is, therefore, essential for reproducibility and for judging the strength of evidence.
Related transportation safety research illustrates the importance of transparent analytical comparisons. Majidi, Wang, and Souleyrette [18] combine structured crash records with police narratives and examine simulated changes in model inputs through sensitivity testing. Majidi et al. [19], in a preprint, compare narrative-augmented person-level injury models across alternative roadway classifications. Their treatment of model inputs and roadway context offers a methodological parallel for documenting how analytical groupings and specifications influence results. In the present study, reporting original eHMI configurations alongside grouped models serves that transparency objective. These crash severity studies provide methodological context rather than evidence about eHMI acceptance or validation of a security-related perception construct.
4.5. Limitations
Only 10 independent participants contributed data, including five cycling contributors. Model 1 has eight coefficients, and Model 2 has 10, including intercepts; neither the bias reduction, t reference, nor jackknife creates independent information or guarantees valid coverage. The reduced model is a check on specification dependence and sacrifices adjustment. The largely university-based recruitment during COVID-19 constraints and uneven mode contributions further restrict generalizability. Marginal GEE estimates also mix within-person and between-person associations.
SAC is post hoc, represents general concern, and lacks discriminant specificity from risk and trust. Pooled alpha is affected by repeated-response structure and is not a participant-level reliability validation. All constructs are measured in the same post-trial questionnaire, creating shared-method and simultaneity concerns. There are no manipulated cyberattacks or independent measures of reliability, integrity, or resilience. Content and placement are bundled, E is absent for pedestrians, and the original-condition models are overparameterized relative to cluster count. Multiple exploratory comparisons are unadjusted; their p-values are descriptive rather than confirmatory. VR control does not reproduce all real-world complexity, and larger independent samples with purpose-built measurement and factorial manipulations are required.
5. Conclusions
This reproducible secondary reanalysis identifies substantial empirical overlap between a legacy security-adjacent index and general trust/risk perceptions. SAC is, therefore, interpreted as general concern. Its negative relationship with acceptance was directionally stable across reduced specifications and working correlations, but its incremental coefficient in Model 2 was imprecise under t and participant-jackknife inference. The approximately 77% attenuation is a coefficient change, not a decomposition of psychological mechanisms.
Grouped eHMI configurations were associated with higher acceptance and lower concern than no eHMI. The text-versus-non-text contrast does not establish equivalence, and individual-condition summaries demonstrate variation obscured by aggregation. Vehicle yielding was associated with lower concern; its acceptance estimate was positive but uncertain. These findings reassess measurement and inference in an existing small VR dataset. They neither measure trust calibration nor demonstrate communication integrity, cybersecurity vulnerability, or technical resilience.
Author Contributions
Conceptualization, A.S.; writing—original draft preparation, T.L., F.N., and A.S.; writing—review and editing, A.S. All authors have read and agreed to the published version of the manuscript.
Funding
This research received no external funding.
Institutional Review Board Statement
The original data collection was approved by the University of New Mexico Office of the Institutional Review Board (IRB Registration No. IRB00000431; Board Reference No. 09019), as reported in the project final report.
Informed Consent Statement
Informed consent was obtained from participants in the original study, as reported in the project final report. No new consent was sought for the present secondary analysis of de-identified public data.
Data Availability Statement
The de-identified dataset analyzed in this study is publicly available through Zenodo at https://doi.org/10.5281/zenodo.6430710 (accessed on 22 October 2026). The analysis code, variable mappings, model specifications, and additional numerical outputs are available from the corresponding author upon reasonable request.
Conflicts of Interest
The authors declare no conflicts of interest.
Appendix A. Reproducibility and Additional Diagnostics
Appendix A.1. Item Mapping and Data Processing
Excel letters refer to the original workbook, which has metadata in row 1, field names in row 2, and 310 observations in rows 3–312. Whitespace is stripped from interface and mode labels; participant IDs remain the clustering variable. Dates define two sessions per participant. Composite scores require all constituent items. No required analytical values are missing, so all specifications use the same 310 trials.
Table A1.
Mapping of original post-trial questionnaire columns to analytical composites.
Appendix A.2. Correlations and Multicollinearity
Table A2.
(a). Pooled trial correlation matrix. (b). Participant-centered trial correlation matrix. (c). Participant-mean correlation matrix.
These matrices are descriptive. Participant-centered correlations subtract each participant’s construct mean from each trial; they do not condition on scenario or session. Participant-mean correlations use 10 unweighted participant averages and are especially unstable. No independent-trial tests or correlation confidence intervals are attached.
Table A3.
(a). Descriptive HTMT ratios from absolute item correlations. (b). Complete non-intercept VIF diagnostics. Dashes denote a predictor absent from that diagnostic.
Appendix A.3. Original Interface Configurations
A uses a windshield LED movement/blinking pattern for yielding and a steady center illumination otherwise. B uses blinking mirror arrows for yielding and is unlit otherwise. C combines grille text and arrows; D uses roof text; and E relocates a grille-like text concept to the driver-side door. The text concepts activate for yielding and remain unlit for non-yielding. The workbook’s A–E/N codes are retained in the executable mapping. N is the baseline. Each configuration has contributions from 10 participants overall, but not from every participant in every mode.
Table A4.
Original-condition counts by mode and descriptive outcome means (SD).
Table A5.
Exploratory original-condition GEE associations relative to N. B and intervals are raw outcome points; t-inference uses df = 9.
These models include five interface indicators, two mode indicators, yielding, session, and an intercept (10 coefficients). They provide a transparent disaggregation rather than a validated ranking. E has no pedestrian observations, and no condition comparison separates physical placement from message content or activation. Pairwise superiority and equivalence were not tested; comparisons are exploratory and not adjusted for multiplicity.
References
- Brill, S.; Payre, W.; Debnath, A.; Horan, B.; Birrell, S. External Human-Machine Interfaces for Automated Vehicles in Shared Spaces: A Review of the Human-Computer Interaction Literature. Sensors 2023, 23, 4454. [Google Scholar] [CrossRef] [Scilit] [PubMed]
- Man, S.S.; Huang, C.; Ye, Q.; Chang, F.; Chan, A.H.S. Pedestrians’ Interaction with eHMI-equipped Autonomous Vehicles: A Bibliometric Analysis and Systematic Review. Accid. Anal. Prev. 2025, 209, 107826. [Google Scholar] [CrossRef] [Scilit] [PubMed]
- Eisele, D.; Kraus, J.; Schlemer, M.M.; Petzoldt, T. Should Automated Vehicles Communicate Their State or Intent? Effects of eHMI Activations and Non-Activations on Pedestrians’ Trust Formation and Crossing Behavior. Multimed. Tools Appl. 2025, 84, 24405–24429. [Google Scholar] [CrossRef] [Scilit]
- Lau, M.; Wilbrink, M.; Oehl, M. Matching vs. Mismatching Signals of External Human-Machine Interface and Vehicle Kinematics: An Examination of Pedestrian Crossing Behavior and Trust, Safety, and Affective Ratings in Interactions with Differently Sized Automated Vehicles. Transp. Res. Part F Traffic Psychol. Behav. 2024, 107, 1092–1104. [Google Scholar] [CrossRef] [Scilit]
- Lim, D.; Kim, Y.; Shin, Y.H.; Yu, M.S. External Human-Machine Interfaces of Autonomous Vehicles: Insights from Observations on the Behavior of Game Players Driving Conventional Cars in Mixed Traffic. Vehicles 2024, 6, 1284–1299. [Google Scholar] [CrossRef] [Scilit]
- Lee, J.D.; See, K.A. Trust in Automation: Designing for Appropriate Reliance. Hum. Factors 2004, 46, 50–80. [Google Scholar] [CrossRef] [Scilit] [PubMed]
- Kim, S.; He, X.; van Egmond, R.; Happee, R. Designing User Interfaces for Partially Automated Vehicles: Effects of Information and Modality on Trust and Acceptance. Transp. Res. Part F Traffic Psychol. Behav. 2024, 103, 404–419. [Google Scholar] [CrossRef] [Scilit]
- Eisma, Y.B.; van Bergen, S.; ter Brake, S.M.; Hensen, M.T.T.; Tempelaar, W.J.; de Winter, J.C.F. External Human-Machine Interfaces: The Effect of Display Location on Crossing Intentions and Eye Movements. Information 2020, 11, 13. [Google Scholar] [CrossRef] [Scilit]
- Lim, C.; Prendez, D.; Boyle, L.N.; Rajivan, P. The Impact of Cybersecurity Attacks on Human Trust in Autonomous Vehicle Operations. Hum. Factors 2025, 67, 485–502. [Google Scholar] [CrossRef] [Scilit] [PubMed]
- Lim, C.; Rajivan, P. Towards Adaptive Autonomous Vehicle Systems: Considering Trust and Risk Perception during Failures. Accid. Anal. Prev. 2026, 224, 108267. [Google Scholar] [CrossRef] [Scilit] [PubMed]
- Moskalenko, V.; Kharchenko, V.; Semenov, S. Model and Method for Providing Resilience to Resource-Constrained AI-System. Sensors 2024, 24, 5951. [Google Scholar] [CrossRef] [Scilit] [PubMed]
- Liang, K.-Y.; Zeger, S.L. Longitudinal Data Analysis Using Generalized Linear Models. Biometrika 1986, 73, 13–22. [Google Scholar] [CrossRef]
- Mancl, L.A.; DeRouen, T.A. A Covariance Estimator for GEE with Improved Small-Sample Properties. Biometrics 2001, 57, 126–134. [Google Scholar] [CrossRef] [Scilit] [PubMed]
- Jian, J.-Y.; Bisantz, A.M.; Drury, C.G. Foundations for an Empirically Determined Scale of Trust in Automated Systems. Int. J. Cogn. Ergon. 2000, 4, 53–71. [Google Scholar] [CrossRef] [Scilit] [PubMed]
- Van Der Laan, J.D.; Heino, A.; De Waard, D. A Simple Procedure for the Assessment of Acceptance of Advanced Transport Telematics. Transp. Res. Part C Emerg. Technol. 1997, 5, 1–10. [Google Scholar] [CrossRef] [Scilit]
- Hart, S.G.; Staveland, L.E. Development of NASA-TLX (Task Load Index): Results of Empirical and Theoretical Research. In Advances in Psychology; Hancock, P.A., Meshkati, N., Eds.; North-Holland: Amsterdam, The Netherlands, 1988; Volume 52, pp. 139–183. [Google Scholar] [CrossRef] [Scilit]
- Henseler, J.; Ringle, C.M.; Sarstedt, M. A New Criterion for Assessing Discriminant Validity in Variance-Based Structural Equation Modeling. J. Acad. Mark. Sci. 2015, 43, 115–135. [Google Scholar] [CrossRef] [Scilit]
- Majidi, M.Z.; Wang, T.; Souleyrette, R. From Prediction to Prevention: Identifying Actionable Crash Factors Through ML and Narrative-Based Sensitivity Testing. Future Transp. 2025, 5, 190. [Google Scholar] [CrossRef] [Scilit]
- Majidi, M.Z.; Karimi, S.; Wang, T.; Kluger, R.; Souleyrette, R. Predicting Person-Level Injury Severity Using Crash Narratives: A Balanced Approach with Roadway Classification and Natural Language Process Techniques. arXiv 2025, arXiv:2509.07845. [Google Scholar] [CrossRef] [Scilit]

Disclaimer/Publisher’s Note: The statements, opinions and data contained in all publications are solely those of the individual author(s) and contributor(s) and not of MDPI and/or the editor(s). MDPI and/or the editor(s) disclaim responsibility for any injury to people or property resulting from any ideas, methods, instructions or products referred to in the content. |
© 2026 by the authors. Licensee MDPI, Basel, Switzerland. This article is an open access article distributed under the terms and conditions of the Creative Commons Attribution (CC BY) license.