


Abstract
A finite element model of a novel maglev train levitation frame is developed to achieve optimal load-bearing performance and lightweight construction. Track tests are conducted to validate the model reliability, and the structural strength under critical operating conditions is evaluated in accordance with relevant technical specifications. Surrogate models are constructed for the longitudinal beam of the levitation frame using the Kriging method and the quadratic polynomial response surface method, and their prediction accuracies are compared. A multi-objective optimization approach is applied to the structural parameters of the longitudinal beam to obtain a Pareto-optimal solution set. The results indicate that the Kriging-based surrogate model achieves higher prediction accuracy than the quadratic polynomial response surface model. A parameter set selected from the Pareto-optimal solutions is used for simulation analysis. Compared with the original design, the mass of a single longitudinal beam is reduced by 5.6 kg (23.53%), the mass of a single levitation module is decreased by 11.2 kg, and the safety factor decreases from 3.32 to 2.24. Although the maximum von-Mises stress rises by 47.66%, it remains within the allowable stress range of the material. The optimized structure satisfies structural strength requirements and achieves the lightweight-design objective. The proposed method demonstrates reasonable applicability in structural engineering design.
1. Introduction
The diversified development of maglev trains offers new transportation alternatives. As an emerging transport mode, maglev trains hold great promise for future intelligent transportation systems owing to their merits of contact-free operation, low noise, and superior climbing capability [1,2]. Globally, maglev trains are mainly categorized into medium–low-speed and high-speed types. Medium–low-speed maglev trains have gained increasing application in urban rail transit thanks to their lower construction cost, shorter project cycle and improved safety, and they serve as a favorable solution for medium-volume passenger transport between urban and suburban areas [3].
The levitation frame acts as a core component of medium- and low-speed maglev trains. It undertakes load-bearing and force-transmission functions while connecting multiple pieces of on-board equipment. Therefore, the strength and mass characteristics of the levitation frame exert a direct influence on the levitation performance and operational safety of maglev vehicles.
Research on the strength of levitation frames remains at an exploratory stage. Most existing studies adopt numerical simulations to obtain stress distributions at critical regions of the levitation frame, conduct analyses according to relevant railway evaluation specifications, and predict fatigue life [4,5]. Several scholars have explored load-definition methods based on the dynamic load features of levitation frames. Kim et al. [6] established a dynamic maglev vehicle model to identify dynamic load characteristics and the corresponding calculation conditions, so as to investigate the load history and levitation performance of the levitation frame. Li Cen [7] built a maglev vehicle dynamic model and selected the most heavily loaded levitation module as the research object. Time-variant load histories at critical positions were acquired under real-world loading conditions, which supported subsequent fatigue-life prediction. Cao Hui [8] determined the loads acting on the levitation frame following EN 13749 [9] and other standards and verified that all components meet static and fatigue strength requirements. Different from the above load-definition strategies, Chen et al. [10] carried out dynamic load and dynamic stress tests on the maglev levitation frame. They analyzed dynamic stress features under multiple operating conditions and performed comprehensive line tests to evaluate the frame’s fatigue strength, aiming to validate the accuracy of the established simulation model and further improve the structural performance of vehicle levitation frames. Li et al. [11] performed multi-condition strength tests on the levitation frame using a self-developed full-scale test rig, with reasonably arranged measuring points on the frame. The test results demonstrated compliance with structural-strength specifications. Han [12] proposed a load-testing method for safety verification of EMS-maglev levitation-frame structures and implemented fatigue tests on the frame. A fatigue-strength evaluation procedure for levitation frames was put forward based on the test outcomes. Han et al. [13] further proposed a static-load testing scheme tailored to maglev vehicle characteristics. After completing static-strength assessment of the levitation frame, they formulated an evaluation method for its fatigue strength. Wang et al. [14] performed comprehensive modeling and numerical computations for levitation-frame structural design via finite element analysis (FEA). Their results revealed the stress distribution, deformation and potential fatigue failure locations under diverse loads and operating scenarios, providing support for design optimization. To improve the anti-vibration performance of the levitation frame, Zhang et al. [15] constructed finite-element and dynamic models of the frame, investigated its vibration responses under excitations of different frequencies and amplitudes, and proposed optimization suggestions concerning material selection and geometric parameters.
In conclusion, comprehensive studies concerning the simulation and experimental validation of levitation-frame strength remain relatively limited. Levitation capacity and structural lightweight performance constitute the two primary design requirements for levitation-frame structures. Given the difficulties in further enhancing levitation capacity, research on structural lightweight design has gradually attracted increasing attention. Achieving lightweight targets must be premised on satisfying structural strength requirements. For road vehicle load-bearing components, finite-element-based parametric analysis is an effective way to reveal how geometric dimensions dominate mechanical responses, including stress distribution, deformation and stiffness characteristics. Pham et al. [16] investigated the influence of structural parameters on the performance of truck anti-roll bars and quantified the correlation between geometrical sizes, displacement, stress field and roll-stiffness by finite-element simulation. Nevertheless, such pure parametric simulation workflows seldom integrate physical test calibration and multi-objective surrogate-model optimization, which are critical for maglev engineering components under strict fatigue and lightweight constraints.
This paper investigates the levitation frame of a novel medium- and low-speed maglev train. The structural strength of the levitation frame is evaluated via numerical simulation and strength verification tests, and line-test results are used to validate both structural integrity and the reliability of the simulation model. The polynomial response-surface method and Kriging model are adopted to construct a parameter-optimization model for the longitudinal beam of the levitation frame, yielding the Pareto-optimal parameter solution set. This study ensures the structural integrity of the levitation frame and provides new insights for lightweight design. The main innovations of this work are summarized as follows. It should be noted that the Kriging surrogate model and multi-objective genetic algorithm employed in this paper are well-established numerical tools, and this study does not intend to develop new optimization algorithms. The contributions mainly lie in the targeted engineering implementation for a newly-developed maglev levitation-frame component:
- This study focuses on a novel levitation-frame structure with centrally arranged hollow spring damping, as reported in Reference [17]. This structural layout realizes uniform load distribution and dispersed traction-force transfer. At present, few studies have carried out lightweight optimization targeting this specific type of levitation-frame longitudinal beam.
- A complete strength-verification workflow integrating finite-element simulation, multi-axial weld fatigue evaluation and on-track line test validation is proposed for this new-type levitation frame. Most existing studies on maglev levitation-frame strength only rely on pure numerical simulation or bench-scale tests; this paper supplements real line-test calibration to improve the credibility of the subsequent optimization-oriented finite-element model.
- For the extruded thin-walled Q355 steel longitudinal beam with a large strength margin, multi-objective surrogate-based optimization is carried out. By comparing quadratic polynomial response-surface and Kriging prediction accuracy, the Pareto optimal design set under the constraint of safety factor R ≥ 2.2 is obtained. The optimized lightweight solution satisfies static strength requirements and can provide practical reference for the engineering design of similar maglev components.
Previous structural-optimization studies of maglev levitation frames often ignore the calibration from real-vehicle line tests and directly perform lightweight calculation based on finite-element models without experimental correction. Uncalibrated simulation may lead to risky overly lightweight design in practical service. Therefore, this paper combines line-test data to validate the model before optimization, aiming to obtain reliable lightweight parameters for the novel levitation-frame longitudinal beam.
2. Reliability Verification of the Model
2.1. Structural Model
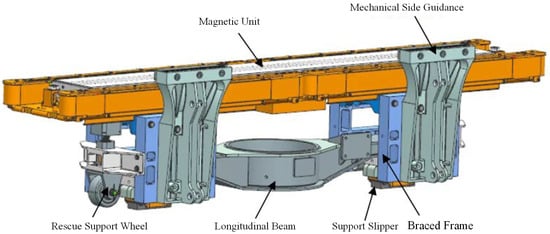
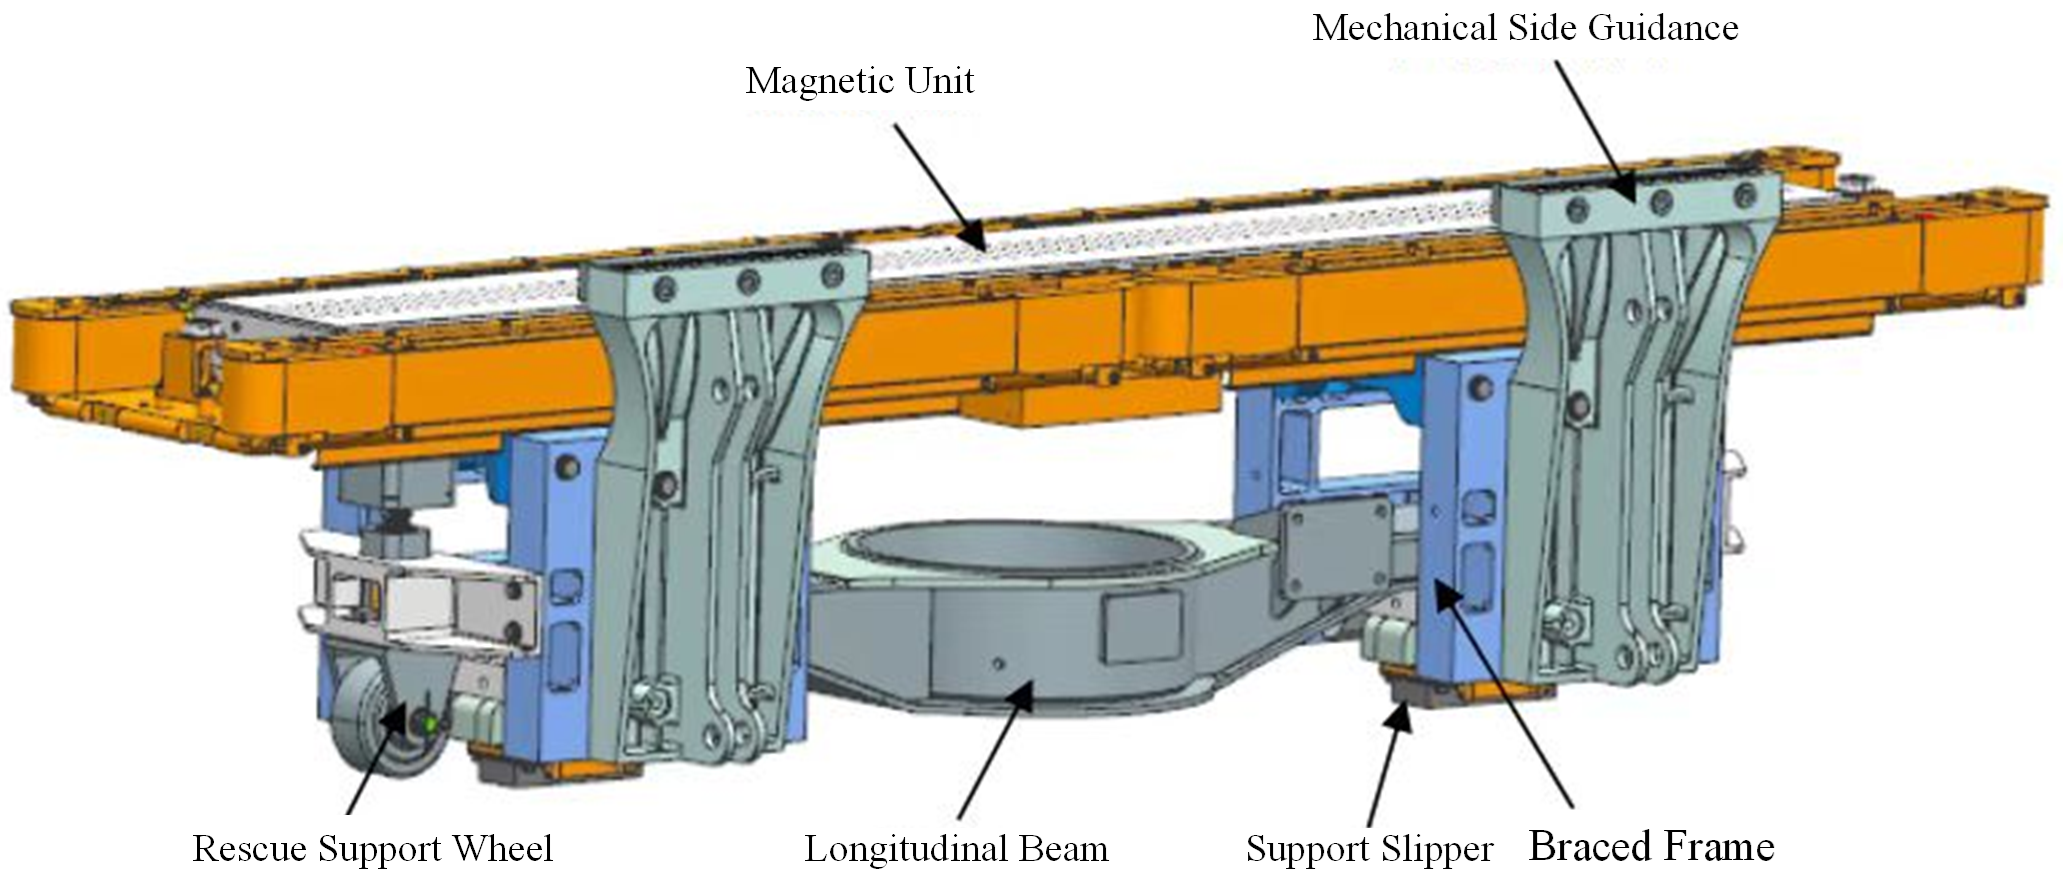
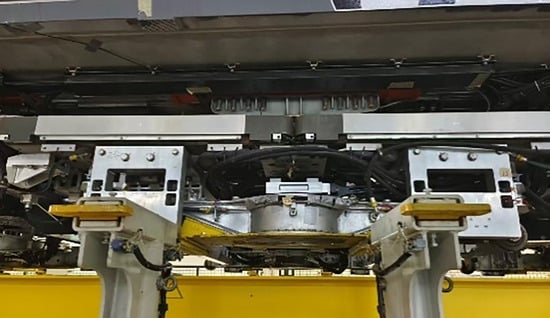
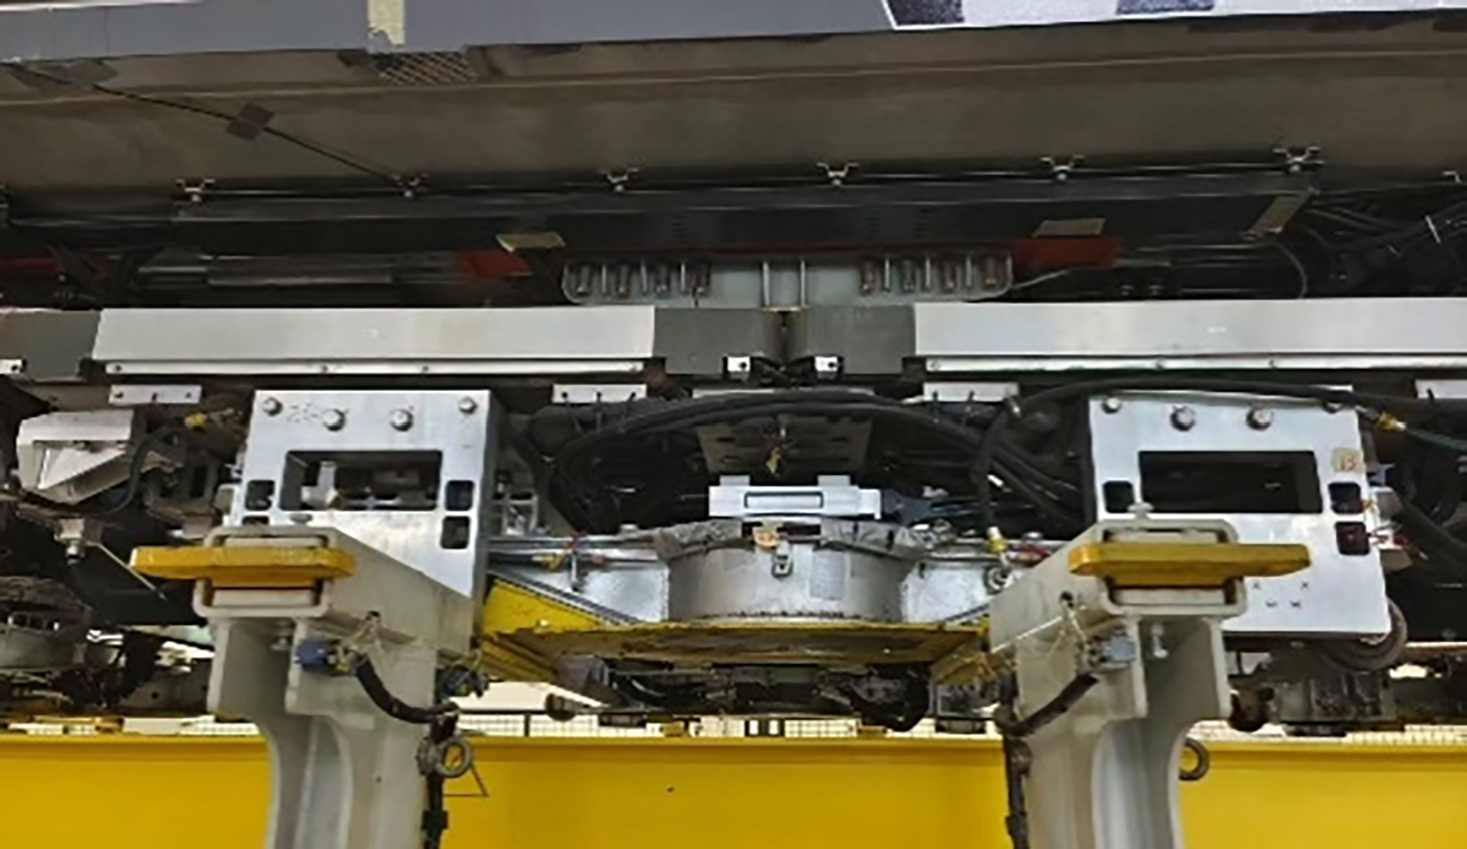
The levitation frame of the novel medium- and low-speed maglev train mainly consists of levitation modules, sleeper beams, and anti-roll beams. As the fundamental constituent unit of the levitation frame, the levitation module comprises multiple key components, including the magnet unit, support frame, longitudinal beam, mechanical side guide, support skid, and rescue support wheel, as illustrated in Figure 1. Given that the air spring is arranged at the central position of each levitation module, the structure is defined as an air-spring levitation frame. The longitudinal beam is an extruded thin-walled structure fabricated from Q355 steel and serves as a critical installation and load-bearing component responsible for load transmission throughout the levitation frame. Except for the magnet unit, which adopts Q235 steel, all other structural components are manufactured from EN AW-6082-T651 aluminum alloy. Table 1 specifies the material assignment for the longitudinal beam, magnet yoke and other aluminum alloy components of the levitation frame. Mechanical assembly of the overall structure is realized through bolt connection and welding processes. Figure 2 presents the in-service operational photograph of the levitation module.
Figure 1.
Modeling diagram of levitation module.
Table 1.
Basic parameters of each material constituting the longitudinal beam structure.
Figure 2.
The actual structure of the levitation module.
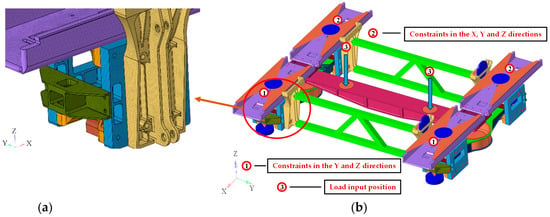
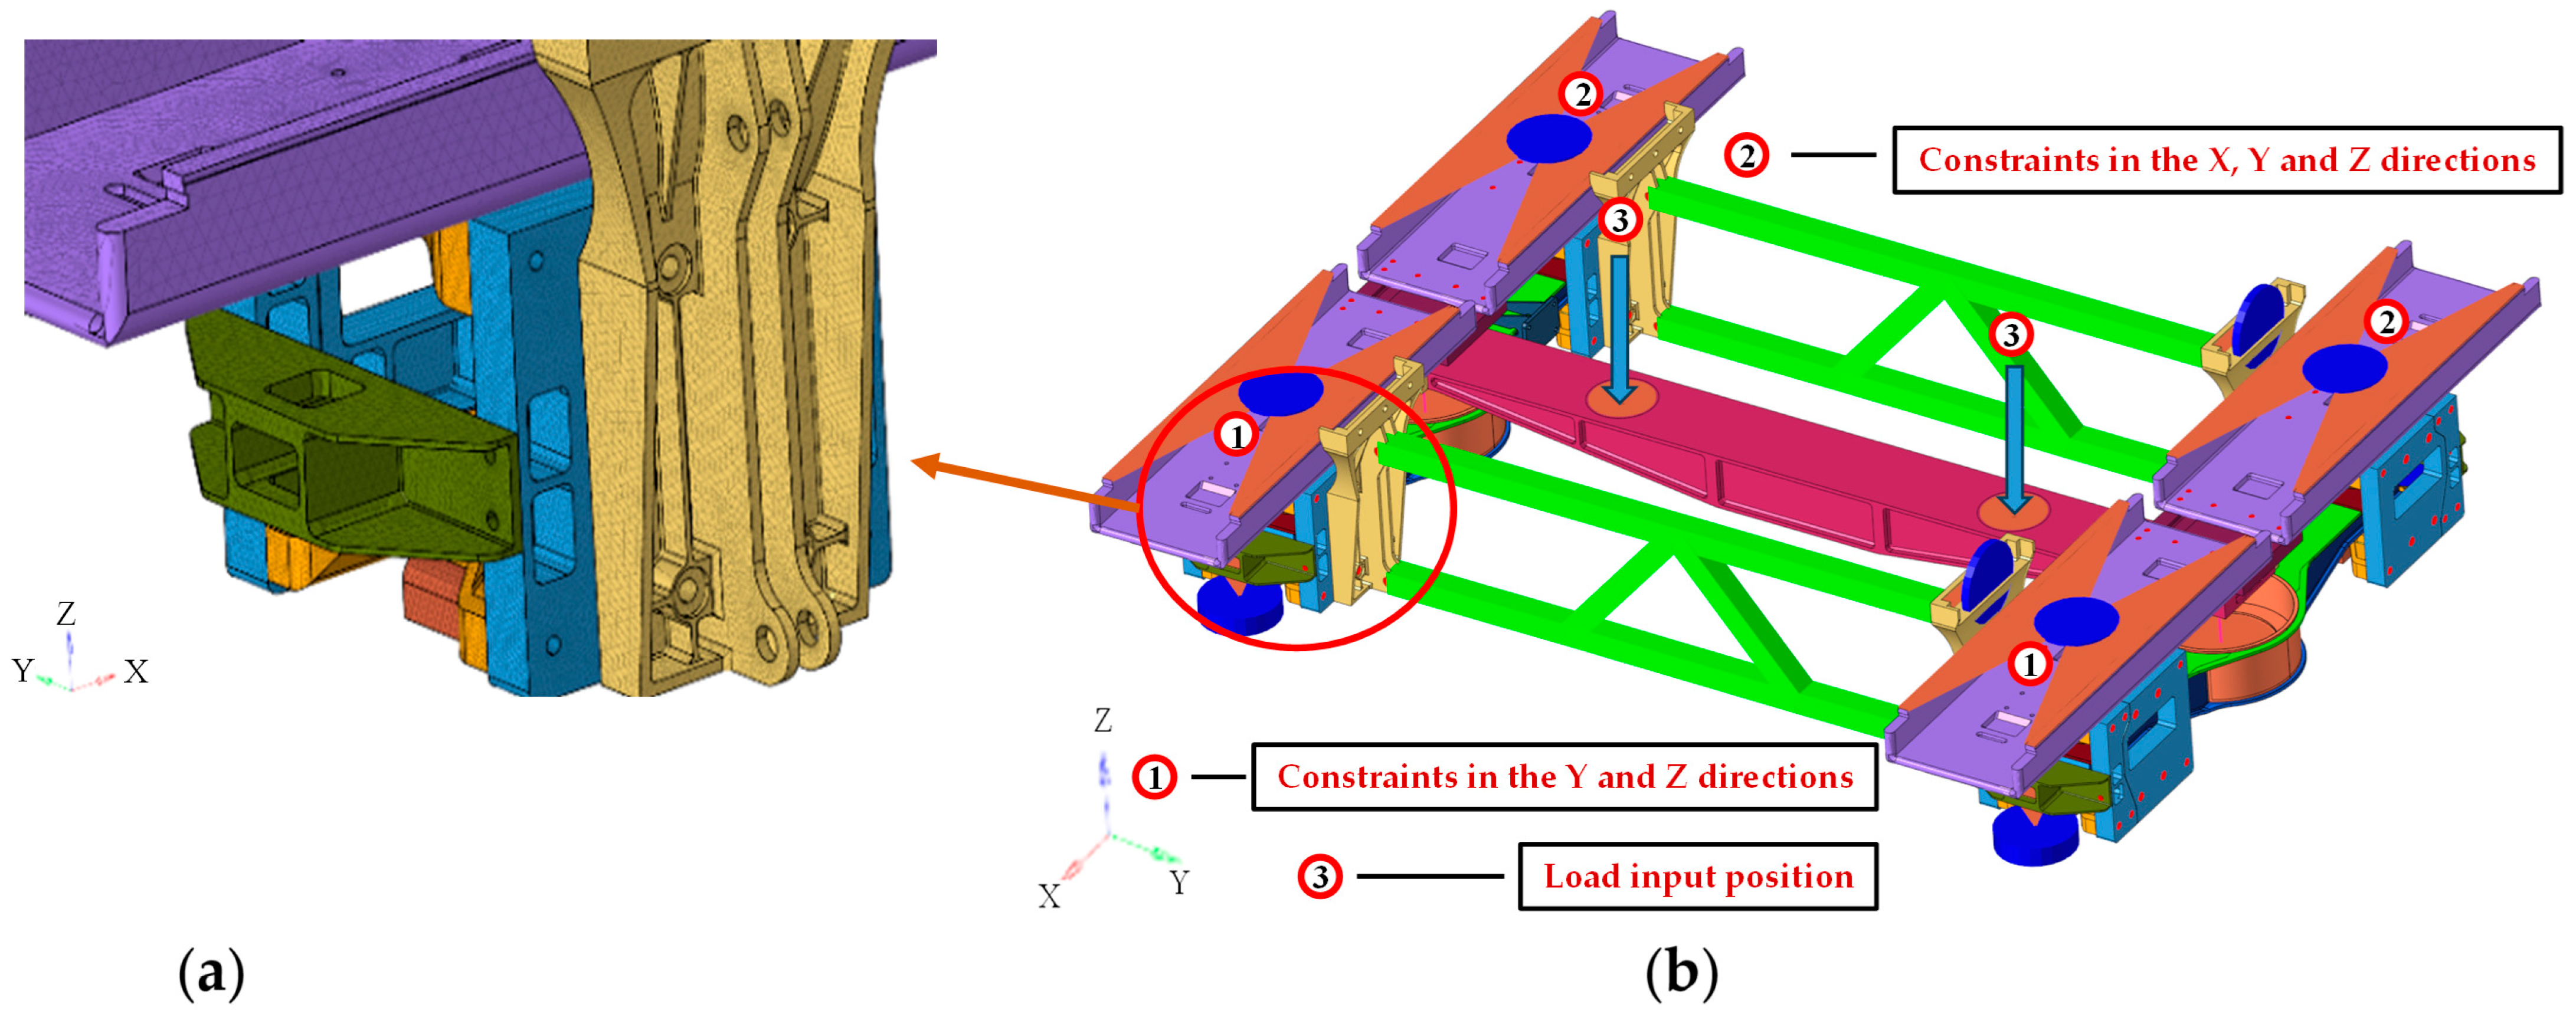
The finite element discretization model of the levitation frame is implemented using SOLID185 solid elements and BEAM188 beam elements, as shown in Figure 3. Figure 3a shows the local mesh view, and Figure 3b presents the overall mesh model of the levitation frame and clearly marks the application directions, action positions of loads and constraint conditions of the levitation frame under the acceleration traction (AT) load case, intuitively demonstrating the load and boundary setup of the finite element model. The maximum transient starting acceleration for the AT load case is 0.8 m/s2. The bolt/rivet connections are simplified using BEAM188 beam elements with corresponding diameters. Both ends of each beam element are connected to mass elements rigidly coupled via constraint equations. The air springs and traction rods in the structure are each represented by three separate springs, which have translational stiffness in the X, Y and Z directions. Detailed stiffness values are listed in Table 2.
Figure 3.
Finite element modeling diagram of levitation frame: (a) local mesh refinement schematic; (b) boundary condition schematic for the levitation frame under AT conditions.
Table 2.
Basic parameters of spring elements.
The global mesh size of the longitudinal beam is defined as 4 mm. Local mesh refinement is implemented at critical regions, including fillets, weld transition zones and stress-concentration zones, with a refined mesh size of 1.5 mm. This refinement strategy remains unchanged for all parametric models throughout the optimization process to maintain consistent stress evaluation. The final numerical model contains 3,876,695 Solid185 solid elements and 6,399,818 nodes.
2.2. Multiaxial Stress Fatigue Assessment
To verify the validity of the established finite element model and realize the lightweight structural design, this study conducts a fatigue evaluation of the levitation frame based on the multi-axial stress assessment method for frame welds proposed in [18,19]. Focusing on the longitudinal beam of the levitation frame, this section adopts the nominal stress method to evaluate the fatigue strength of welds and base metals, aiming to achieve a reliable lightweight design while fully satisfying the structural strength requirements of the longitudinal beam.
The evaluation points are set at a specific distance from the weld toe. According to the DVS 1612 standard [20], the three dominant stress components governing weld fatigue failure include the normal stress perpendicular to the weld seam (σ⊥), the normal stress parallel to the weld seam (tangential stress σ‖), and the shear stress parallel to the weld seam (τ). The fatigue stresses of the welds and base metals of the longitudinal beam are evaluated in the aforementioned three directions based on Equation (1). Furthermore, Equation (2) is applied to calculate the ultimate multi-axial material utilization index for weld fatigue strength evaluation. A material utilization index close to 1 indicates a lower safety margin and degraded fatigue strength at the corresponding evaluation position.
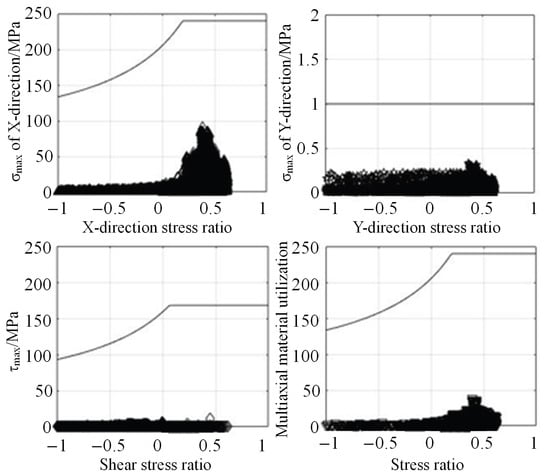
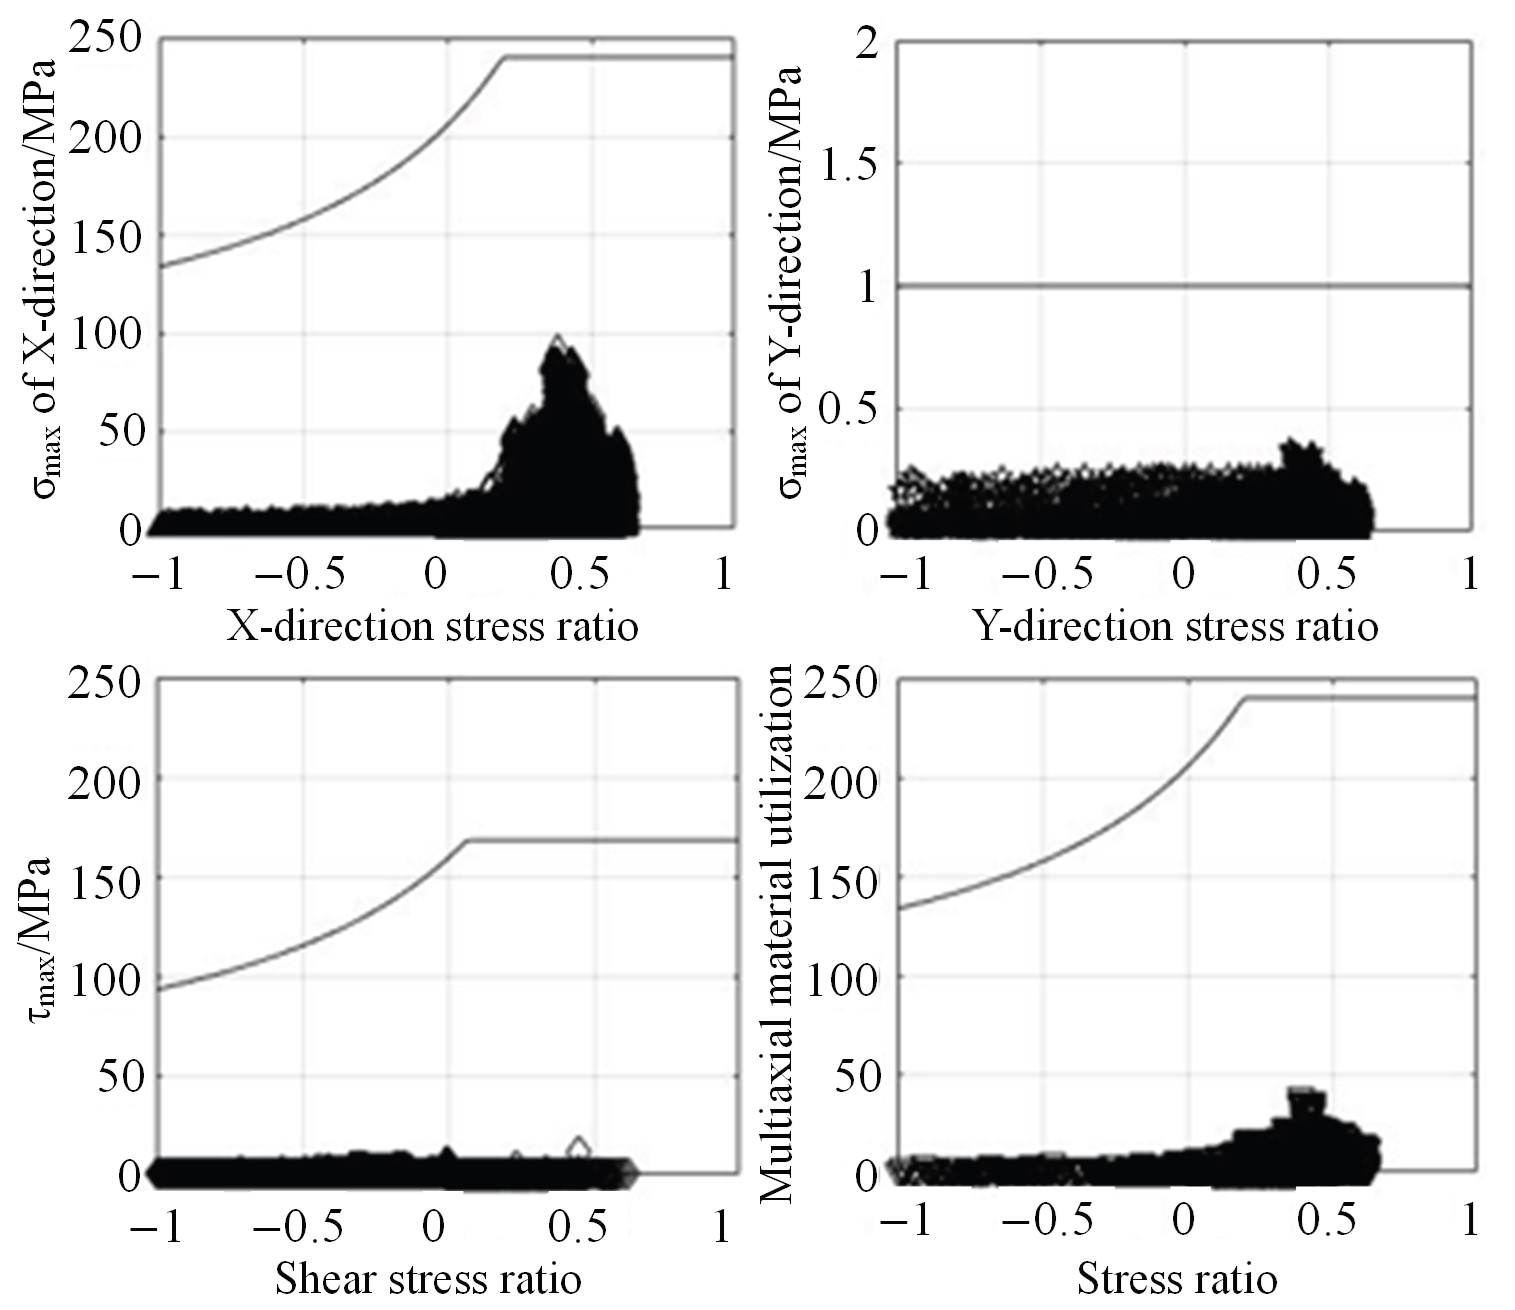
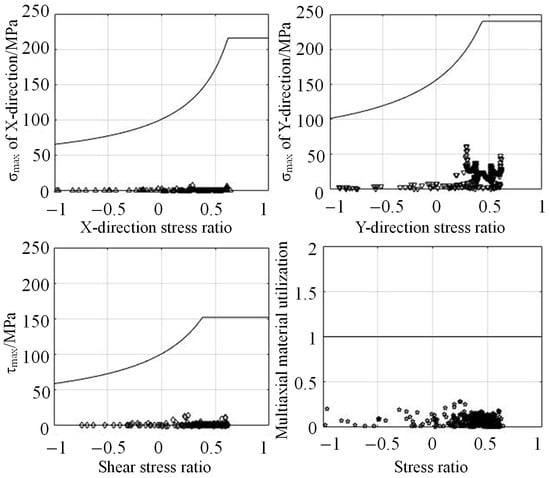
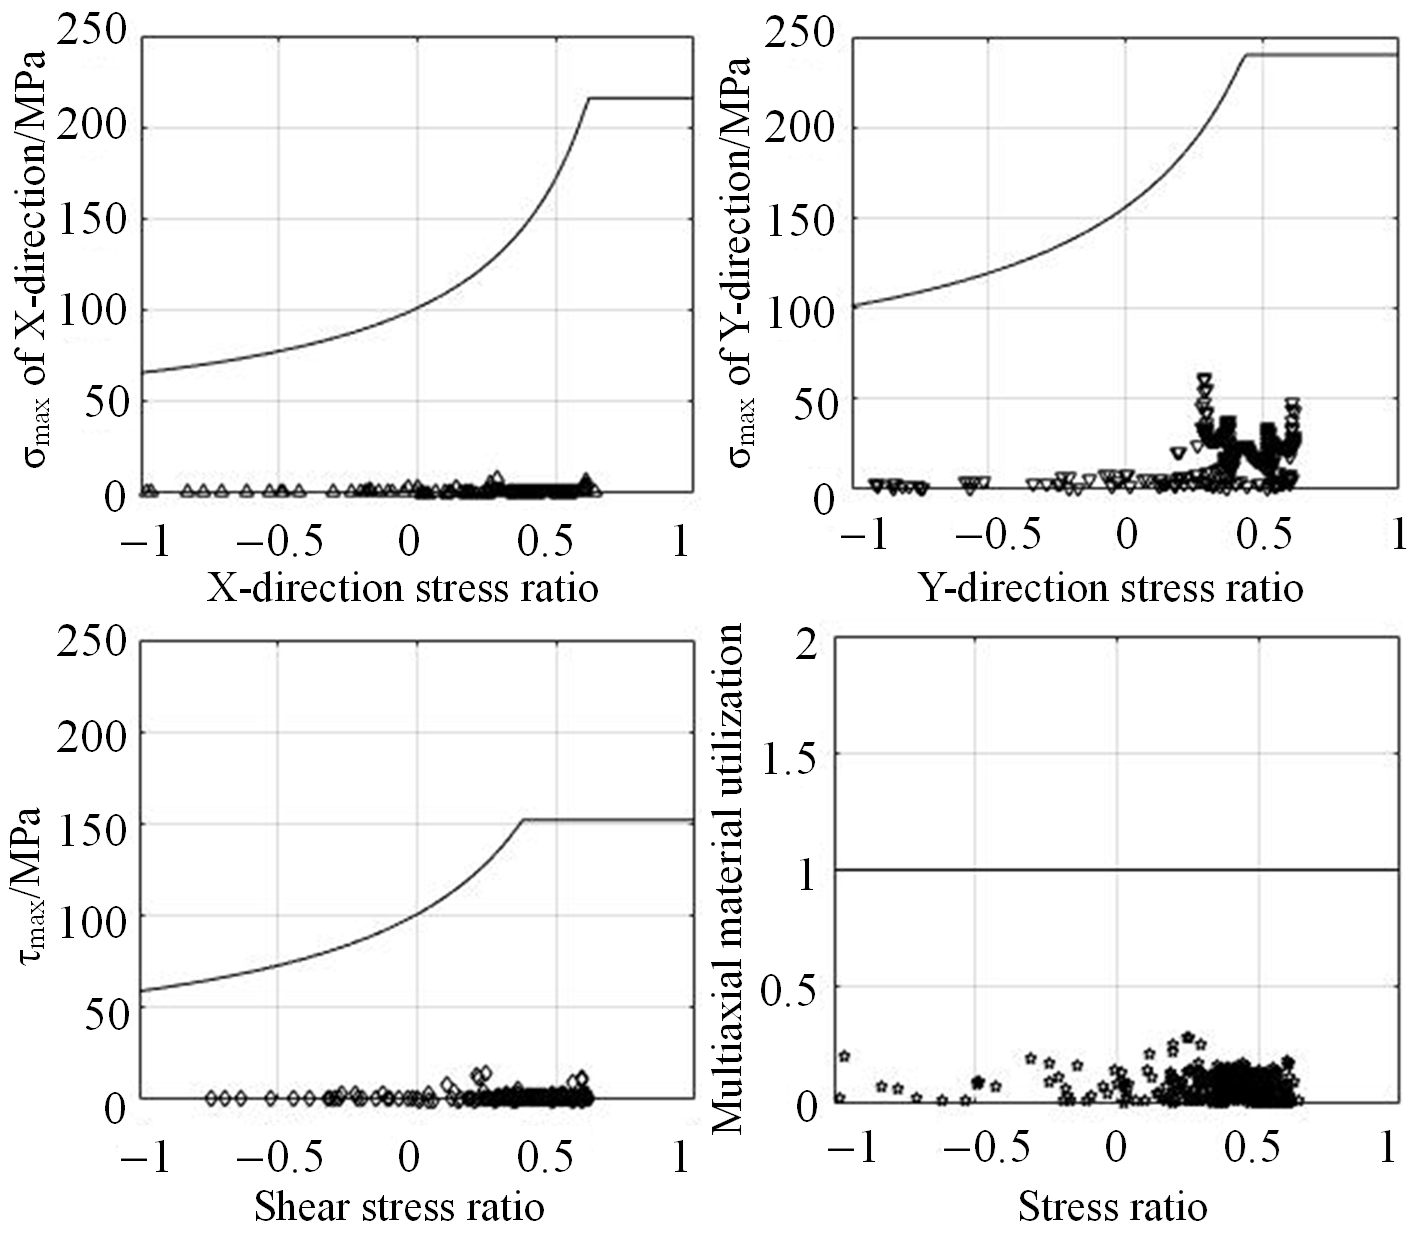
The DVS 1612 specification specifies the selection of Moore–Kommers–Jasper (MKJ) fatigue strength tolerance curves for diverse welds and base metals. Based on this theoretical framework, a fatigue evaluation system is compiled via computer programming [21]. The multi-axial material utilization values of evaluation points under different stress ratios are plotted on the MKJ tolerance curves. Specifically, the distribution of maximum material utilization for the welds of the longitudinal beam is illustrated in Figure 4, and the fatigue evaluation results for the base metal of the longitudinal beam are presented in Figure 5.
Figure 4.
Evaluation result diagram of longitudinal beam base metal.
Figure 5.
The maximum evaluation result of the longitudinal beam weld.
The evaluation results show that the maximum multi-axial material utilization of the longitudinal beam weld obtained from fatigue strength simulation is 0.36, while that of the longitudinal beam base metal is 0.39. Both values are lower than the critical threshold of one, and the stress values in all directions are well within the allowable fatigue limits. This demonstrates that the fatigue strength of the longitudinal beam fully meets the relevant design specifications. The proposed evaluation method can be extended to the fatigue assessment of other levitation frame components, and the overall evaluation results verify that the structure complies with practical service requirements.
2.3. Model Reliability Analysis
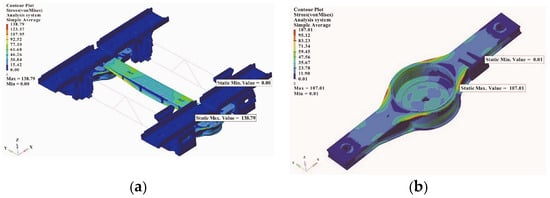
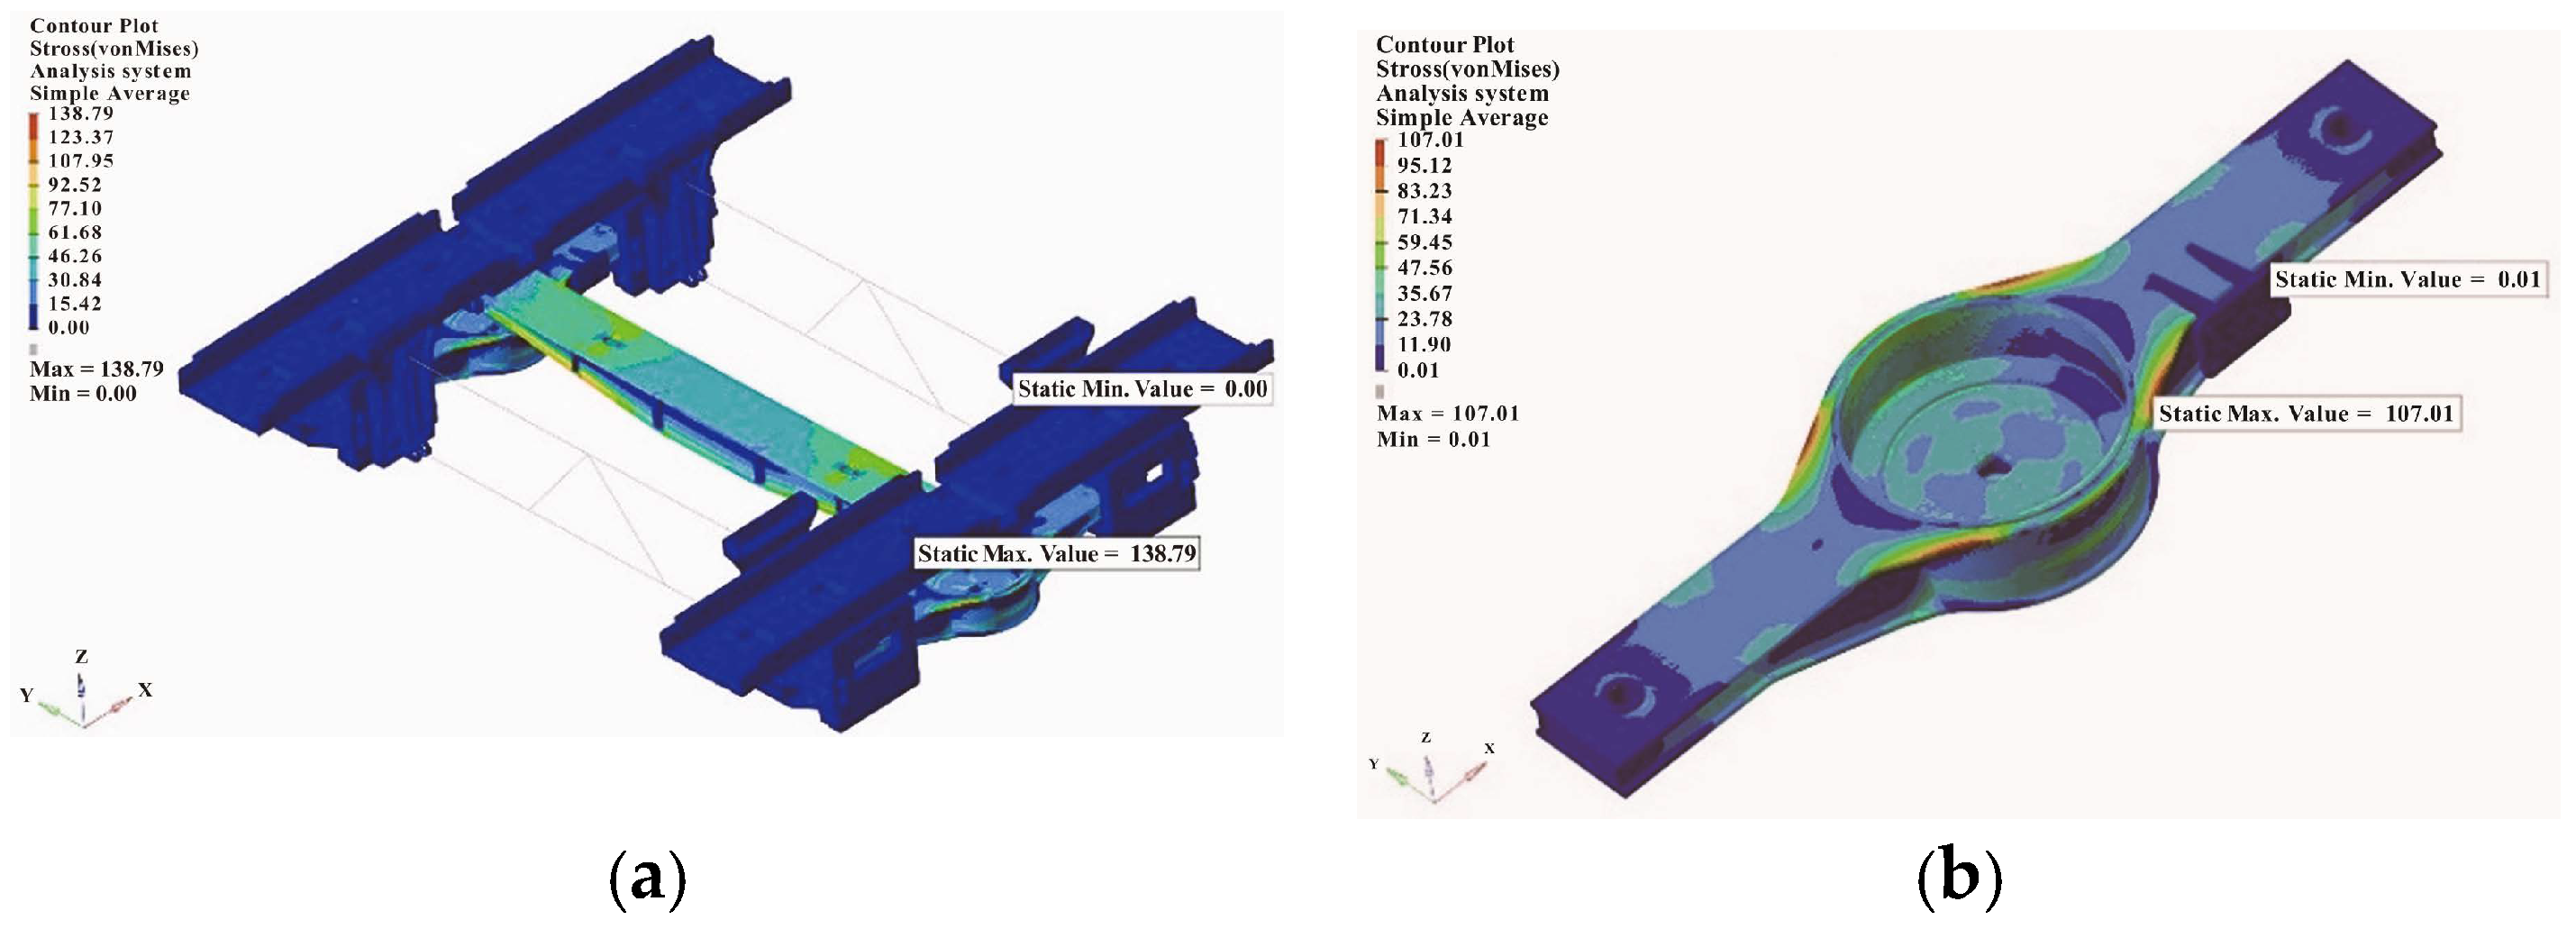
This section validates the static strength reliability of the levitation frame model through a combined simulation and experimental testing approach. In accordance with the EN 13749 standard, UIC 615-4 standard [22], and the general technical specifications for levitation frame load calculation, five typical load cases are defined for the levitation frame, namely static levitation, accelerated traction, curve bending, rescue, and emergency braking conditions. Static strength simulations of the levitation frame under AW3 load conditions are presented in this study. To streamline the article layout without redundant elaboration, only the Accelerated Traction (AT) condition is elaborated herein. The corresponding Von Mises equivalent stress distributions of the full-scale levitation frame and longitudinal beam structure were calculated and are visualized in Figure 6.
Figure 6.
The simulation results of the levitation frame under AT conditions. (a) Overall simulation results of levitation frame. (b) Simulation calculation results of longitudinal beam.
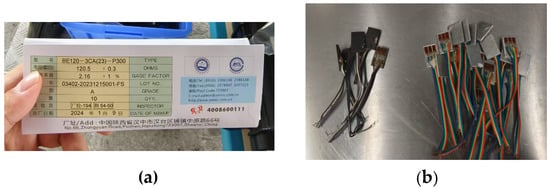
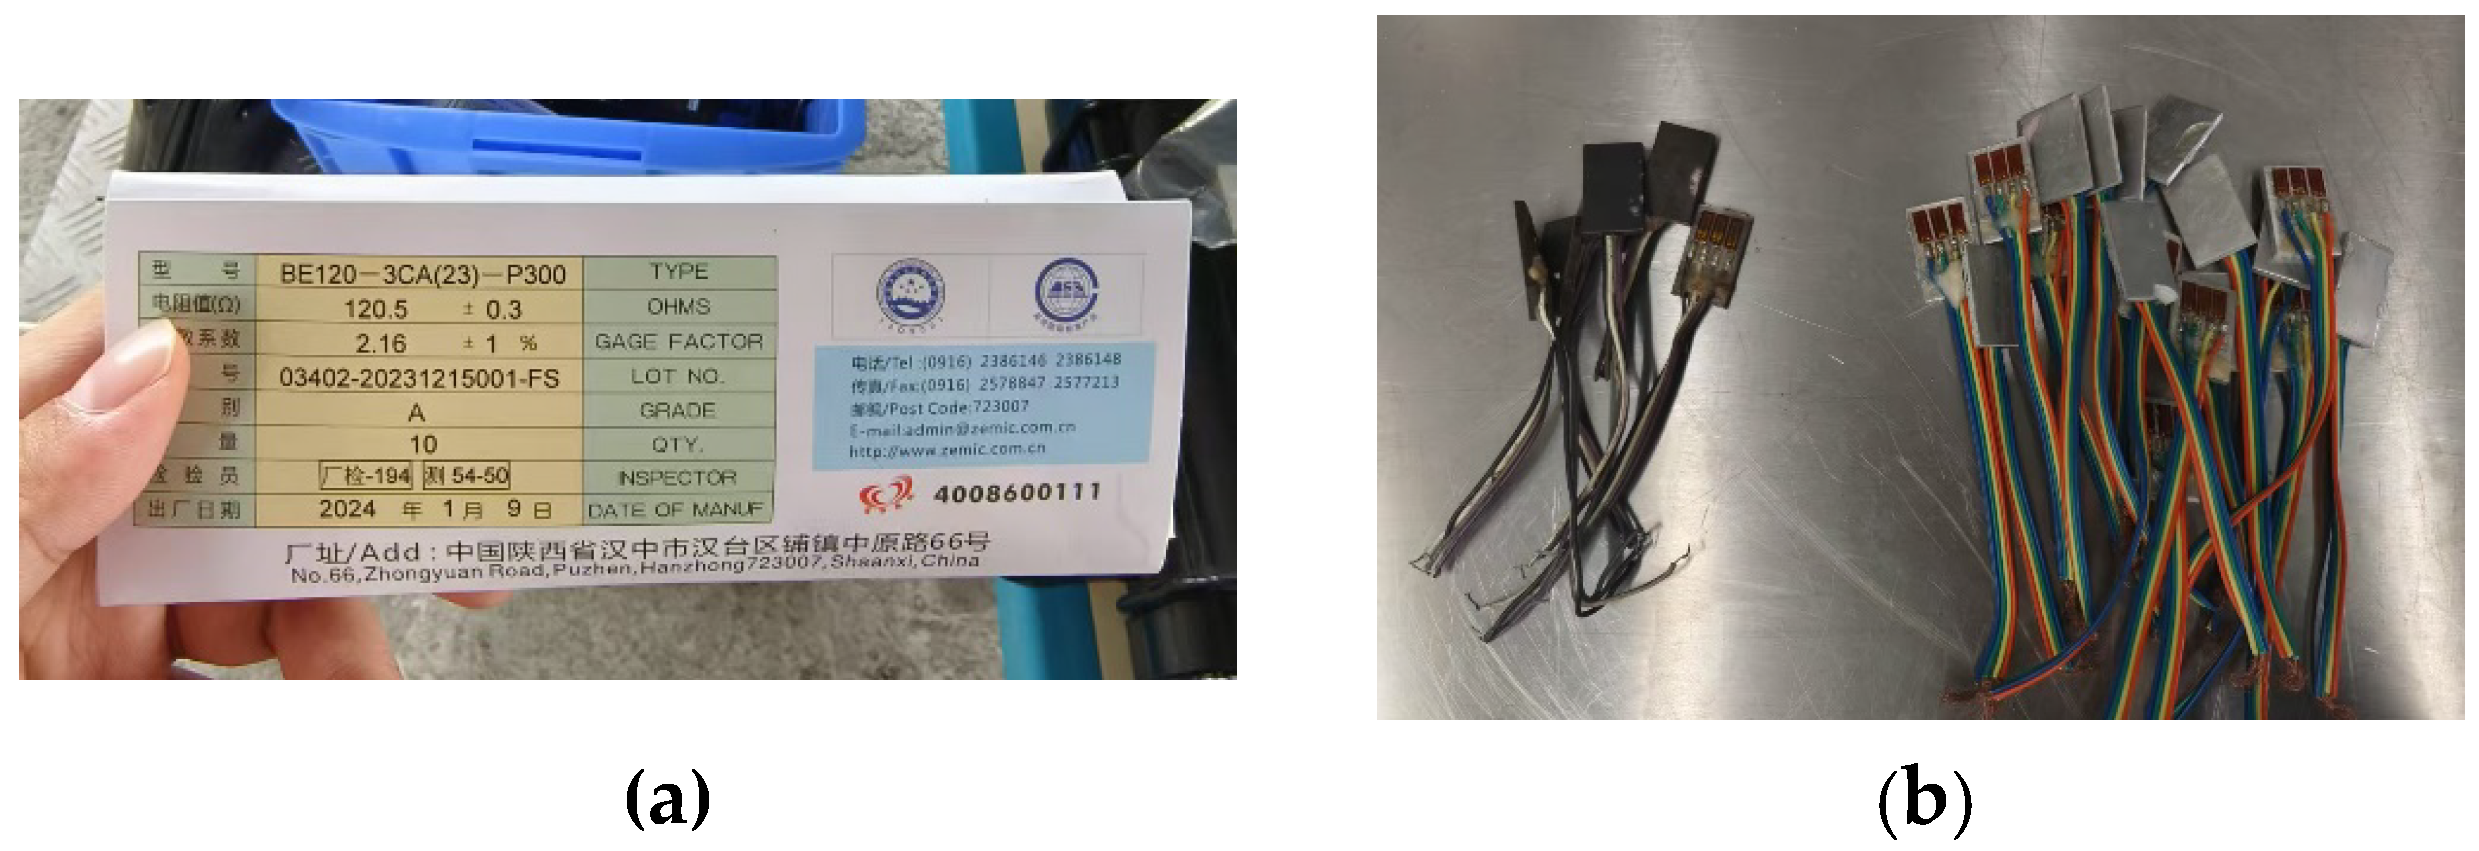
To further validate the reliability of the established finite element model, field line tests are conducted on a three-car marshalling test train that matches the simulation prototype. The test line covers complex operating conditions with large longitudinal gradients and bending angles, including a composite curve with a radius of 607 m, an ultra-high angle of 8°, and a length of 450 m. Strain gauges are mounted at the maximum stress positions of the levitation frame longitudinal beam for comparative analysis with simulation results. Three sets of strain components are acquired using a 0°/45°/90° rosette strain gauge. The principal stresses and principal angle are obtained through data processing, and the von Mises equivalent stress is then calculated. The BE120-3CA(23)-P300 rectangular rosette strain gauges were used for strain measurement, with a nominal resistance of 120.5 Ω and gauge factor of 2.16. For each rosette, the 0° direction (X) is aligned with the vehicle running direction, the 90° direction (Y) corresponds to the lateral direction of the vehicle, and the 45° direction (Z) is the intermediate orientation. Material-matched temperature compensators were applied for thermal compensation, and the strain gauges were wired as full-bridge circuits. Strain data were acquired via the DASP system at a sampling frequency of 500 Hz, with an anti-aliasing filter of 195.313 Hz and sampling interval of 2 ms. Figure 7 presents the basic information of experimental test materials. The measured strain data were post-processed to calculate von Mises equivalent stress for structural assessment.
Figure 7.
Basic test materials for experiments. (a) Strain gauge information. (b) Temperature compensators for aluminum alloy and steel.
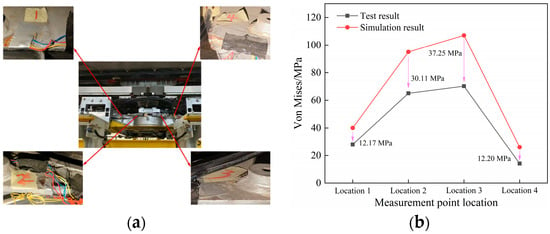
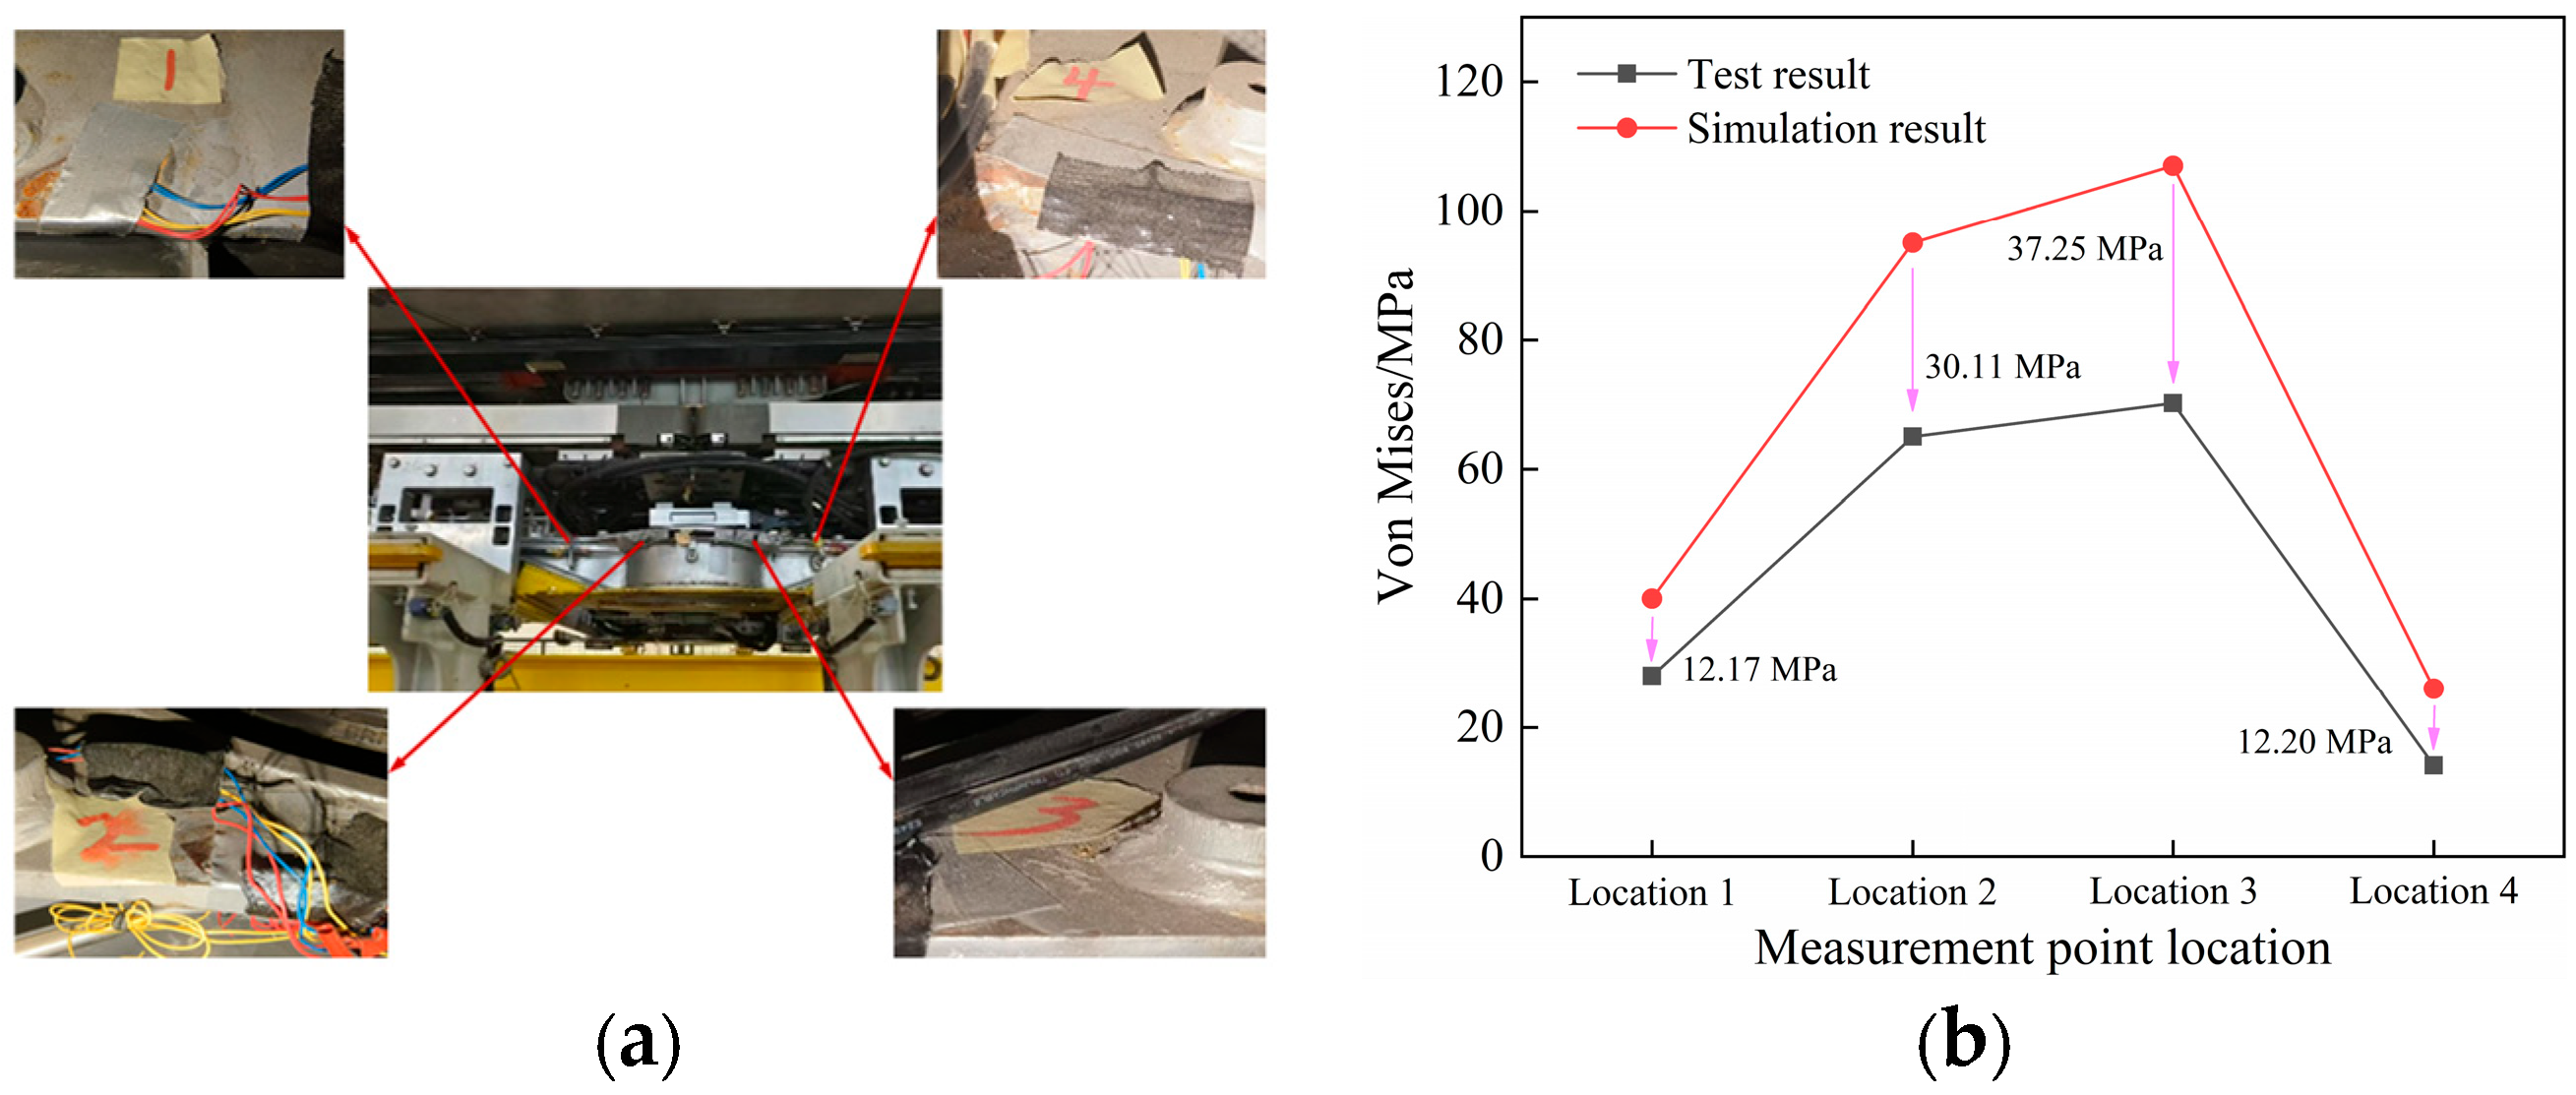
As illustrated in Figure 8, the equivalent stress variations at measuring points 1–4 of the longitudinal beam obtained from static strength tests are highly consistent with the simulation results. The experimentally identified maximum stress regions agree well with the numerical predictions. The maximum tested stress is 69.76 MPa, which is considerably lower than the allowable stress of 355 MPa for the longitudinal beam, demonstrating that the test results fully satisfy the structural strength requirements. A comparative analysis of the simulated and experimental stress values at the four measuring points under the AT condition reveals a maximum stress difference of approximately 37.25 MPa. This discrepancy originates from multiple factors. Primarily, a conservative reduced-magnitude load was applied during the field test to prevent potential damage to the physical prototype. Additional error sources include geometric simplification within the finite-element model where weld-toe local profiles and weld reinforcements are smoothed out; minor installation offset of strain gauges relative to actual hot-spot positions; material property scatter of manufactured components; and simplified contact-friction assumptions for assembled multi-part interfaces. Although the maximum absolute stress difference reaches 37.25 MPa, the corresponding maximum relative error is approximately 34.7%. Nevertheless, the changing trend of stress across four measuring points and the locations of peak-stress regions match well between the simulation and experiment. This indicates that the finite-element model can accurately reproduce the stress distribution pattern of the longitudinal beam, which provides credible support for the following structural optimization work.
Figure 8.
Distribution of measurement points and test results under AT conditions. (a) Layout of experimental measurement points. (b) Comparison of test and simulation trends at measurement points.
To quantitatively evaluate the agreement between simulation and tests, three metrics, including point-wise relative error, root-mean-square error (RMSE) and Pearson correlation coefficient, are calculated based on stress data from four measurement points. The point-wise relative errors range from 28.56% to 37.64%, and the RMSE between simulated and measured stress reaches 29.41 MPa. Nevertheless, the Pearson correlation coefficient reaches 0.986, which indicates excellent linear consistency of stress variation trend among different measuring points.
Overall, the consistent correlation between the simulated strength results and field test data of the levitation frame longitudinal beam verifies the structural strength reliability and the accuracy of the established finite element model, providing a solid basis for subsequent structural optimization. The maximum simulated stress of the longitudinal beam under the AT condition is 107.01 MPa, which is far below the material allowable stress of 355 MPa, indicating a considerable optimization margin for structural lightweight design. Furthermore, the longitudinal beam is an extruded thin-walled structure, and optimizing the structural parameters of its internal ribs can effectively realize the lightweight design of the levitation frame. Therefore, the longitudinal beam is selected as the research object for multi-objective optimization. By optimizing the internal structural parameters of the longitudinal beam, this study achieves a lightweight design of the levitation frame while guaranteeing overall structural safety and mechanical performance.
3. Structural Optimization Theory
3.1. Multinomial Response Surface Method
The polynomial response surface method is a system that combines statistical and mathematical methods to establish a clear expression between the input parameters and the output response. Its core principle is to use relatively simple mathematical polynomials to fit a complex and often unknown real function relationship. Thus, the global optimal solution of the polynomial is found by the optimization method. In the design space of variables, the functional relationship between the actual response y and the design parameter x is as follows [23]:
where (x) is the response function; ε is the comprehensive error (including random error and modeling error, etc.); N is the term of the basis function φi (x); ai is the coefficient. Each sample point consists of an independent variable xj (j = 1, 2, …, n). Then, the equation of the quadratic response surface model can be expressed as
where a0 is a constant; aj, ajk, ajj are all coefficients. By analogy, the response functions of the cubic and quartic response surface models can be obtained. In engineering applications, the polynomial model with more than three orders will affect the computational efficiency because of the large number of design parameters. Therefore, the linear and quadratic polynomial response surface methods are used to construct the surrogate model.
3.2. Kriging Surrogate Model
The Kriging model is a surrogate model technology that has been widely studied by researchers because of its good approximation ability with regard to nonlinear functions. The Kriging model obtains the predicted value by linearly weighting the known sample points, and its core is the variance function. It consists of two parts: a parametric model represented by polynomials and a nonparametric stochastic process model represented by random distribution functions [24,25].
where f(x) = [f1(x), f2(x), …, fp(x)] is the regression model; β is the regression coefficient; z(x) is a local deviation. The mathematical characteristics can be expressed by the following formulas:
where E is the integer function, Var is the variance function, Cov is the covariance function, σ is the variance, and R is the correlation function; this correlation will decrease with the increase of distance.
y(x) = F(β,x) + z(x) = fΤ(x)β + z(x)
E[z(x)] = 0
Var[z(x)] = σ2
Cov[Z(xi),Z(xj)] = σ2R(θ,xi,xj)
The predicted value expression of the design point is
In the formula, w (x) is the estimated value of the response value y, and w (x) is the difference coefficient matrix.
The obtained error expression is
In the formula, Z = [z1, z2, …, zk]T is the error matrix of the training sample points.
The expression of the prediction variance is
In the formula, r is the correlation vector between the measured point x and the sample point. In order to reduce the prediction error of the Kriging model, σx needs to be minimized. Let FT w(x) = f(x). Then, the Lagrange function is introduced. Finally, the expression of the predicted value of the design point is
In the formula, it is a polynomial parameter.
3.3. Optimization Algorithm
An optimization method used to mimic biological evolution is called a genetic algorithm. The multi-objective genetic algorithm (MOGA) efficiently solves multi-objective problems by utilizing the fundamental genetic algorithm architecture. MOGA has the advantages of quick operation speed, good solution set convergence, and uniform Pareto front distribution when compared to other methods, such as non-dominated sorting genetic algorithms and multi-objective particle swarm optimization [26]. The approach has been effectively used for structural parameter optimization and has drawn a lot of interest recently.
The Kriging surrogate models for mass and safety factor are established using the DACE toolbox in MATLAB 2023b. A constant trend (regpoly0) and Gaussian correlation function (corrgauss) are employed. Hyperparameters are estimated by maximum likelihood estimation, with lower bound 0.1, initial guess 10 and upper bound 20 for each hyperparameter. The four design variables are normalized into [0, 1] by mapminmax before training. The DACE built-in optimizer is used for hyperparameter optimization.
4. Structural Parameter Optimization Strategy
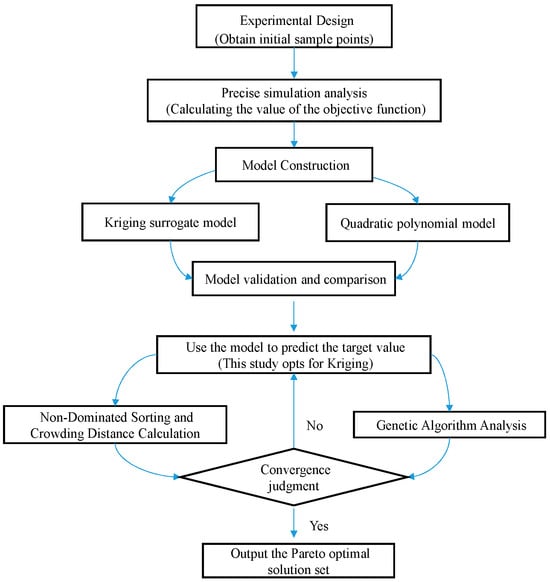
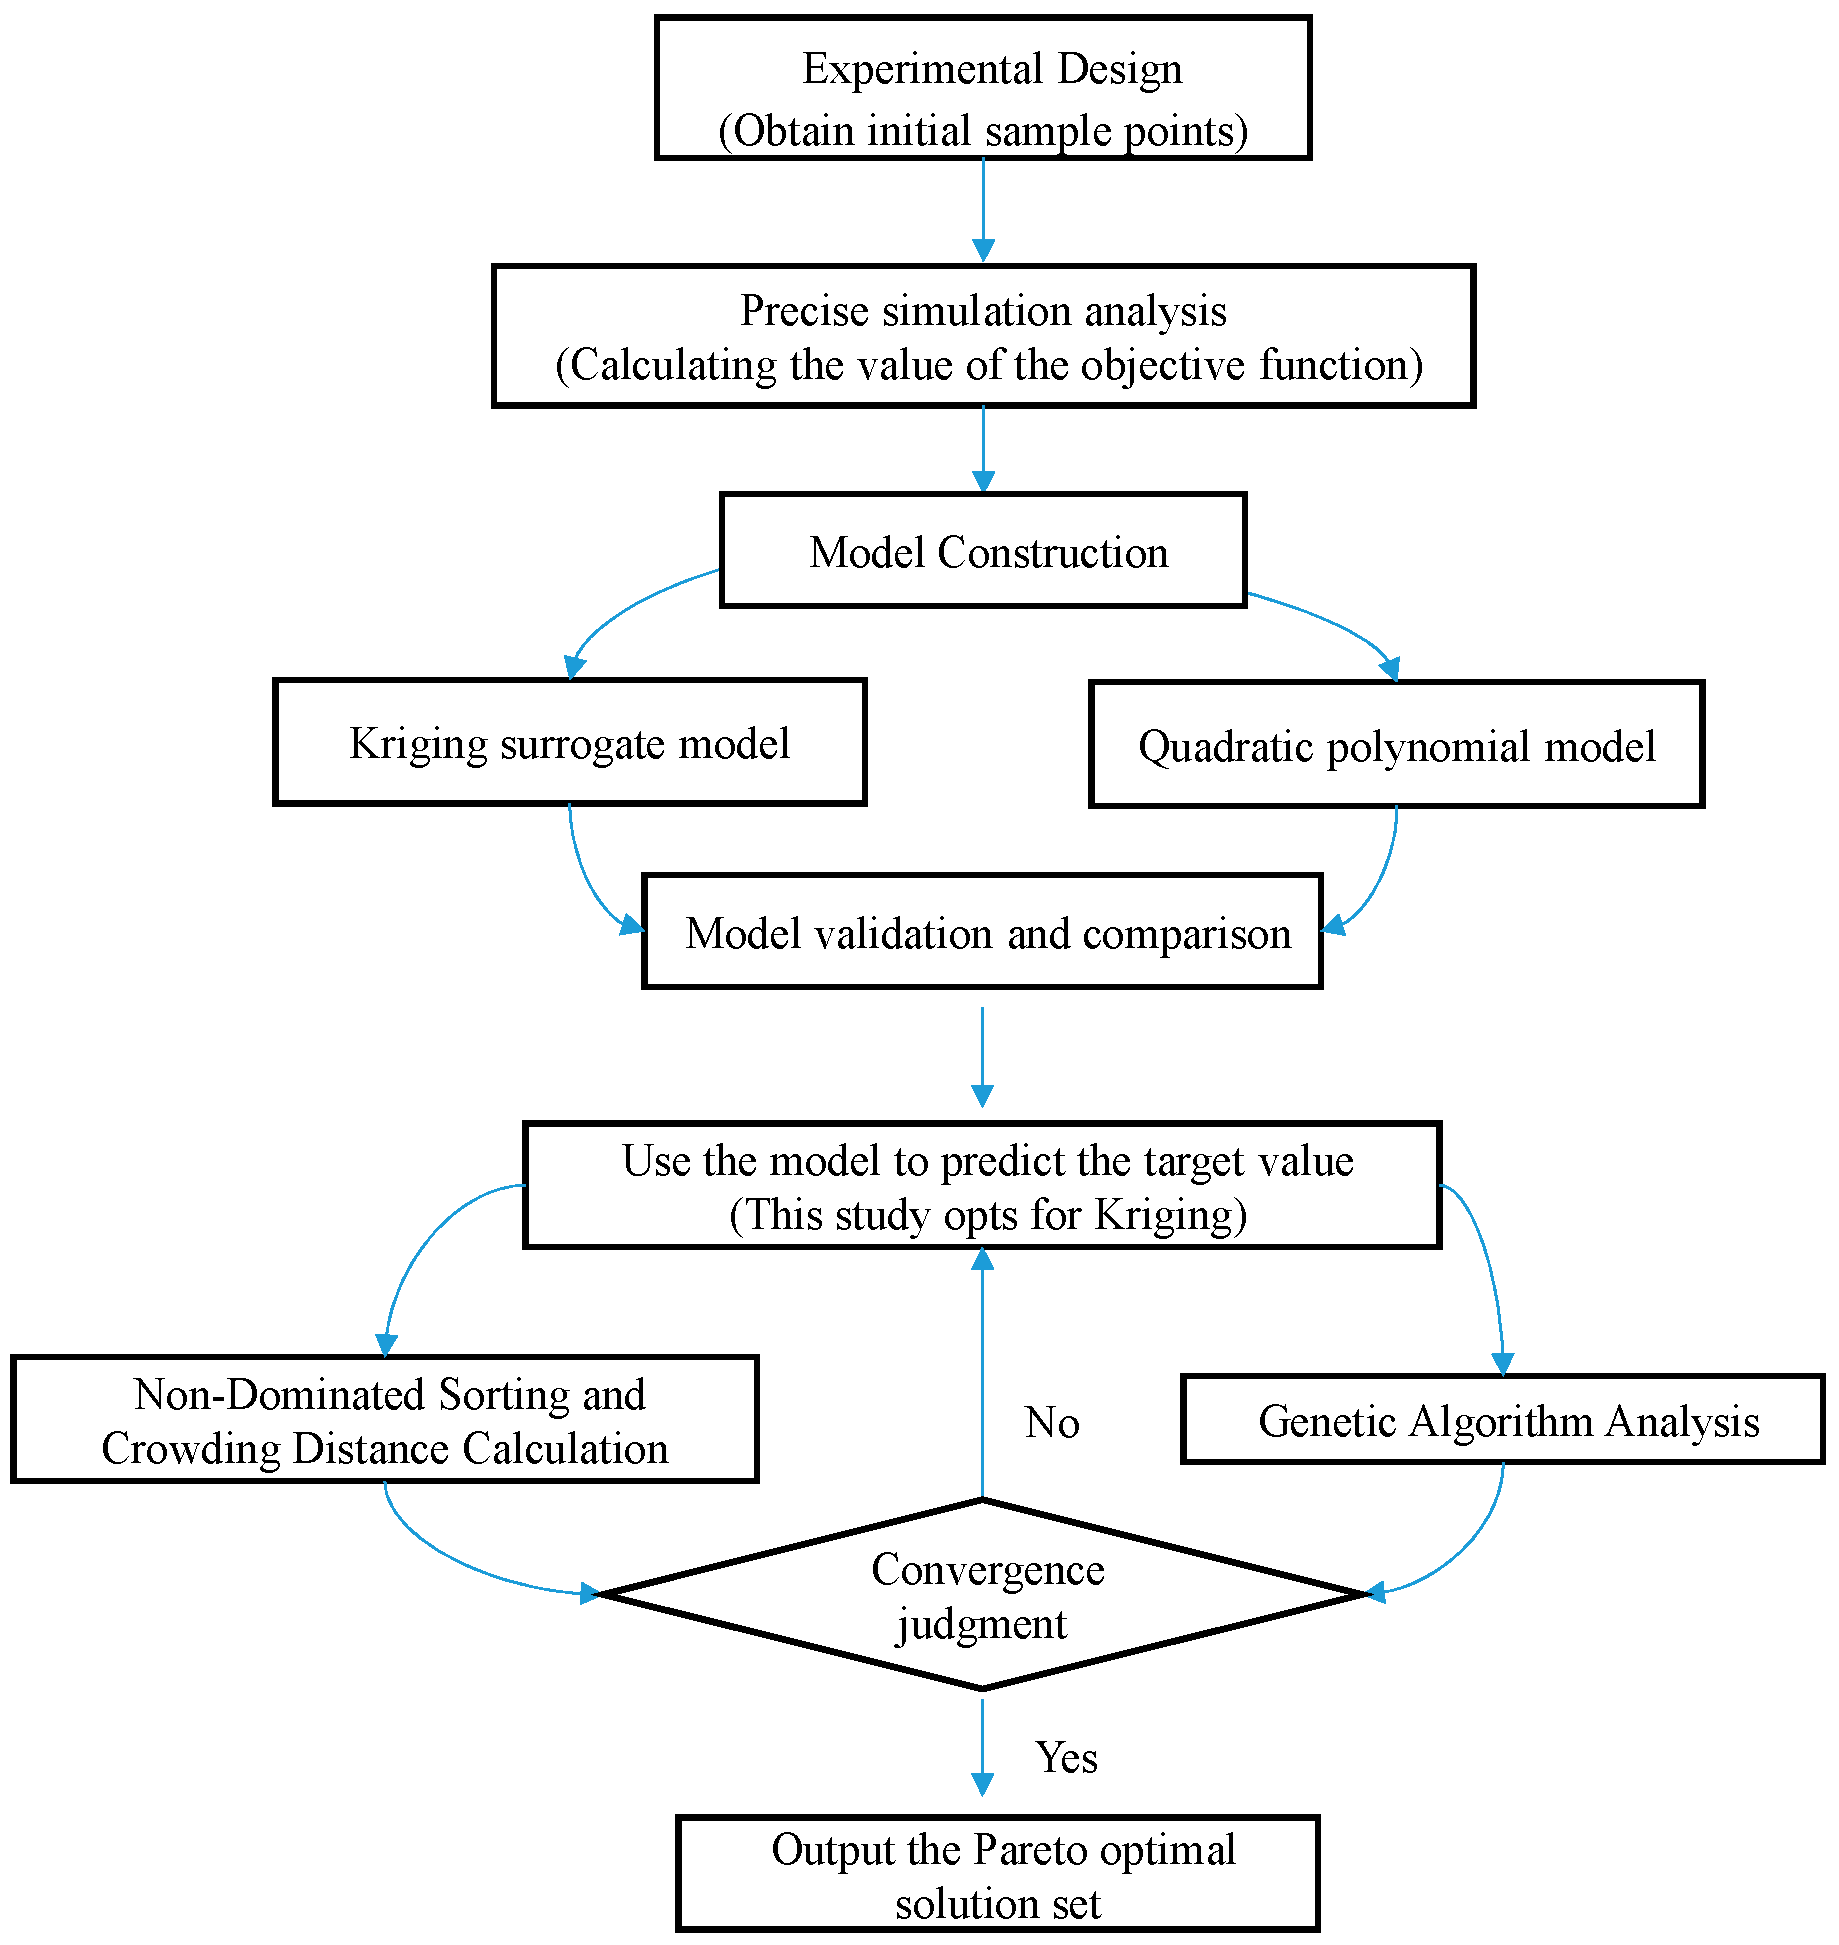
Taking the longitudinal beam of the maglev train levitation frame as the research object, this study defines two design objectives, namely the structural mass and safety factor of the longitudinal beam, and selects the key dimensional parameters of the beam components as design variables. Latin hypercube sampling is adopted to generate sufficient sample points for experimental design. Finite element simulation is performed on all sample sets to obtain corresponding mechanical response data. Two surrogate models correlating the design variables with response objectives are established based on the Kriging method and polynomial response surface method, respectively. The fitting accuracy of the two surrogate models is comprehensively compared to determine the optimal modeling approach. Subsequently, the multi-objective genetic algorithm (MOGA) is employed to execute structural optimization based on the superior surrogate model, and finite element verification is conducted to validate the optimized results. The complete optimization workflow is illustrated in Figure 9.
Figure 9.
Optimization ideas.
4.1. Experimental Design
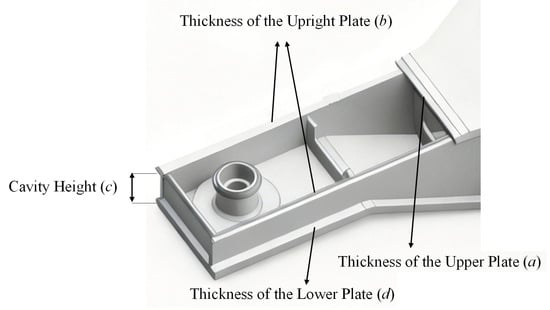
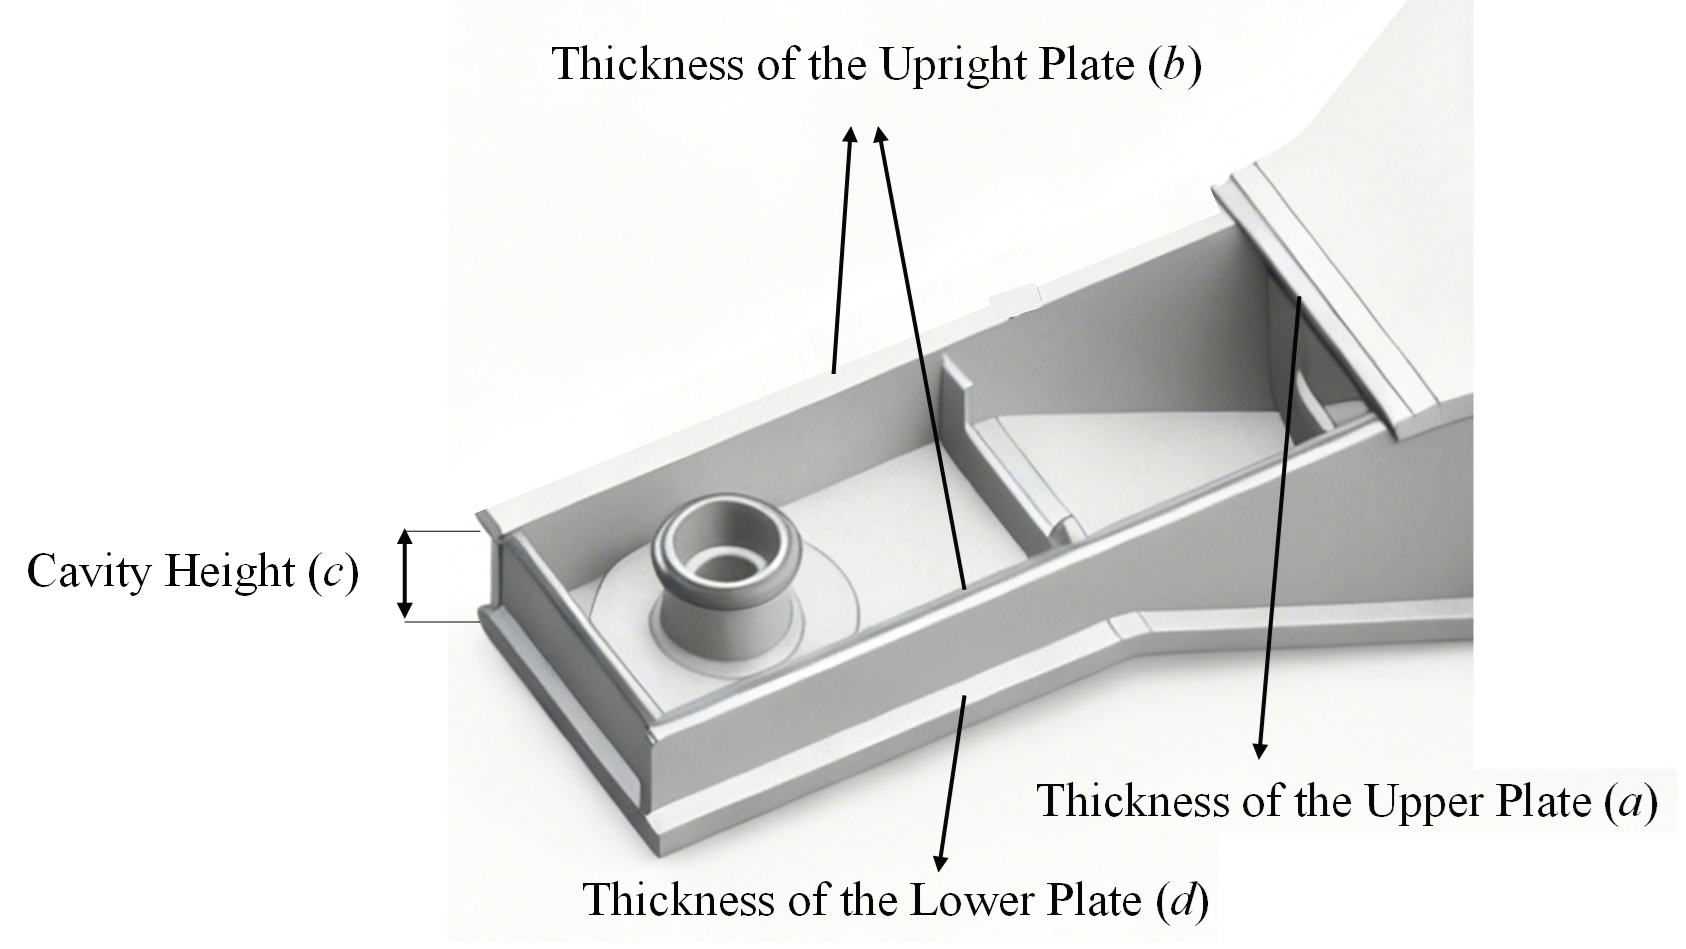
The maximum stress under extreme operating conditions for the longitudinal beam structure made of steel materials is approximately 107.01 MPa, according to the simulation and test results of Section 2.3. There is a wide optimization space when compared to the material’s permitted stress. In order to optimize the structure of the levitation frame longitudinal beam welded by various plate thickness structures, the upper plate thickness (a), the vertical plate thickness (b), the cavity height (c), and the lower plate thickness (d), which represent the structural size of the longitudinal beam, are chosen as the design variables of this section. The selection rationale is that the plate thickness of structural panels serves as a critical parameter for lightweight design. Adjusting the plate thickness of the longitudinal beam can significantly change its overall mass. In addition, parameter c is selected because the height of the longitudinal beam can be adjusted by the air spring. This parameter does not affect the overall structure of the levitation frame and can vary within a certain range. The aforementioned design variables, a, b, c and d, are configured to follow the normal distribution. Latin hypercube sampling (LHS) based on truncated normal distribution is adopted to generate 25 sample points (see Supplementary Materials). For each design variable, the mean of the normal distribution is the initial baseline value with a coefficient of variation of 0.3. Variable upper and lower bounds act as truncation limits; out-of-bound samples are discarded and re-sampled. The sampling is implemented in MATLAB with the maximin criterion.
As shown in Figure 10, it should be noted that variables a, b, c and d cannot fully define the complete geometry of the longitudinal beam. These variables govern the key cross-sectional thicknesses and cavity height and are treated as design variables. All other structural details, including the total beam length, stiffener arrangement and local features, remain identical to the initial prototype as fixed parameters. Both finite-element stress computation and structural mass calculation are performed based on this geometric model combining design variables and fixed parameters. The design variables are randomly sampled using the Latin hypercube sampling method to produce 25 sets of sample points for their beginning values as well as upper and lower limits as indicated in Table 3.
Figure 10.
Design variable location diagram.
Table 3.
Range of design variables.
The structural bearing capacity and lightweight characteristics of the levitation frame are described in this section using the safety factor R and mass m, because the levitation frame must meet the corresponding bearing capacity while achieving the lightweight design goal as much as possible. The following formula is used to determine the safety factor R:
Variables to be taken into account include the allowable stress and the working stress. The safety factor R and mass m corresponding to the above 25 groups of sample points are calculated by the finite element method as output variables.
4.2. Delegation Model
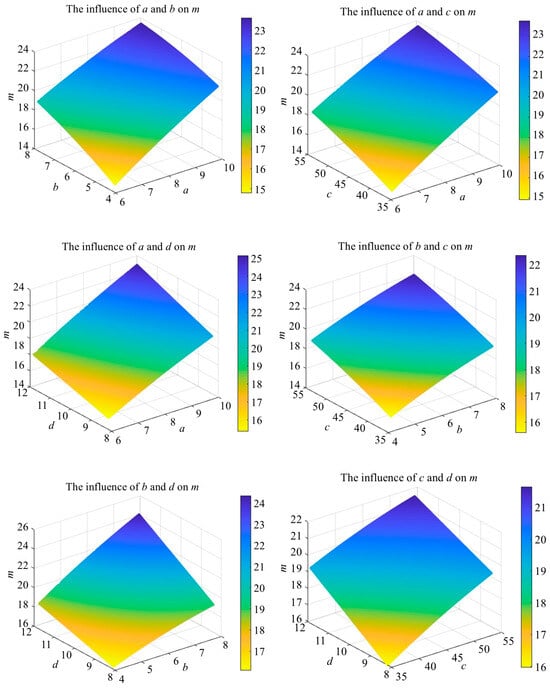
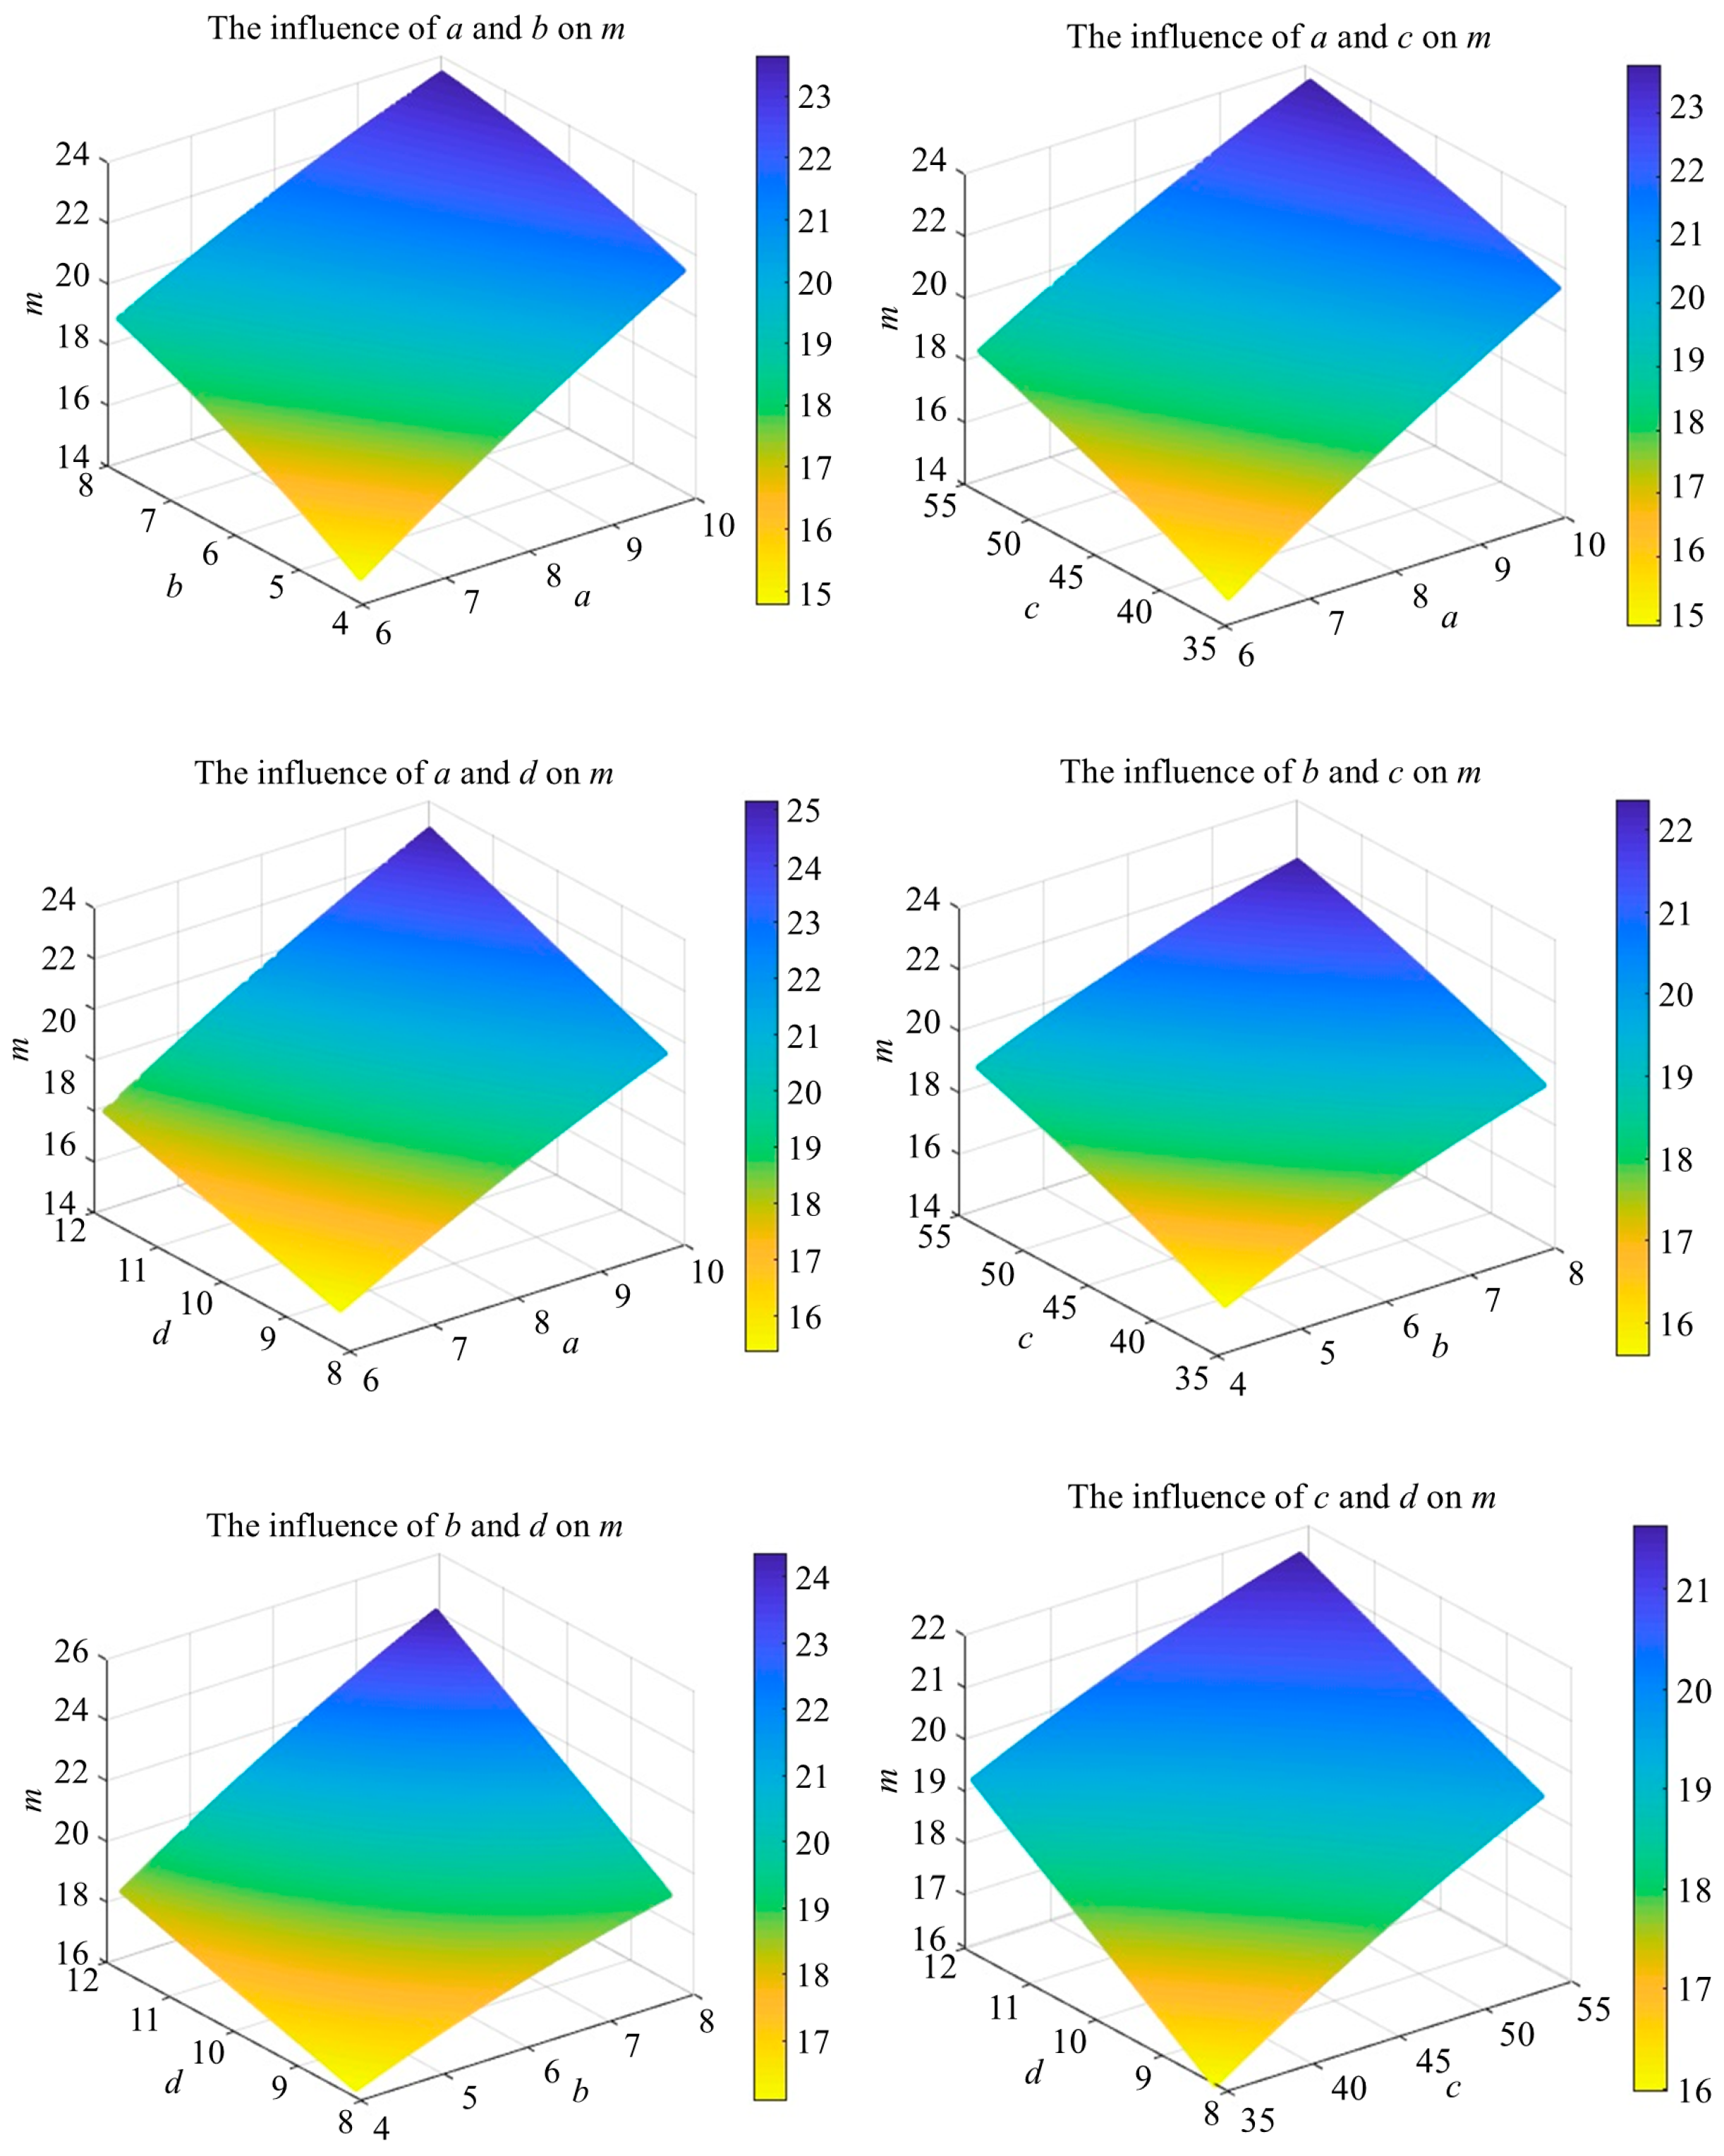
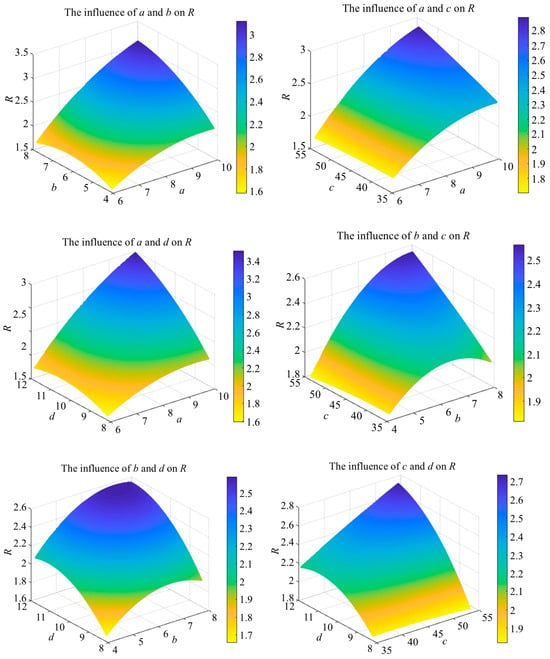
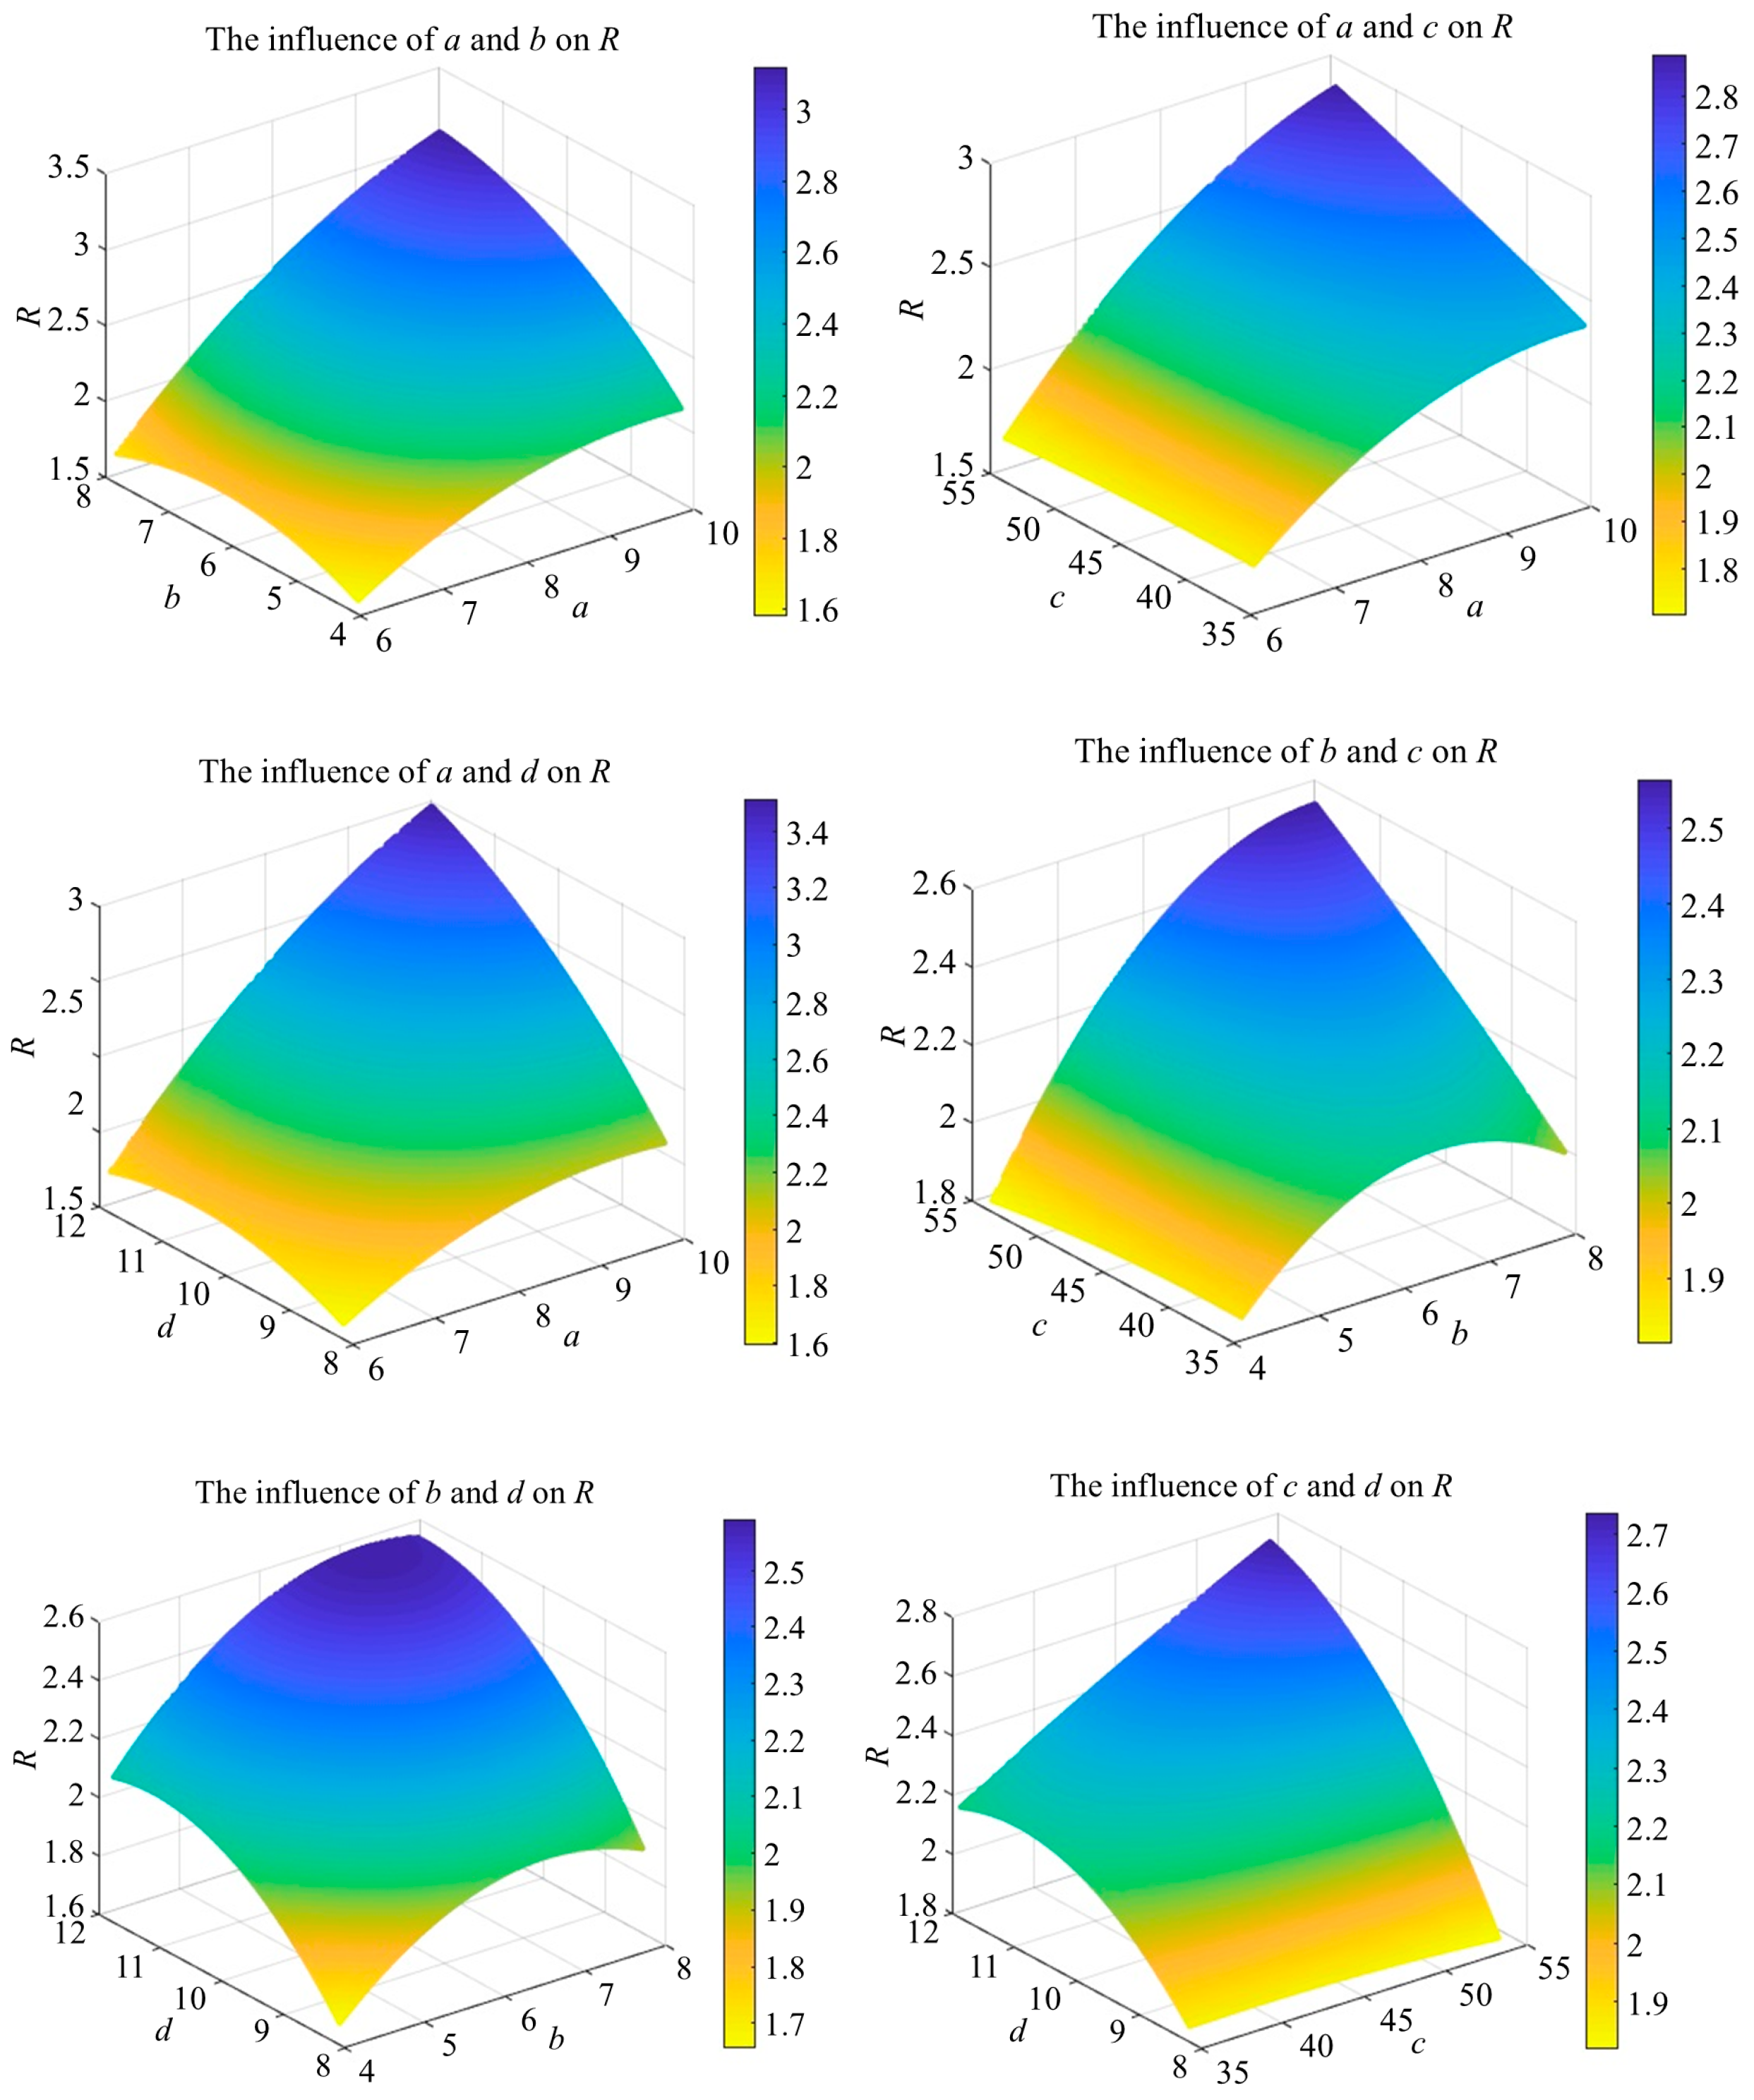
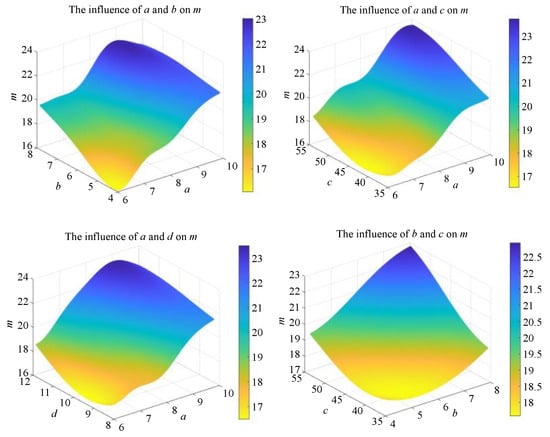
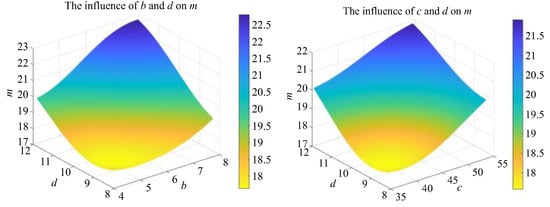
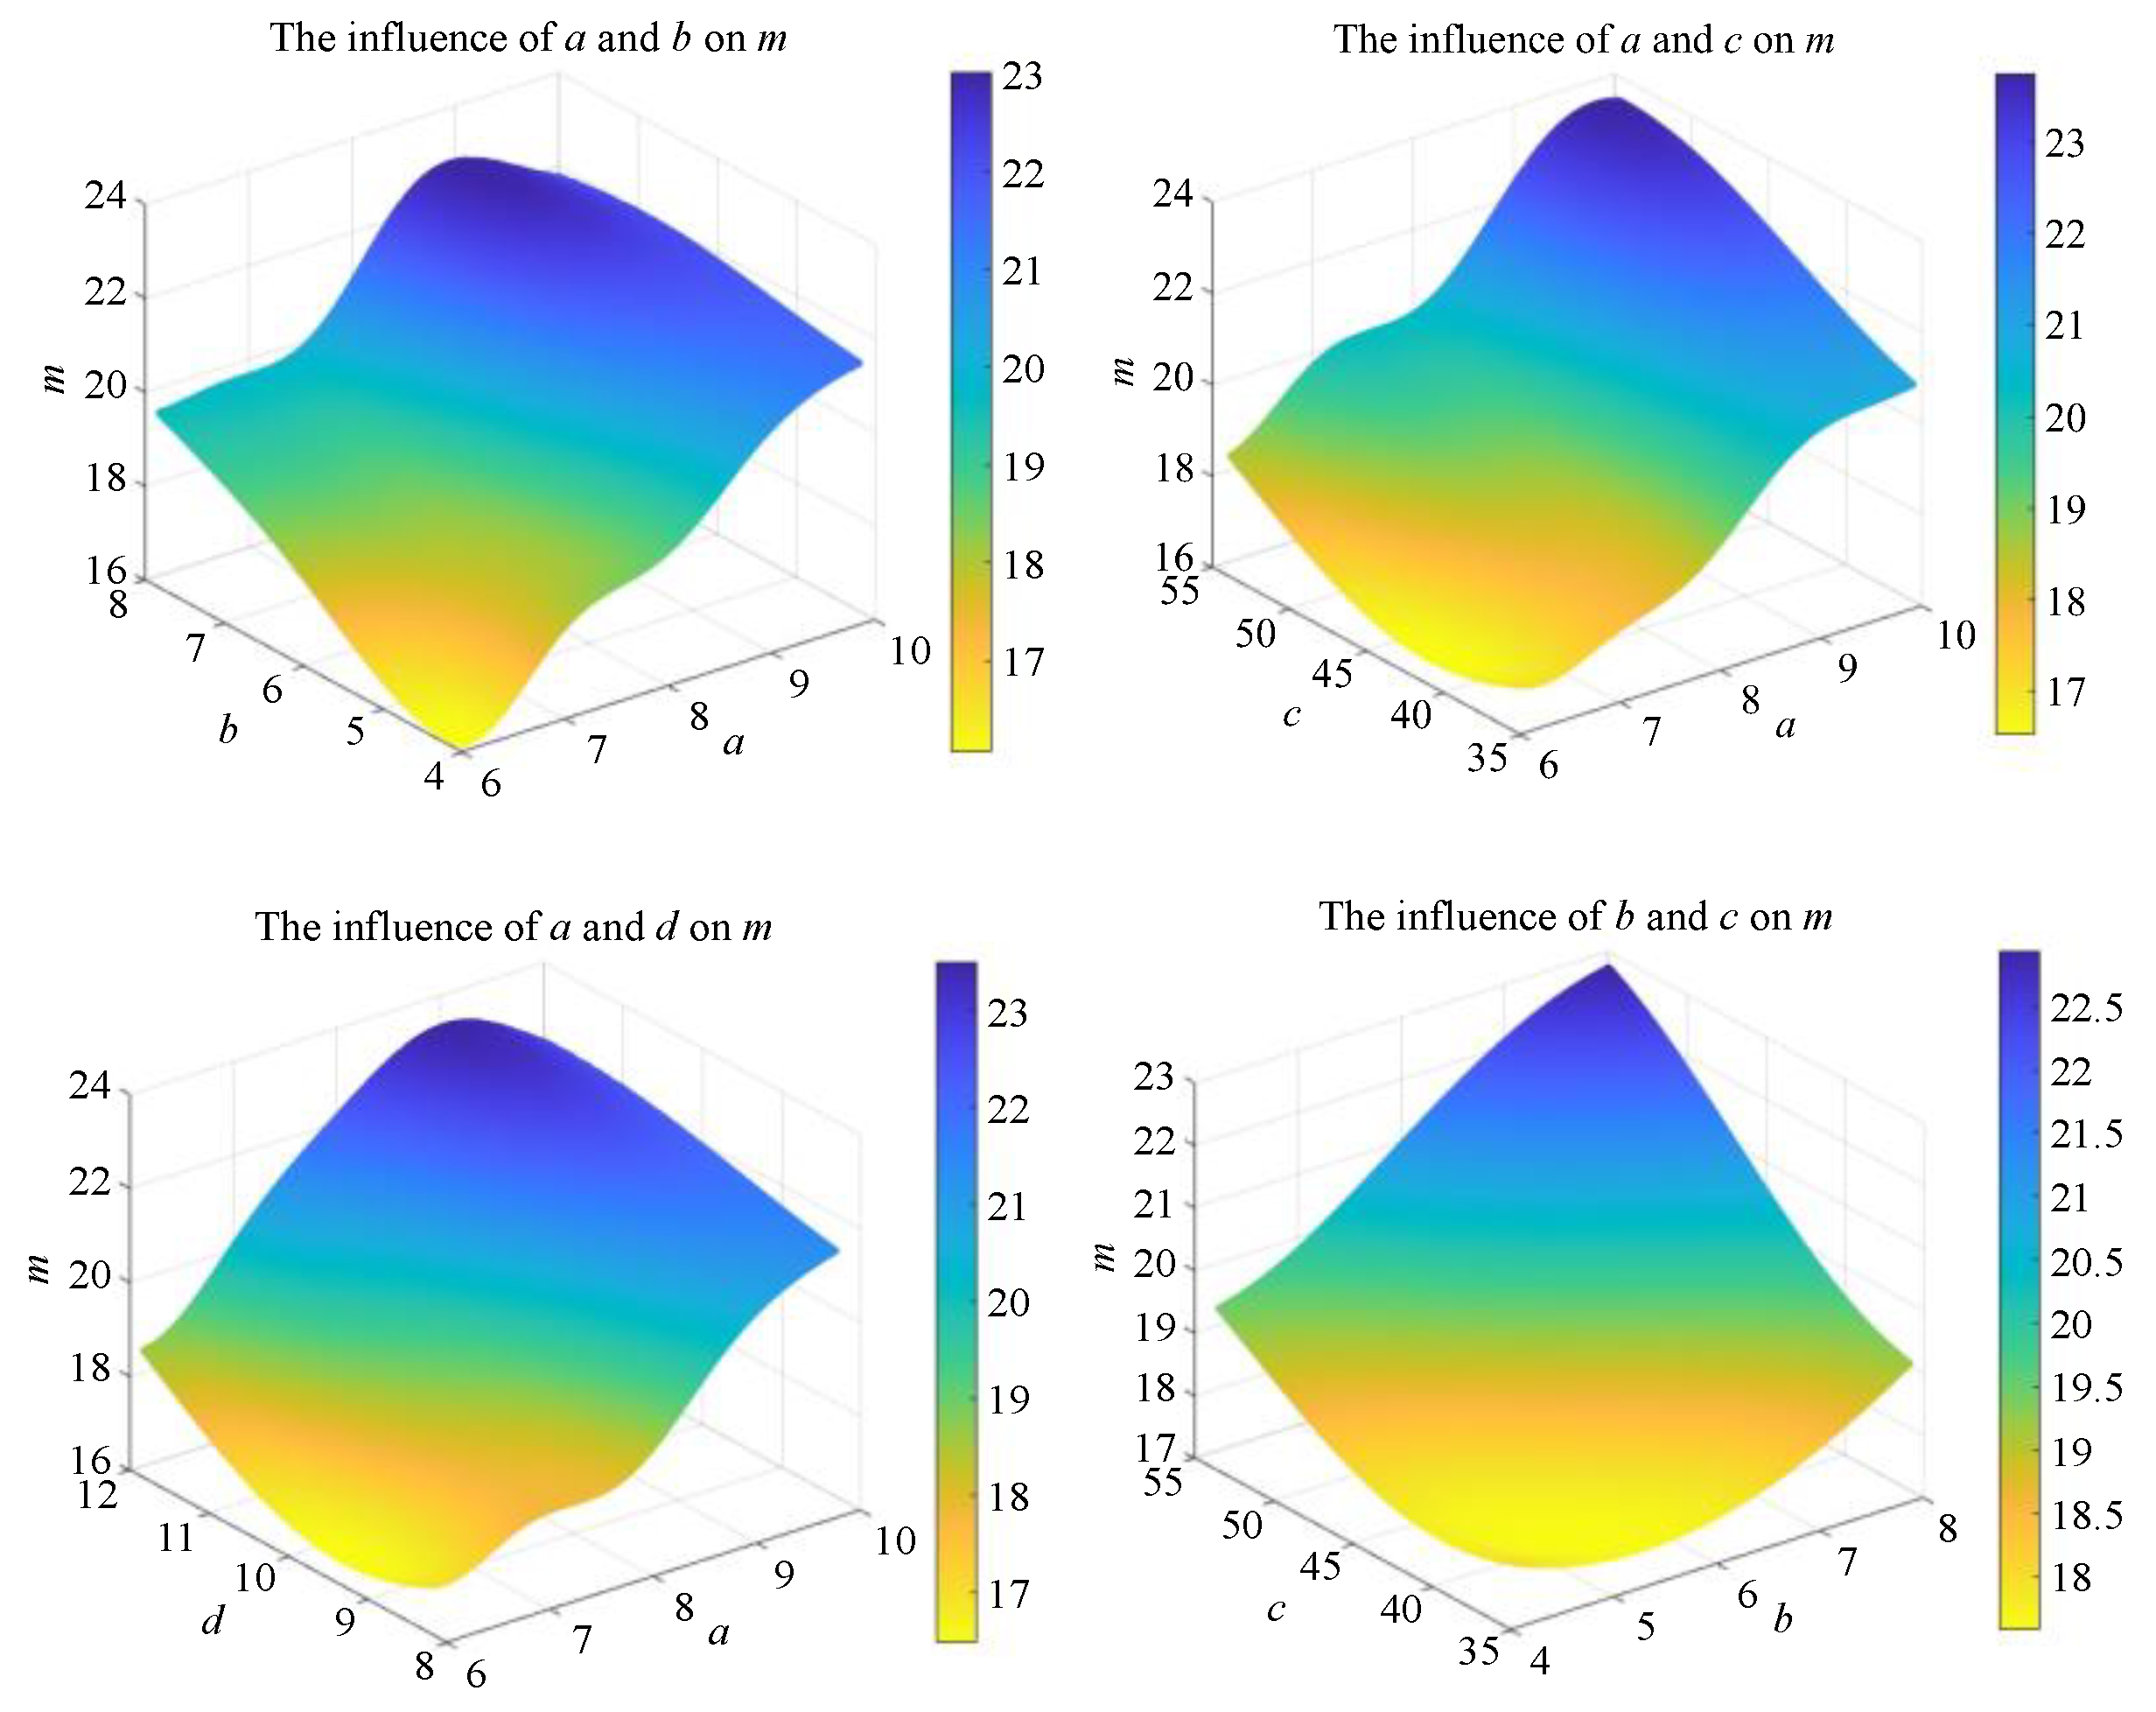
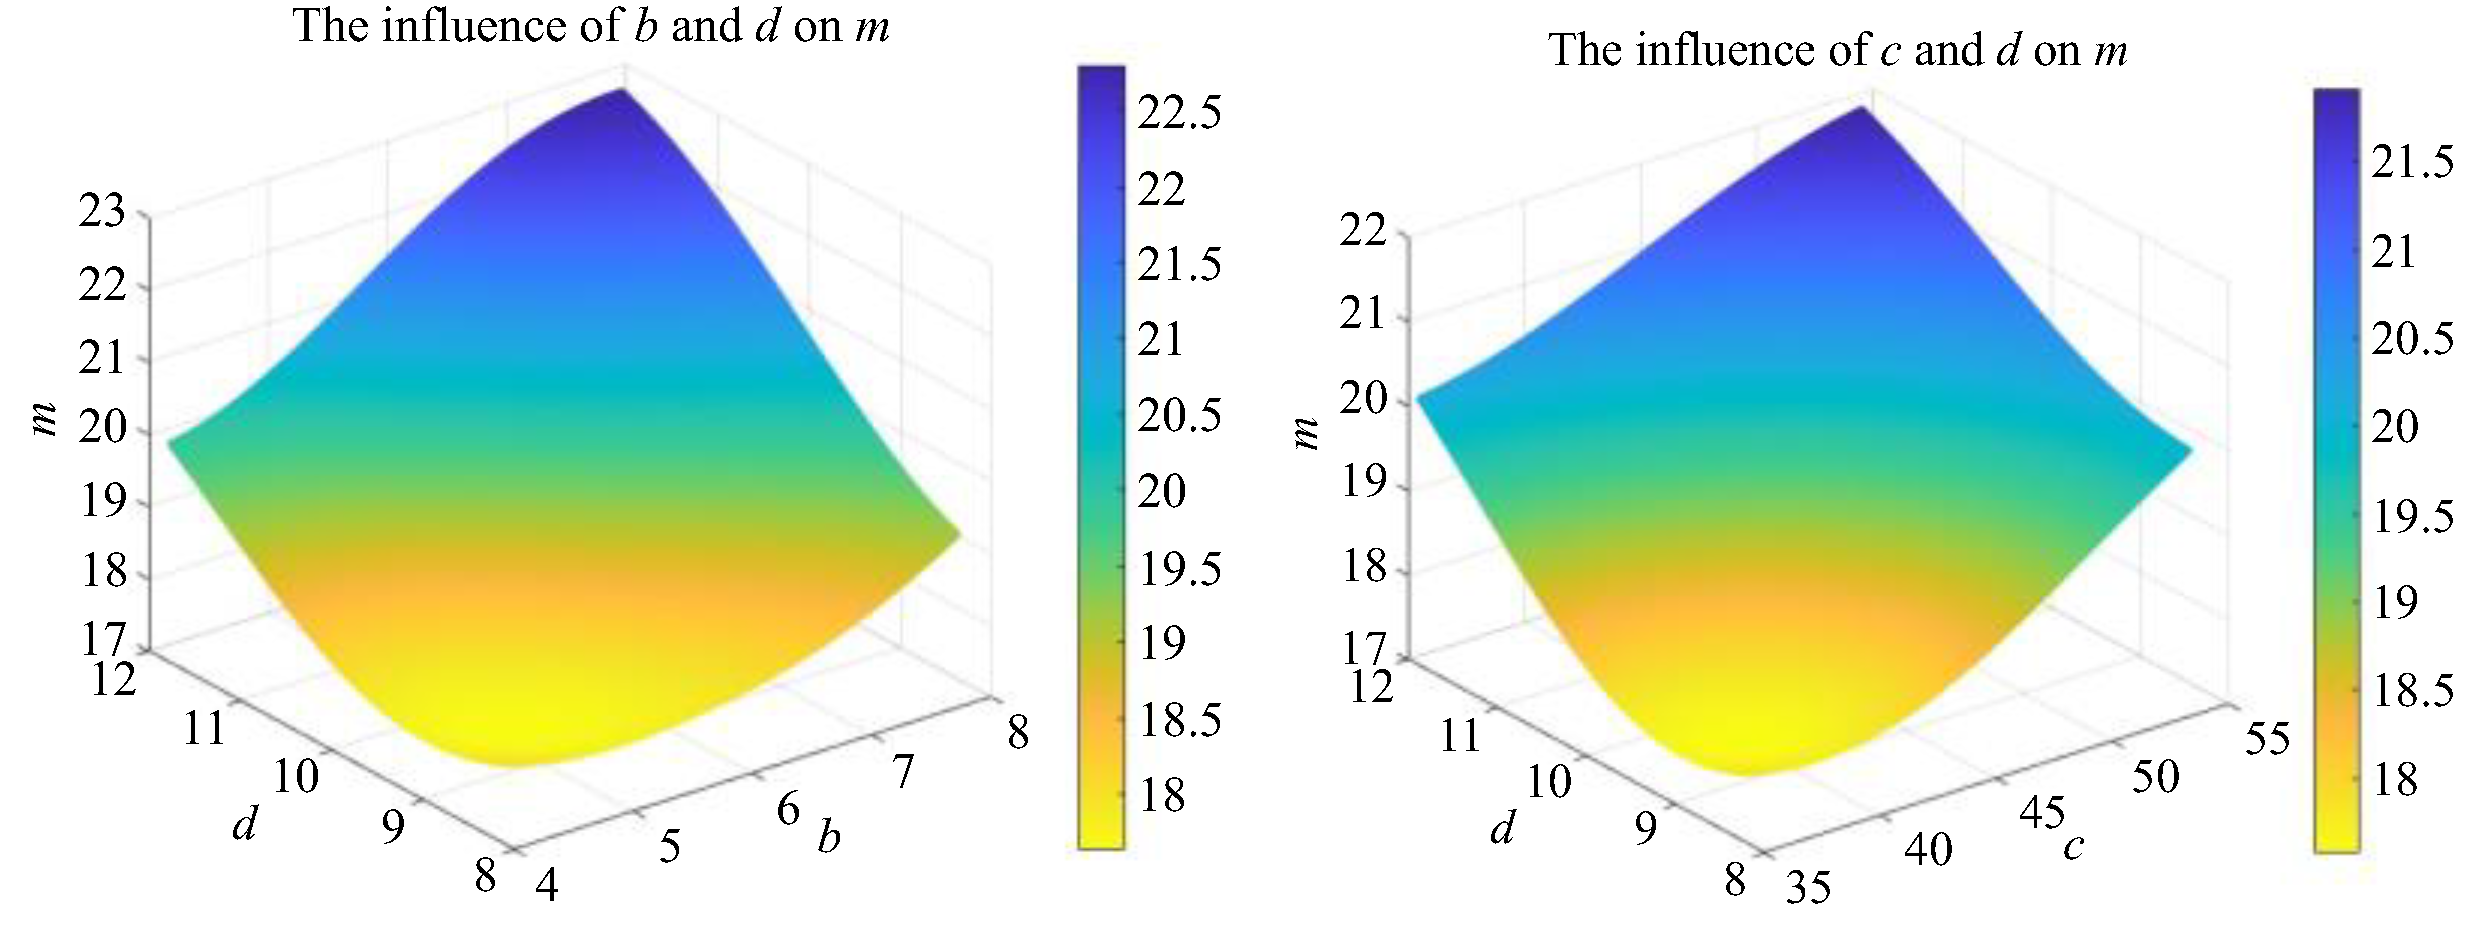
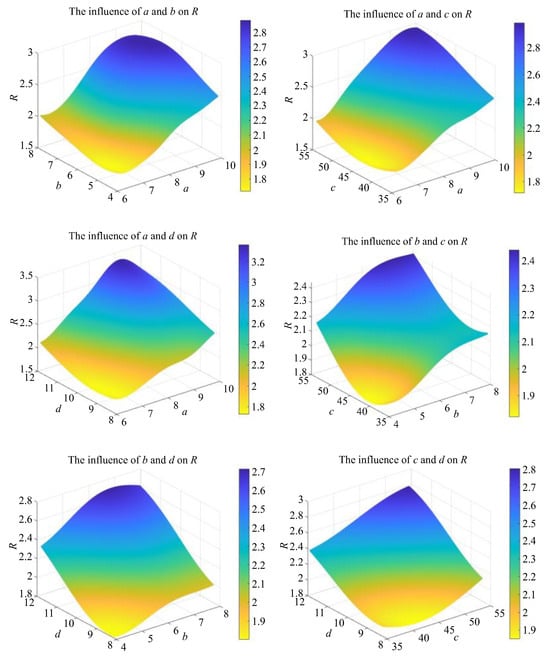
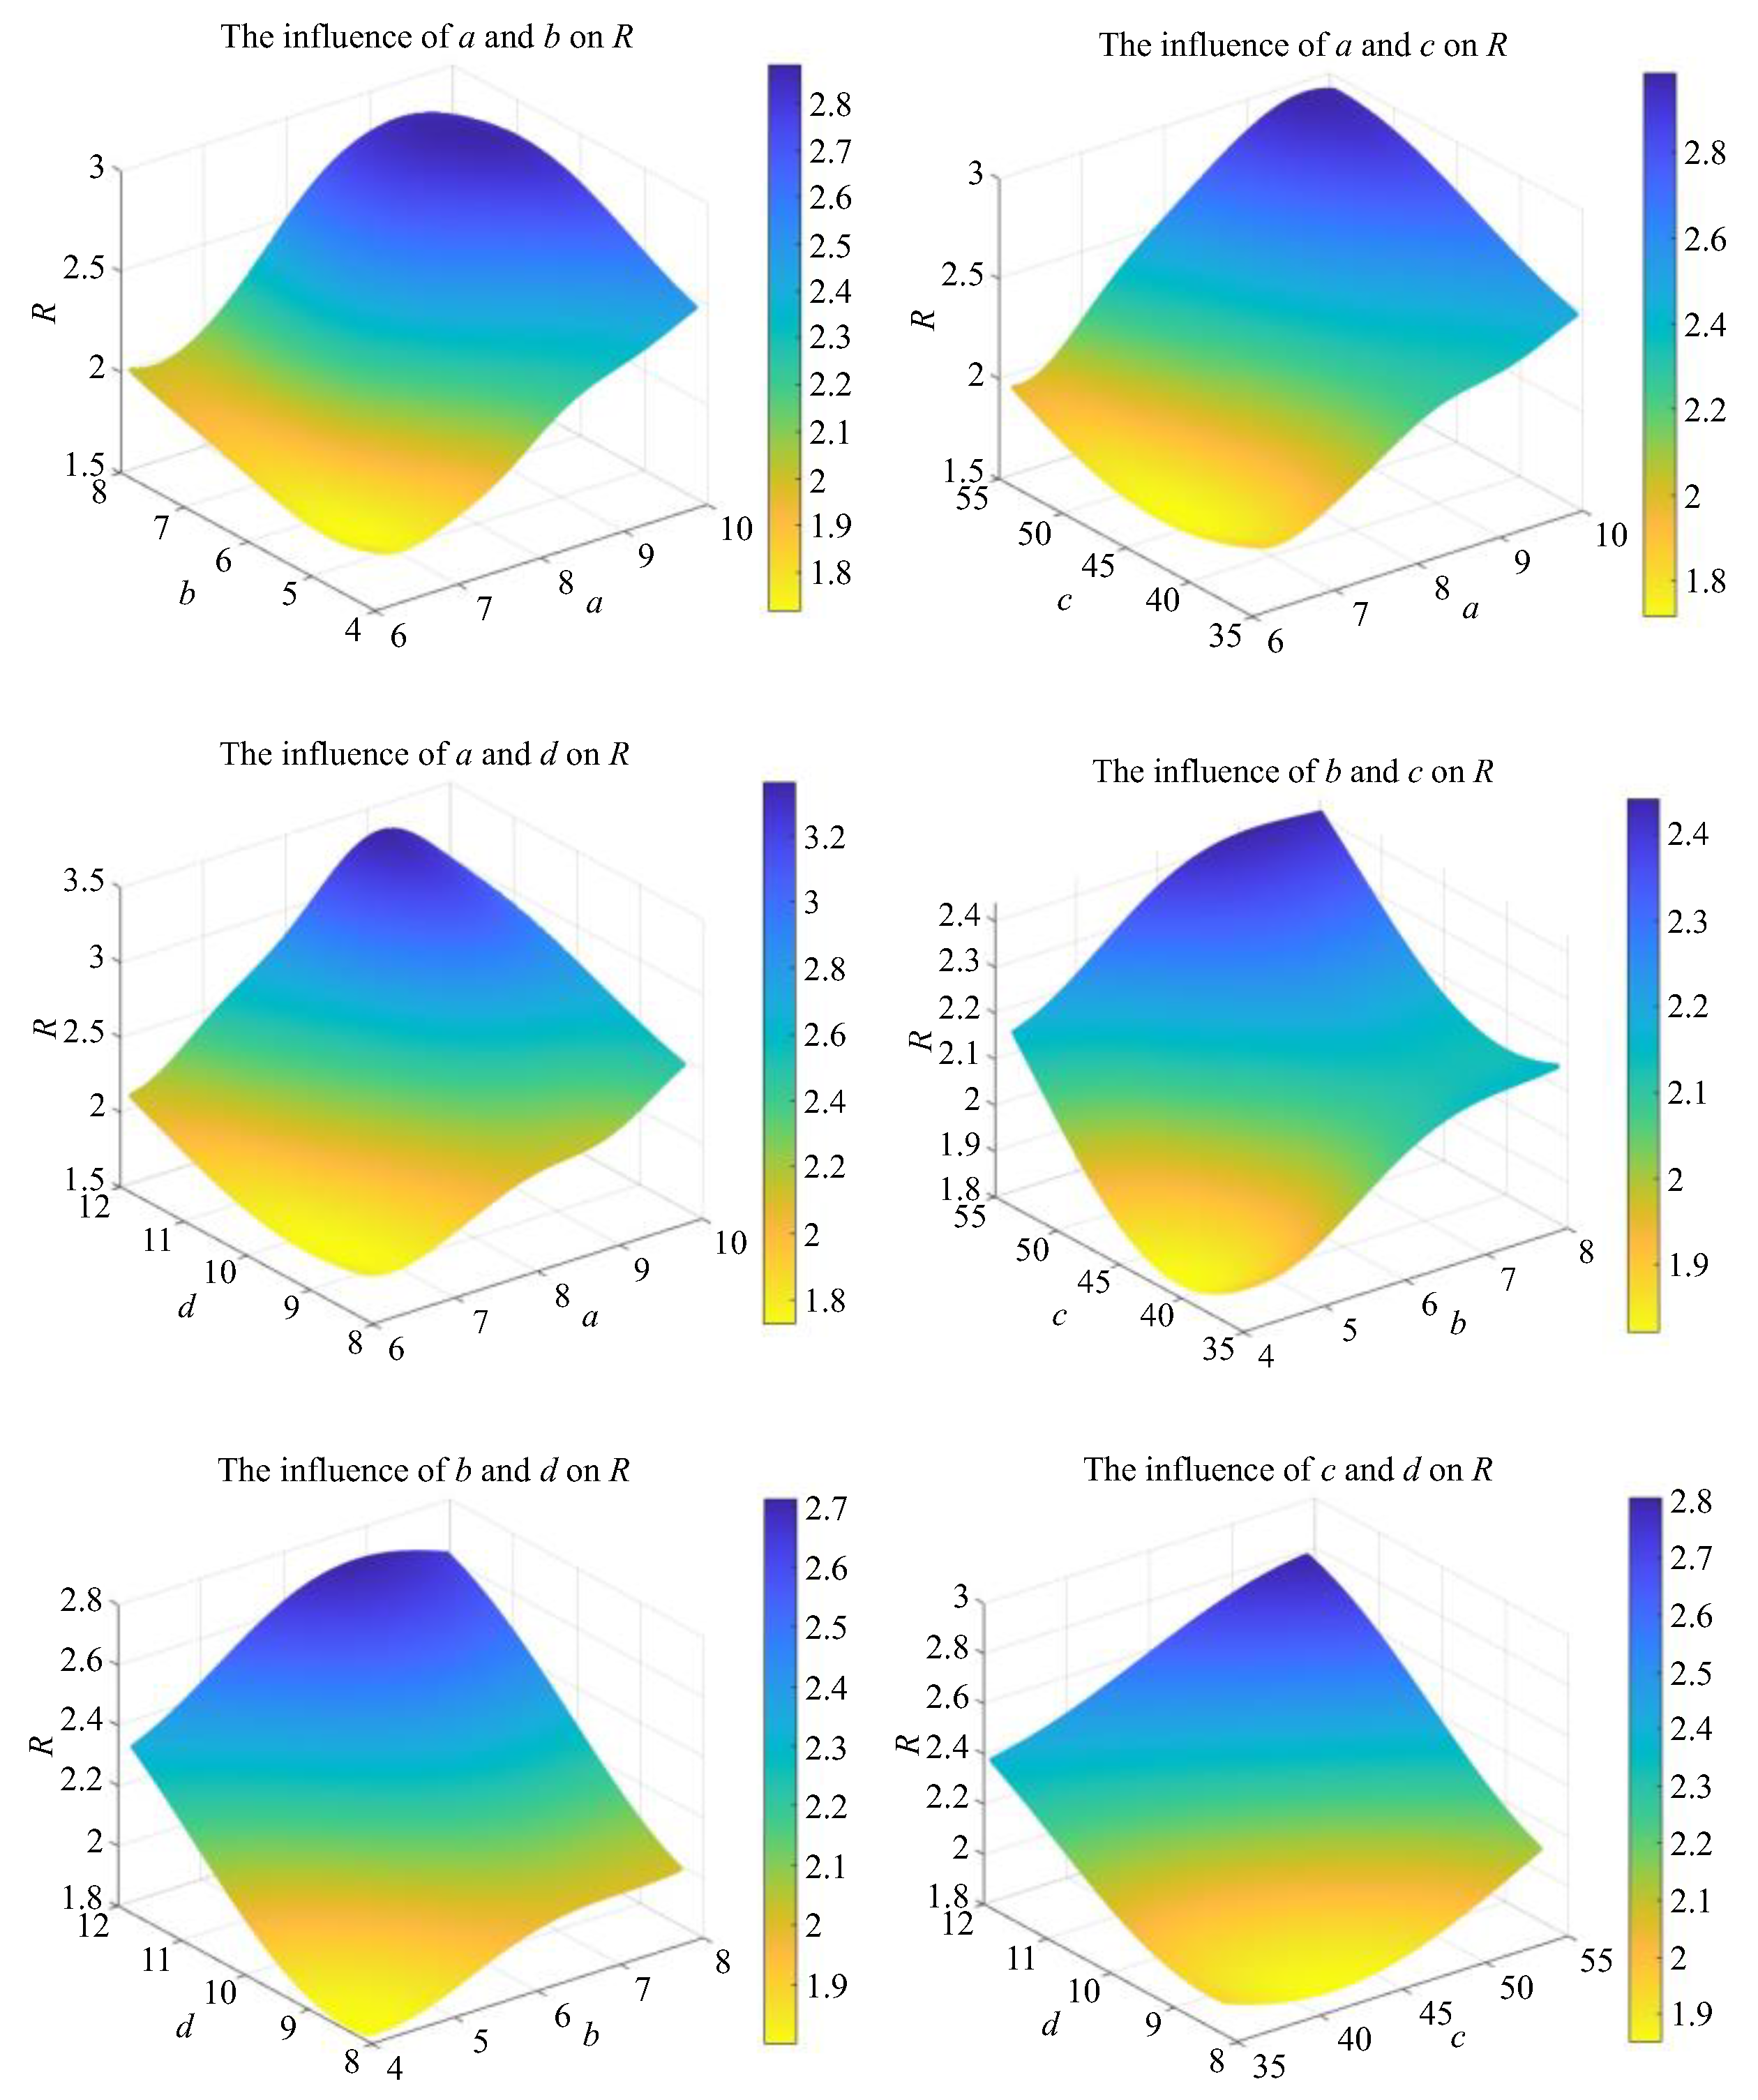
Based on the 25 sample points acquired from design parameter sampling, surrogate models and approximate functional relationships between optimization objectives and design parameters are established by adopting the quadratic polynomial response surface method and Kriging method. The quadratic polynomial response surface models are presented in Figure 11 and Figure 12, while the Kriging-based fitted response surface models are illustrated in Figure 13 and Figure 14. The functional expression of the quadratic response surface surrogate model is defined as follows:
Figure 11.
Quadratic polynomial response surface—m.
Figure 12.
Quadratic polynomial response surface—R.
Figure 13.
Response surface of Kriging method—m.
Figure 14.
Response surface of Kriging method—R.
The relationship between the mass m and the structural parameters is shown in Figure 11, and the relationship between the safety factor R and the structural parameters is shown in Figure 12.
The relationship between the structural parameters and the mass m and the safety factor R is obtained by establishing the Kriging surrogate model, as shown in Figure 13 and Figure 14.
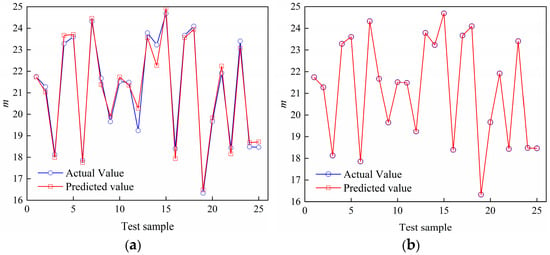
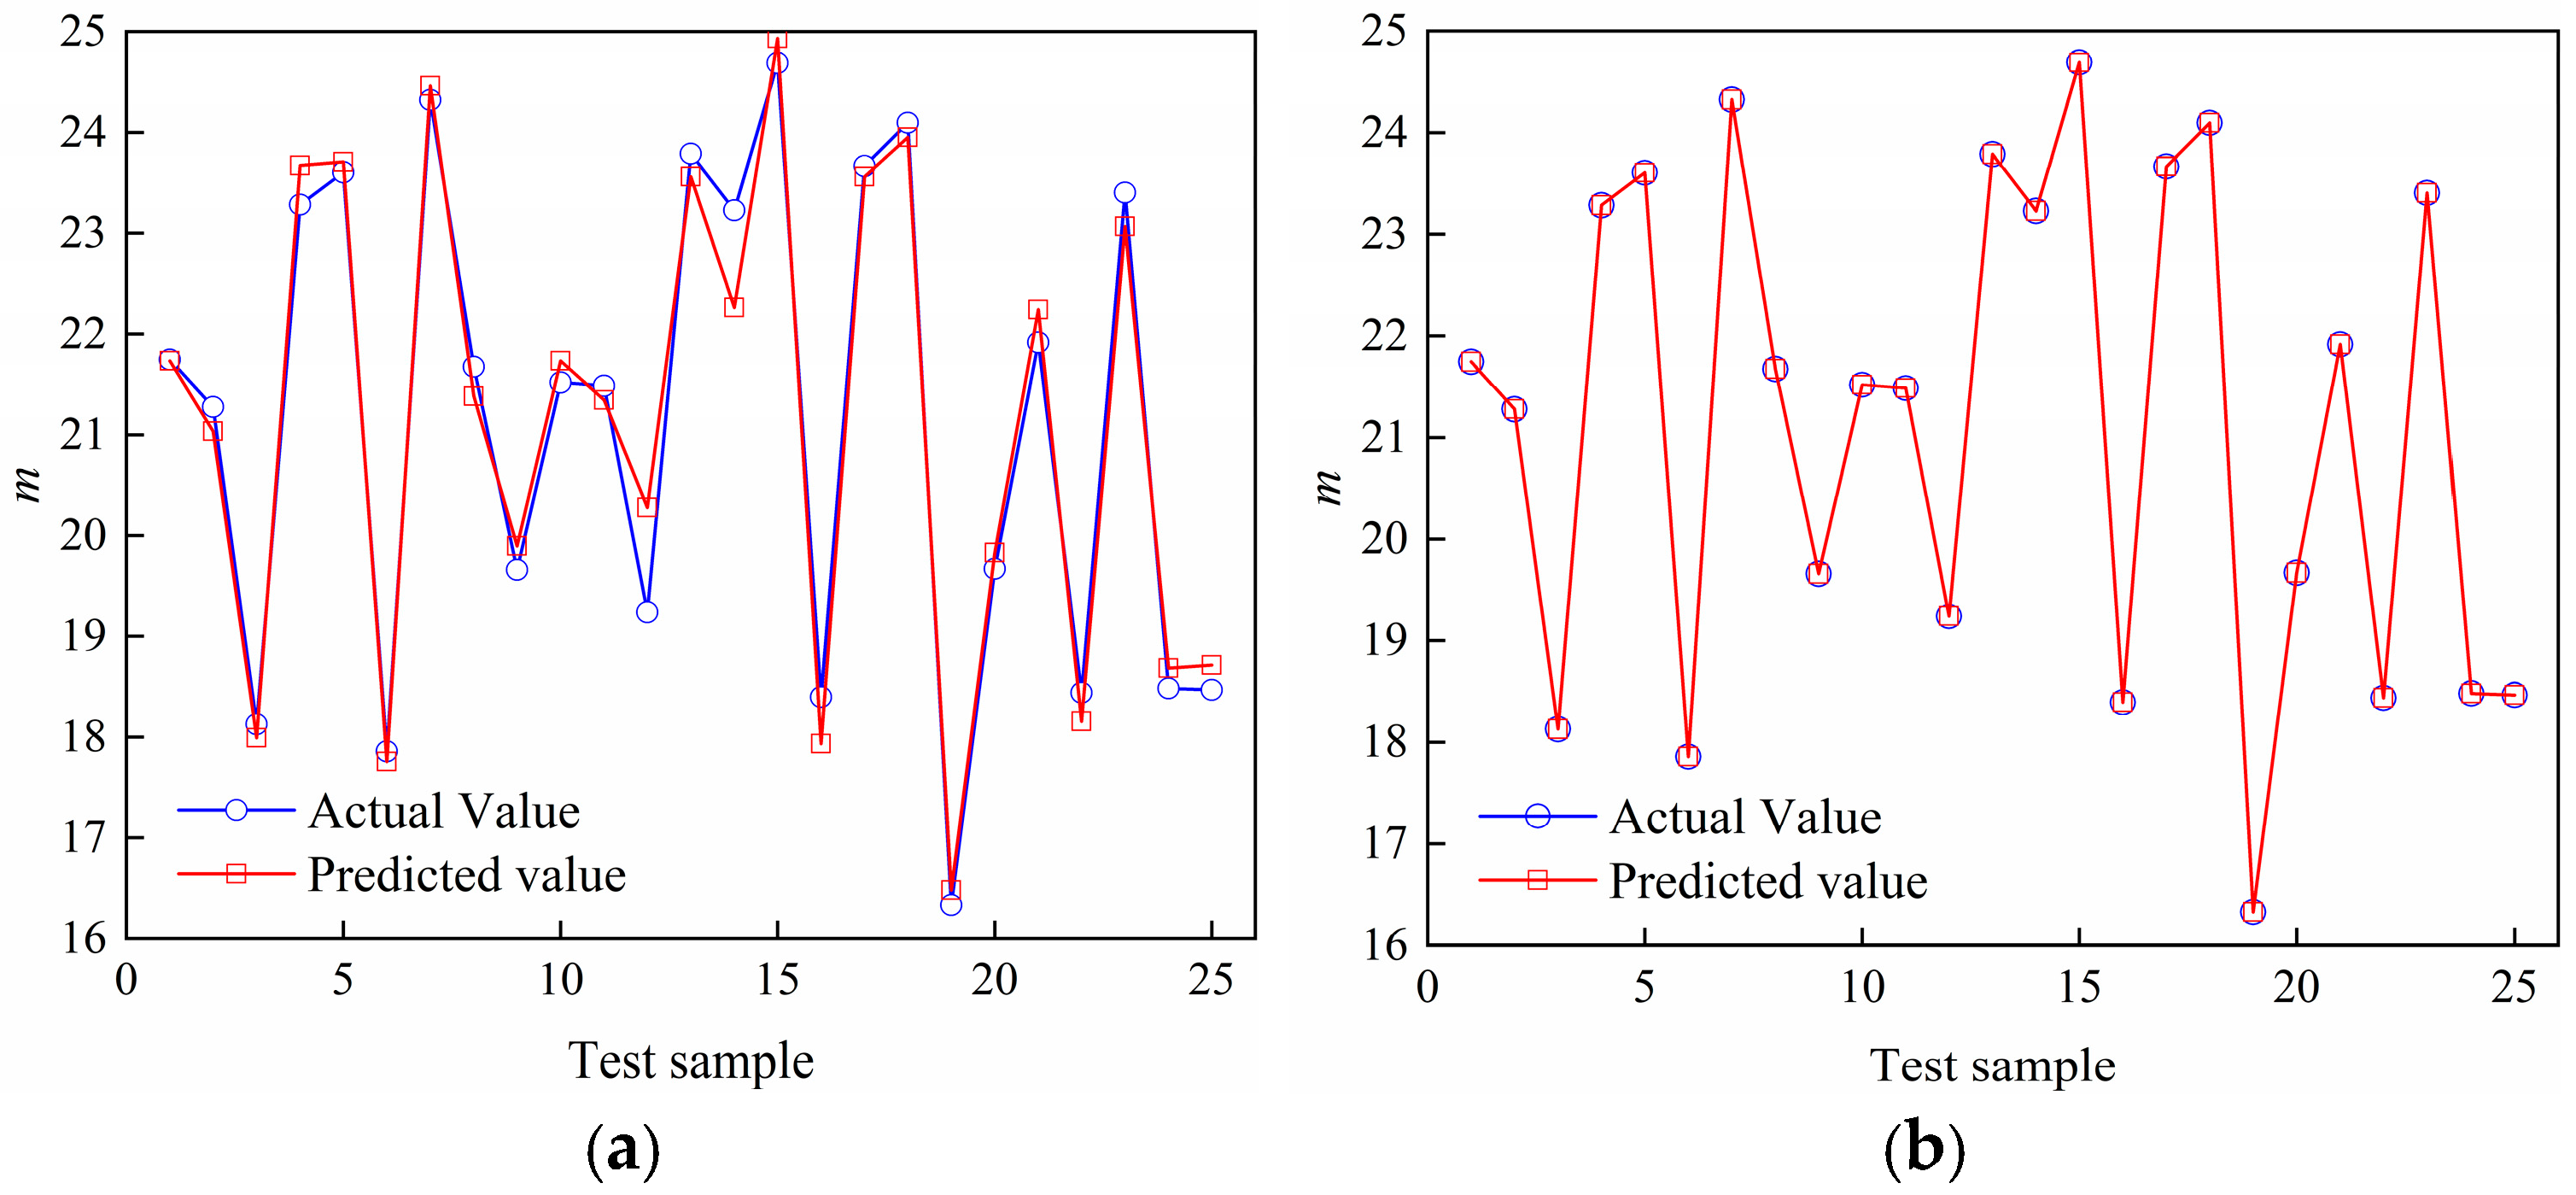
In order to evaluate the fitting accuracy of the surrogate model, the prediction accuracy of the mass m is used as a reference. The error results of the quadratic polynomial response surface and the Kriging method are shown in Figure 15.
Figure 15.
The error comparison between the actual value and the predicted value. (a) Quadratic polynomial response surface. (b) Kriging method prediction error diagram.
Table 4 presents the comparison of performance metrics between the Kriging method and the quadratic response-surface method. Root-mean-square error (RMSE) is introduced as a quantitative indicator to assess the prediction performance of the two surrogate-model approaches for mass response. For the quadratic polynomial response-surface model shown in Figure 15a, the RMSE between predicted values and actual finite-element results is 0.3626. For the Kriging surrogate-model in Figure 15b, the RMSE is 4.2036 × 10⁻¹⁴. Such an extremely low RMSE originates from the interpolation characteristic of the Kriging method: the Kriging model can exactly reproduce responses at training sample points, and the tiny residual value mainly comes from floating-point numerical computation error.
Table 4.
Comparison of metrics between Kriging and quadratic response surface method.
Combined with the visual comparison in Figure 15, the RMSE metric quantitatively demonstrates that the Kriging surrogate model achieves much higher prediction accuracy for the given sample dataset compared with the quadratic polynomial response-surface model. Consequently, the Kriging surrogate model is adopted for the subsequent multi-objective optimization calculation.
4.3. Optimization and Verification
It can be observed from Figure 11, Figure 12, Figure 13 and Figure 14 that the structural mass m and safety factor R of the levitation frame longitudinal beam exhibit significant nonlinear correlations with the cavity dimensional parameters a, b, c, and d. Moreover, the lightweight performance and structural safety factor of the longitudinal beam present a typical conflicting relationship, necessitating the acquisition of trade-off optimal solutions. In this study, the multi-objective genetic algorithm (MOGA) is adopted to determine optimization. Taking the mass and safety factor of the longitudinal beam as dual optimization objectives and the structural reliability as the constraint condition, the mathematical model of the multi-objective optimization problem is established as follows:
In the formula: Xi, Xf are the upper and lower limits of the independent variables, respectively; R is the bearing safety factor of the levitation frame longitudinal beam structure. In order to ensure the reliability of the structure, R ≥ 2.2 is taken.
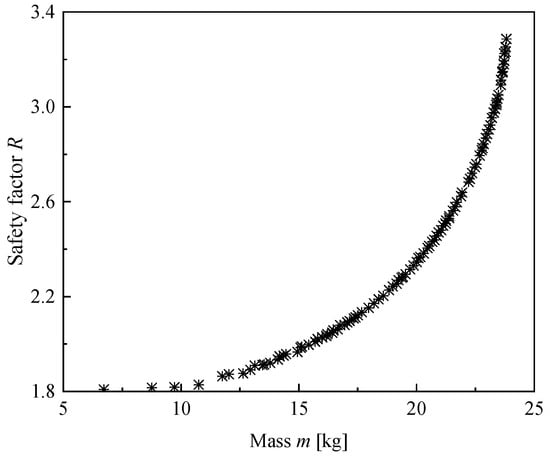
The MOGA is utilized to optimize the Kriging surrogate model owing to its superior fitting accuracy. The algorithm parameters are set as follows: a population size of 100, a maximum iteration number of 50, a minimum iteration number of 25. Binary tournament selection, simulated binary crossover (crossover probability = 0.7) and polynomial mutation (mutation rate = 0.1, μ = 0.02) are applied. Through iterative computation, the Pareto frontier for the structural optimization of the longitudinal beam is obtained, as visualized in Figure 16.
Figure 16.
Pareto frontier after multi-objective optimization.
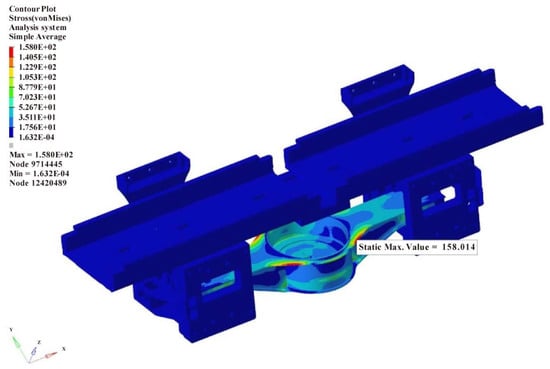
As illustrated in Figure 16, the Pareto frontier presents a uniform distribution, where each point corresponds to a feasible optimal solution. Combined with the constraint criteria in Equation (17), the optimal design set of structural mass m and dimensional parameters for the longitudinal beam is determined with a safety factor approaching the threshold of R = 2.2. A refined finite element model is established based on the selected optimal solution, and corresponding numerical simulation analysis is conducted. The structural bearing performance of the optimized longitudinal beam is investigated under the AT operating condition, and the corresponding Von Mises stress nephogram is displayed in Figure 17. The comparative parameters of the longitudinal beam before and after optimization are summarized in Table 5.
Figure 17.
Stress nephogram of optimized longitudinal beam structure.
Table 5.
Comparison before and after optimization.
As listed in Table 4, under the overload accelerated traction condition, the maximum stress of the optimized levitation frame longitudinal beam is 158.01 MPa, representing a 47.66% rise in maximum von Mises stress after lightweight modification. The corresponding structural safety factor R is 2.24, a reduction of 32.53%, which still satisfies the structural reliability requirements. In terms of lightweight performance, the mass of the single-side longitudinal beam is reduced by 5.6 kg, corresponding to a mass reduction rate of 23.53%, which translates to a total mass reduction of 11.2 kg for a single levitation module. The optimization results demonstrate that the proposed parameter configuration scheme effectively reduces the structural mass of the levitation frame longitudinal beam while guaranteeing structural safety, which achieves the dual design targets of structural reliability and lightweight optimization.
5. Conclusions
Medium- and low-speed maglev trains have gained increasing attention in the field of novel rail transportation due to their unique advantages, including contactless operation and low noise performance. To further improve the levitation performance of maglev train levitation frames under the constraint of limited electromagnetic levitation capacity, lightweight structural design has become a critical research focus. In this study, the levitation frame of a novel medium- and low-speed maglev train is taken as the research object. Combined with experimental testing and strength simulation verification, a multi-objective optimization algorithm is adopted to realize the lightweight design of the levitation frame longitudinal beam.
The main conclusions are summarized as follows:
- Based on field line tests and a fatigue strength evaluation system, both the structural strength reliability of the novel maglev levitation frame and the accuracy of the finite element model are fully verified, which provides a reliable foundation for the structural optimization of the longitudinal beam.
- Two surrogate models based on the quadratic polynomial response surface method and the Kriging method are established for the longitudinal beam structure. By comparing the fitting accuracy of the two models, the Kriging surrogate model presents superior predictive performance and is more suitable for the structural parameter optimization in this work.
- After optimization, the maximum stress of the longitudinal beam reaches 158.01 MPa, with a 47.66% increase in von Mises stress caused by material removal for lightweight purposes. Nevertheless, the stress still stays below the material allowable limit. The structural safety factor R is reduced by 32.53%, while still meeting the structural strength requirements. The mass of the unilateral longitudinal beam is reduced by 5.6 kg (23.53%), corresponding to a total mass reduction of 11.2 kg for a complete levitation frame. The optimized structure successfully achieves lightweight design while ensuring structural safety.
- The proposed strength verification scheme can be extended to the reliability and safety evaluation of other engineering structures. The combination of the Kriging surrogate model and multi-objective optimization algorithm provides an effective approach for obtaining improved and reasonable structural design solutions, which possesses good engineering application value.
Supplementary Materials
The following supporting information can be downloaded at: https://www.mdpi.com/article/10.3390/vehicles8110272/s1.
Author Contributions
Conceptualization, S.S. and H.L.; methodology, H.L.; software, X.C. (Xia Cao).; validation, H.L.; formal analysis, L.W.; investigation, C.H.; resources, C.H.; data curation, X.C. (Xicheng Chen).; writing—original draft preparation, L.W.; writing—review and editing, H.Z.; visualization, H.L.; supervision, H.Z.; project administration, S.S. All authors have read and agreed to the published version of the manuscript.
Funding
This research received no external funding.
Data Availability Statement
The original contributions presented in this study are included in the article/Supplementary Material. Further inquiries can be directed to the corresponding author.
Conflicts of Interest
The authors declare no conflict of interest.
Abbreviations
The following abbreviations are used in this manuscript:
| FEA | Finite Element Analysis |
| MKJ | Moore–Kommers–Jasper |
| AT | Accelerated Traction |
| MOGA | Multi-Objective Genetic Algorithm |
References
- Liu, X.J.; Gao, L.X.; Liu, L. Modeling and analysis of suspension frame of maglev train. J. Phys. Conf. Ser. 2020, 1650, 032196. [Google Scholar] [CrossRef] [Scilit]
- Xia, W.T.; Zeng, J.W.; Dou, F.S.; Long, Z.Q. Method of combining theoretical calculation with numerical simulation for analyzing effects of parameters on the maglev vehicle-bridge system. IEEE Trans. Veh. Technol. 2021, 70, 2250–2257. [Google Scholar] [CrossRef] [Scilit]
- Xu, F.; Luo, S.H.; Deng, Z.G. Study on key technologies and whole speed range application of maglev rail transport. J. China Railw. Soc. 2019, 41, 40–49. [Google Scholar]
- Han, S.W.; Woo, K.J. Evaluation of dynamic fatigue life for maglev bogie frame. J. Korean Soc. Railw. 2010, 13, 1–8. [Google Scholar]
- Wu, Y.K.; Liu, F.; Zhang, B.; Yang, X.P.; Wu, C.L. Fatigue life analysis of levitation chassis of long stator maglev vehicle. Mod. Manuf. Eng. 2016, 8, 54–59. [Google Scholar] [CrossRef]
- Kim, K.J.; Lee, J.M.; Lee, N.J.; Yang, S.J. Prediction of dynamic loads on the aluminum bogie of a maglev vehicle using flexible multibody dynamics. In Proceedings of the Conference of the Korean Society for Railway, Seoul, Republic of Korea, 11–13 May 2009; pp. 2773–2778. [Google Scholar]
- Li, C.; Yao, Y.J.; Yu, D.L.; Yuan, Y.Q.; Sun, S.G. Study on load characteristics of maglev train suspension frame based on dynamics simulation analysis. J. Beijing Jiaotong Univ. 2021, 45, 118–125. [Google Scholar]
- Cao, H. Study on Load Characteristics and Structural Strength of Small Constant Conductivity Maglev Vehicles; Southwest Jiaotong University: Chengdu, China, 2023. [Google Scholar]
- EN 13749:2021+A1:2023; Railway Applications—Wheelsets and Bogies—Method of Specifying the Structural Requirements of Bogie Frames. European Committee for Standardization (CEN): Brussels, Belgium, 2023.
- Chen, C.J.; Su, E. Analysis of dynamic stress characteristics of suspension frame of medium and low-speed maglev train. J. Phys. Conf. Ser. 2025, 2964, 012027. [Google Scholar] [CrossRef] [Scilit]
- Li, M.; Ma, Y.Q.; Wang, Y.; Luo, S.H.; Ma, W.H.; Lei, C. Strength evaluation of levitation frame for medium and low speed maglev train based on full-scale bench test. J. Traffic Transp. Eng. 2023, 23, 206–215. [Google Scholar]
- Han, J.W.; Kim, J.D.; Huh, Y.C. Load test method of vehicle body and bogie frame for urban maglev vehicle. Proc. KSR Conf. Korean Soc. Railw. 2011, 924–930. Available online: https://koreascience.kr/article/CFKO201132164225633.page (accessed on 3 September 2026).
- Han, J.W.; Kim, J.D.; Song, S.Y. Fatigue strength evaluation of a bogie frame for urban maglev train with fatigue test on full-scale test rig. Eng. Fail. Anal. 2013, 31, 412–420. [Google Scholar] [CrossRef] [Scilit]
- Wang, Y.; Gao, H.L. Simulation analysis and online monitoring of suspension frame of maglev train. Machines 2023, 11, 607. [Google Scholar] [CrossRef] [Scilit]
- Zhang, M.L.; Liu, L.R.; Shen, Y.J.; Cui, K. Study on the vibration characteristics of suspension frame system for maglev train under track irregularity harmonic excitation. IEEE Trans. Appl. Supercond. 2025, 35, 1–9. [Google Scholar] [CrossRef] [Scilit]
- Pham, T.T.; Tran, M.Q.; Do, T.T.; Ngo, V.D.; Vu, V.T. Evaluation of the influence of structural parameters on the characteristics of anti-roll bars in trucks by using finite element method. J. Appl. Eng. Sci. 2025, 23, 280–290. [Google Scholar] [CrossRef] [Scilit]
- Wang, K.R.; Luo, S.H.; Ma, W.H.; Chen, X.H. Dynamic characteristics analysis for a new-type maglev vehicle. Adv. Mech. Eng. 2017, 9, 1687814017745415. [Google Scholar] [CrossRef] [Scilit]
- Fu, Z.Q.; Wang, Y.X.; Ji, B.H.; Liu, T.J. Assessment approach for multiaxial fatigue damage of deck and U-rib weld in steel bridge decks. Constr. Build. Mater. 2018, 189, 276–285. [Google Scholar] [CrossRef] [Scilit]
- Zhang, M.Y.; Zhang, K.L. Research on the weld fatigue strength of frame based on multi-axis theory. J. Mech. Strength 2022, 44, 225–231. [Google Scholar] [CrossRef]
- DVS (German Welding Society). Design and Endurance Strength Assessment of Welded Joints with Steels in Rail Vehicle Construction: DVS 1612; DVS (German Welding Society): Düsseldorf, Germany, 2009. [Google Scholar]
- Yin, H.; Zhang, K.L.; Wang, H.M. Development of fatigue assessment system of frame structure based on multi-axis theory. Mach. Build. Autom. 2021, 50, 70–75. [Google Scholar] [CrossRef]
- UIC (International Union of Railways). Motive Power Units—Bogie and Running Gear—Bogie Frame Structure Strength Tests: UIC 615-4; International Union of Railways: Paris, France, 2011. [Google Scholar]
- Qin, X.P.; Wang, Y.L.; Lu, C.H.; Huang, S.; Zheng, H.; Shen, C.R. Structural acoustics analysis and optimization of an enclosed box-damped structure based on response surface methodology. Mater. Des. 2016, 103, 236–243. [Google Scholar] [CrossRef] [Scilit]
- Du, D.H.; He, E.M.; Li, F.; Huang, D.Q. Using the hierarchical Kriging model to optimize the structural dynamics of rocket engines. Aerosp. Sci. Technol. 2020, 107, 106248. [Google Scholar] [CrossRef] [Scilit]
- Lee, U.K. A new adaptive Kriging-based optimization (AKBO) framework for constrained optimization problems: A case study on shared autonomous electric vehicle system design. Expert Syst. Appl. 2024, 252, 124147. [Google Scholar] [CrossRef] [Scilit]
- Muti, S.Y.; Arıkoğlu, A. Multi-objective optimization of a turbopump turbine disk using NSGA-II and CAD-free geometric modeling. Struct. Multidiscip. Optim. 2025, 68, 239. [Google Scholar] [CrossRef] [Scilit]

Disclaimer/Publisher’s Note: The statements, opinions and data contained in all publications are solely those of the individual author(s) and contributor(s) and not of MDPI and/or the editor(s). MDPI and/or the editor(s) disclaim responsibility for any injury to people or property resulting from any ideas, methods, instructions or products referred to in the content. |
© 2026 by the authors. Licensee MDPI, Basel, Switzerland. This article is an open access article distributed under the terms and conditions of the Creative Commons Attribution (CC BY) license.