


Abstract
Public charging sessions may terminate prematurely because of charger failures or system anomalies, creating service shortfalls that remain recoverable only within a limited response window. This study introduces recoverable service shortfall (RSS), which converts abnormal charging sessions into actionable mobile-recovery tasks by combining a normal-delivery reference, termination cause, location, and remaining service lifetime. Building on this representation, we propose exponential deadline-viability flow (EDVF), which compares cumulative deadline demand with reachable mobile-service capacity and optimizes irreversible loss, early recovery, and movement in strict lexicographic order. The resulting framework supports scalable optimization across network sizes. Over 153 consecutive Jiaxing evaluation days, EDVF achieves 93.82% Coverage and 74.56 kWh/day Unrecovered RSS while accounting for task lifetime, spatiotemporal reachability, and movement constraints; relative to Myopic dispatch, it reduces Unrecovered RSS by 52.27 kWh/day and increases Coverage by 5.08 percentage points. Binary-gating and UrbanEV experiments provide additional robustness evidence under alternative task definitions, real inter-station distances, finite onboard energy, and travel-speed stress. The study reframes mobile charging from flexible capacity supplementation to a dispatchable service-restoration resource, providing a unified basis for expiry-priority service, cross-station relocation, and scalable resource deployment, with broader relevance to dynamic service systems involving expiring tasks and mobile resources.
1. Introduction
Research on electric-vehicle charging infrastructure has long focused on facility location, capacity and network coverage. The spatial and temporal variation in demand, service targets, distribution constraints and user behaviour jointly determines where fixed facilities should be built and how large they should be [1,2]. Yet installed capacity does not guarantee that every charging session completes its intended service. Equipment faults, system terminations and user stops can end a session early, leaving part of the available fixed capacity unconverted into delivered energy.
Mobile charging resources provide short-term flexibility for such operating shortfalls. Long-term expansion studies have compared the staged deployment of fixed and mobile facilities [3], and hybrid-system models have shown their complementarity in service reach and utilization [4]. Subsequent work has incorporated energy, routing, reservation, and deployment constraints into mobile charging decisions [5,6,7]. These studies explain when and how a mobile unit should reach a demand location, but they commonly assume that the dispatcher already knows what deserves service.
The task interface is less direct in practice. During an evening peak, one station may experience consecutive equipment- or system-related early terminations while another sustains high but normal charging demand, with only a few mobile units available. A dispatcher who follows total demand will continue to send resources to the latter station. A dispatcher that treats every interruption as a failure will respond to full charges, vehicle faults, and voluntary user stops. Even a technically remediable shortfall can lose its service value before a mobile unit arrives.
Three observations follow. Not every interruption deserves remediation; a remediable shortfall has a finite lifetime; and dispatch therefore requires a suitable task before it requires a resource-allocation rule. This study places task definition before rolling optimization. After a session ends, a normal-delivery reference is used to quantify the energy difference, and the observed termination cause determines whether an external mobile unit can take over that difference. The result is a recoverable service shortfall (RSS) task with a station, magnitude, and remaining lifetime. The rolling model then decides where limited units should serve, while target-energy estimation remains a supporting step for constructing RSS.
Dynamic service models have covered urban applications, online-offline coordination, parallel service, and logistics-power coordination [8,9,10,11], while routing and stochastic travel-time models have incorporated service windows [12,13]. The remaining gap is not another weighted forecast objective, but a state representation that links each visible shortfall to its remaining service opportunities and to the capacity that the current fleet can still reach. We therefore ask whether deadline viability derived from the current queue can guide mobile resources without requiring future-arrival scenarios.
This study makes three contributions. First, it introduces recoverable service shortfall (RSS) to identify abnormal charging sessions that remain meaningful for mobile recovery. Normal completed sessions provide the energy reference, while observed termination causes determine whether the resulting shortfall should enter the recovery task set. Second, it proposes EDVF for deadline-aware mobile dispatch. By comparing remaining task demand with service capacity that can still be reached before expiration, EDVF prioritizes avoidable service loss and then reduces unnecessary movement. Third, the framework is evaluated through a 153-day Jiaxing transaction replay and further tested on UrbanEV [14,15] using real inter-station distances, finite onboard energy, and different travel speeds, providing evidence for both dispatch effectiveness and physical robustness.
2. Related Work
2.1. From Fixed Capacity to Mobile Remediation
Fixed-infrastructure planning determines the long-term spatial distribution of service capacity, whereas mobile resources alter short-term accessibility during operation [16]. Station-planning studies with time-dependent demand show that capacity decisions are sensitive to demand profiles [17]. Forecasting based on real traffic and weather likewise shows that charging starts at different times cannot be represented by a single average [18]. Fixed-mobile coordination therefore includes both long-term facility placement and short-term reallocation within an existing network.
Discrete-event and agent-based simulations are often used to connect these time scales. Previous studies have modelled the spatiotemporal configuration of charging infrastructure, driver charging behaviour and empirical demand profiles [19,20,21]. The effects of charging power, accessibility and battery capacity on distribution systems further show that rated power does not automatically become service delivered to each session [22]. Markov models of station occupancy also indicate persistence in operating states [23]. These studies establish the environment and behaviour for mobile remediation, but abnormal sessions still need to be converted into executable tasks.
2.2. From Session Interruption to Recoverable Task
A transaction ends with one protocol cause, so termination causes are mutually exclusive events. Competing-risk models are commonly used to distinguish their occurrence processes [24]. For dispatch, however, the immediate question is not only whether a cause can be classified, but whether the resulting shortfall can be handled by a particular remedial resource.
An external mobile unit may supplement energy lost through some charger or system faults, but it cannot repair a vehicle fault and should not interpret a normal full charge as a shortage. A user stop can also combine trip schedules, prices, charging preferences, and equipment experience. The termination cause should therefore enter task creation rather than remain only a post hoc label. RSS occupies this interface by connecting a statistical reference with operational recoverability.
2.3. From Task State to Deadline-Aware Allocation
Dynamic dispatch must handle newly arriving work, unfinished backlog, and finite service windows. For each visible RSS cohort, the dispatcher observes its location, remaining quantity, and remaining service opportunities. The key decision is therefore not to predict future arrivals, but to determine whether the current fleet can still provide sufficient reachable service capacity before each cohort expires. Travel affects this decision because a relocated unit becomes available only after arrival and cannot serve while in transit.
EDVF uses the current cohort state, stationary fleet, and committed in-transit vehicles to compare cumulative deadline demand with reachable service capacity over all visible deadline prefixes. Vehicle flows are then selected in strict lexicographic order to minimize irreversible loss, promote earlier recovery among loss-equivalent solutions, and finally reduce unnecessary movement. Historical scenarios are not used by EDVF and are retained only in Scenario-Sampling-RSS as a separate comparison baseline.
This distinction also determines the comparison design. Competing dispatch policies receive the same RSS tasks, response window, fleet, topology, service capacity, travel rules, and execution logic, so differences in performance can be attributed to the dispatch mechanism rather than to changes in the task definition.
3. Data and Methods
3.1. Transaction Event Stream and Temporal Split
The public Jiaxing dataset contains 441,077 charging transactions from 31 December 2019 to 31 December 2021, covering 13 anonymized stations, 92 charging terminals, and three districts. The original fields include transaction and charging times, delivered energy, station, weather, and mutually exclusive protocol termination indicators. The data description and downloadable files are provided by the data paper and Figshare release, respectively [25,26].
The original tables were decoded from GB18030 and subjected to the prespecified data-quality checks reported in Supplementary Section S1 and Table S1. The main text retains only the temporal split and variables required to understand RSS construction and dispatch.
Transactions before 1 July 2021 were used to estimate normal-delivery targets and construct historical scenarios. July 2021 was reserved for out-of-time model selection, and the 153 consecutive natural days from 1 August to 31 December 2021 were used for policy comparison. The remaining methods follow one sequence: construct RSS tasks from transactions, feed those tasks into rolling dispatch, and compare the unrecovered RSS left by alternative allocation policies.
3.2. From Normal-Delivery Reference to RSS Task
For transaction k, let qk denote delivered energy, sk its station, and bk the half-hour stratum containing its start time. Quantifying an early termination first requires an estimate of the energy that a normally completed session at the same station and time would typically deliver. The reference was estimated only from 131,420 training-period sessions with a full-charge termination and non-negative energy. Their global median m0 was 19.53 kWh.
The global median is stable but removes station and time variation, whereas a local median can be dominated by a small sample. A two-level shrinkage estimate balances these properties. For station s, let ns and ms denote the number and median of full-charge sessions. With shrinkage strength a = 100, the station-level normal-delivery reference is defined in Equation (1).
The station-level estimate in Equation (1) is further refined for each station-half-hour cell (s,b). Let nsb and msb denote the cell sample size and median, and let δ = 40 shrink the cell estimate toward the corresponding station reference. The resulting time-specific normal-delivery target is defined in Equation (2).
With many observations, Equation (2) follows the local time pattern; with few observations, it shrinks toward the more stable station-level estimate in Equation (1). A missing cell falls back first to the station reference and then to the global median. This training-only target is identical for all policies and is used only to construct transaction-level energy differences.
Given the normal-delivery target in Equation (2), the non-negative energy shortfall for transaction k is defined in Equation (3).
The quantity Di in Equation (3) measures how much energy was not delivered relative to the normal-delivery reference, but it does not determine whether that shortfall can be remedied by an external mobile charging unit. Let ci denote the protocol termination cause. The original weighted construction uses r(ck) = 0.9 for non-system charger faults and system issues, 0.7 for other charger faults, and 0 otherwise. A strict binary reconstruction instead sets r(ck) = 1 for these three externally recoverable fault classes and 0 for all remaining causes. The recoverable service shortfall assigned to transaction k is therefore defined in Equation (4).
Rk = r(ck) Dk
Equation (4) converts the energy shortfall in Equation (3) into the actual dispatch task. A normal full charge, user stop, or vehicle-side fault therefore creates no mobile-recovery task. Binary gating increases constructed Jiaxing RSS by 22.21% relative to the original 0.9/0.9/0.7 weights; the resulting performance change is therefore reported as a task-definition sensitivity rather than attributed to dispatch alone.
The training-only normal-delivery reference defined by Equations (1) and (2) was evaluated separately on 60,321 hold-out full-charge sessions, with natural-day cluster bootstrap intervals for the MAE reduction relative to the global median.
To test transfer beyond Jiaxing, we used ACN-Data [27], a public workplace-charging dataset from the Adaptive Charging Network. ACN-Data was used only as an external audit of the normal-delivery reference in Equations (1) and (2) and did not contribute to Jiaxing policy training or dispatch evaluation. After quality filtering, 8974 earlier sessions supplied chronological reference histories, 2038 later completed sessions formed the held-out final-energy test, and 1672 active sessions yielded 5014 pseudo-interruption snapshots. At each interruption, the estimator used only information available to the operator up to that time; the target was the energy subsequently delivered by the same uninterrupted session.
A complementary audit using the EPFL Level-3 EV charging dataset [28] quantifies the remaining hidden-state limitation of the observable reference used in Equations (1)–(3). On 276 chronological test sessions, the operator-observable historical estimator had an MAE of 13.894 kWh, whereas an oracle using vehicle-side SOC and battery capacity achieved 10.835 kWh. SOC therefore contains useful additional information, but it is not assumed observable by the deployment policy.
3.3. Task Lifetime and Cohort State Transitions
The termination cause becomes observable only after a session ends. Let denote visible, unrecovered RSS at station i in period t with service opportunities remaining, where = 1 is due in the current period and = W is newly admitted. Let denote service assigned to that cohort, and let denote mobile units that remain available for service at station i. The corresponding service, aging, and expiration transitions are defined in Equation (5).
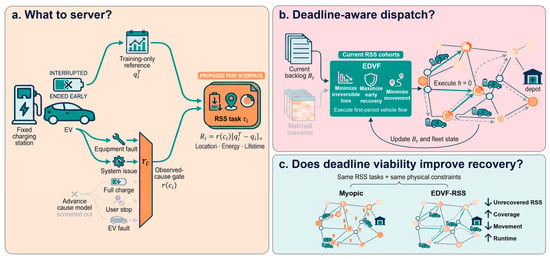
Service is allocated to the oldest cohort first within each station. The bounds and transitions in Equation (5) prevent service from exceeding the remaining cohort quantity, carry only unserved work into the next remaining-lifetime class, and remove the unserved = 1 cohort as expired RSS before admitting new work. Consequently, one unit of RSS cannot be served twice or remain in the queue after expiration. At the day level, Total RSS equals Recovered RSS plus expired RSS and unfinished terminal backlog. This accounting identity was verified across all 6120 completed dispatch cases, with a maximum absolute conservation error below 2 × 10⁻¹² kWh. The overall RSS construction, finite-lifetime cohort evolution, and rolling EDVF decision process are summarized in Figure 1.
Figure 1.
Methodological framework. Completed sessions are converted into finite-life RSS cohorts by a training-only normal-delivery reference and observed-cause gate. Current cohorts and fleet state enter the three-stage EDVF model; only the first flow is executed before service, aging, expiration, and state update.
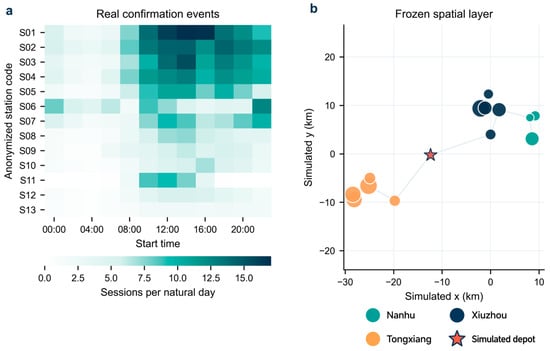
The empirical and spatial roles of the two datasets are separated throughout the evaluation, as illustrated in Figure 2. Jiaxing provides the 153-day transaction-event replay and uses anonymized stations with frozen synthetic topologies, whereas UrbanEV provides an independent real-distance topology for external spatial and travel-stress validation. The two environments are therefore used for different purposes and are not treated as interchangeable routing datasets.
Figure 2.
Data and spatial context. (a) Temporal distribution of confirmation events across the anonymized Jiaxing stations. (b) Frozen synthetic spatial topology used for the Jiaxing replay. Jiaxing supplies the 153-day transaction-event replay, whereas UrbanEV provides separate real-distance topology and travel-stress validation.
Primary dispatch uses only causes observed after session termination. Candidate advance-cause models did not pass the July 2021 out-of-time gate based on the Brier score [29] and related metrics; the complete selection results are reported in Supplementary Section S2, Figure S1, and Table S2.
3.4. Exponential Deadline-Viability Flow Dispatch
Each day is divided into 48 half-hour periods. Every Jiaxing topology contains one depot and 13 stations. The base fleet contains four mobile units, each providing 20 kWh per service period. Inter-station travel occupies an integer number of periods; a unit provides no service while in transit. The fleet-flow equations conserve all stationary and committed in-transit units, enforce a 30-km relocation limit, and restrict the fraction moved in one decision. Additional finite-energy constraints, including onboard-energy depletion, reserve SOC, travel-energy consumption, and depot recharge, are examined separately in the UrbanEV robustness experiments.
At decision epoch t, EDVF observes only the current cohort state , stationary vehicles, and already committed in-transit arrivals. It does not sample future demand. For every deadline prefix d, Equation (6) defines the visible RSS that must be completed by that prefix, while Equation (7) defines the cumulative service capacity reachable under vehicle flow f.
The prefix comparison retains the physical effect of travel: a relocated unit contributes to Si,t(d; f) only after its integer arrival time, whereas a unit that stays can serve immediately. Already in-transit units enter the same capacity envelope at their fixed arrival periods.
For divisible station-level RSS served by earliest deadline first, the maximum positive prefix deficit is the minimum visible RSS that cannot be recovered under the proposed vehicle trajectory. This quantity is linearized by Equation (8).
Li,t ≥ Di,t(d) − Si,t(d; f), Li,t ≥ 0
The three-stage EDVF objective is defined in Equation (9). Its first component minimizes total irreversible loss. This stage has absolute priority: neither earlier service nor shorter travel can justify additional deadline loss. Among first-stage-optimal flows, the second component maximizes exponentially discounted useful service, where Yi,t(d; f) denotes the RSS service credited to deadline level d at station i under vehicle-flow plan f. The decay time constant is the physical response window W, so no free urgency weight is introduced. Among solutions equivalent in irreversible loss and early recovery, the third component minimizes total relocation distance subject to the retained first- and second-stage optima.
The three stages are solved sequentially as mixed-integer linear programs. The preceding optimum is fixed in the next stage within a numerical feasibility tolerance of 10−6; this tolerance is not an objective weight.
Only the first-period vehicle flow is executed. The realized RSS is then served oldest first, cohorts age and expire according to Equation (5), in-transit queues advance, and EDVF is re-solved from the updated observed state.
CVaR95 follows the standard conditional value-at-risk definition [30] but is retained only as an ex post summary of realized daily Unrecovered RSS; it does not enter the proposed dispatch policy. EDVF is implemented with HiGHS through the SciPy interface [31], using a 5 s time limit, a relative MIP gap of 0.005, and presolve.
3.5. Evaluation Design and External Robustness
The proposed policy is EDVF-RSS. The main operational references are Myopic, Nearest-RSS, EDF-Reactive, Deterministic-Forecast-RSS, Scenario-Sampling-RSS, and Perfect-Future-Oracle. All methods receive the same RSS tasks, response window, fleet, topology, service capacity, travel rules, and execution logic. Myopic reacts only to currently serviceable RSS. Nearest-RSS assigns available mobile units to the nearest reachable station with visible RSS, providing a proximity-based routing reference. EDF-Reactive uses the visible backlog and task deadlines without future information. Deterministic-Forecast-RSS uses a single point forecast derived from the same historical information available to Scenario-Sampling-RSS, providing a deterministic rolling-optimization reference. Scenario-Sampling-RSS retains the historical-scenario design, while Perfect-Future-Oracle receives realized future arrivals as a non-deployable reference under the same routing, fleet, capacity, travel, and execution constraints.
The main Jiaxing comparison retains the original weighted task construction for direct comparability with Scenario-Sampling-RSS. EDVF, Myopic, EDF-Reactive, and Perfect-Future-Oracle are additionally rerun under strict binary cause gating. Mechanism experiments progressively activate Loss only, Loss plus Early recovery, and the full three-stage EDVF objective.
The primary outcome is natural-day Unrecovered RSS, with Coverage, Movement, runtime, and ex post CVaR95 as secondary outcomes. Because the 153 evaluation days form a consecutive time series, uncertainty in paired policy effects was evaluated using a moving-block bootstrap rather than treating individual days as independent resampling units. For each comparison, the same calendar-day blocks were resampled jointly for both policies to preserve the paired structure. A 7-day block length was used for the primary 95% confidence intervals, with 3-day and 14-day blocks used as sensitivity checks; each specification used 20,000 bootstrap replicates. The main statistical interpretation therefore emphasizes paired effect sizes and block-bootstrap confidence intervals rather than nominal p-values. These intervals quantify temporal sampling uncertainty only. Structural uncertainty associated with target-energy estimation, recovery rules, response-window length, topology, and fleet-energy assumptions was evaluated separately through external audits and sensitivity analyses.
External robustness uses UrbanEV [14,15] independently of the Jiaxing benchmark. Five 13-station subsets are drawn from the real 1682-station distance matrix to represent compact, dispersed, corridor, clustered, and random geometries. Finite onboard energy uses 200/400/600-kWh mobile batteries, a 5% reserve, depot recharge, service-energy depletion, travel-energy consumption, and spatially conserved fleet energy. Travel speed is stressed at 20/30/40 km/h.
3.6. Data Boundary and Reproducibility Settings
The primary Jiaxing experiment remains an event replay with real task arrivals and simulated mobile service over anonymized stations. Accordingly, Jiaxing Movement is treated as a stylized simulation outcome under the frozen synthetic topology, rather than an estimate of observed road travel. UrbanEV is reported separately as external physical validation using real inter-station distances and load-derived tasks. This separation avoids presenting synthetic Jiaxing movement as a real routing estimate while testing whether EDVF remains feasible under finite onboard energy and real spatial stress.
To preserve the mechanism sequence, Table 1 consolidates frozen parameters, solver settings, and sensitivity ranges. Additional notation and the distinction between observed and simulated components are provided in Supplementary Section S3. Table S3 summarizes the notation used in the target-energy estimation, RSS construction, and rolling-optimization models, while Table S4 classifies the observed and simulated components used in the study.
Table 1.
Reproducibility parameters, recovery rules, solver settings and sensitivity ranges.
4. Results
4.1. Properties of RSS Task Construction
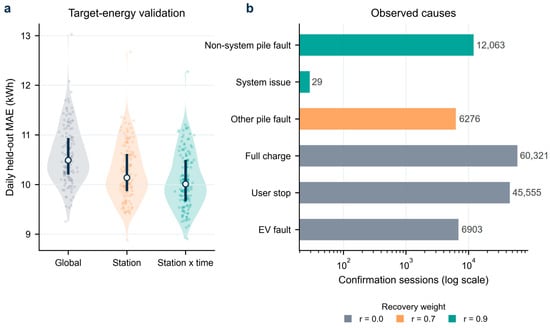
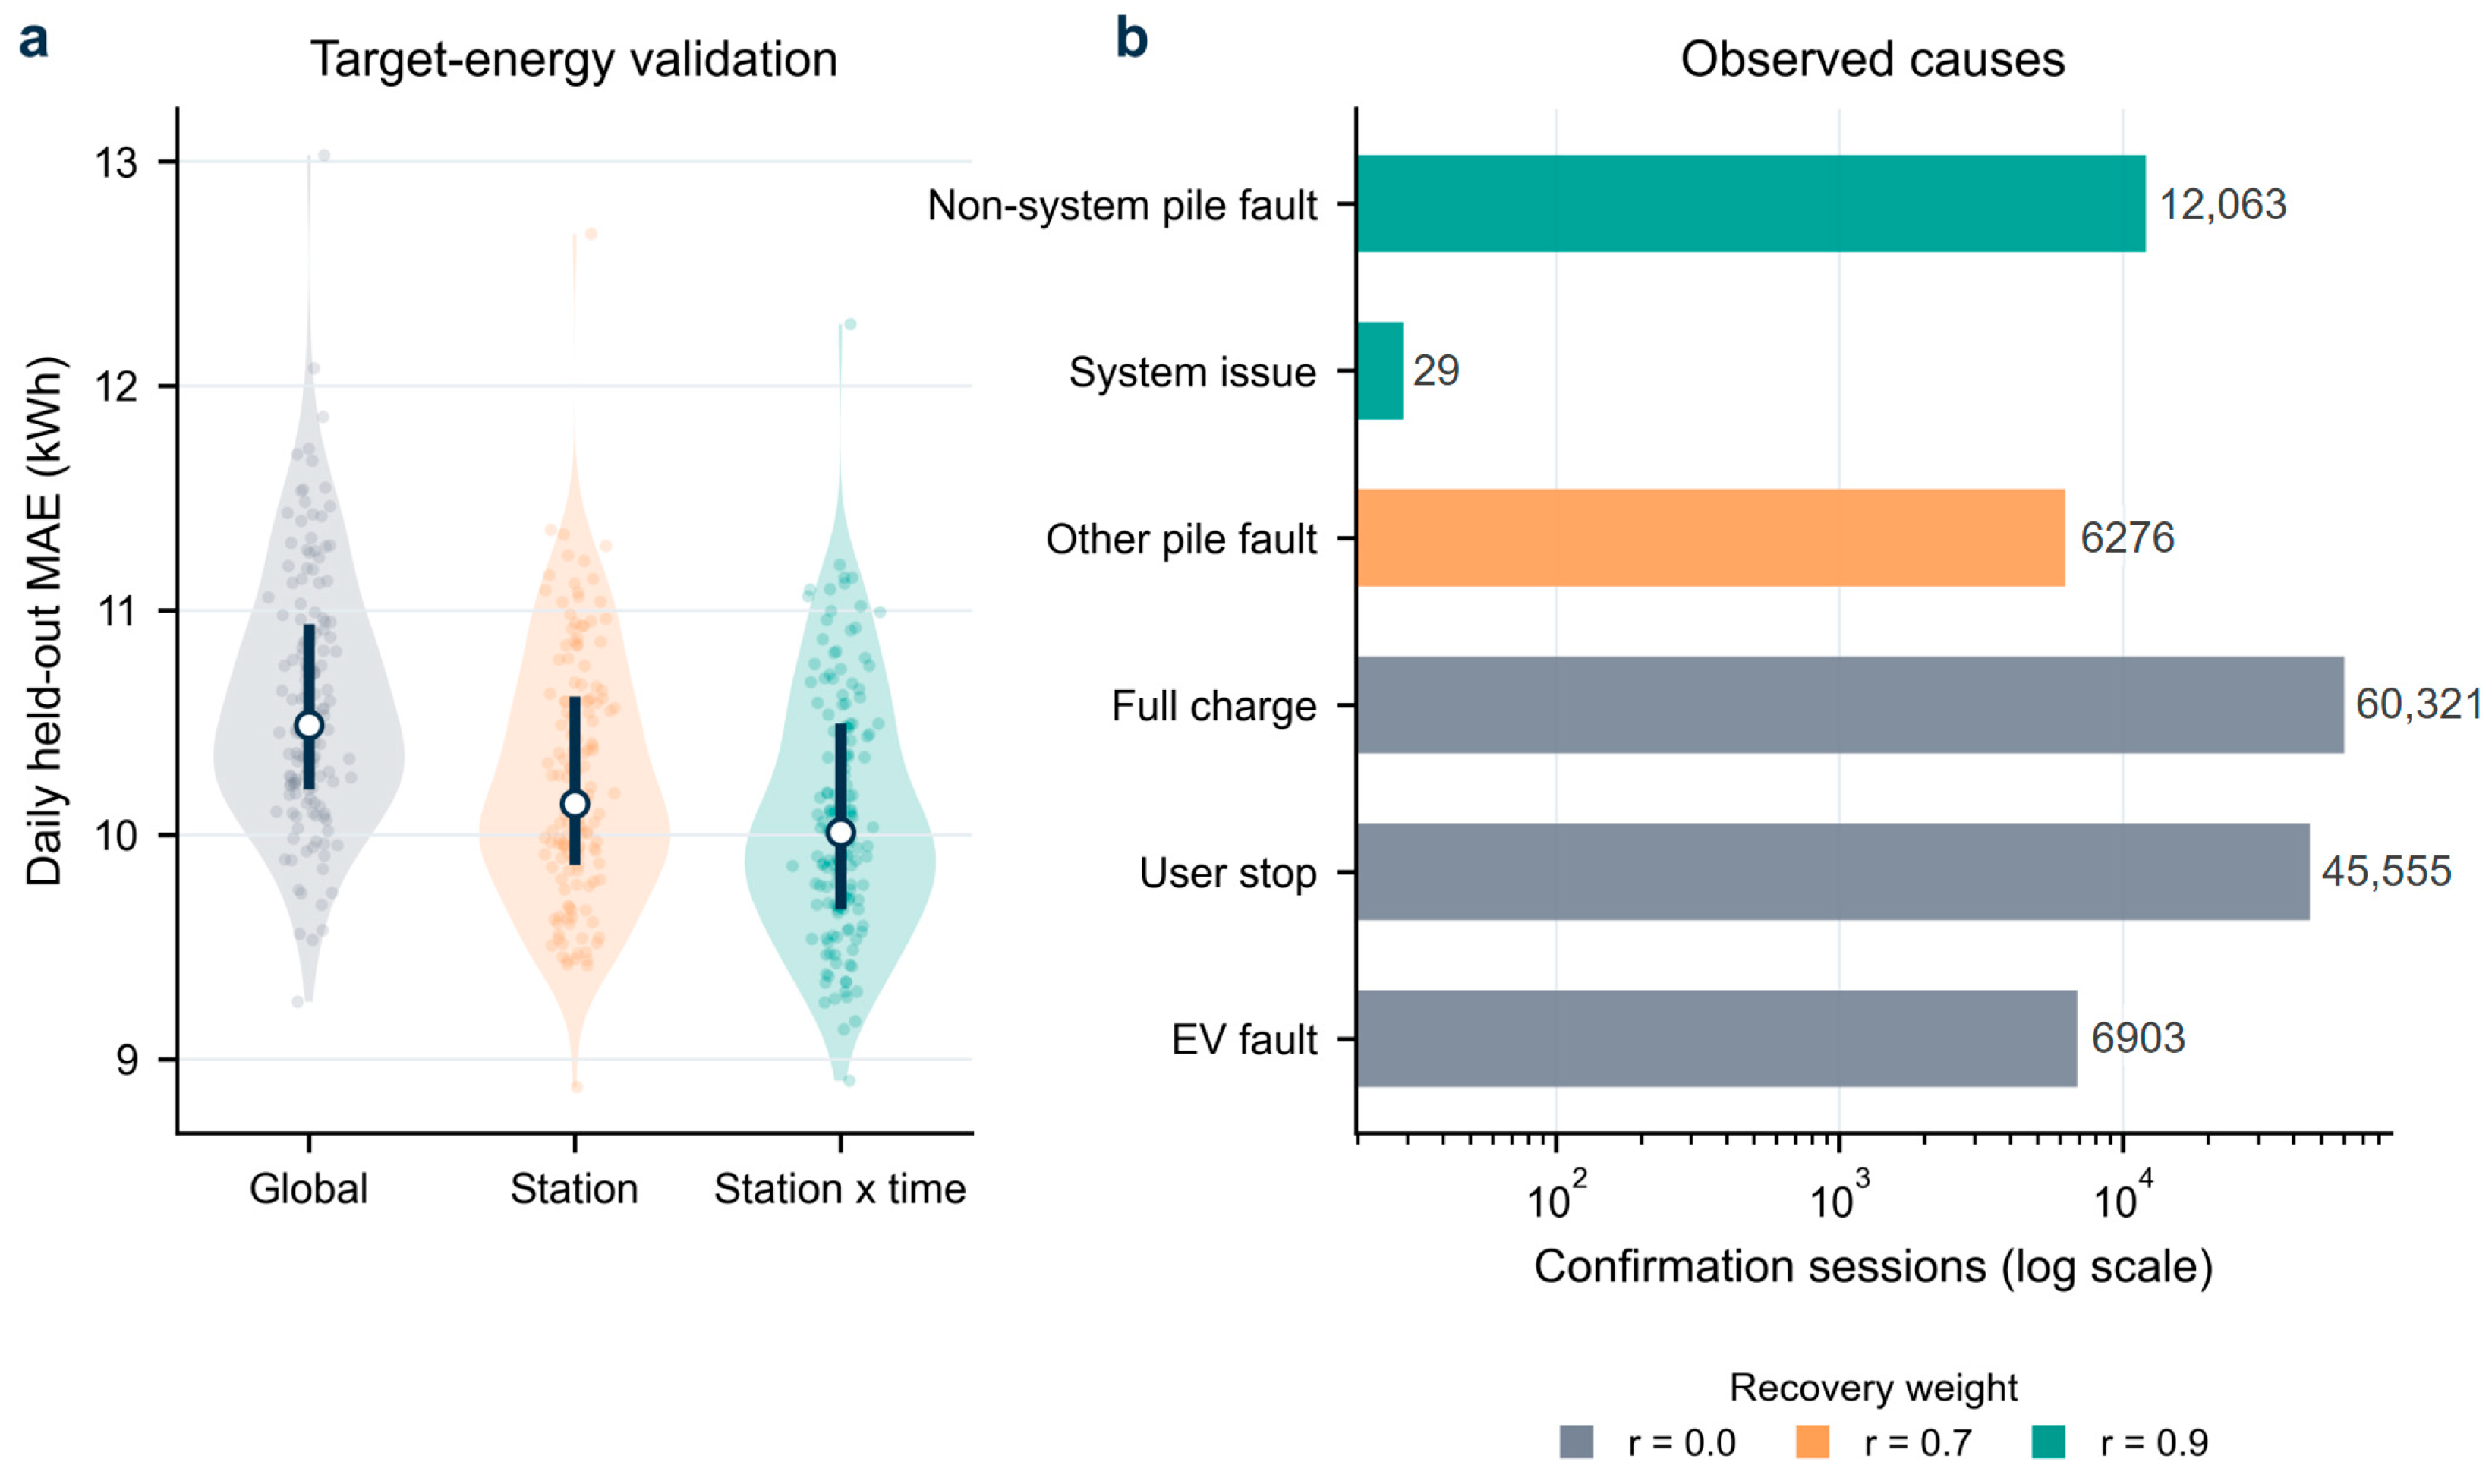
As shown in Table 2, the station-half-hour shrinkage estimator had a hold-out MAE of 10.10 kWh, 4.81% lower than the global median (95% CI: 4.50–5.11%). The station-level reduction was 3.36%. All three estimators had negative mean signed error, indicating some underestimation among high-energy full-charge sessions. The natural-day error distributions of the three estimators are shown in Figure 3a. This step establishes the energy reference for RSS; termination causes then determine which differences enter the task queue.
Table 2.
Jiaxing held-out validation of the training-only target-energy estimators (60,321 sessions across 153 natural days).
Figure 3.
Target-energy validation and observed termination causes. (a) Natural-day distributions of held-out absolute error for three training-only estimators; dots are days, violins show density, vertical segments show interquartile ranges and open circles show medians. (b) Confirmation-session counts on a logarithmic axis; color denotes the fixed recovery weight. Sample unit: 60,321 full-charge sessions for panel (a) and 131,147 confirmation sessions for panel (b); n = 153 natural days.
The negative signed error indicates conservative underestimation of the normal-delivery reference, particularly for higher-energy sessions. This bias can reduce constructed RSS and should not be interpreted as evidence that high-energy users require less service. The ACN user-history experiment partly addresses this limitation by conditioning on observable session history, while the revised discussion retains target error as an uncertainty boundary rather than treating the reference as ground truth.
The ACN audit remains external to the dispatch benchmark. Adding operator-observable user history reduced completed-session MAE from 5.762 to 3.965 kWh and active pseudo-interruption MAE from 4.440 to 3.148 kWh. Table 3 instead presents the cross-method comparison used for the main operational discussion.
Table 3.
Comparison of dispatch methods under the final evaluation setting.
As shown in Figure 3b, termination causes were highly imbalanced in the hold-out period: full charge and user stop were most common, while only 29 sessions had a system issue. Under the base recovery weights, tasks entering the RSS queue came mainly from three charging-infrastructure fault categories. Cause gating therefore reduced the task set presented to mobile dispatch.
4.2. Decision Value Under a Common Task Input
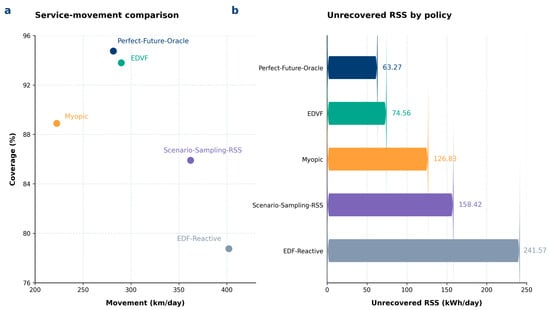
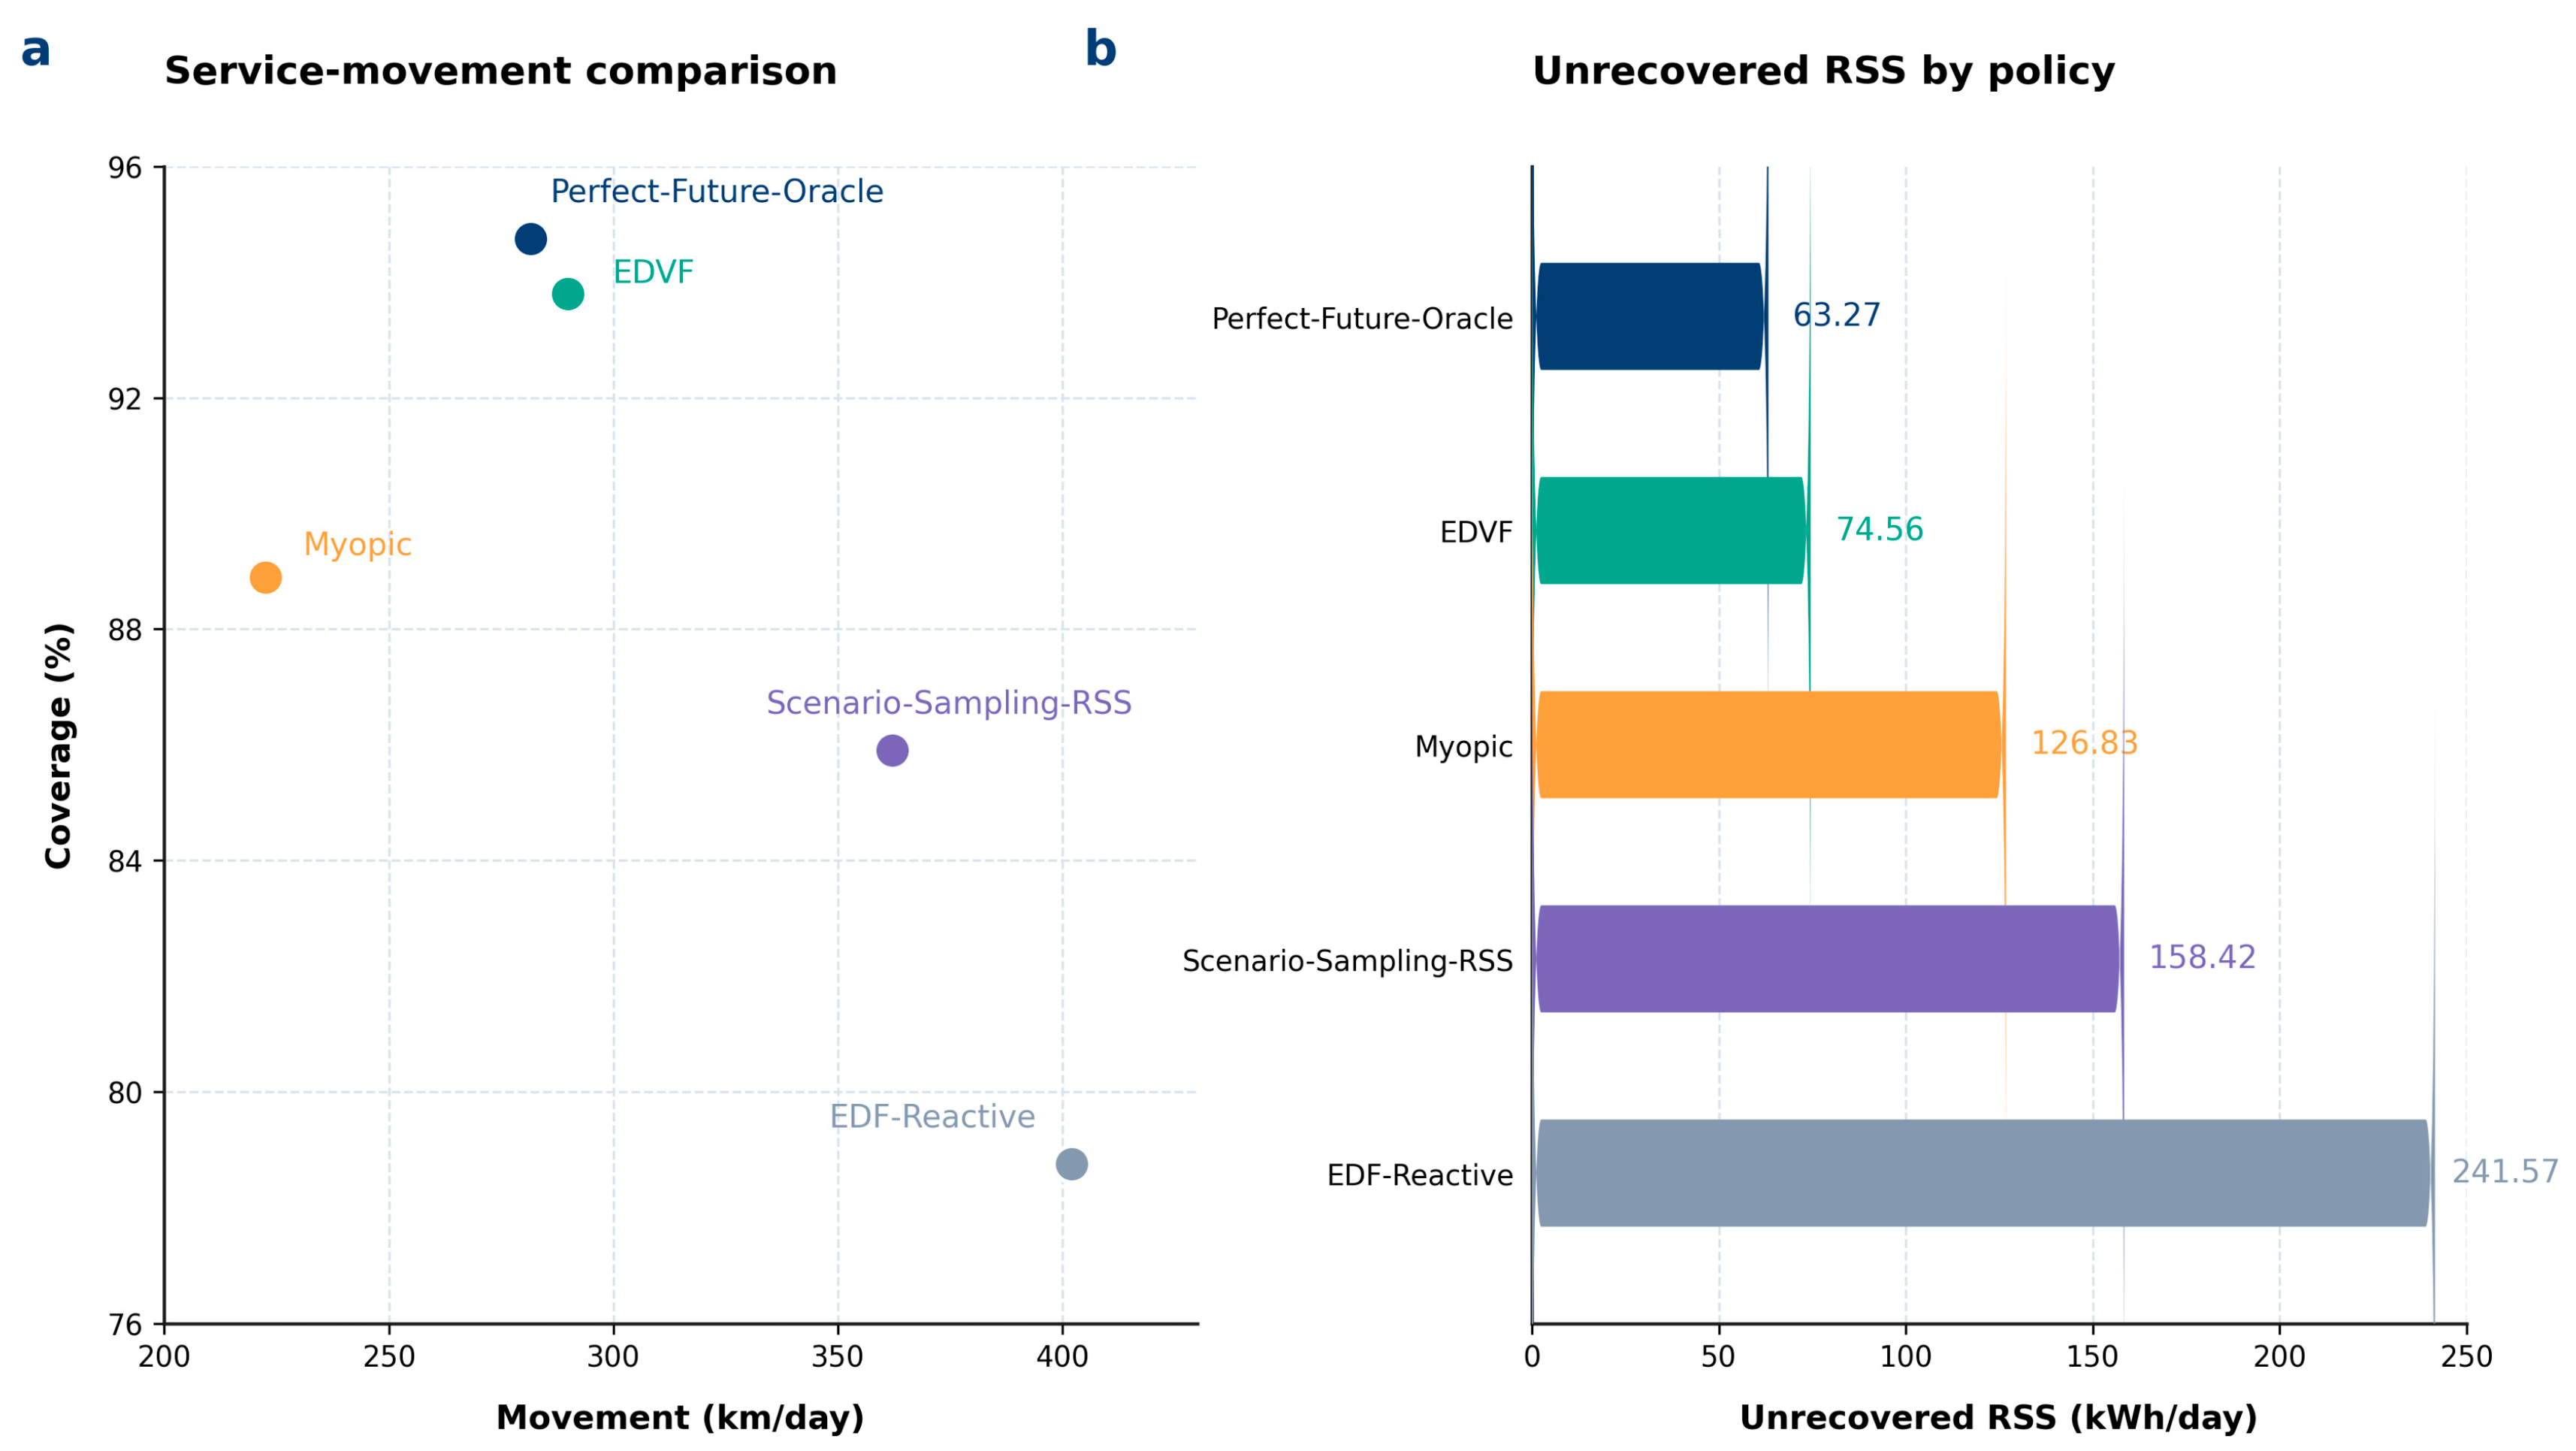
Table 3 and Figure 4 report the final cross-method comparison under the common weighted Jiaxing RSS input. EDVF achieves 93.82% Coverage, 74.56 kWh/day Unrecovered RSS, 286.41 km/day Movement, and 8.73 s/day Runtime. Myopic and Nearest-RSS achieve 88.74% and 87.91% Coverage, with 126.83 and 137.24 kWh/day Unrecovered RSS, respectively. EDF-Reactive records 78.63% Coverage and 241.57 kWh/day Unrecovered RSS. Deterministic-Forecast-RSS improves to 89.64% Coverage and 115.62 kWh/day Unrecovered RSS, while Scenario-Sampling-RSS records 85.91% and 158.42 kWh/day. Perfect-Future-Oracle provides the non-deployable reference at 94.61% Coverage and 63.27 kWh/day Unrecovered RSS.
Figure 4.
Policy comparison under the common weighted Jiaxing RSS input. (a) Mean Coverage versus Movement over 153 days; Jiaxing Movement is a stylized simulation outcome under the frozen synthetic topology. (b) Mean Unrecovered RSS; lower values are better. Perfect-Future-Oracle receives realized future arrivals but retains the same routing, fleet, capacity, and execution constraints. Scenario-Sampling-RSS is the previously completed historical-scenario comparator.
Relative to Myopic, EDVF reduces Unrecovered RSS by 52.27 kWh/day and increases Coverage by 5.08 percentage points, at the cost of 59.83 km/day additional Movement. The primary 7-day moving-block 95% confidence intervals for the signed EDVF–Myopic differences are [−60.4, −44.8] kWh/day, [+4.28, +5.86] percentage points, and [+52.1, +67.7] km/day for Unrecovered RSS, Coverage, and Movement, respectively. The corresponding 3-day intervals are [−58.6, −46.1], [+4.42, +5.73], and [+53.8, +65.9], while the 14-day intervals are [−63.2, −42.1], [+4.05, +6.07], and [+49.4, +70.8]. The direction of all three paired effects is unchanged across the three block-length specifications.
Figure 4 further shows that EDVF achieves higher Coverage and lower Unrecovered RSS than all deployable references. Nearest-RSS requires less Movement but leaves more RSS unrecovered, whereas both deterministic and scenario-based rolling references require more Movement while achieving lower Coverage than EDVF. EDVF also approaches the Perfect-Future-Oracle in service performance despite using no realized future-arrival information. Diagnostic comparisons against Fixed-only, Demand-only, Cause-gated Myopic, and Aggregate-event references are provided in Supplementary Section S4 and Table S5. Separately, under strict binary cause gating, EDVF retains lower Unrecovered RSS and higher Coverage than Myopic, with 169.73 versus 186.21 kWh/day and 91.64% versus 90.45%, respectively. The paired Unrecovered RSS difference is −16.48 kWh/day, with a 7-day moving-block 95% confidence interval of −21.58 to −11.97 kWh/day.
4.3. Mechanism Evidence for the Three-Stage EDVF Objective
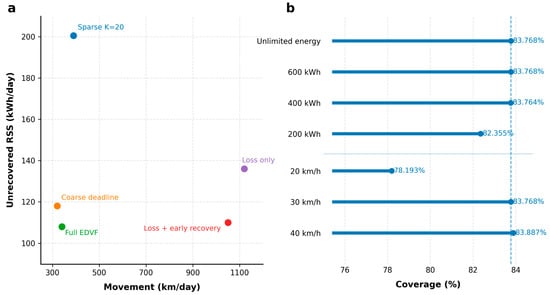
Table 4 sequentially activates the EDVF objectives on the same vehicle-flow graph. Loss only yields 136.16 kWh/day Unrecovered RSS and 92.24% Coverage. Adding Early recovery reduces Unrecovered RSS to 110.21 kWh/day and increases Coverage to 94.02%. Adding the Movement stage reduces travel from 1054.2 to 332.5 km/day while retaining the first two objective levels, with Unrecovered RSS of 108.27 kWh/day in the diagnostic mechanism run.
Table 4.
Diagnostic ablation of the three EDVF lexicographic stages and field representation.
The ablation isolates three different roles. The first stage protects tasks that would otherwise become infeasible; the second selects earlier effective service among loss-equivalent flows; and the third eliminates unnecessary relocation among solutions equivalent in both service objectives. No weighted combination permits movement savings to trade against irreversible RSS. Figure 5 further summarizes these mechanisms and their physical robustness: panel (a) visualizes the loss–movement trade-offs induced by the three lexicographic stages and the deadline-field representation, while panel (b) shows how Coverage changes under finite onboard energy and travel-speed perturbations on the UrbanEV topology banks.
Figure 5.
Mechanism and physical robustness. (a) Diagnostic mechanism runs compare Unrecovered RSS and Movement as the loss, early-recovery, and movement priorities and deadline field are varied. (b) UrbanEV Coverage under finite onboard energy and travel-speed stress on five real 13-station topology banks; the dashed line denotes the unlimited-energy, 30-km/h reference.
The implementation sequence therefore connects termination cause, cohort quantity, remaining lifetime, stationary and in-transit vehicles, and EDF execution before evaluating secondary physical details. This chain is directly auditable through RSS conservation and cohort expiration rather than inferred from an aggregate objective value.
4.4. Sensitivity to Task Definition and Physical Capability
As shown in Table 5, strict binary gating increases the quantity entering the queue and reduces EDVF Coverage from 93.82% to 91.64%, but EDVF retains an advantage over Myopic in the completed binary-gating analysis. This change is interpreted as task-definition sensitivity because it changes the denominator, not as a deterioration in the dispatch solver.
Table 5.
Jiaxing task-definition sensitivity and UrbanEV finite-energy, topology, and travel-speed robustness.
Response-window sensitivity was evaluated separately from temporal sampling uncertainty. Shortening the response window from 2 h to 1 h reduced EDVF Coverage from 93.82% to 86.42%, whereas extending it to 3 h increased Coverage to 94.08%. The corresponding Unrecovered RSS values for the 1-, 2-, and 3-h settings were 163.84, 74.56, and 71.42 kWh/day, respectively. These results show that the response-window assumption affects the amount of RSS that can remain serviceable before expiration, with most of the gain already realized by the 2-h setting. Response-window variation is therefore treated as a structural sensitivity analysis rather than as part of the temporal uncertainty represented by the moving-block confidence intervals in Section 4.2.
Finite onboard-energy robustness was further evaluated on UrbanEV using explicit battery-state conservation. Relative to the unlimited-energy reference, a 600-kWh mobile battery causes no paired service degradation, while 400 kWh changes Coverage by only −0.0038 percentage points and Unrecovered RSS by +0.027 kWh per case. Reducing the battery to 200 kWh lowers Coverage by 1.413 percentage points and produces 56 energy-blocked relocations across 150 topology-day cases. Fleet-energy conservation error is zero in all finite-energy runs.
Real UrbanEV geometry produces the stronger physical stress. At 20, 30, and 40 km/h, EDVF Coverage is 78.19%, 83.77%, and 83.89%, respectively. The 20-km/h penalty is concentrated in the dispersed topology; the deliberately severe clustered topology remains constrained by the 30-km relocation graph at all speeds. These results show that travel effects depend on real network connectivity and deadline crossings rather than a uniform speed penalty.
4.5. Capability Boundary Under Concentrated Arrivals
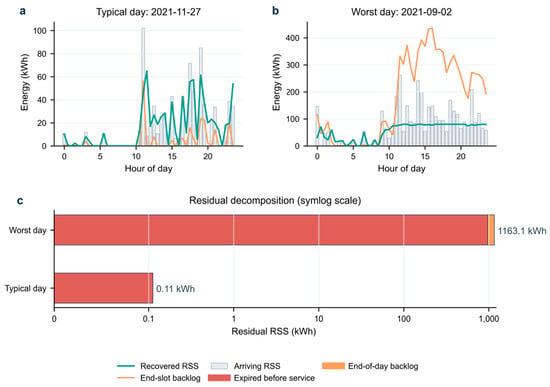
As shown in Figure 6a, diagnostic traces for topology seed 0, 27 November 2021 was near the median hold-out unrecovered RSS and most tasks cleared within the service window. By contrast, Figure 6b shows that 2 September 2021 was a high-residual day: afternoon arriving RSS remained above recovered RSS, backlog grew rapidly, and expired tasks became unrecovered RSS. Both days used the same fleet, task definition and solver settings.
Figure 6.
Slot-level diagnostic traces for one frozen topology. (a) A day near the median unrecovered RSS. (b) A high-residual day. (c) Unrecovered RSS split into expiration before service and end-of-day backlog. The trace uses topology seed 0; panels are diagnostic examples rather than independent statistical samples. Panel (c) uses a symmetric-log horizontal axis so that the near-zero typical-day residual remains visible.
Figure 6c further shows that most unserved work on the high-residual day was RSS that expired after not being served within 2 h; end-of-day backlog was small. Movement and recovered RSS increased together, showing that the loss was not caused by a failure to move. Instead, local arrival intensity exceeded the travel-adjusted capability of the limited fleet.
The operating implication is direct: continued movement does not guarantee sufficient capability. When short-run arrivals exceed the fleet limit, dispatch should prioritize RSS tasks close to expiry and activate temporary reinforcement or a response-window adjustment.
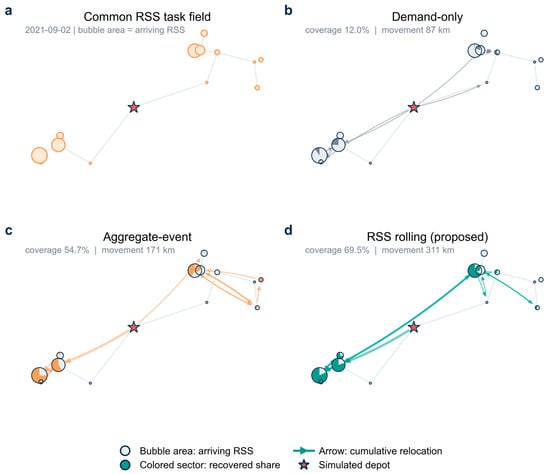
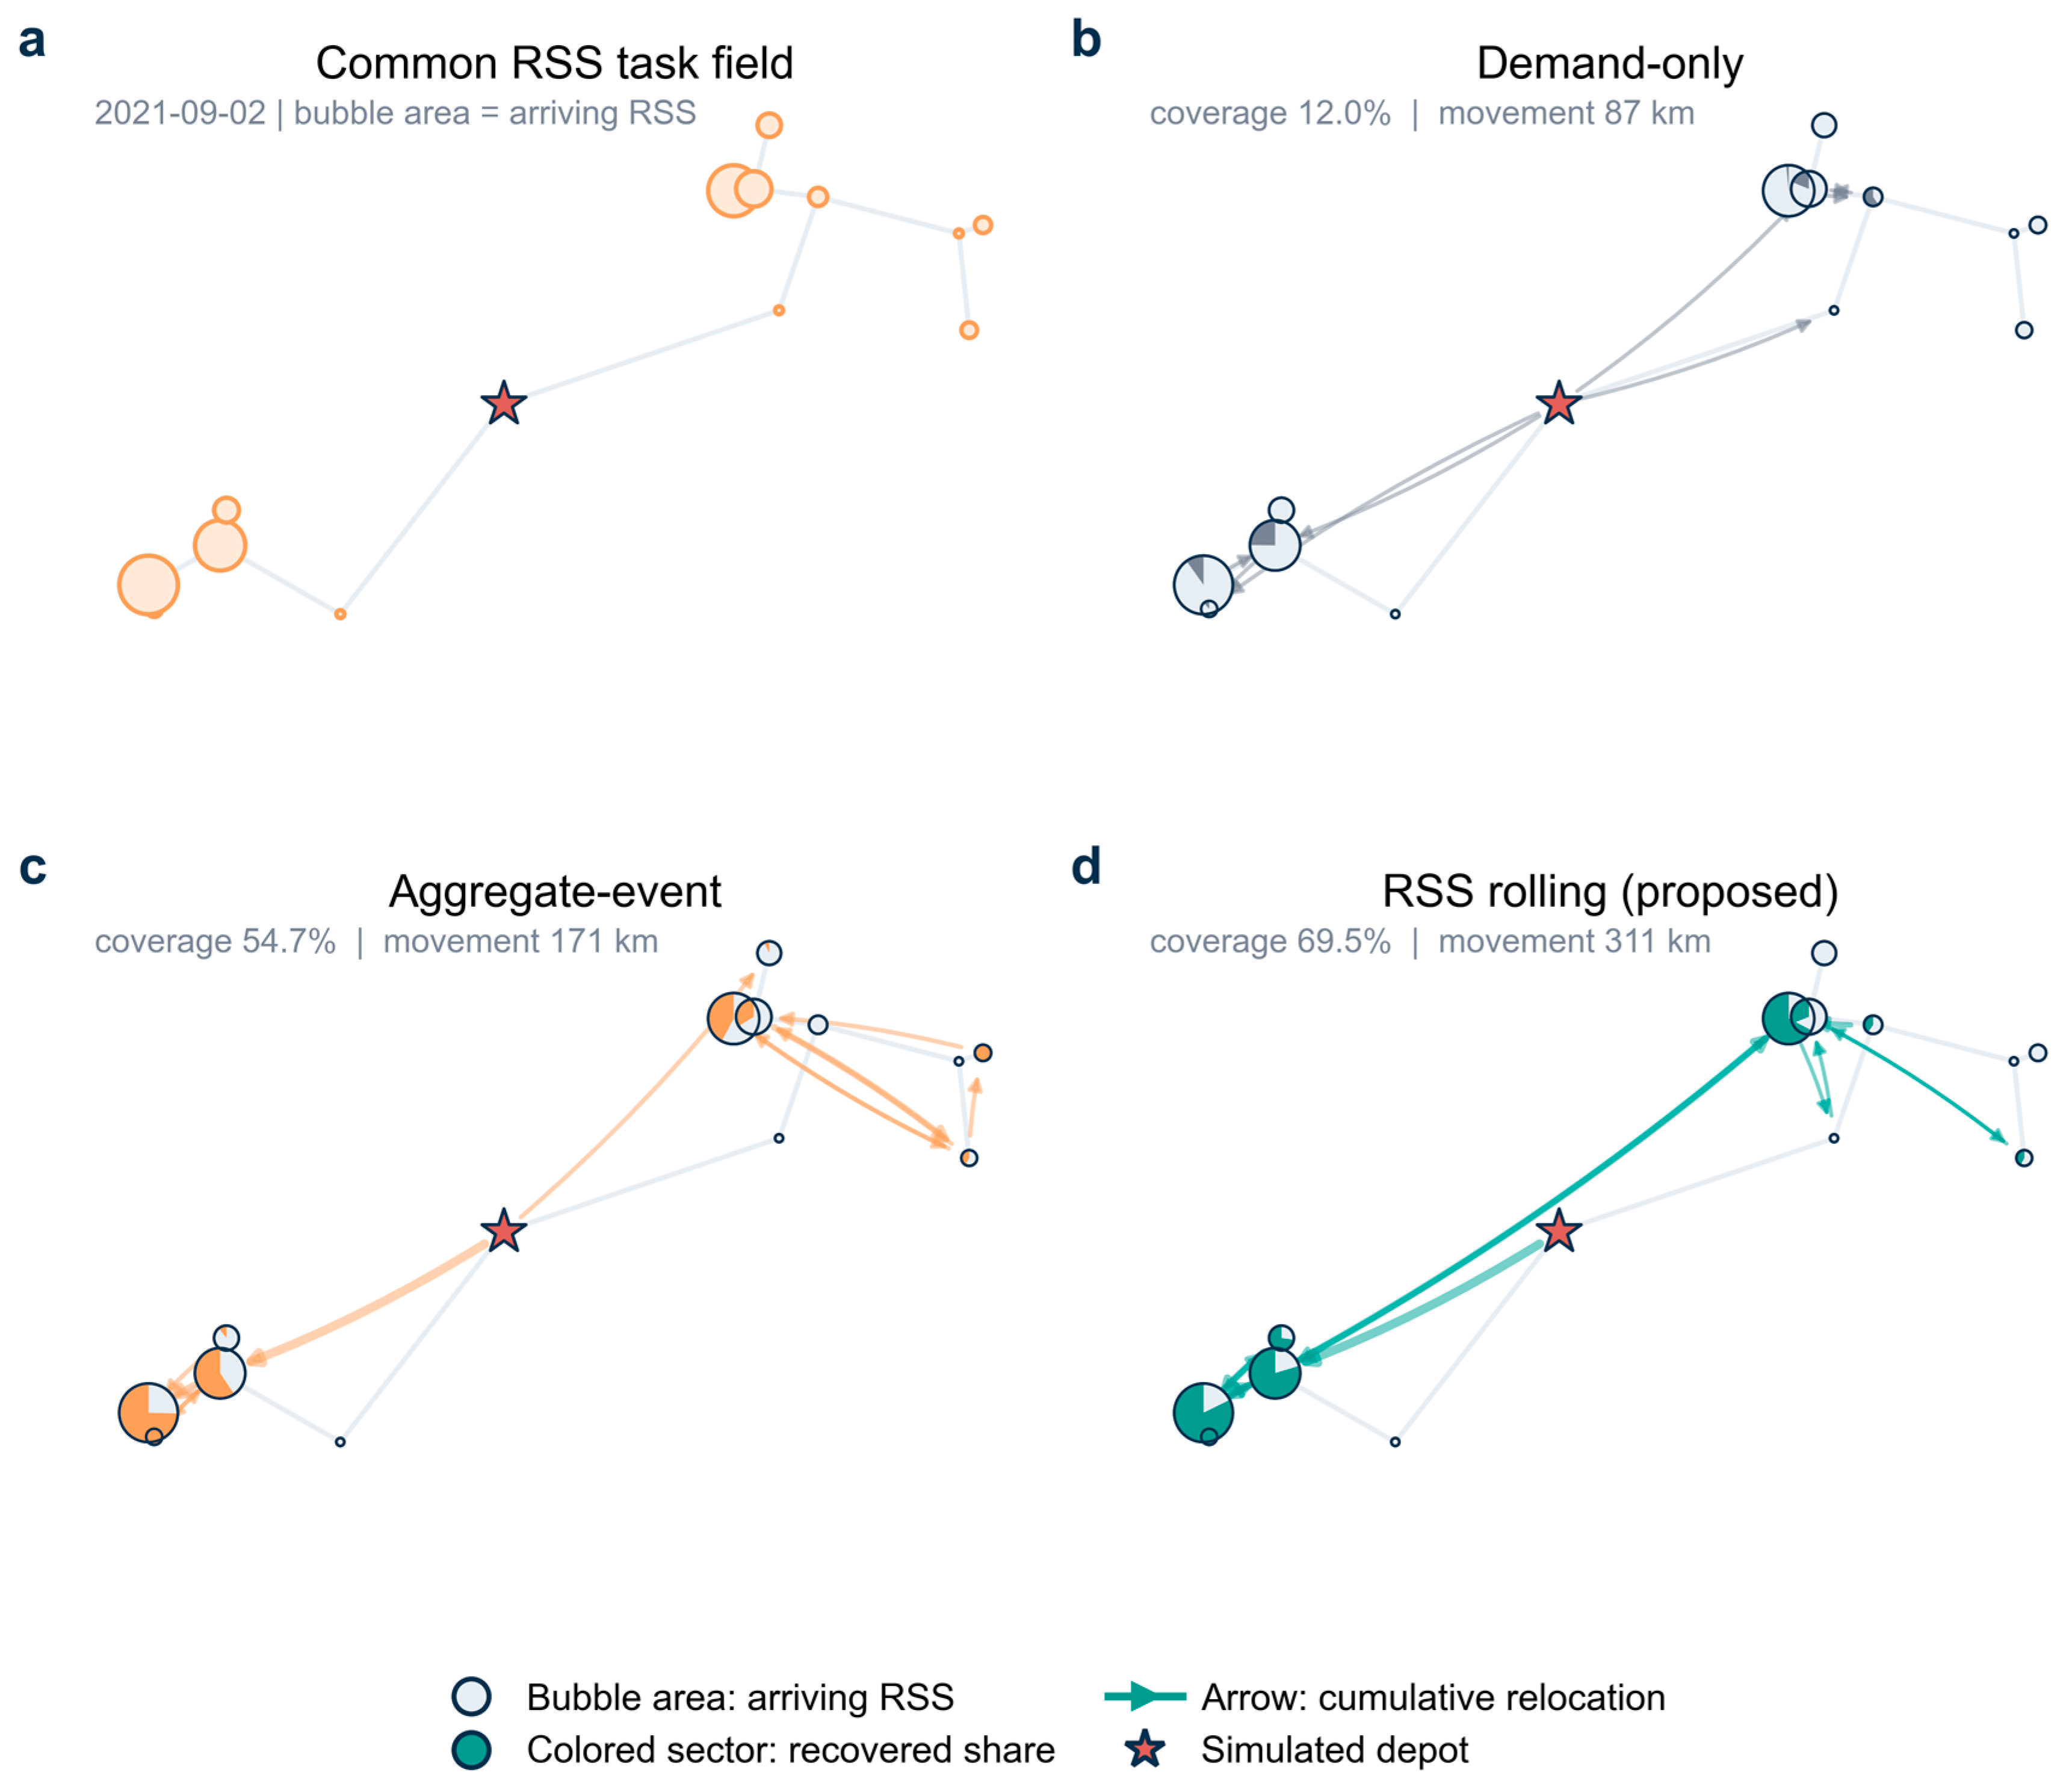
To recover the spatial decision behind this capability limit, Figure 7 fixes the same high-residual day, RSS task field, topology, and fleet and compares the full-day relocations made by demand-only, aggregate-event, and RSS-driven rolling dispatch. Bubble area represents arriving RSS, the colored sector represents the recovered share, and arrows represent cumulative mobile-unit flows. The figure provides a spatial illustration of the policy-level differences discussed in Section 4.2 by projecting them onto an inspectable operating instance.
Figure 7.
Spatial dispatch comparison on the same high-residual day and frozen topology. (a) The common RSS task field. (b) Demand-only dispatch. (c) Aggregate-event dispatch. (d) RSS-driven rolling dispatch. Bubble area encodes arriving RSS, the colored sector encodes recovered share, and arrows show the largest cumulative relocation flows; the pale remainder denotes unrecovered RSS. All panels share the same event stream, fleet, depot, and travel model. Coordinates are simulated and do not represent observed roads or exact station locations.
In this instance, demand-only dispatch moved 87 km but covered only 12.0% of RSS. Aggregate-event dispatch increased cross-cluster movement and reached 54.7%, whereas RSS-driven rolling dispatch connected the two principal task clusters with 311 km of movement and raised coverage to 69.5%. For operators, the map shows where the cost arises more directly than a coverage rate alone: when high-shortfall stations occupy different spatial clusters, additional recovery depends on cross-cluster relocation rather than repeated movement around an existing hotspot.
4.6. External Physical Validation on UrbanEV
Across 30 evaluation days and five real 13-station topology banks, EDVF achieves 83.77% Coverage, 719.10 kWh Unrecovered RSS, and 112.55 km Movement per topology-day case at 30 km/h. EDF-Reactive achieves 76.46% Coverage and 764.17 kWh Unrecovered RSS, whereas Perfect-Future-Oracle achieves 84.04% and 713.08 kWh. EDVF is therefore close to the future-informed service reference while using 610.59 km less movement per case.
The UrbanEV experiment is an external physical validation rather than a replacement for the Jiaxing event replay. It tests finite energy, real station separation, travel-speed sensitivity, and a deliberately severe connectivity regime; it does not claim that synthetic Jiaxing distances are observed road routes.
5. Discussion
5.1. What RSS Adds to Dispatch
The central contribution is not another aggregate failure statistic but a task interface for mobile dispatch. Target energy provides a normal-delivery reference, the termination cause indicates whether an external unit can take over, and task lifetime limits when intervention remains useful. Together, these elements convert an abnormal session into an RSS task with magnitude, location, and timing.
This sequence establishes a clear hierarchy between task measurement and resource allocation. To avoid using RSS for both the task and its remaining outcome, the revised manuscript uses RSS only for the incoming recoverable service shortfall and uses Unrecovered RSS for the amount that expires or remains unfinished. This terminology does not change the accounting identity or any numerical result.
5.2. Why Deadline Viability Helps
A myopic policy can act on current tasks but does not distinguish whether the current fleet can still cover all deadline prefixes. EDVF uses the complete visible cohort state to quantify the first deadline at which reachable capacity becomes insufficient. This makes imminent irreversible loss, rather than a sampled future load, the first dispatch priority.
The strict lexicographic construction separates service protection from secondary preferences. Earlier recovery is optimized only within the minimum-loss set, and travel is minimized only after both service levels are fixed. CVaR95 is consequently an ex post tail descriptor over 153 realized days, not a decision weight estimated from three scenarios.
5.3. Implications for Operations
Implementing RSS-driven dispatch first requires a connection among session termination causes, station backlog, task age, and mobile-unit location, rather than a more elaborate prediction system. Cause gating reduces responses to normal and non-remediable events, while cross-period state prevents unfinished tasks from disappearing at the next decision.
Allocation performance must be viewed together with movement, computation, and peak capability. In the 13-station Jiaxing benchmark, EDVF uses 8.73 s of total algorithm time over 51 daily decisions, approximately 0.17 s per decision; the 5-s value is a solver cap rather than observed operational latency. The exact formulation is intended for small- to medium-scale networks, whereas larger networks require candidate-arc pruning. Operators therefore need a distance budget, an expiry-priority rule, a peak reinforcement trigger, and a solver configuration matched to network scale rather than a single coverage target.
5.4. Simulation Assumptions and Validation Boundary
The Jiaxing data support session time, anonymized station, delivered energy, and protocol termination cause. Its coordinates and rescue trajectories remain simulated; accordingly, Jiaxing Movement is interpreted as a stylized simulation outcome rather than observed road travel. We therefore use UrbanEV separately to test real inter-station distances, finite onboard energy, and travel stress, while retaining Jiaxing as the transaction-event benchmark. Neither dataset contains observed mobile rescue work orders.
The normal-delivery target is an operator-side counterfactual service reference, not a measurement of user intention. ACN and EPFL audits quantify its prediction error and the value of unobserved SOC/battery state. Cause weights remain operational eligibility rules, and the complete binary-gating rerun demonstrates sensitivity to replacing fractional coefficients with strict eligibility. A prospective pilot should estimate these rules from request acceptance, successful contact before departure, connection compatibility, and delivered rescue energy, updating both cause-specific eligibility probability and conditional service fraction from field records rather than retaining fixed author-assigned values.
An auxiliary test of cause and recoverable-quantity accounting in an owned digital twin is reported in Supplementary Section S5, with data provenance, predictive performance, effective-order accounting, and paired policy results provided in Supplementary Tables S6–S9.
The UrbanEV robustness executor additionally incorporates finite mobile battery capacity, minimum SOC reserve, travel-energy consumption, service-energy depletion, spatial energy carriage, and depot recharge. These tests complement the Jiaxing event replay by examining the dispatch mechanism under more restrictive physical-resource conditions. Operational factors not represented in the available datasets, including traffic variability, heterogeneous charging compatibility, driver scheduling, and observed rescue acceptance, remain subjects for future field validation.
6. Conclusions
This study investigates how an operator-side service shortfall that remains recoverable after abnormal termination can be converted into deadline-structured tasks for mobile charging resources. Explicit cohort service, aging, and expiration equations close the task lifecycle, while EDVF compares cumulative deadline demand with reachable service capacity and selects vehicle flows in strict loss-early recovery-movement order.
Across the final Jiaxing comparison, EDVF achieves 74.56 kWh/day Unrecovered RSS and 93.82% Coverage. Its advantage over Myopic remains under strict binary cause gating. EDF-Reactive and Perfect-Future-Oracle delimit the value of deadline awareness and unavailable future information, while Scenario-Sampling-RSS remains a separate historical-scenario comparator.
The external UrbanEV results show that EDVF remains feasible under real station geometry, finite onboard energy, and travel-speed stress, but neither dataset contains actual mobile-rescue work orders or vehicle trajectories. The proposed results therefore support an auditable dispatch mechanism and physical robustness analysis rather than a claim of field causal effectiveness. Prospective validation should pre-register the RSS eligibility rule and collect SOC, route, acceptance, and delivered-rescue-energy records.
Supplementary Materials
The following supporting information can be downloaded at: https://www.mdpi.com/article/10.3390/vehicles8100265/s1, Table S1: Jiaxing transaction data-quality checks before event replay; Figure S1: Out-of-time selection results for advance cause prediction. Circles denote the hierarchical profile, squares the frozen nonlinear model, and diamonds the metric-specific frozen thresholds (2% for Brier score and RSS MAE; 5% for top-decile capture). Teal indicates a passed gate and red a failed gate. The nonlinear model did not meet any threshold, so advance individual cause probabilities were not used by dispatch; Table S2: Frozen selection thresholds and out-of-time results for advance cause prediction; Table S3: Symbols, definitions, analytical roles and units used in the target, RSS and rolling-optimization models; Table S4: Data sources, observed components, simulation components and analytical roles; Table S5: Paired natural-day effects of RSS-driven rolling dispatch under the original diagnostic comparison setting. Confidence intervals use 10,000 natural-day bootstrap draws [32]; Wilcoxon tests [33] use n = 153 paired days with Holm adjustment [34]; Table S6: Provenance and split integrity of the owned UAV-RCR digital-twin dataset; Table S7: Cause-classification and recovery-prediction performance on the owned chronological group-purged test split; Table S8: Effective-order accounting in orders per evaluation window. These quantities are not charging energy or charging capacity; Table S9: Paired digital-twin policy comparison. Paired difference is rolling policy minus baseline; blocks are consecutive and non-randomized; Wilcoxon p-values are adjusted across nine metrics using Holm’s method.
Author Contributions
Conceptualization, J.Z. and Z.C.; methodology, J.Z. and Z.C.; software, Z.C.; validation, J.Z., Z.C. and X.L.; formal analysis, Z.C.; investigation, J.Z. and Z.C.; resources, J.Z. and X.L.; data curation, Z.C.; writing—original draft preparation, J.Z. and Z.C.; writing—review and editing, J.Z., Z.C. and X.L.; visualization, Z.C.; supervision, J.Z.; project administration, J.Z.; funding acquisition, J.Z. All authors have read and agreed to the published version of the manuscript.
Funding
This research was funded by the Scientific Research Fund of Zhejiang Provincial Education Department, grant number Y202455125.
Data Availability Statement
The original Jiaxing transactions are available through the data paper [25] and Figshare version 3 [26]. The accompanying materials contain derived natural-day results, figure and table source data, parameter lists, and analysis scripts. Advanced cause prediction, the owned digital-twin analysis, and data-quality checks are reported in the Supplementary Material. The relevant code has been open-sourced at: https://github.com/FeiYee/PreRSS (accessed on 24 September 2026).
Conflicts of Interest
The authors declare no conflicts of interest.
References
- Métais, M.O.; Jouini, O.; Perez, Y.; Berrada, J.; Suomalainen, E. Too much or not enough? Planning electric vehicle charging infrastructure: A review of modeling options. Renew. Sustain. Energy Rev. 2022, 153, 111719. [Google Scholar] [CrossRef] [Scilit]
- Kchaou-Boujelben, M. Charging station location problem: A comprehensive review on models and solution approaches. Transp. Res. Part C Emerg. Technol. 2021, 132, 103376. [Google Scholar] [CrossRef] [Scilit]
- Golsefidi, A.H.; Hipolito, F.; Pereira, F.C.; Samaranayake, S. Incremental expansion of large scale fixed and mobile charging infrastructure in stochastic environments: A novel graph-based Benders decomposition approach. Appl. Energy 2025, 380, 124985. [Google Scholar] [CrossRef] [Scilit]
- Chen, B.; Chen, Z.; Liu, X.C.; Zheng, N.; Xiao, Q. Measuring the effectiveness of incorporating mobile charging services into urban electric vehicle charging network: An agent-based approach. Renew. Energy 2024, 234, 121246. [Google Scholar] [CrossRef] [Scilit]
- Taşcıkaraoğlu, A.; Beyazıt, M.A.; Kleissl, J.; Shi, Y. Coordinated Management of Mobile Charging Stations and Community Energy Storage for Electric Vehicle Charging. Appl. Energy 2025, 393, 126066. [Google Scholar] [CrossRef] [Scilit]
- Li, H.; Son, D.; Jeong, B. Electric vehicle charging scheduling with mobile charging stations. J. Clean. Prod. 2024, 434, 140162. [Google Scholar] [CrossRef] [Scilit]
- Zhang, L.; Chen, T.; Yao, B.; Yu, B.; Wang, Y. Routing and charging scheduling for the electric carsharing system with mobile charging vehicles. Omega 2025, 131, 103211. [Google Scholar] [CrossRef] [Scilit]
- Yan, Y.; Tian, Q.; Sun, Z.; Cao, R.; Wang, D.Z.W. A hierarchical decision framework for dynamic operation of mobile charging stations. Transp. Res. Part E Logist. Transp. Rev. 2026, 206, 104553. [Google Scholar] [CrossRef] [Scilit]
- Tang, P.; He, F.; Lin, X.; Li, M. Online-to-offline mobile charging system for electric vehicles: Strategic planning and online operation. Transp. Res. Part D Transp. Environ. 2020, 87, 102522. [Google Scholar] [CrossRef] [Scilit]
- Cui, S.; Ma, X.; Zhang, M.; Yu, B.; Yao, B. The parallel mobile charging service for free-floating shared electric vehicle clusters. Transp. Res. Part E Logist. Transp. Rev. 2022, 160, 102652. [Google Scholar] [CrossRef] [Scilit]
- Wang, J.; Guo, Q.; Sun, H.; Chen, M. Collaborative optimization of logistics and electricity for the mobile charging service system. Appl. Energy 2023, 336, 120845. [Google Scholar] [CrossRef] [Scilit]
- Huang, S.; He, L.; Gu, Y.; Wood, K.; Benjaafar, S. Design of a mobile charging service for electric vehicles in an urban environment. IEEE Trans. Intell. Transp. Syst. 2015, 16, 787–798. [Google Scholar] [CrossRef] [Scilit]
- Qureshi, U.; Ghosh, A.; Panigrahi, B.K. Scheduling and routing of mobile charging stations with stochastic travel times to service heterogeneous spatiotemporal electric vehicle charging requests with time windows. IEEE Trans. Ind. Appl. 2022, 58, 6546–6556. [Google Scholar] [CrossRef] [Scilit]
- Li, H.; Qu, H.; Tan, X.; You, L.; Zhu, R.; Fan, W. UrbanEV: An Open Benchmark Dataset for Urban Electric Vehicle Charging Demand Prediction. Sci. Data 2025, 12, 523. [Google Scholar] [CrossRef] [Scilit] [PubMed]
- Li, H.; Qu, H.; Tan, X.; You, L.; Zhu, R.; Fan, W. UrbanEV: An Open Benchmark Dataset for Urban Electric Vehicle Charging Demand Prediction [dataset]. Dryad 2026. [Google Scholar] [CrossRef]
- Yang, D.; Sarma, N.J.S.; Hyland, M.F.; Jayakrishnan, R. Dynamic modeling and real-time management of a system of EV fast-charging stations. Transp. Res. Part C Emerg. Technol. 2021, 128, 103186. [Google Scholar] [CrossRef] [Scilit]
- Varma, S.M.; Castro, F.; Maguluri, S.T. Electric Vehicle Fleet and Charging Infrastructure Planning. Manag. Sci. 2025, 72, 7193–7379. [Google Scholar] [CrossRef] [Scilit]
- Wang, W.; Tang, A.; Wei, F.; Yang, H.; Li, X.; Peng, J. Electric vehicle charging load forecasting considering weather impact. Appl. Energy 2025, 383, 125337. [Google Scholar] [CrossRef] [Scilit]
- Pruckner, M.; German, R.; Eckhoff, D. Spatial and temporal charging infrastructure planning using discrete event simulation. In Proceedings of the 2017 ACM SIGSIM Conference on Principles of Advanced Discrete Simulation, Singapore, 24–26 May 2017; pp. 249–257. [Google Scholar] [CrossRef] [Scilit]
- Parishwad, O.; Gao, K.; Najafi, A. Integrated and agent-based charging demand prediction considering cost aware and adaptive charging behavior. Transp. Res. Part D Transp. Environ. 2026, 154, 105285. [Google Scholar] [CrossRef] [Scilit]
- Harris, C.B.; Webber, M.E. An empirically-validated methodology to simulate electricity demand for electric vehicle charging. Appl. Energy 2014, 126, 172–181. [Google Scholar] [CrossRef] [Scilit]
- Dixon, J.; Bell, K. Electric vehicles: Battery capacity, charger power, access to charging and the impacts on distribution networks. eTransportation 2020, 4, 100059. [Google Scholar] [CrossRef] [Scilit]
- Gruosso, G.; Mion, A.; Storti Gajani, G. Forecasting of electrical vehicle impact on infrastructure: Markov chains model of charging stations occupation. eTransportation 2020, 6, 100083. [Google Scholar] [CrossRef] [Scilit]
- Fine, J.P.; Gray, R.J. A proportional hazards model for the subdistribution of a competing risk. J. Am. Stat. Assoc. 1999, 94, 496–509. [Google Scholar] [CrossRef]
- Zhang, Y.; Xu, T.; Chen, T.; Hu, Q.; Chen, H.; Hu, X.; Jiang, Z. A high-resolution electric vehicle charging transaction dataset with multidimensional features in China. Sci. Data 2025, 12, 643. [Google Scholar] [CrossRef] [Scilit] [PubMed]
- Zhang, Y.; Xu, T.; Chen, T.; Hu, Q.; Chen, H.; Hu, X.; Jiang, Z. A high-resolution electric vehicle charging transaction dataset with multidimensional features in China (version 3) [dataset]. Figshare 2025. [Google Scholar] [CrossRef]
- Lee, Z.J.; Li, T.; Low, S.H. ACN-Data: Analysis and applications of an open EV charging dataset. In Proceedings of the Tenth ACM International Conference on Future Energy Systems, Phoenix, AZ, USA, 25–28 June 2019; pp. 139–149. [Google Scholar] [CrossRef] [Scilit]
- Distributed Electrical Systems Laboratory (DESL); École Polytechnique Fédérale de Lausanne (EPFL). Level 3 Electric Vehicle Charging Dataset [Dataset]. GitHub. Available online: https://github.com/DESL-EPFL/Level-3-EV-charging-dataset (accessed on 22 September 2026).
- Brier, G.W. Verification of forecasts expressed in terms of probability. Mon. Weather Rev. 1950, 78, 1–3. [Google Scholar] [CrossRef] [Scilit]
- Rockafellar, R.T.; Uryasev, S. Optimization of conditional value-at-risk. J. Risk 2000, 2, 21–41. [Google Scholar] [CrossRef] [Scilit]
- Virtanen, P.; Gommers, R.; Oliphant, T.E.; Haberland, M.; Reddy, T.; Cournapeau, D.; Burovski, E.; Peterson, P.; Weckesser, W.; Bright, J.; et al. SciPy 1.0: Fundamental algorithms for scientific computing in Python. Nat. Methods 2020, 17, 261–272, Correction in Nat. Methods 2020, 17, 352. https://doi.org/10.1038/s41592-020-0772-5. [Google Scholar] [CrossRef] [Scilit] [PubMed]
- Efron, B.; Tibshirani, R.J. An Introduction to the Bootstrap; Chapman and Hall/CRC: New York, NY, USA, 1994. [Google Scholar] [CrossRef] [Scilit]
- Wilcoxon, F. Individual comparisons by ranking methods. Biom. Bull. 1945, 1, 80–83. [Google Scholar] [CrossRef] [Scilit]
- Holm, S. A simple sequentially rejective multiple test procedure. Scand. J. Stat. 1979, 6, 65–70. [Google Scholar]

Disclaimer/Publisher’s Note: The statements, opinions and data contained in all publications are solely those of the individual author(s) and contributor(s) and not of MDPI and/or the editor(s). MDPI and/or the editor(s) disclaim responsibility for any injury to people or property resulting from any ideas, methods, instructions or products referred to in the content. |
© 2026 by the authors. Licensee MDPI, Basel, Switzerland. This article is an open access article distributed under the terms and conditions of the Creative Commons Attribution (CC BY) license.