


Abstract
This study explores the quasi-static and dynamic responses of irregular, honeycomb-like topologies made from glycol polyethylene terephthalate (PETG) with various sparse infill densities, using fused filament fabrication (FFF) manufacturing technology. Both tensile and flexural tests revealed a linear increase in Young’s modulus and sample strength as infill density increased, under constant printing and testing conditions. Below 50% infill, this trend remained unchanged, despite cells being irregular and fracture mechanics differing. Low-velocity impact tests were conducted at a velocity of 1.5 m/s, equivalent to an incident energy of 6.2 J. Regarding dynamic responses, irregular honeycomb-like structures use 12.5–25% of the nominal pendulum energy during complete fracture in Charpy tests, and 74.3–98.3% of total available energy during low-impact crushing. Samples with infill densities of 15% and 25% revealed higher absorbed energy values of around 6.5 and 6.1 J, respectively, compared with denser samples. Although they exhibit more favorable mass-specific energy absorption, these samples collapse more quickly than their stiffer 50–100% counterparts. The findings provide valuable insights into irregular, honeycomb-like structures and open up perspectives for optimization and component-level assessment, with potential applications as impact-resistant, secondary/non-structural components for the automotive industry.
1. Introduction
Fused Deposition Modeling (FDM)/Fused Filament Fabrication (FFF) is the dominant process in the current adoption of polymer-based additive manufacturing (AM) in vehicle production, spanning the entire vehicle cycle. A number of specific benefits from FDM/FFF [1] processes for automotive prototyping, ranging from reduced production costs to accelerated development cycles, are often overshadowed by production speed, post-processing overhead, and regulatory and standardization gaps. Comprehensive reviews of Alami et al. [2] (2023) and Hamza et al. [3] (2025) explore the primary AM technologies as pillars for current automotive manufacturing innovation, highlighting a few key benefits in vehicle design and specifically underscoring these as environmentally friendly. Following a thorough review, both research groups reached a consensus on the limitations of these technologies, as previously highlighted. It was also noted that material constraints and the disregard of Design for Additive Manufacturing (DfAM) principles during geometry optimization steps can also limit the effectiveness of these technologies.
From a material standpoint, Polyethylene Terephthalate Glycol (PETG) is increasingly being used as a robust alternative to PLA (Polylactic Acid) and ABS (Acrylonitrile Butadiene Styrene) in FDM/FFF processes due to the favorable balance of strength, flexibility and chemical stability it offers [4,5]. In this context, PETG is an ideal material for interior cabin parts, non-structural components, tooling/fixture, and energy-absorbing demonstrators. It enables lightweighting and the creation of complex geometries that reduce material waste and vehicle mass without compromising safety or durability, with a huge potential for recycling/reuse and promoting sustainability [5].
Infill density is consistently identified as one of the most influential parameters affecting mechanical performance, both in tensile and flexure. Tensile strength and Young’s modulus in tension exhibit a positive, nearly linear correlation with infill density, as reported by Hsueh et al. [6] (2021), Ozen et al. [7] (2021) or Khan et al. [8] (2023), among others. Hsueh et al. found that printing conditions additionally influenced mechanical performance, especially nozzle temperature and printing speed. Meanwhile, Khan et al. established benchmarks for 3D-printed PETG, reporting a tensile strength of 46 MPa. They noted that increasing infill density increases load-bearing capacity and reduces defects. Further, according to Ozen et al., PETG parts exhibited maximum values of ultimate tensile strength (UTS) and Young’s modulus for the combination of higher percentage of filament overlap (20%) and thinner layers (0.2 mm). Furthermore, they emphasized that specimen geometry and slicing techniques are critical for obtaining accurate mechanical data.
The paper by Auffray et al. [9] (2022) identifies infill density and infill pattern as the most critical factors governing the mechanical properties of 3D-printed PLA-based specimens subjected to tensile testing. Their measured values of apparent Young’s modulus ranged from approximately 250 to 800 MPa. The highest stiffness and strength were achieved using a triangular infill pattern at 50% density. A significant finding was the interaction between layer height and infill density. Similarly, Valvez et al. [10] identified infill density as the most influential factor on flexural strength and modulus of bending in their study using the Taguchi method for the purpose of optimizing printing parameters. In support of this, extensive research by Lopes et al. [11] (2023) further focused on how geometric arrangements, such as honeycomb patterns, can optimize flexural capacity. Nevertheless, it should be noted that processing parameters such as printing temperature, speed and layer height also have a significant impact, along with built orientation and patterns. Research data reported by Loskot [12] et al. (2023) identified that print speeds of 60 mm/s are suitable for PETG, with Young’s modulus showing a slight dependence on this parameter. Research by Firtikiadis [13] et al. has found that printing speed does not significantly impact the strength of specimens produced using recycled PETG. The study indicates that intermediate speeds are optimal for achieving maximum interlayer material deposition, resulting in a tensile strength of 46.77 MPa at 90% infill.
Furthermore, in their literature survey and case study, Sola et al. [14] (2023) emphasized that the mechanical properties of 3D-printed specimens are actually the result of a number of interconnected influencing factors. In relation to their case study on the parameters influencing tensile properties, their Ishikawa diagram included seven major groups centered around the following: digital input, printer set-up, printing and part orientation, feedstock material, specimen characteristics and environmental conditions. A key finding from their case study on PLA is that size effects are anisotropic and emphasized that researchers must fully report all parameters to ensure repeatability and allow for meaningful benchmarking until dedicated standards are established.
Recent studies on additively manufactured cellular and sandwich structures indicate that energy absorption capacity during quasi-static three- or four-point bending is a meaningful performance metric alongside flexural strength and stiffness [15,16,17]. Filaments such as PLA and carbon fiber-reinforced nylon were used to print the sandwich structures with hexagonal cores, along with other topologies. For example, Tunay’s [16] (2024) study found that core topology has a significant impact on energy absorption capacity. This supports the assertion that the area under the load-deflection curve is sensitive to internal architecture, as various core shapes, including circular, square, triangular, and hexagonal, were taken into account.
The impact strength of PETG parts produced by FDM/FFF processes is influenced by the same factors aforementioned. Factors such as infill density and pattern, processing and post-processing conditions, and sourcing were considered during the impact performance assessment through Charpy or Izod tests. As evidenced by numerous studies, PLA [18,19,20,21] and ABS [22,23,24] have been thoroughly researched in terms of their impact behavior. In contrast, there are fewer studies that have examined the suitability of PETG and its composites for demanding applications. Samatham et al. [25] (2026) identified honeycomb structure as the best for energy absorption and found that nozzle temperature affects impact resistance. Next, Kumar et al. [26] (2021) examined the effect of infill densities on the impact properties of PETG and CF-PETG under annealing conditions for printed parts, in addition to their tensile and flexural properties. The research points toward 100% infill density parts as having the highest impact strength for both materials and highlights annealing as a post-processing technique resulting in about a 15% increase in impact strength. Furthermore, research suggests that annealed 100% infill CF-PETG could be a viable lightweight replacement for metallic components in automotive structural applications. In their paper, Zisopol et al. [27] (2025) highlighted the increased impact resistance of recycled PETG (rPETG) compared with its virgin counterpart. They also found that the best impact performance was obtained for 100% infill density specimens at a 0.1 mm layer height. Vidakis et al. [28] (2021) previously explored the decline of impact properties that occurs with an increase in recycling cycles for PETG, a consequence of repeated thermomechanical processing. Consequently, further research could focus on optimizing additional process parameters (e.g., wall thickness, printing speed, infill patterns, etc.), environmental impact and testing conditions. However, while addressing lightweighting and crashworthiness concerns, a shift from 100% infill density towards an optimal value identified via multi-criteria decision-making paves the way for further research.
The adoption of dynamic testing methods, such as drop-weight impact experiments, is fueled by the automotive industry’s requirement to engineer crashworthy and sustainable components for effective energy management. In this context, Deng et al. [29] (2025) recently contributed to the field by focusing on the influence of infilling configuration on energy absorption and failure modes in low-velocity impacts on 3D-printed structures. Among the three investigated categories, surface-filled structures, particularly those with a honeycomb pattern, outperformed line- and volume-filled structures by around 40%. Moreover, these structures were identified as the most effective due to their high peak load and minimal damage depth. Similarly, Tilley et al. [30] (2024) investigated the use of 3D-printed metamaterials for motorsport applications. The group reported on gyroids, reinforced gyroids and topology-optimized metamaterials (TOM) 3D-printed PLA-based structures for motorsport impact attenuators. Their findings emphasized that gyroid structures proved to be safer for oblique crashes.
The research groups of Santos et al. [31] (2021) and Isaac et al. [32] (2023) comparatively investigated the crushing performance of several materials that had PLA and PETG in common, as well as a honeycomb pattern selection. Separately, they have all proven that PETG-based structures offer the greatest crushing force efficiency (CFE) and ductility, particularly compared to PLA, which is brittle. In addition to regular honeycomb topologies, Indreș et al. [33] (2024) explored other topologies, such as 0° and 90° re-entrant ones, at two different impact energy values: 10 J and 15 J, respectively. They concluded that all panels exhibited a CFE in the 0.53–0.63 range and that honeycomb topology remains a top candidate for impact engineering due to its stability. The recently published contributions of Awd Allah et al. [34] (2025) and Jain et al. [35] (2025) are closely related to automotive safety applications, as they investigated the crashworthiness behavior of PETG-CF-based 3D-printed composites. Both studies demonstrated enhanced mechanical properties, particularly in impact tests, concluding that honeycomb topologies would be suitable for developing lightweight structural components with increased efficiency in managing impact energy.
Further, the contribution of Anni et al. [36] (2022) is notable in that the study investigated the behavior of density-graded flexible thermoplastic polyurethane (TPU) honeycombs subjected to out-of-plane loading. The authors were able to alter load-bearing and energy absorption capabilities of TPU-based structures by varying cell wall thicknesses and creating density-graded layers. Their findings, especially shape recoverability, make these flexible TPU honeycombs ideal for repeated impacts.
Taken together, the above studies establish infill density as a key contributor to mechanical performance across multiple thermoplastics and loading modes. Furthermore, honeycomb-pattern topologies are identified as being favorable for energy absorption. However, current studies on honeycombs generally examine a single or narrow set of infill/density conditions, a regular or computer-aided design (CAD) topology, or a single loading regime (either quasi-static or dynamic, but rarely both). To the best of our knowledge, no study has simultaneously characterized the quasi-static (tensile and flexural) and dynamic (Charpy and drop-weight) responses of a commercially available, slicer-generated, irregular, honeycomb-like PETG topology across a fine, wide-ranging infill density gradient (5–100%). This represents a specific and practically relevant gap in applied automotive component design, where slicer-native patterns are easily accessible to professionals without expertise in lattice design.
Building on this gap, this paper aims to assess toughness, low-velocity impact resistance, and energy absorption capabilities of 3D-printed, PETG-based, irregular honeycomb-like topology samples with different infill densities subjected to dynamic mechanical testing, across an infill density range of 5% to 100%, with experiments conducted at 6.2 J, equivalent to 1.5 m/s. The study was extended to include experimental data from quasi-static tensile and flexural mechanical tests, jointly characterizing the quasi-static and dynamic response of these slicer-generated honeycomb-like structures. These results are intended to facilitate further component design and benchmarking of impact-resistant, secondary automotive components such as sensor housings or battery covers, in line with the IEC 62262:2002 [37] (IK08-IK09) low-energy impact protection range investigated here.
2. Materials and Methods
2.1. Material Selection and Specimens Manufacturing
The PETG-based samples were manufactured using a fully enclosed Bambu Lab P1S 3D printer (Bambu Lab, Shenzhen, China) via material extrusion (MEX), commonly referred to as FFF. Table 1 lists the material properties of Fiberlogy EASY PETG filaments (Fiberlogy/Fiberlab SA, Brzezie, Poland) as provided by the manufacturer, while Table 2 lists the printing parameter settings for sample manufacturing.
Table 1.
Key material properties of Fiberlogy EASY PETG filament.
Table 2.
Printing parameters used in FFF sample manufacturing.
The printing speed profile followed a standard three-stage process: a reduced first-layer speed of 50 mm/s to ensure bed adhesion; a nominal bulk speed of 120 mm/s, dynamically adjusted by the motion controller up to 200 mm/s; and a reduced final-layer speed of 120 mm/s to improve surface finish. As this profile remained constant across all infill densities, it was not considered an independent process variable in this study.
2.2. Experimental Equipment, Settings and Measurements
2.2.1. Mass Measurements
A BSA623S precision balance (Sartorius AG, Gottingen, Germany) was used to accurately weigh all samples for Charpy and low-velocity impact tests, ensuring consistency in mass measurements. This step was critical to maintaining test reliability and minimizing variability in impact energy absorption analysis.
2.2.2. Tensile Tests
Experimental results were retrieved following the ASTM D638:2022 [38] and ISO 527-2:2025 [39] standards outline using a mechanical testing machine LS100 Plus (Lloyd Instruments, AMETEK® Inc., Bognor Regis, United Kingdom) running in tensile mode, using a 100 kN load cell. The crosshead speed was set to 1 mm/min for the five representative specimens under consideration. The specimens were printed with a dog-bone shape with the following dimensions: 80 mm gauge length, 10 mm gauge width and 4 mm thick. All mechanical tests were conducted at room temperature (approximately 21 ± 2 °C). Apparent tensile strength and ultimate tensile strength, apparent Young’s modulus in tension and elongation were retrieved by means of NEXYGEN Plus 4 data analysis software.
2.2.3. Flexural Tests
Experimental data were retrieved in accordance with ISO 178:2019 [40] standard using a mechanical testing machine LR5K Plus (Lloyd Instruments, AMETEK® Inc.) running in a 3-point bending mode with a length span of 64 mm, 10 mm width and 4 mm height, using a 10 kN load cell. A bending rate of 20 mm/min was used to take measurements, and an average value from five representative samples for each category is reported.
All mechanical tests were conducted at room temperature (approximately 21 ± 2 °C). Apparent flexural strength and Young’s modulus in flexure were retrieved as claimed by standard instructions, by means of NEXYGEN Plus 4 data analysis software.
2.2.4. Charpy Impact Tests
Experimental data were retrieved in accordance with ISO 179-1:2026 [41] standard using a HIT50P Charpy pendulum (Zwick/Roell GmbH, Ulm, Germany), impact energy of 15 J and impact angle of 147.60°. Representative unnotched specimens, in batches of five, had the following dimensions: 80 mm in length and 20 × 4 mm2 as the cross-sectional area. These components were printed using white PETG filament. All impact tests were conducted at room temperature (approximately 22 ± 0.5 °C). Impact energy absorbed in breaking was quantitatively retrieved, and impact strength was evaluated for specimens’ toughness assessment.
2.2.5. Drop-Weight Impact Tests
Experimental data were retrieved in accordance with ISO 6603-2:2023 [42] standard for determination of puncture impact behavior of plastics, using an INSTRON 9400 (INSTRON® representative, Darmstadt, Germany) impact drop tower system. The testing machine was equipped with a 5.5 kg, 20 mm hemispherical impactor, with prior tests determining an initial available impact energy of 6.2 J, equivalent to 1.5 m/s velocity and 115.1 mm drop height. The energy impact level was selected as the minimum value at which damage will be induced in all specimens without boundary effects. The force sensor used in this study had a working range of 0.45 to 90 kN and a sampling rate of 1 MHz. Representative specimens, in batches of five, were printed with the following dimensions: 100 × 100 × 20, all in mm. All specimens under test were simply supported and centered on the lower clamp area. Temperature within the thermostatic measurement chamber was approximately 22 ± 0.5 °C, close to room temperature. Bluehill® Impact software v.4.47 facilitated data acquisition and analysis, recording force–time history and displacements.
The post-test fracture surfaces and cross-sections were examined qualitatively using a Keyence VHX E20 series digital optical microscope (Keyence International, Mechelen, Belgium), enabling magnification within the 20x–100x range. This supported the visual interpretation of deformation and failure mechanisms in Section 3.
Data processing was carried out using Excel from the Microsoft 365 suite, alongside in-house-developed MATLAB® 2025b pseudo-code to estimate velocity, displacement and energy profiles, as well as certain crushing indices derived from them. The following expressions were used [43]:
where is the impactor incident velocity, in m∙s−1; g is gravitational acceleration, in m∙s−2; m is the effective impactor mass, in kg; is the experimental recorded time-dependent force, in N; is the total loading energy transferred to sample, in J; and is the initial position of the hemispherical striker, whereas represents time-dependent displacement, both in m.
3. Results and Discussion
3.1. Mass Measurements
Values listed in Table 3 and Table 4 correspond to notched and unnotched specimens’ mass (g) as printed for Charpy and drop-weight impact tests, respectively. Irrespective of sparse infill density, all standard deviations (stdev) and coefficients of variation (CoV) indicate minimal variability, suggesting consistent measurements and reliable mean values for these groups.
Table 3.
Mean unnotched specimen mass (g) values as delivered for Charpy impact tests.
Table 4.
Mean specimen mass (g) values as delivered for drop-weight impact tests.
3.2. Tensile and Flexural Properties
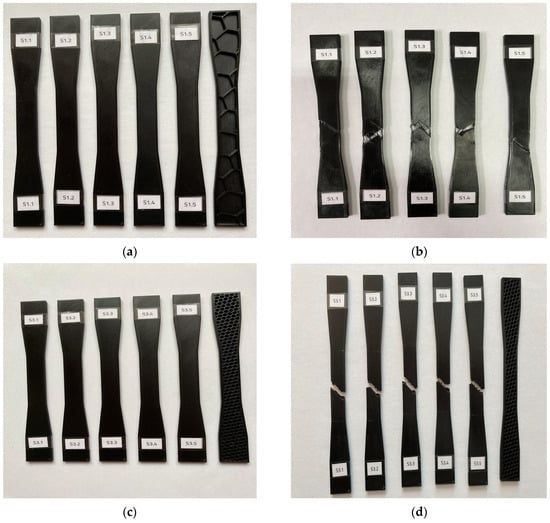
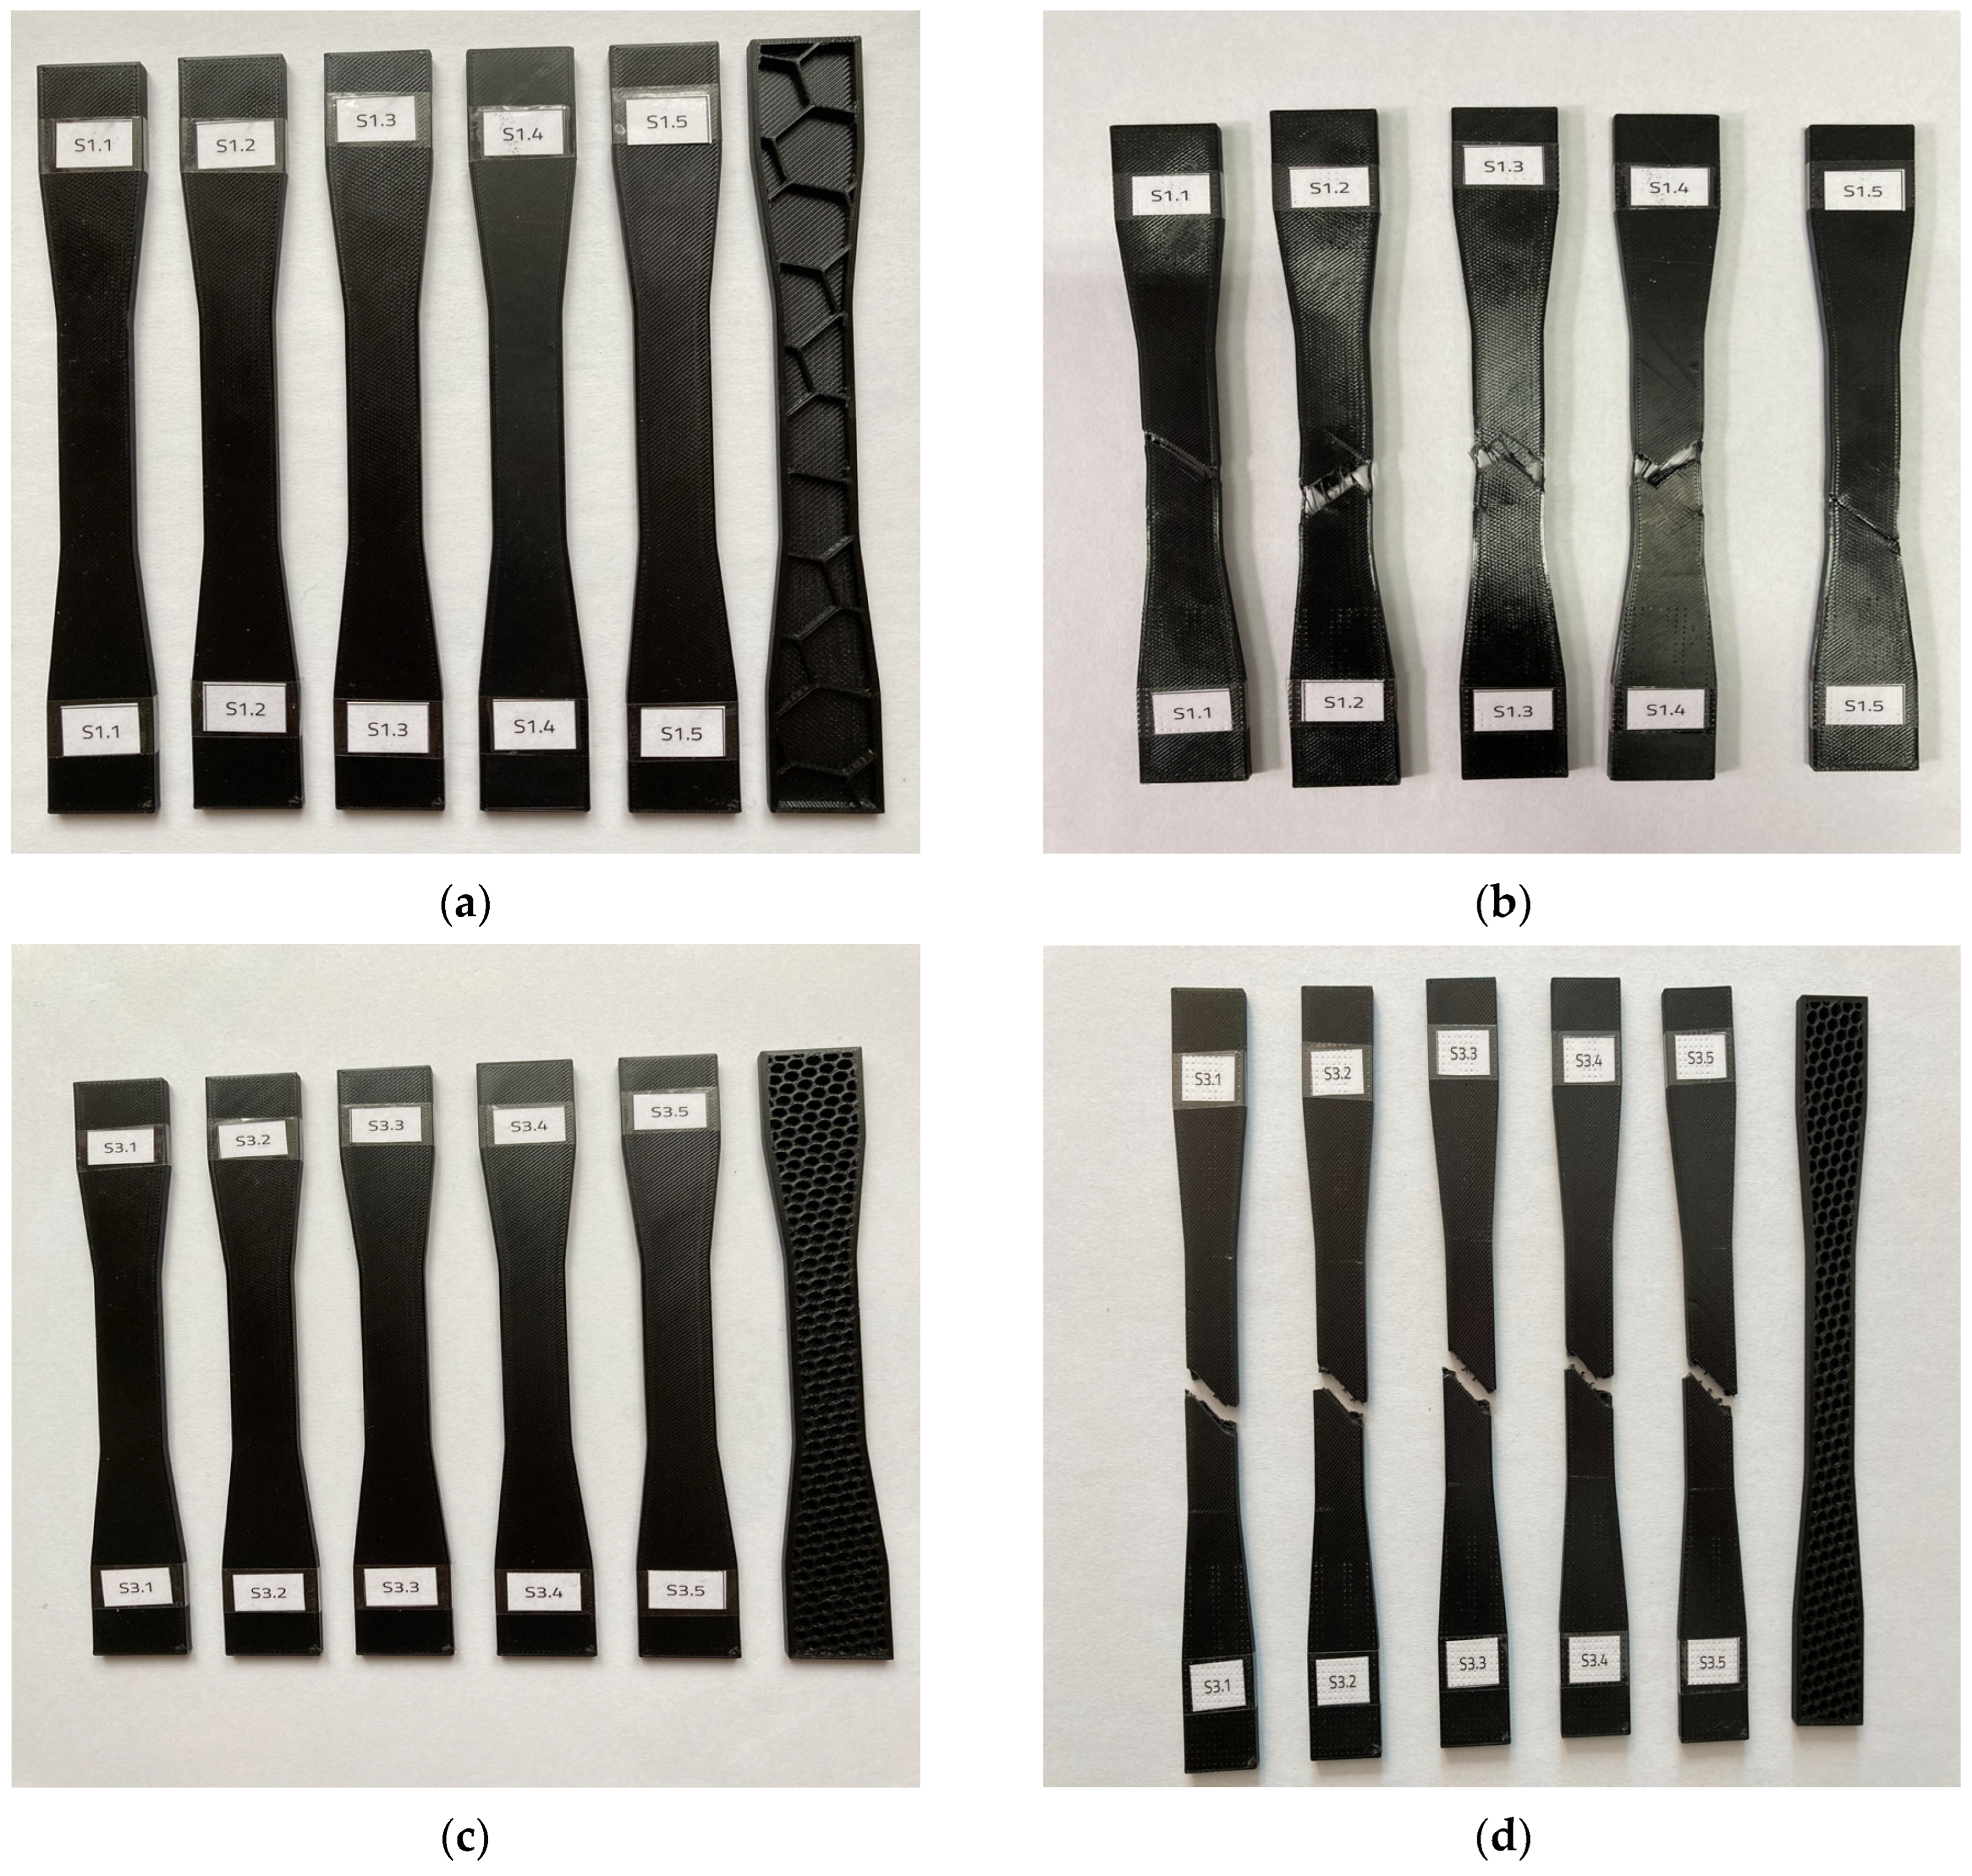
Figure 1 contains excerpts of representative 3D-printed specimens with different sparse infill densities, namely 5% and 50%, prior to and following tensile testing. As is evident, irrespective of sparse infill density values, all specimens failed within the gauge section but at non-identical positions. This suggests that fracture localization was primarily influenced by local structural heterogeneity rather than by specimen geometry alone. Furthermore, fracture paths are predominantly inclined, indicating a mixed tensile-shear failure mode rather than ductile failure. Additionally, the fracture paths are off-center, likely due to the specimens’ anisotropy and infill topology.
Figure 1.
Representative honeycomb-like topology samples used for tensile testing: (a) 5% infill density before tensile testing; (b) 5% infill density after tensile testing; (c) 50% infill density before tensile testing; and (d) 50% infill density after tensile testing.
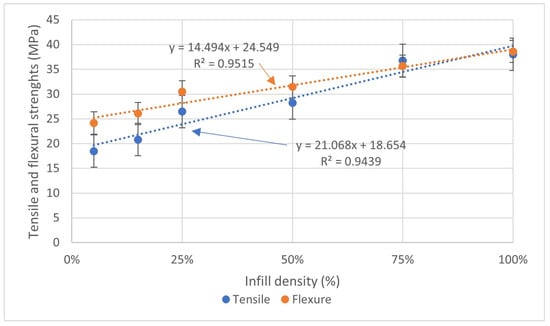
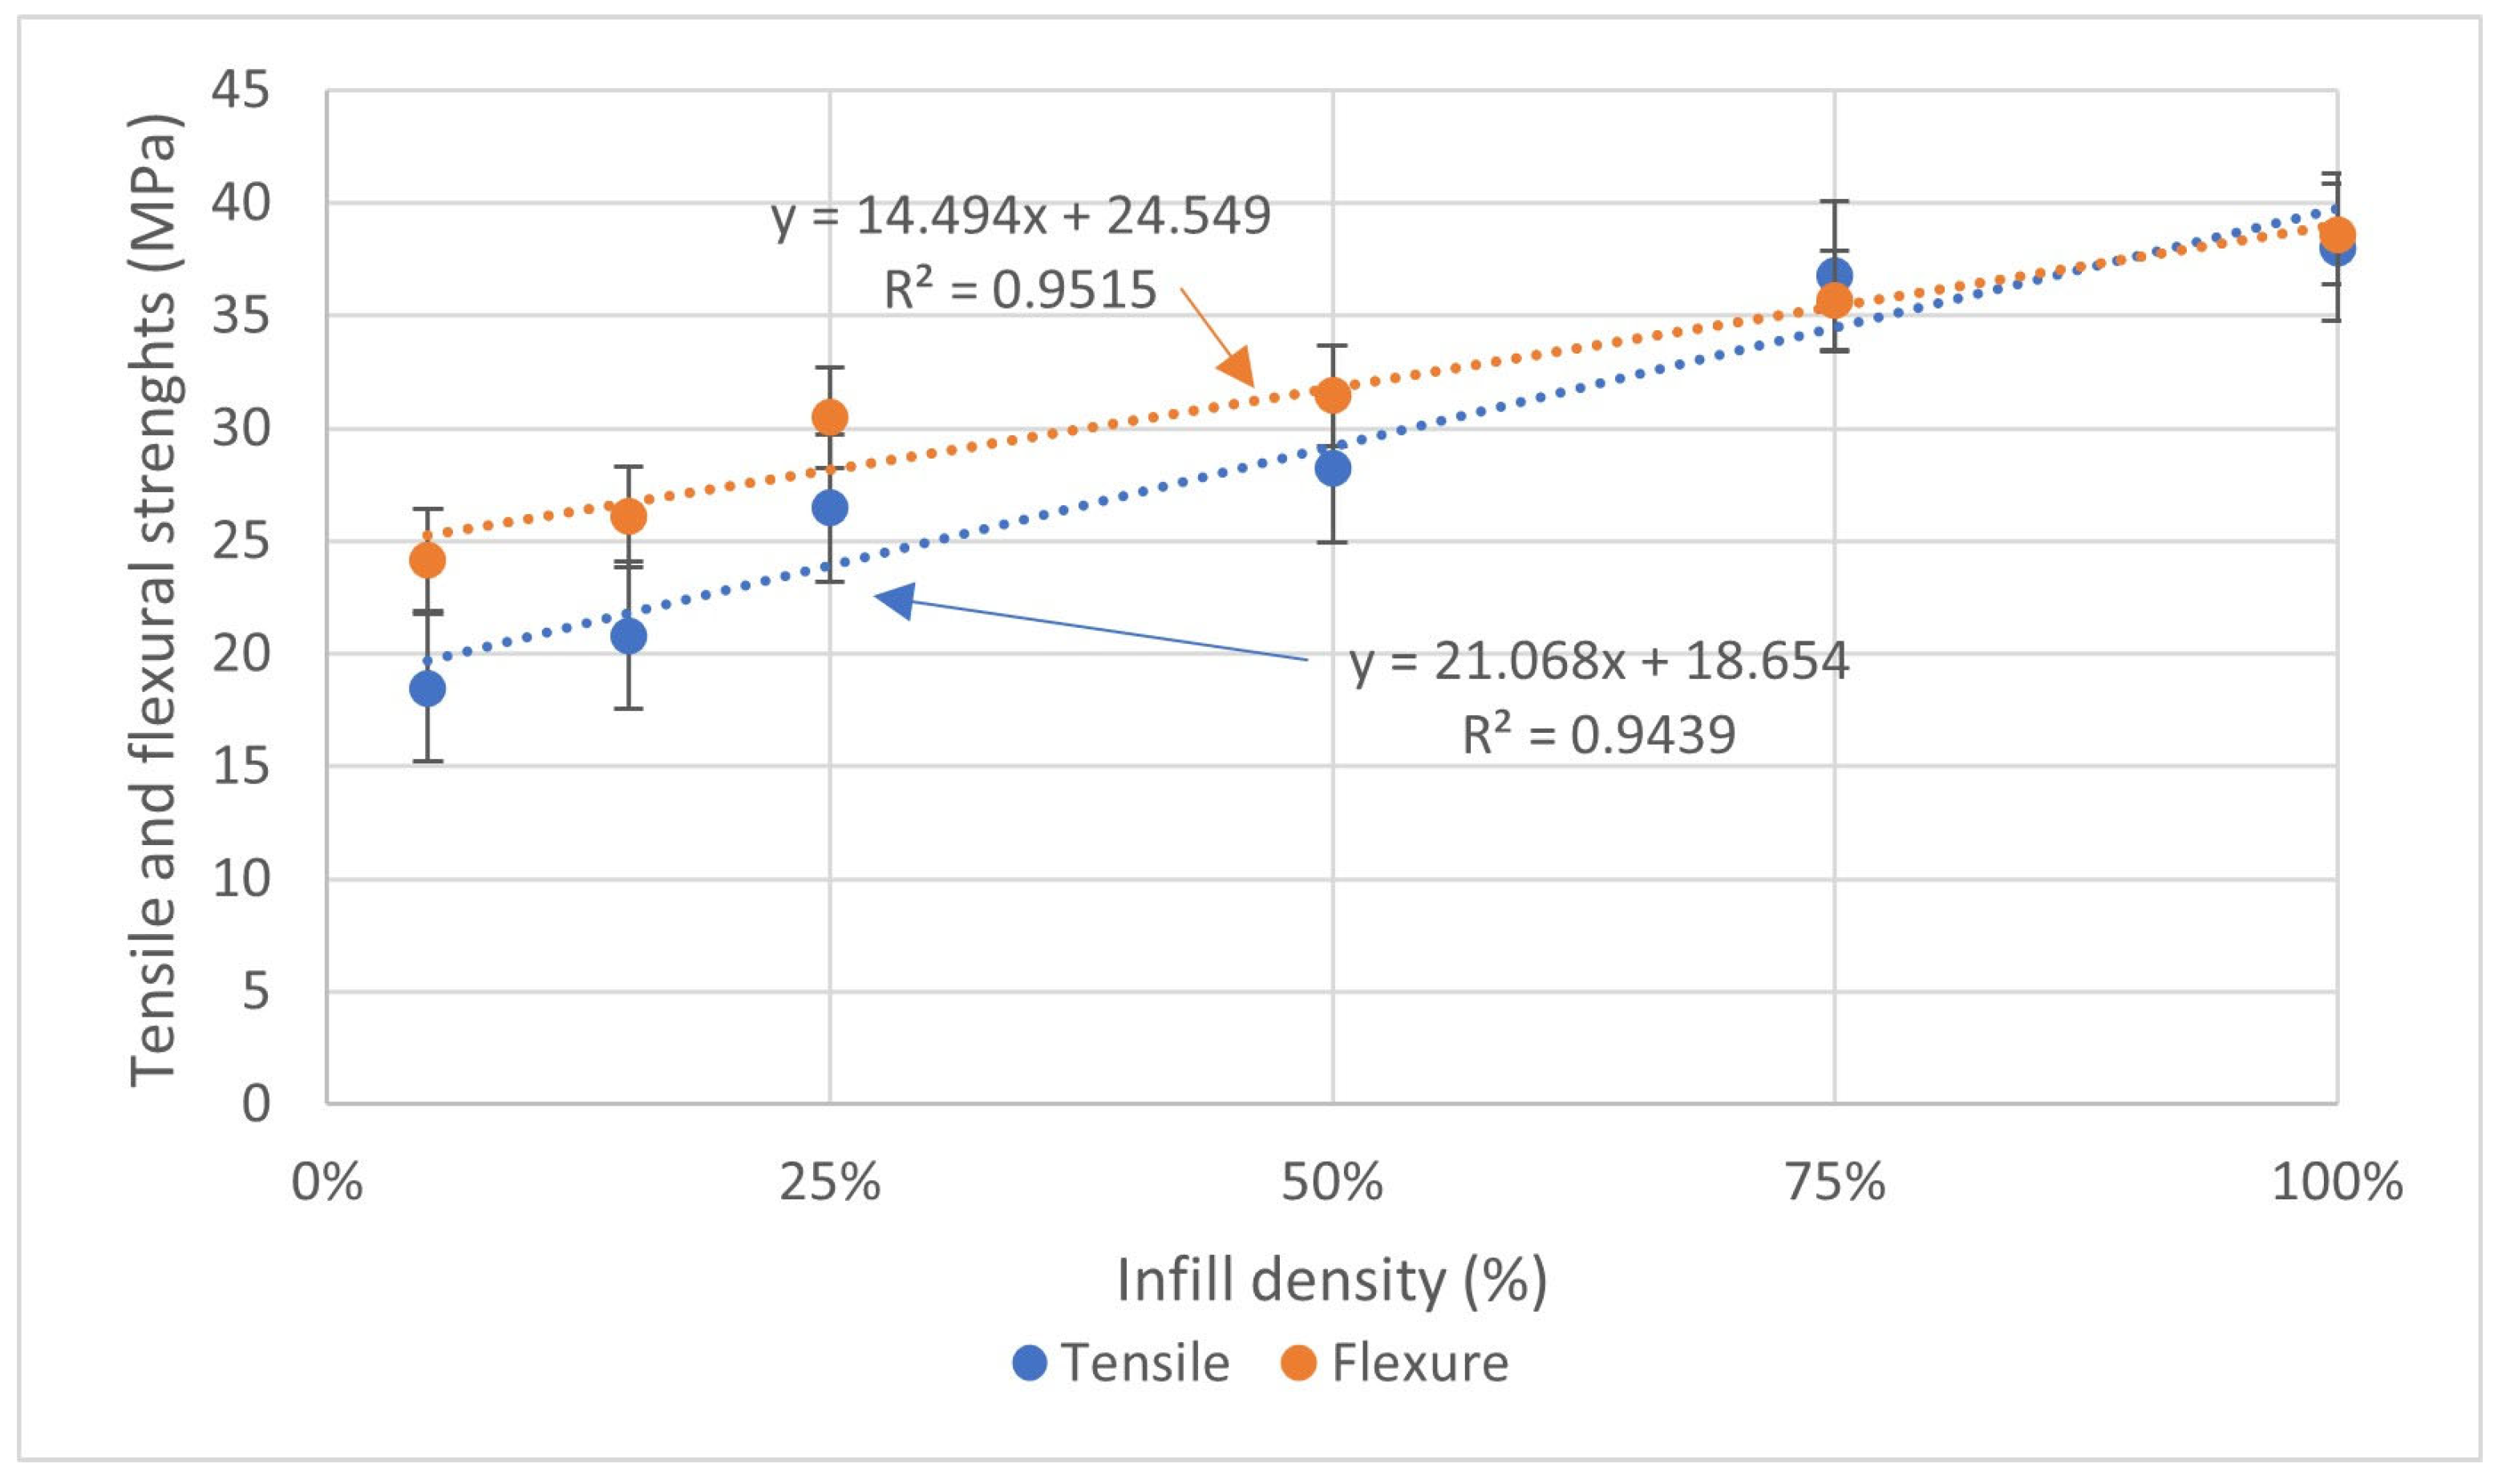
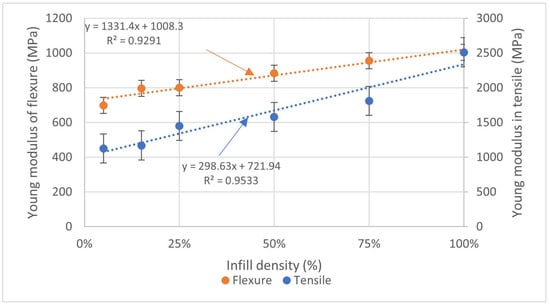
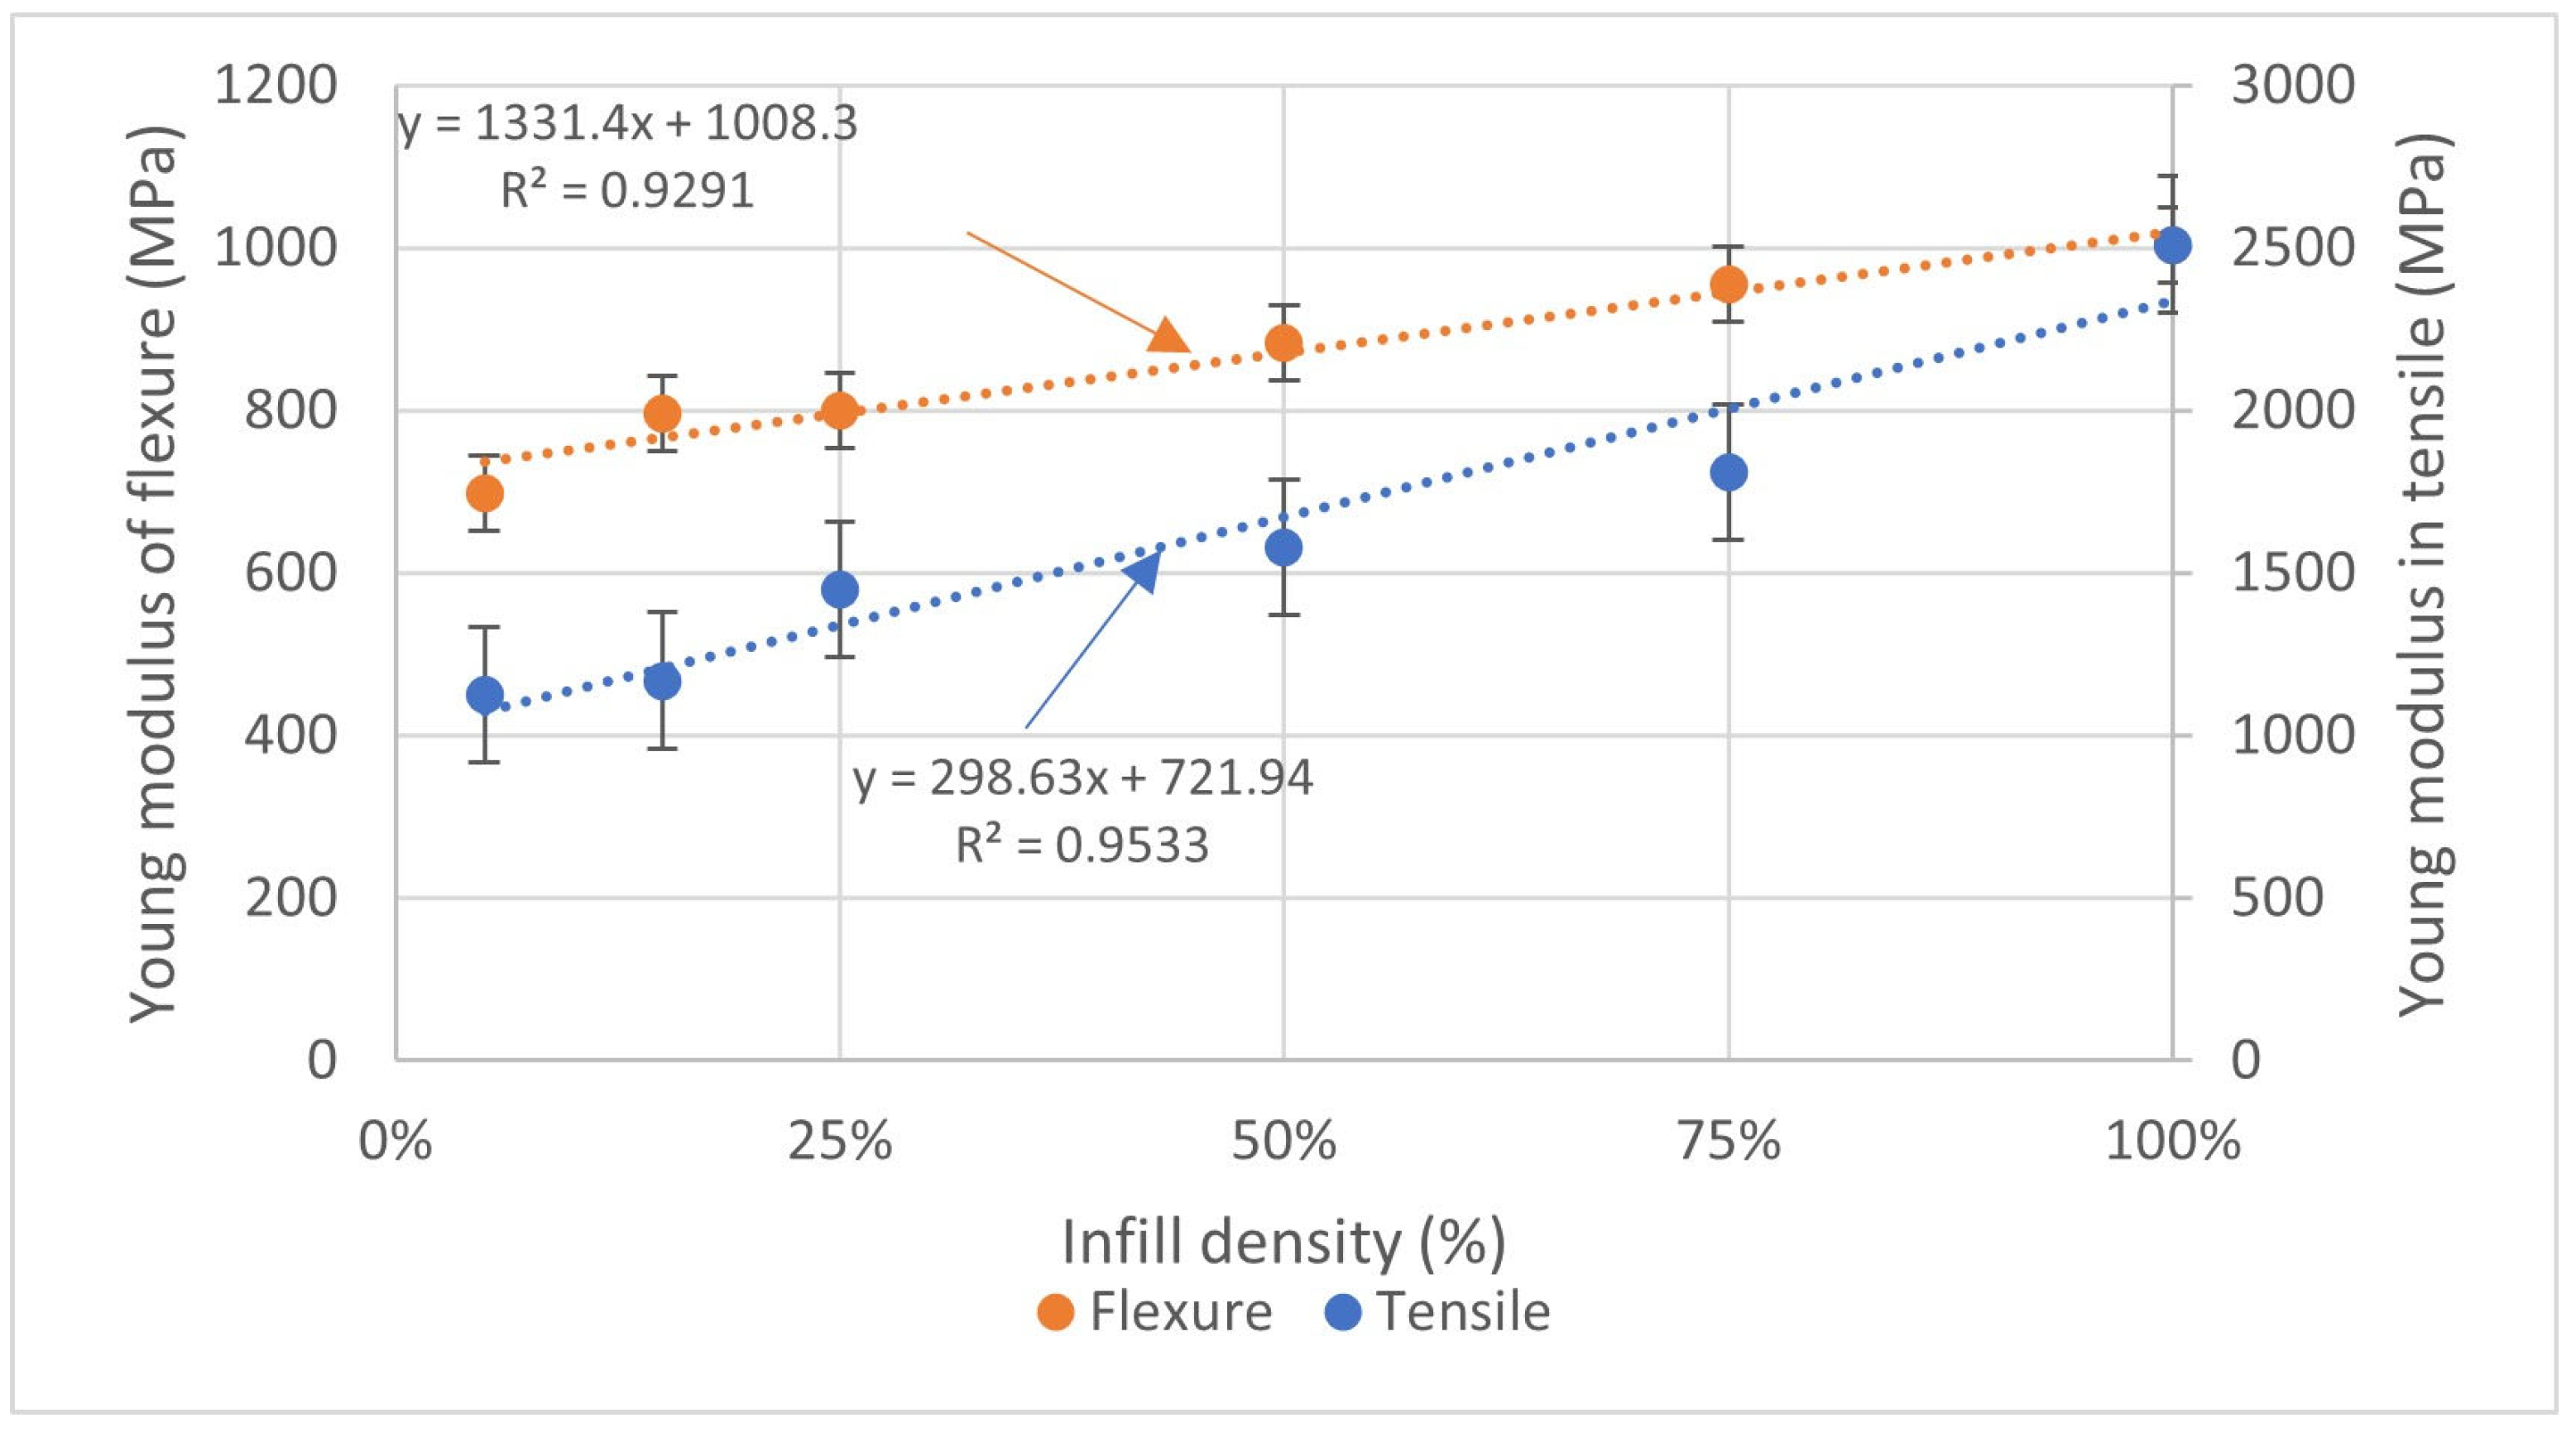
As shown in Figure 2 and Figure 3, the plots illustrate the variation of both apparent tensile strength and Young’s moduli mean values with sparse infill density for the PETG-based irregular honeycomb-like topology samples. These values are estimated from the force-displacement recordings from tensile and quasi-static 3-point bending tests. Irrespective of the mechanical property under consideration, differences between tensile and flexural values estimated at varying sparse infill densities can be observed. These discrepancies can be attributed to the specimen’s shape deployed for tensile runs, such as dog-bone geometry, as curved shapes are difficult to print with accuracy, resulting in stress concentration and failure near grips, as previously outlined.
Figure 2.
Tensile and flexural strength mean value variation with infill density.
Figure 3.
Tensile and flexural Young’s moduli mean value variation with infill density.
As Figure 2 illustrates, there is an evident correlation between strength variation and infill density, as determined by both tensile and flexural tests and one-way ANOVA analysis (p < 0.001). A closer investigation reveals that, irrespective of the mechanical testing method used, there are no significant differences in apparent strength values at higher sparse infill density values. Notably, PETG samples printed at 100% sparse infill density achieved an apparent tensile strength of approximately 38.5 MPa, which is in line with the values reported in the comparison study by Algarni et al. [4] (2021), with the proviso that there are differences in processing parameters. These findings suggest that the issue of minimizing mass becomes possible as the mechanical performances are not compromised as sparse infill density exceeds 75%. In addition, differences between tensile and flexural strength values, particularly at lower sparse infill density values (<50%), can be regarded as a geometric inadequacy, as previously mentioned.
As pictured in Figure 3, elastic moduli values, determined from both traction and flexural tests, increase with sparse infill density of printed specimens. This correlation is statistically significant (p < 0.001), as indicated by a one-way ANOVA analysis. Further, within the 50% to 100% sparse infill density range, there is no considerable increase in elastic moduli from either tensile or flexure runs, as evidenced by comparing the values retrieved at 5% and 100%. Further insights, naturally following inquiries on trend lines, especially related to R-square values, may point to a non-linear increase in elastic moduli with infill density values up to 50%, in line with the findings of Auffray et al. [9] (2022) for PLA-printed specimens, including honeycomb-like topologies. The findings underline the indirect impact of mass on mechanical performance for load-bearing applications in the automotive industry, along with the use of irregular honeycomb-like topology selection.
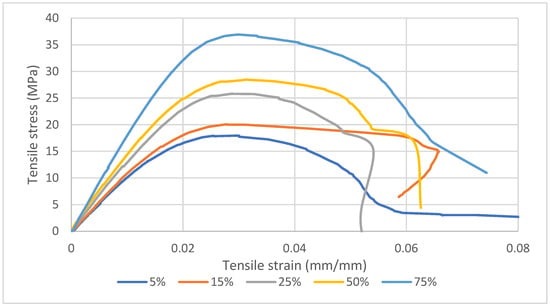
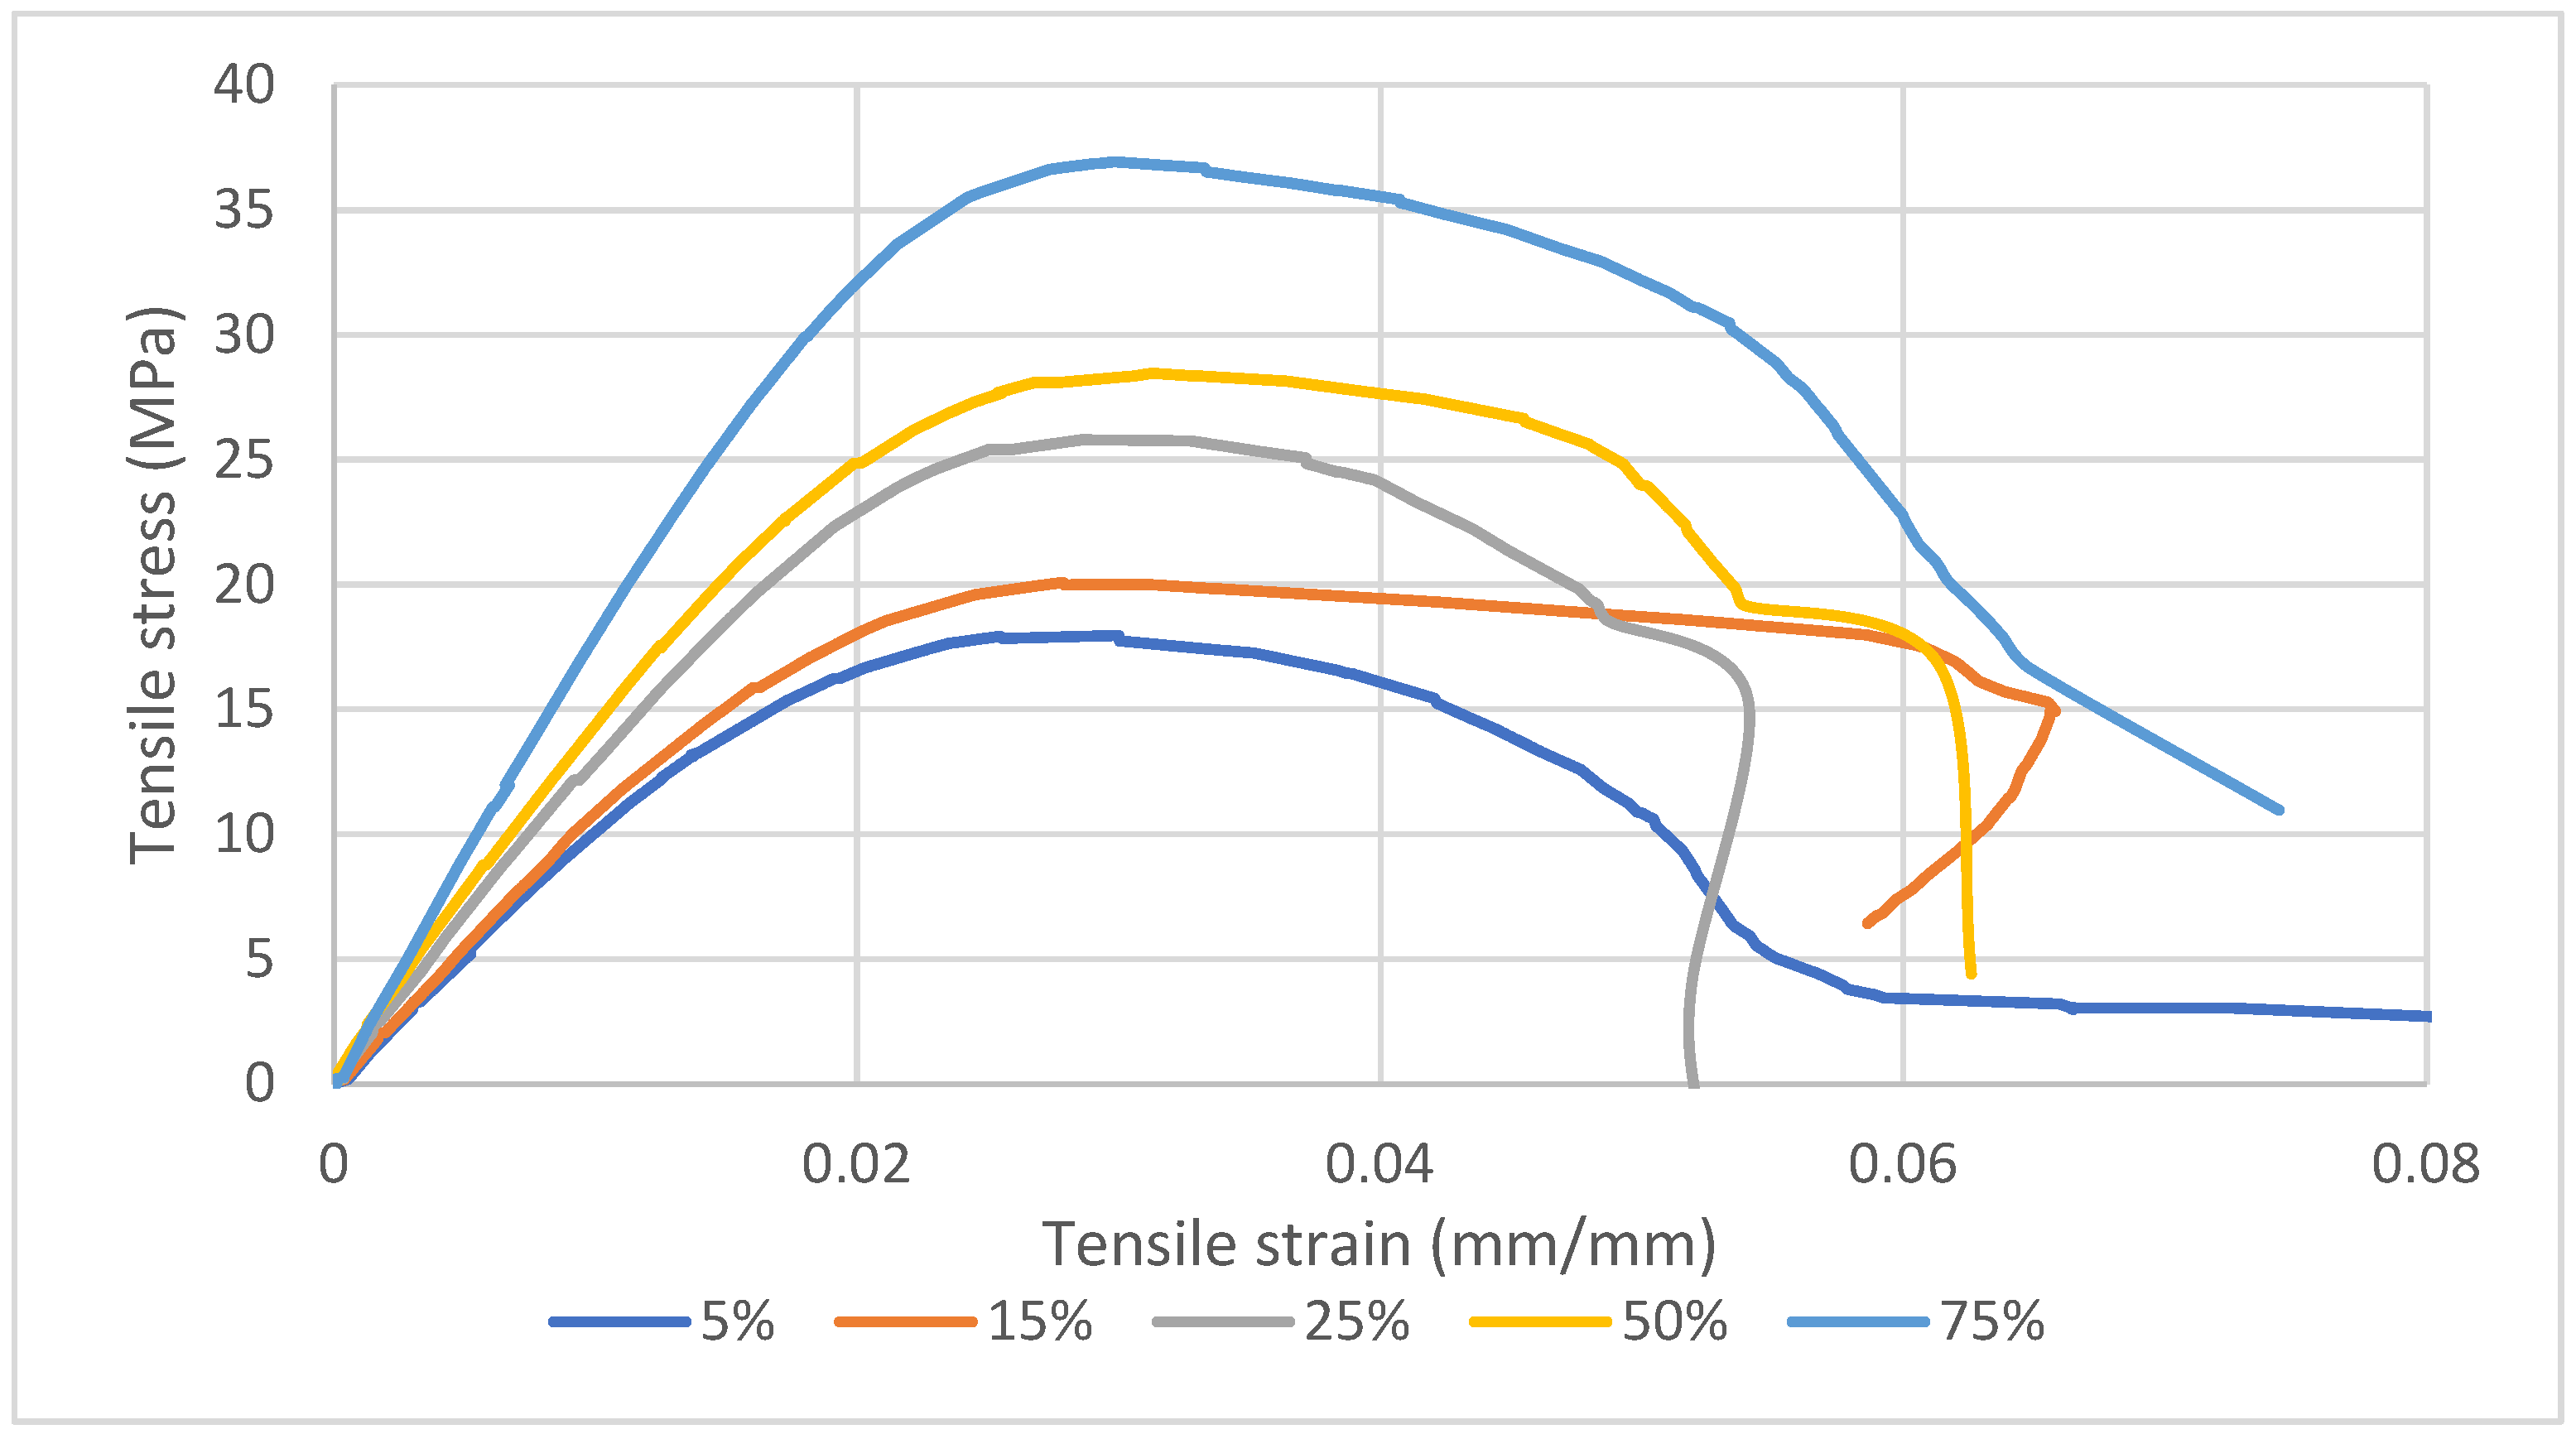
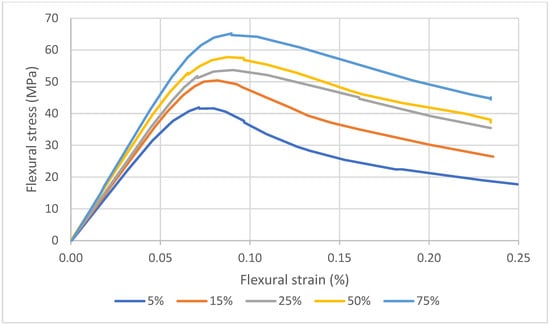
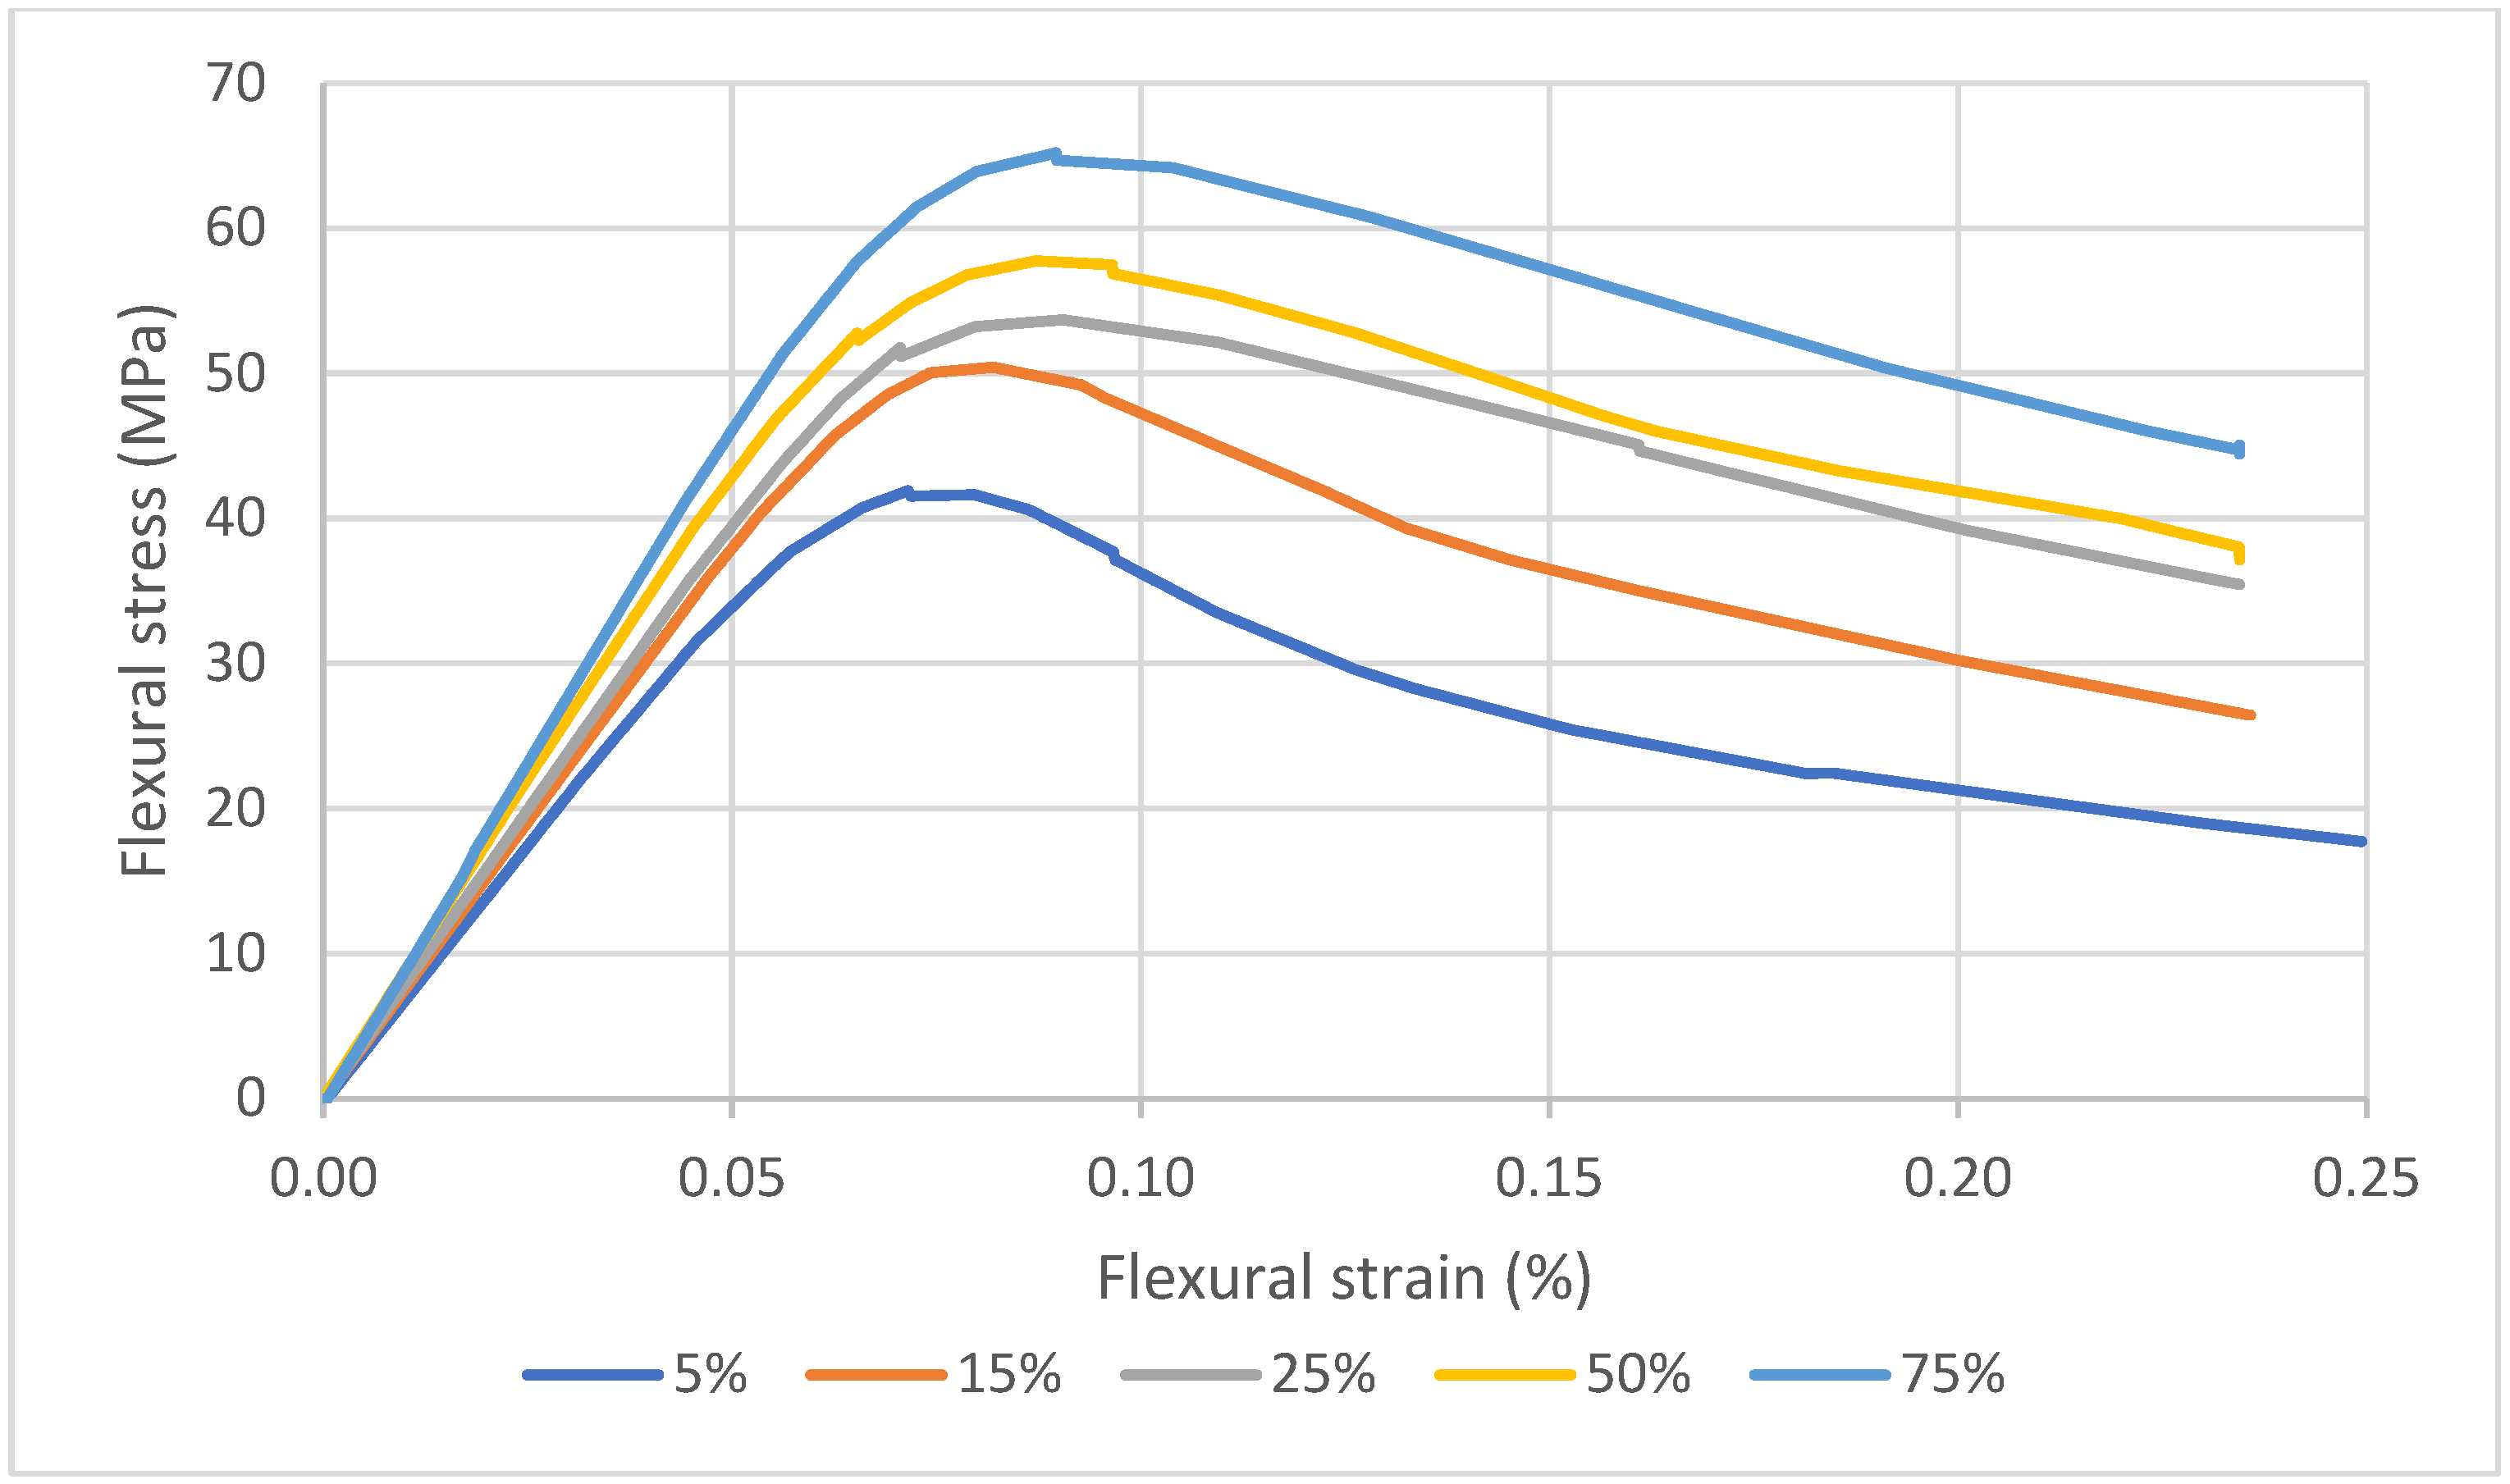
Additionally, Figure 4 and Figure 5 were included as excerpts from experimental records of stress/strain dependencies from both tensile and flexural tests accounting for various sparse infill densities. As shown in Figure 4, specimens with lower sparse infill densities (5%, 15% and 75%, respectively) exhibit the greatest elongation at break under tensile loading, whereas the specimens with 25% and 50% infill display a shoulder prior to their final fracture. This behavior may be associated with progressive failure of the internal structure or temporary load redistribution between the infill and outer contours. Furthermore, all curves display a linear increase up to a maximum, in accordance with linear elastic behavior, followed by a non-linear visco-plastic region. It should be noted that these curves do not capture the fracture of the specimen’s outer contours as individual peaks, as might be foreseen, probably due to the strain rate considered in the study.
Figure 4.
Tensile stress vs. strain recorded for various sparse infill density values.
Figure 5.
Flexural stress vs. strain recorded for various infill density values.
3.3. Charpy Impact Properties
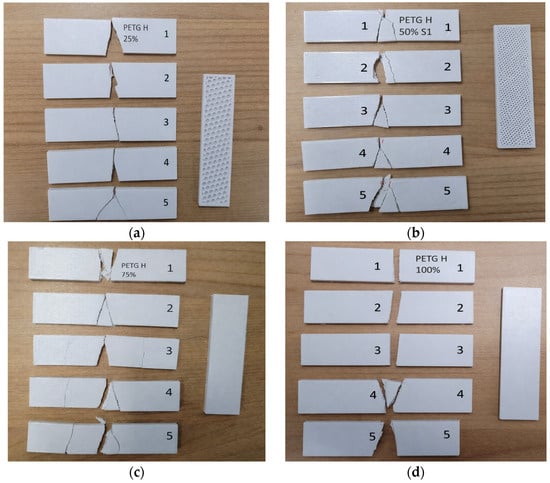
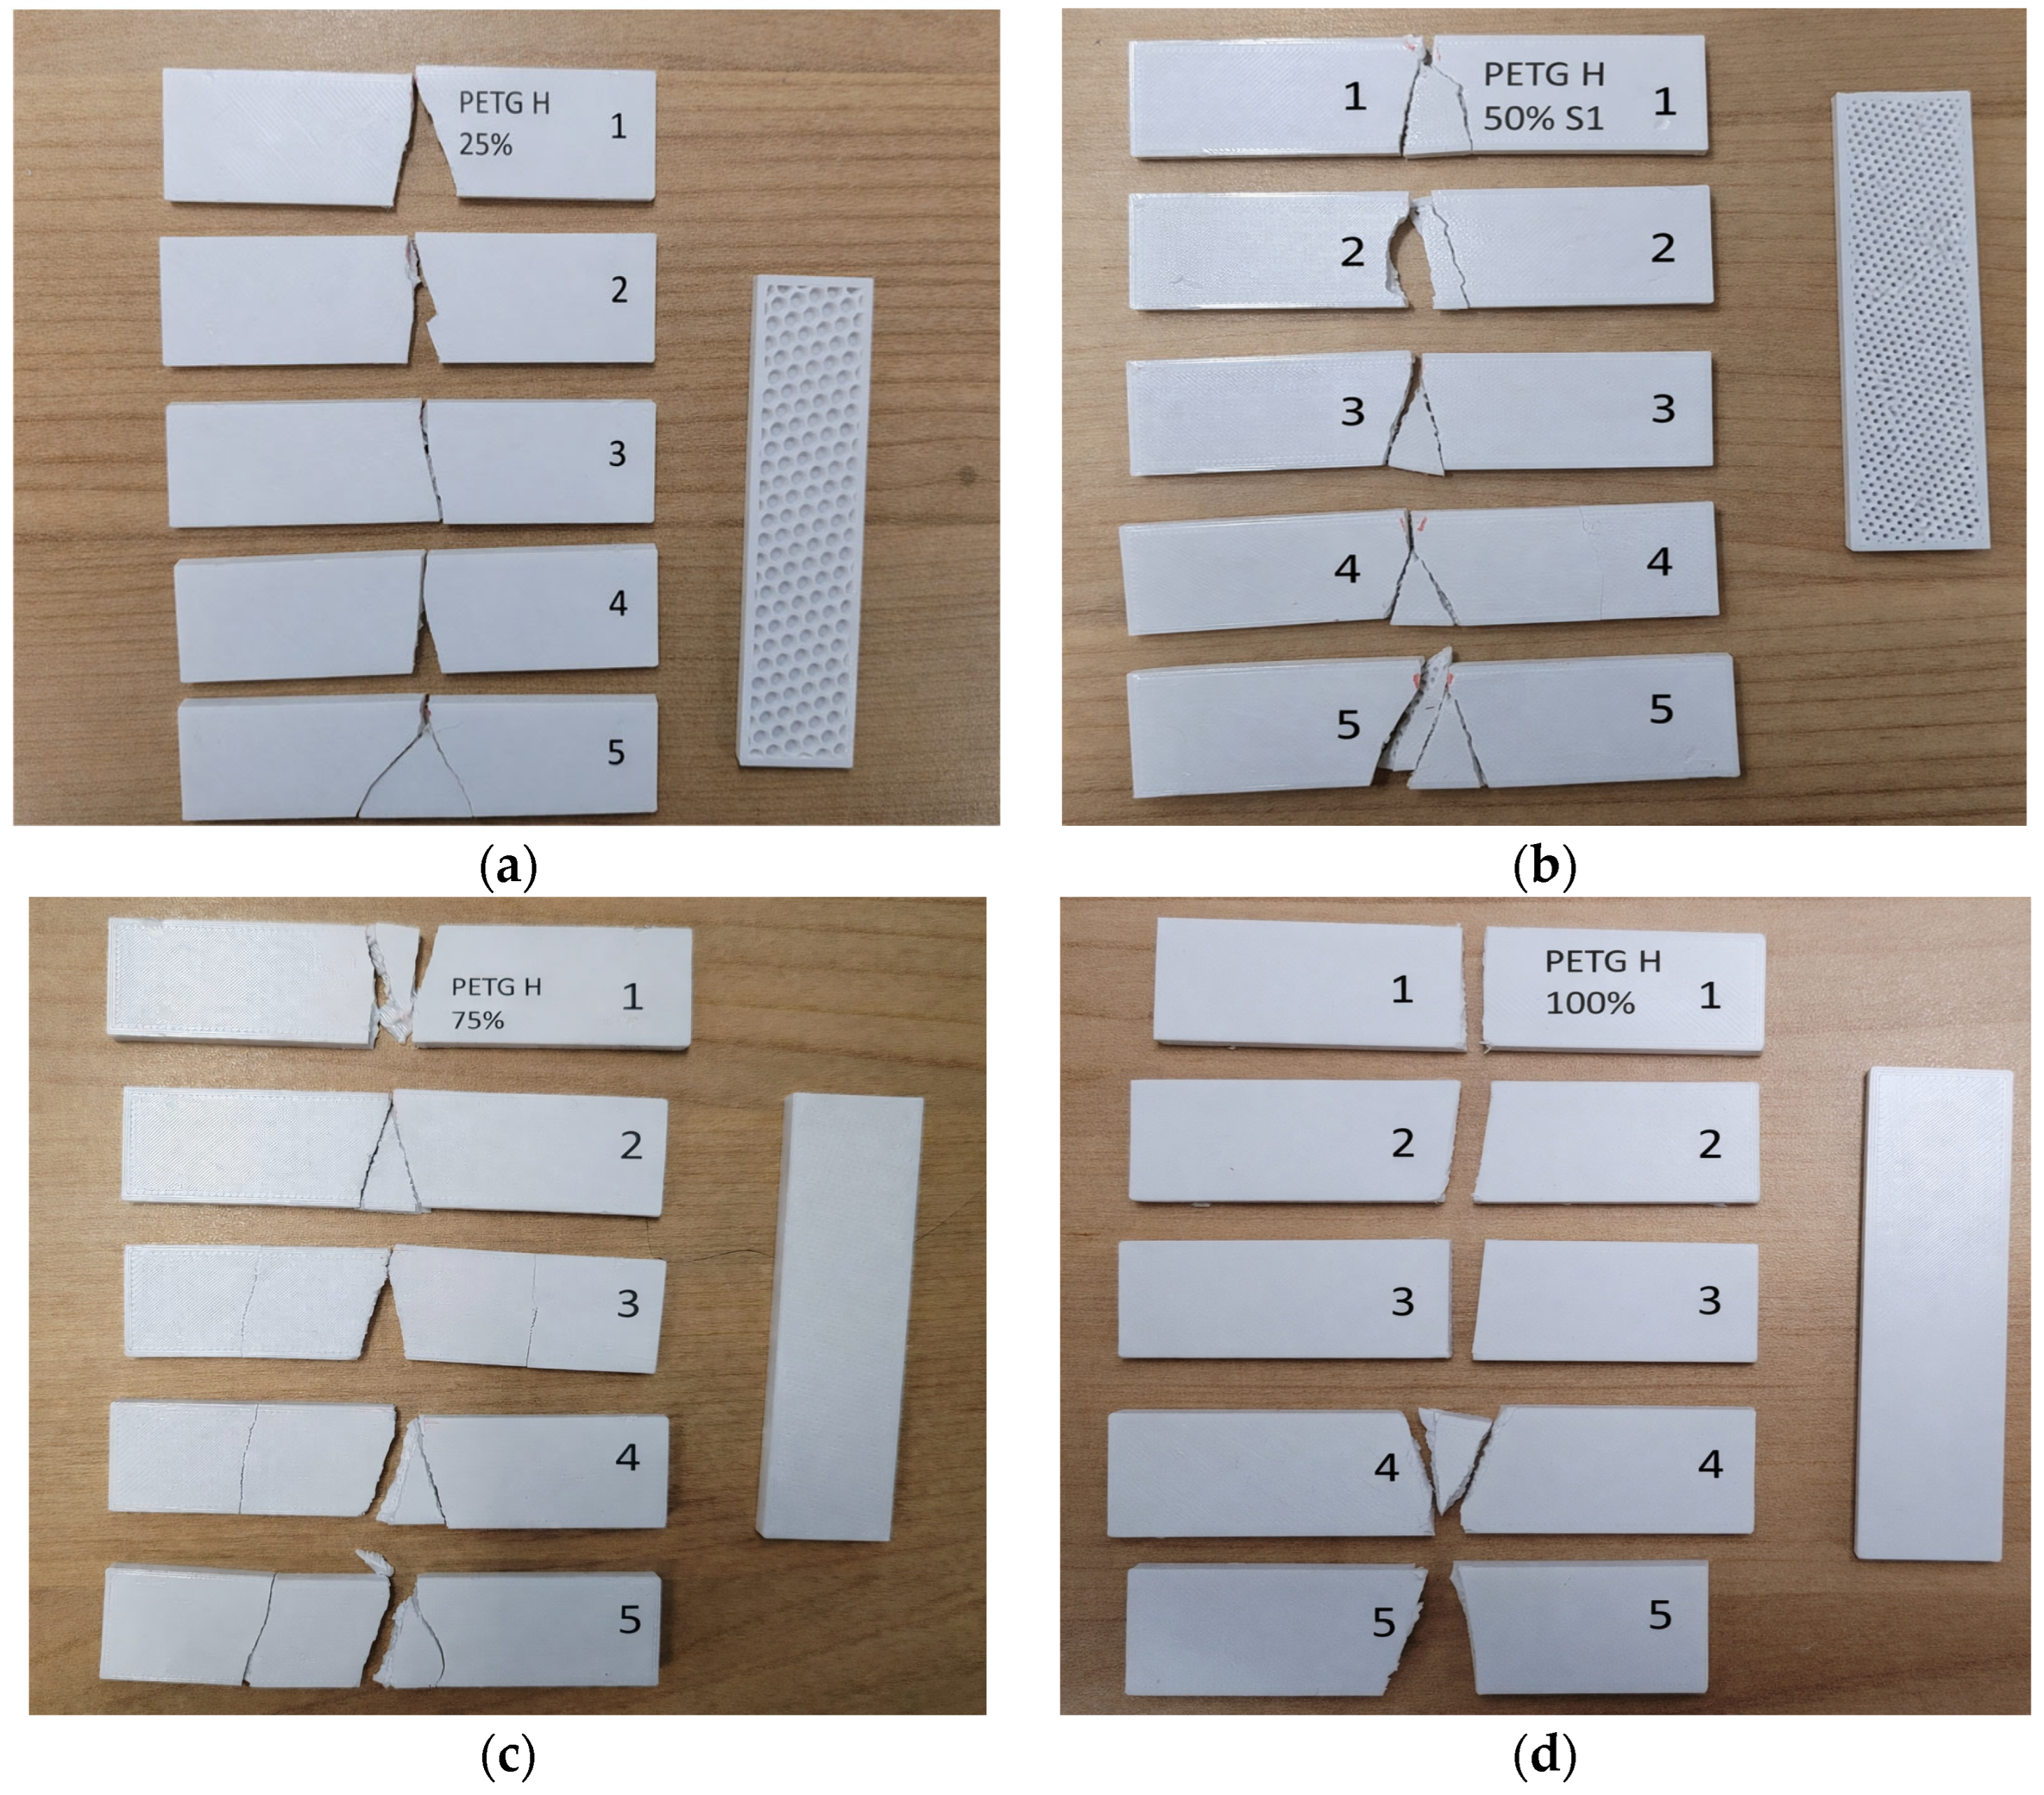
Charpy post-impact specimens’ fracture patterns are outlined in Figure 6. PETG’s brittleness fracture mode is revealed by irregularities and split parts due to a combination of factors. Generally, the following factors should be considered: samples’ geometry (e.g., notched/unnotched), process parameters (e.g., pattern, density, printing speed, nozzle temperature, etc.), part orientation, environment, etc. [14]. As the study primarily focused on the mechanical performance of FFF-printed PETG-based irregular honeycomb-like topology samples with different infill densities under specified conditions, no further influences were considered. The color of filament batches used for Charpy specimens differed from that of filament batches used for other mechanical tests. While sparse infill density comparisons within each test type remain unaffected by this, as all specimens within a given test series were printed from the same batch, no control test was performed to isolate a possible color effect on absolute mechanical values, as reported for PLA by Frunzaverde et al. [44].
Figure 6.
Fracture propagation of PETG parts post-Charpy tests with sparse infill density: (a) 25%; (b) 50%; (c) 75%; (d) 100%.
Next, irrespective of infill density value, PETG-based irregular honeycomb-like topology samples reveal simple to complex fracture morphologies, including inclined and branched crack paths. Samples display signs of localized fractures, indicating constrained energy dissipation. It is interesting to note that samples filled at 75% display variability in the crack propagation paths, which may be viewed as loss of the dominant load-carrying path. Differences among the specimens’ fracture paths may be attributed to local printing heterogeneities caused by deposition fluctuations, void formation and nonuniform interlayer bonding [45].
From the perspective of vehicle component under-impact behavior design, fracture behavior is of the greatest importance. Although controlled cracking, crushing, delamination and cell collapse are preferable for applications that aim to protect occupants or critical systems, PETG-based, irregular, honeycomb-like topologies show promise for non-structural, sacrificial interior components.
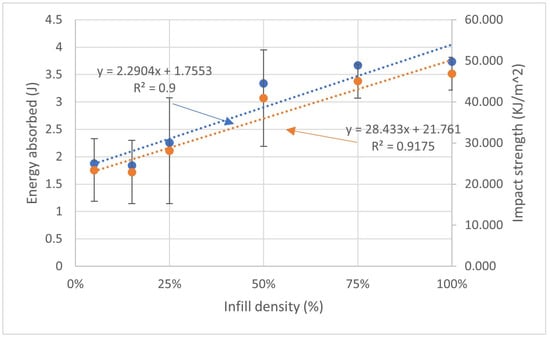
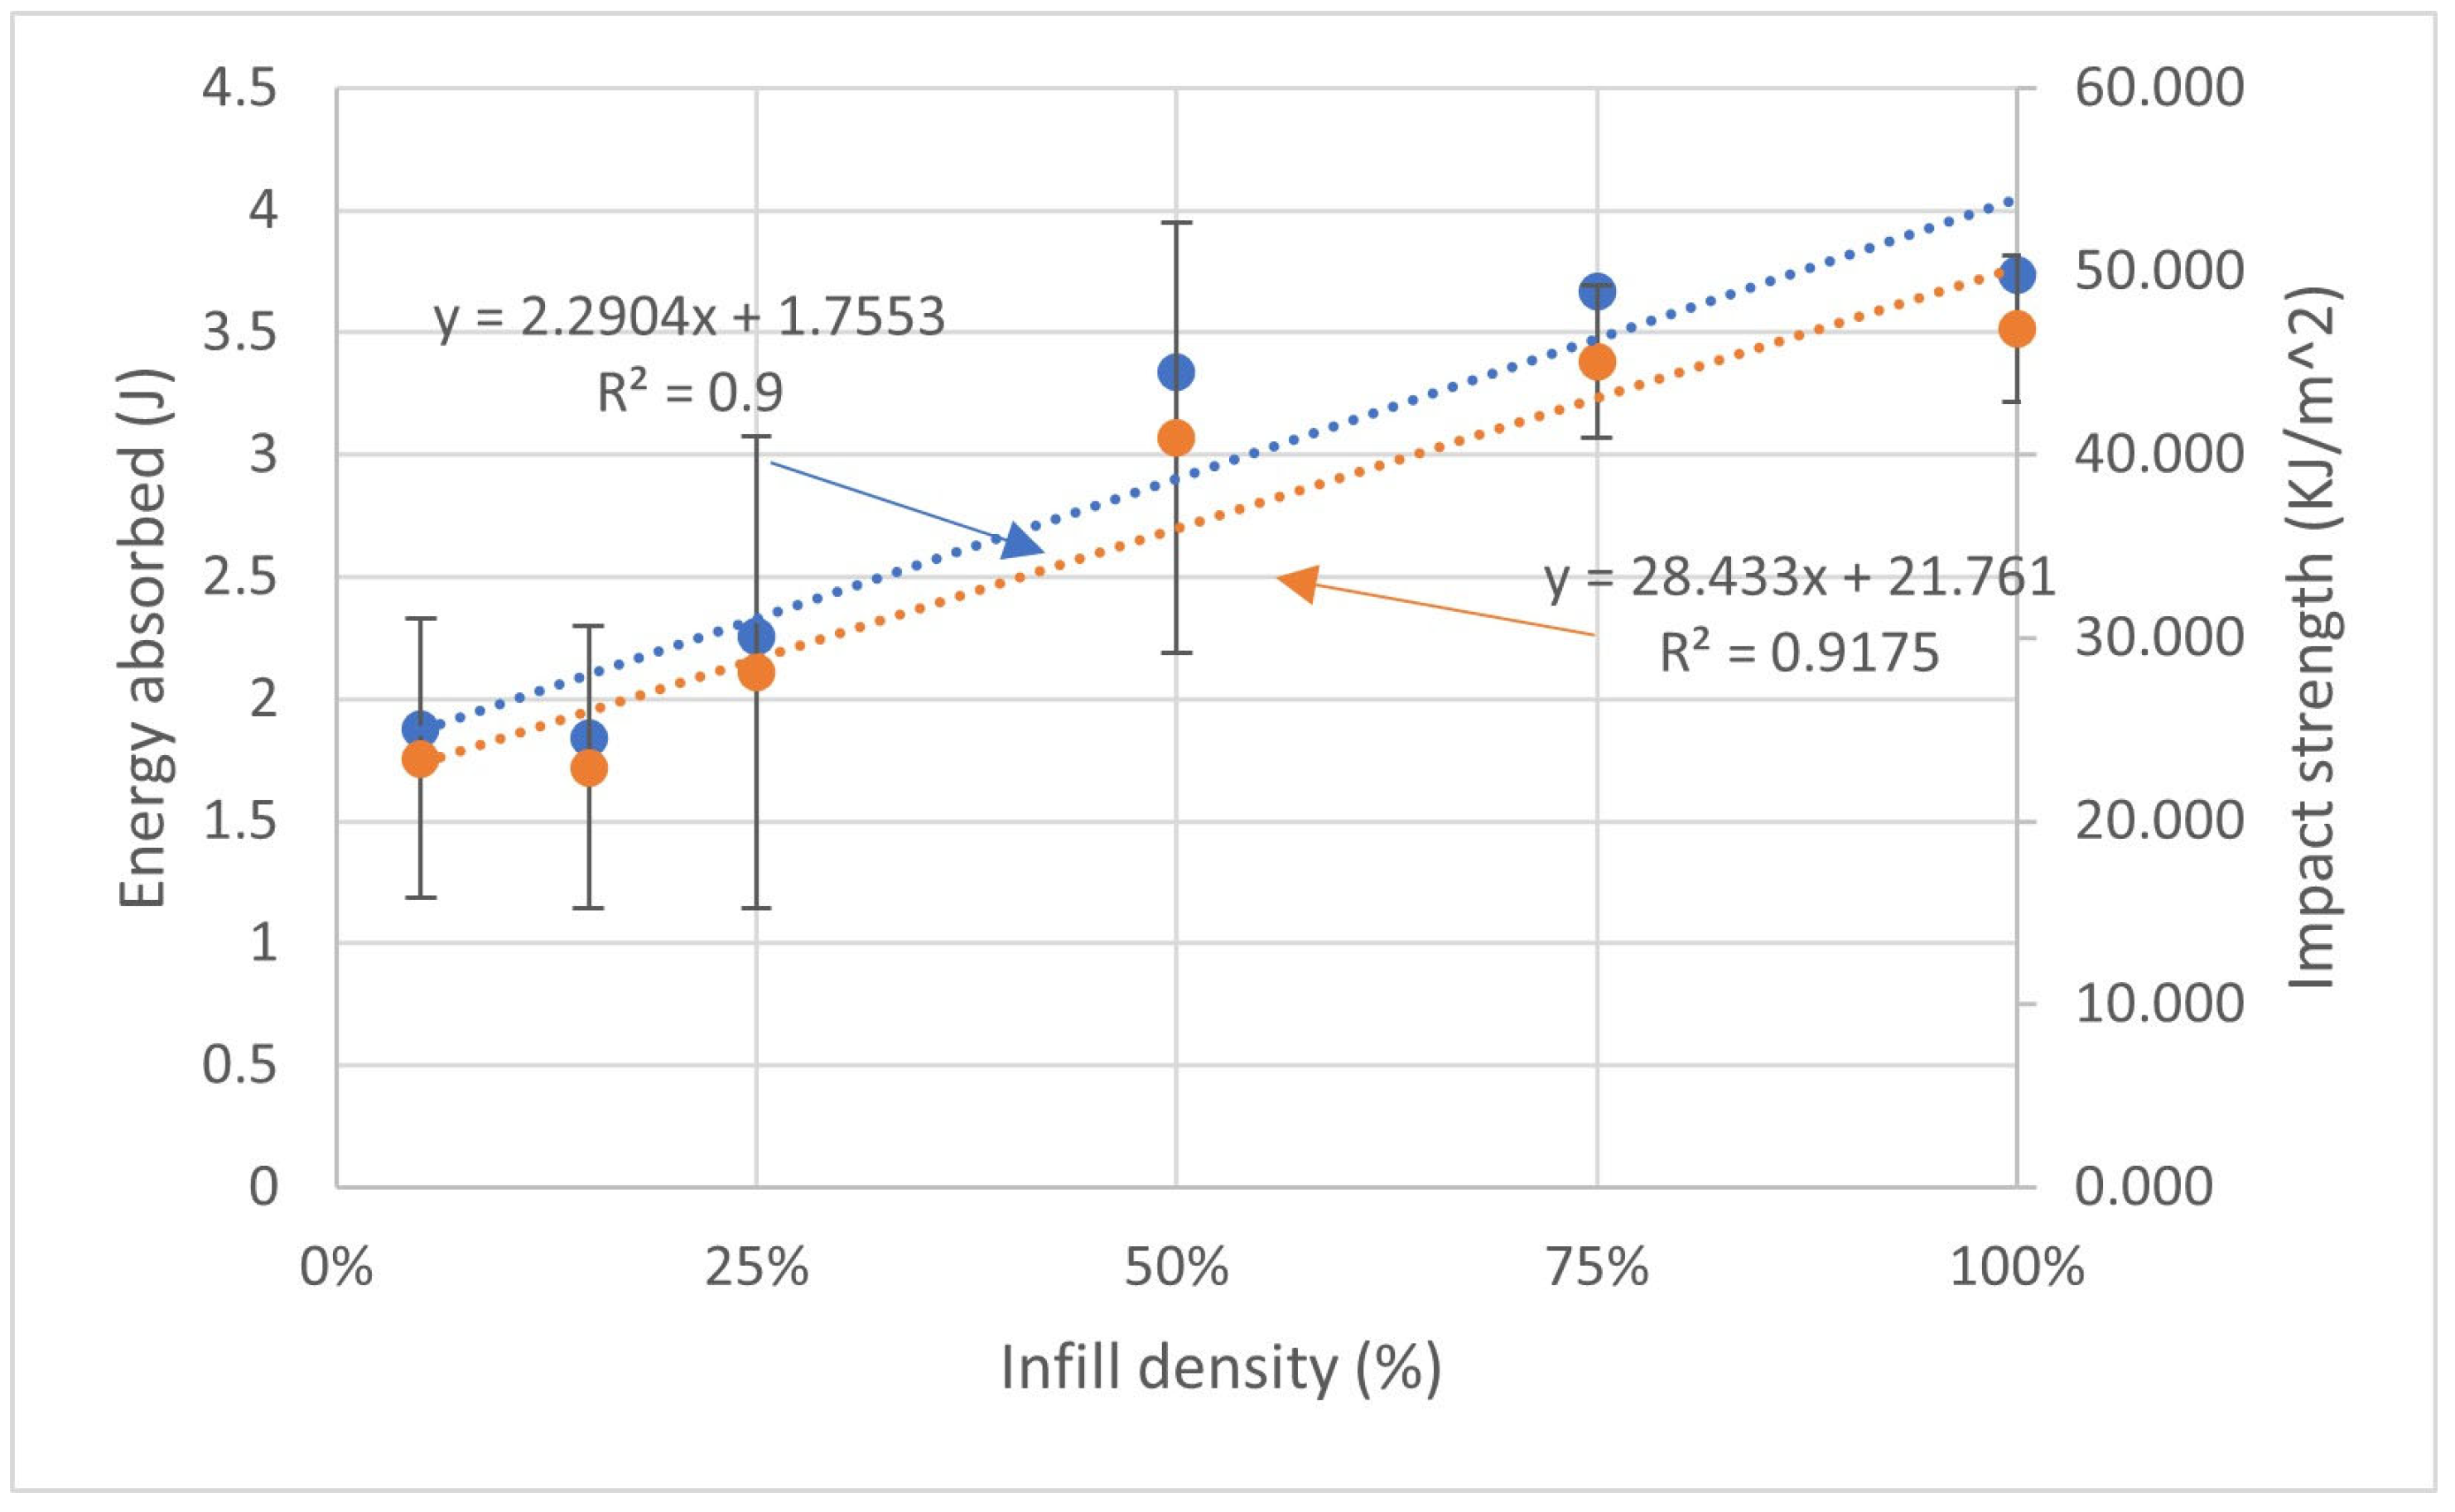
Figure 7 shows that the Charpy absorbed energy exhibits a monotonic architecture effect for sparse infill densities within the 5% to 50% range, and it reveals a decrease from a maximum value of 4.5 J at 75% to 3.7 J at 100%. This tendency shows that maximum infill density does not necessarily lead to maximum impact energy absorption. However, the higher infill specimens exhibit a more consistent fracture pattern, dissipating approximately 25% of the available 15 J of energy before complete fracture occurs, as will be detailed subsequently. Furthermore, the data statistics reveal coefficients of variation of 9.18% and 8.41% at 75% and 100%, respectively. The regression linear models for both measured absorbed energy data and estimated impact strength indicate R-squared (R2) values of about 0.9, which can be accepted as reliable predictions of the experimental outcomes.
Figure 7.
Impact energy absorbed and impact strength dependence with selected infill densities.
Table 5 lists the apparent specific energy absorption (SEA, J/g) values for each infill group. Since the mass variation within an infill group is very low, approx. 1% and lower (see values reported in Table 1), SEA values mainly reflect the physics of fracture. The reported mean values indicate a maximum of 0.516 (J/g) at 50%, followed by a decrease at higher honeycomb-like topology infill densities. This highlights that efficient energy absorption can be achieved at lower mass values. Next, the energy-utilization ratio is reported, defined as
where EA is the energy absorbed by the specimen during impact, in J, and represents the nominal available energy of the Charpy pendulum (e.g., 15 J), in J, and expresses the available energy dissipated during the fracture of the tested specimen. If expressed as %, the values indicate that irregular honeycomb-like topologies of various infill densities use approximately 12.5–25% of the nominal pendulum energy during complete fracture.
Table 5.
Impact performance parameters derived from Charpy tests.
Nevertheless, sparse infill densities of less than 50%—usually aimed at reducing design and manufacturing costs—have been found to both decrease impact strength and result in relatively high variability of measured data about their mean.
Despite a cleaner fracture line at 25% infill (see Figure 6a) than for remaining infills, which show a more irregular path with fragmentation (see Figure 6b–d), this points towards crack-path dominance in data scattering rather than sample geometry or mass variability. Corroborating the relatively low energy utilization ratios, together with complete sample separation, indicates that the unnotched samples predominantly remain within a bending fracture regime.
Elevated coefficients of variation should be noted for 25% infill specimens (see Table 5), which can be attributed to their irregular, honeycomb-like topology. This suggests that local wall density and connectivity in the vicinity of notch roots can vary. Although this does not undermine overall density-dependent trends observed across the tested range, individual results at intermediate infill densities demand appropriate caution.
3.4. Drop-Weight Impact Tests
All PETG-based irregular honeycomb-type structures were tested at an incident energy of 6.2 J, equivalent to a low-impact velocity of 1.5 m∙s−1—corresponding to a local strain rate on the order of 10–102 s−1. As PETG exhibits rate-dependent mechanical behavior [46], it should be noted that local strain rates are several orders of magnitude higher than nominal strain rates in tensile and flexural tests (approximately 2 × 10⁻⁴ s−1 and 2 × 10⁻³ s−1, respectively).
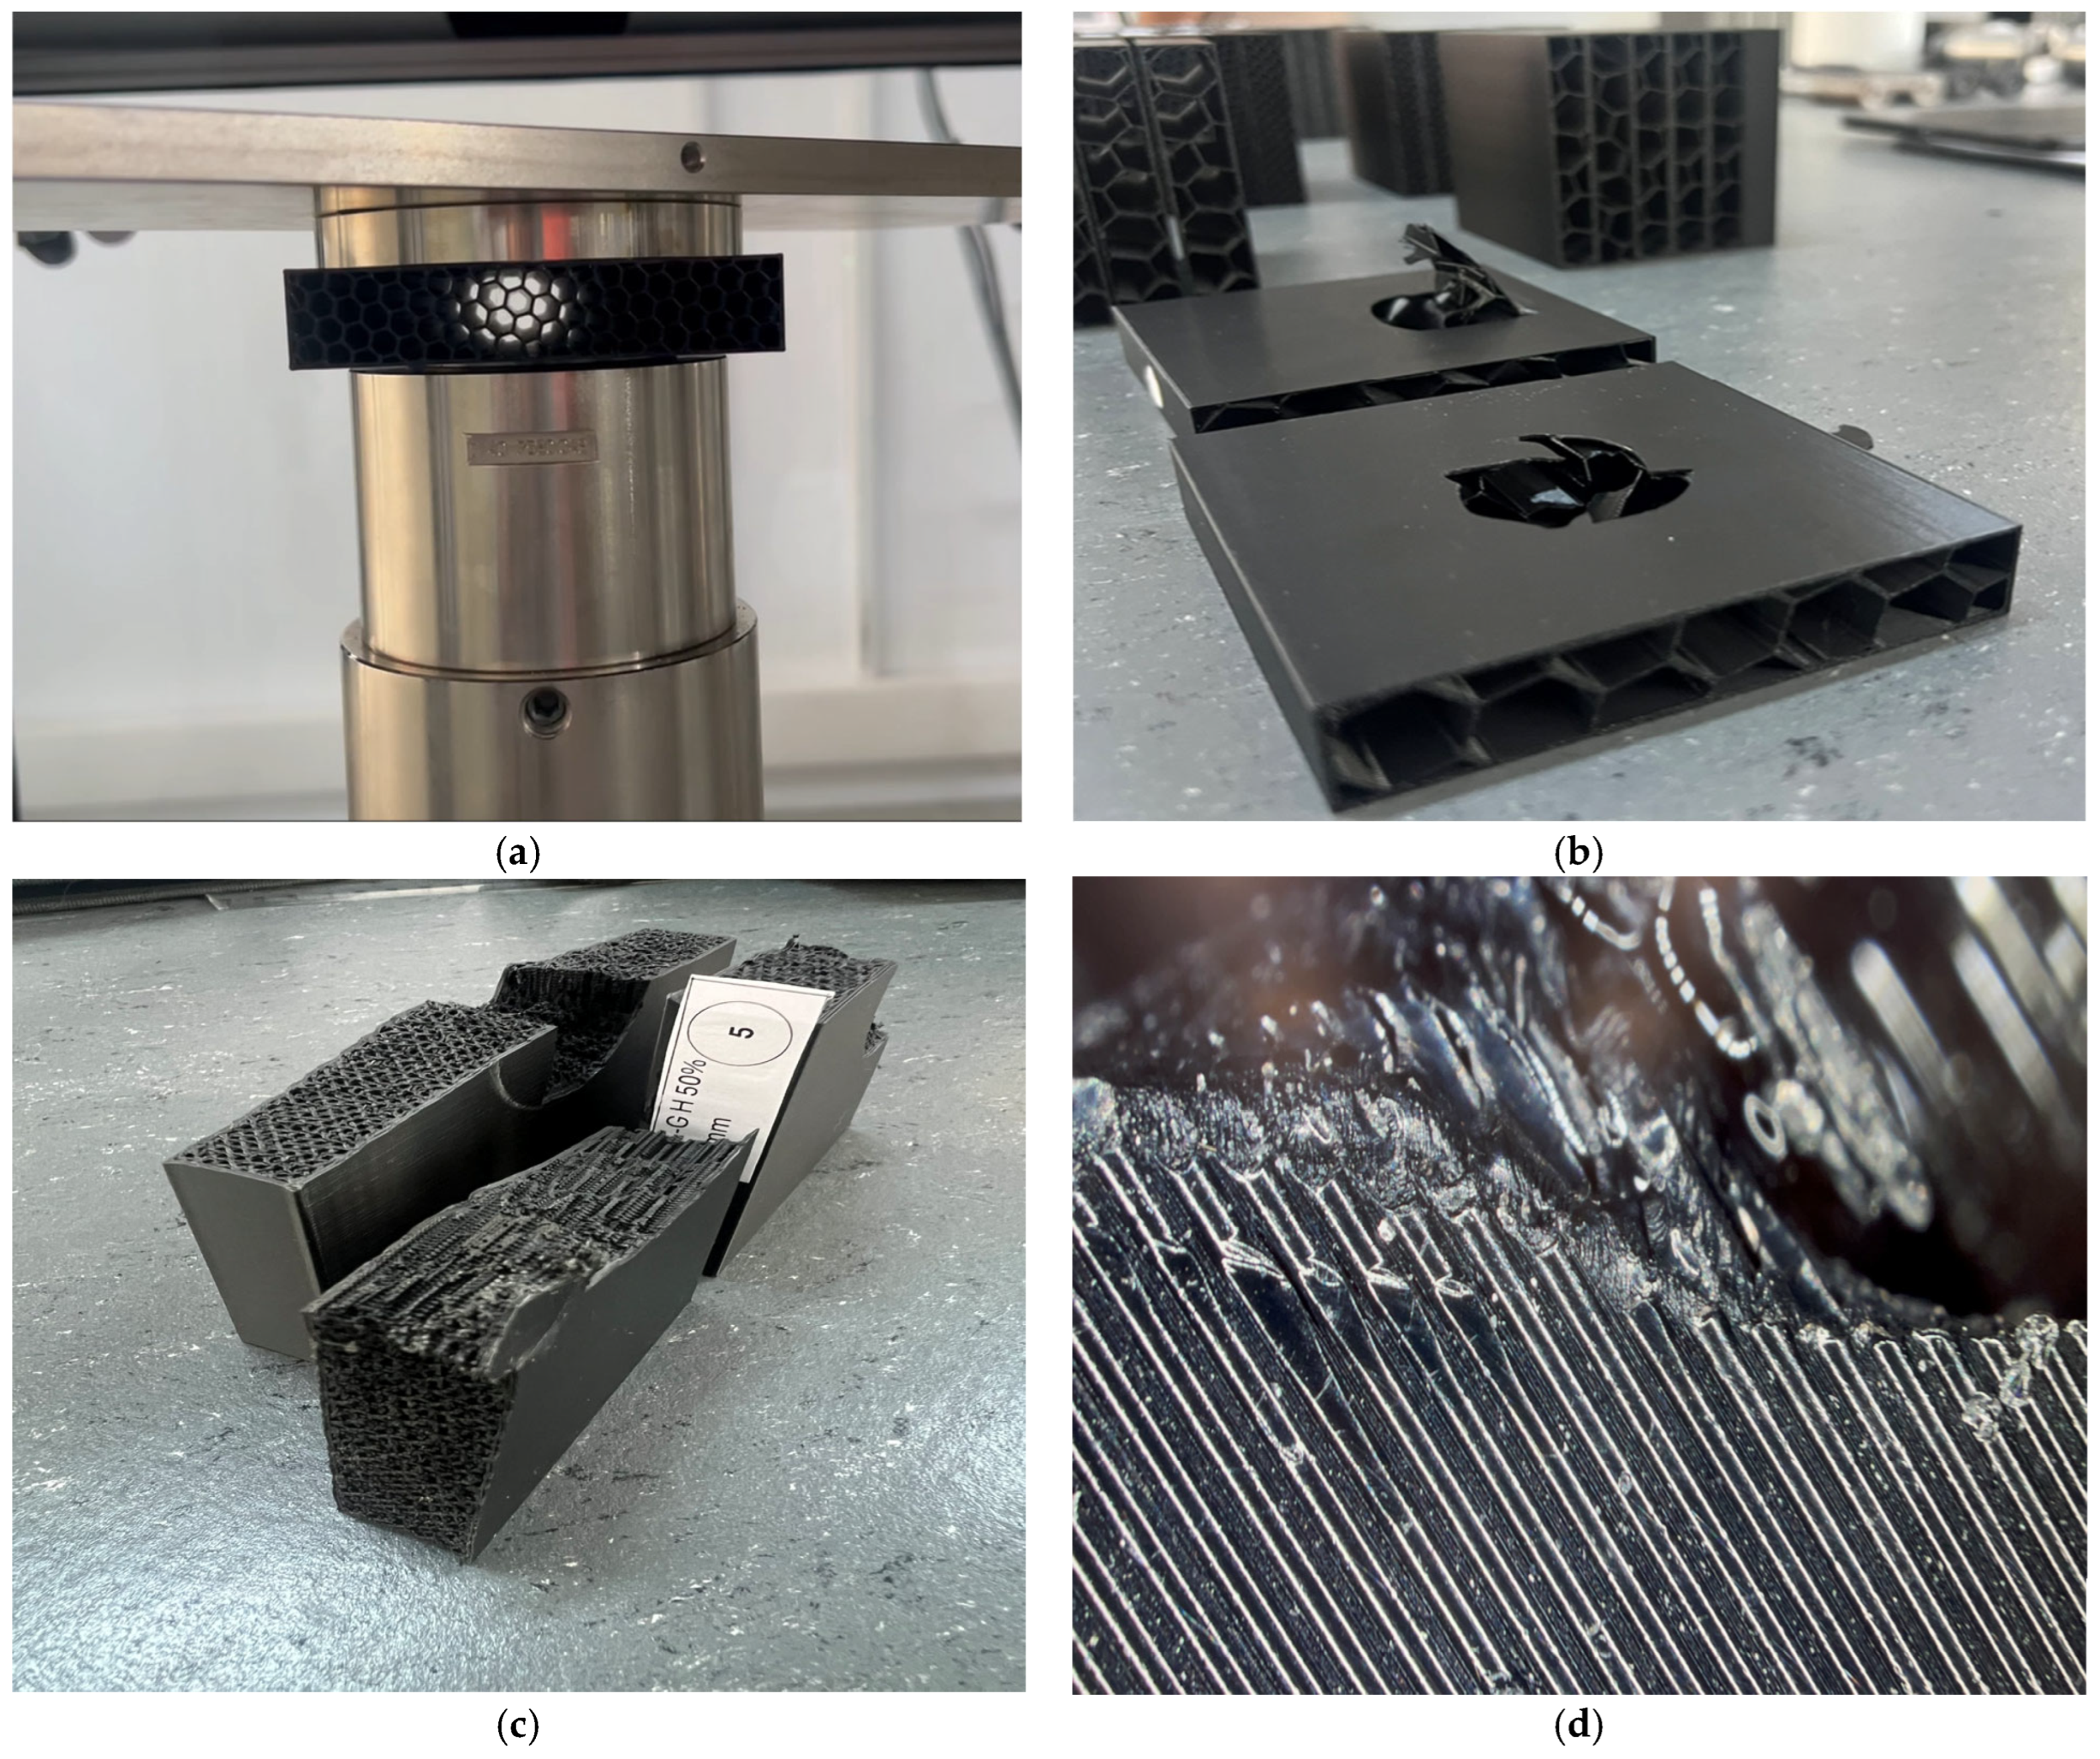
Figure 8 shows the 25% infill sample positioned on the experimental device support (a), as well as the upper and lower portions of the 15% infill sample after the crushing test (b). Direct observation of the fracture cross-section (see Figure 8c) indicates that the load path is consistent with a progressive, wall-by-wall collapse mechanism rather than a single brittle fracture plane. Individual cell walls in the vicinity of the fracture show clear evidence of local buckling and breaking, rather than uniform, simultaneous failure across the section. Figure 8d shows a magnified view of the region adjacent to the fracture in the same 50% infill sample. Notably, regularly spaced raster lines, characteristic of FFF deposition, transition into a fractured, fibrillated surface texture immediately alongside the fracture boundary.
Figure 8.
(a) A 25% infilled sample layout on experimental device support; (b) 15% infilled sample after the crushing test; (c) fracture cross-section of a 50% infill sample displaying localized buckling and damaged cell walls; (d) digital optical microscopy detail of the fracture-adjacent region in a 50% infill sample.
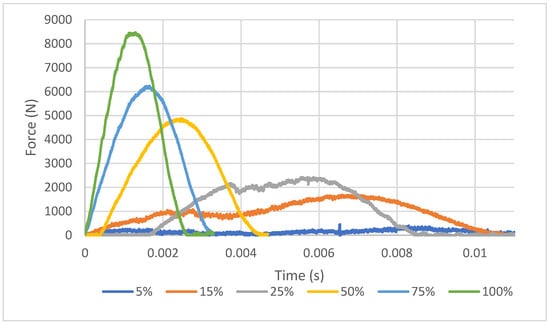
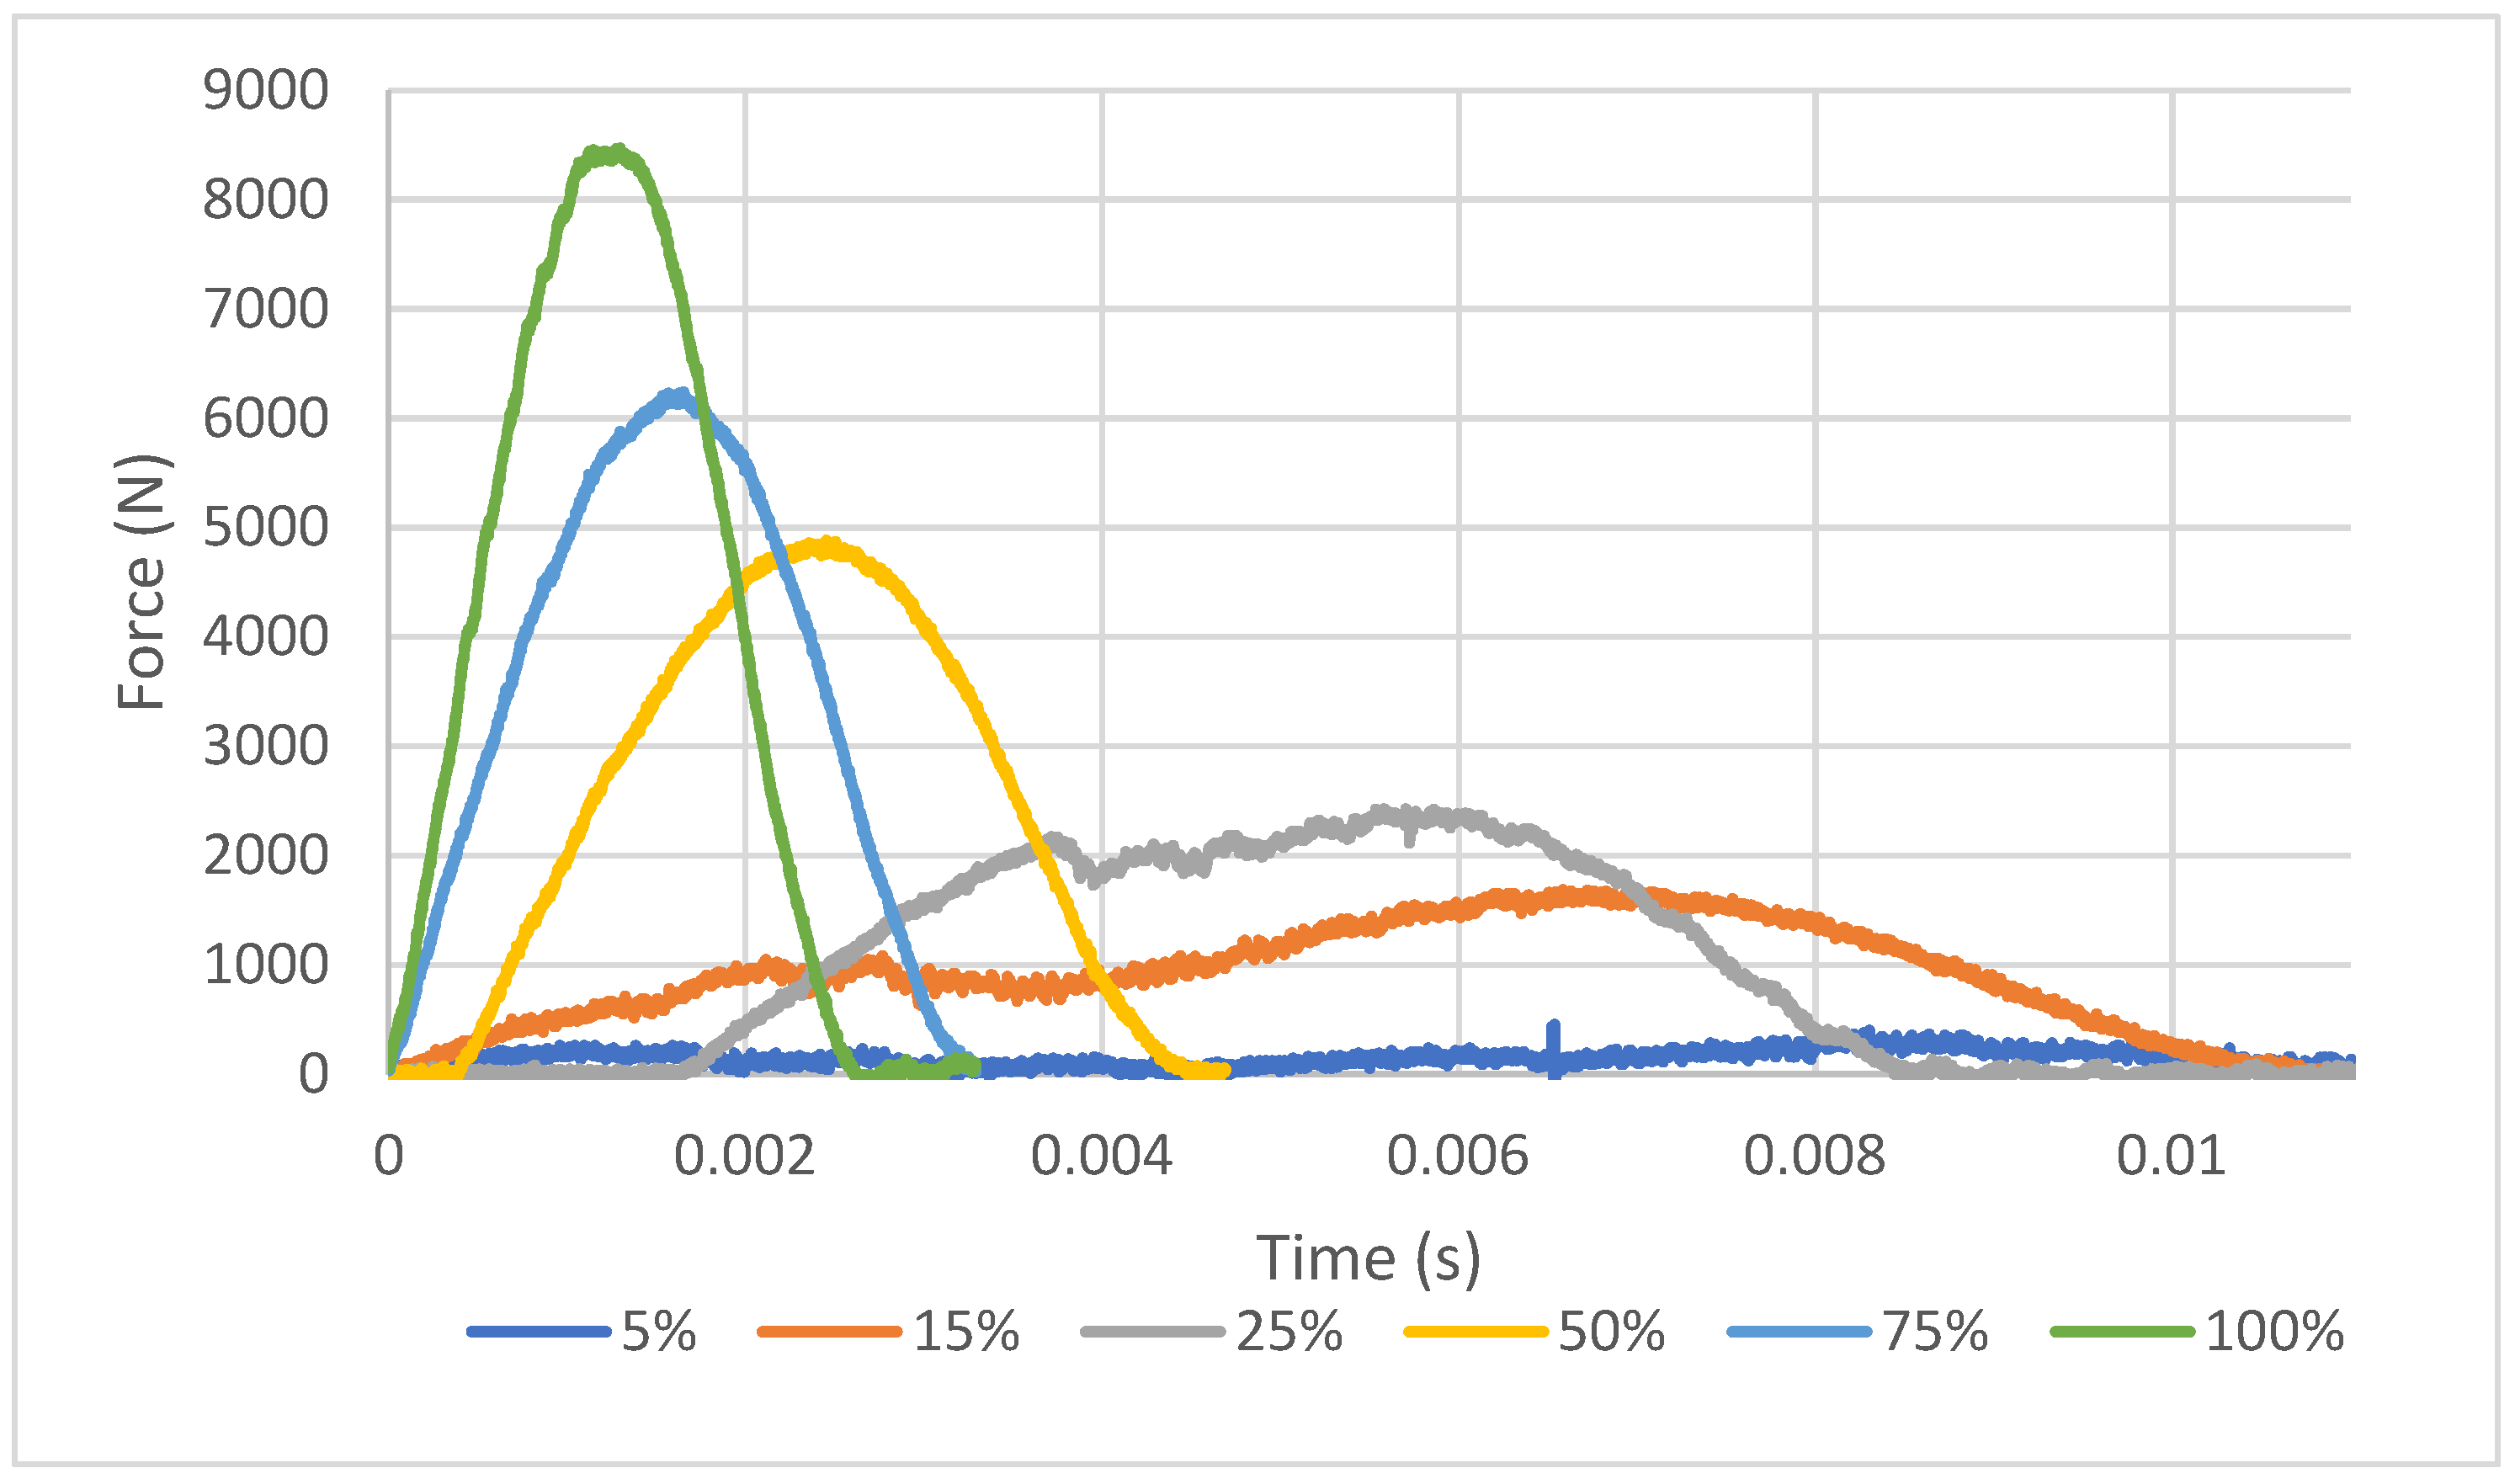
The experimental data recorded corresponds to impact forces developed over time. Figure 9 shows this for the representative samples under each sparse infill density category. The force–time response includes regions of force build-up, peak force, progressive crushing and unloading.
Figure 9.
Force–time evolution in case of representative samples with various infill densities.
Thus, two distinct force–time responses are observed for different sparse infill densities: one ranging from 5% to 50%, and the other from 50% to 100%. The 5%, 15% and 25% infill samples can be distinguished due to their irregular force–time responses, characterized by force fluctuations and lowest peaks. In contrast, samples with 50%, 75% and 100% infill exhibit an increasingly bell-shaped force–time response, with a better-defined unloading branch, indicating greater energy recovery. This evolution can be ascribed to increasing numbers of infill walls and junctions participating in the distribution of impact load throughout the sample. As sparse infill density increases, a more regular cellular architecture is formed, resulting in increased stiffness and formation of more continuous load paths.
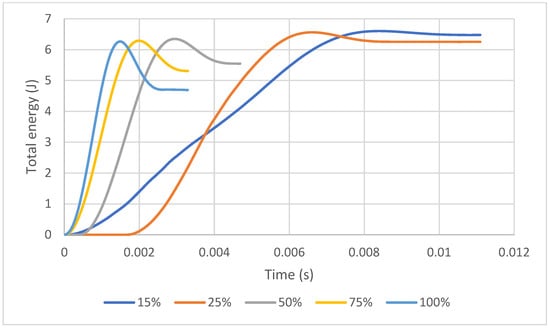
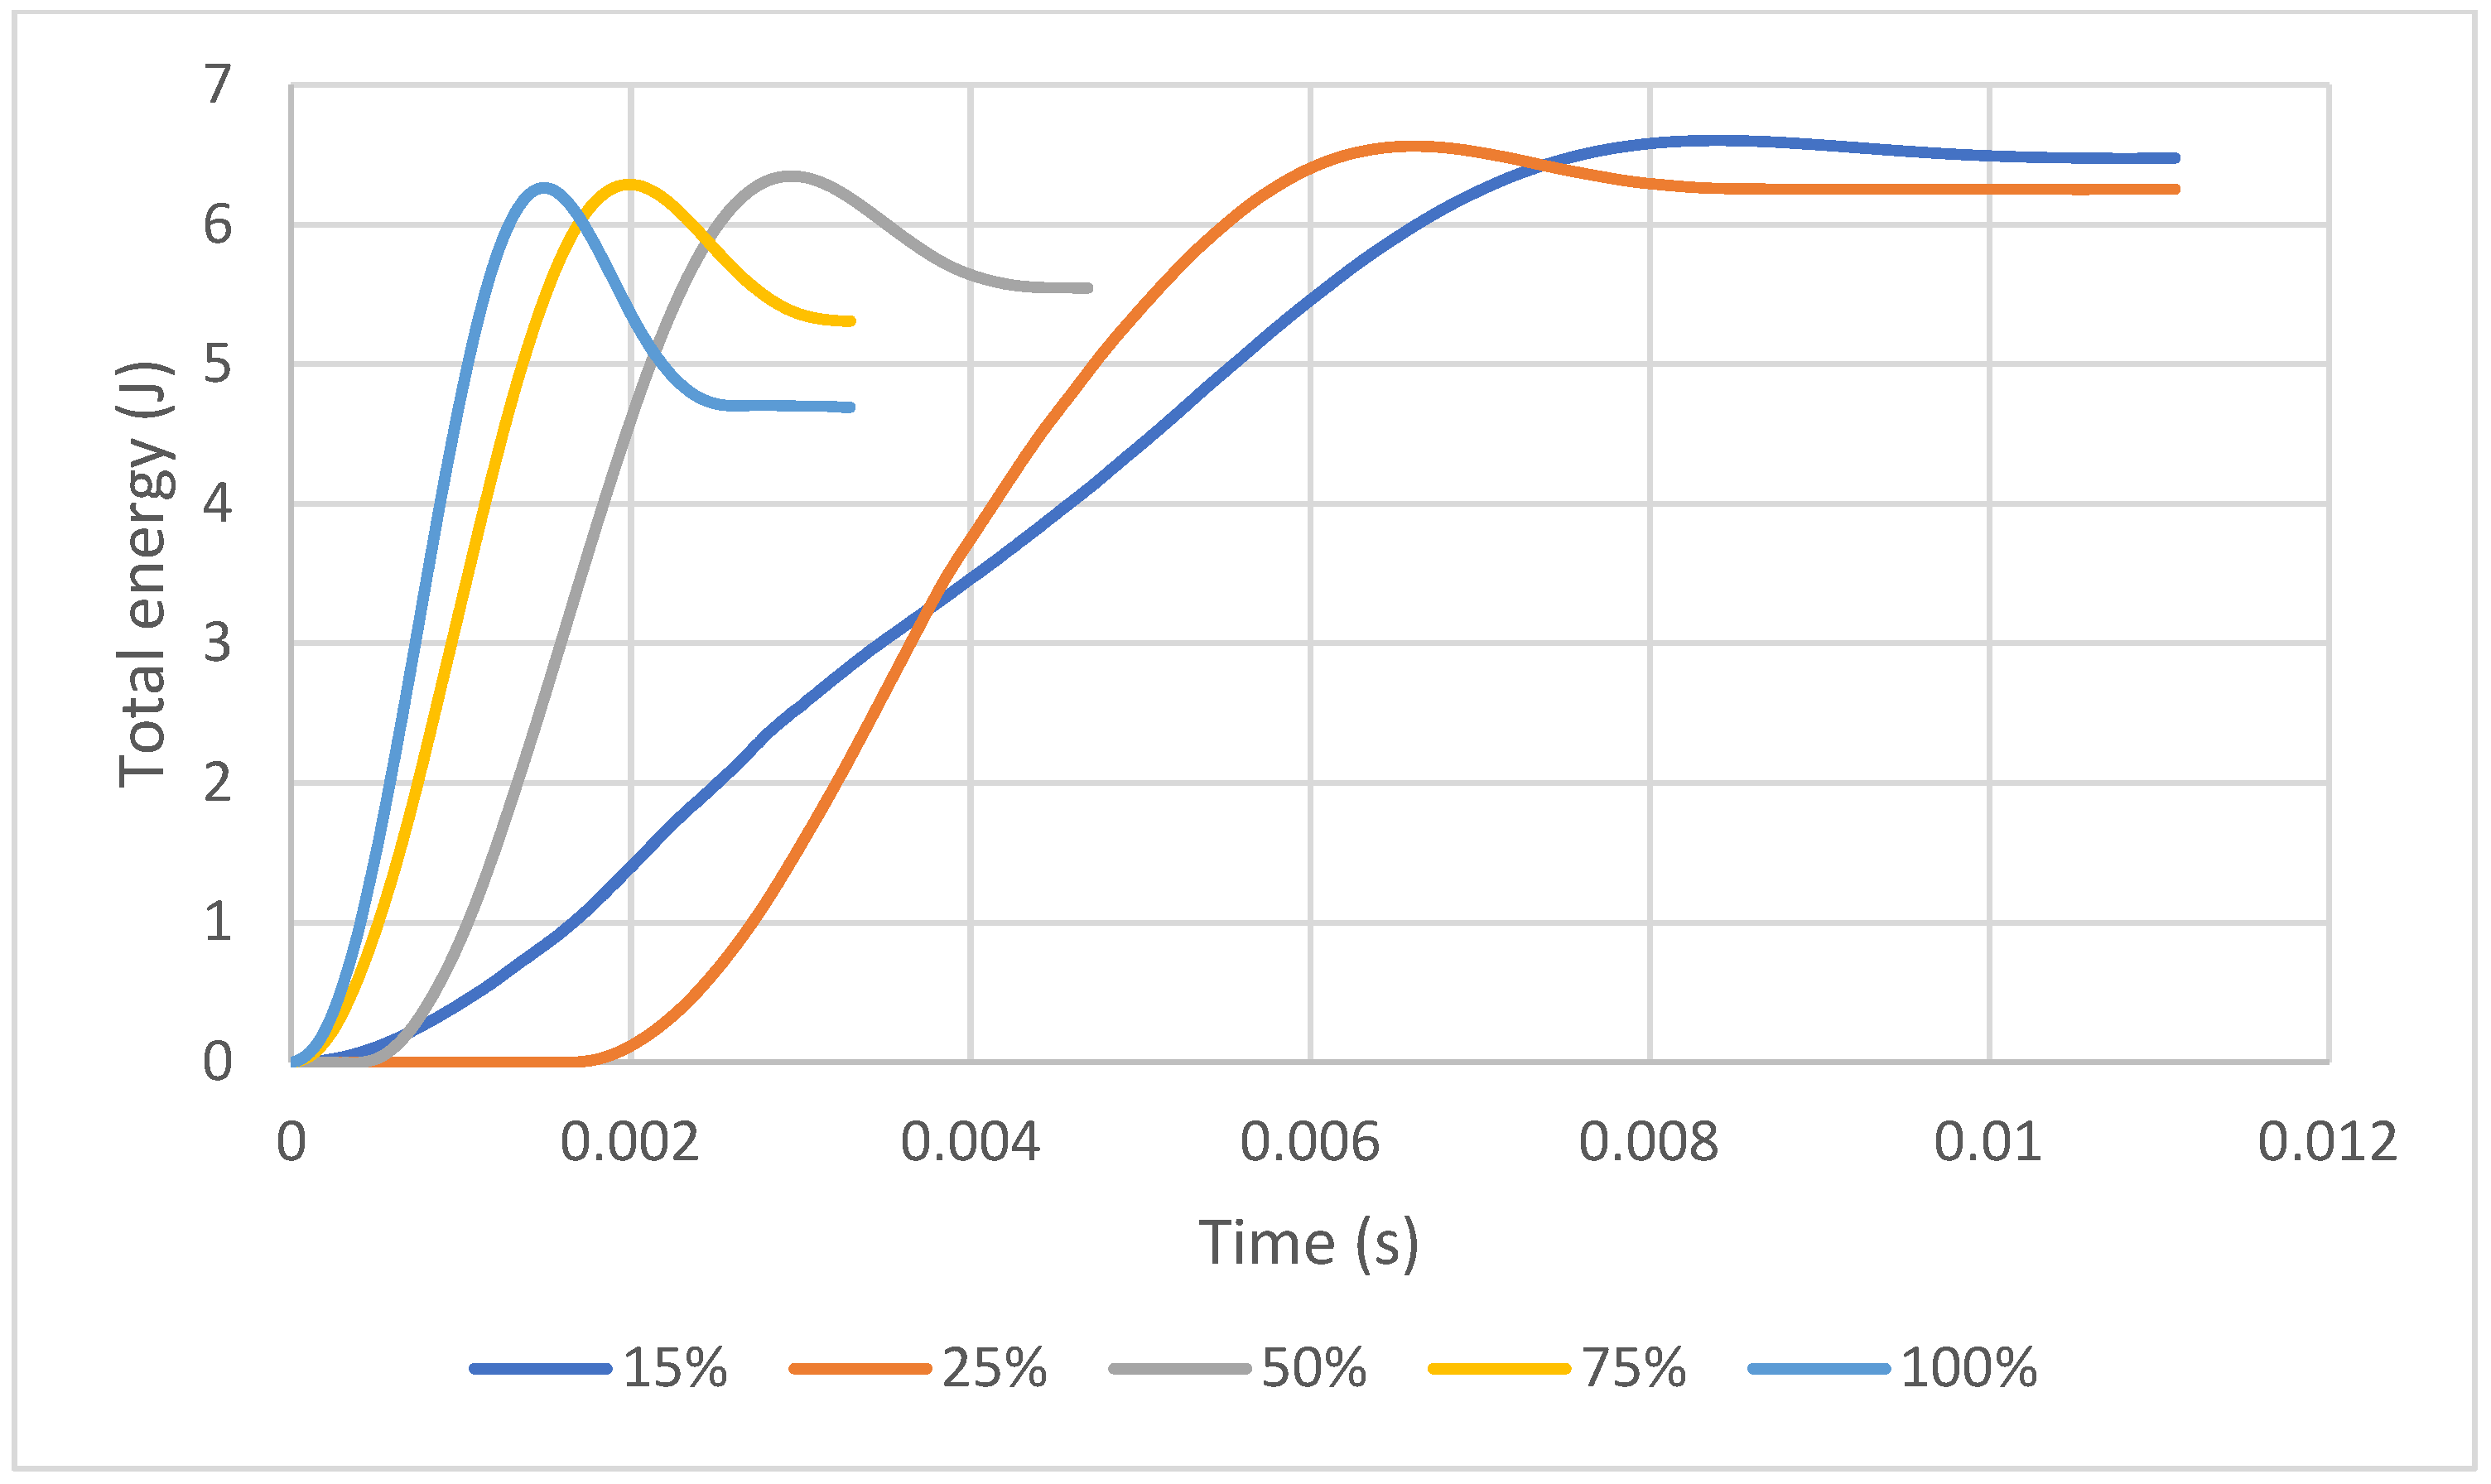
Figure 10 shows the total energy–time evolution, further strengthening the previous statements. The 15% and 25% infill samples display a prolonged total energy–time evolution, with increased absorbed energy values due to the low forces acting along the crushing distance. Although the 15% and 25% infill architectures exhibit higher energy absorption values, this is due to the structures’ rapid crushing and premature collapse. For automotive energy-absorbing components, a higher absorbed energy value is desirable, but not at the expense of the above.
Figure 10.
Total energy–time evolution retrieved for representative samples with various infill densities.
By contrast, 50%, 75% and 100% infill architectures show a tendency towards decreased impact energy corresponding to maximum values on the curves. As sample stiffness increases with infill density, these samples can sustain higher forces while retaining less energy after unloading.
Table 6 summarizes the mean values of key impact performance parameters derived from low-impact puncture tests on PETG-based irregular honeycomb-like topologies for all infill densities considered.
Table 6.
Impact performance parameters derived from low-velocity drop-weight tests.
The dynamic force–time responses discussed are consistent with the quasi-static stiffness trends reported in Section 3.2. Concretely, specimens with higher sparse infill densities displaying a sharper, more bell-shaped force–time response (see Figure 9) exhibited higher tensile and flexural Young’s moduli (see Figure 3), reflecting a more continuous, wall-connected load path under quasi-static and dynamic loading conditions.
The impact performance of each sample was therefore evaluated using maximum force, mean crushing force, crushing force efficiency (CFE), specific energy absorption (SEA) and contact-energy utilization ratio (η).
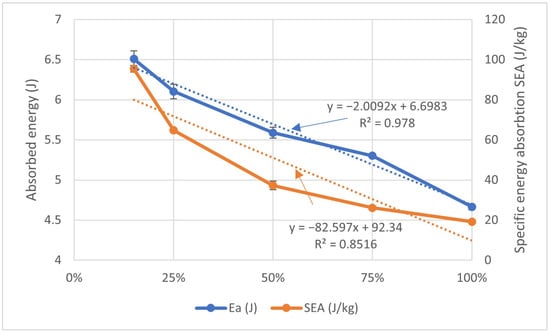
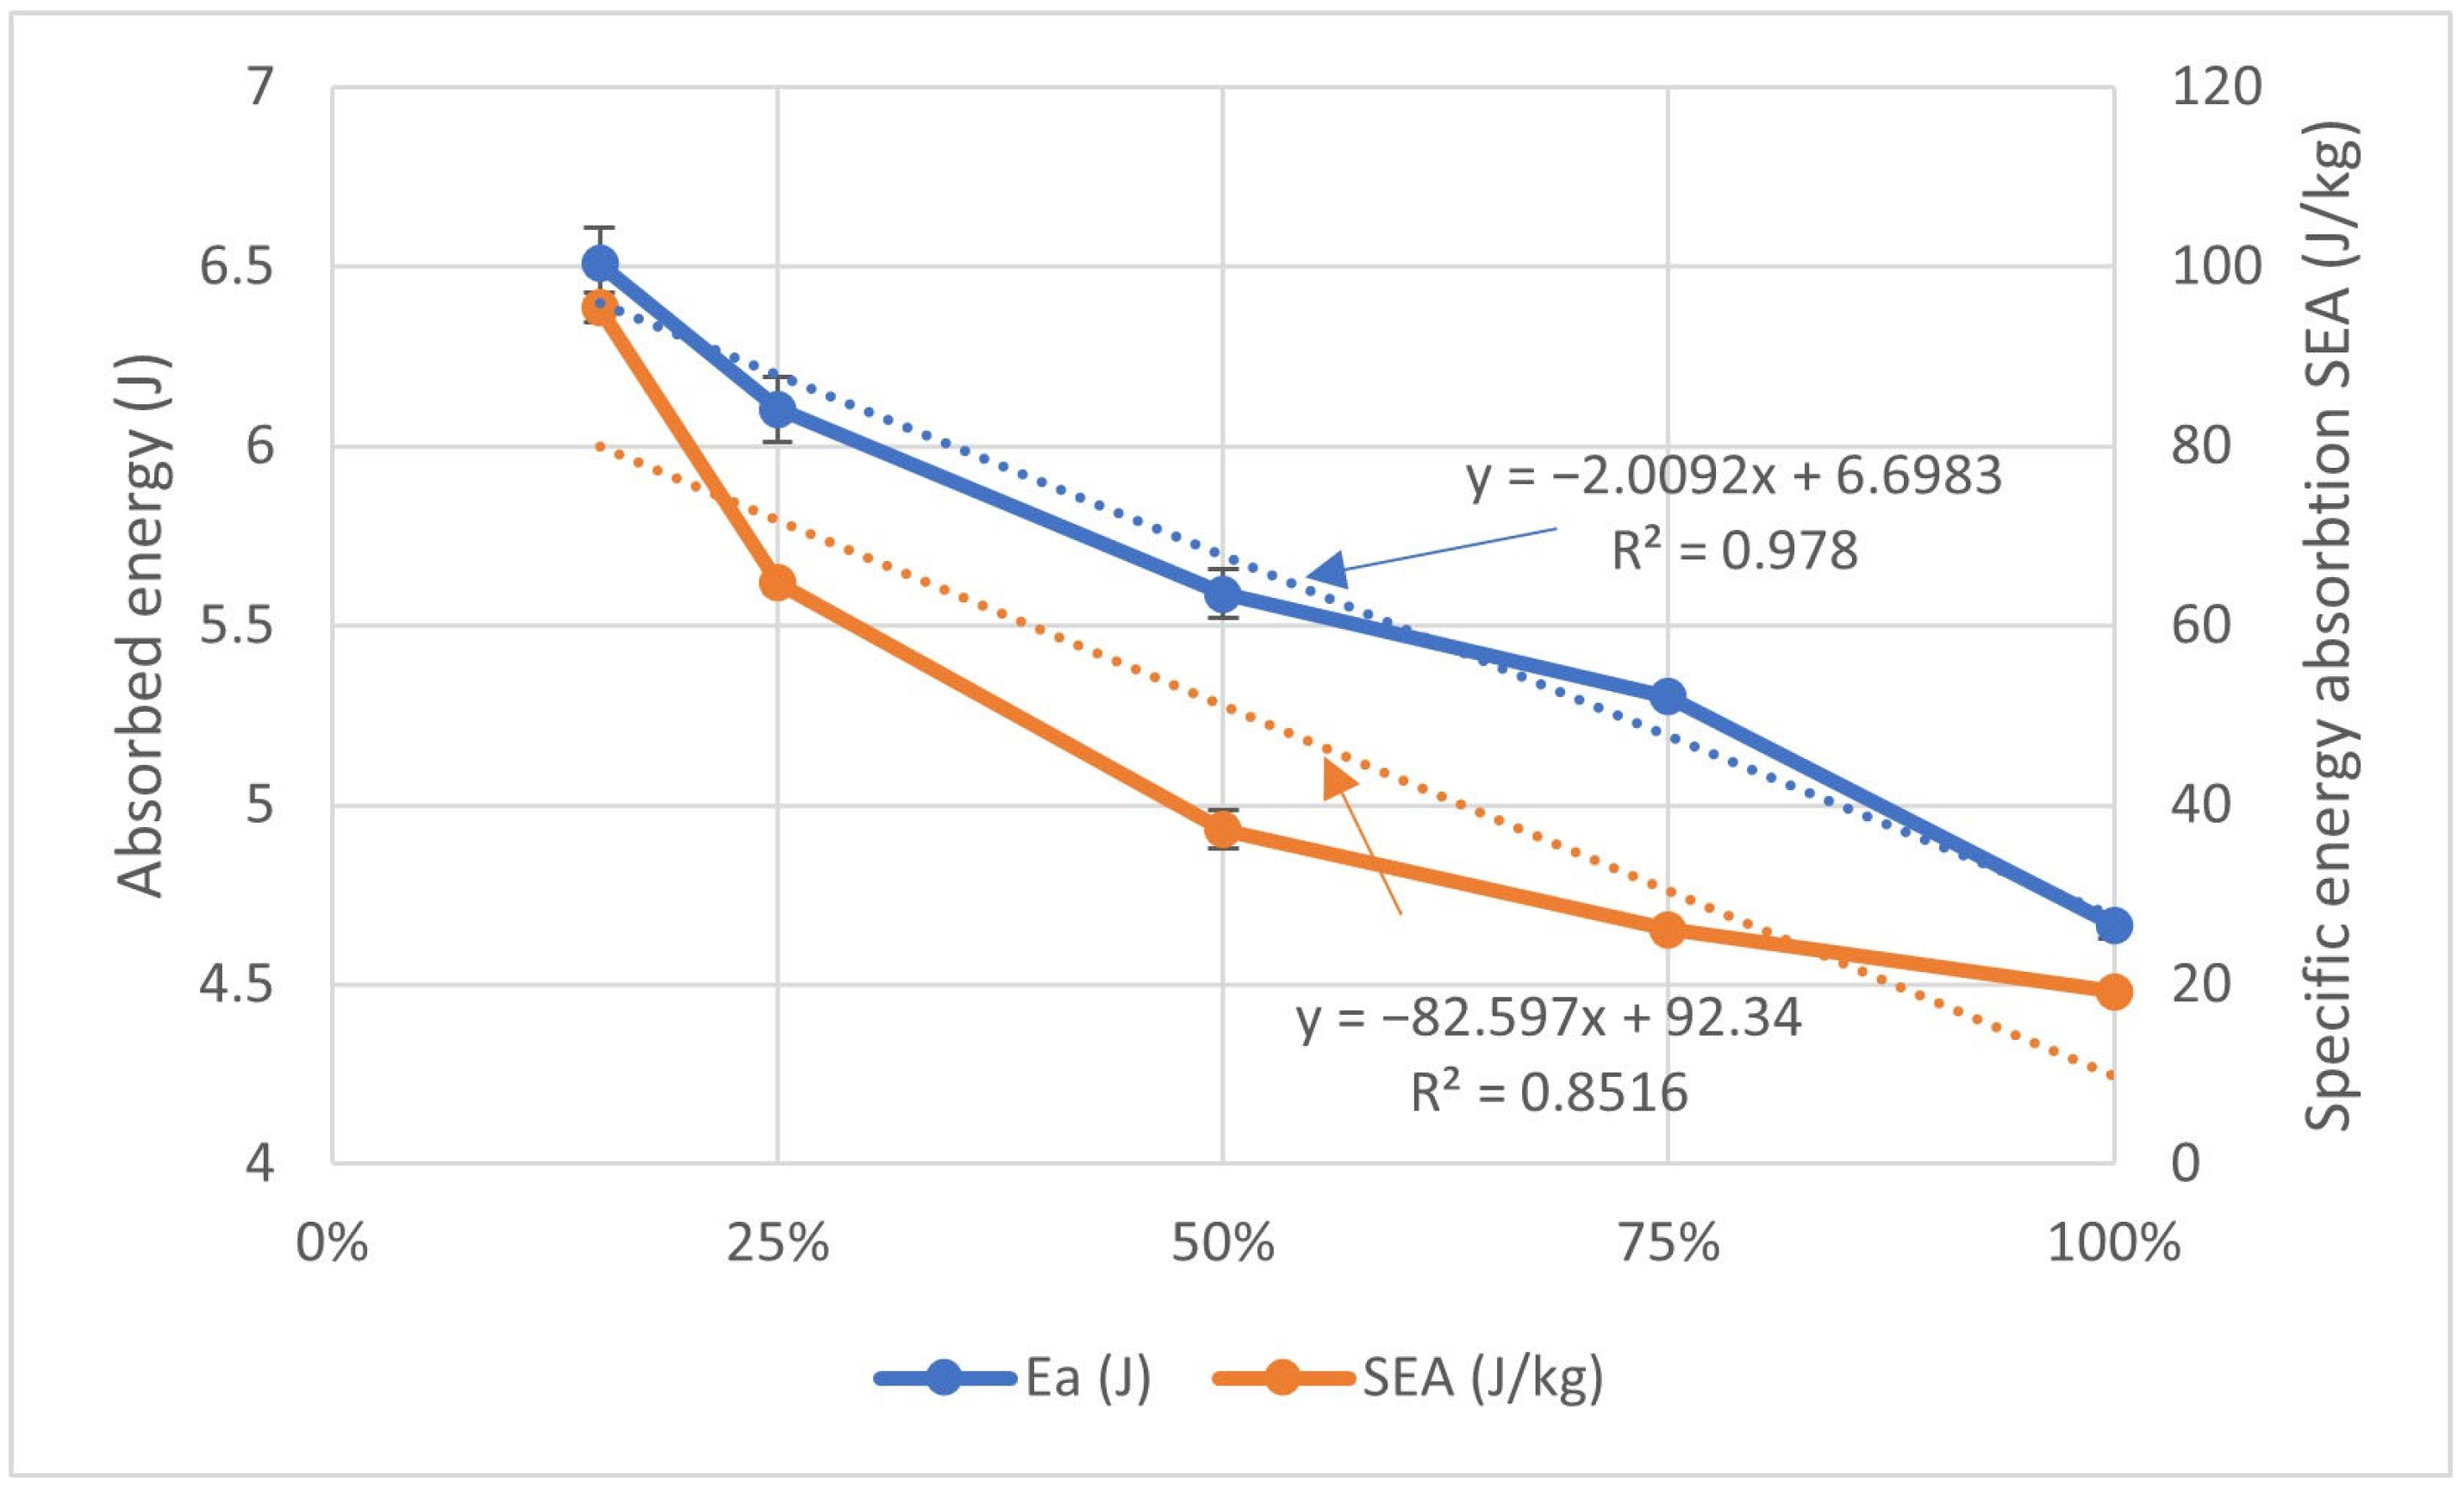
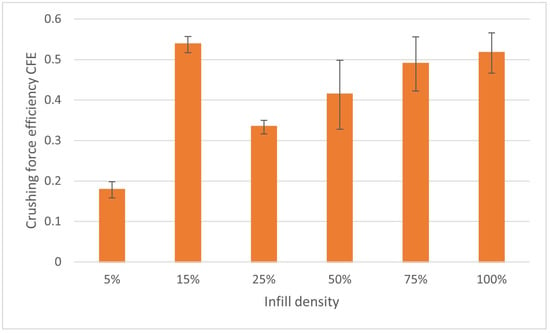
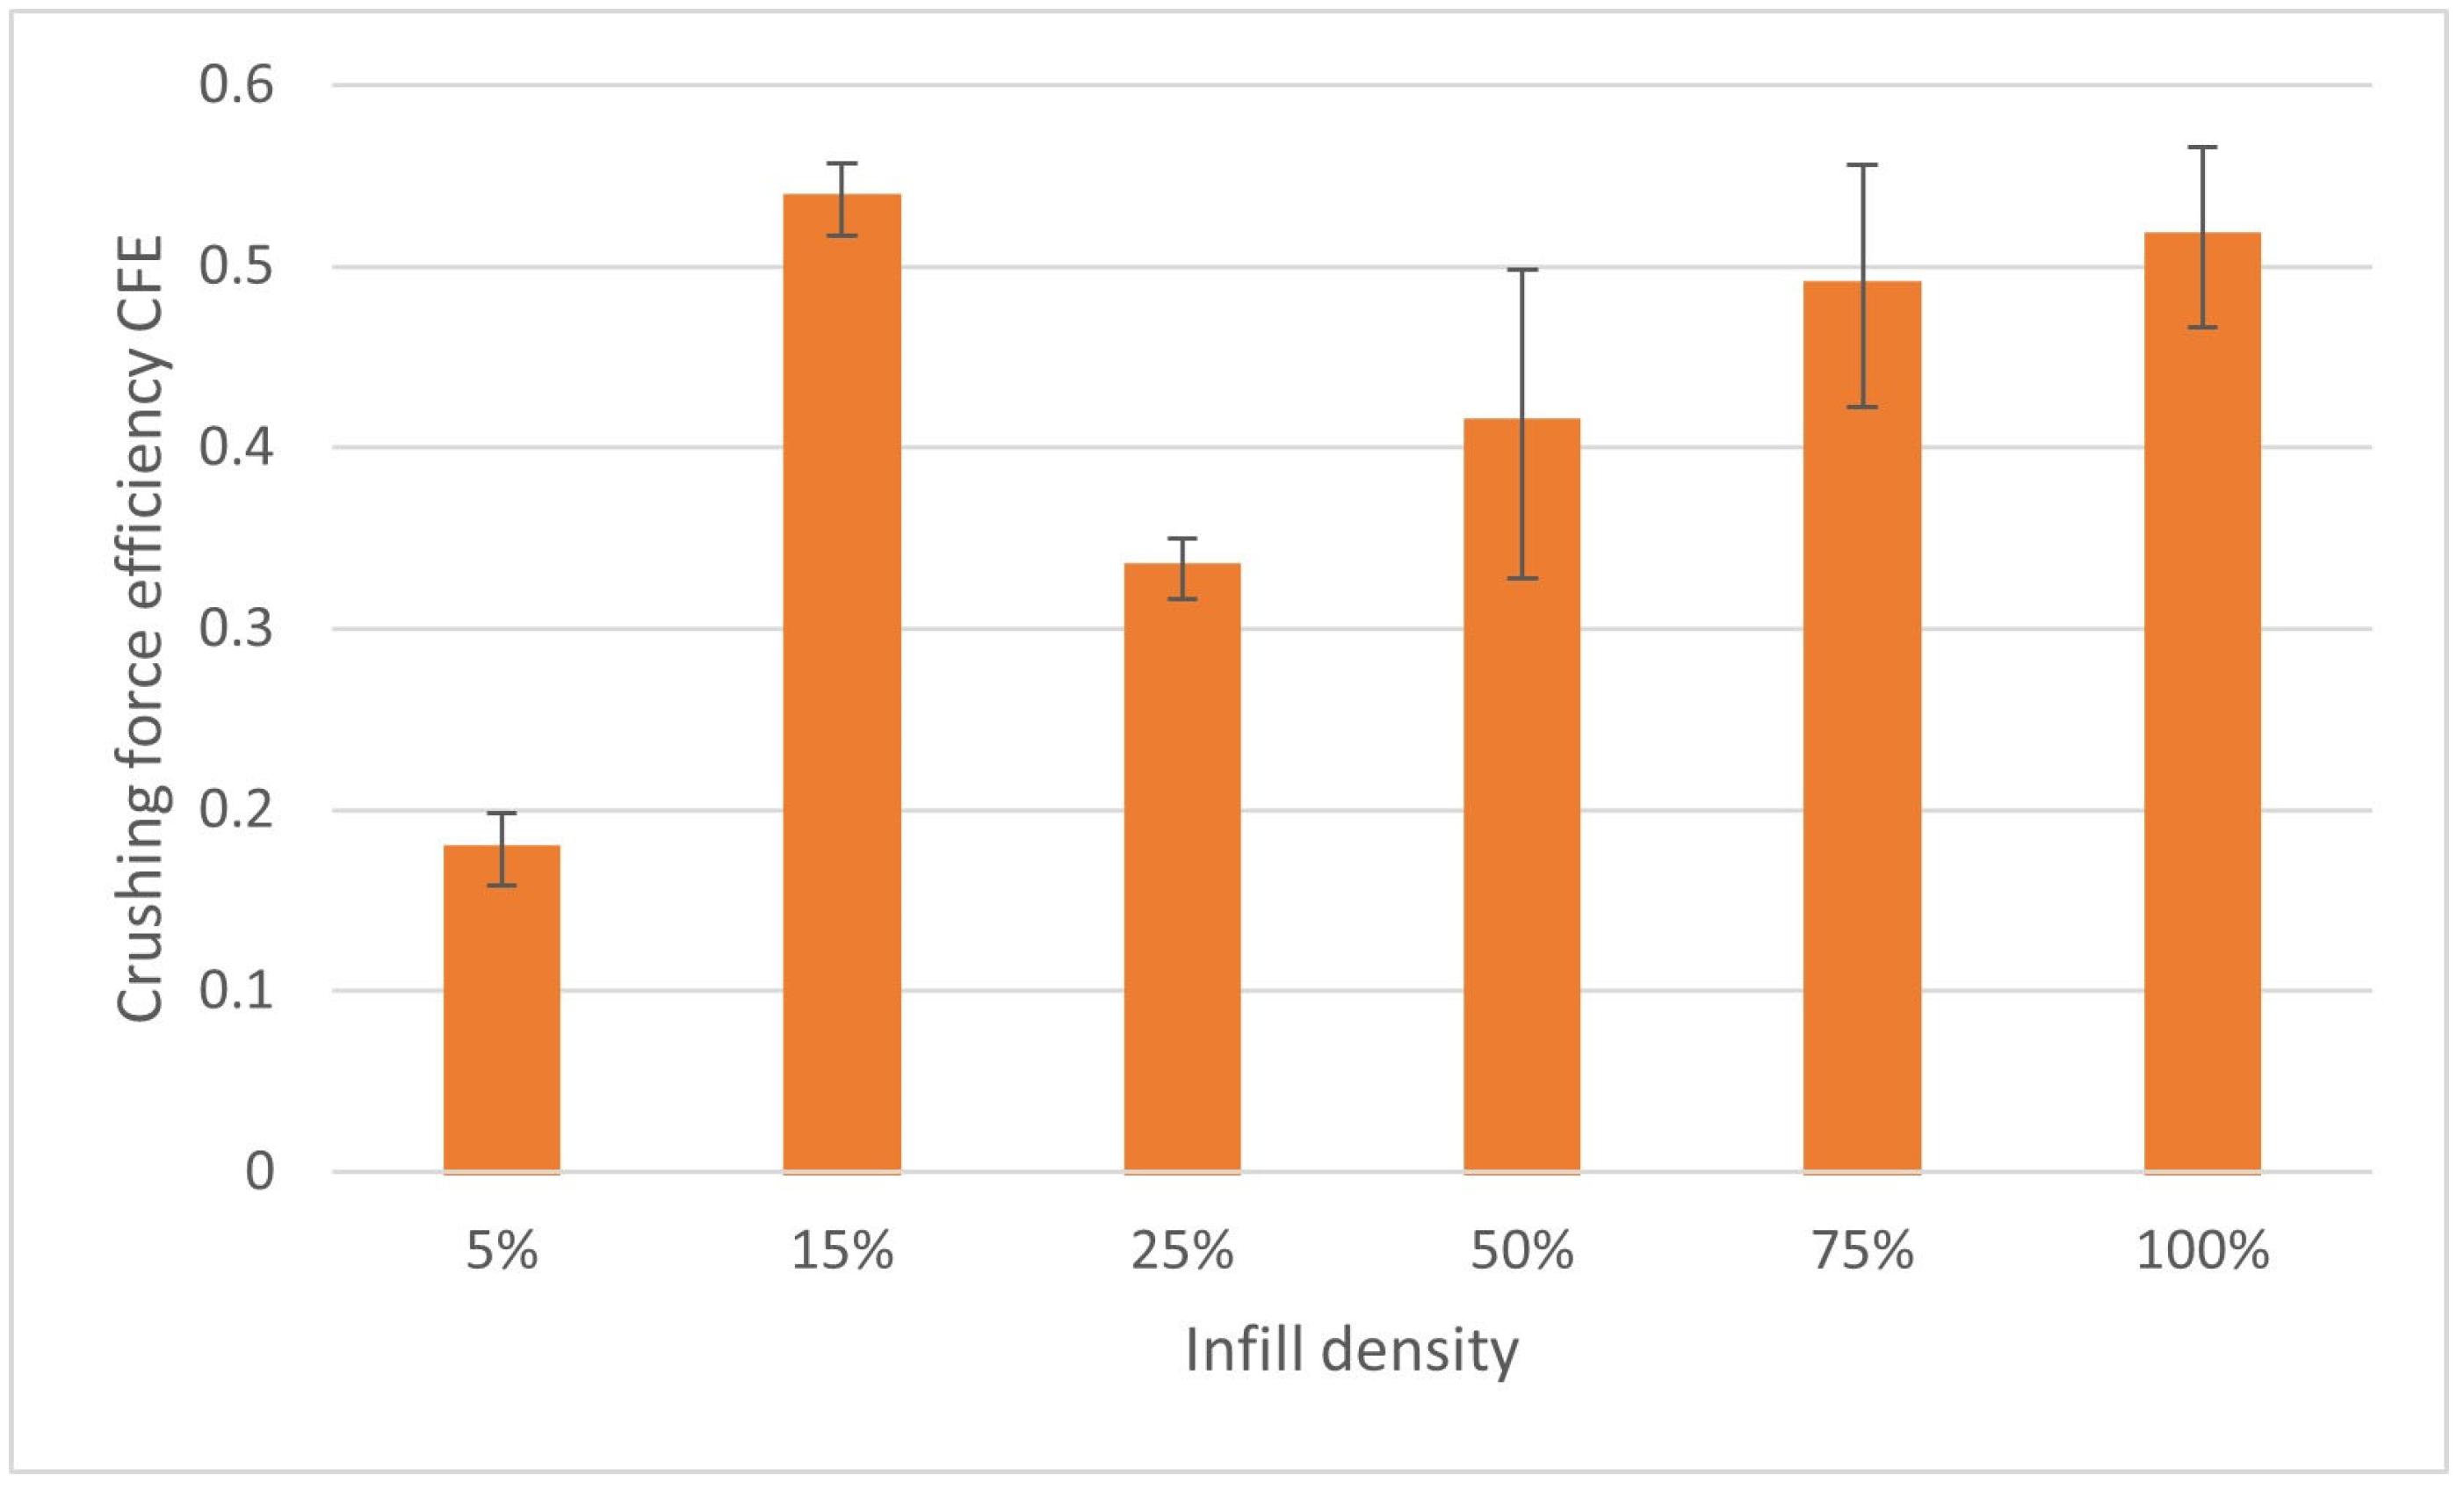
Figure 11 displays the evolution trends of absorbed energy (EA) and lightweight energy efficiency (SEA), with sample infill density, whereas Figure 12 displays the mean values of crushing force efficiency (CFE). Overall, both EA and SEA values decrease as infill density increases, most noticeably in SEA values due to increasing specimen mass. As can be seen in Table 6, the contact-energy utilization ratio (expressed as a % value) increases from around 74.3% for 100% infilled samples to approximately 98.3% for samples with 15% infill. This evolution suggests that all irregular, honeycomb-like samples, irrespective of their sparse infill density, retain almost all impact energy. The mean CFE values corroborate this finding, revealing a non-uniform force response due to irreversible crushing, with significant variations appearing in the plot.
Figure 11.
Means of absorbed energies and specific energy absorption with infill density variation.
Figure 12.
Means of crushing force efficiency with infill density variation.
As can be seen in Figure 12, CFE appears to increase approximately linearly with sparse infill density; the linear fit yields R2 = 0.40 when all tested infill densities are included, improving to R2 = 0.983 when the 15% infill data point is omitted, indicating progressively more uniform force transmission at higher infill densities. This trend should be attributed to cellular architecture that becomes more connected with density increase, causing the mean crushing force to approach the maximum force. Although these results appear remarkable, they should be approached with caution, acknowledging that the trend is empirical and that fluctuations like those encountered at 15% sparse infill density may be present at other densities, as discussed in Section 3.3. Furthermore, this also applies to 100% infill density as the structure transitions from a honeycomb cellular configuration to a nearly solid one.
Indreș et al. [33] reported CFE values in a range of 0.53–0.63 for 3D-printed re-entrant honeycomb-type panels under low-velocity impact (10 J and 15 J), identifying honeycomb-derived topologies as a leading candidate for impact engineering due to their stability. The CFE values obtained in the present study (0.537 at 15%, 0.516 at 100%; see Table 6) fall within or immediately close to this reported range despite the substantially lower impact energy (6.2 J) and the irregular, non-periodic nature of the present topology compared to the engineered re-entrant panels of the aforementioned research group.
Furthermore, as mentioned in the introduction, Santos et al. [31] and Isaac et al. [32] also identified PETG-based honeycomb structures as providing superior crushing force efficiency and ductility compared to other material–topology combinations. This further supports the role of cell architecture in governing crashworthiness performance beyond the amount of raw material used.
4. Conclusions
The present study examined PETG-based, irregular, honeycomb-type structures 3D-printed at various sparse infill densities, subjected to both quasi-static and dynamic tests. In summary, irregular honeycomb-like structures revealed systematic relationships between infill density and mechanical properties, as derived from tensile, flexural, Charpy and low-velocity impact tests. Despite exhibiting favorable mass-specific energy absorption, the irregular honeycomb-like structures were prone to rapid collapse at sparse infill densities below 50%, compared with denser configurations. On the other hand, denser configurations demonstrated increased stiffness and higher elastic moduli in both tensile and flexural tests, showing more uniform force transmission in low-velocity impact tests.
Based on the qualitative trade-offs observed between stiffness, strength, crushing force uniformity, absorbed energy, lightweight efficiency, and deformation capacity, the 50% sparse infilled samples from this study appear to be a reasonable compromise option. A formal multi-criteria decision analysis was beyond the scope of this study but could be considered as part of future research to substantiate this finding.
Further research should focus on irregular honeycomb-like structures below 50% sparse infill, considering variations in infill density, specimen height, shell thickness or printing parameters. Comparative investigations using PETG, PETG-CF, ABS, TPU and PETG-TPU hybrid structures could identify combinations of materials and topologies that balance stiffness, progressive collapse and recovery. Moreover, incorporating techniques such as digital image correlation or micro-computed tomography (μCT) during impact loading would enable more rigorous validation of load path continuity, wall connectivity, and progressive crushing behavior, and would further strengthen the structure-property relationships identified here.
From an automotive application perspective, we suggest that optimized configurations based on PETG, its combinations or other proposed thermoplastics could be suitable for secondary, impact-resistant non-structural components, such as door trim absorbers or battery cover protection elements. This remains to be verified through component-level testing under realistic boundary conditions, which was not considered in this study.
Author Contributions
Conceptualization, D.L.M.; methodology, D.L.M.; software, C.C., H.T.-D. and D.L.M.; validation, C.C., H.T.-D. and D.L.M.; investigation, all; resources, B.I.N. and M.A.L.; data curation, D.L.M.; writing—original draft preparation, D.L.M.; writing—review and editing, C.C., H.T.-D., M.A.L.; visualization, C.C., H.T.-D.; supervision, D.L.M. All authors have read and agreed to the published version of the manuscript.
Funding
This research received no external funding.
Data Availability Statement
The data presented in this study are available on request from the corresponding author due to ethical reasons.
Acknowledgments
During the preparation of this manuscript, the authors used MATLAB® 2025b for the purposes of data analysis and plotting. The authors have reviewed and edited the output and take full responsibility for the content of this publication.
Conflicts of Interest
The authors declare no conflicts of interest.
Abbreviations
The following abbreviations are used in this manuscript:
| ABS | Acrylonitrile Butadiene Styrene |
| AM | Additive Manufacturing |
| CAD | Computer-Aided Design |
| CFE | Crushing Force Efficiency |
| CoV | Coefficient of Variation |
| DfAM | Design for Additive Manufacturing |
| EA | Energy Absorption |
| FDM | Fused Deposition Modelling |
| FFF | Fused Filament Fabrication |
| MEX | Material Extrusion |
| PETG | Polyethylene Terephthalate Glycol |
| PLA | Polylactic Acid |
| stdev | Standard Deviation |
| SEA | Specific Energy Absorption |
| TOM | Topology Optimized Metamaterials |
| TPU | Thermoplastic Polyurethane |
| UTS | Ultimate Tensile Strength |
| Wg | Gravitational Work during crushing |
| μCT | Micro Computed Tomography |
References
- Cano-Vicent, A.; Tambuwala, M.M.; Hassan, S.S.; Barh, D.; Aljabali, A.A.A.; Birkett, M.; Arjunan, A.; Serrano-Aroca, Á. Fused deposition modelling: Current status, methodology, applications and future prospects. Addit. Manuf. 2021, 47, 102378. [Google Scholar] [CrossRef] [Scilit]
- Alami, A.H.; Ghani Olabi, A.; Alashkar, A.; Alasad, S.; Aljaghoub, H.; Rezk, H.; Abdelkareem, M.A. Additive manufacturing in the aerospace and automotive industries: Recent trends and role in achieving sustainable development goals. Ain Shams Eng. J. 2023, 14, 102516. [Google Scholar] [CrossRef] [Scilit]
- Hamza, A.; Bousnina, K.; Dridi, I.; Ben Yahia, N. Revolutionizing Automotive Design: The Impact of Additive Manufacturing. Vehicles 2025, 7, 24. [Google Scholar] [CrossRef] [Scilit]
- Algarni, M.; Ghazali, S. Comparative Study of the Sensitivity of PLA, ABS, PEEK, and PETG’s Mechanical Properties to FDM Printing Process Parameters. Crystals 2021, 11, 995. [Google Scholar] [CrossRef] [Scilit]
- Prajapati, S.; Sharma, J.K.; Kumar, S.; Pandey, S.; Pandey, M.K. A review on comparison of physical and mechanical properties of PLA, ABS, TPU, and PETG manufactured engineering components by using fused deposition modelling. Mater. Today Proc. 2024. [Google Scholar] [CrossRef] [Scilit]
- Hsueh, M.-H.; Lai, C.-J.; Wang, S.-H.; Zeng, Y.-S.; Hsieh, C.-H.; Pan, C.-Y.; Huang, W.-C. Effect of Printing Parameters on the Thermal and Mechanical Properties of 3D-Printed PLA and PETG, Using Fused Deposition Modeling. Polymers 2021, 13, 1758. [Google Scholar] [CrossRef] [Scilit] [PubMed]
- Özen, A.; Auhl, D.; Völlmecke, C.; Kiendl, J.; Abali, B.E. Optimization of Manufacturing Parameters and Tensile Specimen Geometry for Fused Deposition Modeling (FDM) 3D-Printed PETG. Materials 2021, 14, 2556. [Google Scholar] [CrossRef] [Scilit] [PubMed]
- Khan, I.; Tariq, M.; Abas, M.; Shakeel, M.; Hira, F.; Al Rashid, A.; Koç, M. Parametric investigation and optimisation of mechanical properties of thick tri-material based composite of PLA-PETG-ABS 3D-printed using fused filament fabrication. Compos. Part C Open Access 2023, 12, 100392. [Google Scholar] [CrossRef] [Scilit]
- Auffray, L.; Gouge, P.-A.; Hattali, L. Design of experiment analysis on tensile properties of PLA samples produced by fused filament fabrication. Int. J. Adv. Manuf. Technol. 2022, 118, 4123–4137. [Google Scholar] [CrossRef] [Scilit]
- Valvez, S.; Silva, A.P.; Reis, P.N.B. Optimization of Printing Parameters to Maximize the Mechanical Properties of 3D-Printed PETG-Based Parts. Polymers 2022, 14, 2564. [Google Scholar] [CrossRef] [Scilit] [PubMed]
- Lopes, L.; Reis, D.; Paula Junior, A.; Almeida, M. Influence of 3D Microstructure Pattern and Infill Density on the Mechanical and Thermal Properties of PET-G Filaments. Polymers 2023, 15, 2268. [Google Scholar] [CrossRef] [Scilit] [PubMed]
- Loskot, J.; Jezbera, D.; Loskot, R.; Bušovský, D.; Barylski, A.; Glowka, K.; Duda, P.; Aniołek, K.; Voglová, K.; Zubko, M. Influence of print speed on the microstructure, morphology, and mechanical properties of 3D-printed PETG products. Polym. Test. 2023, 123, 108055. [Google Scholar] [CrossRef] [Scilit]
- Firtikiadis, L.; Tzotzis, A.; Kyratsis, P.; Efkolidis, N. Response Surface Methodology (RSM)-Based Evaluation of the 3D-Printed Recycled-PETG Tensile Strength. Appl. Mech. 2024, 5, 924–937. [Google Scholar] [CrossRef] [Scilit]
- Sola, A.; Chong, W.J.; Pejak Simunec, D.; Li, Y.; Trinchi, A.; Kyratzis, I.; Wen, C. Open challenges in tensile testing of additively manufactured polymers: A literature survey and a case study in fused filament fabrication. Polym. Test. 2023, 117, 107859. [Google Scholar] [CrossRef] [Scilit]
- Geramizadeh, H.; Dariushi, S.; Salami, S.J. Optimal face sheet thickness of 3D printed polymeric hexagonal and re-entrant honeycomb sandwich beams subjected to three-point bending. Compos. Struct. 2022, 291, 115618. [Google Scholar] [CrossRef] [Scilit]
- Tunay, M. Bending behavior of 3D printed sandwich structures with different core geometries and thermal aging durations. Thin-Walled Struct. 2024, 194, 111329. [Google Scholar] [CrossRef] [Scilit]
- Yalçın, M.M. Flexural Behavior of 3D-Printed Carbon Fiber-Reinforced Nylon Lattice Beams. Polymers 2024, 16, 2991. [Google Scholar] [CrossRef] [Scilit] [PubMed]
- Kananathan, J.; Samykano, M.; Kadirgama, K.; Ramasamy, D.; Rahman, M.-M. Statistical Model for Impact and Energy Absorption of 3D Printed Coconut Wood-PLA. Energy Eng. 2021, 118, 1305–1315. [Google Scholar] [CrossRef] [Scilit]
- Popa, C.-F.; Mărghitaș, M.-P.; Galațanu, S.-V.; Marșavina, L. Influence of thickness on the IZOD impact strength of FDM printed specimens from PLA and PETG. Procedia Struct. Integr. 2022, 41, 557–563. [Google Scholar] [CrossRef] [Scilit]
- Qamar Tanveer, M.; Mishra, G.; Mishra, S.; Sharma, R. Effect of infill pattern and infill density on mechanical behaviour of FDM 3D printed Parts—A current review. Mater. Today Proc. 2022, 62, 100–108. [Google Scholar] [CrossRef] [Scilit]
- Tunçel, O. Optimization of Charpy Impact Strength of Tough PLA Samples Produced by 3D Printing Using the Taguchi Method. Polymers 2024, 16, 459. [Google Scholar] [CrossRef] [Scilit] [PubMed]
- Fahad, M.; Mujeeb, M.; Khan, M.A. Effect of Process Parameters on the Compressive and Impact Strength of 3D Printed Parts. Iran. J. Sci. Technol. Trans. Mech. Eng. 2023, 47, 257–265. [Google Scholar] [CrossRef] [Scilit]
- Galeja, M.; Hejna, A.; Kosmela, P.; Kulawik, A. Static and Dynamic Mechanical Properties of 3D Printed ABS as a Function of Raster Angle. Materials 2020, 13, 297. [Google Scholar] [CrossRef] [Scilit] [PubMed]
- Agrawal, A.P.; Kumar, V.; Kumar, J.; Paramasivam, P.; Dhanasekaran, S.; Prasad, L. An investigation of combined effect of infill pattern, density, and layer thickness on mechanical properties of 3D printed ABS by fused filament fabrication. Heliyon 2023, 9, e16531. [Google Scholar] [CrossRef] [Scilit] [PubMed]
- Samatham, M.; Jatavallabhula, J.K.; Yennam, R.K.; Pappula, B.; Makgato, S. Taguchi-assisted Multi-Objective Differential Evolution for enhancing mechanical performance of 3D printed PETG. Mater. Today Commun. 2026, 51, 114691. [Google Scholar] [CrossRef] [Scilit]
- Sathish Kumar, K.; Soundararajan, R.; Shanthosh, G.; Saravanakumar, P.; Ratteesh, M. Augmenting effect of infill density and annealing on mechanical properties of PETG and CFPETG composites fabricated by FDM. Mater. Today Proc. 2021, 45, 2186–2191. [Google Scholar] [CrossRef] [Scilit]
- Zisopol, D.G.; Minescu, M.; Iacob, D.V. Evaluation and Optimization of Thermoplastic Extrusion Parameters Influencing the Impact Resistance of Additively Manufactured Samples from PETG and Recycled PETG. Polymers 2025, 17, 2533. [Google Scholar] [CrossRef] [Scilit] [PubMed]
- Vidakis, N.; Petousis, M.; Tzounis, L.; Grammatikos, S.A.; Porfyrakis, E.; Maniadi, A.; Mountakis, N. Sustainable Additive Manufacturing: Mechanical Response of Polyethylene Terephthalate Glycol over Multiple Recycling Processes. Materials 2021, 14, 1162. [Google Scholar] [CrossRef] [Scilit] [PubMed]
- Deng, Y.; Niu, Y.; Du, C. The effect of filling structure on the impact resistance of fused deposition 3D printed structures. Eng. Fract. Mech. 2025, 320, 111084. [Google Scholar] [CrossRef] [Scilit]
- Tilley, R.; Holmes, D.; Pickering, E.; Woodruff, M. 3D Printed Metamaterials for Energy Absorption in Motorsport Applications. Int. J. Automot. Technol. 2024, 25, 1529–1540. [Google Scholar] [CrossRef] [Scilit]
- Santos, F.A.; Rebelo, H.; Coutinho, M.; Sutherland, L.S.; Cismasiu, C.; Farina, I.; Fraternali, F. Low velocity impact response of 3D printed structures formed by cellular metamaterials and stiffening plates: PLA vs. PETg. Compos. Struct. 2021, 256, 113128. [Google Scholar] [CrossRef] [Scilit]
- Isaac, C.W.; Sokołowski, A.; Duddeck, F.; Adamiak, M.; Pakieła, W.; Aremu, A. Mechanical characterisation and crashworthiness performance of additively manufactured polymer-based honeycomb structures under in-plane quasi-static loading. Virtual Phys. Prototyp. 2023, 18, e2273296. [Google Scholar] [CrossRef] [Scilit]
- Indreș, A.I.; Constantinescu, D.M.; Mocian, O.A.; Sorohan, Ș. Particularities on the Low-Velocity Impact Behavior of 3D-Printed Sandwich Panels with Re-Entrant and Honeycomb Core Topologies. J. Compos. Sci. 2024, 8, 426. [Google Scholar] [CrossRef] [Scilit]
- Awd Allah, M.M.; Abd El-Halim, M.F.; Sebaey, T.A.; Mahmoud, S.F.; Saleh, D.I.; Abd El-baky, M.A. Multi-criteria decision-making for optimizing crashworthiness of 3D-printed PETG-CF lightweight structures: Influence of printing parameters. Polym. Compos. 2025, 46, S940–S963. [Google Scholar] [CrossRef] [Scilit]
- Jain, A.; Raj, T.; Sahai, A.; Swarup Sharma, R. Structural behaviour of polyethylene terephthalate glycol reinforced with carbon fibre through fused filament fabrication for automotive components. Plast. Rubber Compos. 2025, 54, 290–298. [Google Scholar] [CrossRef] [Scilit]
- Anni, I.A.; Uddin, K.Z.; Pagliocca, N.; Singh, N.; Rahman, O.; Youssef, G.; Koohbor, B. Out-of-plane load-bearing and mechanical energy absorption properties of flexible density-graded TPU honeycombs. Compos. Part C Open Access 2022, 8, 100284. [Google Scholar] [CrossRef] [Scilit]
- IEC 62262:2002; Degrees of Protection Provided by Enclosures for Electrical Equipment Against External Mechanical Impacts (IK Code). International Electrotechnical Commission: Geneva, Switzerland, 2002.
- ASTM D638:2022; Standard Test Method for Tensile Properties of Plastics. ASTM International: West Conshohocken, PA, USA, 2022.
- ISO 527-2:2025; Plastics—Determination of Tensile Properties, Part 2: Test Conditions for Moulding and Extrusion Plastics. ISO: Geneva, Switzerland, 2025.
- ISO 178:2019; Plastics—Determination of Flexural Properties. ISO: Geneva, Switzerland, 2019.
- ISO 179-1:2026; Plastics—Determination of Charpy Impact Properties, Part 1: Non-Instrumented Impact Test. ISO: Geneva, Switzerland, 2026.
- ISO 6603-2:2023; Plastics—Determination of Puncture Impact Behaviour of Rigid Plastics, Part 2: Instrumented Impact Testing. ISO: Geneva, Switzerland, 2023.
- Aloyaydi, B.; Sivasankaran, S.; Mustafa, A. Investigation of infill-patterns on mechanical response of 3D printed poly-lactic-acid. Polym. Test. 2020, 87, 106557. [Google Scholar] [CrossRef] [Scilit]
- Frunzaverde, D.; Cojocaru, V.; Bacescu, N.; Ciubotariu, C.-R.; Miclosina, C.-O.; Turiac, R.R.; Marginean, G. The Influence of the Layer Height and the Filament Color on the Dimensional Accuracy and the Tensile Strength of FDM-Printed PLA Specimens. Polymers 2023, 15, 2377. [Google Scholar] [CrossRef] [Scilit] [PubMed]
- Ghorbani, J.; Koirala, P.; Shen, Y.-L.; Tehrani, M. Eliminating voids and reducing mechanical anisotropy in fused filament fabrication parts by adjusting the filament extrusion rate. J. Manuf. Process. 2022, 80, 651–658. [Google Scholar] [CrossRef] [Scilit]
- Petousis, M.; Ntintakis, I.; David, C.; Sagris, D.; Nasikas, N.K.; Korlos, A.; Moutsopoulou, A.; Vidakis, N. A Coherent Assessment of the Compressive Strain Rate Response of PC, PETG, PMMA, and TPU Thermoplastics in MEX Additive Manufacturing. Polymers 2023, 15, 3926. [Google Scholar] [CrossRef] [Scilit] [PubMed]

Disclaimer/Publisher’s Note: The statements, opinions and data contained in all publications are solely those of the individual author(s) and contributor(s) and not of MDPI and/or the editor(s). MDPI and/or the editor(s) disclaim responsibility for any injury to people or property resulting from any ideas, methods, instructions or products referred to in the content. |
© 2026 by the authors. Licensee MDPI, Basel, Switzerland. This article is an open access article distributed under the terms and conditions of the Creative Commons Attribution (CC BY) license.