


Abstract
The increasing demand for high-protein nutritional supplements has led to the widespread incorporation of milk protein concentrate (MPC) and whey protein isolate (WPI) into dairy systems; however, their synergistic effects on thermal stability and sensory quality remain poorly understood. This study systematically investigated the heat-induced denaturation and volatile organic compound (VOC) evolution in fortified whole milk (WM) systems (80 °C, 30 min) using a multidimensional flavoromics approach. We integrated SDS-PAGE and HPLC to quantify protein denaturation, alongside HS-SPME-arrow-GC-MS and descriptive sensory analysis (QDA) to map the resulting volatilome and aroma profile. HPLC analysis showed that WPI-fortified systems maintained higher initial β-lactoglobulin levels and exhibited a numerical 19.7% reduction in recoverable soluble β-LG after heat treatment. In contrast, MPC-containing systems showed less pronounced high-molecular-weight aggregation in non-reducing SDS-PAGE, suggesting that the casein-rich matrix may modulate whey protein aggregation. VOC profiling indicated a prominent contribution of lipid oxidation products, including hexanal and nonanal, together with formulation-dependent differences in sulfur-containing and ketonic compounds. Correlation analysis suggested associations between the volatile profiles and selected sensory attributes. Although sulfur-containing compounds were detected, the sensory results indicated formulation-dependent differences in cooked aroma, suggesting that the casein-rich matrix may influence volatile retention and release. Collectively, these findings indicate that protein-specific matrix interactions contribute to the thermal and sensory behavior of protein-fortified dairy systems and provide initial guidance for the formulation of thermally stable, protein-enriched dairy beverages.
1. Introduction
The expanding demand for infant formulas and targeted nutritional supplements has driven significant interest in high-protein milk powders [1]. To meet these needs, dairy formulations are increasingly fortified with protein derivatives, such as whey protein isolate (WPI) and milk protein concentrate (MPC), to enhance their nutritional profiles [2]. However, the thermal stability of these fortified systems is constrained by the divergent behaviors of their constituent proteins [3]. While casein remains largely unaffected by standard thermal processing [4], the globular structure of whey proteins renders them highly susceptible to denaturation and aggregation at temperatures exceeding 70 °C [5].
Heat treatment is a foundational process in dairy production to ensure microbiological safety and shelf-life stability; however, the specific processing parameters applied vary significantly depending on the intended functional outcome. In this study, a thermal treatment of 80 °C for 30 min was employed. These conditions were specifically selected to induce a controlled and consistent degree of denaturation of milk proteins [6,7], which is a fundamental prerequisite for analyzing the impact of thermal processing on the structural and sensory properties of high-protein dairy matrices. This standardized thermal history allowed for a rigorous comparison between the unheated controls and the heat-treated systems, facilitating an accurate evaluation of how heat-induced structural unfolding influences the matrix properties and volatile profile. In liquid dairy systems, these processes often result in undesirable browning and the development of off-flavors, which can significantly compromise consumer acceptance [8]. Specifically, the thermal denaturation of whey proteins, most notably β-lactoglobulin, triggers the formation of complex protein-lipid conjugates and disulfide-linked aggregates with κ-casein [9,10,11,12,13,14,15,16,17]. In high-protein environments, these interactions are intensified, creating a complex, dynamic volatilome that is difficult to predict through single-protein models [18,19,20,21].
While the thermal stability of individual MPC or WPI systems has been extensively documented, their synergistic and interactive effects within a blended whole milk (WM) matrix remain underexplored [22,23,24,25]. Recent advances in flavoromics, which integrate GC-MS profiling with multivariate statistical analysis, offer a robust framework for mapping these chemical shifts. Despite the widespread use of MPC and WPI to enhance dairy formulations, their combined impact on the thermal durability and sensory fingerprints of whole milk remains largely unknown.
This study investigates the heat-induced denaturation of high-protein fortified milk systems supplemented with MPC, WPI, or a combination of both. By bridging the gap between structural protein analysis and sensory flavor profiles, our findings provide actionable insights for developing thermally stable, protein-fortified dairy systems that maintain both nutritional functionality and consumer acceptability.
2. Materials and Methods
2.1. Sample Collection and Preparation
Ultra-high temperature (UHT) treated whole milk (WM; 138 °C for 2 s) was obtained from a regional marketplace (Beijing Sanyuan Foods Co., Ltd., Beijing, China). Milk protein concentrate (MPC) and whey protein isolate (WPI) powders were provided by Cezanne Company (Yinchuan, Ningxia, China). The nutritional composition of the base WM was determined using standard methods: protein content by the Kjeldahl method (N × 6.38), fat content by the Gerber method, total solids by gravimetric oven-drying at 105 °C, and carbohydrate by difference. The final composition of the fortified systems was calculated by mass balance using the measured WM composition and the manufacturer-provided nutritional specifications of MPC and WPI powders.
A total of four liquid dairy systems were prepared on a weight-to-weight basis (w w−1), as summarized in Table 1. The systems included: (1) WM: unfortified whole milk used as the control; (2) WM+MPC: 96% WM fortified with 4% MPC; (3) WM+WPI: 96% WM fortified with 4% WPI; and (4) WM+MPC+WPI: 96% WM fortified with a combination of 2% MPC and 2% WPI. The compositional values shown in Table 1 were calculated by mass balance using the measured composition of the base WM and the manufacturer-provided nutritional specifications of MPC and WPI powders. After preparation, total protein content was checked by the Kjeldahl method as a quality-control confirmation of the intended fortification level; these verification values are not reported in Table 1. All mixtures were prepared in stainless steel containers and stirred until complete hydration was achieved.
Table 1.
Nutritional composition of control and protein-fortified liquid systems (% w w−1).
Samples were subjected to thermal treatment in a controlled-temperature water bath at 80 °C. The samples were held for designated intervals of 0, 5, 10, and 30 min. Heated samples were denoted with the suffix “-H” (e.g., WM+MPC-H). Following thermal processing, all samples were immediately cooled in an ice-water bath and subsequently tempered at 25 °C for 1 h prior to analytical measurement to ensure the equilibration of protein structures and volatile release.
2.2. Protein Analysis
2.2.1. Determination of the Protein Profile
The protein profile was analyzed using SDS-PAGE, with minor modifications to the procedure described by Zenker et al. [25]. To standardize sample loading, each milk system was diluted to a protein concentration of 2% (w w−1) based on the total protein content of the corresponding formulation reported in Table 1. The samples were vortexed thoroughly before electrophoretic analysis to ensure homogeneity.
Protein samples were prepared under both reducing and non-reducing conditions. For reducing SDS-PAGE, 80 μL of each sample was mixed with 80 μL of double-concentrated reducing buffer. For non-reducing SDS-PAGE, 80 μL of each sample was mixed with 20 μL of five-fold concentrated non-reducing buffer. The mixtures were heated at 95 °C for 5 min in an Eppendorf Thermomixer, vortexed, and equilibrated at room temperature for 30 min. Subsequently, 8 μL of each prepared sample was loaded onto a 4–20% Super-PAGE Bis-Tris gel (Epizyme, Shanghai, China) and separated using a Mini P-4 vertical electrophoresis system (Cavoy, Beijing, China). Proteins were stained with Coomassie Brilliant Blue R-250 (0.01%, w v−1; Bio-Rad Laboratories, Hercules, CA, USA) for 1 h and destained overnight in an ethanol–acetic acid solution containing 250 mL anhydrous ethanol, 80 mL acetic acid, and 670 mL deionized water.
After destaining, the gels were scanned and analyzed using ImageJ software (Version 1.54f, NIH, Bethesda, MD, USA). Reducing SDS-PAGE was used for densitometric estimation of individual protein fractions, including caseins, β-LG, α-LA, and LF, whereas non-reducing SDS-PAGE was used to evaluate the formation of heat-induced high-molecular-weight aggregates. For the semi-quantitative values reported in Table 2, the relative intensity of each protein band was calculated as a percentage of the total lane intensity and then converted to mass-based protein fraction contents using the corresponding total protein content reported in Table 1.
Table 2.
Semi-quantitative protein fraction composition of the milk systems estimated by SDS-PAGE densitometry.
2.2.2. HPLC Quantification of Recoverable Soluble Whey Proteins
Protein quantification was carried out using an HPLC system (Agilent 1260, Agilent Technologies, Santa Clara, CA, USA) fitted with an AdvanceBio RP-mAb C4 column (4.6 × 150 mm, 3.5 µm), following the methodology established by Bordin et al. [26]. This method was used to quantify the recoverable soluble whey protein fractions, including α-LA, β-LG, and LF, in the pH 4.6 supernatant after acidification and centrifugation. Therefore, the measured values should be interpreted as recoverable soluble protein concentrations rather than total protein abundance or direct denaturation rates.
Subsequently, acidification and centrifugation were performed, followed by pH adjustment utilizing an accurate pH instrument in combination with certified calibration liquids (pH 4.0 and 7.0). A 1 mol L−1 HCl solution was prepared by diluting concentrated HCl (37%, Mreda Technology Co., Ltd., Beijing, China) using deionized water, adjusting the total volume to 100 mL. For pH adjustment, 20 mL portions of each sample were transferred to glass beakers, where the initial pH (6.6 ± 0.1) was measured. The pH was then lowered to 4.6 by gradually adding 1 mol L−1 HCl.
After acidification, the aliquots were moved into 50 mL centrifugal tubes of polypropylene, followed by stabilization at 20 °C for 20 min. The samples were subsequently centrifuged at 10,000× g for 30 min at 4 °C using a bench-top refrigerated centrifuge (Heraeus Multifuge ×1R, Thermo Fisher Scientific, Cleveland, OH, USA). The resulting supernatants were passed through 0.22 µm membrane filters into pre-labeled HPLC vials. Filtration was conducted using syringe-driven 0.22 µm membrane filters (Merck Millipore, Burlington, MA, USA) into pre-chilled glass vials, which were directly preserved at −20 °C. Before the HPLC procedure, the frozen samples were given 2 h to thaw at 4 °C. and vortexed to guarantee full redissolution of the contents.
For high-performance liquid chromatography (HPLC) analysis, the specimens were separated at a constant throughput of 1 mL min−1, utilizing a 10 µL injection volume, while the temperature of the column was held steady at 60 °C for the quantification of α-LA and β-LG, with measurement conducted at 210 nm. The solvent gradient initiated with 70% solvent A and 30% solvent B, gradually shifting to 45% solvent A and 55% solvent B at 10 min, then altering to 30% solvent A and 70% solvent B at 10.1 min, and reverting to the original solvent composition by 12.1 min, followed by an additional 17-min hold. For LF analysis, the column temperature was increased to 70 °C, and measurement was conducted at 280 nm. The LF gradient began with 95% solvent A and 5% solvent B for 2 min, then transitioned to 20% solvent A and 80% solvent B at 5 min, maintaining this formulation for 8 min before returning to the original solvent mix at 9 min, with a subsequent 13-min hold. Calibration curves were constructed separately for each protein using six concentration levels for each protein, with each analysis conducted in triplicate. Peak identification was performed by comparing the retention times of sample peaks with those of purified α-LA, β-LG, and LF standards analyzed under the same chromatographic conditions. The obtained regression equations showed acceptable linearity for α-LA, β-LG, and LF, with R2 values of 0.9962, 0.9922, and 0.9949, respectively. The sample-level RSD values ranged from 11.88% to 32.04% for α-LA, 1.51% to 21.68% for β-LG, and 4.10% to 19.75% for LF, indicating greater variability for selected low-abundance or matrix-affected peaks. Therefore, the HPLC results were interpreted as recoverable pH 4.6-soluble protein fractions rather than total protein abundance. Representative chromatograms are provided in Table S1. Accordingly, the three protein datasets are not directly interchangeable: Table 1 reports calculated total formulation protein, Table 2 reports semi-quantitative SDS-PAGE-based estimates of selected protein fractions, and Table 3 reports experimentally measured concentrations of soluble native whey proteins recovered in the pH 4.6 supernatant.
Having characterized the heat-induced protein aggregation and denaturation patterns, we next investigated the impact of these structural changes on the volatile organic compound (VOC) profile, which directly influences the sensory characteristics of the dairy system.
2.3. Analysis and Identification of the Volatile Organic Compounds (VOCs)
Extraction of Volatile Components by Solid-Phase Microextraction (HS-SPME-Arrow-GC-MS)
A 1 g portion of sodium chloride (NaCl) was combined with a 5 g sample, followed by the addition of 1 μL of a 0.816 mg mL−1 solution of 2-methyl-3-heptanone, sourced from Macklin Biochemical Co., Ltd. (Shanghai, China), as an internal reference. The mixture was transferred into a 10 mL amber container, capped with a rubber septum, and subjected to vortex mixing for thorough homogenization. The container was then immersed in a metal bath set at 45 °C for 20 min to facilitate equilibration. A 120 μm, 1.1 cm DVB/CAR/PDMS fiber (divinylbenzene/carboxen/polydimethylsiloxane; Agilent Scientific Instruments, Santa Clara, CA, USA) was introduced into the headspace, where it was equilibrated for 30 min at 45 °C, positioned 1 cm above the liquid level inside the sealed vessel. Following the extraction phase, the fiber was placed into the analytical port for thermal desorption and maintained at 230 °C for 5 min. Each specimen was examined in triplicate, and the data generated were processed using CDNN software (v.2.1, Applied Photophysics Ltd., Leatherhead, UK).
Volatile compound detection was performed using a gas chromatograph (Agilent 7890B, Agilent Technologies Co., Santa Clara, CA, USA), coupled with a solid-phase microextraction (SPME) arrow injector, a mass-selective detector (Agilent 5977, Agilent Technologies Co., USA), and a polyethylene glycol-based capillary column (Agilent DB-WAX, Agilent Scientific Instruments, Santa Clara, CA, USA; 60 m × 0.25 mm, 0.25-μm film thickness). Helium served as the carrier gas, with a constant flow rate of 1.2 mL min−1, and the system operated in a non-split mode, with the injector temperature maintained at 250 °C. The column oven was programmed according to the following temperature ramp: starting at 40 °C, increasing at 7 °C min−1 to 75 °C, then rising at 2 °C min−1 to 150 °C, followed by a 5 °C min−1 increment to 230 °C, where it was held for 2 min. The mass spectrometer operated in electron impact ionization mode with an electron energy of 70 eV, and the ion source temperature was maintained at 230 °C. Full-scan acquisition was performed over an m/z range of 30–350. VOCs were identified by comparing the acquired mass spectra with the NIST 14 and Shimadzu databases and were further confirmed using linear retention indices (LRI) calculated relative to a C7–C40 n-alkane series according to van den Dool and Kratz (1963) [27]. Relative concentrations were determined by semi-quantitation using 2-methyl-3-heptanone as the internal standard, following the method of Huang et al. [28].
2.4. Quantitative Descriptive Analysis (QDA)
The sensory profile of the dairy specimens was evaluated using Quantitative Descriptive Analysis (QDA) [29]. The panel consisted of eight trained participants (two males and six females, aged 18–27 years) from Beijing Technology and Business University. Participants were screened for their ability to distinguish aroma differences among dairy samples and provided informed consent after reviewing the study aims, methodology, and procedures. Because the panel size was limited and the assessors were from a relatively narrow age range and institutional background, the sensory results were interpreted as descriptive panel data rather than as consumer acceptance or population-level preference data.
Prior to the formal evaluation, the panel reached consensus on the sensory descriptors and reference standards. Five aroma attributes were defined: milky, dairy fat, cooked, oxidized, and grassy. Reference standards for these descriptors were established as outlined in Table S1. Panelists were familiarized with the descriptor definitions, reference standards, sample presentation procedure, and the use of the unstructured 15-point intensity scale before formal scoring.
A randomized complete block design (RCBD) was used across two sessions, with four samples evaluated per session to reduce sensory fatigue. Each of the eight sample types (WM, WM-H, WM+MPC, WM+MPC-H, WM+WPI, WM+WPI-H, WM+MPC+WPI, and WM+MPC+WPI-H) was evaluated in triplicate by each panelist. For statistical analysis, the triplicate scores were first averaged for each panelist × sample combination, so that panelists rather than repeated scores served as the experimental units in the sensory model. Samples (10 mL) were presented in odorless, sealed glass vials labeled with three-digit random codes. The assessment focused exclusively on orthonasal olfaction; samples were not ingested. Aroma intensity was rated on an unstructured 15-point line scale (0 = none, 15 = strong). Water and plain crackers were provided between evaluations.
Following thermal treatment at 80 °C for 30 min, samples were rapidly cooled to 25 °C in an ice-water bath with continuous agitation for 5 min and stabilized for 30 min before evaluation.
2.5. Statistical Analysis
Replicate-based results, including HPLC, VOC, and sensory measurements, are presented as mean ± standard deviation. Calculated formulation compositions and semi-quantitative SDS-PAGE estimates are reported without standard deviations because they were not treated as independent replicate response variables. Data were meticulously documented, with initial computations carried out using Microsoft Excel 2025 (Microsoft, Redmond, WA, USA). Statistical analyses were performed using SPSS 27.0 software (SPSS Inc., Chicago, IL, USA), with significance established at p < 0.05. HPLC data were analyzed separately for each protein fraction using one-way ANOVA. Tukey’s post hoc test was applied when variance homogeneity was satisfied, whereas the Games–Howell test was used when variance homogeneity was not satisfied. For sensory data, triplicate scores were first averaged for each panelist × sample combination. Each sensory descriptor was then analyzed separately using a univariate general linear model with sample as the fixed effect and panelist as a blocking factor. Pairwise comparisons among samples were adjusted using the Bonferroni method. To visually illustrate the data, bar charts, radar diagrams, and correlation graphs were generated using Origin 2025 (OriginLab Corporation, Northampton, MA, USA). Principal component analysis (PCA) was conducted using SIMCA 14.1.0 software (Umetrics AB, Umeå, Sweden) to assess data patterns and reduce dimensionality. Heatmap and clustering analyses were performed using ChiPlot (https://www.chiplot.online/, accessed on 6 September 2025). XLSTAT software (version 2019.2.2, Addinsoft, New York, NY, USA) was used for partial least squares regression (PLSR) to explore relationships among variables.
3. Results and Discussion
3.1. Sample Composition and Protein Profile (Gel Electrophoresis)
3.1.1. Compositional Analysis
The nutritional composition of the four liquid systems (WM, WM+MPC, WM+WPI, and WM+MPC+WPI) is summarized in Table 1. The compositional values were calculated by mass balance using the measured composition of the base whole milk and the manufacturer-provided nutritional specifications of MPC and WPI powders. As expected from the formulation design, the total protein content increased from 3.30% in the unfortified WM control to 5.97%, 6.77%, and 6.37% in the WM+MPC, WM+WPI, and WM+MPC+WPI systems, respectively. The WPI-fortified system showed the highest calculated protein content because of the higher protein concentration of WPI compared with MPC. Fat and carbohydrate contents remained within a relatively narrow range across the formulations, reflecting the fixed proportion of whole milk in all systems and the comparatively low addition level of the protein powders. These compositional data provide the basis for interpreting the subsequent SDS-PAGE and HPLC results.
3.1.2. Effects of Different Protein Compositions
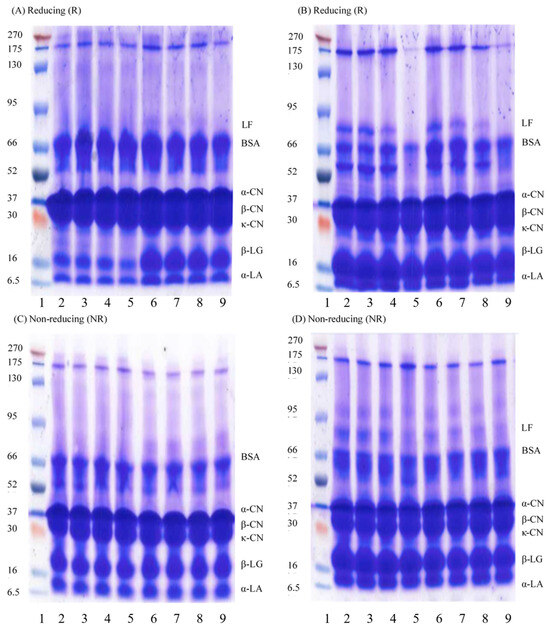
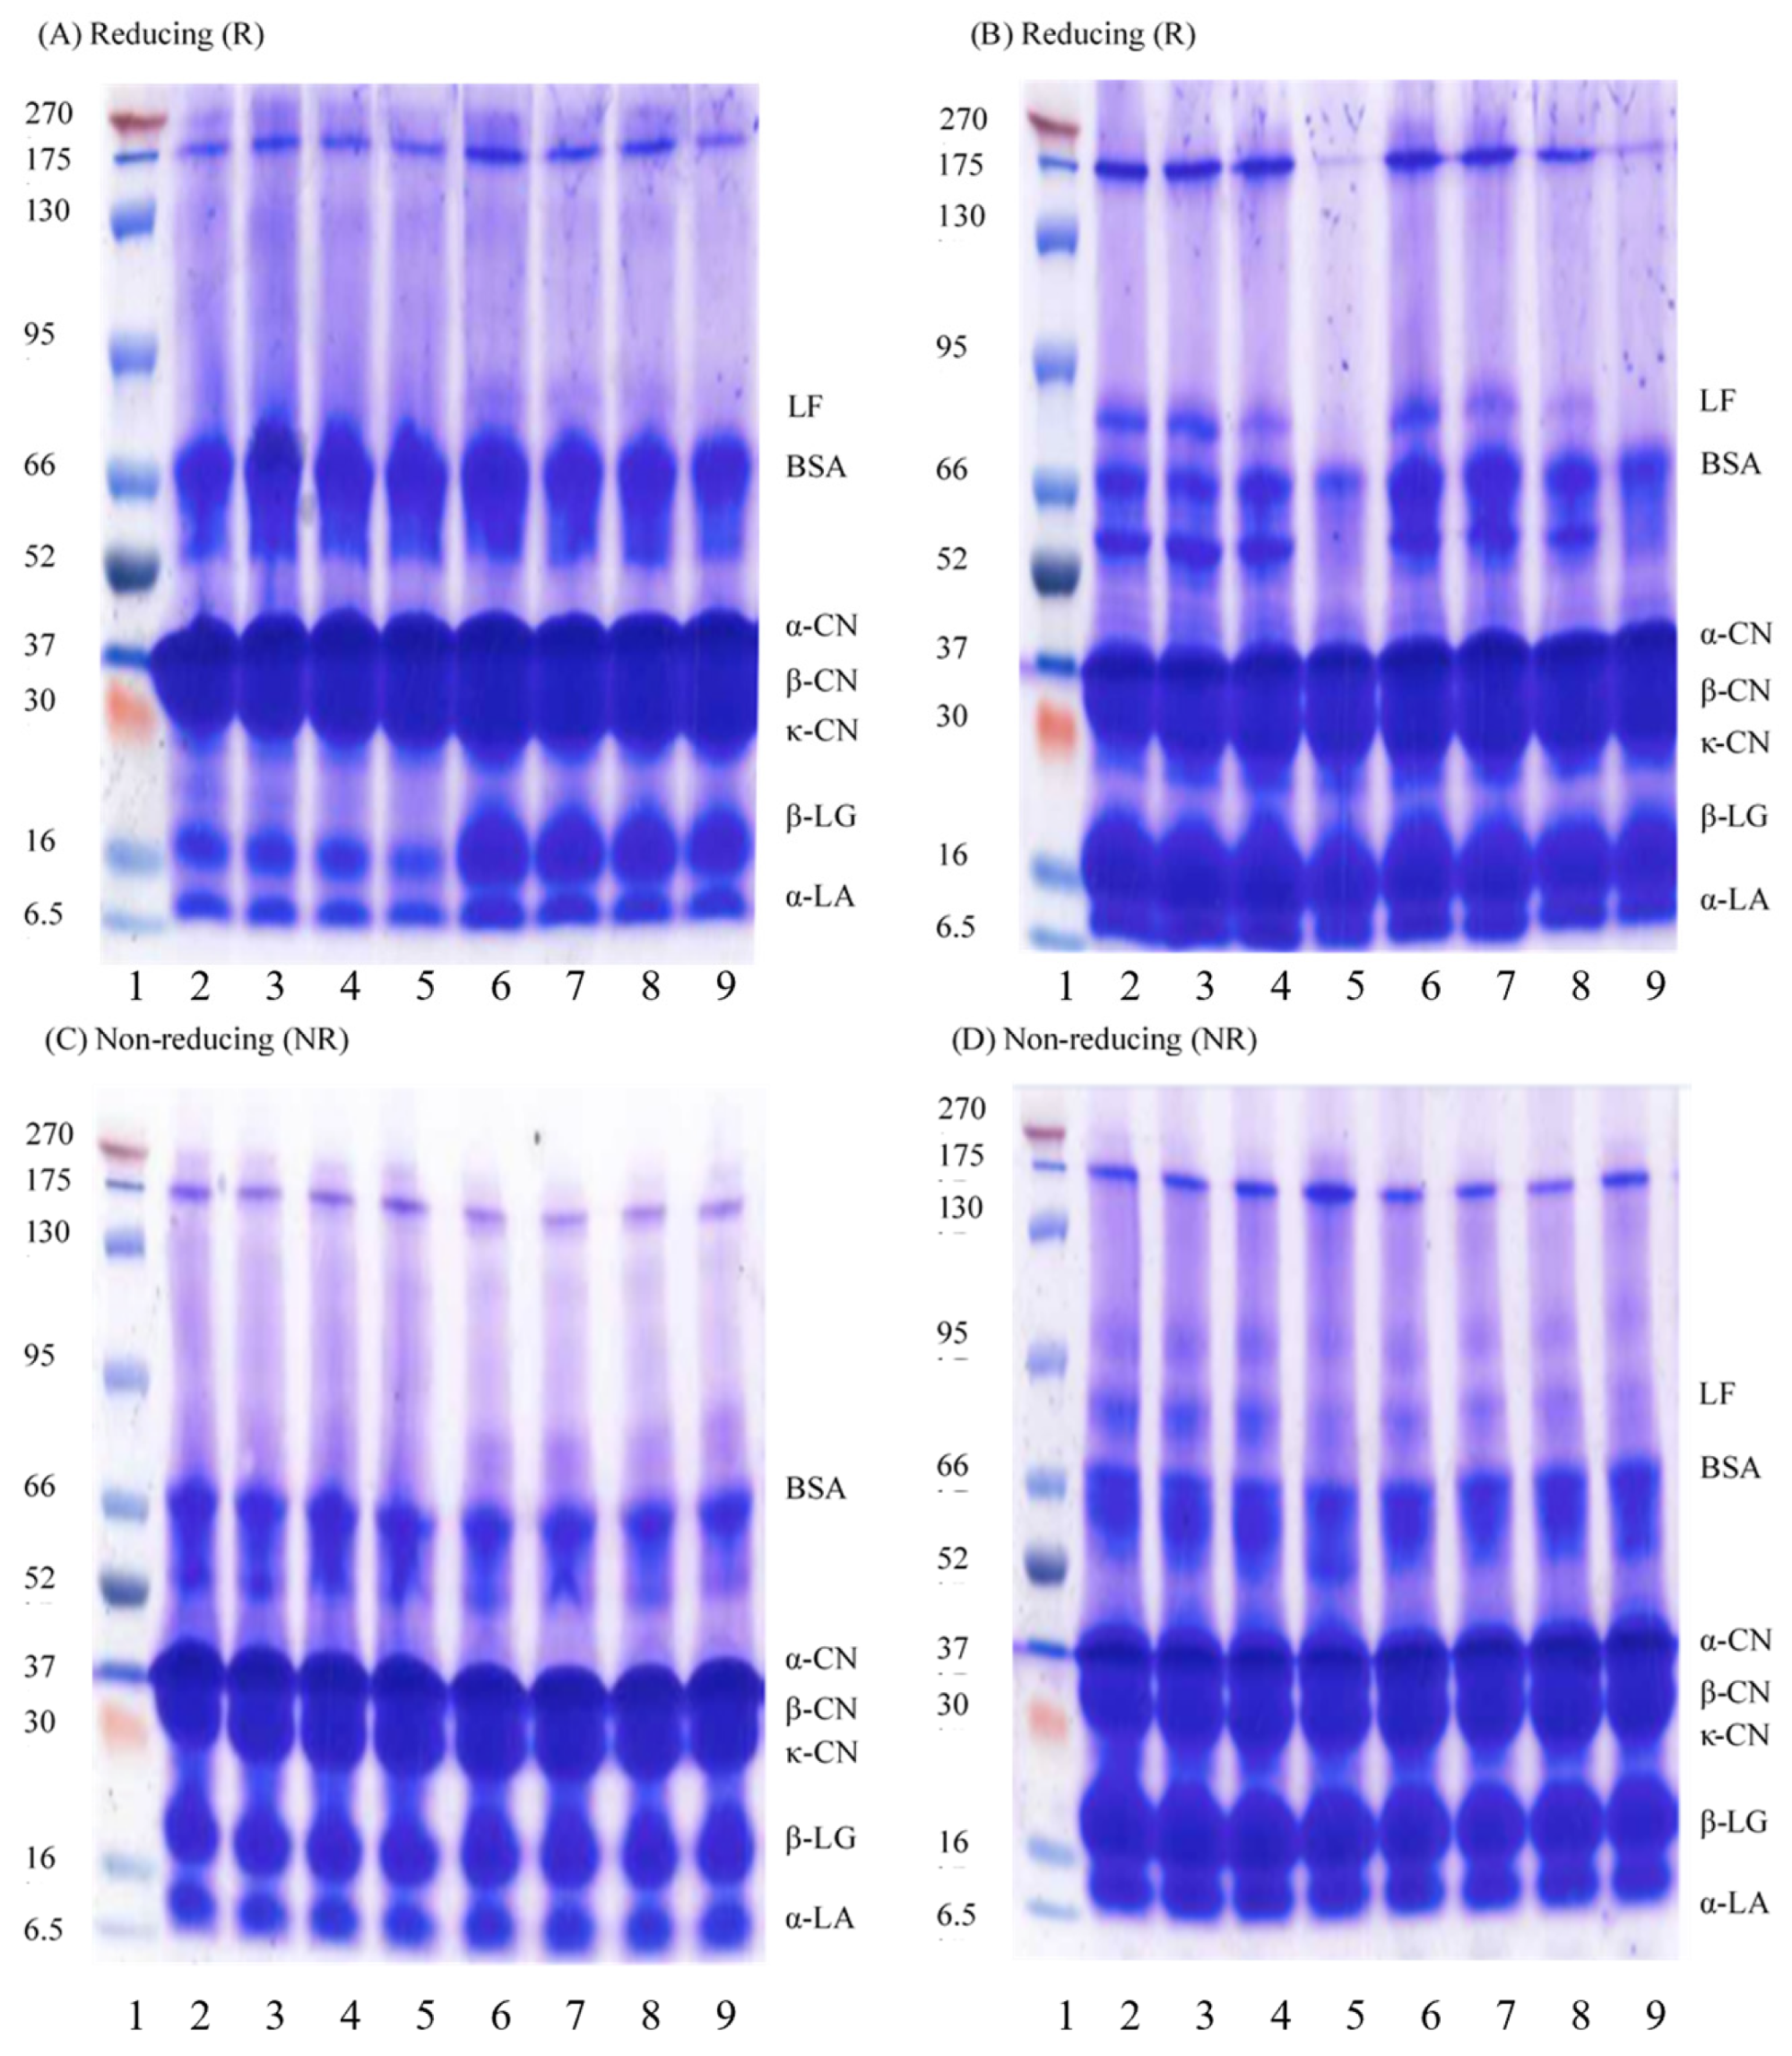
SDS-PAGE analysis (Figure 1) was used to characterize the protein profiles of WM and protein-fortified milk systems under reducing and non-reducing conditions. Reducing SDS-PAGE (Figure 1A,B) enabled the identification of the major protein fractions, including caseins, β-LG, α-LA, and LF [30], whereas non-reducing SDS-PAGE (Figure 1C,D) was used to evaluate the formation of heat-induced high-molecular-weight aggregates [31,32,33]. The estimated protein fraction composition derived from SDS-PAGE densitometry is summarized in Table 2.
Figure 1.
SDS-PAGE analysis of protein profiles in whole milk (WM) and fortified WM formulations (WM+MPC, WM+WPI, and WM+MPC+WPI) under reducing (R) and non-reducing (NR) conditions. Panels (A,B) represent reducing SDS-PAGE profiles, whereas panels (C,D) represent non-reducing SDS-PAGE profiles. In panel (A) (R), lane 1 represents the molecular weight marker; lanes 2–5 represent WM and WM-H treated at 80 °C for 5, 10, and 30 min, respectively; lanes 6–9 represent WM+MPC and WM+MPC-H treated at 80 °C for 5, 10, and 30 min, respectively. In panel (B) (R), lane 1 represents the molecular weight marker; lanes 2–5 represent WM+WPI and WM+WPI-H treated at 80 °C for 5, 10, and 30 min, respectively; lanes 6–9 represent WM+MPC+WPI and WM+MPC+WPI-H treated at 80 °C for 5, 10, and 30 min, respectively. Panels (C,D) show the corresponding samples under non-reducing conditions. Protein bands were assigned according to their apparent molecular weights relative to the molecular weight marker. The major protein regions were identified as lactoferrin (LF, ~80 kDa), bovine serum albumin (BSA, ~66 kDa), α-casein (α-CN, ~25 kDa), β-casein (β-CN, ~24 kDa), κ-casein (κ-CN, ~19 kDa), β-lactoglobulin (β-LG, ~18.4 kDa), and α-lactalbumin (α-LA, ~14.2 kDa). Numerical lane assignments and band quantification are provided in the text and Table 2.
Under reducing conditions, β-mercaptoethanol disrupted disulfide-linked structures, allowing the major protein fractions to migrate mainly according to their molecular weights [32,33]. The reducing gels showed clear casein, β-LG, and α-LA bands across the WM, WM+MPC, WM+WPI, and WM+MPC+WPI systems. Compared with WM and WM+MPC, the WPI-fortified samples showed visibly stronger β-LG and α-LA bands, consistent with the higher whey protein contribution in this formulation. In contrast, the WM+MPC samples showed a stronger casein region, reflecting the casein-rich composition of MPC. These observations are consistent with the semi-quantitative protein fraction estimates reported in Table 2.
Under non-reducing conditions, more material was retained near the upper region of the gels and at the stacking/resolving interface, indicating the presence of high-molecular-weight protein aggregates. This pattern was more evident in the heated samples, particularly in WPI-containing systems, suggesting that whey proteins, especially β-LG, contributed to heat-induced disulfide-linked aggregation [13,31,33]. The MPC-containing systems showed comparatively less pronounced aggregation, which may be related to the higher casein content and the ability of casein-rich matrices to modulate whey protein interactions during heating [32,33]. Overall, the SDS-PAGE results indicate that protein composition strongly influenced the thermal aggregation behavior of the milk systems: WPI increased the contribution of heat-sensitive whey proteins, whereas MPC provided a casein-rich matrix that appeared to moderate aggregate formation.
3.1.3. HPLC Analysis of Recoverable Soluble Whey Proteins
The quantitative impact of thermal treatment on individual whey proteins, α-LA, β-LG, and LF, was evaluated via HPLC, with results summarized in Table 3.
Because commercial UHT whole milk was used as the base matrix, the unheated WM sample should be interpreted as an experimental baseline rather than as a raw or fully native milk control. Prior UHT processing may already have induced partial whey protein denaturation, aggregation, or association with casein micelles, thereby affecting the amount of whey protein recovered in the pH 4.6 soluble fraction. Therefore, the HPLC results in this study represent the recoverable soluble whey protein fraction remaining after acidification and centrifugation, and the effects of the subsequent 80 °C, 30 min treatment should be interpreted as additional heat-induced changes relative to this UHT-treated baseline.
Thermal treatment (80 °C, 30 min) affected the recovery of native whey proteins in the pH 4.6 soluble fraction. In WM, α-LA and β-LG were detected at low concentrations in the acid-soluble supernatant. These values should not be interpreted as the total whey protein composition of bovine milk, because the HPLC analysis was performed after acidification to pH 4.6 and centrifugation, which removed caseins and protein fractions associated with denatured or aggregated material. The slight numerical increase in α-LA after heating in WM was not statistically significant, as indicated by the shared superscript letters in Table 3, and most likely reflects variation in the recovery of the low-abundance soluble native fraction after acidification and centrifugation [34]. Similarly, the apparent increase in LF in heated WM may reflect heat-induced redistribution or improved recovery of LF in the soluble fraction rather than an increase in total LF content. Therefore, the HPLC data in Table 3 are interpreted as changes in the recoverable soluble native fraction, rather than as total protein abundance. Because some values, particularly the low α-LA and β-LG concentrations in WM and the apparent LF increase after heating, may be affected by prior UHT processing, acidification, centrifugation, and peak recovery, these patterns were interpreted only as changes in recoverable soluble proteins. Peak assignments were checked against purified protein standards, and the repeatability of the chromatographic measurements was confirmed before statistical analysis. In WPI-containing systems, soluble β-LG showed a numerical decrease after heating, indicating the thermal susceptibility of β-LG and its possible involvement in heat-induced aggregation.
To further understand the molecular mechanisms underlying these variations, previous chromatographic and protein-aggregation studies indicate that native milk systems contain soluble whey protein fractions, whereas heated or fortified formulations may contain denatured proteins, aggregates, and smaller soluble protein components [31,32,34]. These studies confirm the simultaneous presence of both denatured and native whey protein components. In the WPI-supplemented system, soluble β-LG numerically decreased from 6.469 ± 1.044 to 5.193 ± 0.304 mg mL−1 after heating, corresponding to an approximately 19.7% reduction based on mean values, whereas α-LA showed a smaller numerical decrease from 0.373 ± 0.105 to 0.330 ± 0.078 mg mL−1. Because the β-LG values shared common superscript letters in Table 3, this change should be interpreted as a numerical tendency rather than a statistically significant difference. This numerical pattern suggests that β-LG was more susceptible than α-LA to heat-induced loss from the soluble native fraction, consistent with the higher thermal stability conferred by the compact disulfide-stabilized structure of α-LA [35]. LF showed a matrix-dependent recovery pattern in the pH 4.6 soluble fraction. Because LF was measured only in the acid-soluble supernatant after centrifugation, the values should be interpreted as recoverable soluble LF rather than total LF abundance. Therefore, no direct conclusion about LF formation or total LF stability was drawn from these data.
The combined SDS-PAGE and HPLC results provide complementary information on heat-induced protein transitions. SDS-PAGE described the overall protein profile and the formation of high-molecular-weight aggregates, whereas HPLC quantified the native whey protein fraction remaining soluble after acidification to pH 4.6. Therefore, the two methods should not be interpreted as directly interchangeable. Nevertheless, the depletion of soluble β-LG in WPI-containing systems observed by HPLC is consistent with the stronger aggregation tendency observed in the non-reducing SDS-PAGE profiles.
Overall, the influence of protein fortification depended on the initial protein composition and the matrix environment. WPI-containing systems had higher initial soluble β-LG levels because of the whey-rich composition of WPI, but they also showed a numerical tendency toward decreased soluble β-LG after heating. MPC-containing systems showed lower soluble β-LG levels but appeared to moderate aggregate formation in the SDS-PAGE profiles, likely because of the higher casein content. These results indicate that thermal behavior in fortified milk systems is governed by both the concentration of heat-sensitive whey proteins and their interactions with the surrounding casein-rich matrix.
Table 3.
HPLC quantification of soluble native whey proteins in milk systems (pH 4.6 supernatant).
3.2. Analysis of Volatile Organic Compounds (VOCs) Profiles
The VOC profiles of the milk systems were analyzed using HS-SPME-arrow-GC-MS to evaluate the effects of thermal treatment and protein fortification on aroma-related compounds. Headspace-based extraction techniques, including SPME, have been widely used for the characterization of volatile compounds in milk and dairy powders because they are suitable for detecting lipid-derived, protein-derived, and heat-induced volatiles in complex dairy matrices [36,37,38]. In the present study, 46 VOCs were identified, including alcohols, aldehydes, acids, esters, ketones, and other compounds (Table S2). These compound classes are consistent with previously reported volatile profiles of heated milk, milk powders, whey protein ingredients, and milk protein concentrates [37,39,40,41,42,43,44].
Aldehydes and short-chain fatty acids were important components of the volatile profile in the WM system. Compounds such as hexanal and nonanal are commonly associated with lipid oxidation pathways, while short-chain fatty acids such as butanoic acid and octanoic acid are related to fat-derived dairy aroma notes [39,40,42,43,45]. Lipid oxidation is a major pathway for the generation of aldehydes in milk and milk powders, especially during heat treatment and storage [40,44,45]. Therefore, the detection of these compounds suggests that lipid oxidation and fat-related degradation contributed to the VOC profile of the milk systems. The role of milk fat in shaping dairy aroma has also been reported in fermented milk systems, where fat content influenced the formation and perception of volatile compounds [46].
Protein fortification altered the VOC profile, indicating that protein composition influenced volatile formation and/or volatile retention during heating. The MPC-containing systems were characterized by a casein-rich matrix, whereas the WPI-containing systems supplied a higher proportion of heat-sensitive whey proteins. Whey proteins can undergo heat-induced unfolding and aggregation, and these structural changes may influence volatile formation, binding, and release [42,47]. WPI and WPC systems have been associated with characteristic volatile compounds and off-flavor development, including cooked, cabbage-like, cardboard, and oxidized notes, depending on processing and storage conditions [48,49,50,51,52,53,54]. Thus, the higher contribution of heat-associated volatiles in WPI-containing systems may be related to the greater availability of whey proteins and their susceptibility to thermal reactions.
Sulfur-containing compounds were also considered because they are important contributors to cooked and sulfurous aroma notes in heated dairy products. Jo et al. identified volatile sulfur compounds generated in milk during thermal processing and showed that these compounds are closely related to heat-induced flavor development [55]. In the present study, sulfur-containing compounds such as dimethyl trisulfide and dimethyl sulfone were detected in selected samples. Although these compounds were present at relatively low concentrations compared with several aldehydes, acids, and ketones, sulfur volatiles may still have sensory relevance because of their strong odor characteristics and their reported association with cooked or sulfurous dairy aroma [42,48,55]. However, odor activity values were not calculated in this study. Therefore, the contribution of individual sulfur compounds should be discussed in relation to their reported odor characteristics or odor detection/recognition thresholds, rather than being interpreted using OAV-based criteria.
The blended WM+MPC+WPI system showed an intermediate volatile profile compared with the single-protein-fortified systems, suggesting that casein-rich and whey-protein-rich fractions jointly influenced volatile development during heating. Previous studies on milk proteins and milk protein concentrates have shown that protein composition, processing conditions, and storage can strongly affect flavor formation and flavor stability [41,42,43,44]. In addition, aroma release from food matrices can be influenced by fat replacement, rheological properties, and matrix structure, indicating that volatile concentration alone does not fully determine perceived aroma intensity [56,57]. Therefore, the VOC differences among formulations may reflect not only the generation of volatile compounds but also matrix-dependent volatile retention and release.
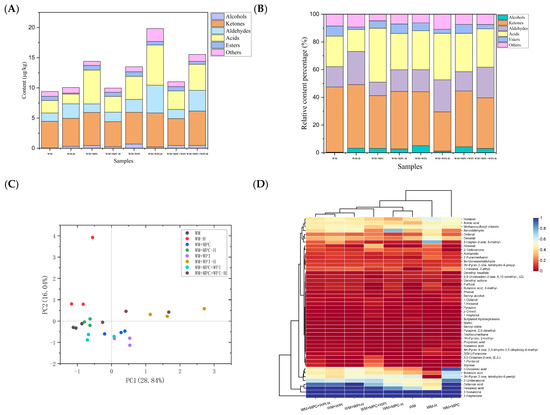
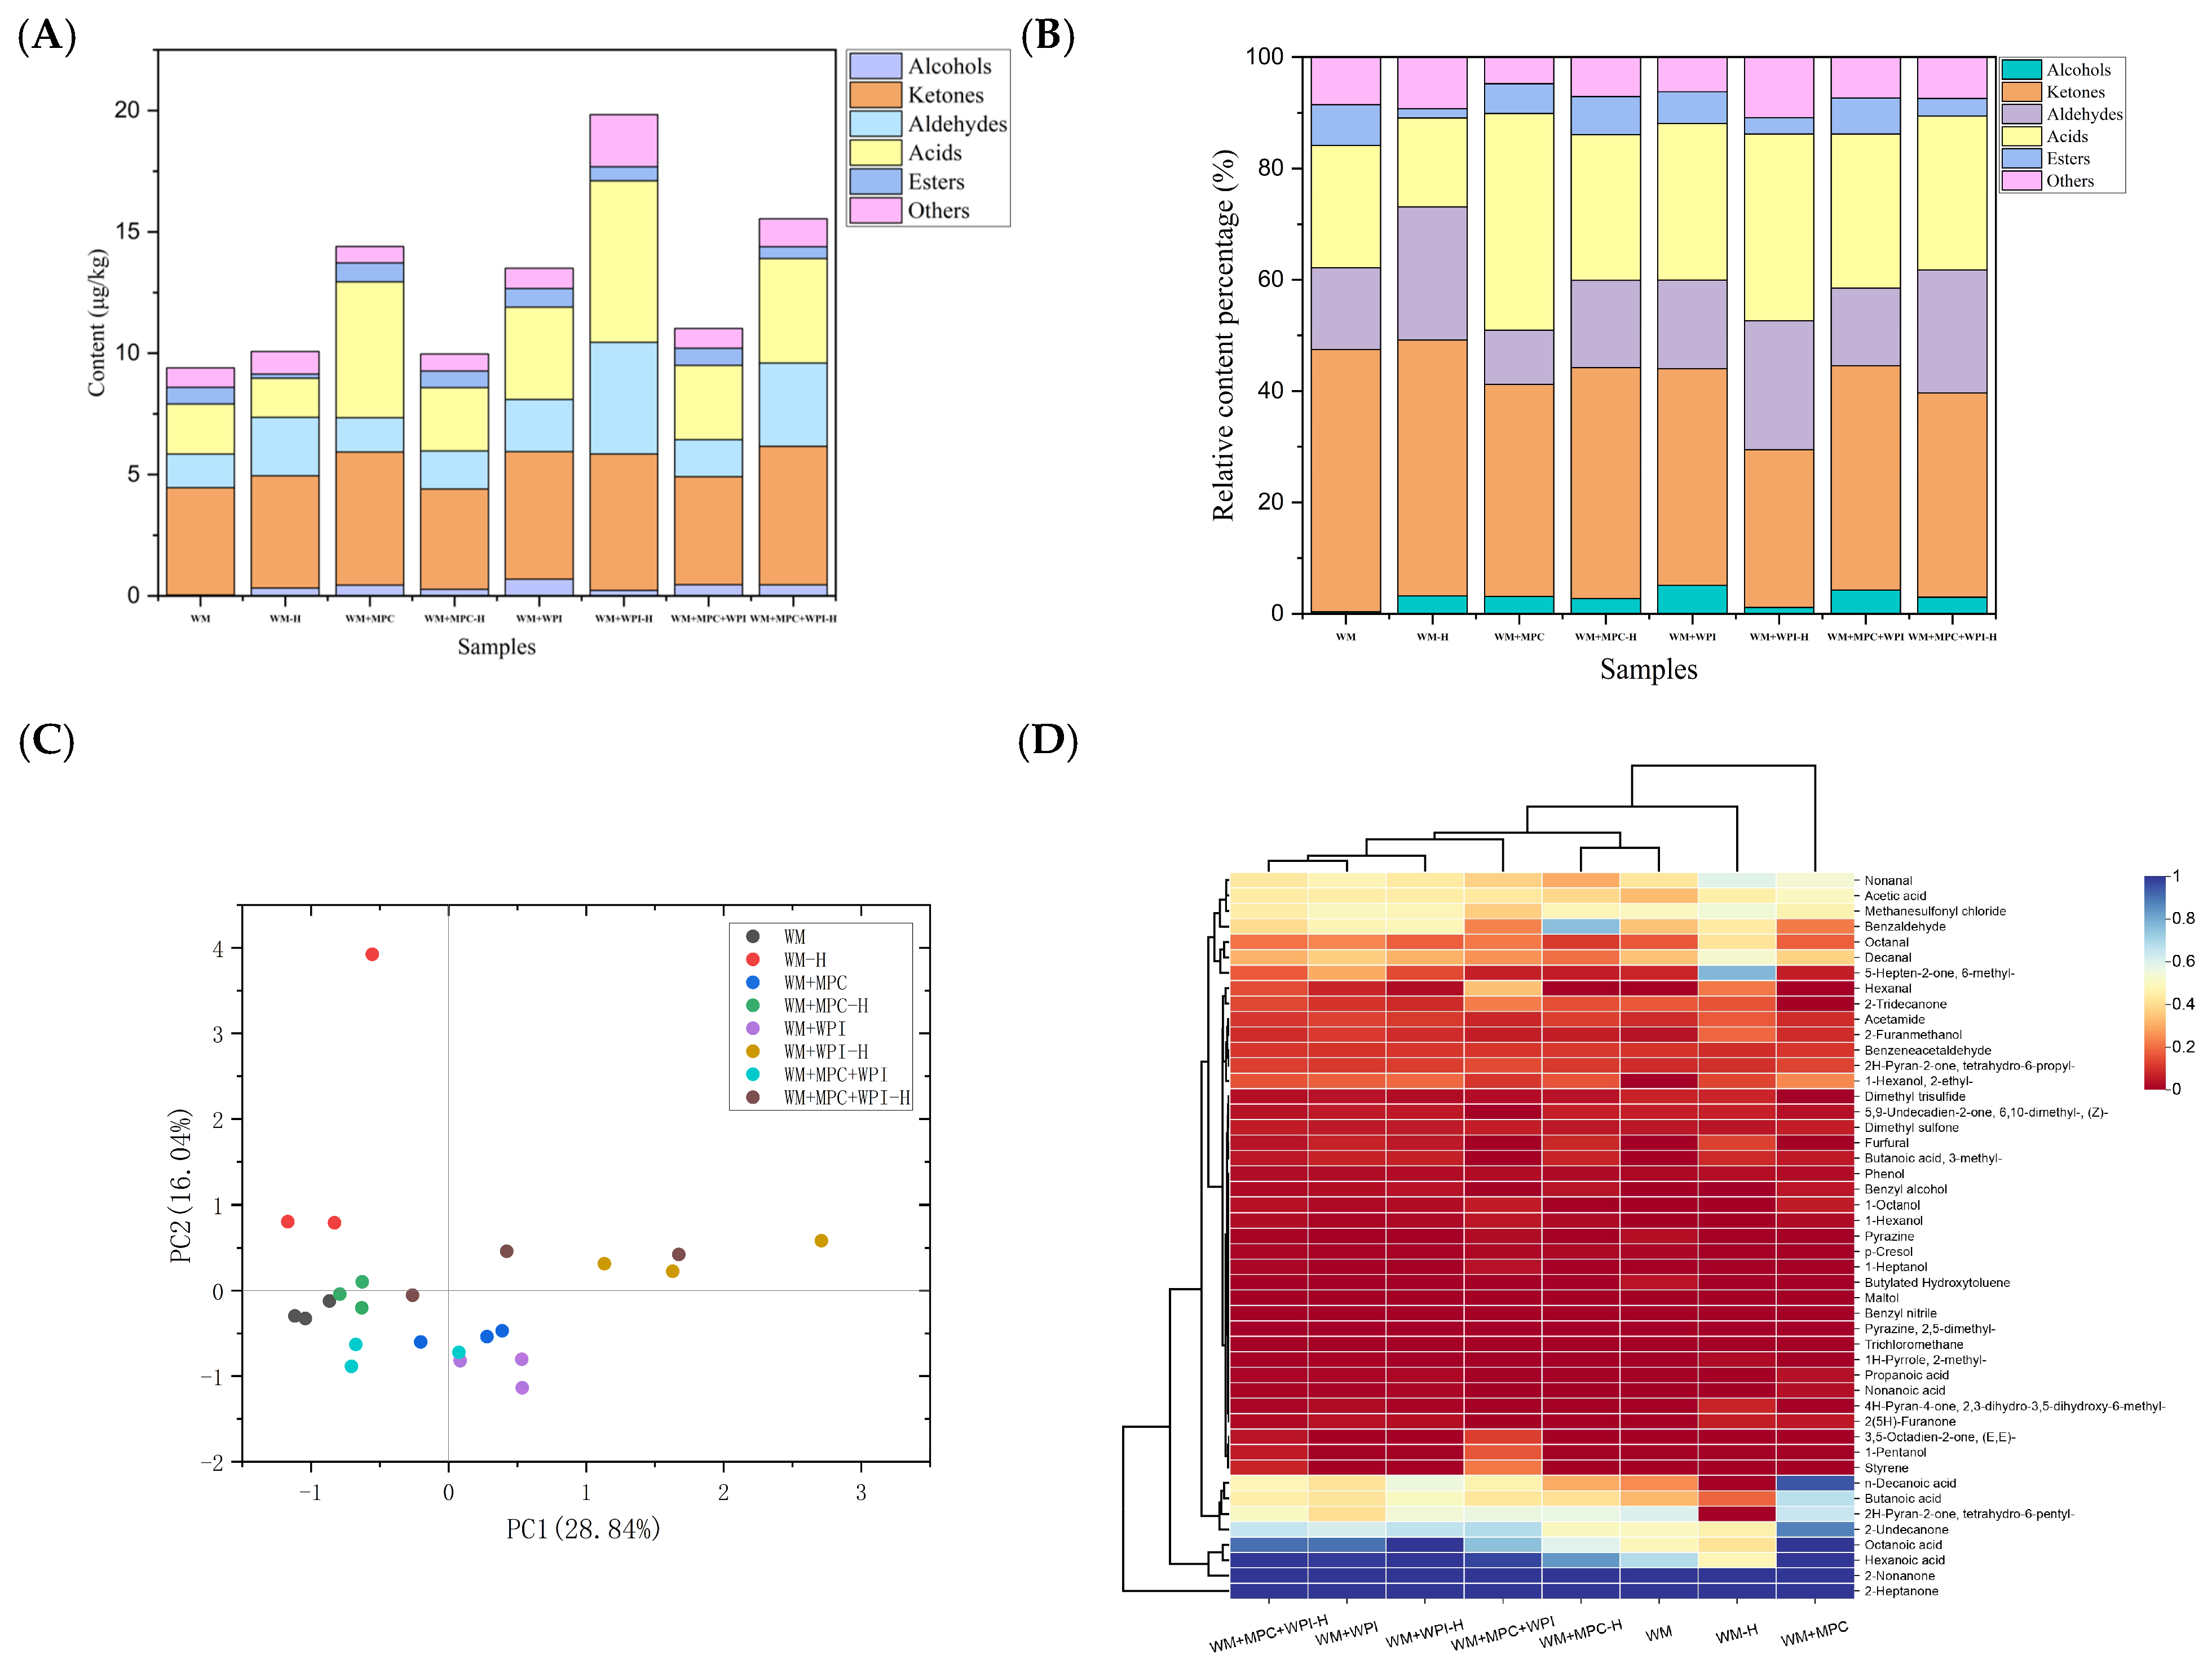
PCA and hierarchical clustering were used as exploratory tools to visualize differences in VOC profiles among the milk systems (Figure 2). The PCA plot showed some separation tendencies among formulations and heat-treated samples; however, the first two principal components explained less than half of the total variance. Therefore, the PCA results should be interpreted as exploratory visualization rather than definitive evidence of complete group separation. Overall, the VOC results indicate that thermal treatment and protein fortification modified the volatile profile of the milk systems. However, the relationship between individual VOCs and sensory perception should be interpreted cautiously because aroma perception depends on compound concentration, odor threshold, volatility, matrix binding, and interactions among volatile compounds.
Figure 2.
Volatile organic compound (VOC) profiles of milk systems after heat treatment and protein fortification, determined by HS-SPME-arrow-GC-MS. (A) Relative VOC content. (B) Relative percentage of VOC classes. (C) Exploratory PCA score plot of VOC profiles. (D) Hierarchical clustering heatmap of VOCs.
3.3. Sensory Characteristics
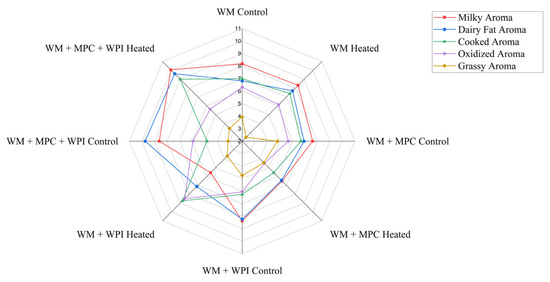
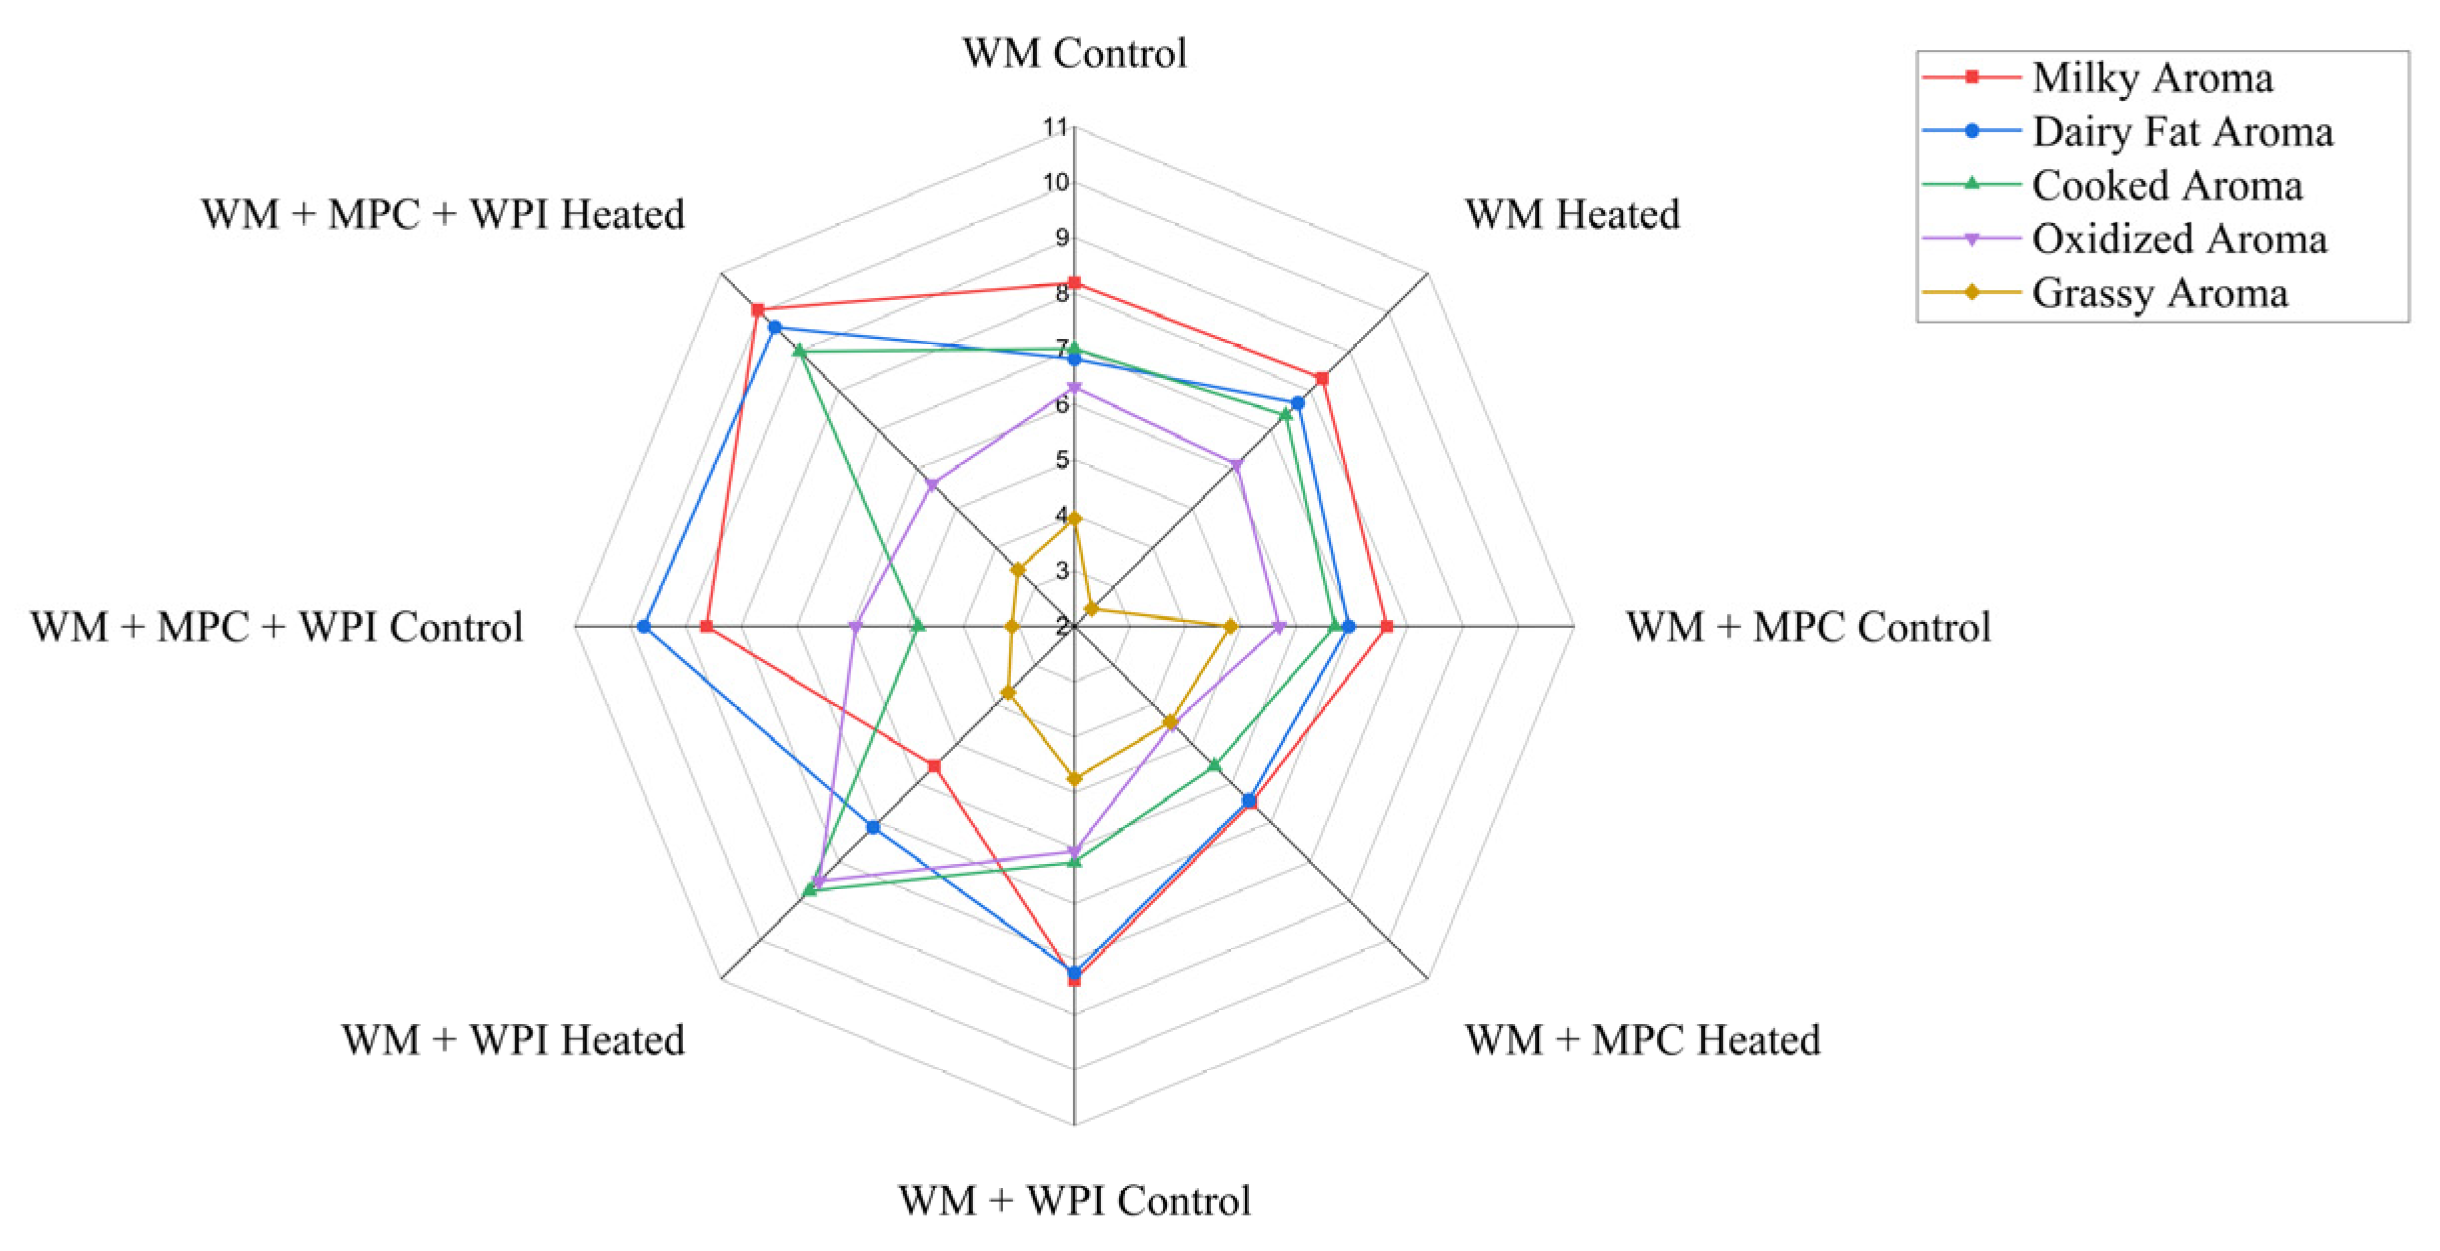
The sensory characteristics of the milk systems were evaluated by quantitative descriptive analysis (QDA) to determine how thermal treatment and protein fortification affected aroma perception. QDA has been widely used for sensory profiling of dairy products because it allows specific sensory attributes to be described and compared across formulations [58]. In the present study, the radar plot provides an overview of the sensory patterns (Figure 3), while Table 4 presents the mean scores and statistical groupings obtained after reanalysis of the sensory data. Because triplicate scores were averaged for each panelist × sample combination and the model accounted for panelist effects, the revised statistical analysis provides a more conservative interpretation of sensory differences among samples.
Figure 3.
Radar plot of aroma attribute intensities in milk samples after heat treatment and protein fortification. Each polygon shape represents the complete sensory profile of a sample. Scales range from 0 (none) to 15 (extremely strong).
Table 4.
Sensory Evaluation of Aroma Descriptors for Different Samples.
Given the limited number of trained assessors and the narrow demographic range of the panel, the sensory data should be interpreted as descriptive aroma profiling results for the tested formulations rather than as evidence of consumer preference, market acceptance, or broad population-level sensory responses.
For milky aroma, the mean scores ranged from 5.56 to 10.06. WM+MPC+WPI-H showed the highest numerical score, whereas WM+WPI-H showed the lowest numerical score. However, only this pair differed significantly after Bonferroni-adjusted pairwise comparisons. Therefore, the results do not support a broad conclusion that thermal treatment consistently reduced milky aroma across all formulations. Instead, the effect of heat treatment on milky aroma appeared to be formulation-dependent. This may be related to differences in protein composition, heat-induced changes in the dairy matrix, and milk protein–volatile interactions, which can influence the retention, release, and perception of aroma compounds in protein-rich dairy systems [57,59].
Dairy fat aroma showed higher numerical scores in the blended WM+MPC+WPI and WM+MPC+WPI-H systems. Significant differences were mainly observed between WM+MPC-H and the two blended MPC/WPI systems, while most other samples were not significantly different. These results suggest that the combined use of MPC and WPI may influence perceived dairy fat aroma, possibly through changes in protein–fat interactions, volatile binding, or aroma release. Interactions between milk proteins and volatile flavor compounds are important in protein-fortified foods because they may alter the headspace concentration and sensory availability of aroma compounds [57]. However, because many sample pairs shared common superscript letters, these differences should be interpreted as formulation-dependent tendencies rather than general effects across all fortified systems.
Cooked aroma was affected most clearly in the blended MPC/WPI formulation. WM+MPC+WPI-H showed a significantly higher cooked aroma score than the corresponding unheated WM+MPC+WPI sample. This result suggests that heating promoted cooked aroma perception in this formulation, possibly through heat-induced changes in protein structure and matrix composition. Thermal processing and storage can alter the physicochemical characteristics of milk, including protein interactions and colloidal stability, which may influence aroma release and sensory perception [59]. Nevertheless, most other pairwise comparisons for cooked aroma were not significant, indicating that cooked aroma development was not uniformly increased across all heated samples.
Oxidized aroma differed significantly only between WM+MPC-H and WM+WPI-H. The higher oxidized aroma score in WM+WPI-H suggests that the heated WPI-containing system may have been more prone to oxidized aroma perception than the heated MPC-containing system under the present processing condition. This tendency is consistent with the VOC results, where lipid oxidation-related aldehydes were detected. Previous work has shown that volatile compounds are closely associated with sensory properties of bovine milk, although the relationship between individual VOCs and sensory perception depends on compound concentration, odor threshold, and matrix effects [60]. Therefore, this interpretation should be limited to the statistically supported comparison rather than extended to all WPI-containing samples.
For grassy aroma, no significant differences were observed among the eight samples. Although certain aldehydes, such as hexanal, may be associated with green or grassy notes, the sensory scores did not show significant separation among samples. Faulkner et al. reported that changes in bovine milk volatile profiles can be associated with sensory differences, including attributes related to feeding system and milk aroma quality [60]. In the present study, however, the detected VOC differences did not translate into statistically distinguishable grassy aroma perception by the trained panel. Therefore, grassy aroma appeared to be less affected by thermal treatment and protein fortification than cooked or oxidized aroma under the present experimental conditions.
Overall, the sensory effects of thermal treatment and protein fortification were formulation- and descriptor-dependent, and most numerical differences should be interpreted cautiously unless supported by significant pairwise comparisons. When considered together with the VOC data, WPI-containing heated systems showed tendencies toward stronger cooked or oxidized aroma, whereas MPC-containing and blended systems exhibited different aroma patterns. Because compound-specific OAVs were not calculated and the multivariate analyses identify associations rather than causal relationships, these findings should be interpreted as supportive associations rather than definitive mechanistic evidence.
3.4. Correlation Analysis
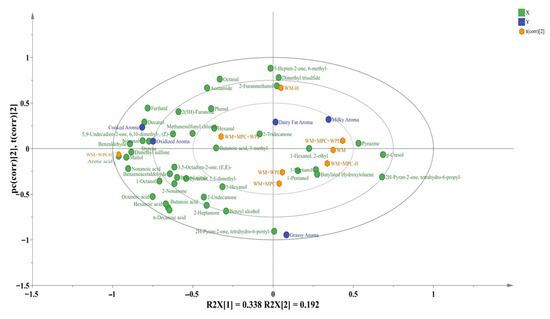
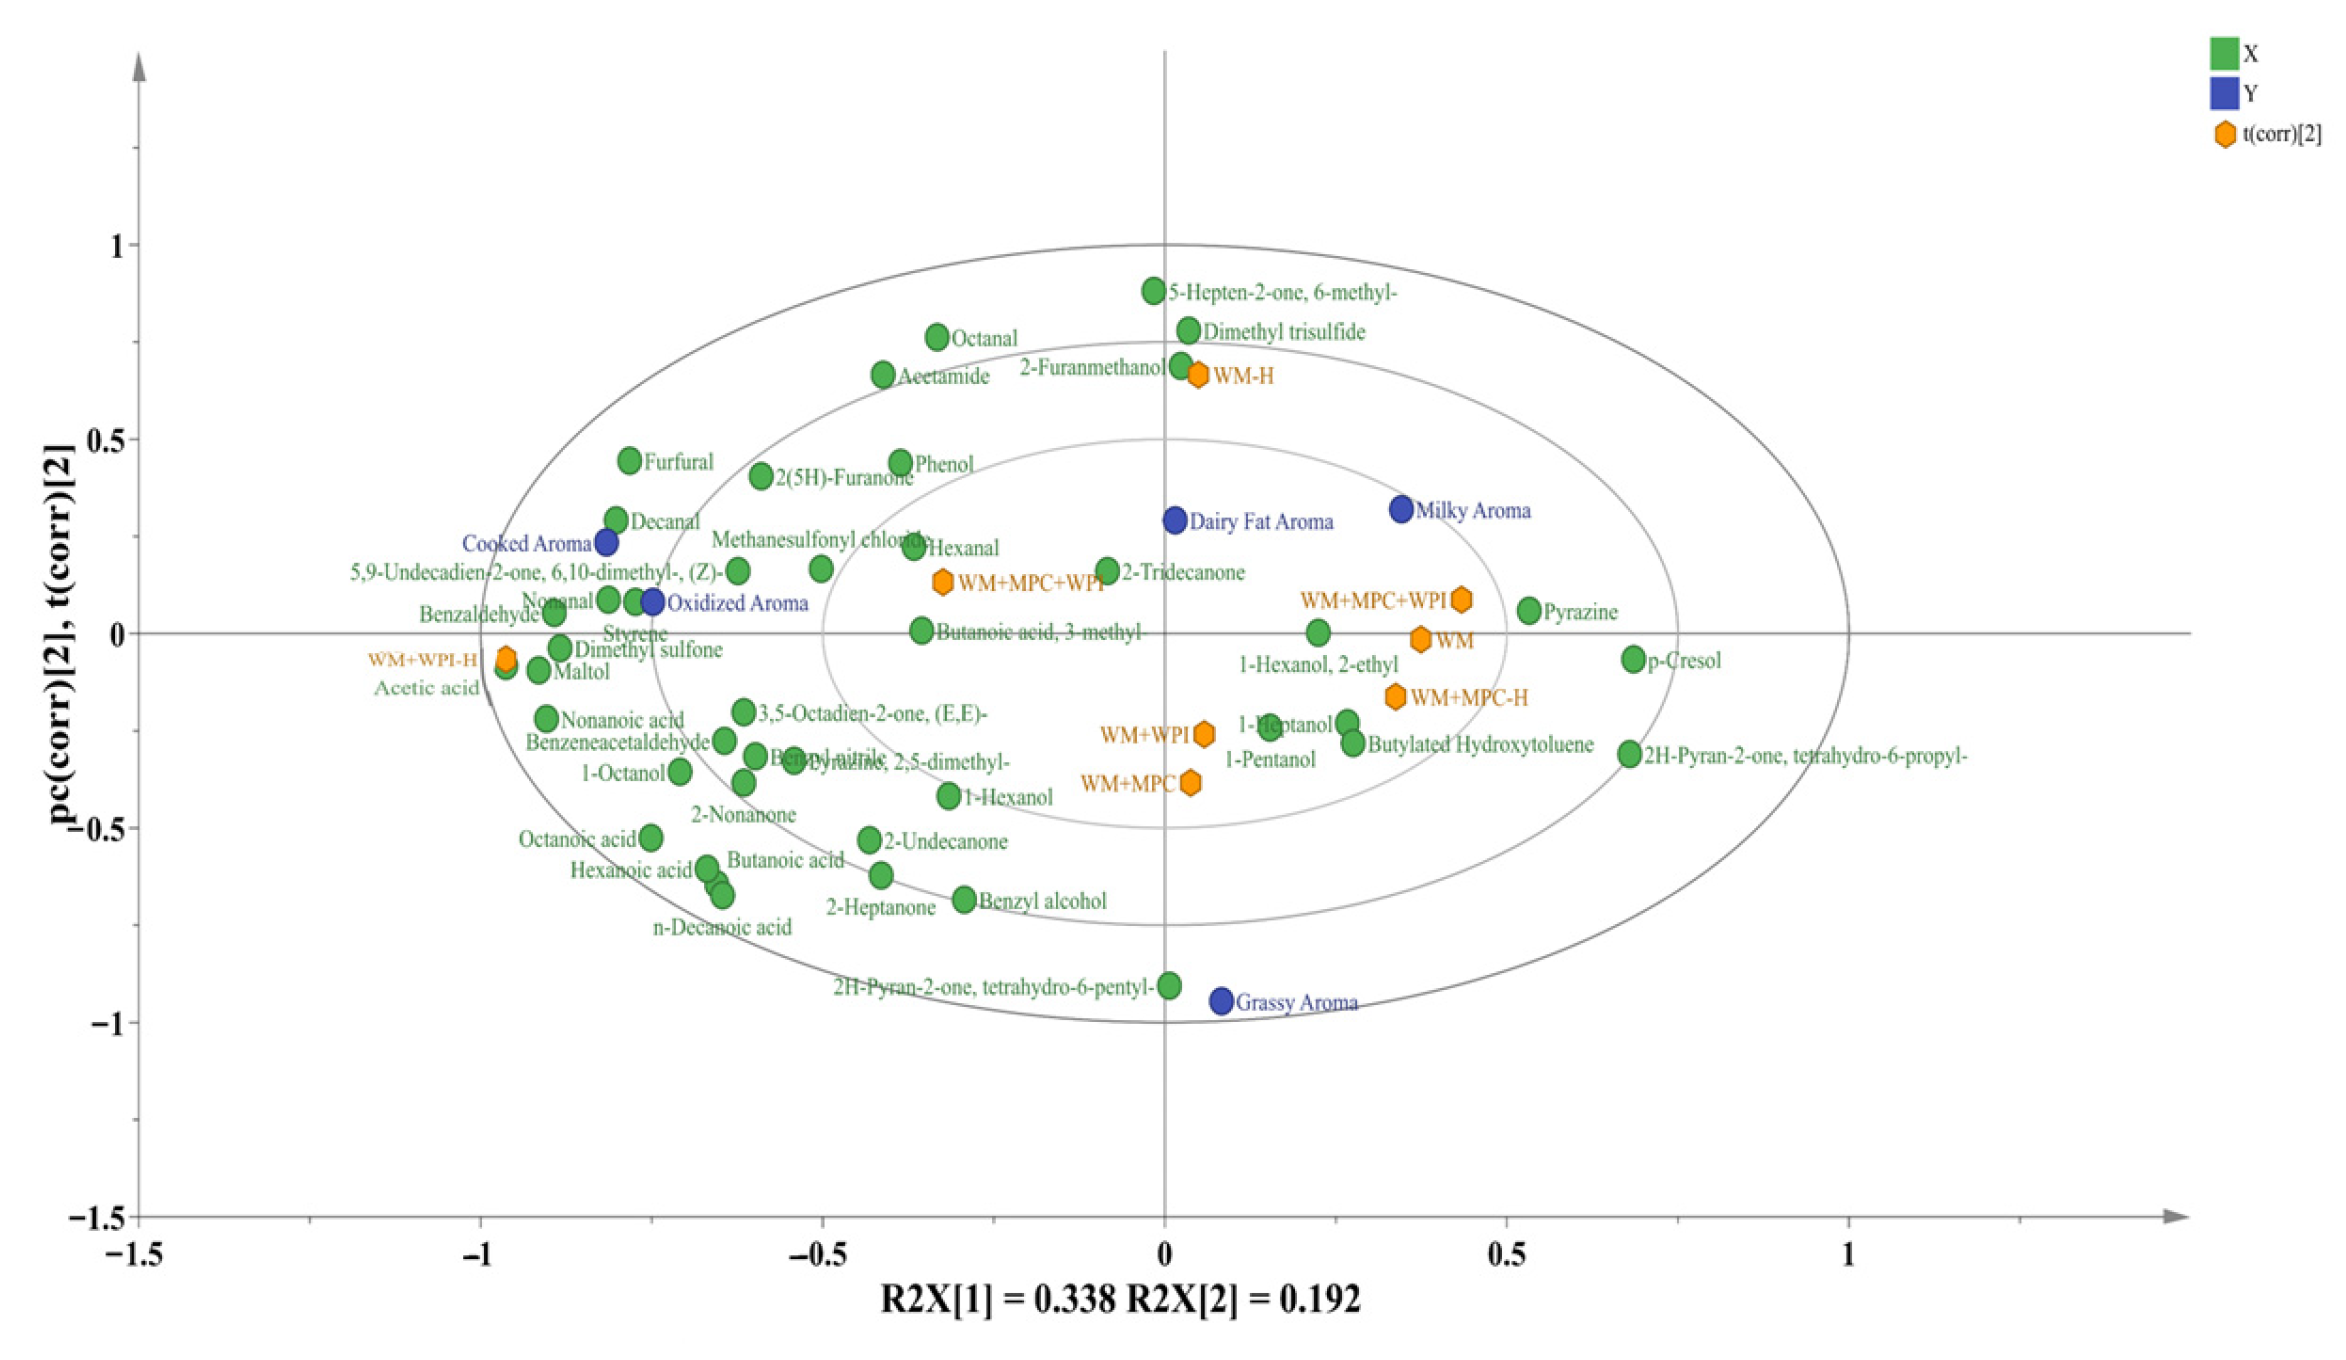
The Partial Least Squares Regression (PLS-R) correlation loading plot (Figure 4) was used as an exploratory tool to visualize associations among milk formulations, volatile compounds, and sensory attributes. The plot suggested that some heat-treated and protein-fortified samples, such as WM+MPC+WPI-H, were positioned closer to the “milky” and “grassy” attributes. These sensory attributes were located near several alcohols and ketones, including 1-hexanol, 1-pentanol, and 2-heptanone. Previous studies have reported associations between selected alcohols, ketones, and dairy aroma characteristics; however, their actual sensory contribution depends on concentration, odor threshold, matrix effects, and interactions with other volatile compounds [60,61]. Therefore, these relationships should be interpreted as exploratory associations rather than evidence that these compounds directly determined the sensory attributes.
Figure 4.
Partial Least Squares Regression (PLS-R) correlation loading plot showing exploratory associations among milk samples, volatile compounds, and sensory attributes. Samples located near specific sensory descriptors or volatile compounds indicate proximity within the multivariate model and should not be interpreted as evidence of direct causality. The axes show latent variables (LV1 and LV2) and the percentages of explained variance. Ellipses show the 95% confidence intervals for the treatment groups.
In contrast, samples such as WM-H and WM+WPI-H were positioned closer to the “cooked” and “oxidized” attributes. This region of the loading plot also included selected straight-chain aldehydes, such as nonanal and decanal, and Maillard-related compounds, such as furfural. These compounds have been associated with heat-induced flavor development and oxidative changes in dairy systems [39,40,42,61]. However, because compound-specific odor activity values and dynamic aroma-release measurements were not obtained, the proximity between these VOCs and sensory descriptors should be regarded as an association within the multivariate dataset rather than proof of a direct sensory mechanism. Similarly, the observed association between WPI-containing heated samples and cooked or oxidized aroma may reflect concurrent changes in protein composition, volatile generation, and matrix-dependent volatile retention or release [55,57].
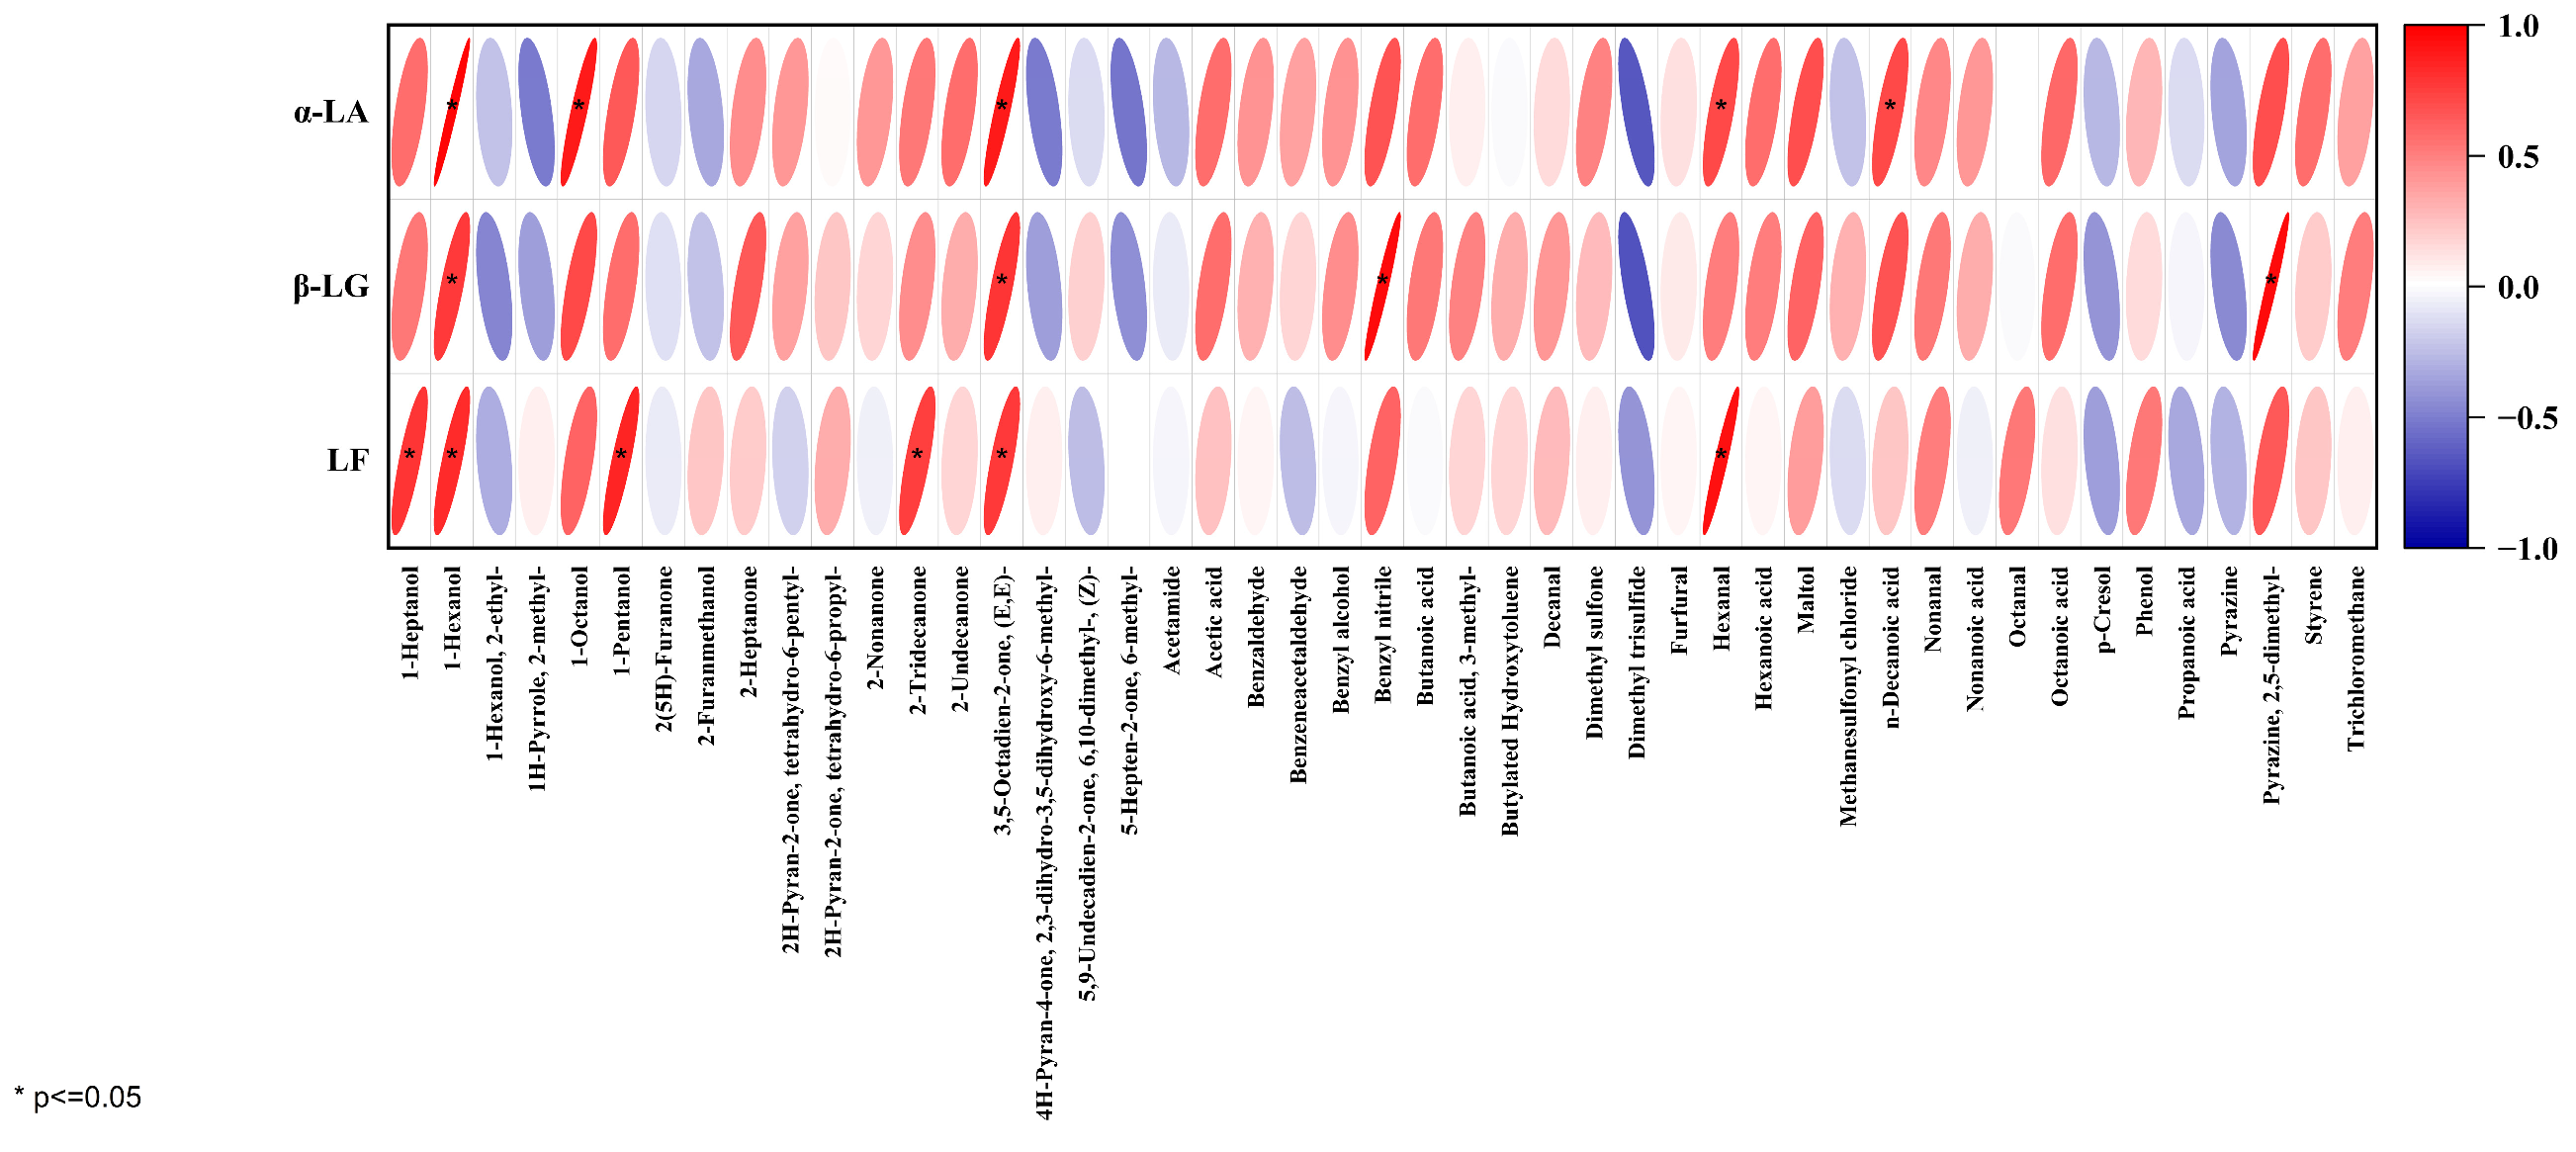
Correlation analysis further showed associations between recoverable pH 4.6-soluble whey protein fractions and selected volatile compounds (Figure 5). Positive associations involving α-LA or β-LG and selected alcohols, ketones, and Maillard-related compounds may reflect concurrent changes during heating [42,57,61]; however, these correlations do not demonstrate that protein unfolding directly caused the formation of these VOCs.
Figure 5.
Correlation plot showing associations between recoverable soluble whey protein fractions (α-LA, β-LG, and LF) and volatile compounds under different processing treatments. The color key indicates the strength and direction of the Pearson correlation coefficient, ranging from −1 (strong negative correlation, blue) to +1 (strong positive correlation, red).
An inverse association was observed between recoverable soluble LF and selected lipid-derived aldehydes. Because the HPLC values represent LF recovered in the pH 4.6 supernatant rather than total LF content or directly measured antioxidant activity, this association should not be interpreted as evidence that LF inhibited lipid oxidation. Targeted mechanistic experiments would be required to establish such a relationship.
4. Conclusions
This study indicates that matrix composition influenced the thermal behavior, soluble whey protein recovery, volatile profile, and sensory characteristics of protein-fortified milk systems. WPI-containing formulations showed a numerical tendency toward reduced soluble β-LG after heating and stronger heat-induced aggregation, whereas MPC-containing systems appeared to moderate aggregate formation. Differences in VOC and sensory profiles were formulation-dependent; however, the observed relationships should be interpreted as associations rather than direct causal links between protein structure and flavor release. Because the base matrix was commercial UHT whole milk, the unheated control should be regarded as a UHT-treated baseline rather than a raw native milk system; consequently, the reported protein changes reflect additional heat-induced modifications superimposed on the prior thermal history of the milk.
The combined use of MPC and WPI may provide a useful formulation approach for balancing protein enrichment with thermal and sensory stability. However, further validation using larger sensory panels, compound-specific odor thresholds, and dynamic aroma-release measurements is required before these findings can be translated into definitive industrial formulation recommendations.
Several limitations should be noted. First, the base matrix was commercial UHT whole milk; therefore, the unheated control represents a UHT-treated baseline rather than a raw native milk system, and the reported protein changes reflect additional heat-induced modifications superimposed on the prior thermal history of the milk. Second, compound-specific odor activity values were not calculated, and dynamic aroma-release measurements were not performed; therefore, the relationships between VOCs and sensory attributes should be interpreted as exploratory associations rather than direct causal mechanisms. Third, the sensory analysis was based on a small trained panel (n = 8) with a relatively narrow demographic background, so the sensory findings should be regarded as descriptive aroma-profile data rather than consumer acceptance data. Future studies should include larger and demographically broader sensory panels, compound-specific odor threshold or OAV analysis, and dynamic aroma-release measurements, such as proton-transfer-reaction mass spectrometry (PTR-MS), to further clarify the relationship between protein–matrix interactions, volatile release, and perceived aroma.
Supplementary Materials
The following supporting information can be downloaded at: https://www.mdpi.com/article/10.3390/dairy7050075/s1, Table S1: Sensory attribute definitions and reference standards. Table S2: Identification and semi-quantification of volatile organic compounds (VOCs) in milk subjected to different heat treatments using HS-SPME-Arrow-GC-MS.
Author Contributions
Conceptualization, Y.Z. and B.W.; methodology, B.L.; software, J.Y.; validation, J.Y., Y.W. and Y.Z.; formal analysis, J.Y.; investigation, J.Y.; resources, B.W.; data curation, J.Y., Y.W. and X.W.; writing—original draft preparation, J.Y.; writing—review and editing, B.L., F.M. and Y.Z.; visualization, Y.W.; supervision, F.M. and B.W.; project administration, Y.Z.; funding acquisition, Y.Z. All authors have read and agreed to the published version of the manuscript.
Funding
This research was funded by Beijing Technology and Business University Horizontal Project, grant number 2024085.
Institutional Review Board Statement
This research program was approved by the Science Research Ethics Committee of Beijing Technology and Business University. Approval Code: No. (64) 2024, Approval Date: 20 February 2024.
Informed Consent Statement
Informed consent for participation was obtained from all subjects involved in the study.
Data Availability Statement
The original contributions presented in this study are included in the article/Supplementary Materials; further inquiries can be directed to the corresponding author.
Acknowledgments
The authors would like to express their gratitude to the School of Food and Health, Beijing Technology and Business University for providing laboratory facilities and instrumentation support. Special thanks are extended to the 8 participants who volunteered for the sensory evaluation experiment. We also appreciate the administrative support provided by the editorial team of MDPI Dairy during the submission process.
Conflicts of Interest
Dr. Bozhao Li is affiliated with a commercial company, but the company had no role in the design of the study; in the collection, analyses, or interpretation of data; in the writing of the manuscript; or in the decision to publish the results. The remaining authors declare that the research was conducted in the absence of any commercial or financial relationships that could be construed as a potential conflict of interest.
References
- Walstra, P.; Lagrange, B.C. Global market for dairy proteins. J. Food Sci. 2015, 80, A16–A22. [Google Scholar] [CrossRef] [Scilit]
- Nagpal, R.; Behare, P.V.; Rana, R.; Kumar, A.; Kumar, M.; Arora, S.; Morotta, F.; Jain, S.; Yadav, H. Bioactive peptides derived from milk proteins and their health beneficial potentials: An update. Food Funct. 2011, 2, 18–27. [Google Scholar] [CrossRef] [Scilit]
- Smithers, G.W. Whey and whey proteins—From “gutter-to-gold”. Int. Dairy J. 2008, 18, 695–704. [Google Scholar] [CrossRef] [Scilit]
- Fickak, A.; Delaplace, G.; Andrieu, J.; Ronse, G. Effect of whey protein concentration on the fouling and cleaning of a heat transfer surface. J. Food Eng. 2011, 104, 323–331. [Google Scholar] [CrossRef] [Scilit]
- Eshpari, H.T.; Perrechil, F.A.; Cunha, R.L. Changes in the physical properties, solubility, and heat stability of milk protein concentrates prepared from partially acidified milk. J. Dairy Sci. 2014, 97, 7394–7401. [Google Scholar] [CrossRef] [Scilit]
- Kessler, H.G.; Beyer, H.J. Thermal denaturation of whey proteins and its effect in dairy technology. Int. J. Biol. Macromol. 1991, 13, 165–173. [Google Scholar] [CrossRef] [Scilit]
- Law, A.J.; Leaver, J. Effect of pH on the thermal denaturation of whey proteins in milk. J. Agric. Food Chem. 2000, 48, 672–679. [Google Scholar] [CrossRef] [Scilit]
- Singh, H.; Creamer, L.K. Denaturation, aggregation and heat stability of milk proteins during the manufacture of skim milk powder. J. Dairy Res. 1991, 58, 269–283. [Google Scholar] [CrossRef] [Scilit]
- Murphy, E.G.; Tobin, J.T.; Roos, Y.H.; Fenelon, M.A. A high-solids steam injection process for the manufacture of powdered infant milk formula. Food Bioprocess Technol. 2013, 6, 463–475. [Google Scholar] [CrossRef] [Scilit]
- Singh, H.; Havea, P. Thermal denaturation, aggregation and gelation of whey proteins. In Advanced Dairy Chemistry—1: Proteins; Fox, P.F., McSweeney, P.L.H., Eds.; Springer: New York, NY, USA, 2003; pp. 1261–1287. [Google Scholar]
- Walstra, P.; Jenness, R. Dairy Chemistry & Physics, 1st ed.; John Wiley & Sons: New York, NY, USA, 1984; pp. xviii + 467. [Google Scholar]
- Havea, P.; Singh, H.; Creamer, L.K. Characterization of heat-induced aggregates of β-lactoglobulin, α-lactalbumin, and bovine serum albumin in a whey protein concentrate environment. J. Dairy Res. 2001, 68, 483–497. [Google Scholar] [CrossRef] [Scilit]
- Hong, Y.H.; Creamer, L.K. Changed protein structures of bovine β-lactoglobulin B and α-lactalbumin as a consequence of heat treatment. Int. Dairy J. 2002, 12, 345–359. [Google Scholar] [CrossRef] [Scilit]
- Wijayanti, H.B.; Bansal, N.; Deeth, H.C. Stability of whey proteins during thermal processing: A review. Compr. Rev. Food Sci. Food Saf. 2014, 13, 1235–1251. [Google Scholar] [CrossRef] [Scilit]
- Zúñiga, R.N.; Tabilo-Munizaga, G.; Vega-Gálvez, A.; Miranda, M.; Pérez-Won, M. Kinetics of formation and physicochemical characterization of thermally induced β-lactoglobulin aggregates. J. Food Sci. 2010, 75, E261–E268. [Google Scholar] [CrossRef] [Scilit]
- Law, A.J.R.; Leaver, J. Effect of protein concentration on rates of thermal denaturation of whey proteins in milk. J. Agric. Food Chem. 1997, 45, 4255–4261. [Google Scholar] [CrossRef] [Scilit]
- Huppertz, T.; Kelly, A.L. Advances in milk protein ingredients. In Innovations in Healthy and Functional Foods; Taylor & Francis Group: Boca Raton, FL, USA, 2012; pp. 363–389. [Google Scholar]
- Carr, A.J. The Functional Properties of Milk Protein Concentrates. Ph.D. Thesis, Massey University, Palmerston North, New Zealand, 1999. Available online: http://hdl.handle.net/10179/2460 (accessed on 10 October 2025).
- Chandan, R.C. Dairy ingredients for food processing: An overview. In Dairy Ingredients for Food Processing; Wiley-Blackwell: Ames, IA, USA, 2011; pp. 3–33. [Google Scholar]
- Crowley, S.V.; Megemont, M.; Gazi, I.; Kelly, A.L.; Huppertz, T.; O’Mahony, J.A. Heat stability of reconstituted milk protein concentrate powders. Int. Dairy J. 2014, 37, 104–110. [Google Scholar] [CrossRef] [Scilit]
- Masters, K. Spray Drying Handbook, 4th ed.; Godwin: London, UK, 1985. [Google Scholar]
- Quach, M.L.; Clapperton, J.; Fanning, S.; Rasmussen, J. Headspace sampling of whey protein concentrate solutions using solid-phase microextraction. Food Res. Int. 1999, 31, 371–379. [Google Scholar] [CrossRef] [Scilit]
- Davis, J.P.; Foegeding, E.A. Comparisons of the foaming and interfacial properties of whey protein isolate and egg white proteins. Colloids Surf. B Biointerfaces 2007, 54, 200–210. [Google Scholar] [CrossRef] [Scilit]
- Morr, C.V.; Ha, E.Y.W. Whey Protein Concentrates and Isolates: Processing and Functional Properties. Crit. Rev. Food Sci. Nutr. 1993, 33, 431–476. [Google Scholar] [CrossRef] [Scilit]
- Zenker, H.; Raupbach, J.; Boeren, S.; Wichers, H.; Hettinga, K. The effect of low vs. high temperature dry heating on solubility and digestibility of cow’s milk protein. Food Hydrocoll. 2020, 109, 106105. [Google Scholar] [CrossRef] [Scilit]
- Bordin, G.; Raposo, F.C.; de la Calle, B.; Rodríguez, A.R. Identification and quantification of major bovine milk proteins by liquid chromatography. J. Chromatogr. A 2001, 928, 63–76. [Google Scholar] [CrossRef] [Scilit]
- Van Den Dool, H.A.N.D.; Kratz, P.D. A generalization of the retention index system including linear temperature programmed gas-liquid partition chromatography. J. Chromatogr. 1963, 11, 463–471. [Google Scholar] [CrossRef] [Scilit]
- Huang, Y.; Cao, H.; Pan, M.; Wang, C.; Sun, B.; Ai, N. Unraveling volatilomics profiles of milk products from diverse regions in China. Food Res. Int. 2024, 179, 114000. [Google Scholar] [CrossRef] [Scilit]
- Silva, R.C.A.; Ferreira, J.F.; Alvarenga, T.A.; Mattos, M.C.; Rocha, R.S.; Pimentel, T.C.; Esmerino, E.A.; Freitas, M.Q.; Cruz, A.G. Quantitative descriptive analysis in sensory evaluation of dairy products. J. Sens. Stud. 2018, 33, e12408. [Google Scholar]
- Farrell, H.M.J.R.; Jimenez-Flores, R.; Bleck, G.T.; Brown, E.M.; Butler, J.E.; Creamer, L.K.; Hicks, C.L.; Hollar, C.M.; Ng-Kwai-Hang, K.F.; Swaisgood, H.E. Nomenclature of the proteins of cows’ milk. J. Dairy Sci. 2004, 87, 1641–1674. [Google Scholar] [CrossRef] [Scilit]
- Patel, H.A.; Singh, H.; Anema, S.G.; Creamer, L.K. Effects of heat and high hydrostatic pressure treatments on the aggregation of whey proteins in whey protein concentrate solutions. Food N. Z. 2004, 4, 29–35. [Google Scholar]
- Considine, T.P.; Patel, H.A.; Anema, S.G.; Singh, H.; Creamer, L.K. Interactions of milk proteins during heat and high hydrostatic pressure treatments—A review. Innov. Food Sci. Emerg. Technol. 2007, 8, 1–23. [Google Scholar] [CrossRef] [Scilit]
- Livney, Y.D.; Dalgleish, D.G. Specificity of disulfide bond formation during thermal aggregation in solutions of β-lactoglobulin B and κ-casein A. J. Agric. Food Chem. 2004, 52, 5527–5532. [Google Scholar] [CrossRef] [Scilit]
- Elgar, D.F.; Norris, C.S.; Ayers, J.S.; Pritchard, M.; Otter, D.E.; Palmano, K.P. Simultaneous separation and quantitation of the major bovine whey proteins including proteose peptone and caseinomacropeptide by reversed-phase high-performance liquid chromatography on polystyrene-divinylbenzene. J. Chromatogr. A 2000, 878, 183–196. [Google Scholar] [CrossRef] [Scilit]
- Permyakov, S.E.; Berliner, L.J.; Permyakov, E.A. α-Lactalbumin: Structure and function. FEBS Lett. 2000, 473, 269–274. [Google Scholar] [CrossRef] [Scilit]
- Contarini, G.; Povolo, M. Volatile Fraction of Milk: Comparison between Purge and Trap and Solid Phase Microextraction Techniques. J. Agric. Food Chem. 2002, 50, 7350–7355. [Google Scholar] [CrossRef] [Scilit]
- Yuan, N.; Chi, X.; Ye, Q.; Liu, H.; Zheng, N. Analysis of Volatile Organic Compounds in Milk during Heat Treatment Based on E-nose, E-tongue and HS-SPME-GC-MS. Foods 2023, 12, 1071. [Google Scholar] [CrossRef] [Scilit]
- Tunick, M.H.; Iandola, S.K.; Van Hekken, D.L. Comparison of SPME Methods for Determining Volatile Compounds in Milk, Cheese, and Whey Powder. Foods 2013, 2, 534–543. [Google Scholar] [CrossRef] [Scilit]
- Cadwallader, K.R.; Drake, M.A. Flavours and off-flavours in milk and dairy products. In Advanced Dairy Chemistry: Volume 3—Lactose, Water, Salts and Minor Constituents; McSweeney, P.L.H., Fox, P.F., Eds.; Springer: New York, NY, USA, 2009; pp. 631–690. [Google Scholar]
- Hall, G.; Andersson, J.; Lingnert, H.; Olofsson, B. Flavor Changes in Whole Milk Powder during Storage: The Kinetics of the Formation of Volatile Fat Oxidation Products and Other Volatile Compounds. J. Food Qual. 1985, 7, 153–190. [Google Scholar]
- Park, C.W.; Stout, M.A.; Drake, M.A. The effect of spray-drying parameters on the flavor of nonfat dry milk and milk protein concentrate 70%. J. Dairy Sci. 2016, 99, 9598–9610. [Google Scholar] [CrossRef] [Scilit]
- Smith, T.J.; Campbell, R.E.; Jo, Y.; Drake, M.A. Flavor and stability of milk proteins. J. Dairy Sci. 2016, 99, 4325–4346. [Google Scholar] [CrossRef] [Scilit]
- Carunchia Whetstine, M.E.; Drake, M.A. The flavor and flavor stability of skim and whole milk powders. In Flavor of Dairy Products; ACS Publishing: Washington, DC, USA, 2007; pp. 217–251. [Google Scholar]
- Lloyd, M.A.; Hess, S.J.; Drake, M.A. Effect of Nitrogen Flushing and Storage Temperature on Flavor and Shelf-Life of Whole Milk Powder. J. Dairy Sci. 2009, 92, 2409–2422. [Google Scholar] [CrossRef] [Scilit]
- Frankel, E.N. Lipid Oxidation. Prog. Lipid Res. 1980, 19, 1–22. [Google Scholar] [CrossRef] [Scilit]
- Tan, C.; Tian, Y.; Tao, L.; Xie, J.; Wang, M.; Zhang, F.; Yu, Z.; Sheng, J.; Zhao, C. Exploring the Effect of Milk Fat on Fermented Milk Flavor Based on Gas Chromatography–Ion Mobility Spectrometry (GC-IMS) and Multivariate Statistical Analysis. Molecules 2024, 29, 1099. [Google Scholar] [CrossRef] [Scilit]
- Guyomarc’h, F.; Famelart, M.H.; Henry, G.; Gulzar, M.; Leonil, J.; Hamon, P.; Croguennec, T. Current ways to modify the structure of whey proteins for improved functionality. Annu. Rev. Food Sci. Technol. 2022, 13, 1–29. [Google Scholar]
- Wright, J.W.; Whetstine, M.E.C.; Miracle, R.E.; Drake, M. Characterization of a cabbage off-flavor in whey protein isolate. J. Food Sci. 2006, 71, C86–C90. [Google Scholar] [CrossRef] [Scilit]
- Croissant, A.E.; Kang, E.J.; Campbell, R.E.; Bastian, E.; Drake, M. The effect of bleaching agent on the flavor of liquid whey and whey protein concentrate. J. Dairy Sci. 2009, 92, 5917–5927. [Google Scholar] [CrossRef] [Scilit]
- Evans, J.; Zulewska, J.; Newbold, M.; Drake, M.A.; Barbano, D.M. Comparison of composition, sensory and volatile components of thirty-four percent whey protein and milk serum protein concentrates. J. Dairy Sci. 2009, 92, 4773–4791. [Google Scholar] [CrossRef] [Scilit]
- Whitson, M.E.; Miracle, R.E.; Drake, M.A. Sensory characterization of chemical components responsible for cardboard flavor in whey proteins. J. Sens. Stud. 2010, 25, 616–636. [Google Scholar] [CrossRef] [Scilit]
- Listiyani, M.A.D.; Campbell, R.E.; Miracle, R.E.; Dean, L.; Drake, M. Influence of bleaching on the flavor of 34% whey protein concentrate and residual benzoic acid concentration in dried whey proteins. J. Dairy Sci. 2011, 94, 4347–4359. [Google Scholar] [CrossRef] [Scilit]
- Jervis, S.; Campbell, R.; Wojciechowski, K.L.; Foegeding, E.; Drake, M.; Barbano, D. Effect of bleaching whey on sensory and functional properties of 80% whey protein concentrate. J. Dairy Sci. 2012, 95, 2848–2862. [Google Scholar] [CrossRef] [Scilit]
- Lee, Y.B.; Laye, I.; Kim, Y.D.; Morr, C.V. Formation of volatile compounds in whey protein concentrate during elevated temperature storage as a function of water activity. Int. Dairy J. 1996, 6, 485–496. [Google Scholar] [CrossRef] [Scilit]
- Jo, Y.; Carter, B.G.; Barbano, D.M.; Drake, M.A. Identification of the Source of Volatile Sulfur Compounds Produced in Milk during Thermal Processing. J. Dairy Sci. 2019, 102, 8658–8669. [Google Scholar] [CrossRef] [Scilit]
- Schädle, C.N.; Sanahuja, S.; Bader-Mittermaier, S. Influence of Fat Replacers on the Rheological, Tribological, and Aroma Release Properties of Reduced-Fat Emulsions. Foods 2022, 11, 820. [Google Scholar] [CrossRef] [Scilit]
- Kühn, J.; Considine, T.; Singh, H. Interactions of milk proteins and volatile flavor compounds: Implications in the development of protein foods. J. Food Sci. 2006, 71, R72–R82. [Google Scholar] [CrossRef] [Scilit]
- Silva, H.L.A.; Balthazar, C.F.; Silva, R.; Vieira, A.H.; Costa, R.G.B.; Esmerino, E.A.; Freitas, M.Q.; Cruz, A.G. Sodium reduction and flavor enhancer addition in probiotic Prato cheese: Contributions of quantitative descriptive analysis and temporal dominance of sensations for sensory profiling. J. Dairy Sci. 2018, 101, 8837–8846. [Google Scholar] [CrossRef] [Scilit]
- Gaucher, I.; Mollé, D.; Gagnaire, V.; Gaucheron, F. Effects of Storage Temperature on Physico-Chemical Characteristics of Semi-Skimmed UHT Milk. Food Hydrocoll. 2008, 22, 130–143. [Google Scholar] [CrossRef] [Scilit]
- Faulkner, H.; O’Callaghan, T.F.; McAuliffe, S.; Hennessy, D.; Stanton, C.; O’Sullivan, M.G.; Kerry, J.P.; Kilcawley, K.N. Effect of Different Forage Types on the Volatile and Sensory Properties of Bovine Milk. J. Dairy Sci. 2018, 101, 1034–1047. [Google Scholar] [CrossRef] [Scilit]
- Contarini, G.; Povolo, M.; Leardi, R.; Toppino, P.M. Influence of Heat Treatment on the Volatile Compounds of Milk. J. Agric. Food Chem. 1997, 45, 3171–3177. [Google Scholar] [CrossRef] [Scilit]

Disclaimer/Publisher’s Note: The statements, opinions and data contained in all publications are solely those of the individual author(s) and contributor(s) and not of MDPI and/or the editor(s). MDPI and/or the editor(s) disclaim responsibility for any injury to people or property resulting from any ideas, methods, instructions or products referred to in the content. |
© 2026 by the authors. Licensee MDPI, Basel, Switzerland. This article is an open access article distributed under the terms and conditions of the Creative Commons Attribution (CC BY) license.