


Abstract
Targeted CSN2 codon-67 genotyping supports A2-oriented breeding and herd management. We compared Kompetitive Allele-Specific PCR (KASP) with a locally implemented gel-based tetra-primer amplification refractory mutation system PCR (T-ARMS PCR) workflow in a balanced, non-population-representative Holstein–Friesian panel using re-audited Sanger-supported reference classifications. Both assays distinguish His67-associated (A1-type) from Pro67-associated (A2-type) β-casein classes rather than complete CSN2 alleles. The paired analysis included 96 independent samples. KASP produced 90 reference-concordant, four reference-discordant, and two no-call outcomes (93.8% all-record reference-concordant yield), whereas T-ARMS PCR produced 77 reference-concordant, six reference-discordant, and 13 ambiguous outcomes (80.2%). Concordance among callable/evaluable results was 95.7% and 92.8%, respectively. In the primary comparison, KASP showed a 13.5 percentage point higher yield (95% CI, 4.2–22.9 percentage points; p = 0.015), mainly because it generated fewer non-interpretable outcomes. All callable KASP discordances involved Pro67/Pro67 reference samples called His67/Pro67. Because no independent DNA dilution, new DNA extraction, repeat KASP run, or new Sanger sequencing was performed, their cause and reproducibility remain unresolved. Formal repeatability and between-run reproducibility were not systematically evaluated; therefore, this comparison is not a formal assay validation and does not define T-ARMS PCR performance beyond the tested local configuration. Discordant, ambiguous, or high-impact classifications require independent repeat testing or sequencing confirmation.
1. Introduction
Targeted CSN2 codon-67 genotyping is increasingly used in dairy cattle breeding, herd management, product differentiation, and molecular testing. The CSN2 gene lies in the bovine casein cluster on chromosome 6 and encodes β-casein, which accounts for approximately 45% of total casein [1,2,3,4,5,6]. Its polymorphism is therefore relevant to milk composition and breeding applications.
Milk protein polymorphisms are useful genetic markers in dairy cattle selection programs. Variants in milk protein genes can support breeding strategies aimed at improving milk composition, product traceability, and herd-level genetic management [7,8,9]. Several β-casein allelic variants have been described, including A1, A2, A3, and B, among others [3,8,10,11,12]. The commonly targeted codon-67 polymorphism determines whether β-casein contains histidine (His67) or proline (Pro67) [3,13,14]. Importantly, the His67 and Pro67 states are each shared by multiple CSN2 allelic variants; therefore, a single-site assay distinguishes A1-type from A2-type β-casein classes but does not uniquely identify every CSN2 allele [12,15]. Throughout this manuscript, A1A1, A1A2, and A2A2 are retained as operational shorthand for the His67/His67, His67/Pro67, and Pro67/Pro67 codon-67 classes, respectively, unless a specific multi-site CSN2 allele is explicitly discussed.
The A1/A2 β-casein distinction has also been discussed in relation to the potential release of β-casomorphin-7 (BCM-7) during gastrointestinal digestion [16,17,18]. However, the relationship between A1 β-casein consumption, BCM-7 release, and human health outcomes remains debated, and current evidence does not support broad causal conclusions or public health recommendations [14,17,19,20,21]. Therefore, the present study focuses on targeted CSN2 codon-67 classification as a breeding, herd management, product differentiation, and molecular testing issue rather than as a human health risk assessment.
Consumer interest in A2 milk and the commercial value of products derived from animals carrying the Pro67-associated A2-type state have encouraged the incorporation of targeted CSN2 codon-67 genotyping into dairy cattle breeding and herd management strategies [4,9,22]. Recent studies use codon-67 genotyping to characterize breed-specific class distributions, identify operational A2A2 (Pro67/Pro67) animals, and support breeding decisions aimed at increasing the frequency of the Pro67-associated state [5,23]. Consequently, accurate, reproducible, scalable, and practically implementable codon-67 classification is important for molecular diagnostics, marker-assisted selection, and routine dairy cattle genotyping [5,13,15,24].
Direct DNA sequencing remains a reference approach for detecting nucleotide substitutions and confirming allelic variants [25,26]. Sanger sequencing provides high analytical confidence, but it is relatively labor-intensive and less practical for routine large-scale screening [5,27]. For this reason, several alternative molecular approaches have been developed and applied for CSN2 polymorphism detection, including polymerase chain reaction–restriction fragment length polymorphism (PCR-RFLP), allele-specific polymerase chain reaction (AS-PCR), high-resolution melting (HRM) analysis, TaqMan probe-based assays, Kompetitive Allele-Specific PCR (KASP), and other single-nucleotide polymorphism (SNP) genotyping platforms [10,28,29,30,31]. These methods differ in cost, throughput, equipment requirements, interpretability, scalability, and suitability for routine implementation in breeding programs [15].
Among PCR-based approaches, tetra-primer amplification refractory mutation system PCR (T-ARMS PCR) represents a low-infrastructure strategy for single-nucleotide polymorphism genotyping. It uses two outer primers and two allele-specific inner primers to generate a control fragment and allele-specific products of different sizes in one reaction, followed by agarose-gel discrimination [29,32]. T-ARMS PCR has been applied to CSN2 codon-67 classification and remains attractive for small- to medium-scale testing where conventional PCR and electrophoresis are available [23,29,33]. However, performance depends strongly on the specific primer design, inner-to-outer primer balance, annealing conditions, template quality, and detection workflow. Recent ARMS-integrated high-resolution melting work further illustrates that ARMS-based discrimination can also be implemented as a closed-tube workflow without post-PCR gel electrophoresis [34].
In contrast, KASP is a fluorescence-based genotyping platform designed for scalable SNP detection. It relies on allele-specific primer extension and fluorescence-based signal discrimination, enabling software-assisted genotype calling in larger sample sets [30,35,36]. KASP offers a closed-tube workflow, scalable throughput, and compatibility with routine genotyping pipelines, but it requires fluorescence detection instrumentation and commercial assay components [30,35,36]. Comparative platform studies and livestock applications further show that assay design, DNA quality, cluster separation, and analysis workflow can materially affect KASP performance [37,38,39,40,41,42,43]. Therefore, the choice between T-ARMS PCR, KASP, and confirmatory sequencing should be guided by analytical performance, laboratory infrastructure, throughput, cost structure, interpretation risk, and the practical needs of the breeding or diagnostic workflow [15].
Direct same-sample comparison of gel-based and fluorescence-based CSN2 codon-67 workflows remains relevant to dairy laboratories [15,28,29]. We therefore compared KASP with one locally implemented gel-based T-ARMS PCR workflow using re-audited Sanger-supported classifications in a Holstein–Friesian panel. This was a paired, laboratory-specific method comparison. Because formal repeatability, between-run reproducibility, and independent retesting of discordant records were not evaluated, the study should not be interpreted as a formal validation of either assay or as a general comparison of KASP and ARMS amplification principles.
The primary objective was to compare the paired all-record reference-concordant classification rates of KASP and the evaluated, locally implemented, gel-based T-ARMS PCR workflow in the 96 independent primary sample records. Secondary objectives were to describe callability, concordance among callable or evaluable results, class-specific discordances, non-interpretable outcomes, plate-stratified patterns, and practical workflow characteristics.
2. Materials and Methods
2.1. Sample Origin, Ethical Approval, and Reference Classification Panel
The genomic DNA samples used in the present method comparison study were selected from the larger Holstein–Friesian CSN2 genotyping dataset described by Sándorová et al. [5], which comprised more than 2700 animals. This original dataset was previously investigated for CSN2 β-casein polymorphisms, A2 milk selection, and the biological relevance of the A2 β-casein variant in dairy cattle [5,44]. The original animal population, herd management conditions, sample collection procedure, DNA extraction protocol, and related production data have been described in detail in these previous publications. The present study reuses the archived DNA and previously generated Sanger-supported assignments as the reference source for a distinct paired comparison of KASP and T-ARMS PCR outcomes.
Animal owners provided informed consent for the use of biological samples and production records for research purposes. Ethical approval for sample collection and data use was obtained from the Institutional Animal Welfare Body of the Hungarian University of Agriculture and Life Sciences, Szent István Campus (Approval: MATE SZIC MÁB, issued on 10 July 2024). According to the official certification, the study was outside the scope of Directive 2010/63/EU and therefore did not require an experimental animal permit.
For the present study, previously collected and genotyped archived genomic DNA samples were selected to establish a Sanger-supported CSN2 codon-67 reference panel. The 96 primary sample records were not a random or population-representative subset of the original herd-level dataset. They were selected purposively to create a balanced method comparison panel with representation of the three operational codon-67 classes: A1A1, A1A2, and A2A2. Eligible samples required sufficient remaining DNA, acceptable DNA quality, and an unambiguous previously assigned Sanger-supported reference classification. Panel composition was therefore determined by DNA availability and quality, reference class clarity, and balanced class representation. No additional invasive sampling or animal procedures were performed for this method comparison study.
The Sanger-supported CSN2 codon-67 reference classifications were obtained from our previously published CSN2 genotyping work [5] and were re-audited before concordance analysis, as described below. To distinguish independent biological samples from technical assay records, the dataset structure and terminology were defined before analysis. A “primary sample record” is the genotyping record of an independent biological DNA sample included in the paired method comparison. “Bridge sample record” and “positive control record” refer to technical monitoring records used for descriptive inter-plate consistency and assay control assessment, respectively. “Assay-level genotyping record” refers to any record generated and evaluated in the complete technical dataset.
The complete technical dataset comprised 116 assay-level genotyping records: 96 primary sample records, 8 bridge sample records, and 12 positive control records. The 96 primary records represented independent Holstein–Friesian animals selected from the larger CSN2 dataset described by Sándorová et al. [5] and formed the primary analysis set. Bridge sample and positive control records were summarized descriptively. Because the primary method comparison panel was intentionally balanced across genotype classes, its codon-67 class proportions should not be interpreted as population-level frequencies (Table 1).
Table 1.
Structure of the CSN2 codon-67 method comparison dataset and definition of analytical record types.
The primary sample size was determined pragmatically by the availability of archived DNA with unambiguous Sanger-supported classifications and the aim of obtaining approximately equal representation of the three operational codon-67 classes; no formal prospective power or precision calculation was performed. The 96-record panel provided 31–33 independent records per reference class, allowing class-specific assay behavior, discordant calls, no-call outcomes, and ambiguous T-ARMS PCR patterns to be evaluated across A1A1, A1A2, and A2A2 categories. Because the comparison was paired, each primary record contributed matched KASP and T-ARMS PCR outcomes against the same re-audited Sanger-supported reference classification. The panel was intended for laboratory-specific method comparison and not for estimation of population-level codon-67 class frequencies.
The 8 bridge sample records and 12 positive control records were included for technical monitoring purposes only. Their numbers were chosen pragmatically to monitor inter-plate consistency and positive control performance across the workflow, rather than to support separate inferential comparisons. Accordingly, these records were summarized descriptively and were not included in the primary paired statistical analysis. Formal within-run repeatability and between-run reproducibility were not systematically evaluated according to a predefined replicate testing design; the bridge sample records should therefore be interpreted only as limited descriptive inter-plate monitoring.
Supplementary Table S1a,b defines the dataset components and outcome categories; Figure 1 summarizes the analytical workflow.
Figure 1.
Analytical workflow of the CSN2 codon-67 comparison. The 96 independent primary samples were used for paired comparison of KASP and the locally implemented gel-based T-ARMS PCR workflow. Bridge and positive control records were summarized descriptively. Discordant, no-call, and ambiguous outcomes were classified as not reference-concordant under the primary all-record analysis; callable/evaluable results were also analyzed separately. Bridge records did not constitute a formal repeatability or reproducibility study. The 96-sample panel was purposively balanced across the three operational codon-67 classes and was not population-representative. Arrows indicate the direction of the analytical workflow.
Sanger-Supported Codon-67 Reference Classification Verification and Re-Audit
In the previous CSN2 genotyping workflow described by Sándorová et al. [5], selected animals were genotyped for β-casein variants by Sanger sequencing targeting exon 7 and additional informative sequence positions. Representative chromatogram evidence and sequence-based assignments were reported in that study. For the present comparison, the codon-67 state was extracted from those sequence-supported records. Chromatograms had been quality-trimmed using a minimum Phred score threshold of Q20 and aligned to the bovine CSN2 reference sequence. Heterozygous calls required clearly resolved double peaks at the target position, whereas homozygous calls required a clear single-base signal. Samples with ambiguous sequence quality had been re-amplified and re-sequenced in the original genotyping workflow.
In the present method comparison study, the previously generated Sanger chromatograms and sequence-based codon-67 assignments were used as pre-existing sequence-supported reference classifications. These classifications were assigned and re-audited without using the KASP or T-ARMS PCR results; however, no new or external reference sequencing was performed for the present comparison. Before the formal comparison with KASP and T-ARMS PCR outcomes, the chromatograms corresponding to all method comparison panel records were re-inspected to verify the previously assigned CSN2 codon-67 reference classifications. This re-audit was performed by two independent evaluators who assessed the diagnostic nucleotide position and the surrounding sequence region without using the KASP or T-ARMS PCR results for classification assignment. Disagreements, if present, were resolved by consensus review based only on the Sanger chromatogram evidence and alignment to the bovine CSN2 reference sequence.
The re-audit was not intended to generate new Sanger sequencing data, but to confirm that all retained records had unambiguous chromatogram evidence at the codon-67 His/Pro-discriminating nucleotide position and in the surrounding sequence region. Only records with unambiguous Sanger chromatogram interpretation were retained in the reference panel. The Sanger-supported codon-67 reference classification was not modified based on KASP or T-ARMS PCR outcomes; instead, KASP and T-ARMS PCR results were evaluated against the re-audited Sanger-supported reference classifications.
The four callable KASP-discordant records, the two KASP no-call/repeat-required records, the six clearly discordant T-ARMS PCR records, and the T-ARMS PCR no-call/non-interpretable record are documented in Supplementary Figure S4. Representative weak band and additional band T-ARMS PCR outcomes are shown separately in Supplementary Figures S1 and S2. Supplementary Figure S4 documents the available pre-existing chromatogram evidence supporting the retained reference classifications in these critical comparison records. During revision, the software-generated non-diagnostic reference/alignment tracks were removed from the displayed panels after a graphical base inconsistency was identified outside the diagnostic position; the chromatogram traces and sample base calls were not modified. Supplementary Figure S4 does not represent newly generated Sanger sequencing or independent analytical retesting. For reverse strand chromatograms, codon-67 classification was based on alignment to the CSN2 reference sequence and the corresponding reverse complement nucleotide at the diagnostic position.
2.2. T-ARMS PCR
Tetra-primer amplification refractory mutation system PCR (T-ARMS PCR) was performed to interrogate the CSN2 codon-67 His/Pro polymorphism. The four primer sequences were based on sequences reported by Vigolo et al. and related published T-ARMS work [29,45]. The reaction chemistry, primer concentrations, thermal cycling program, and electrophoretic conditions were established locally and did not reproduce the complete published protocol. The assay should therefore be regarded as a local gel-based implementation using Vigolo-reported primer sequences, rather than as a replication or independent validation of the complete Vigolo protocol. It generated one common control fragment and two smaller allele-specific products intended to distinguish the His67-associated (A1-type) and Pro67-associated (A2-type) nucleotide states by agarose gel electrophoresis. Accordingly, the results apply to this specific local configuration and should not be generalized to T-ARMS PCR or ARMS-based assays overall.
Four primers were used: the Pro67-associated forward inner primer FA2 (5′-TAGTCTATCCCTTCCCTGGACCCATTCC-3′), the His67-associated reverse inner primer RA1 (5′-AGGGATGTTTTGTGGGAGGCTGTCAT-3′), the forward outer primer NFO (5′-TCTGCAGGAACTCAGGAAGAGGTGGA-3′), and the reverse outer primer NRO (5′-AAGACTGGAGCAGAGGCAGAGGAAGGT-3′) [29,45]. The FA2 oligonucleotide sequence reported here is the sequence synthesized and used in the present experiments. During revision, in silico re-examination of the reported FA2 sequence against X14711.1 indicated non-target differences at X14711.1:g.8093 and X14711.1:g.8099. The available experimental records do not establish whether these bases were intentionally engineered mismatches, inherited typographical inconsistencies in the published sequence, or reflect a different original reference convention. Because this uncertainty could have influenced allele-specific amplification, it is explicitly considered when interpreting the performance of the evaluated T-ARMS PCR implementation.
PCR reactions were carried out in a final volume of 20 µL using 2× QIAGEN Multiplex PCR Master Mix (QIAGEN GmbH, Hilden, Germany). Each reaction contained 10 µL of 2× Master Mix, 45 ng of genomic DNA, 0.4 µL of each inner primer FA2 and RA1, and 0.2 µL of each outer primer NFO and NRO from 10 µM primer stock solutions. The final concentrations were therefore 0.20 µM for each inner primer and 0.10 µM for each outer primer, corresponding to a 2:1 inner-to-outer primer concentration ratio. This ratio was treated as a fixed local implementation condition; alternative primer ratios were not compared, so the present study cannot establish that the selected ratio was optimal. The tested ratio should therefore be interpreted as part of the evaluated local configuration rather than as an optimized T-ARMS setting. The final volume was adjusted with nuclease-free water.
Before the primary method-comparison runs, the working annealing temperature was assessed in a pilot gradient PCR using a GeneExplorer Thermal Cycler (Hangzhou Bioer Technology, Hangzhou, China). One Sanger-supported reference sample from each operational codon-67 class (A1A1, A1A2, and A2A2) was tested at 64.0, 65.1, 66.2, 67.3, 68.4, and 70.0 °C. The inner-to-outer primer concentration ratio was fixed at 2:1. The pilot program comprised initial denaturation at 95 °C for 15 min, 40 cycles of 94 °C for 30 s, gradient annealing for 40 s, and 72 °C for 40 s, followed by a final extension at 72 °C for 10 min. Pilot products were separated on a 1% agarose gel at 130 V for 70 min using an ENDURO 300 V Power Supply (Labnet International, Inc., Edison, NJ, USA), a 100 bp-plus DNA ladder, and GelGreen staining. Based on visual comparison of the expected class-specific band patterns across the gradient, 68.4 °C was selected as the working annealing temperature. A subsequent small follow-up run at 68.4 °C included four Sanger-supported samples from each operational codon-67 class and one no-template control. This pre-comparison experiment was a limited annealing-temperature assessment rather than a factorial optimization study: alternative primer ratios and replicated combinations of reaction parameters were not tested (Supplementary Figure S5). It documents the selected working temperature but does not establish the optimal parameter combination or the best achievable performance of T-ARMS PCR.
For the primary method comparison runs, amplification was performed in a GeneExplorer Thermal Cycler (Hangzhou Bioer Technology, Hangzhou, China) with initial denaturation at 95 °C for 15 min, followed by 35 cycles of 94 °C for 30 s, 68.4 °C for 30 s, and 72 °C for 30 s, and a final extension at 72 °C for 10 min. Each run included a no-template control. The final 68.4 °C annealing temperature was selected from the pilot gradient described above, whereas the 2:1 inner-to-outer primer ratio was retained as a fixed local implementation condition. The pilot and primary thermal programs differed in cycle number and annealing/extension duration; these settings were not evaluated as experimental factors. No systematic comparison of alternative primer ratios or factorial optimization of temperature, primer balance, cycle number, and template input was performed. Accordingly, the primary comparison evaluates this fixed assay configuration only.
For the primary method-comparison runs, PCR products were separated by electrophoresis on 1.5% agarose gels at 110 V for 1 h using an ENDURO 300 V Power Supply (Labnet International, Inc., Edison, NJ, USA). A GeneRuler 100 bp DNA Ladder (Thermo Scientific, Waltham, MA, USA) was used as the molecular size marker. Gels were visualized under UV illumination using a Bio-Rad GelDoc™ XR Imaging System (Bio-Rad Laboratories, Hercules, CA, USA). The separate pilot-gradient and follow-up gels are documented in Supplementary Figure S5.
Codon-67 classes were assigned according to the presence of the common internal-control fragment and the allele-specific bands. Based on the X14711.1 primer coordinates, the predicted products were 586 bp for the internal control fragment, 384 bp for the His67-associated fragment, and 255 bp for the Pro67-associated fragment. The previously reported 256 bp designation was corrected to 255 bp during revision. Operational A1A1 calls showed the 586 and 384 bp products, operational A2A2 calls showed the 586 and 255 bp products, and operational A1A2 calls showed all three products.
For T-ARMS PCR quality classification, WB indicated weak bands, AB indicated additional bands, SM indicated smeared or non-specific amplification, and NC indicated no interpretable call. Gel images were evaluated using predefined interpretation categories. A codon-67 call was considered evaluable only when the internal control band and the expected allele-specific band pattern were clearly visible. Weak allele-specific amplification, additional non-specific bands interfering with class interpretation, smeared amplification, or lack of an interpretable banding pattern were classified as ambiguous outcomes. Ambiguous outcomes were not forced into codon-67 categories. They represent non-interpretable banding patterns under the predefined criteria and were not treated as confirmed incorrect codon-67 calls.
Gel images were first scored using predefined interpretation categories by the primary evaluator. The complete set was subsequently re-scored independently by a second laboratory evaluator who was blinded to the Sanger reference classifications, KASP results, and initial T-ARMS PCR calls. The blinded re-scoring yielded the same final genotype and quality category assignments, and the original calls were retained without modification. This procedure assessed interpretation consistency only. Ambiguous and discordant samples from the primary comparison were not re-amplified using modified primer ratios, additional annealing temperature conditions, new DNA dilutions, or newly extracted DNA. Representative primary comparison gel images are provided in Supplementary Figures S1 and S2.
The coordinate-based amplicon-size check and the FA2 alignment observations were performed as an in silico audit during revision; they did not involve post hoc replacement of any experimental result. The original gel classifications and the primary concordance analysis were retained unchanged.
2.3. KASP Genotyping
KASP genotyping was performed for targeted detection of the CSN2 codon-67 polymorphism. The custom assay was commercially designed, synthesized, and supplied by LGC Genomics [46] (Hoddesdon, Hertfordshire, UK) using the bovine CSN2 reference sequence X14711.1 and target position g.8101 specified by the authors. The submitted target flanking sequence was 5′-GATTTGTTTTCCTTCTTTCCAGGATGAACTCCAGGATAAAATCCACCCCTTTGCCCAGACACAGTCTCTAGTCTATCCCTTCCCTGGACCCATCC[A/C]TAACAGCCTCCCACAAAACATCCCTCCTCTTACTCAAACCCCTGTGGTGGTGCCGCCTTTC-3′. Initial assay design checks were performed by the provider; reference concordance was evaluated against the re-audited Sanger-supported classifications.
In the X14711.1 forward strand orientation, the C nucleotide forms the CCT codon encoding proline and was assigned as the Pro67-associated (A2-type) state, whereas the A nucleotide forms the CAT codon encoding histidine and was assigned as the His67-associated (A1-type) state. Thus, the assay discriminates the codon-67 His/Pro classes rather than uniquely identifying the complete CSN2 A1 or A2 alleles. Because the assay was supplied as a proprietary commercial KASP assay, the allele-specific primer sequences and internal design parameters are not reported.
Fluorescence clusters were reported using the operational labels A1A1, A1A2, and A2A2, corresponding to His67/His67, His67/Pro67, and Pro67/Pro67, respectively. Positive controls verified fluorescence channel orientation, whereas Sanger-supported reference classifications were used for post hoc concordance assessment. The KASP assay is therefore a targeted codon-67 SNP assay and not a full CSN2 haplotyping or comprehensive β-casein variant-detection method. It cannot independently resolve alleles such as A3, B, I, or other variants that share the same codon-67 state but differ elsewhere in CSN2.
Genomic DNA concentration and purity were assessed using a NanoDrop 2000 spectrophotometer (Thermo Fisher Scientific, Waltham, MA, USA). Prior to KASP genotyping, DNA samples were diluted to a working concentration of 5 ng/µL. Each KASP reaction was prepared in a final volume of 10.14 µL, consisting of 5 µL of 2× KASP Master Mix (LGC Genomics, Hoddesdon, UK), 0.14 µL of KASP primer mix, and 5 µL of diluted genomic DNA, corresponding to 25 ng of DNA per reaction. No-template controls were included on the KASP plates for assay monitoring and were not included in the 116-record analytical dataset.
Reactions were prepared in LightCycler 8-Tube Strips (white) and sealed with original Roche LightCycler 96 caps compatible with the Roche LightCycler 96 Real-Time PCR System (Roche Diagnostics, Mannheim, Germany). Prior to amplification, the strips were briefly centrifuged at 5000× g for 30 s using a Thermo Scientific Pico 17 centrifuge (Thermo Electron LED GmbH, Osterode am Harz, Germany) to collect the reaction mixture at the bottom of each tube and remove potential air bubbles.
KASP amplification and fluorescence detection were performed using a Roche LightCycler 96 Real-Time PCR System (Roche Diagnostics, Mannheim, Germany). The cycling protocol consisted of a pre-read step at 30 °C for 60 s, enzyme activation at 94 °C for 15 min, followed by 10 touchdown cycles of denaturation at 94 °C for 20 s and annealing/extension at 61 °C for 60 s, with the annealing temperature decreasing by 0.6 °C per cycle. This was followed by 35 amplification cycles at 94 °C for 20 s and 55 °C for 60 s, and a final post-read step at 30 °C for 60 s.
Endpoint fluorescence was recorded in the two standard KASP reporter channels, 6-carboxyfluorescein (FAM) and hexachlorofluorescein (HEX), which provide allele-specific signal discrimination after competitive allele-specific amplification. Fluorescence data were analyzed using LightCycler® 96 Software version 1.1 (Roche Diagnostics, Mannheim, Germany). Codon-67 classes were assigned based on allele-specific fluorescence clustering, and samples were classified as A1A1, A1A2, or A2A2 according to their relative FAM and HEX fluorescence signal distribution. Positive controls were used to verify fluorescence channel-to-allele orientation. Primary sample classification calls were exported from the KASP cluster analysis before concordance assessment and were not modified after comparison with the Sanger-supported codon-67 reference classifications. Cluster plots were visually inspected to confirm separation of classification clusters and to identify potential ambiguous calls. Final classification calls were tabulated in Microsoft Excel (Microsoft Corporation, Redmond, WA, USA) and subsequently compared with T-ARMS PCR and the re-audited Sanger-supported codon-67 reference classifications.
For KASP outcome classification, quality control acceptable (QC OK) indicated an interpretable fluorescence cluster call. Discordant (DIS) indicated a callable result differing from the re-audited reference and remained in the callable result denominator; no-call (NC) or repeat-required (REP) indicated a non-evaluable outcome. Reported assay details include the target, reference sequence, flanking sequence, reaction conditions, instrument, fluorescence channels, and assignment strategy.
In callable primary records, the exported KASP classification calls showed distinct FAM/HEX signal ratio ranges: A2A2, 0.186–0.540; A1A2, 0.708–0.960; and A1A1, 2.586–4.448. Median ratios were 0.232, 0.811, and 3.373, respectively. These empirical ranges document the endpoint fluorescence distribution in the present primary method comparison dataset and were not used as post hoc reclassification thresholds.
Retrospective Record-Level Review of Callable KASP-Discordant Outcomes
After completion of the primary comparison, the four callable KASP-discordant records were reviewed retrospectively using the available original records. The review considered the sample identifiers and plate/well assignments reported in the analytical dataset, the original exported KASP calls, endpoint FAM and HEX values and FAM/HEX ratios, position within the recorded fluorescence clusters, the corresponding T-ARMS PCR outcomes, plate control summaries, and the existing re-audited Sanger chromatograms. This review was descriptive and was intended to document the direction and available technical context of the discordances; it did not constitute independent analytical retesting. No new working DNA dilution, separate aliquot, new DNA extraction, repeat KASP run, or new Sanger sequencing was performed. Original primary-analysis calls were retained unchanged. Consequently, the review could not determine the technical cause or reproducibility of the discordant outcomes.
2.4. Statistical and Concordance Analysis
Classification calls obtained by KASP and the evaluated T-ARMS PCR implementation were recorded in Microsoft Excel (version: LTSC 2021, 64-bit)(Microsoft Corporation, Redmond, WA, USA) and compared with the re-audited Sanger-supported codon-67 reference classifications. The primary comparison used the 96 independent primary sample records. Bridge sample and positive control records were excluded from inferential testing and retained only for descriptive technical monitoring summaries.
For each record, an alternative method result was considered concordant when it matched the Sanger-supported operational codon-67 class. Class-specific concordance was assessed for the operational A1A1, A1A2, and A2A2 categories, corresponding to His67/His67, His67/Pro67, and Pro67/Pro67, respectively.
For KASP, classification calls identical to the Sanger-supported reference classification were concordant, interpretable calls that differed were discordant, and NC or REP outcomes were non-evaluable and excluded from callable result analyses. For T-ARMS PCR, matching clear calls were concordant, differing clear calls were discordant, and WB, AB, SM, or NC outcomes were classified as ambiguous and excluded from evaluable call analyses. In addition to the three-class comparison, binary A2A2 versus non-A2A2 summaries were prepared for both methods in the 96 primary sample records. Binary results were reported both conservatively, with no-call or ambiguous outcomes treated as not reference-concordant in the all-record analysis, and conditionally among callable or evaluable results.
The all-record reference-concordant yield was defined as the proportion of all records that produced a classification matching the Sanger-supported reference. Discordant, no-call, and ambiguous outcomes were classified as not reference-concordant under this conservative all-record rule. Concordance among callable/evaluable results was calculated separately. KASP callable results excluded NC/REP outcomes but retained discordant calls; T-ARMS evaluable results excluded ambiguous outcomes.
Exact 95% binomial confidence intervals were calculated for the main primary method comparison indicators, including all-record reference-concordant yield, discordance, no-call and ambiguous outcome proportions, and concordance among callable or evaluable calls, using the Clopper–Pearson method [47].
Agreement between each genotyping method and the Sanger-supported reference classifications was quantified descriptively using Cohen’s kappa [48]. Because no-call and ambiguous categories describe outcome quality rather than codon-67 classes, kappa was calculated only among callable or evaluable results. Primary kappa values used the 96 independent primary records. Values from the complete 116-record technical dataset were retained only as secondary descriptive measures because bridge and positive control records were not independent biological observations. Given the intentionally balanced panel, kappa was interpreted within the method comparison framework rather than as a population-level agreement estimate [49].
To compare all-record reference-concordant yield between KASP and T-ARMS PCR, an exact McNemar test was used for the 96 primary sample records. For each record, each method was classified according to whether it produced a codon-67 classification concordant with the Sanger-supported reference; discordant, no-call, and ambiguous outcomes were classified as not reference-concordant under the primary all-record rule. The exact paired comparison was implemented as an exact binomial test on the discordant pairs, under the null hypothesis that the two methods were equally likely to produce a reference-concordant classification when the other method did not [50]. This approach allowed direct comparison of paired reference-concordance outcomes while avoiding overinterpretation of repeated bridge sample and positive control records. The same classification logic was summarized for the complete 116-record technical dataset as a secondary descriptive analysis. The binary paired analysis addressed all-record reference concordance with the Sanger-supported reference and did not imply absolute correctness, a resolved error mechanism, or formal validation of either alternative assay. Exact binomial confidence intervals were reported to describe the precision of the observed method comparison panel estimates, in line with precision-based approaches recommended for qualitative test performance studies [51,52,53,54].
The absolute paired difference in all-record reference-concordant yield between KASP and T-ARMS PCR was calculated as (b − c)/n, where b represents primary sample records concordant by KASP but not reference-concordant by T-ARMS PCR, c represents primary sample records not reference-concordant by KASP but concordant by T-ARMS PCR, and n represents the 96 primary sample records. Because the number of discordant paired cells was limited, the 95% confidence interval for the paired difference was estimated using a nonparametric percentile bootstrap procedure [55]. This approach was chosen to preserve the paired record structure and avoid reliance on large-sample approximations. Paired primary sample records were resampled with replacement, the paired difference was recalculated for each bootstrap replicate, and the 2.5th and 97.5th percentiles of the bootstrap distribution were used as the 95% confidence interval.
Plate-associated differences were evaluated as part of the plate- and control-stratified analysis. Plate 1 and Plate 2 were compared using Fisher–Freeman–Halton exact tests for three-category outcome distributions because of the small number of discordant, no-call, and ambiguous outcomes [56]. Binary comparisons of concordant versus non-concordant outcomes were performed using Fisher’s exact test [57]. Bridge samples and positive controls were summarized descriptively because of their limited sample size and their role as technical monitoring and assay control records. These plate-stratified analyses were exploratory sample-level comparisons and were not intended to estimate between-run reproducibility.
All statistical analyses were performed in R version 4.5.1 (R Core Team, 2025) [58]. Exact binomial confidence intervals and exact paired binomial comparisons were calculated using the binom.test function from the stats package. Fisher’s exact tests were calculated using the fisher.test function from the stats package. Cohen’s kappa coefficients were calculated using the kappa2 function from the irr package (version 0.84.1) [48,59]. Before bootstrap resampling, the random number generator was initialized using set.seed (2026). Nonparametric percentile bootstrap confidence intervals were calculated using 10,000 bootstrap resamples of the paired primary sample records [55]. RStudio Desktop version 2025.09.1 + 401 was used only as the integrated development environment (Posit Team, 2025) [60].
2.5. Practical Workflow Assessment
The practical applicability of the evaluated T-ARMS PCR implementation, KASP genotyping, and Sanger sequencing was compared descriptively using workflow-related parameters, including instrumentation requirements, post-PCR processing, interpretation, and workflow characteristics relevant to potential throughput and scalability. This comparison was not designed as an economic evaluation. Standardized micro-costing, labor and instrument time measurements, equipment depreciation, maintenance, repeat testing costs, quality control failures, data handling, fixed costs, and institutional overhead were not evaluated. Consequently, no conclusions are drawn regarding total per-sample cost, cost-effectiveness, or the economic superiority of any method.
3. Results
3.1. Sanger-Supported Codon-67 Reference Panel
The complete technical dataset consisted of 116 assay-level codon-67 genotyping records: 96 primary samples, 8 bridge sample records, and 12 positive control records. The 96 primary samples formed the independent primary dataset for inferential method comparison. Across the complete technical dataset, the three operational codon-67 classes comprised 38 His67/His67 (A1A1), 39 His67/Pro67 (A1A2), and 39 Pro67/Pro67 (A2A2) records (Table 2). These counts describe the intentionally balanced technical dataset and are not population frequencies.
Table 2.
Composition of the complete codon-67 technical dataset.
3.2. KASP and T-ARMS PCR Genotyping Outcomes
Across the complete 116-record technical dataset, KASP produced 110 concordant, 4 discordant, and 2 no-call results, whereas T-ARMS PCR produced 96 concordant, 7 discordant, and 13 ambiguous results. In the 96 independent primary sample records, KASP yielded 90 concordant, 4 discordant, and 2 no-call results, whereas T-ARMS PCR yielded 77 concordant, 6 discordant, and 13 ambiguous results. KASP discordances occurred only in Sanger-supported A2A2 records, and KASP no-calls occurred only in A1A1 records. T-ARMS PCR non-concordant outcomes were most frequent in the A2A2 reference class. The 13 ambiguous primary outcomes were non-interpretable banding patterns under the predefined scoring criteria, not forced or confirmed incorrect genotype classifications. Class-specific outcomes for both the complete technical dataset and the primary analysis set are summarized in Table 3.
Table 3.
Class-specific KASP and T-ARMS PCR outcomes relative to Sanger-supported codon-67 reference classifications in the complete technical dataset and in the 96 independent primary sample records.
KASP had a higher estimated all-record reference-concordant yield than the evaluated T-ARMS PCR implementation. When all 96 primary records were retained and discordant, no-call, and ambiguous outcomes were classified as not reference-concordant, KASP yielded reference-concordant classifications in 90/96 records (93.8%), compared with 77/96 (80.2%) for T-ARMS PCR. Among callable or evaluable results, concordance was 90/94 (95.7%) for KASP and 77/83 (92.8%) for T-ARMS PCR. Exact 95% binomial confidence intervals for the primary indicators are shown in Table 4.
Table 4.
Exact 95% binomial confidence intervals for the main primary reference-concordance and outcome metrics.
The estimated difference between methods was larger for all-record reference-concordant yield than for concordance among callable or evaluable results. This indicates that the main observed difference in this panel was the higher KASP call rate and lower proportion of non-interpretable outcomes, rather than a large difference after a clear result had been obtained.
Under the primary paired classification, KASP was reference-concordant while T-ARMS PCR was not reference-concordant in 19 records, whereas T-ARMS PCR was reference-concordant while KASP was not reference-concordant in 6 records. The exact McNemar test gave p = 0.015, and the estimated paired difference in all-record reference-concordant yield was 13.5 percentage points higher for KASP (bootstrap 95% CI: 4.2–22.9 percentage points; Table 5). Cohen’s kappa among callable/evaluable primary records was 0.936 for KASP and 0.891 for T-ARMS PCR. This paired result describes reference concordance under the primary all-record rule and does not establish an intrinsic method advantage or the cause of individual discordances.
Table 5.
Primary paired comparison of KASP and T-ARMS PCR relative to the re-audited Sanger-supported codon-67 reference classifications and descriptive agreement statistics.
3.2.1. Direction and Retrospective Record-Level Review of KASP Discordances
Retrospective record-level review of the four callable KASP-discordant primary records documented that all four had Sanger-supported A2A2 reference classifications and exported A1A2 KASP calls, whereas T-ARMS PCR classified all four as A2A2. Two discordant records occurred on each assay plate; thus, the discordances were not confined to one plate, although the small number of records precludes formal inference about plate effects.
The FAM/HEX ratios of the four callable KASP-discordant records were 0.8345, 0.8440, 0.7755, and 0.8947. These values fell within the observed heterozygous cluster range rather than at the Pro67/Pro67-to-heterozygous cluster boundary. The original exported KASP calls therefore corresponded to clear heterozygous-like fluorescence patterns for samples with Sanger-supported Pro67/Pro67 reference classifications. The retrospective review was limited to available original records and did not include a new DNA dilution, independent aliquot, new DNA extraction, repeat KASP run, or new Sanger sequencing. It could therefore document the direction and fluorescence pattern of the discordance but could not determine its technical cause, reproducibility, or whether it reflected a sample-specific or assay-related factor. Original calls were retained without mechanistic reclassification (Supplementary Table S2 and Figure S3).
3.2.2. Binary A2A2 Versus Non-A2A2 Classification
In the binary A2A2 versus non-A2A2 summary, KASP yielded A2A2 calls in 29/33 Sanger-supported A2A2 records and yielded no A2A2 calls among non-A2A2 reference records; two non-A2A2 reference records were no-calls. T-ARMS PCR yielded A2A2 calls in 22/33 A2A2 reference records, non-A2A2 calls in five A2A2 reference records, and six ambiguous outcomes among A2A2 reference records.
When non-evaluable outcomes were classified as not reference-concordant, the reference-positive all-record yield for A2A2 records and the reference-negative all-record yield for non-A2A2 records were 87.9% (29/33) and 96.8% (61/63) for KASP, and 66.7% (22/33) and 87.3% (55/63) for T-ARMS PCR, respectively. Among callable or evaluable primary records, reference-based sensitivity and specificity were 87.9% and 100.0% for KASP and 81.5% and 98.2% for T-ARMS PCR, respectively. Positive and negative predictive values are reported only as panel-specific descriptive quantities for this intentionally balanced panel and must not be interpreted as population-level estimates (Supplementary Tables S3 and S4).
To make the direction of class-level reference discordances explicit, method-specific confusion summaries for the 96 primary sample records are provided in Supplementary Table S5. KASP produced no A2A2 calls among non-A2A2 reference records; all four callable KASP discordances occurred in Sanger-supported A2A2 records and were called A1A2. In contrast, T-ARMS PCR produced one A2A2 call among non-A2A2 reference records and five clear non-A2A2 calls among Sanger-supported A2A2 records, in addition to thirteen ambiguous outcomes.
3.3. Plate-, Bridge-Sample-, and Control-Stratified Analyses
Plate-stratified results did not indicate confinement of the KASP discordances to a single plate: each plate had 45 concordant, 2 discordant, and 1 no-call result. However, the small number of discordant and no-call outcomes limits formal inference on plate effects. No evidence of a plate-associated outcome difference was observed in the Fisher–Freeman–Halton exact test (p = 1.000); however, the study was not designed or powered to evaluate between-run effects.
For T-ARMS PCR, each plate had three discordant calls. Ambiguous outcomes were more frequent on Plate 2 than on Plate 1 (eight versus five), but neither the three-category outcome distribution nor the binary concordant/non-concordant comparison differed significantly (p = 0.746 and p = 0.609, respectively; Table 6).
Table 6.
Plate-stratified primary-sample outcomes and descriptive bridge sample and positive control summary for KASP genotyping and T-ARMS PCR relative to Sanger-supported reference classifications.
All positive control records were concordant for both methods. Bridge samples were fully concordant for KASP and 7/8 concordant for T-ARMS PCR.
The composition of ambiguous T-ARMS PCR outcomes was further summarized by plate and Sanger-supported reference classification in Supplementary Table S6. Among the 13 ambiguous primary records, weak band patterns were the most frequent category (8/13), followed by additional band patterns (4/13) and one non-interpretable call. No smeared amplification category was observed among the primary sample records. Ambiguous outcomes were more frequent on Plate 2 than on Plate 1, consistent with the plate-stratified summary, but this difference was not statistically significant.
3.4. Practical Workflow Comparison
The descriptive workflow comparison distinguished the practical laboratory roles of the three approaches evaluated in the present study (Table 7). The evaluated T-ARMS PCR implementation used conventional PCR and gel electrophoresis infrastructure and may therefore be applicable in laboratories without fluorescence detection instrumentation. However, it required post-PCR processing and visual or semi-manual interpretation, and it produced a higher proportion of ambiguous outcomes under the tested conditions.
Table 7.
Practical workflow and implementation requirements of the evaluated T-ARMS PCR implementation, KASP genotyping, and Sanger sequencing for targeted CSN2 codon-67 genotyping.
KASP provided a closed-tube fluorescence workflow with software-assisted classification and no post-PCR electrophoresis, providing greater potential for higher-throughput implementation where compatible fluorescence detection instrumentation and commercial assay components are available. Sanger sequencing provided sequence-level reference information and remains appropriate for reference classification, discordant result investigation, rare variant assessment, and other cases requiring broader sequence information. Because comprehensive cost accounting was not performed, the present comparison does not establish the relative total cost or cost-effectiveness of these workflows.
4. Discussion
For A2-oriented breeding, the practical value of a targeted CSN2 codon-67 test depends on both agreement with the reference classification and the production of an interpretable result. In this paired, laboratory-specific comparison, KASP had a higher all-record reference-concordant yield than the evaluated locally implemented gel-based T-ARMS PCR workflow when discordant, no-call, and ambiguous outcomes were classified as not reference-concordant (93.8% versus 80.2%). Concordance was more similar among callable or evaluable results (95.7% versus 92.8%). The principal observed difference was therefore the higher KASP call rate and lower frequency of non-interpretable outcomes rather than a large difference after a clear classification had been obtained. These findings do not constitute formal validation of either assay and should not be interpreted as evidence of the intrinsic superiority of one amplification principle over another.
Direct numerical comparison with previous CSN2 studies is limited by differences in assay targets, reference comparators, sample selection, analytical denominators, and the treatment of unsuccessful or indeterminate results. Giglioti et al. [61] reported complete genotyping and 100% agreement between LNA-probe real-time PCR and rhAmp genotyping in 38 samples, but compared two alternative assays and did not report a separate no-call category. Kulibaba et al. [62] reported complete agreement between optimized AS-PCR systems and an ACRS-PCR comparator, while also showing that non-optimized annealing conditions could produce false heterozygous patterns in known A2A2 samples. Albiero et al. [63] reported 100% sensitivity and specificity for binary A2A2 identification using protein-based assays in previously genotyped animals, but that endpoint is not directly equivalent to three-class DNA-genotyping concordance. Vigolo et al. [29] confirmed their evaluated PCR results by sequencing but did not report an ARMS-PCR no-call or failure rate using a denominator directly comparable with the present analysis. Consequently, the present all-record and callable/evaluable estimates should be interpreted according to their explicitly defined outcome categories rather than as direct numerical benchmarks against these studies.
The direction of the four callable KASP discordances is relevant to A2-oriented breeding decisions. All four records had Sanger-supported Pro67/Pro67 reference classifications but were called His67/Pro67 by KASP; no non-Pro67/Pro67 reference record received a Pro67/Pro67 KASP call. Thus, the observed errors represented under-calling of the operational A2A2 class, which could exclude suitable animals from A2-oriented breeding or production groups, rather than false inclusion of non-A2A2 animals. The four records fell within the heterozygous fluorescence-cluster range rather than at the cluster boundary, so visual cluster inspection alone would not necessarily have identified them as questionable.
The cause and reproducibility of these KASP discordances remain unresolved. The original calls were retained, and the existing Sanger chromatograms were independently re-audited, but no new DNA dilution, separate aliquot, DNA extraction, repeat KASP run, or new Sanger sequencing was performed. Potential contributors include sample-handling or labeling error, cross-contamination, DNA concentration or quality effects, sequence variation near an assay-binding site, or non-specific allele amplification [35,37,38,39,40,41,42,43]. However, the available records cannot distinguish among these possibilities, and the four observations cannot be used to infer a stable KASP error rate or a specific analytical mechanism. Independent repeat testing and sequencing confirmation remain necessary for discordant, borderline, or high-impact classifications [64,65,66].
The ambiguity burden observed with the evaluated T-ARMS PCR implementation should likewise be interpreted in relation to the tested assay configuration. Tetra-primer ARMS PCR performance can be affected by primer architecture, the relative concentrations of inner and outer primers, annealing temperature, cycle conditions, template quality, and interpretation of allele-specific bands [62,67,68,69,70,71,72]. In the present study, 68.4 °C was selected through a six-temperature pilot gradient using one reference sample from each operational codon-67 class and was subsequently examined in a small follow-up run. However, the 2:1 inner-to-outer primer ratio was fixed; alternative primer ratios were not compared; the pilot and primary thermal programs differed; and the parameters were not examined in a replicated factorial design. Ambiguous or discordant primary records were also not re-amplified under modified conditions. The weak band and additional band outcomes therefore characterize this specific locally implemented primer and detection workflow under the tested conditions; they do not define the best achievable performance of T-ARMS PCR. The in silico FA2 alignment findings further support an assay-specific interpretation, although their contribution to the observed outcomes was not experimentally tested.
The ARMS-integrated HRM assay described by Lee et al. [34] provides additional support for this distinction. That assay combined allele-specific amplification with closed-tube melting analysis and discriminated the three codon-67 classes without post-PCR gel electrophoresis. This demonstrates that post-PCR handling and gel-related interpretation are not intrinsic requirements of the ARMS principle and may be reduced through alternative primer architectures and detection systems. The present findings therefore compare KASP with the specific locally implemented gel-based T-ARMS PCR workflow evaluated here, not with ARMS-based approaches generally.
The present comparison is also complementary to the authors’ earlier sequence-supported CSN2 workflow [5]. The earlier approach was designed to distinguish multiple alleles, including A1, A2, A3, B, and I, whereas the KASP and T-ARMS PCR assays evaluated here classify only the codon-67 His/Pro state. Because multiple CSN2 alleles can share His67 or Pro67, the operational A1A1, A1A2, and A2A2 labels used in this study should be understood as His67/His67, His67/Pro67, and Pro67/Pro67 classes rather than complete allele assignments [12,15,29,73,74,75,76]. Targeted codon-67 assays may be appropriate for routine screening where the broader allelic spectrum has already been characterized, whereas sequencing or multi-marker analysis remains preferable for comprehensive allele identification, rare variants, unresolved discordances, and other high-impact cases.
The binary Pro67/Pro67 versus non-Pro67/Pro67 analysis further illustrates the practical effect of non-evaluable outcomes. When such outcomes were treated as non-concordant decisions, the reference-positive and reference-negative decision yields were 87.9% and 96.8% for KASP and 66.7% and 87.3% for the evaluated T-ARMS PCR implementation. These differences again primarily reflected callability. In practical terms, the evaluated gel-based workflow can be implemented with conventional PCR and electrophoresis equipment but requires post-PCR processing and visual band interpretation. KASP requires fluorescence detection instrumentation and commercial assay components but provides closed-tube processing, software-assisted calling, and greater potential scalability [15,29,34,35,36]. Sanger sequencing or broader sequence-based analysis remains appropriate for reference confirmation and cases requiring information beyond the targeted nucleotide [5,15,25,27]. Because standardized micro-costing, labor and instrument time measurement, repeat-testing costs, equipment depreciation, and institutional overhead were not evaluated, the present comparison does not establish total per-sample cost, cost-effectiveness, or the economic superiority of any workflow.
Several limitations define the scope of these findings. The panel was purposively balanced across the three operational codon-67 classes and was not population-representative; it therefore cannot be used to estimate population frequencies or prevalence-dependent predictive values. Selection required sufficient archived DNA, acceptable DNA quality, and unambiguous pre-existing Sanger evidence, which may limit generalizability to routine samples with lower or more variable DNA quality. Formal within-run repeatability, between-run reproducibility, and multi-laboratory reproducibility were not systematically assessed. The four KASP-discordant records were not independently retested, and the T-ARMS PCR implementation was not evaluated through replicated factorial optimization or retesting of ambiguous records. Complete CSN2 haplotyping, production traits, product purity, consumer outcomes, and comprehensive economic outcomes were outside the scope of the study. These limitations restrict the conclusions to a paired, laboratory-specific comparison of targeted genotyping workflows and preclude formal assay validation claims [54,64,65,66].
Future studies should include predefined within-run and between-run replicate designs, independent retesting of discordant and high-impact classifications, replicated evaluation of the adapted T-ARMS primer set across primer ratios, annealing temperatures, cycle conditions, and template inputs, prevalence-based sample panels, broader CSN2 variant coverage, and multi-laboratory assessment. The present data suggest that KASP may offer greater potential for scalable targeted codon-67 screening where compatible fluorescence instrumentation is available, whereas optimized ARMS-based workflows may remain suitable for other laboratory settings. Neither approach should be considered universally superior, and discordant, ambiguous, borderline, or economically consequential classifications should be independently repeated or confirmed by sequencing.
5. Conclusions
Under the primary all-record definition, KASP showed a higher reference-concordant yield and fewer non-interpretable outcomes than the specific locally implemented gel-based T-ARMS PCR workflow in this Holstein–Friesian panel. The difference primarily reflected the higher KASP call rate; concordance among callable/evaluable results was more similar. Because the panel was purposively balanced and both assays target only the codon-67 His/Pro state, the results should not be interpreted as estimates of population-level class frequencies or as comprehensive CSN2 allele assignments. The findings do not constitute formal assay validation, do not establish the intrinsic superiority of KASP over T-ARMS PCR or other ARMS approaches, do not define the performance achievable after further T-ARMS optimization, and apply only to targeted CSN2 codon-67 His/Pro classification under the tested laboratory conditions. Systematic repeatability testing, independent retesting of the four KASP-discordant records, factorial T-ARMS PCR optimization, multi-laboratory assessment, and comprehensive economic evaluation were not performed. Consequently, no claim is made regarding the cost-effectiveness or economic superiority of either genotyping workflow. The cause and reproducibility of the four KASP reference discordances therefore remain unresolved. KASP may offer greater potential for scalable targeted screening where fluorescence instrumentation is available, while optimized ARMS workflows may suit other settings. Discordant, ambiguous, borderline, or high-impact classifications require independent repeat testing or sequencing confirmation.
Supplementary Materials
The following supporting information can be downloaded at: https://www.mdpi.com/article/10.3390/dairy7040067/s1, Figure S1: Representative T-ARMS PCR gel image for Plate 1; Figure S2: Representative T-ARMS PCR gel image for Plate 2; Figure S3: KASP endpoint fluorescence cluster plot with operational codon-67 class labels; Figure S4: Cropped Sanger chromatogram evidence supporting the re-audited CSN2 codon-67 reference classifications in representative and critical comparison records; Figure S5: Pilot annealing-temperature gradient and follow-up T-ARMS PCR run at 68.4 °C; Table S1a: Technical dataset components and analytical inclusion criteria; Table S1b: Outcome categories and their treatment in the primary all-record analysis; Table S2: Expanded record-level review of callable KASP-discordant primary sample records; Table S3: Binary Pro67/Pro67 versus non-Pro67/Pro67 classification summary; Table S4: Conditional Pro67/Pro67 detection performance among callable or evaluable primary records; Table S5: Codon-67-class confusion matrices for KASP and T-ARMS PCR in the 96 primary sample records; Table S6: Plate- and reference-class-stratified distribution of ambiguous T-ARMS PCR outcomes in the 96 primary sample records.
Author Contributions
Conceptualization, L.S., V.S., F.P. and Á.B.; methodology, L.S., V.S., F.P., P.Á.F. and Á.B.; formal analysis, L.S., F.P., Á.B. and V.S.; investigation, L.S., P.Á.F., V.S., F.P., Á.B., G.H., S.B. and D.F.; resources, P.P., S.Á., G.H. and D.F.; data curation, L.S., V.S., Á.B. and F.P.; writing—original draft preparation, L.S.; writing—review and editing, L.S., F.P., Á.B., V.S., P.P., S.Á., G.H., S.B., P.Á.F. and D.F.; visualization, L.S. and F.P.; supervision, V.S. and F.P.; project administration, L.S., V.S., F.P. and P.P.; funding acquisition, P.P. and S.Á. All authors have read and agreed to the published version of the manuscript.
Funding
This research was supported by the MATE project 2020-1.1.2-PIACI-KFI-2021-00305 (“Development of technologies supporting the production of industrial milk widely accepted from a nutritional physiology perspective using molecular biology tools”), by the National Research, Development and Innovation Office of the Hungarian Government (grant no. RRF-2.3.1-21-2022-00007, Agribiotechnology and Precision Breeding for Food Security National Laboratory), and by the Flagship Research Groups Programme of the Hungarian University of Agriculture and Life Sciences (Flagship Research Groups 2026).
Institutional Review Board Statement
The present study used previously collected biological samples and associated production records. Sample collection and data use were approved by the Institutional Animal Welfare Body of the Hungarian University of Agriculture and Life Sciences, Szent István Campus (MATE SZIC MÁB; approval issued 10 July 2024). According to the official certification, the study was outside the scope of EU Directive 2010/63/EU and therefore did not require an experimental animal permit.
Informed Consent Statement
Informed consent was obtained from the farm owners for the use of biological samples and production records.
Data Availability Statement
The data supporting the reported aggregate results are contained within the article and its Supplementary Materials. The de-identified record-level assay data and the R analysis code are available from the corresponding author upon reasonable request.
Acknowledgments
The authors also acknowledge the helpful comments received during language editing and statistical review.
Conflicts of Interest
Author D.F. was employed by the company Bólyi Mezőgazdasági Termelő és Kereskedelmi Zártkörűen Működő Részvénytársaság. The remaining authors declare that the research was conducted in the absence of any commercial or financial relationships that could be construed as a potential conflict of interest.
References
- Andiç, S.; Ayaz, R.M.; Oğuz, Ş. A1 milk and beta-casomorphin-7. Food Health 2021, 7, 128–137. [Google Scholar] [CrossRef] [Scilit]
- Huppertz, T. Chemistry of the caseins. In Advanced Dairy Chemistry: Volume 1A: Proteins: Basic Aspects, 4th ed.; McSweeney, P.L.H., Fox, P.F., Eds.; Springer: Boston, MA, USA, 2013; pp. 135–160. [Google Scholar] [CrossRef] [Scilit]
- Bisutti, V.; Pegolo, S.; Giannuzzi, D.; Mota, L.F.M.; Vanzin, A.; Toscano, A.; Trevisi, E.; Ajmone Marsan, P.; Brasca, M.; Cecchinato, A. The β-casein (CSN2) A2 allelic variant alters milk protein profile and slightly worsens coagulation properties in Holstein cows. J. Dairy Sci. 2022, 105, 3794–3809. [Google Scholar] [CrossRef] [Scilit] [PubMed]
- Dantas, A.; Kumar, H.; Prudencio, E.S.; de Avila Junior, L.B.; Orellana-Palma, P.; Dosoky, N.S.; Nepovimova, E.; Kuča, K.; Cruz-Martins, N.; Verma, R. An approach on detection, quantification, technological properties, and trends market of A2 cow milk. Food Res. Int. 2023, 167, 112690. [Google Scholar] [CrossRef] [Scilit] [PubMed]
- Sándorová, L.; Fehér, P.Á.; Ambagan, A.C.; Nagy, K.; Szabari, M.G.; Áprily, S.; Bodó, S.; Bodnár, Á.; Póti, P.; Pajor, F.; et al. Rapid direct CSN2 genotyping by PCR and its application in population genetics and A2 milk selection in Holstein cattle. Dairy 2026, 7, 12. [Google Scholar] [CrossRef] [Scilit]
- Santillo, A.; d’Angelo, F.; Lamberti, C.; Giuffrida, M.G.; Romaniello, F.; Albenzio, M. Distribution of β-casein variants and effects on milk composition in Podolian cows reared in Gargano Promontory, Southern Italy. J. Dairy Sci. 2025, 108, 5570–5579. [Google Scholar] [CrossRef] [Scilit] [PubMed]
- Kolenda, M.; Sitkowska, B. The polymorphism in various milk protein genes in Polish Holstein-Friesian dairy cattle. Animals 2021, 11, 389. [Google Scholar] [CrossRef] [Scilit] [PubMed]
- Amalfitano, N.; Mota, L.F.M.; Rosa, G.M.; Cecchinato, A.; Bittante, G. Role of CSN2, CSN3, and BLG genes and the polygenic background in the cattle milk protein profile. J. Dairy Sci. 2022, 105, 6001–6020. [Google Scholar] [CrossRef] [Scilit] [PubMed]
- Cartuche-Macas, L.F.; Navarrete-Mera, J.F.; Gutiérrez-Reinoso, M.A.; García-Herreros, M. Differential A1/A2 β-casein (CSN2) gene-derived allelic and genotypic frequencies across Ecuadorian exotic dairy cattle breeds. Front. Vet. Sci. 2025, 12, 1616426. [Google Scholar] [CrossRef] [Scilit] [PubMed]
- Miluchová, M.; Gábor, M.; Candrák, J. The effect of the genotypes of the CSN2 gene on test-day milk yields in the Slovak Holstein cow. Agriculture 2023, 13, 154. [Google Scholar] [CrossRef] [Scilit]
- Khan, R.; De, S.; Dewangan, R.; Tamboli, R.; Gupta, R. Potential status of A1 and A2 variants of bovine beta-casein gene in milk samples of Indian cattle breeds. Anim. Biotechnol. 2023, 34, 4878–4884. [Google Scholar] [CrossRef] [Scilit] [PubMed]
- Farrell, H.M., Jr.; Jimenez-Flores, R.; Bleck, G.T.; Brown, E.M.; Butler, J.E.; Creamer, L.K.; Hicks, C.L.; Hollar, C.M.; Ng-Kwai-Hang, K.F.; Swaisgood, H.E. Nomenclature of the proteins of cows’ milk—Sixth revision. J. Dairy Sci. 2004, 87, 1641–1674. [Google Scholar] [CrossRef] [Scilit] [PubMed]
- Safa, M.A.; Mou, M.A.; Hridoy, M.F.A.; Siddiqua, S.A.; Bhuiyan, A.K.F.H.; Bhuiyan, M.S.A. Analysis of β-casein gene for A1 and A2 allelic variants in Holstein-Local crossbred cattle of Bangladesh using allele-specific PCR. J. Adv. Biotechnol. Exp. Ther. 2024, 7, 74–82. [Google Scholar] [CrossRef] [Scilit]
- Ali, A.H.; Hachem, M.; Najjar, Z.; Liu, S.Q.; Bamigbade, G.B.; Ayyash, M. β-casomorphin-7: A review of occurrence, identification, techno-functionality, and effects on human health. npj Sci. Food 2026, 10, 116. [Google Scholar] [CrossRef] [Scilit] [PubMed]
- Sándorová, L.; Pajor, F.; Egerszegi, I.; Bodnár, Á.; Bodó, S.; Stéger, V. CSN2 A1/A2 genotyping in dairy cattle: A decision-oriented review of molecular methods and practical applications. Agriculture 2026, 16, 822. [Google Scholar] [CrossRef] [Scilit]
- Bolat, E.; Eker, F.; Yılmaz, S.; Karav, S.; Oz, E.; Brennan, C.; Proestos, C.; Zeng, M.; Oz, F. BCM-7: Opioid-like peptide with potential role in disease mechanisms. Molecules 2024, 29, 2161. [Google Scholar] [CrossRef] [Scilit] [PubMed]
- Cieślińska, A.; Fiedorowicz, E.; Rozmus, D.; Sienkiewicz-Szłapka, E.; Jarmołowska, B.; Kamiński, S. Does a little difference make a big difference? Bovine β-casein A1 and A2 variants and human health—An update. Int. J. Mol. Sci. 2022, 23, 15637. [Google Scholar] [CrossRef] [Scilit] [PubMed]
- Kaskous, S. A1- and A2-milk and their effect on human health. J. Food Eng. Technol. 2020, 9, 15–21. [Google Scholar] [CrossRef] [Scilit]
- De Noni, I.; Fitzgerald, R.J.; Korhonen, H.J.T.; Le Roux, Y.; Livesey, C.T.; Thorsdottir, I.; Tomé, D.; Witkamp, R. Review of the potential health impact of β-casomorphins and related peptides. Report of the DATEX Working Group on β-casomorphins. EFSA Sci. Rep. 2009, 231, 1–107. [Google Scholar] [CrossRef] [Scilit]
- Kamiński, S.; Cieślińska, A. β-casein A1 and A2 genetic variants and β-casomorphin-7 in raw milk and processed milk products. Int. J. Mol. Sci. 2025, 26, 8612. [Google Scholar] [CrossRef] [Scilit] [PubMed]
- González-Rodríguez, N.; Vázquez-Liz, N.; Rodríguez-Sampedro, A.; Regal, P.; Fente, C.; Lamas, A. The impact of A1- and A2 β-casein on health outcomes: A comprehensive review of evidence from human studies. Appl. Sci. 2025, 15, 7278. [Google Scholar] [CrossRef] [Scilit]
- Ardicli, S.; Aldevir, Ö.; Aksu, E.; Kucuk, K.; Gümen, A. Associations of bovine beta-casein and kappa-casein genotypes with genomic merit in Holstein Friesian cattle. Arch. Anim. Breed. 2024, 67, 61–71. [Google Scholar] [CrossRef] [Scilit] [PubMed]
- Pabitra, M.H.; Maruf, T.M.; Mony, S.I.; Ebnat, R.; Hoque, M.R.; Bhuiyan, M.S.A. Molecular characterization and A1/A2 genotyping of casein beta gene in zebu and crossbred cattle of Bangladesh. Czech J. Anim. Sci. 2022, 67, 318–326. [Google Scholar] [CrossRef] [Scilit]
- Czerniawska-Piątkowska, E.; Cioch-Szklarz, B.; Kowalczyk, A.; Wrzecińska, M.; Wójcik, J.; Kordan, W.; Araujo, J.P.; Cerqueira, J.L.; Kossakowski, K.; Cwynar, P.; et al. Relationship between milk protein polymorphism and selected cows’ reproductive indices. Animals 2023, 13, 1729. [Google Scholar] [CrossRef] [Scilit] [PubMed]
- Sanger, F.; Nicklen, S.; Coulson, A.R. DNA sequencing with chain-terminating inhibitors. Proc. Natl. Acad. Sci. USA 1977, 74, 5463–5467. [Google Scholar] [CrossRef] [Scilit] [PubMed]
- Hashim, H.O.; Al-Shuhaib, M.B.S. Exploring the potential and limitations of PCR-RFLP and PCR-SSCP for SNP detection: A review. J. Appl. Biotechnol. Rep. 2019, 6, 137–144. [Google Scholar] [CrossRef] [Scilit]
- Lewerentz, F.; Vanhala, T.K.; Johansen, L.B.; Paulsson, M.; Glantz, M.; de Koning, D.J. Re-sequencing of the casein genes in Swedish Red cattle giving milk with diverse protein profiles and extreme rennet coagulation properties. JDS Commun. 2024, 5, 299–304. [Google Scholar] [CrossRef] [Scilit] [PubMed]
- Raschia, M.A.; Caffaro, M.E.; Rossi, Ú.A.; Poli, M.A. Modification of a previously patented method to unequivocally score A2-like and A1-like bovine β-casein variants. MethodsX 2023, 10, 102183. [Google Scholar] [CrossRef] [Scilit] [PubMed]
- Vigolo, V.; Franzoi, M.; Cendron, F.; Salvadore, G.; Penasa, M.; Cassandro, M.; De Marchi, M. Characterization of the genetic polymorphism linked to the β-casein A1/A2 alleles using different molecular and biochemical methods. J. Dairy Sci. 2022, 105, 8946–8955. [Google Scholar] [CrossRef] [Scilit] [PubMed]
- Kusza, S.; Cziszter, L.T.; Ilie, D.E.; Sauer, M.; Padeanu, I.; Gavojdian, D. Kompetitive Allele Specific PCR (KASP™) genotyping of 48 polymorphisms at different caprine loci in French Alpine and Saanen goat breeds and their association with milk composition. PeerJ 2018, 6, e4416. [Google Scholar] [CrossRef] [Scilit] [PubMed]
- Zhao, J.; Wang, C.; Hu, J.; Ma, R.; Yu, B.; Zhao, W.; Zhang, J. Integrated metagenomics and metabolomics analyses revealed biomarkers in β-casein A2A2-type cows. Front. Vet. Sci. 2024, 11, 1438717. [Google Scholar] [CrossRef] [Scilit] [PubMed]
- Alyethodi, R.R.; Singh, U.; Kumar, S.; Alex, R.; Deb, R.; Sengar, G.S.; Prakash, B. T-ARMS PCR genotyping of SNP rs445709131 using thermostable strand displacement polymerase. BMC Res. Notes 2018, 11, 132. [Google Scholar] [CrossRef] [Scilit] [PubMed]
- Ganguly, I.; Gaur, G.K.; Singh, U.; Kumar, S.; Mann, S. Beta-casein (CSN2) polymorphism in Ongole (Indian zebu) and Frieswal (HF × Sahiwal crossbred) cattle. Indian J. Biotechnol. 2013, 12, 195–198. [Google Scholar]
- Lee, Y.; Baek, H.; Lee, J.; Lim, D.; Choi, I. An ARMS-integrated high-resolution melting assay for reliable discrimination of the A1/A2 polymorphism in the bovine CSN2 gene. Food Chem. Mol. Sci. 2026, 12, 100404. [Google Scholar] [CrossRef] [Scilit] [PubMed]
- Semagn, K.; Babu, R.; Hearne, S.; Olsen, M. Single nucleotide polymorphism genotyping using Kompetitive Allele Specific PCR (KASP): Overview of the technology and its application in crop improvement. Mol. Breed. 2014, 33, 1–14. [Google Scholar] [CrossRef] [Scilit]
- Dipta, B.; Sood, S.; Mangal, V.; Bhardwaj, V.; Thakur, A.K.; Kumar, V.; Singh, B. KASP: A high-throughput genotyping system and its applications in major crop plants for biotic and abiotic stress tolerance. Mol. Biol. Rep. 2024, 51, 508. [Google Scholar] [CrossRef] [Scilit] [PubMed]
- Broccanello, C.; Gerace, L.; Stevanato, P. Comparison of three PCR-based assays for SNP genotyping in plants. Plant Methods 2018, 14, 28. [Google Scholar] [CrossRef] [Scilit] [PubMed]
- Ayalew, H.; Tsang, P.W.; Chu, C.; Wang, J.; Liu, S.; Chen, C.; Ma, X.F. Comparison of TaqMan, KASP and rhAmp SNP genotyping platforms in hexaploid wheat. PLoS ONE 2019, 14, e0217222. [Google Scholar] [CrossRef] [Scilit] [PubMed]
- Kalendar, R.; Shustov, A.V.; Akhmetollayev, I.; Kairov, U. Designing allele-specific competitive-extension PCR-based assays for high-throughput genotyping and gene characterization. Front. Mol. Biosci. 2022, 9, 773956. [Google Scholar] [CrossRef] [Scilit] [PubMed]
- Chen, X.; Huang, L.; Fan, J.; Yan, S.; Zhou, G.; Zhang, J. KASP-IEva: An intelligent typing evaluation model for KASP primers. Front. Plant Sci. 2024, 14, 1293599. [Google Scholar] [CrossRef] [Scilit] [PubMed]
- Ilie, D.E.; Gavojdian, D.; Kusza, S.; Neamț, R.I.; Mizeranschi, A.E.; Mihali, C.V.; Cziszter, L.T. Kompetitive Allele Specific PCR genotyping of 89 SNPs in Romanian Spotted and Romanian Brown cattle breeds and their association with clinical mastitis. Animals 2023, 13, 1484. [Google Scholar] [CrossRef] [Scilit] [PubMed]
- Zheng, W.; Wu, P.; Zhu, M.; Ullah, Y.; Zhao, Z.; Cao, S.; Li, G.; Ou, S.; He, K.; Xu, Y. Establishment and validation of a method for the identification of recessive mastitis resistance genes in dairy cows. Genes 2025, 16, 485. [Google Scholar] [CrossRef] [Scilit] [PubMed]
- Zhang, Y.; Liang, D.; Huang, H.; Yang, Z.; Wang, Y.; Yu, Y.; Liu, L.; Zhang, S.; Han, J.; Xiao, W. Technical note: Development and application of KASP assays for rapid screening of eight genetic defects in Holstein cattle. J. Dairy Sci. 2020, 103, 619–624. [Google Scholar] [CrossRef] [Scilit] [PubMed]
- Sándorová, L.; Pajor, F.; Fehér, P.Á.; Szabari, M.G.; Áprily, S.; Bodó, S.; Póti, P.; Egerszegi, I.; Bodnár, Á.; Stéger, V. Reproductive neutrality of the A2 β-casein variant in Holstein cows. Animals 2026, 16, 741. [Google Scholar] [CrossRef] [Scilit] [PubMed]
- Rincón, G.; Medrano, J.F. Single nucleotide polymorphism genotyping of bovine milk protein genes using the tetra-primer ARMS-PCR. J. Anim. Breed. Genet. 2003, 120, 331–337. [Google Scholar] [CrossRef] [Scilit]
- Biosearch Technologies. KASP Genotyping Assays. Available online: https://www.biosearchtech.com/products/oligos-probes-and-primers/kasp-genotyping-assays (accessed on 20 May 2026).
- Clopper, C.J.; Pearson, E.S. The use of confidence or fiducial limits illustrated in the case of the binomial. Biometrika 1934, 26, 404–413. [Google Scholar] [CrossRef] [Scilit]
- Cohen, J. A coefficient of agreement for nominal scales. Educ. Psychol. Meas. 1960, 20, 37–46. [Google Scholar] [CrossRef] [Scilit]
- Landis, J.R.; Koch, G.G. The measurement of observer agreement for categorical data. Biometrics 1977, 33, 159–174. [Google Scholar] [CrossRef] [Scilit]
- McNemar, Q. Note on the sampling error of the difference between correlated proportions or percentages. Psychometrika 1947, 12, 153–157. [Google Scholar] [CrossRef] [Scilit] [PubMed]
- Buderer, N.M.F. Statistical methodology: I. Incorporating the prevalence of disease into the sample size calculation for sensitivity and specificity. Acad. Emerg. Med. 1996, 3, 895–900. [Google Scholar] [CrossRef] [Scilit] [PubMed]
- Flahault, A.; Cadilhac, M.; Thomas, G. Sample size calculation should be performed for design accuracy in diagnostic test studies. J. Clin. Epidemiol. 2005, 58, 859–862. [Google Scholar] [CrossRef] [Scilit] [PubMed]
- Hajian-Tilaki, K. Sample size estimation in diagnostic test studies of biomedical informatics. J. Biomed. Inform. 2014, 48, 193–204. [Google Scholar] [CrossRef] [Scilit] [PubMed]
- CLSI. Evaluation of Qualitative, Binary Output Examination Performance, 3rd ed.; CLSI guideline EP12; Clinical and Laboratory Standards Institute: Wayne, PA, USA, 2023. [Google Scholar]
- Efron, B.; Tibshirani, R.J. An Introduction to the Bootstrap; Chapman & Hall: New York, NY, USA, 1993. [Google Scholar]
- Freeman, G.H.; Halton, J.H. Note on an exact treatment of contingency, goodness of fit and other problems of significance. Biometrika 1951, 38, 141–149. [Google Scholar] [CrossRef] [Scilit]
- Fisher, R.A. On the interpretation of χ2 from contingency tables, and the calculation of P. J. R. Stat. Soc. 1922, 85, 87–94. [Google Scholar] [CrossRef] [Scilit]
- R Core Team. R: A Language and Environment for Statistical Computing; R Foundation for Statistical Computing: Vienna, Austria, 2025. [Google Scholar]
- Gamer, M.; Lemon, J.; Fellows, I.; Singh, P. irr: Various Coefficients of Interrater Reliability and Agreement; R Package Version 0.84.1. 2019. Available online: https://CRAN.R-project.org/package=irr (accessed on 6 August 2026).
- Posit Team. RStudio: Integrated Development Environment for R; Posit Software; PBC: Boston, MA, USA, 2025. [Google Scholar]
- Giglioti, R.; Okino, C.H.; Azevedo, B.T.; Gutmanis, G.; Katiki, L.M.; de Sena Oliveira, M.C.; Vercesi Filho, A.E. Novel LNA probe-based assay for the A1 and A2 identification of β-casein gene in milk samples. Food Chem. Mol. Sci. 2021, 3, 100055. [Google Scholar] [CrossRef] [Scilit] [PubMed]
- Kulibaba, R.; Sakhatskyi, M.; Liashenko, Y. Comparative analysis of A1 and A2 allele detection efficiency for bovine CSN2 gene by AS-PCR methods. Acta Biochim. Pol. 2023, 70, 205–209. [Google Scholar] [CrossRef] [Scilit] [PubMed]
- Albiero, L.O.X.; Ansiliero, R.; Kempka, A.P. Comparative analysis of rapid and less invasive methods for A2A2 dairy cattle genotyping and A2 milk purity detection. Dairy 2024, 5, 786–799. [Google Scholar] [CrossRef] [Scilit]
- Mattocks, C.J.; Morris, M.A.; Matthijs, G.; Swinnen, E.; Corveleyn, A.; Dequeker, E.; Müller, C.R.; Pratt, V.; Wallace, A. EuroGentest Validation Group. A standardized framework for the validation and verification of clinical molecular genetic tests. Eur. J. Hum. Genet. 2010, 18, 1276–1288. [Google Scholar] [CrossRef] [Scilit] [PubMed]
- Bossuyt, P.M.; Reitsma, J.B.; Bruns, D.E.; Gatsonis, C.A.; Glasziou, P.P.; Irwig, L.; Lijmer, J.G.; Moher, D.; Rennie, D.; de Vet, H.C.W.; et al. STARD 2015: An updated list of essential items for reporting diagnostic accuracy studies. BMJ 2015, 351, h5527. [Google Scholar] [CrossRef] [Scilit] [PubMed]
- Cohen, J.F.; Korevaar, D.A.; Altman, D.G.; Bruns, D.E.; Gatsonis, C.A.; Hooft, L.; Irwig, L.; Levine, D.; Reitsma, J.B.; de Vet, H.C.W.; et al. STARD 2015 guidelines for reporting diagnostic accuracy studies: Explanation and elaboration. BMJ Open 2016, 6, e012799. [Google Scholar] [CrossRef] [Scilit] [PubMed]
- Newton, C.R.; Graham, A.; Heptinstall, L.E.; Powell, S.J.; Summers, C.; Kalsheker, N.; Smith, J.C.; Markham, A.F. Analysis of any point mutation in DNA. The amplification refractory mutation system (ARMS). Nucleic Acids Res. 1989, 17, 2503–2516. [Google Scholar] [CrossRef] [Scilit] [PubMed]
- Ye, S.; Dhillon, S.; Ke, X.; Collins, A.R.; Day, I.N.M. An efficient procedure for genotyping single nucleotide polymorphisms. Nucleic Acids Res. 2001, 29, e88. [Google Scholar] [CrossRef] [Scilit] [PubMed]
- Medrano, R.F.V.; de Oliveira, C.A. Guidelines for the tetra-primer ARMS-PCR technique development. Mol. Biotechnol. 2014, 56, 599–608. [Google Scholar] [CrossRef] [Scilit] [PubMed]
- Ahlawat, S.; Sharma, R.; Maitra, A.; Roy, M.; Tantia, M.S. Designing, optimization and validation of tetra-primer ARMS PCR protocol for genotyping mutations in caprine Fec genes. Meta Gene 2014, 2, 439–449. [Google Scholar] [CrossRef] [Scilit] [PubMed]
- Honardoost, M.A.; Tabatabaeian, H.; Akbari, M.; Salehi, M. Investigation of sensitivity, specificity and accuracy of tetra-primer ARMS PCR method in comparison with conventional ARMS PCR, based on sequencing technique outcomes in IVS-II-I genotyping of beta thalassemia patients. Gene 2014, 549, 1–6. [Google Scholar] [CrossRef] [Scilit] [PubMed]
- Rosman, N.; Nawawi, H.M.; Al-Khateeb, A.; Chua, Y.-A.; Chua, A.-L. Development of an optimized tetra-amplification refractory mutation system PCR for detection of 12 pathogenic familial hypercholesterolemia variants in the Asian population. J. Mol. Diagn. 2022, 24, 120–130. [Google Scholar] [CrossRef] [Scilit] [PubMed]
- Ardicli, S.; Samli, H.; Balci, F. Analysis of bovine beta-casein A1 and A2 allele frequency in Holstein-Friesian cows by real-time PCR with fluorescent hybridization probes. Vet. Arh. 2023, 93, 279–286. [Google Scholar] [CrossRef] [Scilit]
- Caroli, A.M.; Chessa, S.; Erhardt, G.J. Invited review: Milk protein polymorphisms in cattle: Effect on animal breeding and human nutrition. J. Dairy Sci. 2009, 92, 5335–5352. [Google Scholar] [CrossRef] [Scilit] [PubMed]
- Massella, E.; Piva, S.; Giacometti, F.; Liuzzo, G.; Zambrini, A.V.; Serraino, A. Evaluation of bovine beta casein polymorphism in two dairy farms located in northern Italy. Ital. J. Food Saf. 2017, 6, 6904. [Google Scholar] [CrossRef] [Scilit] [PubMed]
- Sanchez, M.P.; Fritz, S.; Patry, C.; Delacroix-Buchet, A.; Boichard, D. Frequencies of milk protein variants and haplotypes estimated from genotypes of more than 1 million bulls and cows of 12 French cattle breeds. J. Dairy Sci. 2020, 103, 9124–9141. [Google Scholar] [CrossRef] [Scilit]
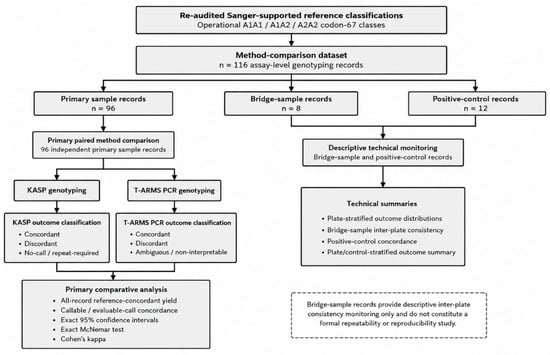
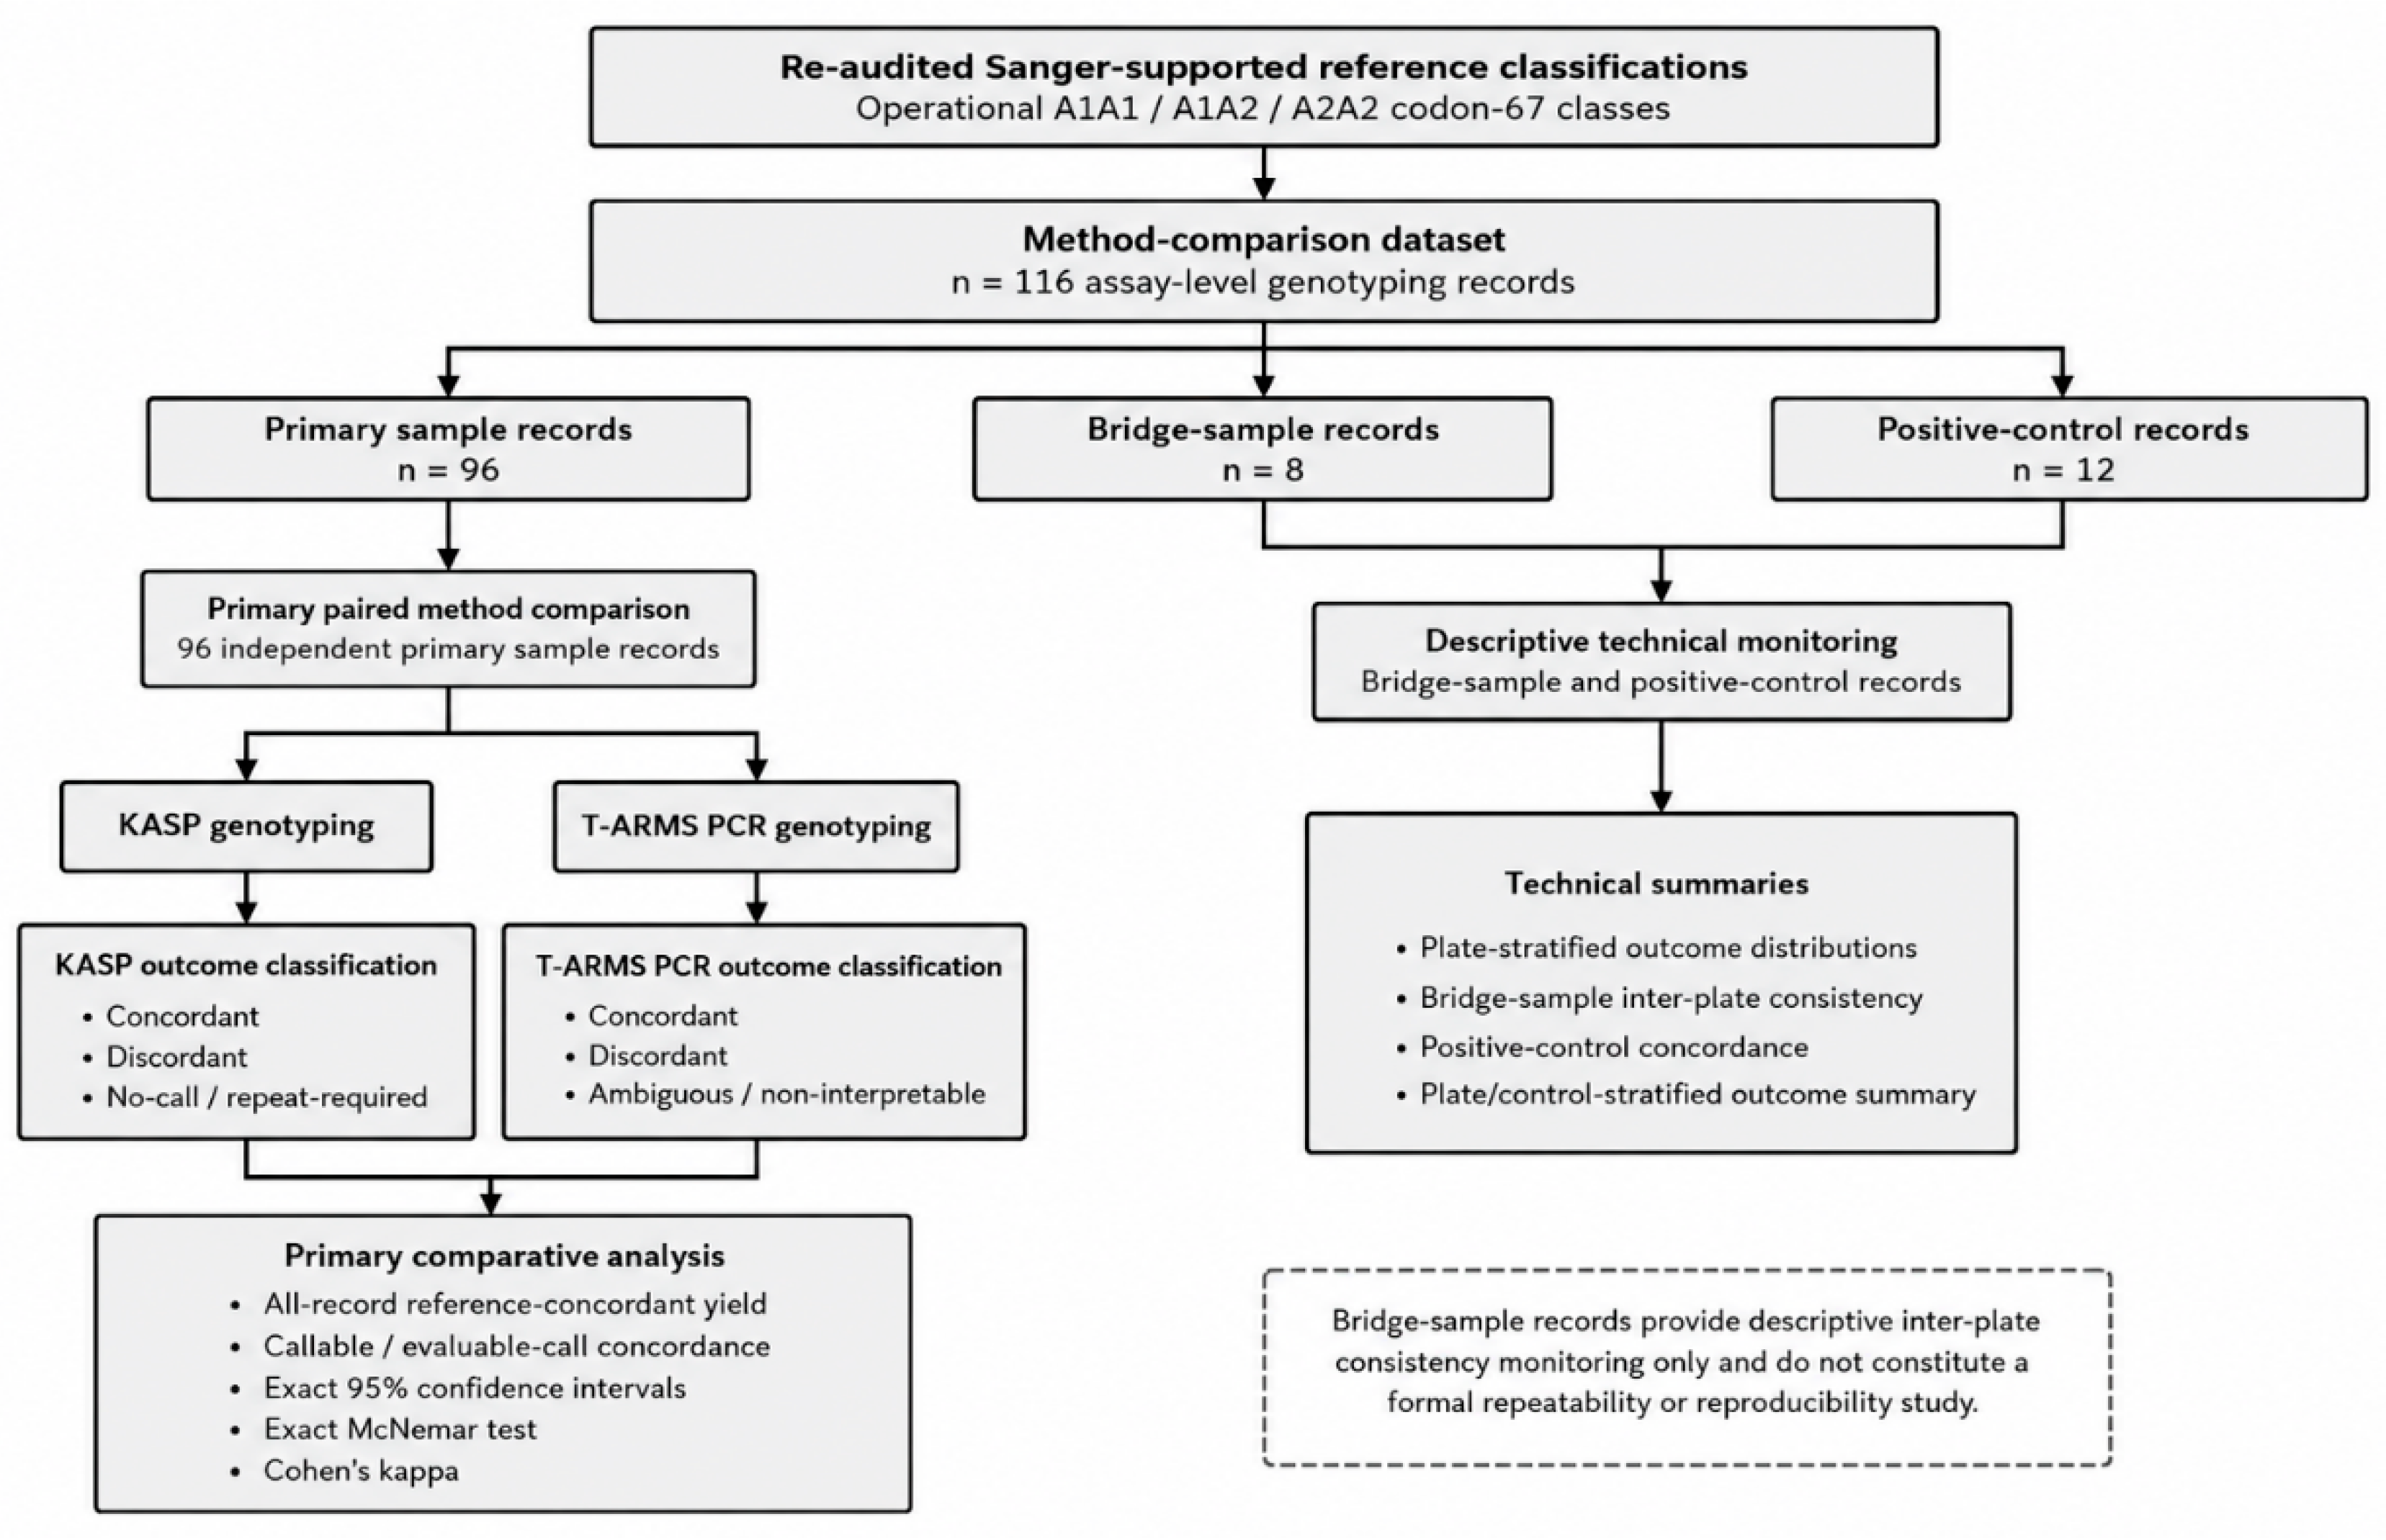

Disclaimer/Publisher’s Note: The statements, opinions and data contained in all publications are solely those of the individual author(s) and contributor(s) and not of MDPI and/or the editor(s). MDPI and/or the editor(s) disclaim responsibility for any injury to people or property resulting from any ideas, methods, instructions or products referred to in the content. |
© 2026 by the authors. Licensee MDPI, Basel, Switzerland. This article is an open access article distributed under the terms and conditions of the Creative Commons Attribution (CC BY) license.