


Abstract
Modeling milk yield in dairy cows is essential for improving management decisions, but traditional lactation curve models often fail to capture individual variability. Machine learning approaches offer greater flexibility; however, their performance in small, within-herd datasets and their reliance on explicit cow identification remain unclear, particularly in grazing systems. This study aimed to evaluate whether routinely measured biological traits can substitute for cow identification in machine learning models for predicting daily milk yield within a herd under limited data conditions. The dataset comprised 62 lactations from 48 Holstein–Friesian cows in a grazing system. Two machine learning models were developed: one including cow identification (With ID) and another excluding cow identification but incorporating milk quality traits, body weight, and body condition score (Without ID). Both models were compared with the Wood lactation model fitted to individual cows. The With ID and Without ID models achieved values of 0.97 and 0.93 and RMSE values of 1.2 and 1.6 , respectively. Both machine learning models outperformed the Wood model fitted individually to each cow ( < 0.90; RMSE > 2.03 ), which represents an implicitly cow-specific approach. The model including cow identification therefore served as a machine learning analogue to this benchmark. Importantly, the trait-based model closely matched the performance of the cow-specific model. These results demonstrate that machine learning models based on routinely measured traits provide a practical approach for predicting within-herd milk yield from small datasets, while retaining much of the accuracy of cow-specific models.
1. Introduction
Accurately characterizing the lactation curve in dairy cattle is essential to herd management and animal breeding, as it describes the pattern of milk production from calving to drying-off [1,2]. Such models make it possible to identify, even in early lactation, cows with superior milk yield potential [3]. However, not all dairy cow populations or production systems follow a typical lactation curve. The shape of the curve is determined by genetic, physiological, productive, and environmental factors, as well as their interactions [4]. For this reason, it is common to model the curve for each animal (or for homogeneous groups of animals) considering variables such as genotype, parity, or production system. In a second stage of modeling, these factors can then be statistically analyzed in terms of their effect on curve parameters [5].
Daily variation in milk production can be considerable, even in healthy cows, making future performance difficult to predict [6]. More complex lactation curve models offer greater flexibility as they can adapt to deviations caused by disease or management practices. However, they require large datasets for calibration, which limits their application in small herds [2]. In contrast, mathematical functions allow for a biological interpretation of the parameters of the lactation curve, although their predictive error may be high in heterogeneous animal groups [4].
The increasing availability of high-frequency milk records, collected daily or at each milking, has driven interest in more flexible and general linear functions, such as polynomials or splines; genetic evaluations based on test-day records have further emphasized the need for these adaptable modeling approaches [1,7]. However, the Wood function [8] remains widely used because it provides biologically meaningful parameters and reliably describes individual lactation curves. More recently, machine learning models have emerged as an alternative with strong predictive capacity, as they can incorporate multiple predictors and capture complex nonlinear relationships. Nevertheless, their application in dairy production is still limited by concerns regarding model interpretability and the difficulty of identifying the factors that explain their predictions [9].
In this study, a small dataset of grazing cows was used to evaluate machine learning models based on variables commonly available in farm records. Two modeling strategies were developed to predict daily milk yield under contrasting levels of data availability. The first approach relied on easily recorded management variables, including cow identification, parity number, and test day. The second excluded cow identification but incorporated milk quality traits, body weight, body condition score, and calf-related information. In the first scenario, the inclusion of cow identification allows the model to capture persistent individual-specific variation that is difficult to measure directly but inherent to each animal. In contrast, the second scenario relies on biological and management indicators shared across cows, although these variables may be less consistently available in routine farm records. Together, these approaches represent alternative predictive strategies adaptable to different recording conditions in grazing systems.
Although the models described above differ in the type of information used as predictors, most studies of lactation curves do not treat individual cow identification as a central component of the modeling objective. However, in the context of genetic selection, cow identification and pedigree information are essential because they allow records to be linked to individual animals, enabling the evaluation and prediction of their productive performance. Under these conditions, models developed from a specific population may provide accurate predictions within that population, although their applicability to other populations may be limited.
Accordingly, this study aimed to evaluate whether routinely measured biological traits can substitute for explicit cow identification in machine learning models for predicting daily milk yield within a grazing herd under limited data conditions. To address this, two modeling scenarios were compared: one including cow identification as a predictor and another based solely on biological and management variables. Model performance was evaluated against two benchmarks: a machine learning model including cow identification and the classical Wood lactation model fitted individually for each cow. Rather than forecasting future lactations, the focus was on assessing model behavior under realistic data availability constraints for within-herd applications.
We hypothesized that machine learning models achieve higher predictive accuracy than the Wood lactation model and that models based on biological traits provide predictions comparable to those obtained when cow identification is included.
Beyond model comparison, evaluating the contribution of different sources of information has practical implications for precision livestock management. Modern dairy systems increasingly rely on automated data collection through sensors and digital farm records, yet determining which variables provide the most useful information for prediction remains a key challenge. Some predictors, such as individual animal identification, are readily available and capture persistent differences among cows but restrict model applicability to the observed population. Other predictors, including milk composition traits, body weight, or body condition score, may provide biologically meaningful indicators that are transferable across animals, although their measurement may involve analytical costs, additional animal handling, or specialized equipment. Therefore, comparing models that rely on these alternative sources of information provides insights into the trade-offs among data availability, measurement cost, and predictive performance and helps identify practical strategies for implementing predictive tools in dairy production systems.
2. Materials and Methods
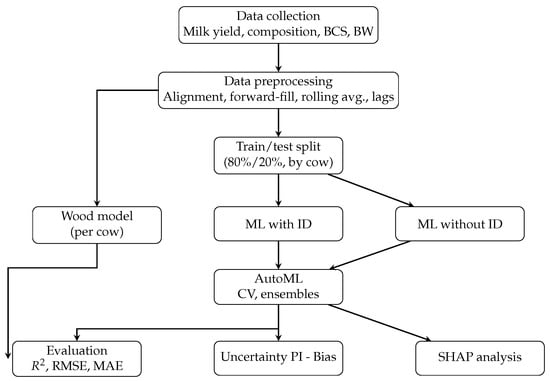
Three complementary modeling approaches were compared to evaluate whether biological traits can substitute for cow identification in predicting daily milk yield (Figure 1). A machine learning model including cow identification (With ID) was used as an explicit cow-specific benchmark. A second machine learning model excluding cow identification but incorporating biological and management traits (Without ID) was used to test whether these variables can capture individual variation. Finally, the Wood lactation model was fitted separately for each cow, representing a classical implicitly cow-specific approach. This design allows comparison between explicitly cow-specific, implicitly cow-specific, and trait-based models under the same dataset.
Figure 1.
Simplified workflow of data processing and modeling approaches used to predict milk yield. ML with ID and ML without ID denote machine learning models with and without cow identification. Abbreviations: ML, machine learning; BCS, body condition score; BW, body weight; CV, cross-validation; PI, prediction interval; SHAP, SHapley Additive exPlanations; RMSE, root mean square error; MAE, mean absolute error; , coefficient of determination.
2.1. Study Site and Animal Management
The animals belonged to Centro de Enseñanza, Investigación y Extensión en Producción Animal en Altiplano, Facultad de Medicina Veterinaria y Zootecnia, Universidad Nacional Autónoma de México, located at 20°36′13.88″ N, 99°55′ 02.91″ W, at an altitude of 1913 m above sea level. The region is characterized by an extreme arid climate of the Ganges type without midsummer drought, classified as BS10w(e)g according to climatological records from station 22025 of the Mexican National Meteorological Service. The average annual rainfall is 458 mm, and the mean annual temperature is 23.5 °C. Frosts occur from October to February, summers are hot, and winters are mild. The production system is non-seasonal and adjusted to market demand; cows calve throughout the year without synchronization or seasonal breeding strategies.
Cows were managed under a rotational strip-grazing system using movable electric fencing, and all animals in the herd grazed as a single group, including those selected for this study. Cows grazed continuously throughout the day and left the paddock only twice daily (about 110 min) for milking in a 16-stand AutoRotor (GEA Westfalia, Germany). Pastures were irrigated by sprinkler and consisted of a grass–legume mixture, where alfalfa (Medicago sativa) predominated throughout the study period, though the grass component also included Dactylis glomerata, Lolium multiflorum, Festuca arundinacea, and Bromus inermis; over time, the contribution of these grasses to the botanical composition declined, resulting in alfalfa dominating the forage mass. Pre- and post-grazing dry matter (DM) averaged 1736 and 1400 kg DM ha−1, respectively, across the three years of the study. The average rotation length was 32 days, with a mean paddock occupation period of 3 days. Stocking rates were 3.7, 3.1, and 2.7 cows ha−1 in 2009, 2010, and 2011, respectively. The average chemical composition of the pasture consumed by the cows throughout the study period was as follows: metabolizable energy, 11.0 MJ kg−1 DM; crude protein, 22.07%; in vitro dry matter digestibility, 67.03%; dry matter content, 23.49%; neutral detergent fiber, 45.89%; and ash, 3.23%.
In addition to grazing, cows received daily supplementation consisting of 1.8 kg DM of commercial concentrate and/or rolled corn grain and 1.6 kg DM of hay (pasture residual forage), calculated per cow per day. Mineral salts and water were provided ad libitum. To prevent bloating, particularly during high-risk periods, each cow received 1 g of polysiloxane orally prior to grazing. Furthermore, an anti-bloating product (Bloat Tenz®, Ecolab ETD, Hamilton, New Zealand), composed of ethoxylated and propoxylated alcohols that function as non-ionic surfactants, was administered in the drinking water at a dose of 1 L of active ingredient per 1000 L of water. With these preventive measures, no cases of bloating or mortality attributable to bloating were recorded during the study period.
Cows were selected according to strict inclusion criteria. Only pure New Zealand- genotype Holstein–Friesian cows were considered, and only complete lactation periods were included in the analysis (mean lactation length: 346 days). Each cow was required to have at least 70 milk yield records during lactation. A total of 62 lactations from 48 Holstein–Friesian cows were included in the study, with an average of 85.04 records per lactation (rounded to 85), resulting in 5225 milk yield records in the final dataset. The animals included in the study had no recorded cases of major clinical diseases (e.g., metritis, dystocia, lameness or pneumonia) during the evaluated lactation periods, based on routine farm health records, and were confirmed pregnant for the subsequent lactation. It should be noted that this criterion refers to the absence of clinically diagnosed diseases and does not exclude the presence of subclinical conditions, such as variations in somatic cell count (Table 1). The mean body weight of the cows was kg. The mean days open was 128 days, and the average calving interval was 13.4 months. The dry period averaged days, days to first service were days, and services per conception averaged . The average milk yield was kg , with a lactation length of days, lactations per cow, and an average calf birth weight of kg.
Table 1.
Descriptive statistics (means ± standard deviations) of numerical variables for the herd and by parity.
2.2. Variables
The response variable was milk yield (kg ), which was recorded every four days using DairyPlan (GEA, Westfalia, Germany). Milk protein yield, fat yield, and somatic cell count were measured every 16 days using standard analytical equipment (Milkoscan, FOSS, Hillerød, Denmark). At the same 16-day intervals, body weight (BW; kg) was recorded using an electronic scale in a handling chute, and body condition score (BCS) was assessed. Body condition score was evaluated on a 1–10 scale commonly used in pasture-based dairy systems, as in New Zealand. This scale is directly equivalent to the 1–5 system used in North America, but provides greater descriptive resolution for grazing management decisions.
These sampling frequencies were determined by the operational conditions of the commercial production system, including equipment availability, labor and scheduling constraints, budget limitations, and the need to minimize repeated animal handling. Because some predictor variables were measured less frequently than milk yield, they were temporally aligned with yield records by carrying forward the most recent available observation until the next measurement.
2.2.1. Model Including Cow Identification (With ID)
In this model, the predictor variables were parity number, cow identification, and test day; the first two were treated as categorical variables. Cow identification was encoded using a random three-letter code to avoid potential spurious effects in the model. This configuration represents an explicit cow-specific modeling approach and serves as a machine learning benchmark.
2.2.2. Model Excluding Cow Identification (Without ID)
In this model, the predictor variables included parity number, test day, milk protein and fat yield (g ), somatic cell count, live weight (kg), and body condition score (BCS, scale 1–10). Calf-related traits were also considered, including sex, birth weight (kg), and the sire used at the time of effective service. This configuration was used to evaluate whether routinely measured biological traits can replace cow identification in capturing individual variation in milk yield.
To account for the temporal structure of the dataset, lagged variables (e.g., previous-day or previous-week measurements) were included to capture short-term dependencies, recognizing that current responses are often influenced by recent states. Because several predictors (milk composition traits, BCS, and BW) were measured at longer intervals than milk yield, these variables were temporally aligned with yield observations using forward-filling, whereby the most recent available measurement was carried forward until the next observation. Rolling averages over predefined windows were then calculated to smooth short-term variability and reflect gradual biological trends. Together, these transformations enabled the model to better represent both the reliability of measurements and the dynamic processes underlying animal performance. Depending on the variable, between 69% and 70% of the values were imputed. Although this may appear to be a large proportion, it was not a concern because the “missing” entries resulted from differences in sampling frequency rather than data loss.
With forward-filling, we replaced missing values (NA) with the most recent non-missing observation. For a variable at time t,
where is the original value at time t and is the forward-filled value. With rolling averages, we smoothed short-term fluctuations by taking the mean over a fixed window size:
where is the rolling average calculated from the forward-filled series and w is the window size (). With lags, we captured past values of a time series as new predictors for lag k:
where represents the value of the forward-filled series at lag k ().
Flags and lagged flags are binary indicators showing whether a variable was actually observed or was estimated; these flags were used as a proxy of data availability:
2.3. Statistical Analysis
2.3.1. AutoML Framework
Modeling was conducted in R (Vienna, Austgria) using the H2O package (H2O.ai Inc., Mountain View, CA, USA) [10]. AutoML was selected to enable the systematic and reproducible exploration of multiple algorithmic families under a unified validation protocol. To address this objective, machine learning models were trained under two feature configurations: one incorporating cow identification and another relying solely on routinely measured biological traits. Because the goal was predictive optimization rather than a formal comparison of algorithmic classes, diverse learners were evaluated within a common resampling framework, allowing the data to determine the most suitable modeling approach for each feature configuration.
The AutoML procedure automatically trained and evaluated multiple algorithms, including deep learning (DL), feedforward neural network (NN), generalized linear model (GLM), gradient boosting machine (GBM), extreme gradient boosting (XGBoost), distributed random forest (DRF), and extremely randomized tree (XRT), following the implementations described in the H2O documentation and associated methodological references. For each algorithm, AutoML explored hyperparameters through randomized grid search within predefined search spaces. This approach sampled combinations of influential hyperparameters (e.g., tree depth, learning rate, number of trees, and subsampling rates in boosting models; variable sampling and tree count in random forests; network architecture and regularization in neural networks) without exhaustively enumerating all combinations, thereby balancing computational efficiency with effective coverage of the parameter space.
In addition to individual base learners, AutoML automatically constructed stacked ensemble models using out-of-fold predictions from cross-validated base models. A metalearner (typically a regularized GLM) is trained to optimally combine these predictions, allowing the ensemble to weight constituent models according to their predictive contribution. This stacking strategy often improves generalization performance by integrating complementary linear and nonlinear representations. Because two alternative feature sets were evaluated, the optimal predictive model was not assumed to belong to a specific algorithmic family. Instead, the AutoML framework allowed the best-performing learner, whether a single model or stacked ensemble, to emerge independently for each feature configuration under the same deviance-based optimization criterion. Thus, the modeling strategy emphasizes predictive performance and likelihood-consistent evaluation rather than algorithmic preference.
The number of instances used for this study was considered small, especially for machine learning models. Data augmentation was not used because we wanted to preserve the individual information of each of the cows. Because of this, we relied on ensemble methods. The core reasoning behind ensemble methods is that several weak learners, i.e., small classifiers, work together to compensate for the shortcomings of a strong learner, i.e., a single, more powerful, standalone classifier [11]. One of the advantages of ensemble methods is their resilience to overfitting, which is a common problem with small datasets. Therefore, ensemble approaches are commonly used to work with small datasets across a variety of fields, such as geotechnical engineering [12], civil engineering [13], and health assessment [14].
Tree-based machine learning algorithms, such as gradient boosting and random forests, can naturally handle categorical predictors with multiple levels without requiring explicit encoding. Moreover, when using H2O AutoML, categorical encoding, missing value imputation, and normalization for models that require it (e.g., GLMs or deep learning models) are performed automatically, so minimal manual preprocessing is needed. Multicollinearity was not expected to substantially affect the models because tree-based machine learning algorithms are generally robust to correlated predictors.
2.3.2. Model Training
Models were trained with 80% of the data, reserving 20% for testing (Table 1). To mitigate the risk of data leakage, the modeling strategy was designed to respect the temporal and individual structure of the dataset. First, training and test sets were split at the cow level, ensuring that no records from the same cow appeared simultaneously in both sets. This prevents the model from implicitly memorizing cow-specific patterns that would artificially inflate predictive performance. In addition, lagged variables and rolling averages were constructed exclusively from past observations within each cow’s time series (Table 2), thereby avoiding the introduction of information from future states. Forward-filled sparse measurements (e.g., body weight, body condition score, and fat and protein yields) were carefully flagged to indicate imputed rather than directly observed values, allowing the model to distinguish between true data and propagated estimates. Together, these measures guaranteed that the model predictions were based only on information that would be available in a real-world forecasting scenario.
Table 2.
Transformed variables derived from the original variables in the training dataset. For numerical variables, we report mean () and standard deviation (s); for binary variables, we report the proportion of ones .
Model training incorporated internal cross-validation, and the early stopping criterion was based on mean residual deviance, which was also used for leaderboard ranking. Mean residual deviance represents the likelihood-based generalization of residual error and provides a coherent objective function across regression models. Monitoring cross-validated deviance during training allowed for the termination of unpromising hyperparameter configurations and reduced overfitting risk. The top-performing model, the “leader”, was subsequently evaluated on independent test data.
2.3.3. Model Testing
Final model performance was evaluated using the 20% independent test dataset. Predictive accuracy was summarized using the coefficient of determination (R2), root mean square error (RMSE; kg ), and mean absolute error (MAE; kg ). RMSE and MAE express prediction error in the same units as the response variable, facilitating practical interpretation, while R2 quantifies the proportion of variance in observed values explained by the model. Agreement and potential systematic bias between predicted and observed values were further assessed using the Bland–Altman method [15], implemented with the blandr package.
Prediction uncertainty was quantified using a cluster bootstrap procedure at the cow level (38 independent cows and 500 resamples). For each resample, cows from the training set were sampled with replacement, and the models were refitted using the best algorithm in the leaderboard of the models trained in the AutoML process. Predictions were generated for the independent test set. Empirical 95% prediction intervals were derived from the 2.5th and 97.5th percentiles of the bootstrap prediction distribution. Coverage probability and mean prediction interval width were calculated. This approach allowed us to decompose total predictive variance into two components: model instability (i.e., variability in predictions across bootstrap refits) and residual variance (i.e., irreducible error not explained by the model).
The h2o.explain function was applied to obtain SHAP (SHapley Additive exPlanations) values, which describe both the effect of each variable on individual predictions and the average importance of variables in the overall model behavior [16].
2.4. Wood Model
The lactation curve was also modeled using the Wood function [8], shown in Equation (5). This parametric model describes milk yield as a function of time since calving by using three parameters that characterize the shape of the lactation curve.
where is the milk yield of cow i at test day t; a, b, and c are parameters describing the scale, ascending phase, and rate of decline of the lactation curve; and e is the base of the natural logarithm.
Model parameters were estimated using nonlinear least squares implemented in the minpack.lm package. The Wood model was fitted separately for each cow, thereby representing an implicitly cow-specific approach in which individual differences are captured through separate model estimation rather than explicit use of cow identification as a predictor. Predictions obtained from the individual curves were then pooled by parity to evaluate model performance at the parity level.
Goodness of fit was evaluated using , RMSE, MAE, and prediction bias calculated from the relationship between observed and predicted milk yield. For the Wood models, all available records were used for parameter estimation and no data were reserved for independent testing. This approach reflects the traditional application of the Wood model as a descriptive, cow-specific benchmark rather than a predictive model intended for generalization.
2.5. Computing Setup
Model implementation was carried out on an Ubuntu 22.04.5 LTS (Canonical Ltd., London, UK) system using Docker 28.3.2 (Docker Inc., Palo Alto, CA, USA) with the rocker/geospatial image (https://hub.docker.com/r/rocker/geospatial, accessed on 6 May 2025) implementing R, version 4.5.1, and the H2O package, version h2o-3.46.0.7. The H2O environment was configured with max_mem_size = 100 G, nthreads = 50, max_runtime_secs = 300, and nfolds = 4, as well as a fixed random seed to ensure reproducibility. The computing node was equipped with two Xeon E5-2680 v4 CPUs, 512 GB of RAM, and two NVIDIA A4000 GPUs with 16 GB of VRAM each.
3. Results
3.1. Machine Learning Models
The AutoML procedure generated 107 candidate models for the With ID approach and 148 candidate models for the Without ID approach. The top-performing models identified in each scenario are summarized in Table 3. Overall, models that included cow identification (With ID) achieved consistently better predictive accuracy than those that excluded this information (Without ID). The best-performing models in the With ID approach were stacked ensemble models, which obtained the lowest prediction errors, with RMSE values around 1.077, MAE values close to 0.799, and mean residual deviance of approximately 1.159. In contrast, the best models in the Without ID approach were primarily based on XGBoost and GBM algorithms, but they showed higher error values, with RMSE ranging from about 1.688 to 1.740, MAE from 1.175 to 1.216, and deviance values between 2.849 and 3.029. These results indicate that incorporating cow identification improved the model’s ability to capture individual variation in milk yield, leading to lower prediction errors. Among the evaluated metrics, RMSE and MAE provide complementary measures of prediction accuracy, with RMSE giving greater weight to larger errors and MAE reflecting the average magnitude of prediction deviations. The consistently lower values for these metrics in the With ID models suggest that this approach provides a reliable benchmark for precise milk yield prediction when using relatively small datasets.
Table 3.
Performance metrics of the top ten AutoML models With ID and Without ID for predicting milk yield of grazing cows.
3.2. Variable Importance
The order of variable importance for the leader model in the With ID configuration was test day, cow identification, and number of lactation periods (Table 4). In contrast, for the leader model in the Without ID configuration, the most influential variables were related to protein and fat contents, along with test day.
Table 4.
Variable relative importance and performance metrics of the best models from each modeling configuration (Table 3): (1) an ensemble model including cow identification, number of lactation periods, and test day as predictors (With ID) and (2) an XGBoost model using milk composition and body condition as predictors while excluding cow identification (Without ID). Only the most influential variables are shown (relative importance > 0.0009); variables with lower importance values are omitted.
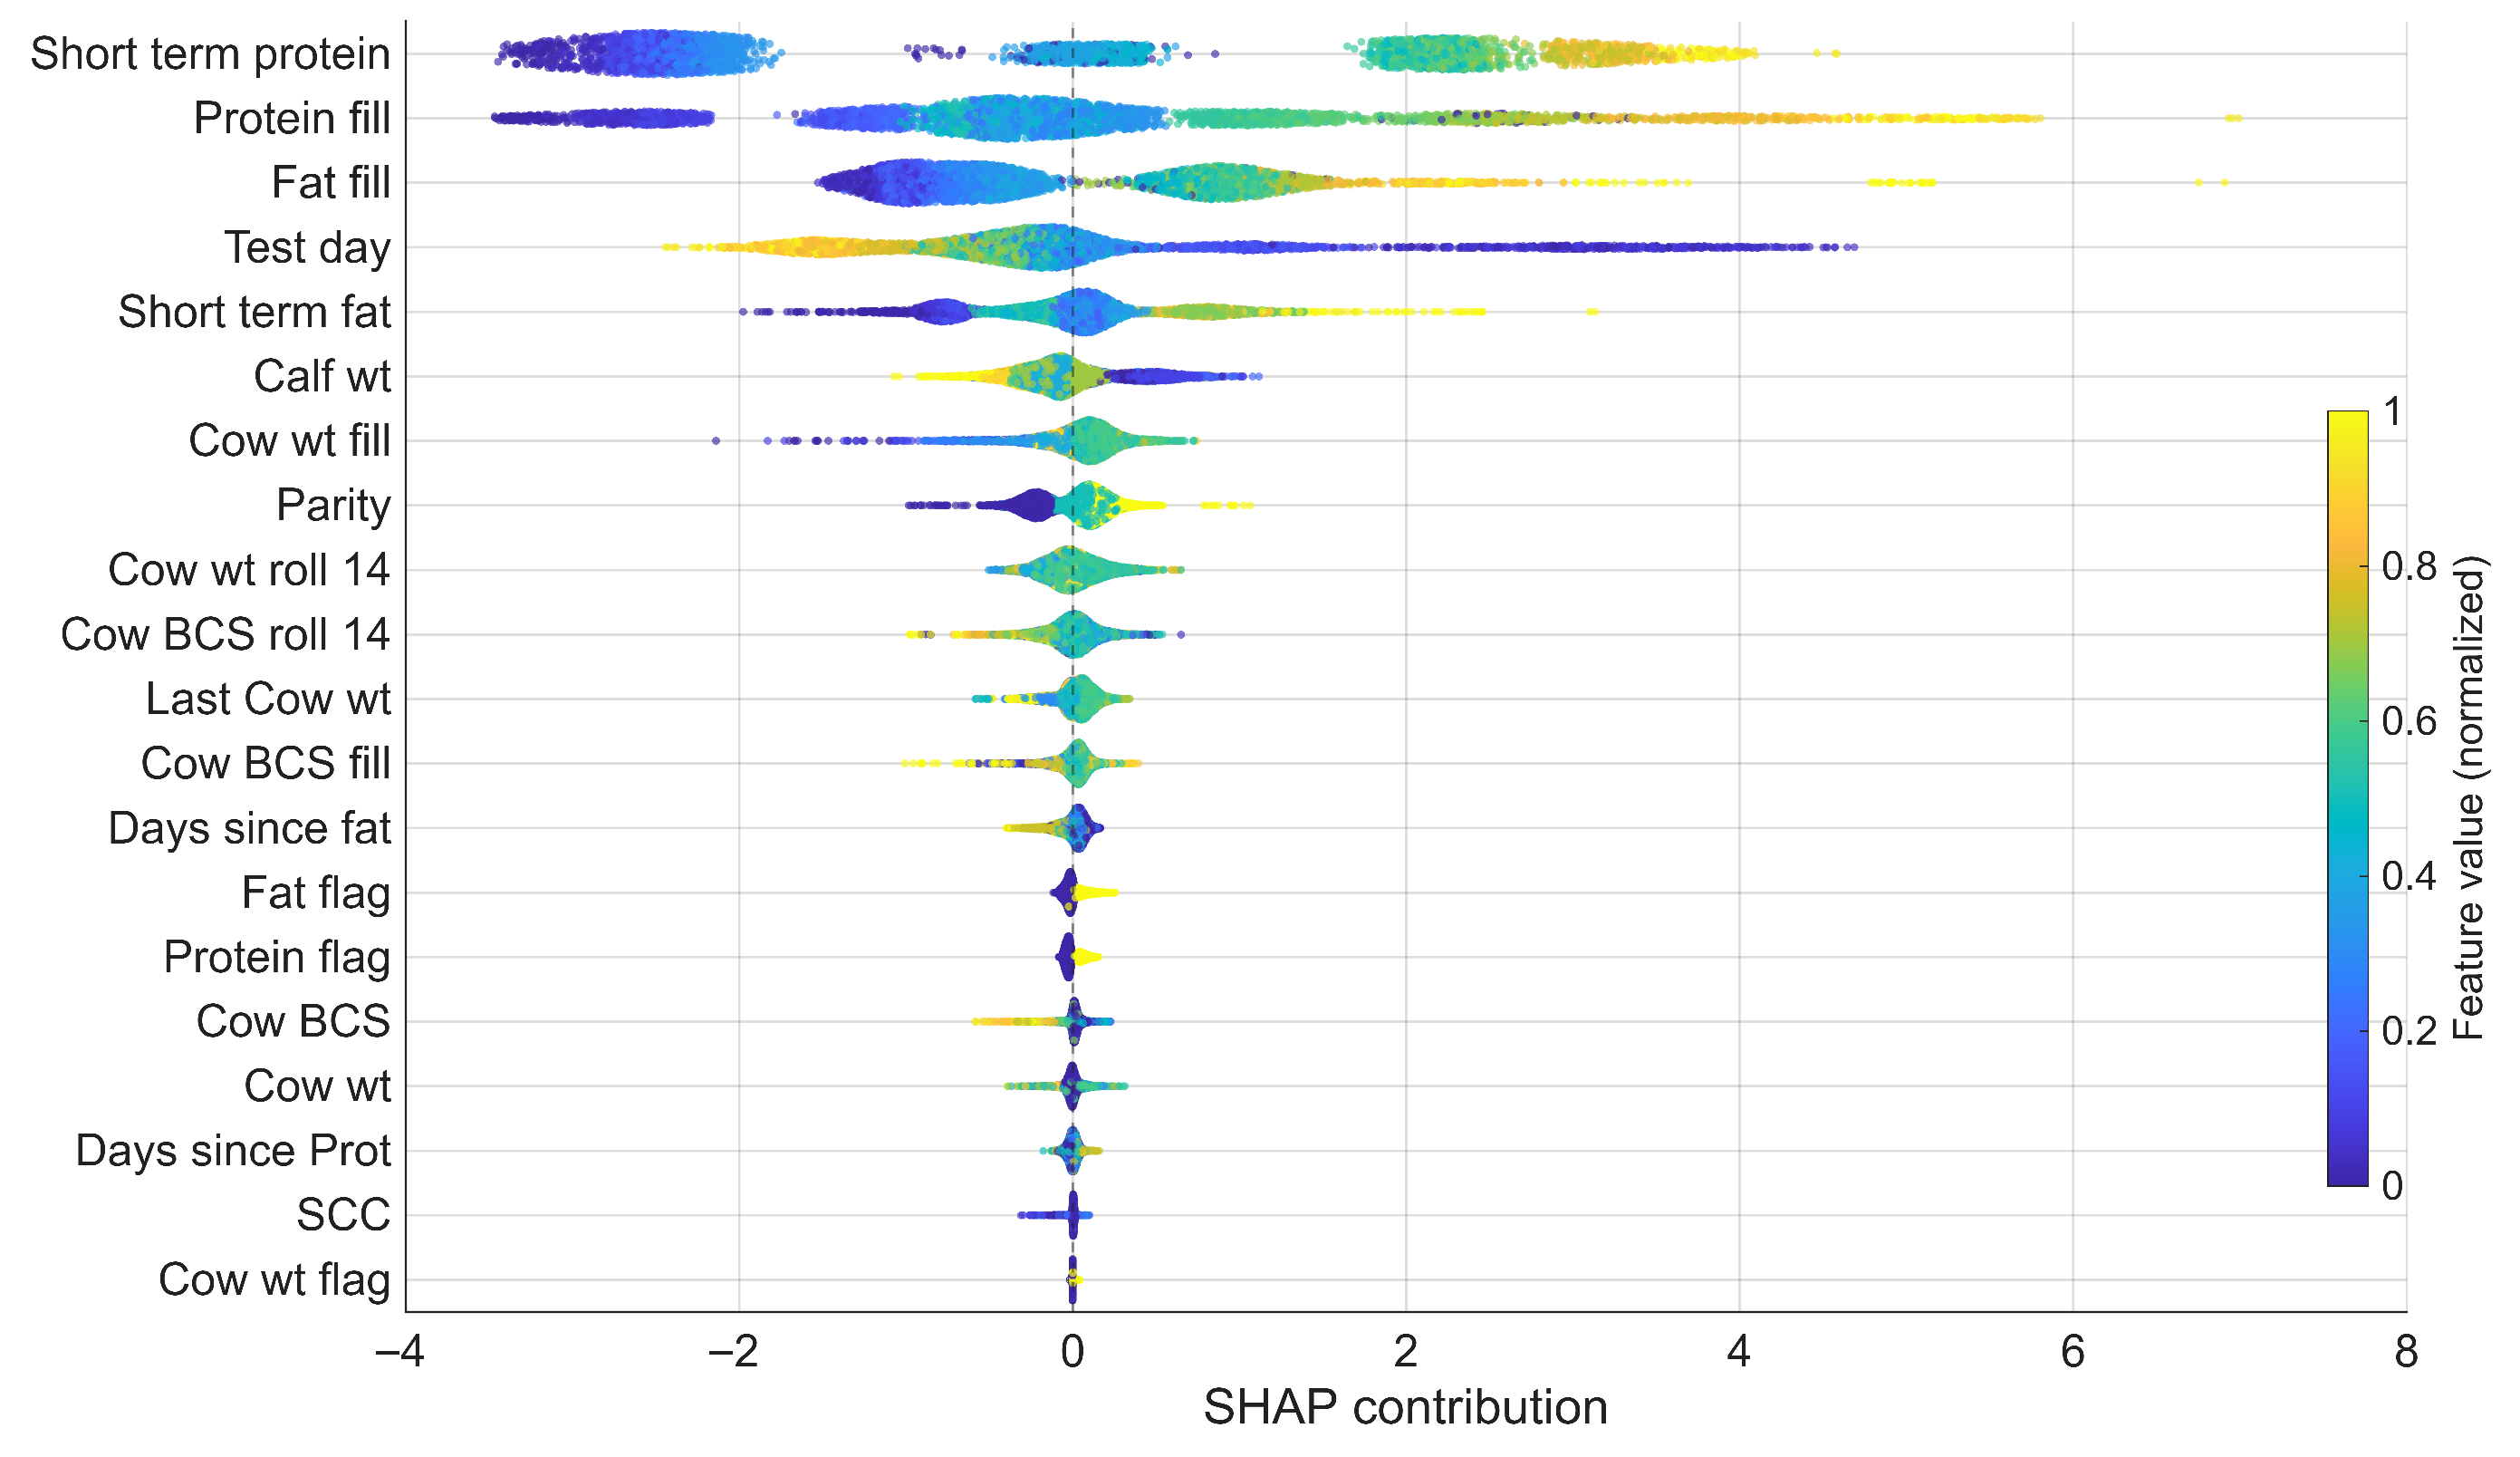
The variable importance values shown in Table 4, as well as those presented in the SHAP plots, correspond to the leader models for each modeling configuration and the engineered variables described in the Methods Section. Specifically, variables labeled “fill” represent forward-filled values used to maintain temporal continuity when measurements were missing, short-term variables represent short-rolling window summaries capturing recent trends, and roll variables correspond to longer rolling averages that smooth short-term fluctuations.
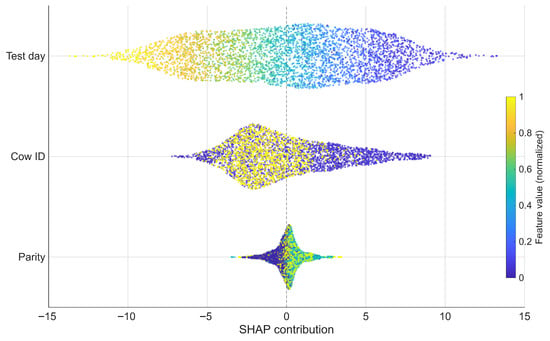
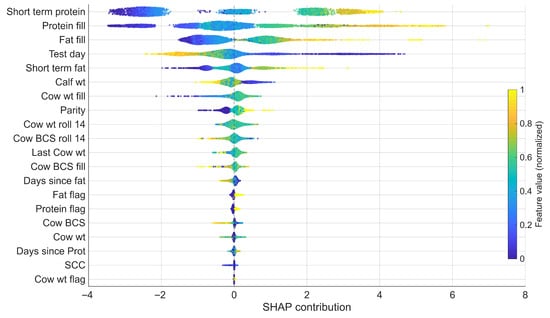
Figure 2 and Figure 3 show the SHAP plots for the best individual models in the With ID and Without ID configurations. For the With ID case, SHAP contributions are presented for the best individual model (GBM), as variable importance cannot be directly computed for ensembles. The SHAP plots give an impression of the importance of variables in the modeling approaches examined. The SHAP plot (Figure 2) for the GBM With ID model showed a positive contribution (blue shading) to milk yield when the normalized value of test day was low and a decrease in its contribution as the value increased (reddish shading). First-lactation cows exhibited SHAP values with negative contributions to milk yield (blue), whereas multiparous cows showed positive contributions. In the Without ID model, the filled values of milk protein and fat had the greatest contribution to milk yield according to their SHAP values, followed by test day, with a combined importance of 0.947, while the other variables contributed only marginally. In the XGBoost individual model shown in Figure 3, calf birth weight had a negative influence on milk yield, and its importance was on par with that of parity number.
Figure 2.
SHAP contributions (swarm) for the best-performing, individual With ID model, a GBM model ranked fourth on the leaderboard. Each point represents an observation, positioned along the x-axis according to its SHAP value, which indicates the contribution of that feature to the model prediction relative to the baseline. Features are ordered by overall importance based on the mean absolute SHAP value. Point color represents the normalized value of the feature (blue = low values and yellow = high values), allowing for the visualization of how feature magnitude influences the direction and magnitude of its contribution to the prediction of milk yield.
Figure 3.
SHAP summary (swarm) plot of the Without ID XGBoost model showing the contribution of each predictor to milk yield prediction. Plot interpretation is as in Figure 2.
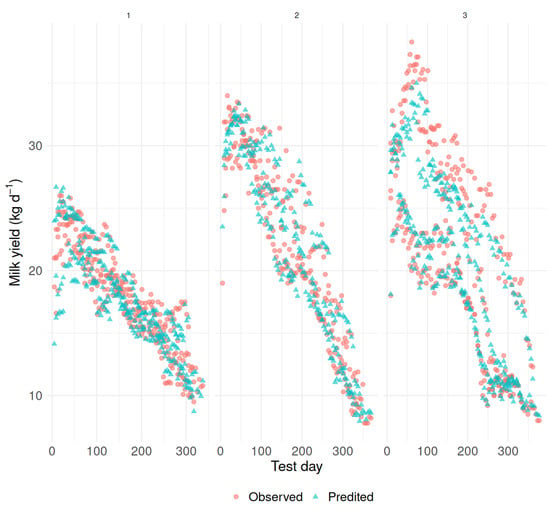
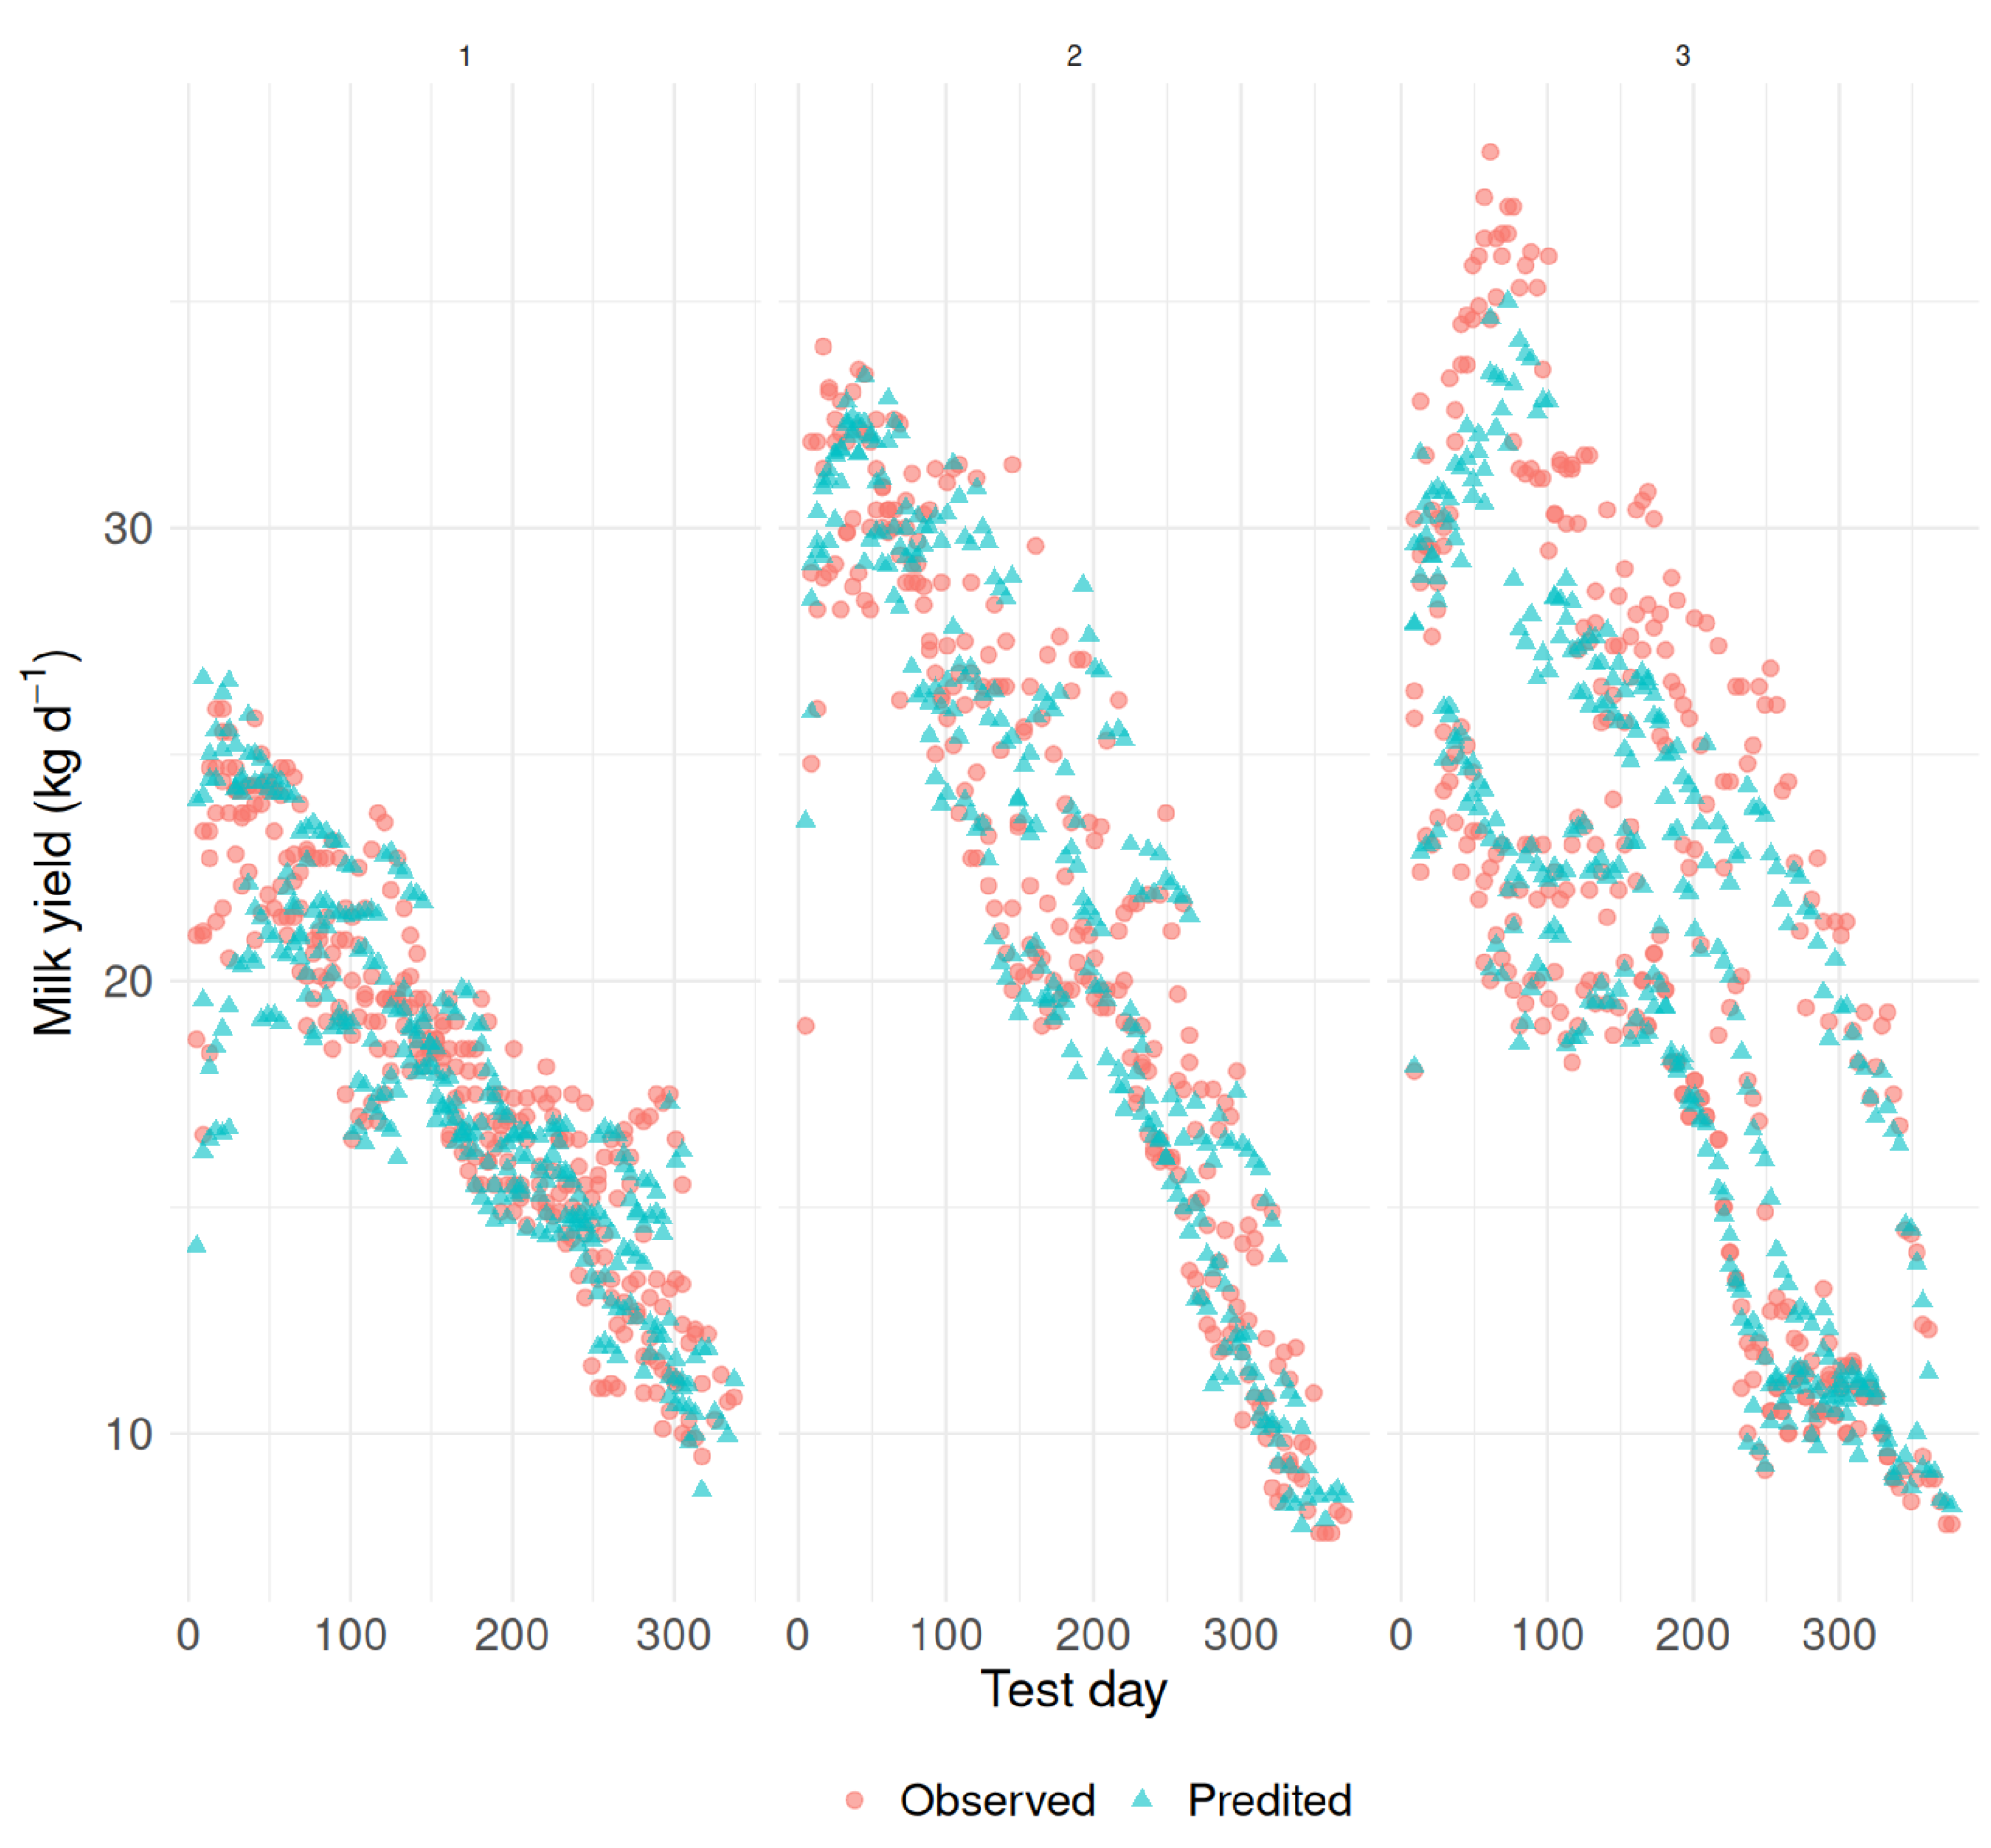
Although the Without ID model achieved a relatively high , the RMSE remained higher than desirable. The inspection of predicted and observed milk yield across parities (Figure 4) suggests that this may partly reflect greater between-cow variation in multiparous animals, particularly among third-parity cows. While the model captured the overall lactation trajectory across parities, including the early lactation peak followed by a gradual decline, the dispersion of observations around predictions was wider in second- and third-parity cows. These groups also showed higher peak milk yield and lower persistence than first-parity cows. In contrast, first-parity cows exhibited lower milk yield and less between-cow variability, resulting in predictions that appeared more tightly clustered around the observed values.
Figure 4.
Breakdown by parity number of observed and predicted milk yield during the lactation period according to the Without ID model.
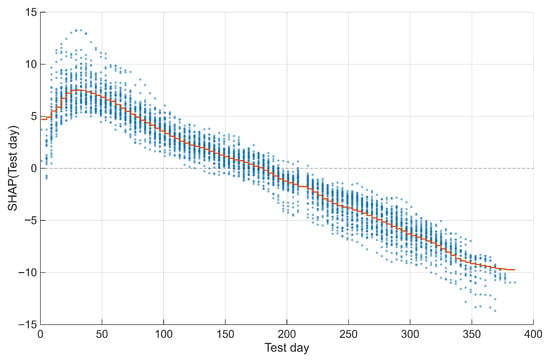
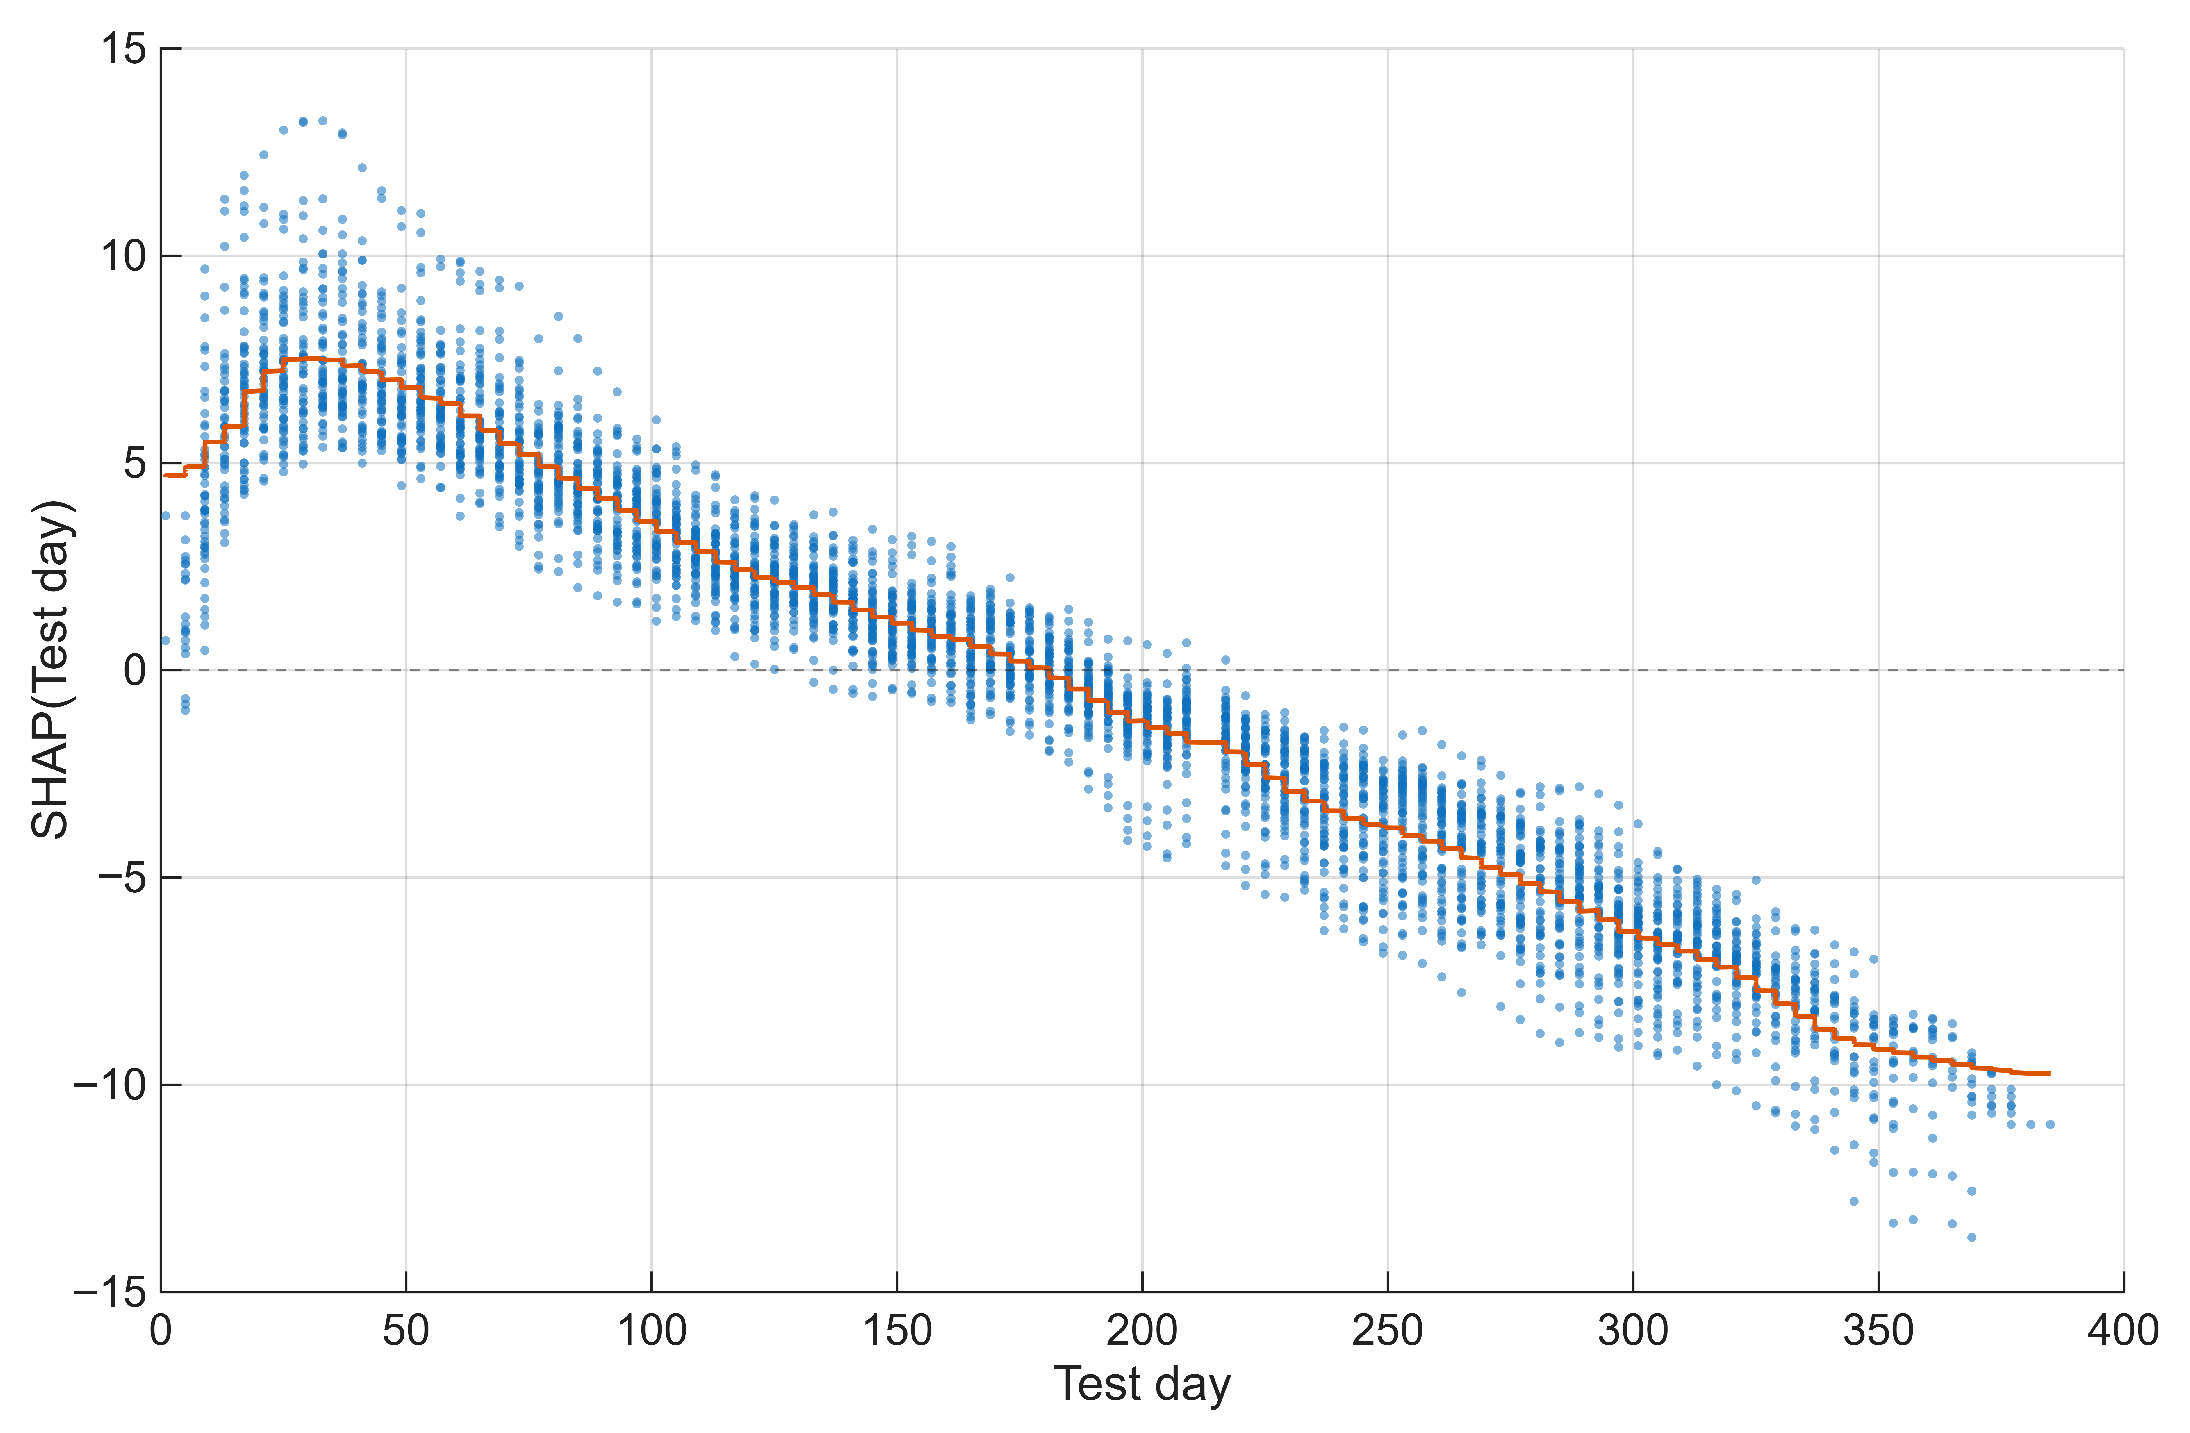
Although parity was not an important predictor in the Without ID model, stratifying predictions by parity revealed differences in the dispersion of observations across lactation groups. This pattern likely reflected the greater biological variability typically observed in multiparous cows, which tend to exhibit higher peak milk yield and persistence. Because the Without ID model did not include cow ID, part of the between-cow heterogeneity was expressed as increased scatter around predictions, particularly later in lactation. In contrast, the partial dependence of milk yield on test day obtained from the With ID model (Figure 5) shows a more uniform temporal pattern. Test day was the most influential predictor in this model, followed by cow identity and parity (Table 4), indicating that the model captured the overall lactation trajectory primarily through the temporal structure, while cow-specific differences were absorbed by the identity effect.
Figure 5.
SHAP dependence plot illustrating the marginal effect of test day on predicted milk yield in the With ID model. Each point represents an observation, and the orange line indicates the average partial dependence of test day on model prediction. Positive SHAP values correspond to higher predicted milk yield relative to the model baseline, whereas negative values indicate lower predicted values. This dependence reflects the average effect of test day on predictions when the influence of the other model features is accounted for.
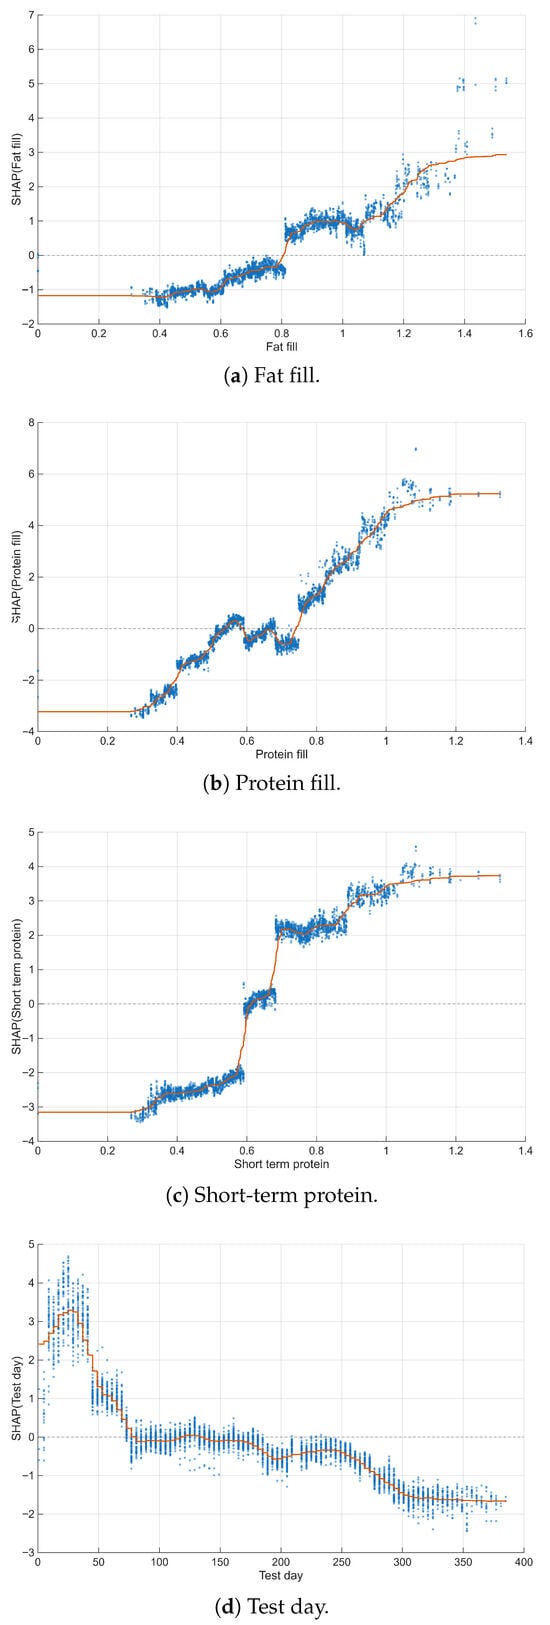
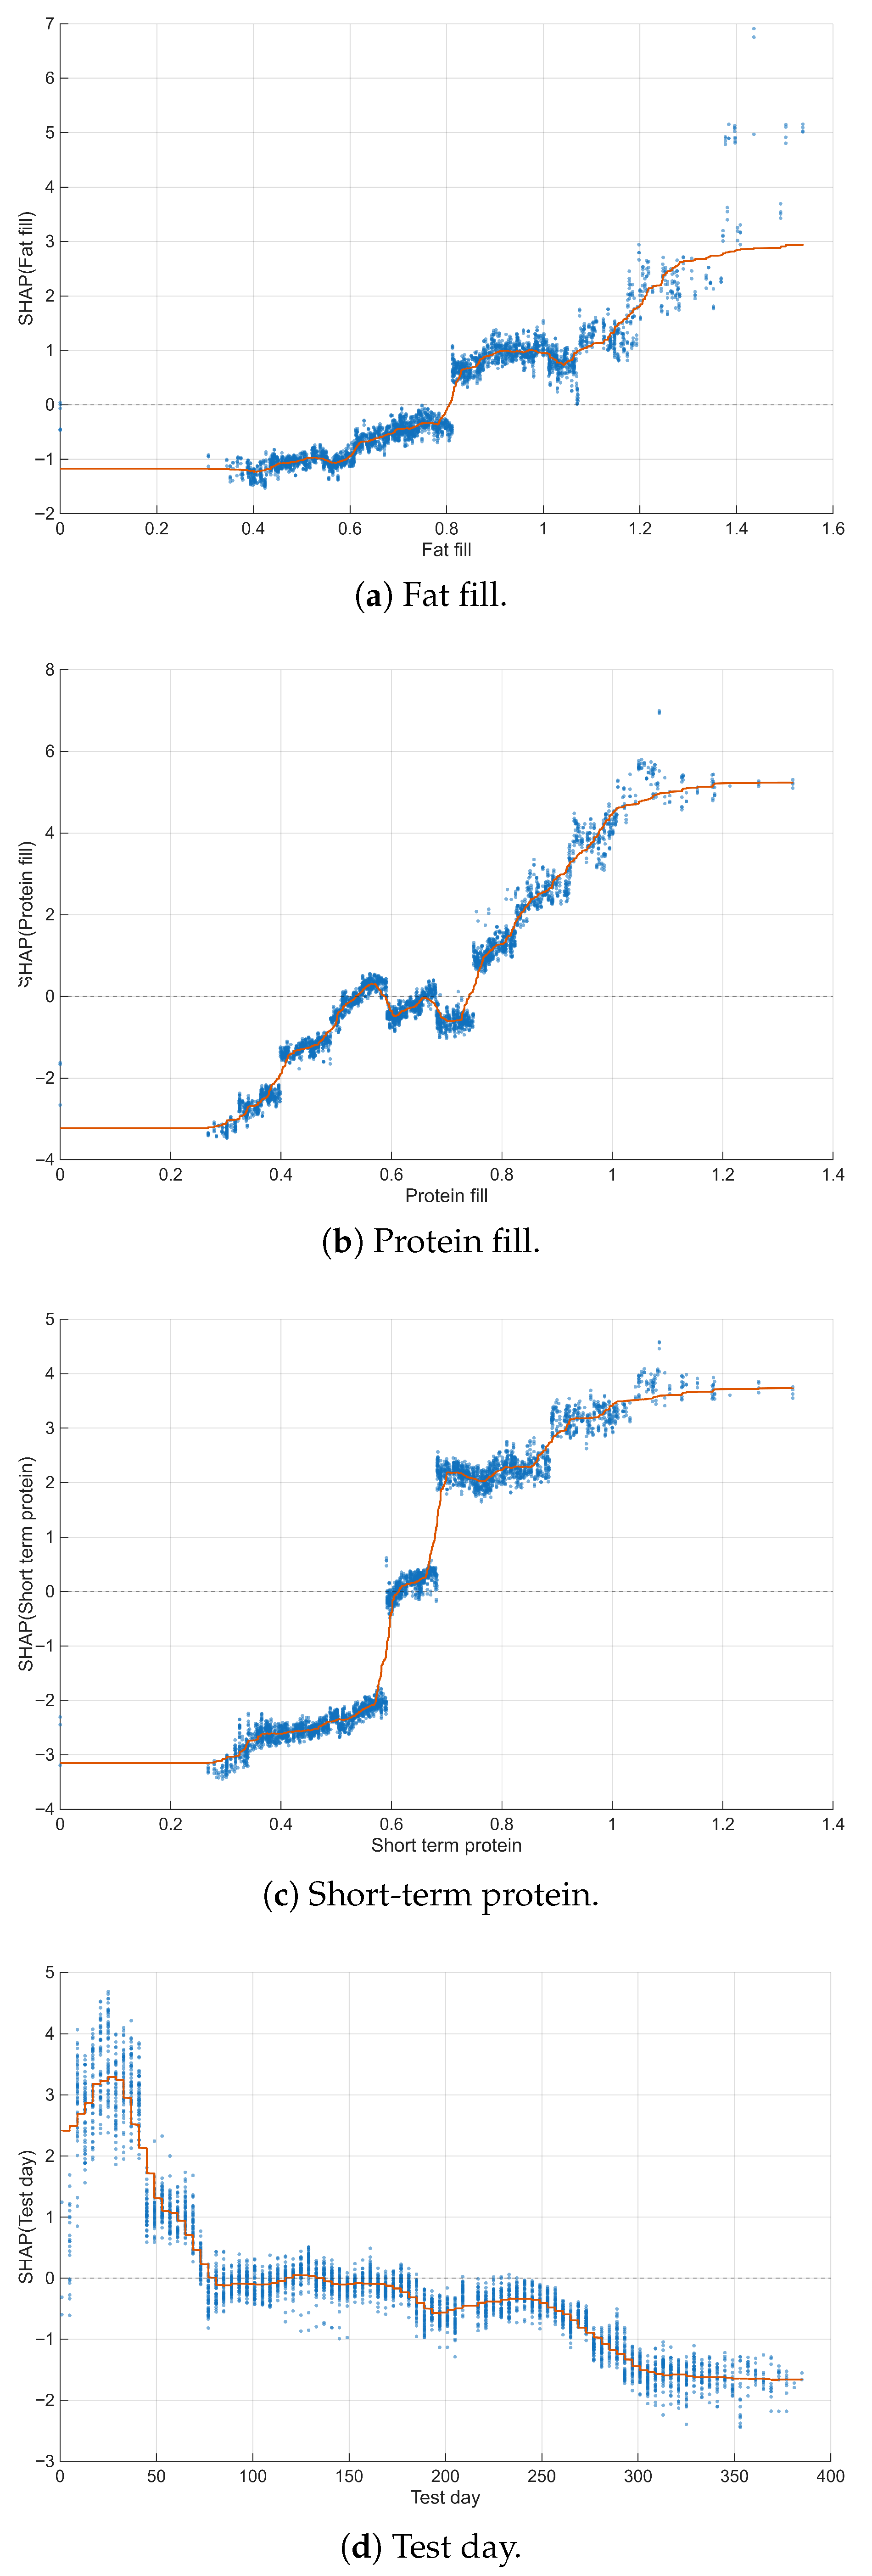
Figure 6 presents SHAP dependence plots illustrating the marginal effect of selected predictors on the predicted milk yield in the Without ID model. Forward-filled fat and protein variables show clear positive relationships with predicted milk yield. For both fat fill and protein fill, low values were associated with negative SHAP values, indicating a reduction in predicted milk yield relative to the model baseline. As the values increased, the contribution became positive and gradually leveled off, suggesting diminishing marginal effects at higher levels. These variables represented the most recent available milk composition measurements, as fat and protein were recorded every 15 days and missing values were replaced using forward-filling. The lagged short-term protein variable, representing protein measured approximately one week earlier, also showed a strong positive effect, with a marked increase in SHAP values around intermediate values and a plateau at higher levels. This indicates that recent protein measurements were informative predictors of current milk yield. In contrast, the effect of test day followed a decreasing trend over time. Early lactation days showed positive SHAP values, indicating higher predicted milk yield, while the contribution gradually became negative as lactation progressed, reflecting the typical decline in milk production during later stages of lactation. Overall, the Without ID model captured biologically plausible relationships among milk composition, recent production history, and stage of lactation.
Figure 6.
Model interpretation plots of the Without ID model. Plots illustrate the partial dependence of milk yield on the feature. Plot interpretation is as in Figure 5.
The relative importance values in Table 4 and the SHAP summary plot of the XGBoost model excluding cow identification (Figure 3) indicate that predictors derived from recent milk composition dynamics were the dominant drivers of daily milk yield predictions. Instead of relying on individual identity, the model reconstructed production variability using a combination of milk composition variables, temporal information within the lactation period, and recent indicators of body condition and productive state. In particular, short-term protein indicators, forward-filled protein yield, and forward-filled fat yield showed the highest contributions, followed by test day and short-term fat metrics. Higher values of these variables were generally associated with positive SHAP contributions, indicating increased predicted milk yield. In contrast, variables related to BCS, BW, parity, and data availability flags exhibited smaller contributions, suggesting that they played a secondary role in the prediction process.
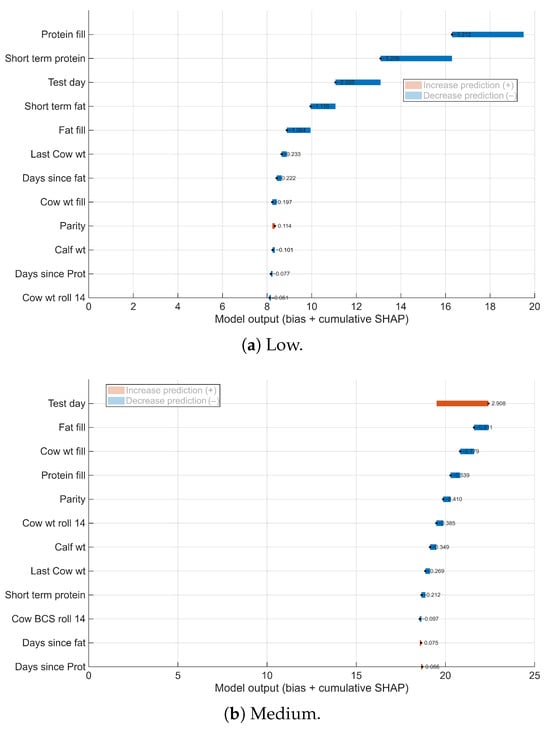
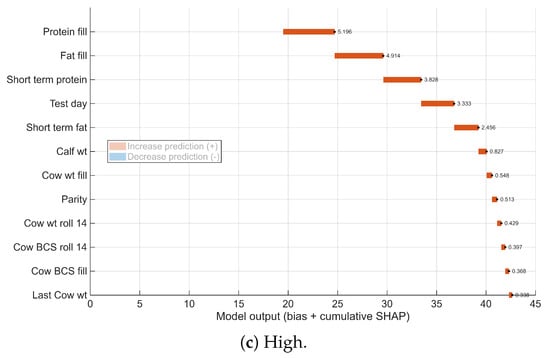
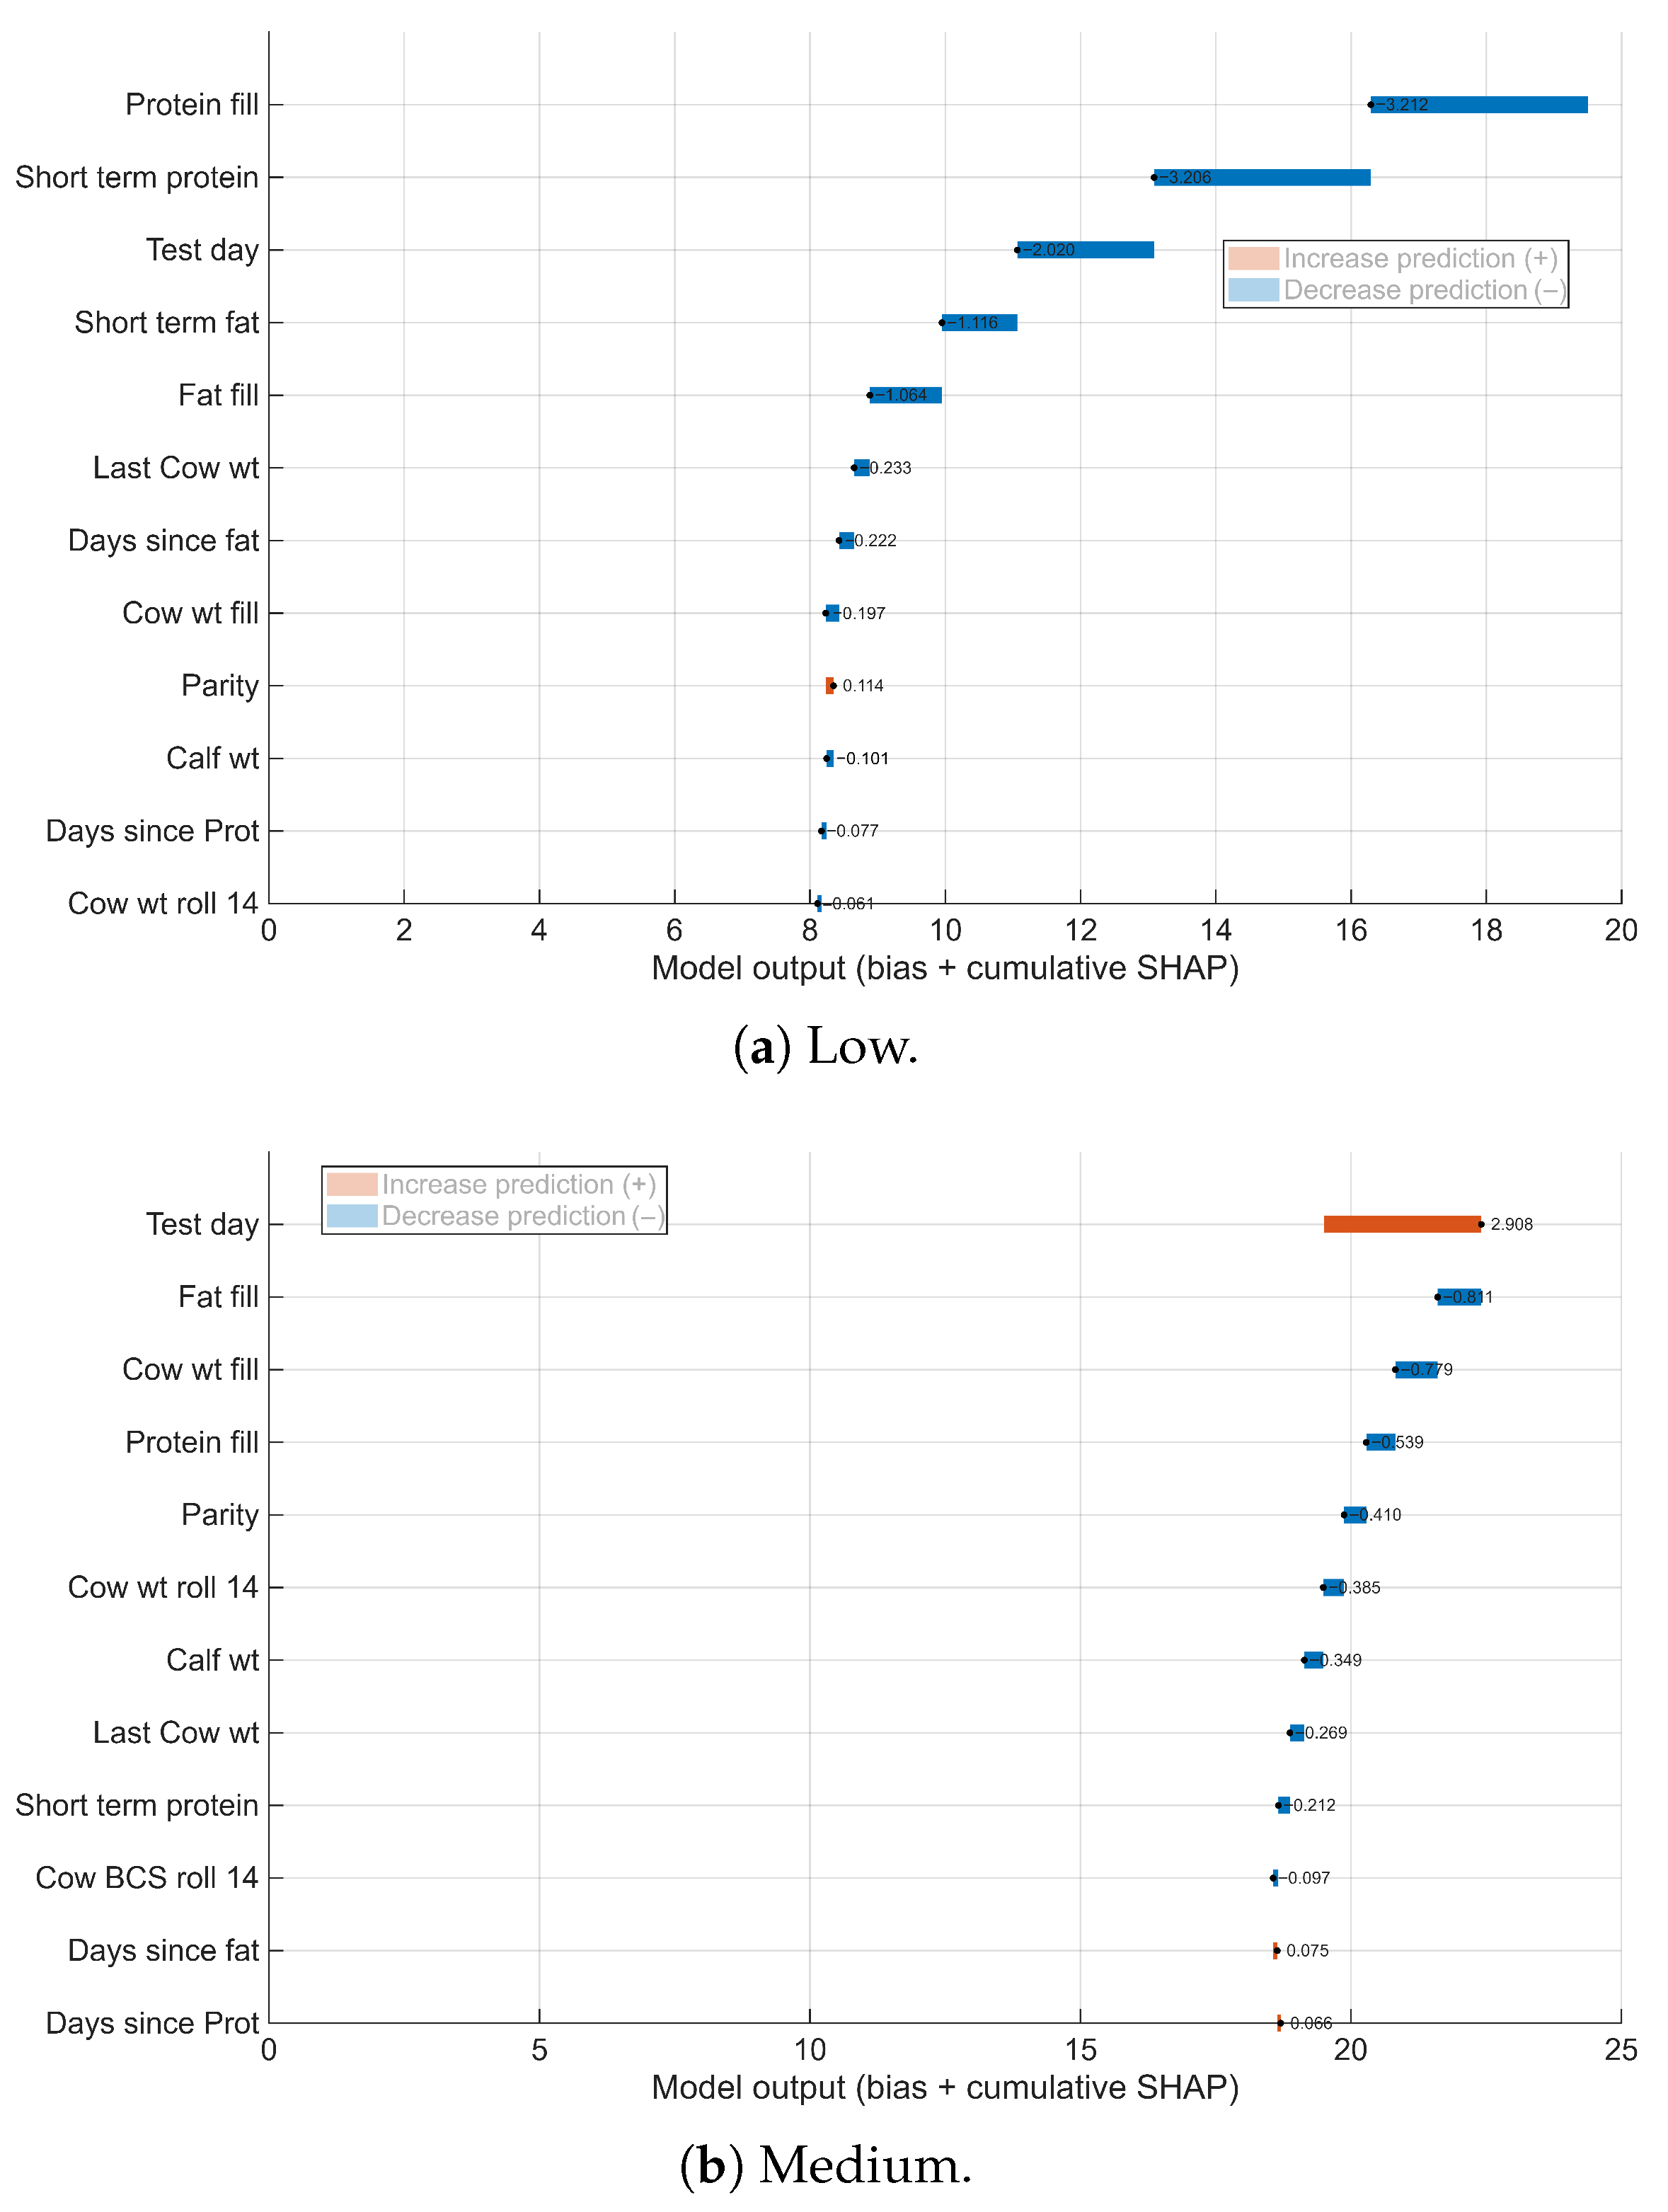
Waterfall plots of representative low-, medium-, and high-production observations predicted by the Without ID model (Figure 7) illustrate how these predictors combined additively to shift the model output from the baseline prediction to the final predicted yield. The strong influence of the forward-filled protein variable likely reflects the sampling structure of the dataset. Milk yield was recorded every 4 days, whereas milk composition traits were measured approximately every 16 days. With forward-filling, therefore, the most recent protein measurement was propagated across several yield records between test days. Consequently, this variable acted as a stable indicator of the cow’s recent physiological and production state, which likely explains its strong contribution to milk yield prediction when cow identification was excluded from the modeling.
Figure 7.
SHAP waterfall plots illustrating the contribution of individual features to the predicted milk yield for three representative observations corresponding to low (a), medium (b), and high (c) predicted production levels according to the Without ID model. The plots show how each feature shifts the model output from the baseline prediction to the final predicted milk yield through cumulative SHAP contributions. Red bars indicate features that increase the predicted milk yield, while blue bars indicate features that decrease it.
3.3. Agreement Analysis and Predictive Uncertainty
3.3.1. Without ID Model
When prediction intervals were constructed using only the variability across bootstrap models, the empirical coverage of the nominal 95% interval was 0.70, with a mean interval width of 2.88 kg d−1. This substantial undercoverage indicated that model-based variability alone severely underestimated the true predictive uncertainty. Variance decomposition revealed that the average variance attributable to model instability was 0.68, whereas the residual variance was 2.76, resulting in a total predictive variance of 3.44. In relative terms, approximately 19.7% of total uncertainty was associated with model instability and 80.3% with residual variability. These results demonstrate that the dominant source of uncertainty arose from unexplained biological or measurement variability rather than from sensitivity of the algorithm to the training sample.
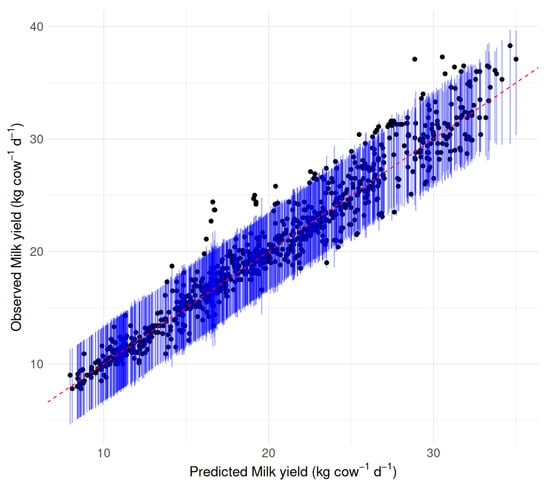
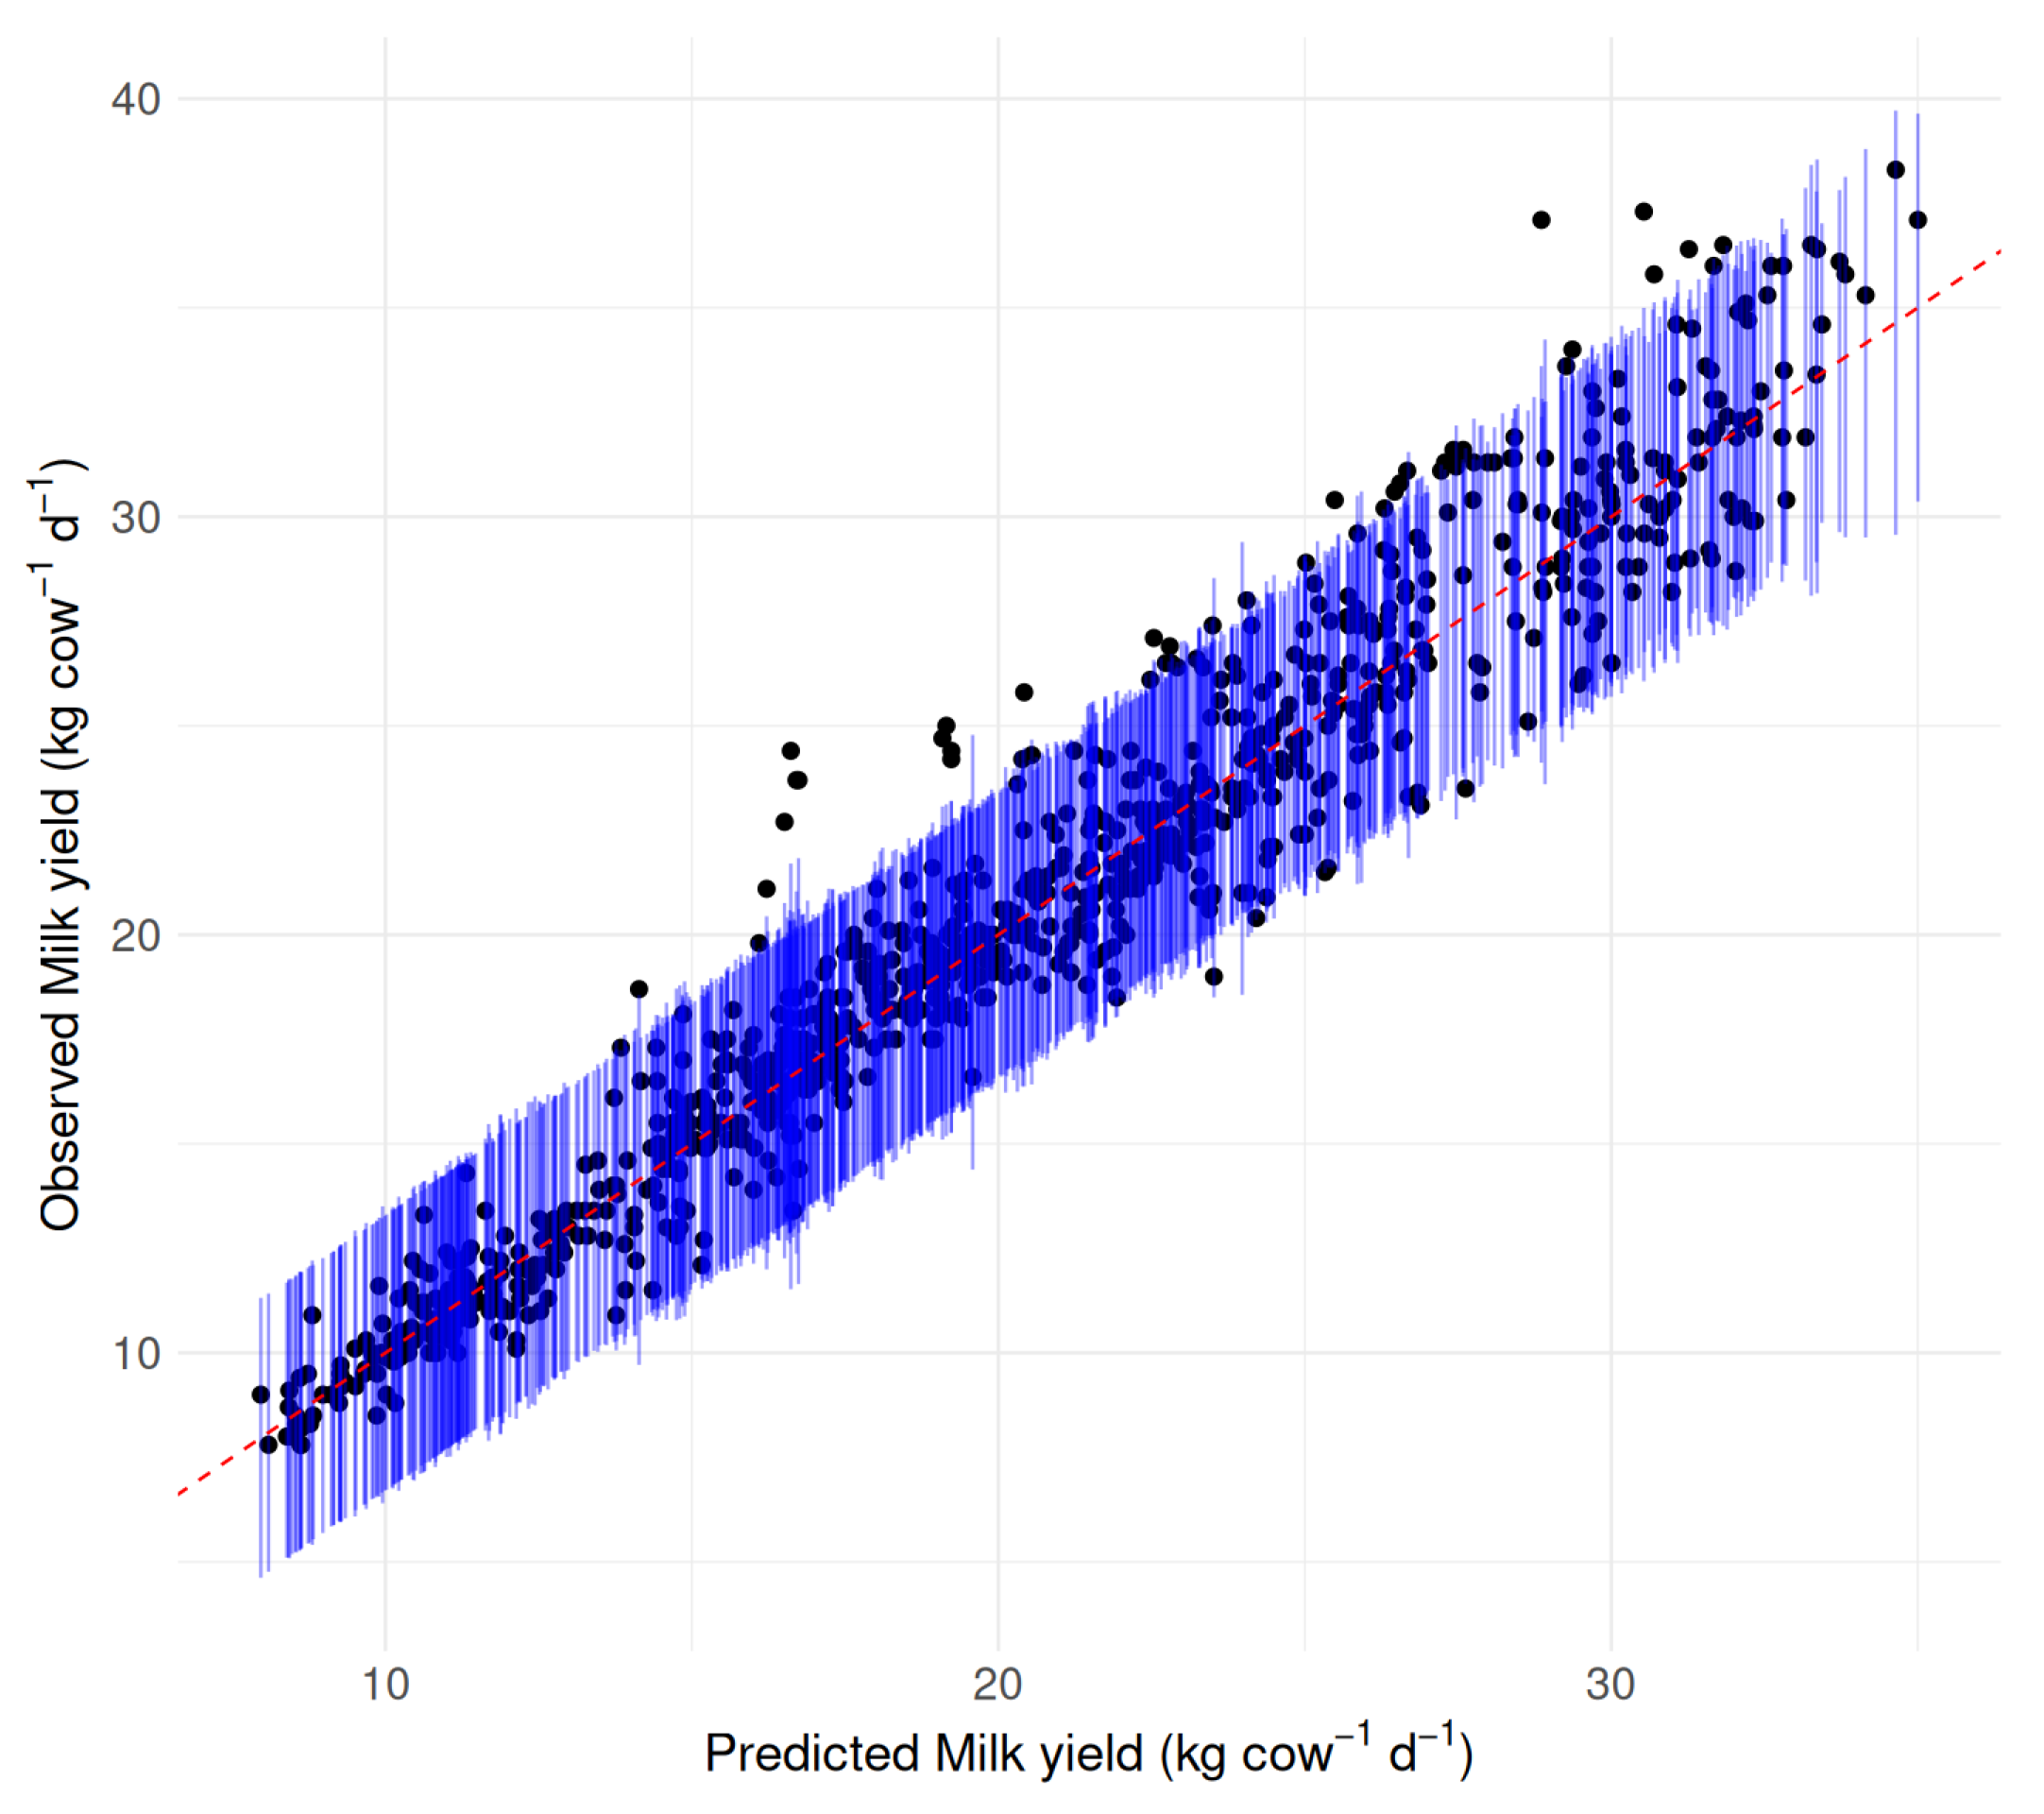
Prediction intervals were, therefore, constructed by combining both components, such that total uncertainty was defined as . The resulting 95% prediction intervals achieved an empirical coverage of 0.957, closely matching the nominal level, with a mean interval width of 7.24 kg d−1. As shown in Figure 8, the combined intervals adequately captured the dispersion of observations across the full production range, including the increased variability at higher milk yield.
Figure 8.
Observed versus predicted milk yield (black dots) with combined 95% prediction intervals (blue lines) for the Without ID model of XGBoost type. Intervals were constructed using the sum of model variance (bootstrap across cows) and residual variance. The empirical coverage was 0.957 with a mean interval width of milk yield of 7.24 kg d−1.
Overall, the results indicate that the Without ID model exhibited relatively high stability despite the limited number of cows and that most predictive uncertainty is driven by residual variability not captured by the current set of explanatory variables. Consequently, further reductions in uncertainty are more likely to be achieved with the improved representation of biological structure, the inclusion of additional informative predictors, or the explicit modeling of heteroskedasticity, rather than with marginal increases in sample size alone.
3.3.2. With ID Model
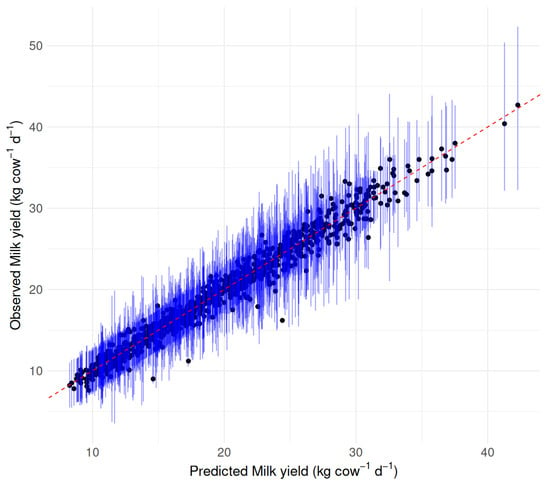
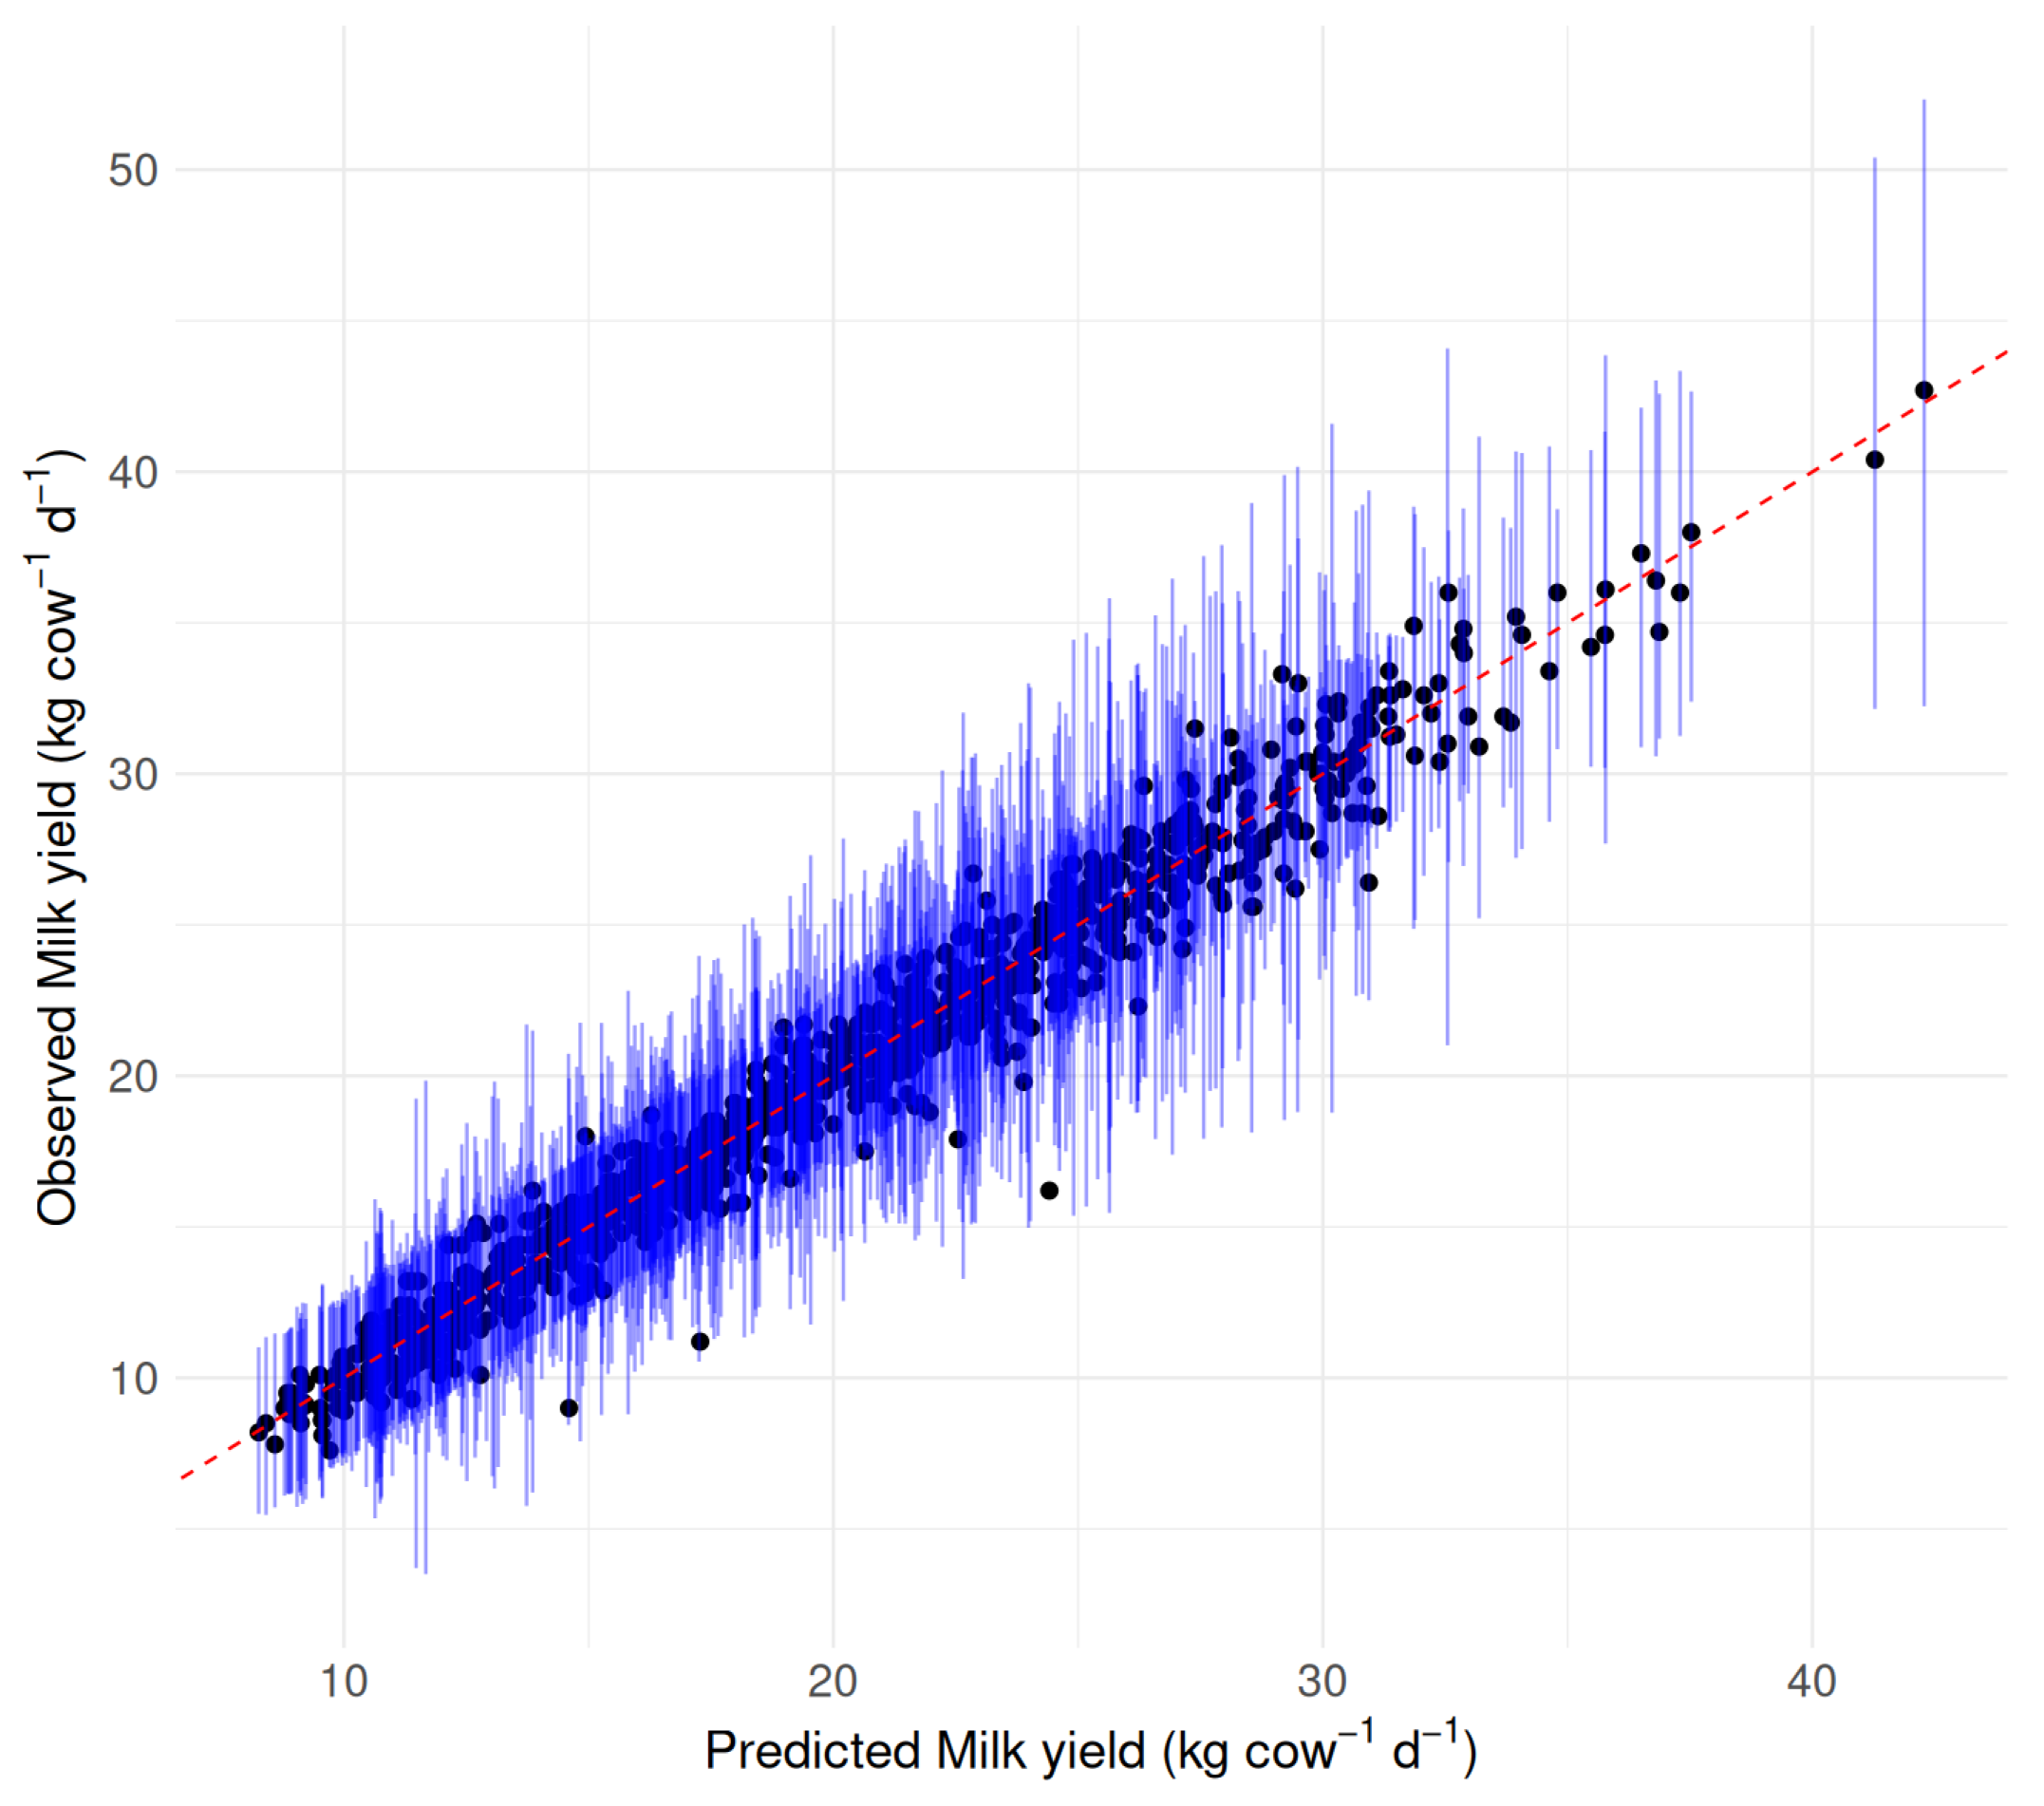
The quantification of the sources of predictive uncertainty for the With ID model showed that the nominal 95% prediction intervals constructed from model variability alone achieved an empirical coverage of 0.63, with a mean interval width of 4.52 kg d−1. As observed in the Without ID model, bootstrap-only intervals underestimated total predictive uncertainty (Figure 9).
Figure 9.
Observed versus predicted milk yield (black dots) with combined 95% prediction intervals (blue lines) for the With ID model of stacked ensemble type. Intervals were constructed using the sum of model variance (bootstrap across cows) and residual variance. The empirical coverage was 0.989 with a mean interval width of milk yield of 7.48 kg d−1.
However, variance decomposition revealed a markedly different structure of uncertainty. Model variance was 3.04, whereas residual variance was 1.27, resulting in a total predictive variance of 4.31. In contrast to the multi-feature model, approximately 70.5% of total uncertainty was attributable to model instability and only 29.5% to residual variability. Thus, in this specification, uncertainty was primarily driven by sensitivity to the training sample rather than by irreducible noise. After combining model and residual variance components, the empirical coverage of the 95% prediction intervals increased to 0.989, with a mean interval width of 7.48 kg d−1. Although calibration was achieved, the wide intervals reflect substantial instability in the estimated cow-specific effects, which is consistent with the limited number of independent cows (n = 38) used for training.
Taken together, the two modeling strategies exhibit fundamentally different uncertainty structures. The multi-feature model, which mainly included milk composition variables, showed relatively low model instability and is predominantly limited by residual variability (approximately 80%), suggesting that additional biological predictors or improved measurement precision would be required to reduce uncertainty. In contrast, the identity-based model was dominated by model variance (approximately 70%), indicating that predictions rely heavily on sample-specific cow effects and are therefore more sensitive to dataset size and sampling variability. These results suggest that increasing the number of independent cows would be expected to substantially reduce predictive uncertainty in the With ID model, whereas improvements in the multi-feature model would likely require enhanced representation of biological mechanisms rather than merely expanding sample size.
3.4. Comparative Performance and Bias Analysis
The machine learning models showed better predictive accuracy than the Wood models (Table 5), as indicated by higher values and lower RMSE and MAE. Bias estimates were generally small across models, although their direction varied. The Wood models for parity number of one and three showed slight positive bias, whereas the Wood model for a parity of two and the machine learning model without cow identification showed moderate negative bias. The machine learning model including cow identification exhibited the smallest bias, with a confidence interval encompassing zero.
Table 5.
Goodness-of-fit metrics, bias, and limits of agreement between observed and predicted milk yield. Metrics for the machine learning models were calculated using the validation dataset. The With ID model corresponds to a stacked ensemble, whereas the Without ID model corresponds to an XGBoost model. The Wood model was fitted separately for each cow using the full dataset (without a hold-out set), and predictions were subsequently aggregated by parity.
Agreement between observed and predicted values, evaluated through the limits of agreement (LoAs), also favored the machine learning models. In particular, the With ID model showed the narrowest LoA range, indicating smaller dispersion of prediction errors. In contrast, Wood models displayed wider LoA ranges, suggesting greater variability in individual prediction differences.
For the Without ID model the Bland–Altman analysis showed a mean bias of −0.30 kg (95% CI: −1.41 to −1.19), indicating that predictions tended to slightly underestimate the observed values. The limits of agreement ranged from −1.56 to 2.96, suggesting that individual differences between predicted and observed values could vary by approximately ±3 kg . Although the average bias was small, the relatively wide limits of agreement highlight the presence of notable variability at the individual level. These results contrasted with the better prediction capability of the With ID model, suggesting that there were important idiosyncratic traits of individual cows that could not be represented by the Without ID model.
4. Discussion
This study evaluated machine learning approaches to predicting daily milk yield in a small dataset of grazing dairy cows in two contrasting information scenarios. Despite the limited number of animals and the heterogeneous environmental conditions typical of pasture-based systems, machine learning models achieved higher predictive accuracy than the classical Wood lactation model. However, models based exclusively on biological and milk composition traits were able to partially reconstruct individual variability.
4.1. Dataset Constraints and Opportunities for Predictor Enrichment
Modeling lactation curves under grazing conditions is challenging because environmental variability and limited sample sizes can increase noise and reduce the stability of fitted relationships [1]. In pasture-based systems, milk-yield dynamics reflect not only physiological lactation processes but also fluctuating pasture availability, climatic conditions, and grazing management [17]. In the present study, the dataset comprised a relatively small number of cows with repeated measurements across lactation periods. Such structures are common in grazing studies, but they complicate model training because the number of observations per animal is high while the number of individuals remains limited [18,19].
Machine learning approaches could potentially improve the prediction of milk yield dynamics when sufficiently rich and integrated datasets are available. In principle, models that combine longitudinal production records with health, reproductive, and environmental information may better explain fluctuations in milk yield. However, the present study was based on animals without recorded clinical disease, so it does not allow direct evaluation of the effect of health disorders on milk-yield variation. Incorporating these additional data sources was beyond the scope of the present work, but remains an important direction for future studies aimed at improving both predictive performance and biological interpretability [20].
4.2. Biologically Relevant Predictors and the Role of Machine Learning
Machine learning studies and earlier biological work together suggest that the most informative predictors of milk yield are traits that reflect the cow’s metabolic state, productive condition, and transition performance rather than time alone. Historically, milk composition traits have been especially relevant: fat- and protein-based milk measures can predict energy balance [21], and the early-lactation fat:protein ratio has been associated with health, milk production, and survival [22]. Productive and periparturient traits have also proved informative, as calf birth weight has been linked with later milk production and reproductive performance [23]; Condon et al. [24] revisited this relationship under contemporary conditions.
More recent machine learning studies extend this logic by integrating richer phenotypes: behavioral, milking-system, and environmental variables improved short-term milk-yield prediction, especially when historical milk-yield information was limited [25]. Likewise, combining genomic merit with routinely available production and calving information improved forecasting and retained predictive value across generations [26,27]. Altogether, these studies indicate that milk traits, transition-related indicators, and sensor-derived behavioral variables are among the most relevant cow-level predictors when the objective is to represent individual biological variability in milk yield more faithfully.
The relevance of machine learning lies not only in its flexibility, but also in its capacity to integrate heterogeneous predictors and recover nonlinear relationships that are difficult to represent with conventional parametric models, provided that performance is assessed through appropriate testing and validation. In this respect, recent studies have compared machine learning models against simpler baselines, reported metrics such as RMSE and MAE, and, in the case of Ferrari et al. [27], extended validation to a new generation of animals, thereby strengthening confidence that the model captures biologically meaningful signal rather than merely fitting the original dataset. Commercial implementation is becoming increasingly feasible because automatic milking systems and precision-dairy data platforms already generate many of the variables required for ML-enabled prediction and decision support [18,28,29].
The ability of machine learning algorithms to explain the underlying sources of variation is still more limited than that of statistical approaches such as mixed-effects models [1]. Under these conditions, ensemble methods offer an advantage by combining multiple learners and reducing the variance associated with individual models. Ensemble learning has been shown to improve predictive stability when datasets are small or noisy [30]. In the present study, ensemble approaches consistently performed among the best models, suggesting that aggregating predictions helped stabilize milk-yield estimates despite the limited number of animals and the environmental heterogeneity inherent in grazing systems.
4.3. Model Evaluation
Machine learning models showed improved predictive performance compared with the Wood lactation model. Although the Wood model remains a widely used benchmark due to its biological interpretability and simplicity, it assumes a predefined lactation curve shape that may not fully capture variability arising from management and environmental conditions [3,5]. In contrast, machine learning models flexibly learned nonlinear relationships among predictors, enabling better adaptation to the observed production dynamics. The fact that ensemble methods outperformed stronger learners, such as standalone deep learning networks, on a small dataset is consistent with the machine learning literature [12,13,14]. Including cow identity substantially improved model performance, likely because it captured persistent individual differences related to genetics, physiology, or management history that were not explicitly represented by the available predictors. In this sense, cow identity acted as a proxy for latent animal-specific effects, analogous to random effects in mixed models [2,3].
The strong performance of GBM and XGBoost is consistent with their well-established effectiveness on tabular datasets. From a predictive standpoint, AutoML can identify robust models even when predictor variables are correlated with each other (multicollinearity); tree-based algorithms used in AutoML are designed to handle such correlations effectively. In the present study, the dataset contained 5257 observations from 58 lactation periods across 49 cows, with repeated test-day measurements and a nonlinear lactation pattern. Such data structures favor tree-based boosting approaches, which can model complex relationships among predictors such as test day, parity, and milk composition. Including cow identification enabled the models to capture individual animal variation in milk production, contributing to the improved predictive accuracy observed for the With ID models. We must clarify that XGBoost is a stacked ensemble method, which stacks different versions of decision trees. The two most successful methods in our study were both ensembles: the one used for the With ID model is an ensemble of multiple algorithms, and the Without ID model uses XGBoost, which is an ensemble of decision trees.
Despite the absence of individual identifiers, the Without ID model still captured part of the variability among animals. This indicates that the biological indicators included in the dataset contained sufficient information to partially reconstruct individual production patterns. In particular, milk composition variables were highly informative for predicting milk yield dynamics. The prominence of protein and fat yield in the SHAP analysis suggests that the model relied on indicators of ongoing mammary secretion, implying that variation in component synthesis provides a strong physiological signal of current lactation intensity.
From a methodological perspective, milk yield and auxiliary traits were recorded at different frequencies, requiring feature engineering to align the information. Forward-filling, rolling averages, and lag variables allowed milk composition measurements to contribute predictive information between sampling events. These derived variables should, therefore, be interpreted as indicators of the cow’s physiological and nutritional status over time rather than direct causal predictors of daily milk yield.
The strong predictive contribution of milk composition variables expressed as component yields (kg ) is consistent with the physiological basis of lactation. In dairy nutrition models such as the NRC framework [31], the energetic cost of milk production is calculated from the amounts of fat, protein, and lactose synthesized rather than milk volume alone. Hence, the secretion rates of these components directly reflect mammary metabolic activity. Because component yields are mathematically related to milk yield, they inherently contain partial information about the response variable. The model, therefore, reconstructs milk production using biologically meaningful proxies of mammary output rather than entirely independent predictors.
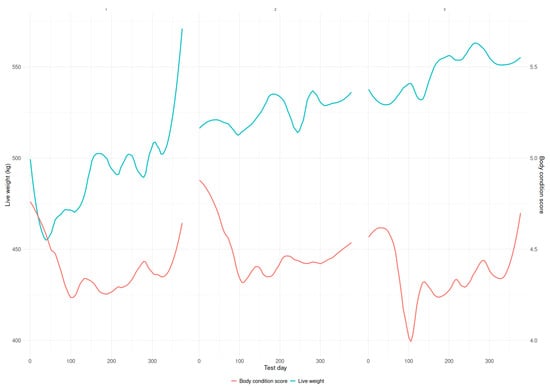
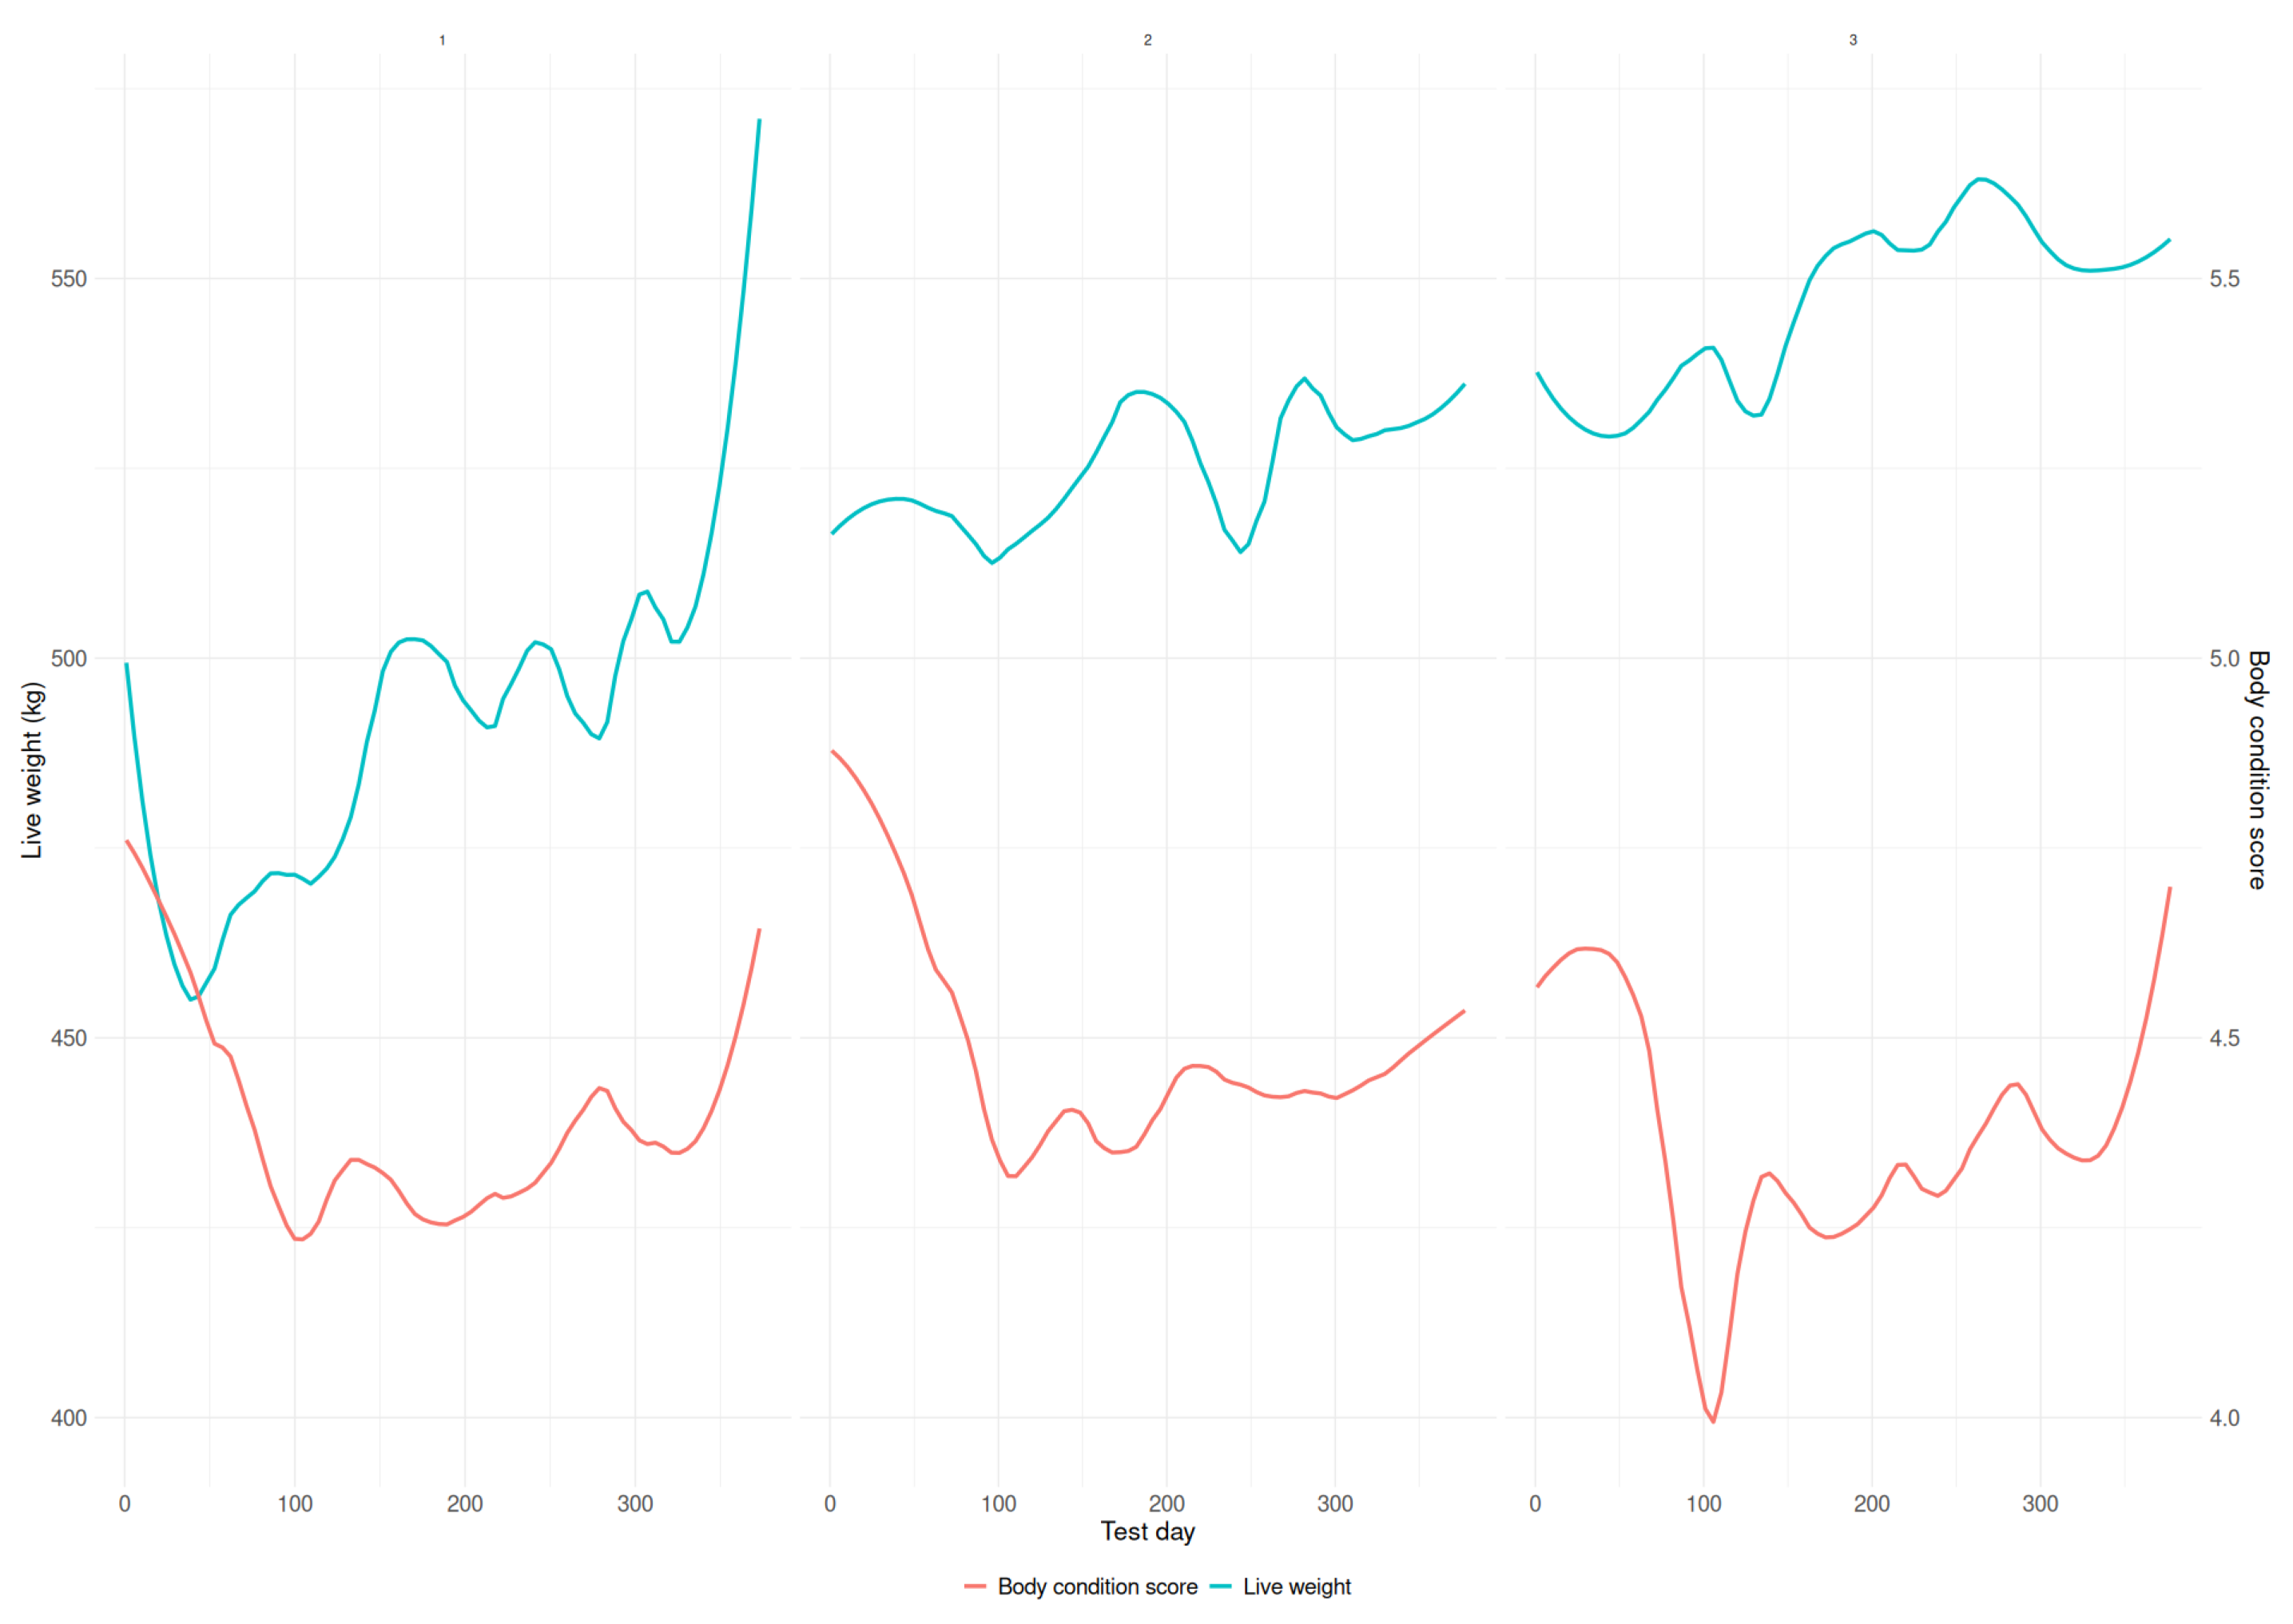
From a physiological standpoint, the lower importance of BW and BCS compared with milk composition variables likely reflects their indirect relationship with short-term milk yield dynamics. Body reserves primarily indicate the mobilization or replenishment of energy stores that buffer nutrient supply during periods of imbalance, whereas milk components respond more rapidly to changes in nutrient availability and mammary metabolism [32]. This difference in temporal sensitivity may explain their stronger predictive signal. In the present study, the body condition score declined during the first 100 days of lactation and recovered later, particularly after approximately 300 days (Figure 10), while body weight showed an early decrease followed by gradual recovery, with short-term fluctuations likely associated with variation in pasture allowance and gut fill under grazing conditions.
Figure 10.
Average time trends of body condition score (BCS) and body weight (BW) of lactating cows under grazing conditions.
From a nutritional perspective, the interpretation of these results must consider that concentrate and hay were offered at the group level, preventing the quantification of individual intake. Consequently, variability in actual nutrient intake likely reflects differences in grazing behavior and feed access among cows. Under these conditions, milk protein yield may serve as an integrative proxy of metabolizable protein supply and nitrogen utilization efficiency at the individual level.
Although cows received energy supplementation in the form of concentrate or rolled corn, as well as fiber from hay, the high crude protein content of the alfalfa-based pasture likely maintained an imbalance between rumen degradable protein and available fermentable energy. This partial asynchrony may have limited nitrogen capture efficiency despite supplementation. The predominance of milk protein and fat yield variables over body condition score, body weight, and parity, therefore, suggests that short-term variation in nutrient utilization plays a greater role in explaining milk yield than static animal characteristics. Milk protein yield reflects metabolizable protein supply, whereas milk fat yield captures aspects of energy balance and rumen fermentation dynamics, particularly acetate production [31]. Together, these variables act as integrative indicators of how efficiently individual cows convert the offered diet into milk solids.
In a grazing system with group-fed supplementation and unobserved individual intake, these results suggest that variability in intake behavior and rumen synchronization are key drivers of production differences. The strong association between milk protein yield and milk yield further supports the interpretation that differences in nutrient utilization, rather than differences in diet offered, underlie much of the observed variability. Future work incorporating individual intake measurements would enable the explicit evaluation of diet–efficiency interactions.
Somatic cell count showed a negligible contribution to milk yield prediction in the SHAP analysis, indicating that it did not explain meaningful variation in model outputs within the present dataset. This result should be interpreted in the context of the observed SCC distribution. Mean SCC values were approximately 126 × 103 cells/mL across parities, which is consistent with low to moderate levels typically reported for grazing dairy systems. Although variability was present, the overall range suggests a limited incidence of elevated SCC events associated with clinical or subclinical mastitis.
When compared with national statistics for New Zealand dairy herds [33], the SCC levels observed in this study appear representative of commercial grazing Holstein populations. Therefore, the low importance of SCC in the model likely reflects the relatively homogeneous and generally healthy status of the cows rather than a lack of biological relevance of this trait. Under conditions where mastitis prevalence is higher or more variable, SCC would be expected to have a stronger association with milk yield and, consequently, greater importance in predictive models.
Uncertainty analysis revealed contrasting variance structures between the models. In the Without ID model, most uncertainty was attributed to residual variance, indicating unexplained biological variability. In contrast, the model including cow ID showed a larger contribution from model variance, reflecting a stronger dependence on individual-specific information. These patterns suggest that improving biological predictors may benefit identity-free models, whereas increasing the number of animals would primarily strengthen models that rely on individual identifiers.
4.4. Limitations and Implications
The results demonstrate that machine learning models can accurately predict daily milk yield in grazing dairy systems even when datasets are relatively small. Such models may support the improved monitoring of lactation dynamics and help identify deviations in production performance at the individual cow level [2]. However, predictive models should not be interpreted as mechanistic descriptions of lactation biology. Variable importance reflects statistical associations rather than causal relationships, and the models do not explicitly represent underlying physiological processes.
The ability of the Without ID model to reconstruct production variability using biological indicators suggests potential applications in precision livestock farming and environmental footprinting [2]. In addition, short-term predictions of milk yield may support farm-level planning and facilitate the coordination of milk supply with processing capacity in dairy value chains. As automated sensors for milk composition, body condition, and animal activity become more widely available, predictive models based on physiological signals rather than individual identifiers may become increasingly practical for real-time production monitoring [28]. Although the H2O AutoML training procedure may require substantial computational resources, once trained, the model can be exported as a model object optimized (MOJO), enabling efficient prediction on standard computing systems with minimal memory requirements.
Several limitations should be acknowledged. The dataset was obtained from a single herd and included a limited number of cows, which may constrain the generalizability of the results. In addition, measurement intervals differed among traits, requiring data engineering procedures that may introduce additional uncertainty. These procedures may also smooth short-term biological fluctuations and therefore cannot substitute for a fully uniform sampling design. Future research should evaluate the proposed modeling framework using larger, multi-herd datasets. Extensive pasture-based dairy databases are available in countries such as New Zealand, where national milk recording systems have generated large longitudinal datasets on milk yield and composition across thousands of herds [34,35]. These resources provide a valuable opportunity to assess the scalability and generalizability of machine learning approaches for modeling lactation dynamics in grazing dairy systems.
We did not explicitly incorporate into the modeling framework biological and management factors that influence lactation dynamics, such as are disease episodes, reproductive status, days open, and individual variation in lactation persistency. These factors influence milk production patterns and may improve predictive realism when included in machine learning models. However, the present study relied on routinely recorded variables available in the herd database, which did not systematically include health events or reproductive indicators. Consequently, the models focused on milk production records and associated biological traits commonly measured in grazing dairy systems. Future studies integrating health records, reproductive variables, and metabolic indicators could further enhance both the biological interpretability and predictive capability of machine learning approaches to modeling lactation dynamics.
5. Conclusions
Machine learning models consistently outperformed the traditional Wood lactation model in predicting daily milk yield. Both the Wood model and the ID-based machine learning model served as cow-specific benchmarks, capturing individual variation in lactation. While the ID-based model achieved the highest accuracy, its reliance on cow identification limits generalization to new animals. Models based solely on biological traits, particularly milk composition, approached the predictive performance of the cow-specific models, suggesting they can capture individual differences without requiring explicit cow IDs. In this model, the imputed values for milk fat and protein yields were among the most important predictors, indicating that measurements taken more frequently than every two weeks may be necessary. Uncertainty analysis indicated complementary strategies for improvement: ID-based models benefit the most from increasing the number of cows, whereas multi-feature models require more precise or additional biological measurements.
Author Contributions
Conceptualization, A.G.-E. and V.L.-R.; methodology, A.G.-E.; validation, A.G.-E.; formal analysis, A.G.-E.; investigation, V.L.-R.; resources, A.G.-E. and V.L.-R.; data curation, V.L.-R.; writing—original draft preparation, A.G.-E.; writing—review and editing, V.L.-R. J.G.G.-M., A.K.Y.-O., C.A.V.-B. and B.V.-A.; visualization, A.G.-E.; supervision, V.L.-R. All authors have read and agreed to the published version of the manuscript.
Funding
This research study received no external funding.
Institutional Review Board Statement
This study involved only the analysis of previously collected data and did not include the use of live animals.
Data Availability Statement
The datasets generated and/or analyzed during the current study are available from the corresponding author upon reasonable request.
Conflicts of Interest
The authors declare no conflicts of interest.
Abbreviations
The following abbreviations are used in this manuscript:
| BCS | Body condition score |
| BW | Body weight |
| DL | Deep learning |
| GLM | Generalized linear model |
| GBM | Gradient boosting machine |
| DRF | Distributed random forest |
| MAE | Mean absolute error |
| MOJO | Model object optimized |
| MSE | Mean square error |
| NN | Neural network |
| Coefficient of determination | |
| RMSE | Root mean square error |
| RMSLE | Root mean square logarithmic error |
| SHAP | SHapley additive explanations |
| XGBoost | Extreme gradient boosting |
| XRT | Extremely randomized tree |
References
- Macciotta, N.P.; Dimauro, C.; Rassu, S.P.; Steri, R.; Pulina, G. The mathematical description of lactation curves in dairy cattle. Ital. J. Anim. Sci. 2011, 10, e51. [Google Scholar] [CrossRef] [Scilit]
- Gong, Y.; Hu, H.; Reed, K.F.; Cabrera, V.E. Advancing dairy farm simulations: A two-step approach for tailored lactation curve estimation and its systemic impacts. J. Dairy Sci. 2025, 108, 9681–9695. [Google Scholar] [CrossRef] [Scilit] [PubMed]
- Innes, D.J.; Pot, L.J.; Seymour, D.J.; France, J.; Dijkstra, J.; Doelman, J.; Cant, J.P. Fitting mathematical functions to extended lactation curves and forecasting late-lactation milk yields of dairy cows. J. Dairy Sci. 2024, 107, 342–358. [Google Scholar] [CrossRef] [Scilit] [PubMed]
- Trejo-Díaz, L.E.; Ruiz-López, F.D.J.; Toledo-Alvarado, H.O.; Durán-Aguilar, M.; García-Ruiz, A. Modeling lactation curves for milk production, fat and protein, and evaluation of factors that affect them in Holstein cattle in Mexico. Rev. Mex. Cienc. Pecu. 2024, 15, 483–500. [Google Scholar] [CrossRef] [Scilit]
- Li, M.; Rosa, G.J.M.; Reed, K.F.; Cabrera, V.E. Investigating the effect of temporal, geographic, and management factors on US Holstein lactation curve parameters. J. Dairy Sci. 2022, 105, 7525–7538. [Google Scholar] [CrossRef] [Scilit]
- Græsbøll, K.; Kirkeby, C.; Nielsen, S.S.; Halasa, T.; Toft, N.; Christiansen, L.E. Models to estimate lactation curves of milk yield and somatic cell count in dairy cows at the herd level for the use in simulations and predictive models. Front. Vet. Sci. 2016, 3, 115. [Google Scholar] [CrossRef] [Scilit]
- Moreno-Gónzalez, Y.; López-Villalobos, N.; Donaghy, D.; López, I.F.; MacGibbon, A.; Holroyd, S.E. Lactation curves for milk, fat and protein in dairy cows under regenerative versus conventional farming practices. N. Z. J. Agric. Res. 2025, 68, 718–733. [Google Scholar] [CrossRef] [Scilit]
- Wood, P.D.P. Algebraic model of the lactation curve in cattle. Nature 1967, 216, 164–165. [Google Scholar] [CrossRef] [Scilit]
- Tursunalieva, A.; Alexander, D.L.; Dunne, R.; Li, J.; Riera, L.; Zhao, Y. Making sense of machine learning: A review of interpretation techniques and their applications. Appl. Sci. 2024, 14, 496. [Google Scholar] [CrossRef] [Scilit]
- Hall, P.; Gill, N.; Kurka, M.; Phan, W.; Bartz, A. Machine learning interpretability with H2O driverless AI. In Machine Learning Interpretability with H2O Driverless AI; Bartz, A., Ed.; H2O.ai Inc.: Mountain View, CA, USA, 2019. [Google Scholar]
- Freund, Y.; Schapire, R.E. A decision-theoretic generalization of on-line learning and an application to boosting. J. Comput. Syst. Sci. 1997, 55, 119–139. [Google Scholar] [CrossRef] [Scilit]
- Li, C.; Wang, L.; Li, J.; Chen, Y. Application of multi-algorithm ensemble methods in high-dimensional and small-sample data of geotechnical engineering: A case study of swelling pressure of expansive soils. J. Rock Mech. Geotech. Eng. 2024, 16, 1896–1917. [Google Scholar] [CrossRef] [Scilit]
- Izonin, I.; Nesterenko, I.; Kazantzi, A.K.; Tkachenko, R.; Muzyka, R.; Mitoulis, S.A. Enhanced ANN-based ensemble method for bridge damage characterization using limited dataset. Sci. Rep. 2024, 14, 24395. [Google Scholar] [CrossRef] [Scilit] [PubMed]
- Lee, J.-H.; Kang, J.; Shim, W.; Chung, H.-S.; Sung, T.-E. State of health estimation and battery management: A review of health indicators, models and machine learning. IEEE Trans. Ind. Appl. 2024, 60, 4366–4380. [Google Scholar] [CrossRef] [Scilit]
- Bland, J.M.; Altman, D.G. Measuring agreement in method comparison studies. Stat. Methods Med. Res. 1999, 8, 135–160. [Google Scholar] [CrossRef] [Scilit]
- Fryer, D.; Strümke, I.; Nguyen, H. Shapley values for feature selection: The good, the bad, and the axioms. IEEE Access 2021, 9, 144352–144360. [Google Scholar] [CrossRef] [Scilit]
- Moreno García, C.A.; Maxwell, T.M.; Hickford, J.; Gregorini, P. On the search for grazing personalities: From individual to collective behaviors. Front. Vet. Sci. 2020, 7, 74. [Google Scholar] [CrossRef] [Scilit]
- Lokhorst, C.; de Mol, R.M.; Kamphuis, C. Invited review: Big Data in precision dairy farming. Animal 2019, 13, 1519–1528. [Google Scholar] [CrossRef] [Scilit]
- Cockburn, M. Review: Application and prospective discussion of machine learning for the management of dairy farms. Animals 2020, 10, 1690. [Google Scholar] [CrossRef] [Scilit] [PubMed]
- Li, B.; He, D.; Wang, J.; Song, X.; Yang, X. Prediction of dairy cow milk yield based on machine learning methods: A review. AgriEngineering 2024, 6, 84. [Google Scholar] [CrossRef] [Scilit]
- Friggens, N.C.; Ridder, C.; Løvendahl, P. On the use of milk composition measures to predict the energy balance of dairy cows. J. Dairy Sci. 2007, 90, 5453–5467. [Google Scholar] [CrossRef] [Scilit] [PubMed]
- Toni, F.; Vincenti, L.; Grigoletto, L.; Ricci, A.; Schukken, Y.H. Early lactation ratio of fat and protein percentage in milk is associated with health, milk production, and survival. J. Dairy Sci. 2011, 94, 1772–1783. [Google Scholar] [CrossRef] [Scilit] [PubMed]
- Linden, T.C.; Bicalho, R.C.; Nydam, D.V. Calf birth weight and its association with calf and cow survivability, disease incidence, reproductive performance, and milk production. J. Dairy Sci. 2009, 92, 2580–2588. [Google Scholar] [CrossRef] [Scilit] [PubMed]
- Condon, T.; Murphy, C.P.; Sleator, R.D.; Ring, S.C.; Berry, D.P. The association between calf birth weight and the postcalving performance of its dairy dam in the absence of dystocia. J. Dairy Sci. 2024, 107, 3688–3699. [Google Scholar] [CrossRef] [Scilit] [PubMed]
- Hooker, J.; de Medebiros, B.B.; Saha, C.; Abdulrahman, T.; Alves, A.A.C. Evaluating the contribution of behavioral, milking-system, and environmental data to short-term milk yield prediction in commercial dairy cows using machine learning. J. Dairy Sci. 2025. [Google Scholar] [CrossRef] [Scilit]
- Vergani, A.M.; Bagnato, A.; Masseroli, M. Predicting bovine daily milk yield by leveraging genomic breeding values. Comput. Electron. Agric. 2024, 219, 108777. [Google Scholar] [CrossRef] [Scilit]
- Ferrari, C.; Punturiero, C.; Delledonne, A.; Vergani, A.M.; Masseroli, M.; Strillacci, M.G.; Bagnato, A. Cross-generational validation of a feedforward neural network for milk yield prediction in dairy cattle. Animals 2026, 16, 707. [Google Scholar] [CrossRef] [Scilit]
- Tedeschi, L.O.; Greenwood, P.L.; Halachmi, I. Advancements in sensor technology and decision support intelligent tools to assist smart livestock farming. J. Anim. Sci. 2021, 99, skab038. [Google Scholar] [CrossRef] [Scilit]
- Palma, O.; Plà-Aragonés, L.M.; Mac Cawley, A.; Albornoz, V.M. AI and data analytics in the dairy farms: A scoping review. Animals 2025, 15, 1291. [Google Scholar] [CrossRef] [Scilit]
- Dietterich, T.G. Ensemble Methods in Machine Learning. In Multiple Classifier Systems; MCS 2000, Lecture Notes in Computer Science; Springer: Berlin/Heidelberg, Germany, 2000; Volume 1857, pp. 1–15. [Google Scholar] [CrossRef] [Scilit]
- National Research Council. Nutrient Requirements of Dairy Cattle, 7th revised ed.; National Academy Press: Washington, DC, USA, 2001. [Google Scholar] [CrossRef] [Scilit]
- Gross, J.J. Limiting factors for milk production in dairy cows: Perspectives from physiology and nutrition. J. Anim. Sci. 2022, 100, skac044. [Google Scholar] [CrossRef] [Scilit]
- DairyNZ. New Zealand Dairy Statistics 2024–25; DairyNZ: Hamilton, New Zealand, 2025; Available online: https://www.dairynz.co.nz/resources/resource-list/new-zealand-dairy-statistics-2024-25-pdf/ (accessed on 23 April 2026).
- Harris, B.L.; Clark, J.M.; Jackson, R.G. Development of a national animal evaluation for dairy cattle in New Zealand. Proc. N. Z. Soc. Anim. Prod. 2006, 66, 175–179. [Google Scholar]
- Spelman, R.J.; Ford, C.A.; McElhinney, P.; Gregory, G.C.; Snell, R.G. Characterization of the New Zealand dairy cattle population using pedigree analysis. J. Dairy Sci. 2001, 84, 1506–1512. [Google Scholar] [CrossRef]

Disclaimer/Publisher’s Note: The statements, opinions and data contained in all publications are solely those of the individual author(s) and contributor(s) and not of MDPI and/or the editor(s). MDPI and/or the editor(s) disclaim responsibility for any injury to people or property resulting from any ideas, methods, instructions or products referred to in the content. |
© 2026 by the authors. Licensee MDPI, Basel, Switzerland. This article is an open access article distributed under the terms and conditions of the Creative Commons Attribution (CC BY) license.